Abstract
Beaked whales are a cryptic pelagic species, rarely sighted at sea. In a ~2.5-year passive acoustic monitoring program on Australia’s Northwest Shelf, a variety of marine mammal sounds were detected, including beaked whale (Ziphiidae) clicks. An automatic detection routine for beaked whale clicks was developed, tested, and run on these recordings. The detection workflow included: (1) the extraction of impulsive signals from passive acoustic recordings based on an auto-regression model, (2) the calculation of a set of features of extracted signals, and (3) binary signal classification based on these features. Detector performance (Precision, Recall, and F1-score) was assessed using a manually annotated dataset of extracted clicks. This automated routine allows for quick analysis of animal (acoustic) presence and distribution spatially and temporally. In our study, beaked whales were present all year round at six deep-water (>1000 m) sites, but no clicks were detected at the shallow-water (~70 m) site. No seasonal or diurnal patterns of beaked whale clicks were identified.
1. Introduction
Beaked whales, belonging to the family Ziphiidae, are deep-diving cetaceans that are poorly studied as they are rarely observed at the water surface. Twelve species have been observed in Western Australia (Table 1), with some species known only from stranded individuals [1], and potentially additional species present but yet unobserved.

Table 1.
Beaked whale species potentially present in Western Australia (https://www.dcceew.gov.au/environment/marine/marine-species/cetaceans/species-found-australian-waters (accessed on 1 April 2025)).
Beaked whales produce clicks for communication, navigation, and echolocation of their prey during deep foraging dives [2,3]. Whale tagging studies suggest that beaked whales produce clicks at depths of a few hundred meters (200–400 m) below the surface, down to 2000 m during foraging dives, and they click almost continuously at depth [4,5,6]. These clicks are not produced near the surface or during recovery dives, possibly to avoid detection by predators such as killer whales that hunt for smaller cetaceans (including beaked whales) at shallow depths [5,7,8].
Beaked whales use two types of echolocation clicks: slow but strong clicks when searching for prey (regular clicks), and rapid, albeit weaker, buzz clicks during prey capture [9,10,11]. The regular (search) clicks of beaked whales are frequency-modulated (FM) pulses (chirps) that have unique characteristics distinguishing them from other odontocetes. Beaked whale clicks further have specific and consistent inter-click intervals (ICIs), longer durations than clicks of most other odontocetes, and higher frequencies than sperm whale clicks, but lower frequencies than clicks of most other odontocetes. Regular click series of beaked whales have ICIs of ~0.4 s (0.2–0.5 s, depending on the species [12,13,14]). Other odontocetes, such as sperm whales and dolphins, produce trains of clicks with ICIs of >0.5 s and <0.1 s, respectively [9,15]. Beaked whale clicks have center frequencies around 40 kHz, −10 dB bandwidths of 20–30 kHz, and durations of 200–300 µs [6,11,12,16]. Centre frequencies of other delphinid clicks are higher (50–130 kHz), and durations are less than 100 µs [17,18,19,20]. Sperm whale clicks have lower peak frequencies (~11 kHz) and shorter durations (~100 µs) than beaked whale clicks [21,22,23].
Not only do click features differentiate beaked whales from other odontocetes, click features further differ between different species of beaked whales and behavior. For example, Cuvier’s beaked whales have ICIs of 510 ms, Blainville’s beaked whales 320 ms, Gervais’ beaked whales 290 ms, and an unidentified beaked whale 140 ms [14,24]. In a different study [4], Cuvier’s beaked whales had ICIs of ~400 ms. The ICIs for Mesoplodon species range between 200 and 400 ms [4,25]. Beaked whale peak frequencies range from 16 kHz to 66 kHz [5,14] and may vary between populations of the same species in different geographic habitats [26].
Given these species-specific click features, passive acoustic monitoring (PAM) is a valuable tool for tracking the presence of beaked whales. However, PAM datasets can quickly grow in volume (1 TB/year/site in our case), depending on sampling frequency and duty cycle, making automatic algorithms necessary to efficiently analyse the data for the presence of beaked whales. Others have developed beaked whale click detectors which typically operate in two steps: 1. automated detection of any click-like signal; 2. automated classification as beaked whales. Detectors include transient peak-energy detectors and Teager–Kaiser energy operators [27,28,29]. Classifiers have utilised features of the waveform such as zero-crossings (i.e., the number of zero-crossings, the time and the change in time between zero-crossings [28]); features of the spectrum such as peak frequency and spectral shape [30]; and combinations of spectral and temporal features including click duration and frequency modulation, and additionally ICI [29,30].
Here, we present a three-step processes in which 1. click-like signals are detected as outliers in an autoregressive model of ambient noise, 2. potential beaked whale clicks are selected by correlation with manually extracted waveform templates, and 3. clicks are classed as beaked whales based on their duration, peak frequency, frequency-modulation rate, kurtosis, and ICI to neighbouring clicks. The intermediate step 2 was necessary as our recordings were limited in Nyquist frequency (48 kHz), missing the upper edge of beaked whale click spectra. For the same reason, we were unable to sort beaked whale clicks to species. However, we set out to document beaked whale spatio-temporal presence on Australia’s Northwest Shelf, in general, and to match their acoustic activity to static and dynamic features of this marine environment, which had not been previously investigated.
2. Materials and Methods
2.1. Data Collection
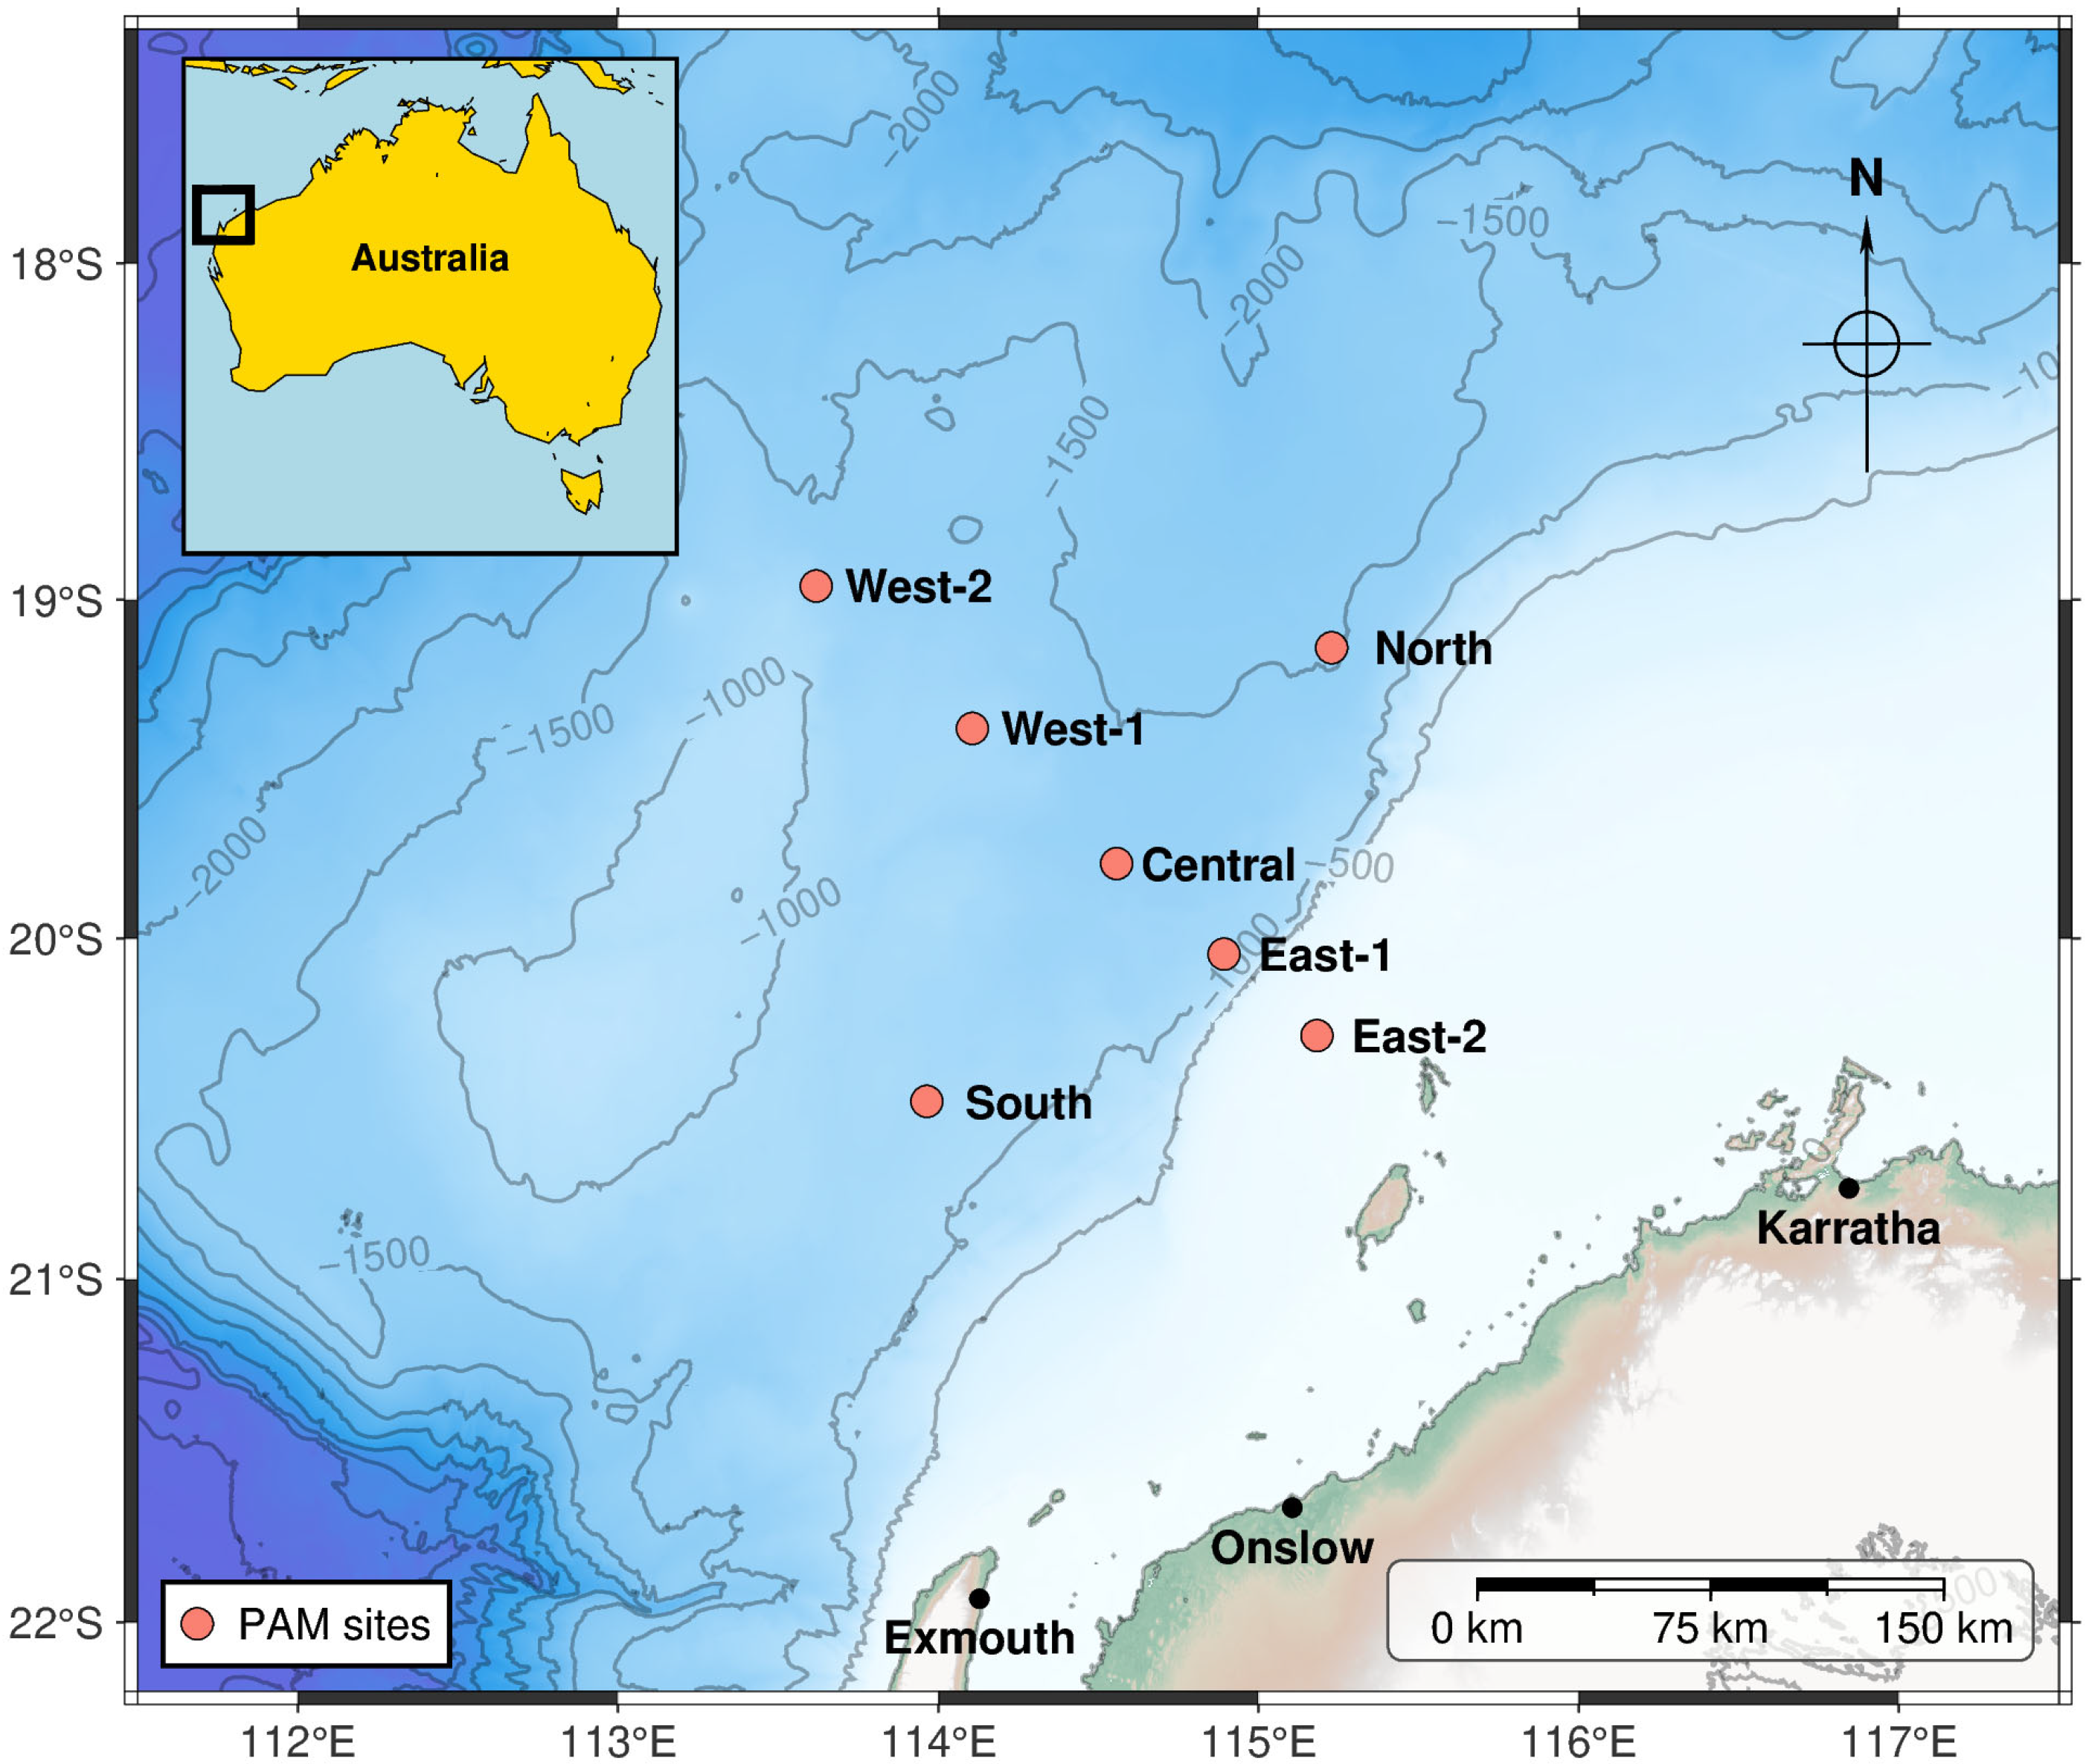
From 1 January 2019 through 31 December 2019, three autonomous underwater acoustic recorders were moored near the Central site simultaneously at different depths in the water column (150 m, 750 m, and 1300 m below the sea surface; Table 2). From ~1 October 2021 to 31 January 2023, additional recorders were deployed at six sites: 100 km North, 50 and 100 km East, 100 km South, and 50 and 100 km West of the Central site. The additional sites roughly formed a square about the Central site, oriented parallel and perpendicular to the coastline and bathymetry isopleths, so it might capture fauna migrating along the coast at various distances from the coast. The nominal locations of all deployment sites are shown in Figure 1 (map plotted with PyGMT v0.15.0 [31]). The sea depth at the monitoring sites varied from ~70 m at East-2 to ~1520 m at the North site. However, none of the recorders were suspended deeper than 1000 m, which is about the mean dive depth of several species of beaked whales—in the North Atlantic [32]. In 2019, SM2M recorders (Wildlife Acoustics, Maynard, MA, USA) were deployed; in 2021–2023 recorders were of type LS1XL (Loggerhead Instruments, St. Petersburg, FL, USA). All instruments had a wideband HTI-92-WB hydrophone with built-in preamplifier (High Tech Inc., Long Beach, MS, USA). All recorders were calibrated with input white noise prior to deployment [33]. They were programmed to record on a duty-cycled schedule (3 min every 15 min in 2019 and 5 min every 20 min in 2021–2023), at a sampling frequency of 96 kHz (Table 2). The effective bandwidth of recorded acoustic data was thus 48 kHz. This band would capture most of the beaked whale echolocation bandwidth, except for its high-frequency edge.
Table 2.
Details of the sound recording deployments analyzed for beaked whale clicks.
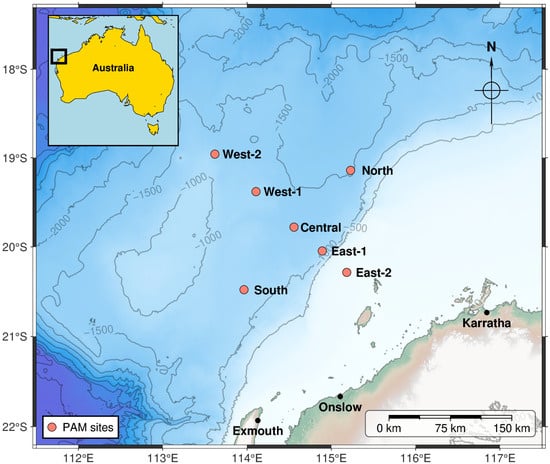
Figure 1.
Chart of acoustic recorder deployments.
2.2. Data Analysis
2.2.1. Manual Compilation of Beaked Whale Click Templates
The underwater soundscape at the seven sites was inspected manually in the software suite CHORUS [34], which runs under MATLAB (Version 2022b; The MathWorks Inc., Natick, MA, USA), by computing long-term spectral averages and zooming into acoustic events (periods above ambient levels) within the beaked whale click bandwidth. Beaked whale clicks were identified by their Gabor signal shape, which exhibits a Gaussian envelope that amplitude-modulates a sine wave of decreasing period (i.e., increasing frequency). Undistorted clicks (of high signal-to-noise ratio) were saved and their waveforms added to a library of beaked whale clicks from this geographic region. Twelve of the more diverse clicks were chosen as beaked whale click templates for subsequent correlation analyses. The aim was to capture the range of beaked whale click features present in our dataset and reduce any bias in species selection.
2.2.2. Automated Pulsive Signal Extraction
Pulsive signals were automatically detected and extracted from PAM recordings by finding outliers in an autoregression (AR) model of background noise [35]. This AR outlier detection routine (AR detector) was originally developed to remove pulsive noise from snapping shrimp in sea noise recordings [34]. The AR detector was applied to all recordings after they had been filtered with a band-pass Butterworth filter of 6th order between 20 kHz and 48 kHz (Nyquist frequency), which spans almost all spectral energy of beaked whale clicks. The AR detector was tuned to search for single pulses (i.e., potential beaked whale clicks) in background noise, using the settings in Table 3.
Table 3.
Settings of the autoregression (AR) model as part of pulsive signal detection.
2.2.3. Correlation of Extracted Pulses with Templates of Beaked Whale Clicks
Each pulsive signal was correlated with each of the beaked whale click templates, yielding 12 correlation coefficients per pulsive signal, and the median of these correlation coefficients was stored. In addition, for each pulsive signal, its kurtosis, peak frequency, frequency-modulation rate, pulse duration, and −10 dB bandwidth were calculated. Finally, ICI was computed between successive clicks in each audio file. All these measures were saved for later binary classification (i.e., beaked whale yes/no) of each extracted pulsive signal.
2.2.4. Manual Inspection of Extracted Pulses
A subset of 5254 audio files containing extracted pulses was manually inspected to identify reasonable temporal and spectral characteristics of beaked whale clicks to be used in a fully automated beaked whale click detector. These audio files were sorted by the maximum correlation coefficient (of all pulsive signals within each file)—in decreasing order. Next, the pulsive signals within each file were sorted by their correlation coefficient (median over the 12 templates)—in decreasing order.
A MATLAB GUI was written to display the sorted pulses, their waveform, envelope, Wigner–Ville transform, power spectral density, kurtosis, peak frequency, frequency-modulation rate, pulse duration, and −10 dB bandwidth, and a histogram of ICIs within the file. Each pulse was manually labelled as “1” (beaked whale) or “0” (not a beaked whale). If the displayed pulse was ambiguous and could not be confidently labelled, it was skipped and excluded from further analysis.
2.2.5. Parameter Selection of the Automated Beaked Whale Detector
The parameters computed of all extracted pulses were examined in scatter plots, and color-coded depending on whether they were confirmed as beaked whale or confirmed not to be a beaked whale. From these plots, the most distinguishing signal parameters and their ranges were derived. Within these ranges, thresholds were tested to find the set of parameters providing the best classification performance. Initially, True Positive Rate (TPR), False Positive Rate (FPR), True Negative Rate (TNR), and False Negative Rate (FNR) were computed to assess detector performance. However, due to the unbalanced nature of the data subset (the number of labelled non-beaked whale clicks was much higher than the number of confirmed beaked whale clicks), other metrics such as Precision, Recall, and F1-score were chosen to provide a more accurate performance assessment.
2.2.6. Execution of the Beaked Whale Click Detector
All pulsive signals extracted from all datasets were binary classified using the optimal parameters. The final output of this process was condensed into a binary classification of audio files; files were labelled as containing beaked whales if at least three clicks were classified as beaked whales. Figure 2 shows the schematic of the beaked whale click detection workflow.
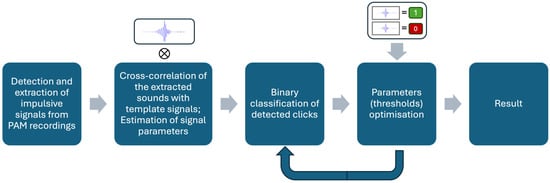
Figure 2.
Diagram of beaked whale click identification workflow.
2.2.7. Spatio-Temporal Occurrence of Beaked Whales
The acoustic detection of beaked whale clicks was compared spatially across the seven sites and temporally over the duration of recorder deployment. Moreover, the number of detections was correlated with environmental features. Bathymetry data were taken from Geoscience Australia’s 250 m bathymetry grid [36], and seafloor slope was derived from the bathymetry. Sea surface temperature (SST) data were obtained from the IMOS-SRS-SST-L3S dataset, downloaded from the Australian Ocean Data Network (http://imos.aodn.org.au/ (accessed on 1 October 2024)). From the same site, net primary productivity based on the OC3 model and Eppley-VGPM algorithm, gridded (adjusted) sea level anomaly, gridded sea level, and surface geostrophic velocity (UCUR, VCUR) were accessed.
Pearson’s correlation coefficient (R) was used to assess the optimal temporal lag and spatial radius of correlation with these parameters. General Linear Models (GLMs) were built with different combinations of these parameters to help determine the spatial and temporal drivers of beaked whale acoustic activity.
3. Results
3.1. Beaked Whale Click Templates
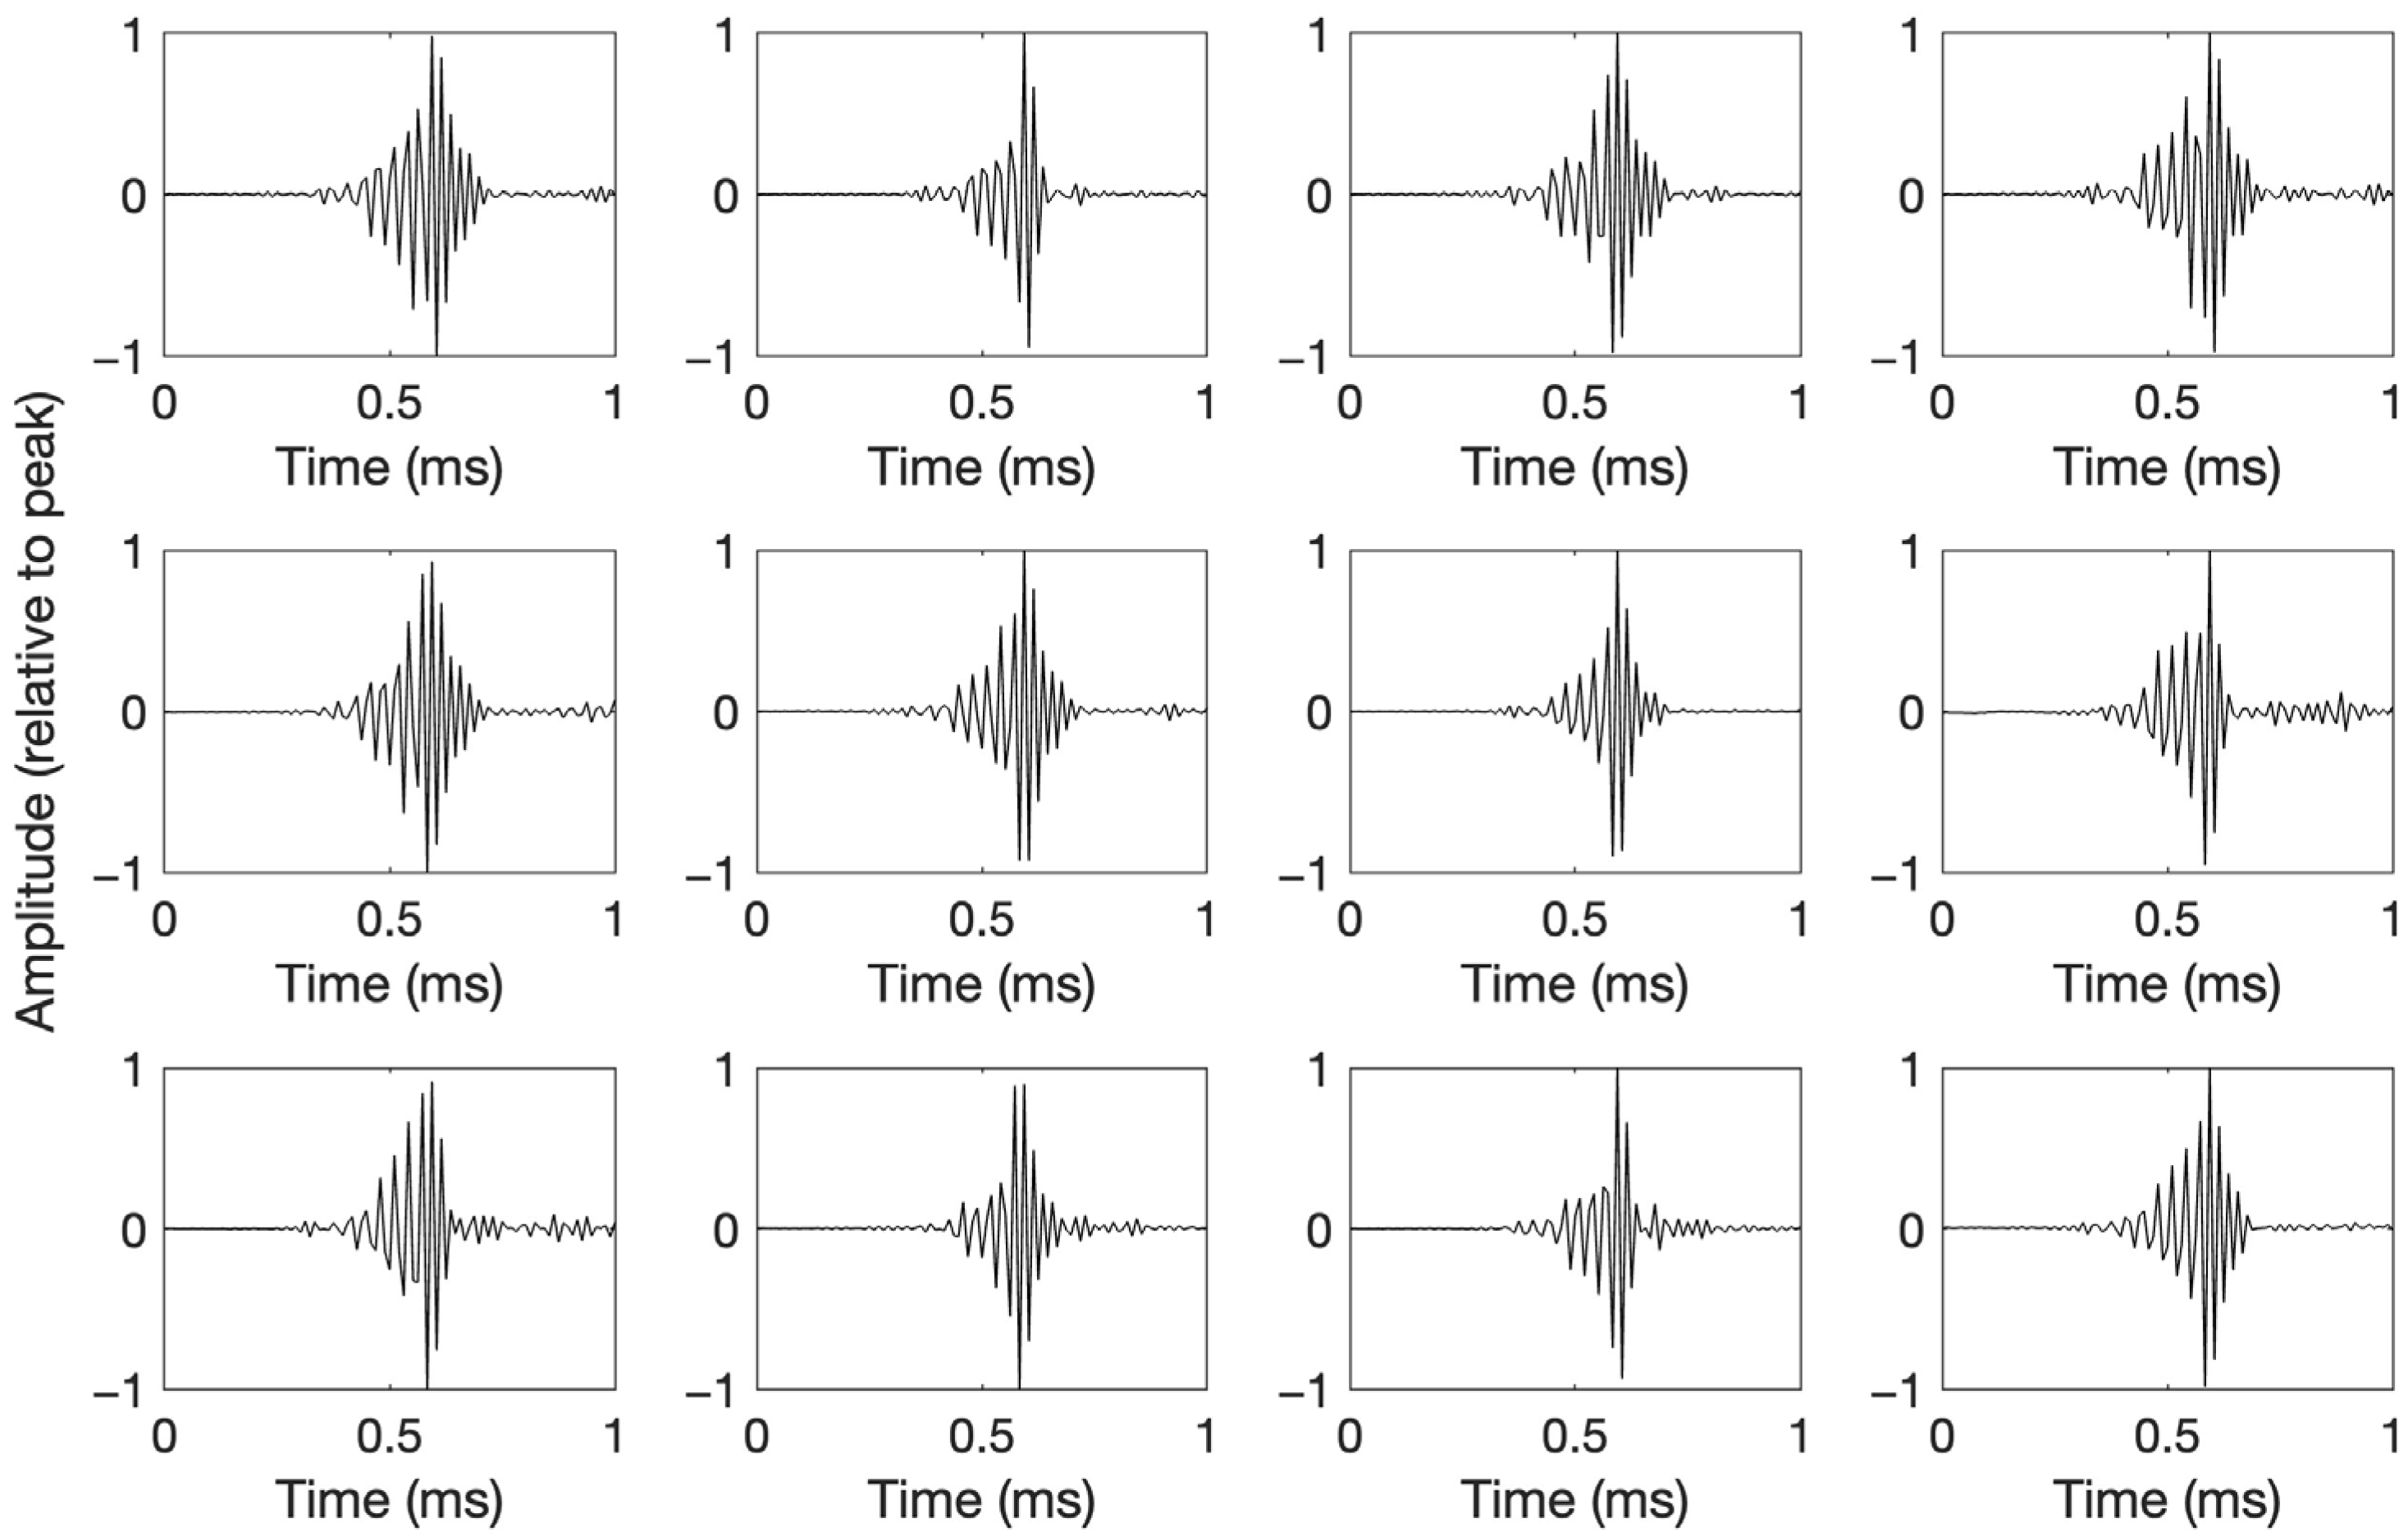
All of the manually extracted beaked whale clicks featured a bell-shaped envelope modulating the amplitude of a sine wave with increasing frequency (decreasing period). The 12 templates chosen for their diversity in waveform are plotted in Figure 3.

Figure 3.
Waveforms of manually selected clicks likely from multiple beaked whale species, used as templates in subsequent automated detection based on waveform correlation. Amplitudes are relative to peak.
3.2. Beaked Whale Click Features
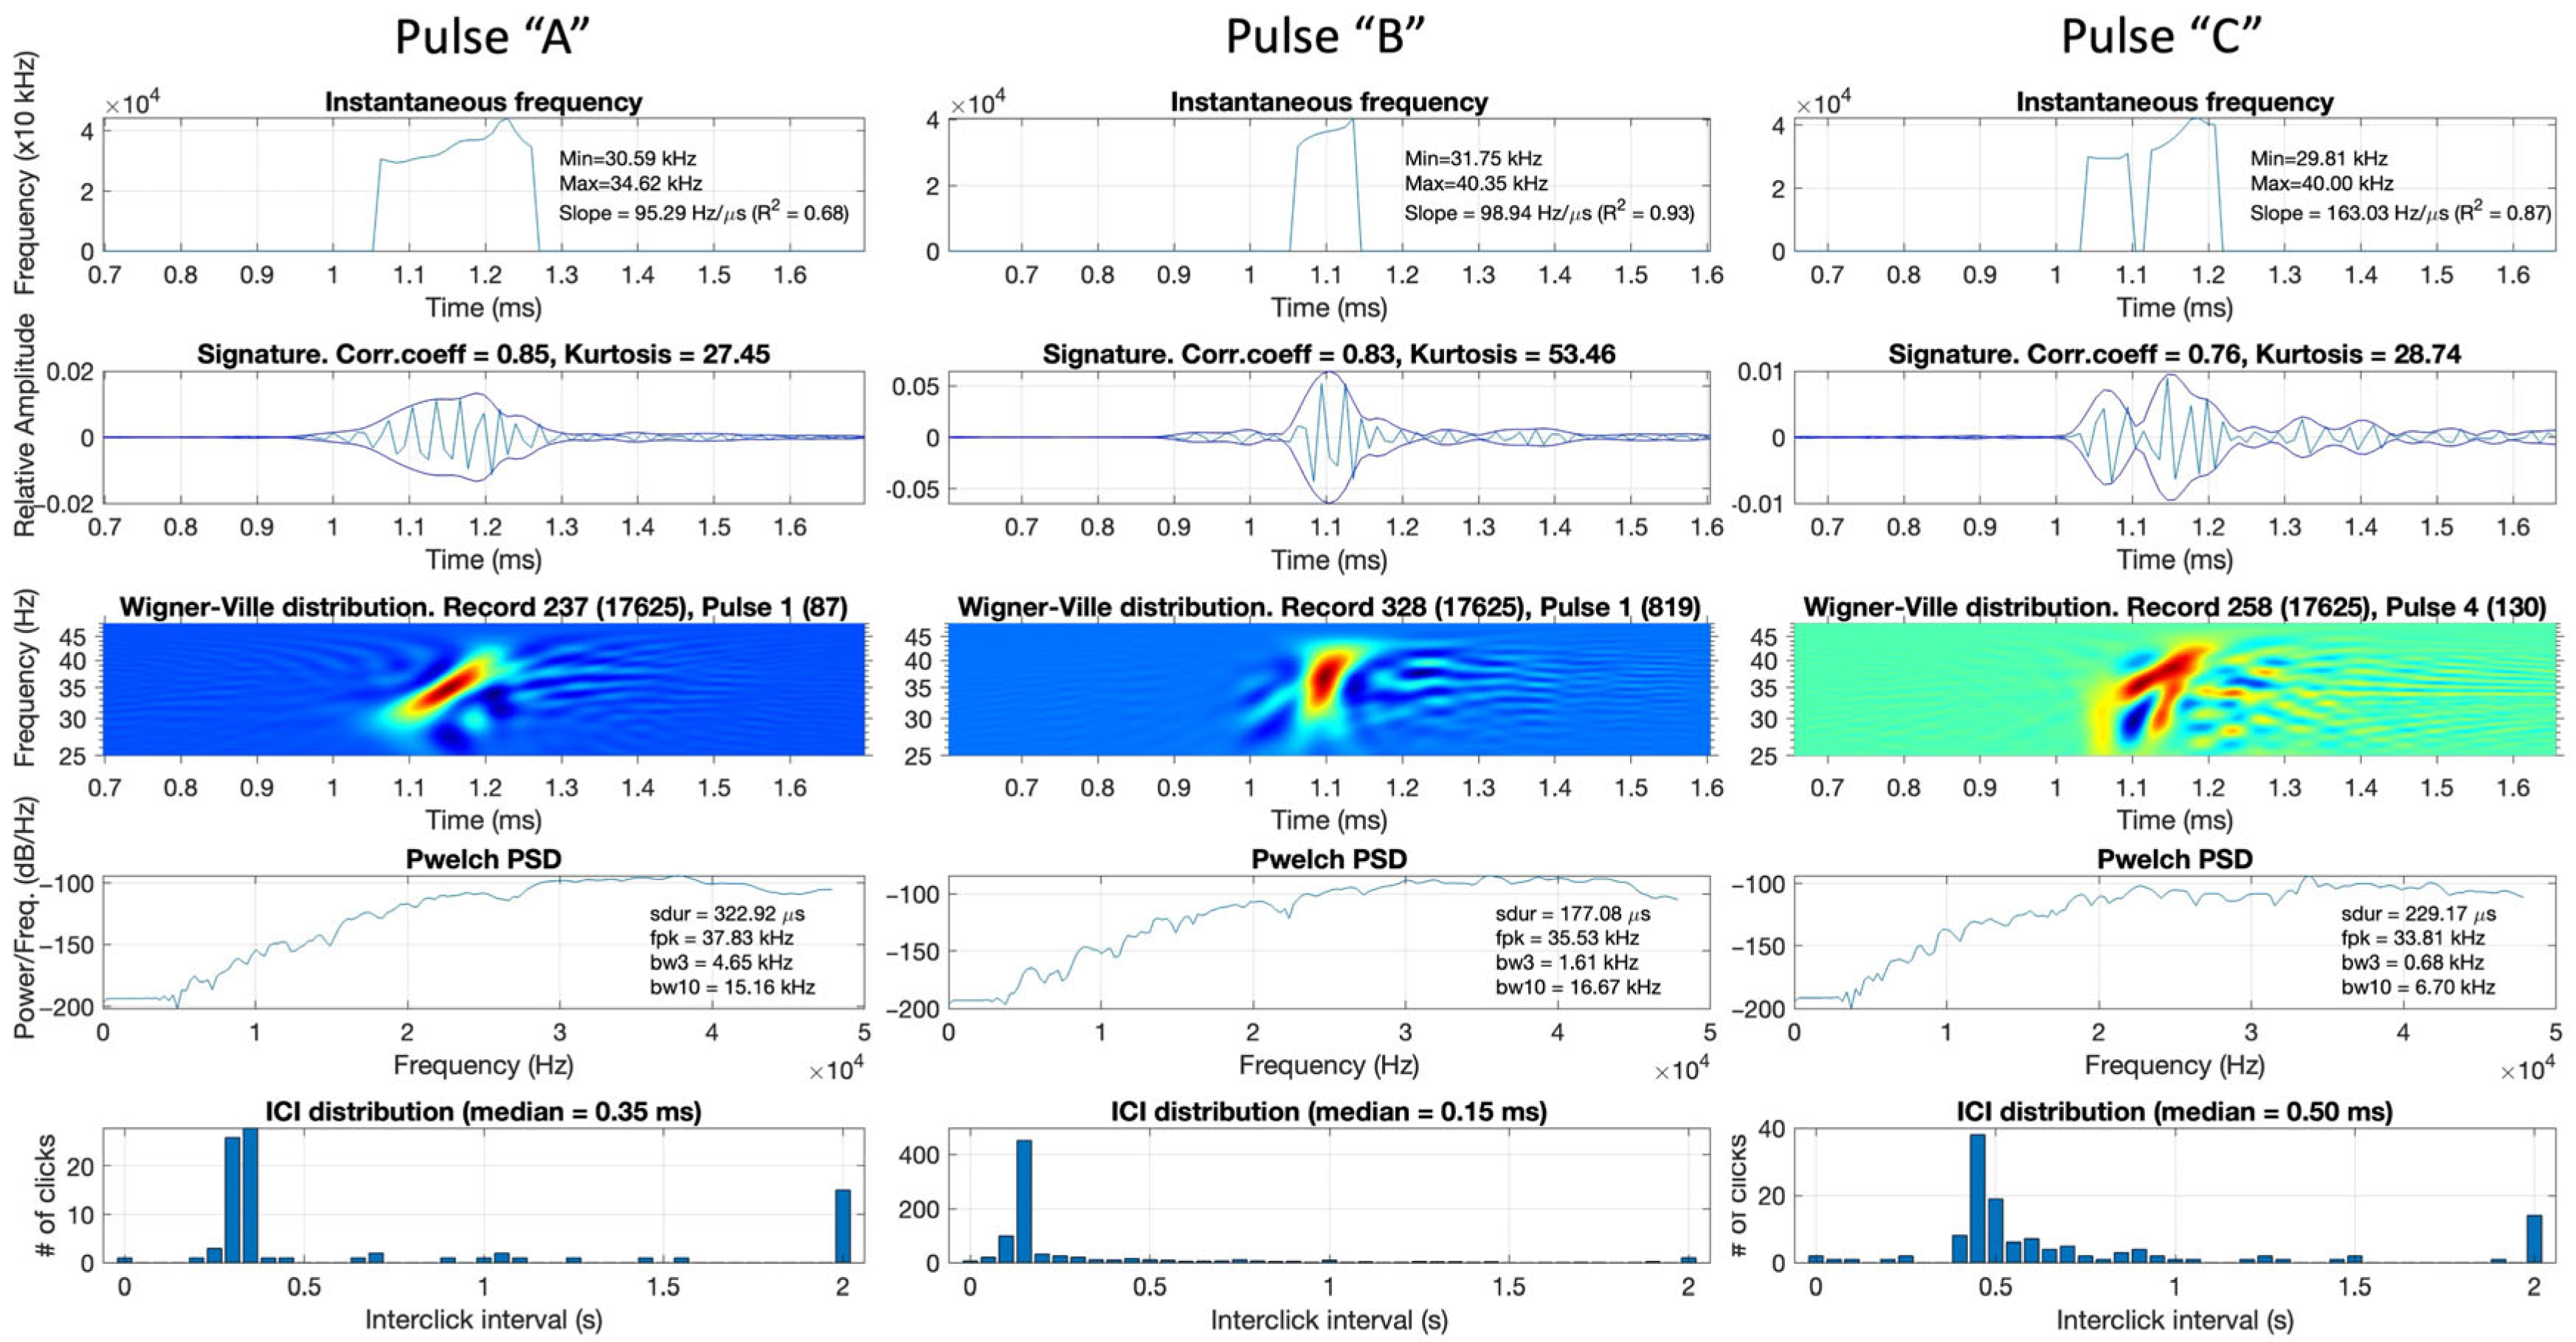
Examples of extracted pulsive events from the recordings are presented in Figure 4. Each pulse (labelled as “A”, “B”, or “C”) is depicted in five subplots: frequency-modulation rate, time signature with envelope, Wigner–Ville transform (which shows the time-frequency representation of the signal), power spectral density, and histogram of ICIs in the current audio file. These examples were selected to demonstrate the different types of pulses found in the data.
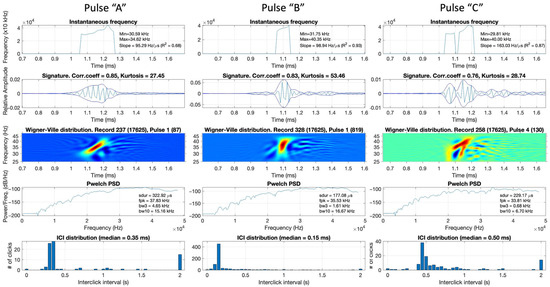
Figure 4.
Examples of reviewed extracted pulses displayed during the data labelling process. Each pulse window contains the following data (from top to bottom): instantaneous frequency showing frequency-modulation rate, time-series and envelope, Wigner–Ville transform, power spectral density, and ICI distribution plot of the corresponding audio file from which the displayed signal had been taken. Only pulse A was considered a beaked whale.
Pulse “A” was identified as a beaked whale click because it exhibited increasing frequency over time, a bell-shaped envelope, and peak frequency and pulse duration values that matched beaked whale click characteristics. The distribution of ICIs in the corresponding audio file peaked between 200 and 400 ms, indicating that this file contained numerous signals with ICIs commonly observed in beaked whales as reported in the literature. Pulse “B” was a frequency-modulated click; however, it was shorter (<200 ms) than common beaked whale clicks. The peak of the distribution of ICIs in this audio file was <200 ms, suggesting that this audio file and the displayed click could belong to delphinids. Thus, there was not enough confidence to label Pulse “B” as a beaked whale. Pulse “C” had a heavily distorted shape in the time-frequency domain, leading to its label as a non-beaked-whale click.
Results of the cross-plot analysis of signal parameters of extracted pulses are shown in Figure 5, for frequency-modulation rate and kurtosis versus correlation coefficient. Simply viewing the manually confirmed beaked-whale clicks (blue) versus those of low confidence (orange) and non-beaked-whale clicks (grey) demonstrates that beaked whale click features do segregate from those of other species. Beaked whale clicks had correlation coefficients > 0.65 (median correlation coefficient with the templates), frequency-modulation rates in the range of ~30–200 Hz/µs, and kurtosis values in the range of 20–50.
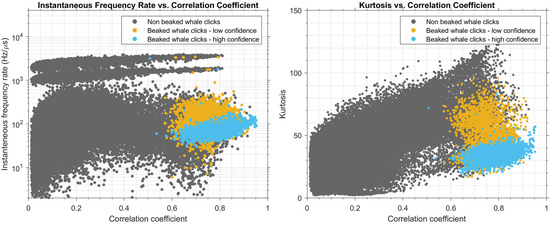
Figure 5.
Cross-plots of signal parameters with data points filled with colors corresponding to the type of the signal (beaked whale and non-beaked-whale). The left plot shows the labelled data distribution across signal frequency-modulation rate and correlation coefficient axes. The right plot shows the labelled data distribution across kurtosis and correlation coefficient axes. Grey dots correspond to pulses of non-beaked whale origin; blue dots correspond to manually identified beaked whale clicks; orange dots are low-confidence beaked whale clicks.
3.3. Detector Performance
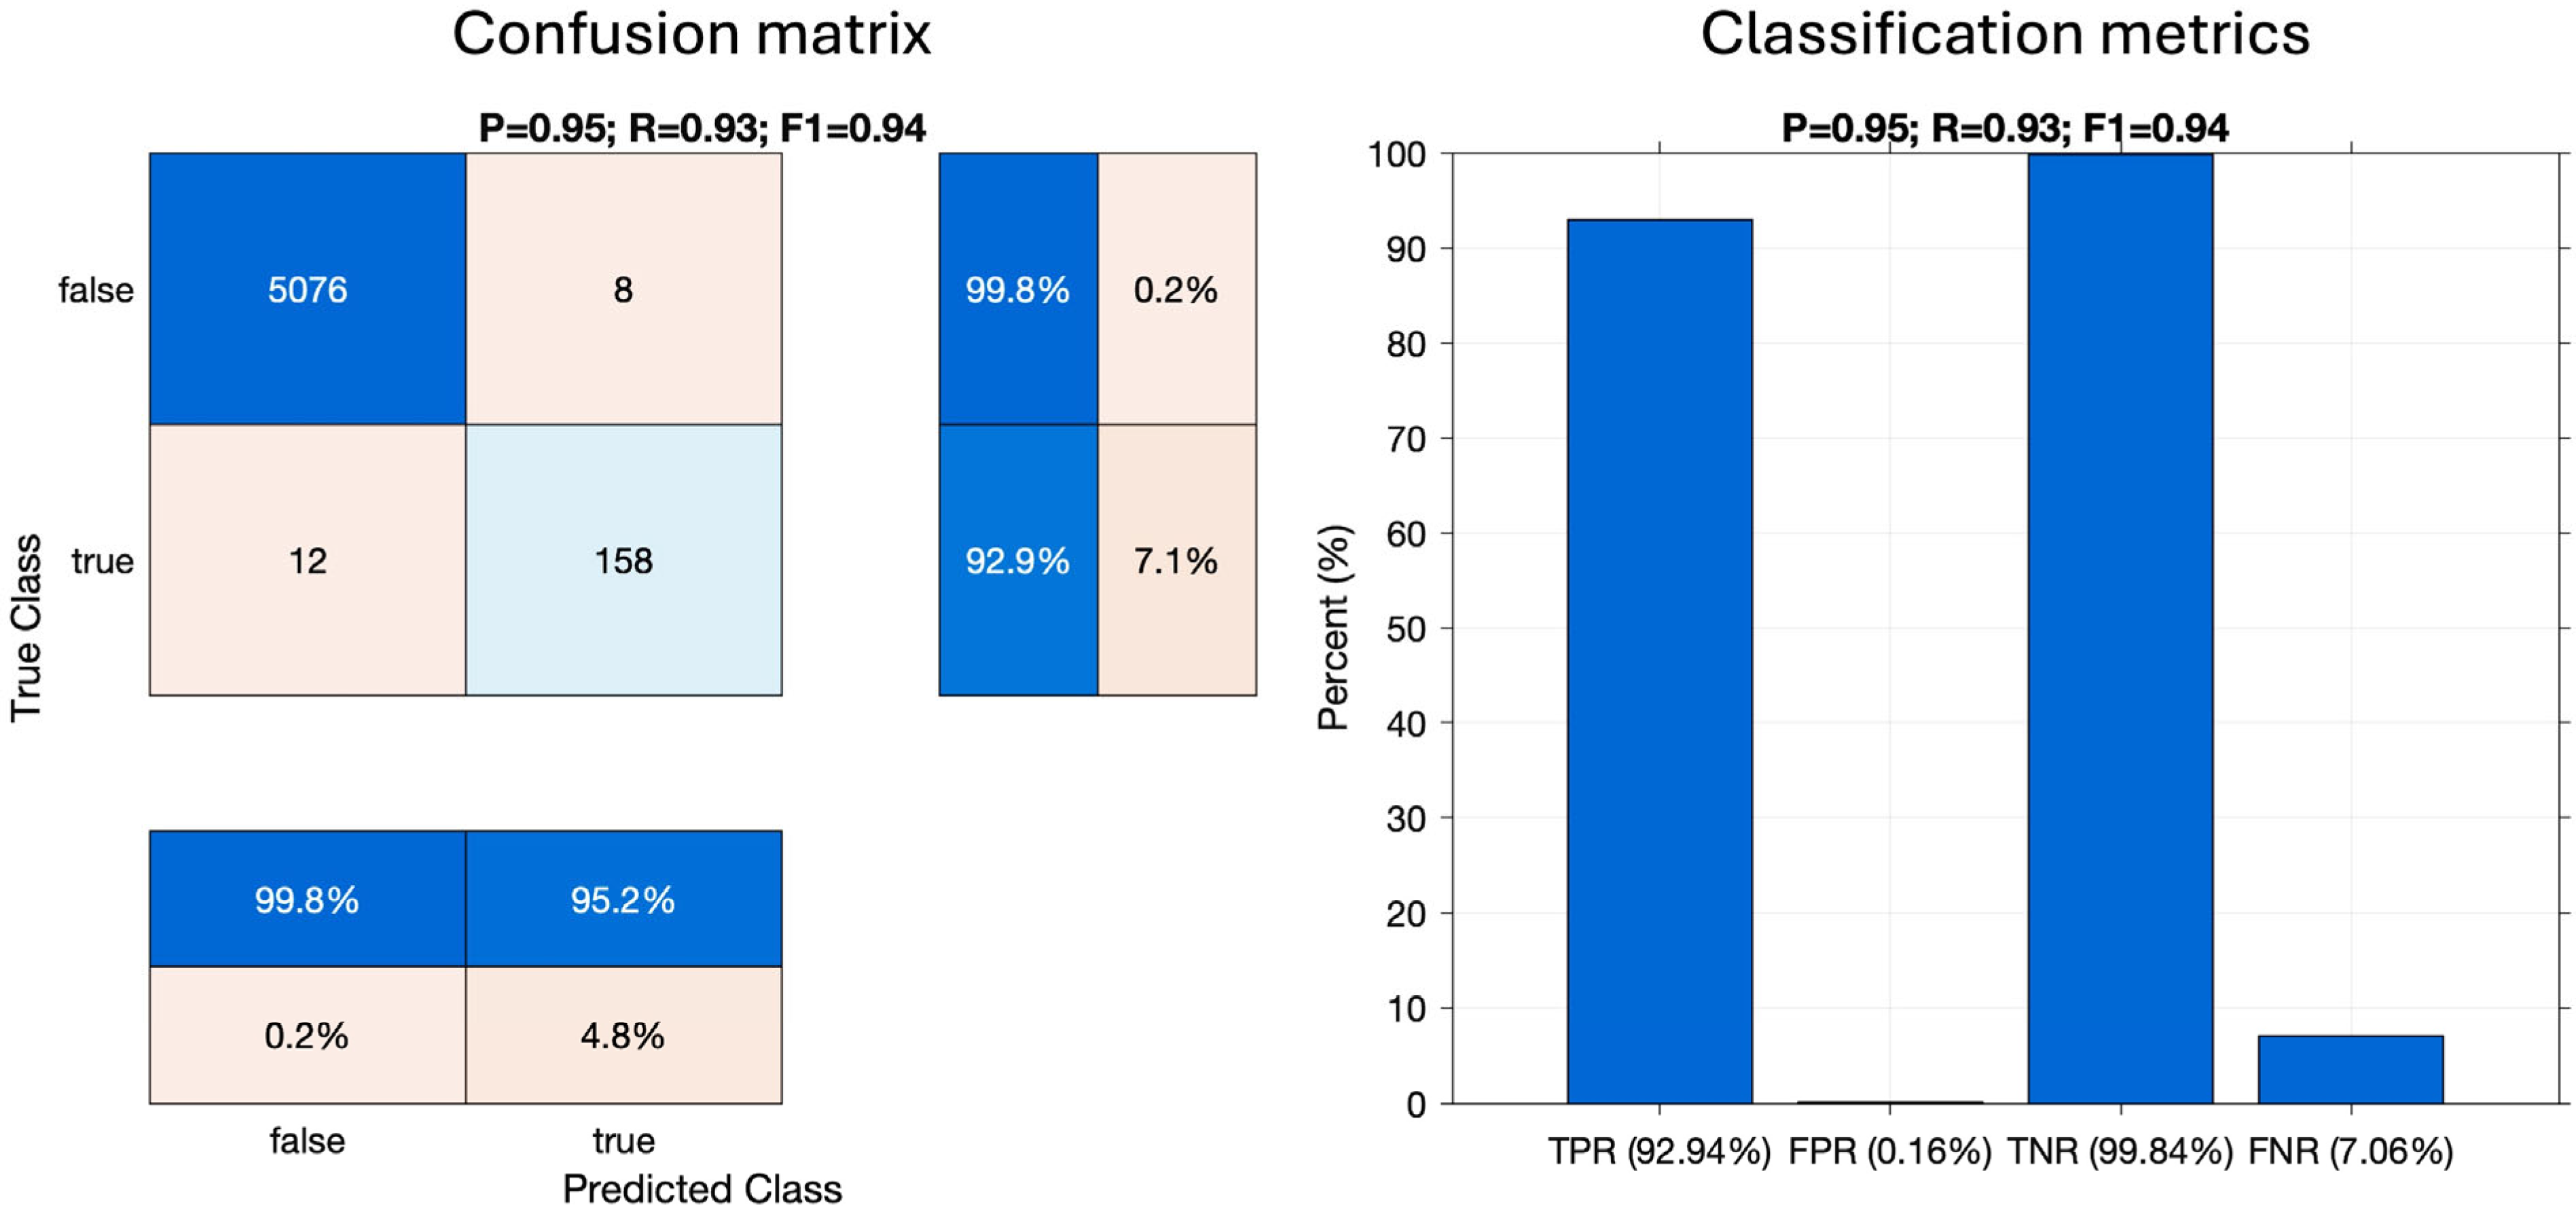
The results of the click classification performance assessment on a file basis rather than individual pulse basis, using the set of 5254 manually labelled audio files, are demonstrated in Figure 6. The left plot shows the confusion matrix with Precision (P), Recall (R), and F1-score (F1) printed in the title; the right plot shows TPR, FPR, TNR, and FNR metrics. The values inside the confusion matrix represent the numbers of files containing or not containing beaked whale clicks. Out of 5254 manually inspected files, 170 contained beaked whale clicks and 5084 did not. The detector correctly classed 158 files as containing beaked whale clicks and correctly rejected 5076 files. Twelve files with beaked whales were missed by the detector and eight files without beaked whales triggered false alarms. The TPR (i.e., percentage of correctly classed files with beaked whales out of all files with beaked whales) and the TNR (i.e., percentage of correctly rejected files as not containing beaked whales out of all files without beaked whales) were high (>90%), and the FPR and FNR were low (<10%).

Figure 6.
Beaked whale click detector performance assessment for the best set of automated detection parameters.
The detection and classification process achieved a correct detection rate (Recall) of over 92%, a correct reported rate (Precision) of over 95%, a false alarm rate (FP/(FP + TP)) of ~5%, and F1-score of 94%.
3.4. Spatio-Temporal Occurrence of Beaked Whale Clicks
Beaked whales were acoustically detected at all sites, except at the shallow East-2 site. Beaked whales were present all year round (over entire deployments) in the monitoring area of ~40,000 km2. In ~2.5 years of PAM data, ~2000 of ~220,000 audio samples contained beaked whale clicks (Table 4).
Table 4.
Beaked whale detection results. Top rows are 2021–2023; bottom row is 2019. Note that no recordings were obtained at the South Site between Nov 2021 and May 2022.
The acoustic activity of beaked whales at the Central site in 2019 was significantly lower than in 2021–2023. For the 2021–2023 dataset, the highest acoustic activity of beaked whales was at the Central site. The second-highest acoustic activity of beaked whales was at East-1; the lowest acoustic activity was observed at the North and South sites. West-1 and West-2 exhibited similar, intermediate statistics.
Comparison of the percentage of days with beaked whale detections at all sites (Table 2) with environmental parameters found the highest correlation with the distance from Central (R = −0.82), and this correlation was greater when the range was on a log scale (R = −0.87; Table 5). The parameters that drive this preference for the centre of the monitoring area might relate to sea level (mean and standard deviation) as indicated by the stronger correlations (R = 0.48 and 0.56, respectively) and the two-parameter model (first row, R = 0.91).
Table 5.
Correlation coefficients of different environmental parameters compared to the percentage of days with beaked whale detections at all sites between October 2021 and Jan 2023.
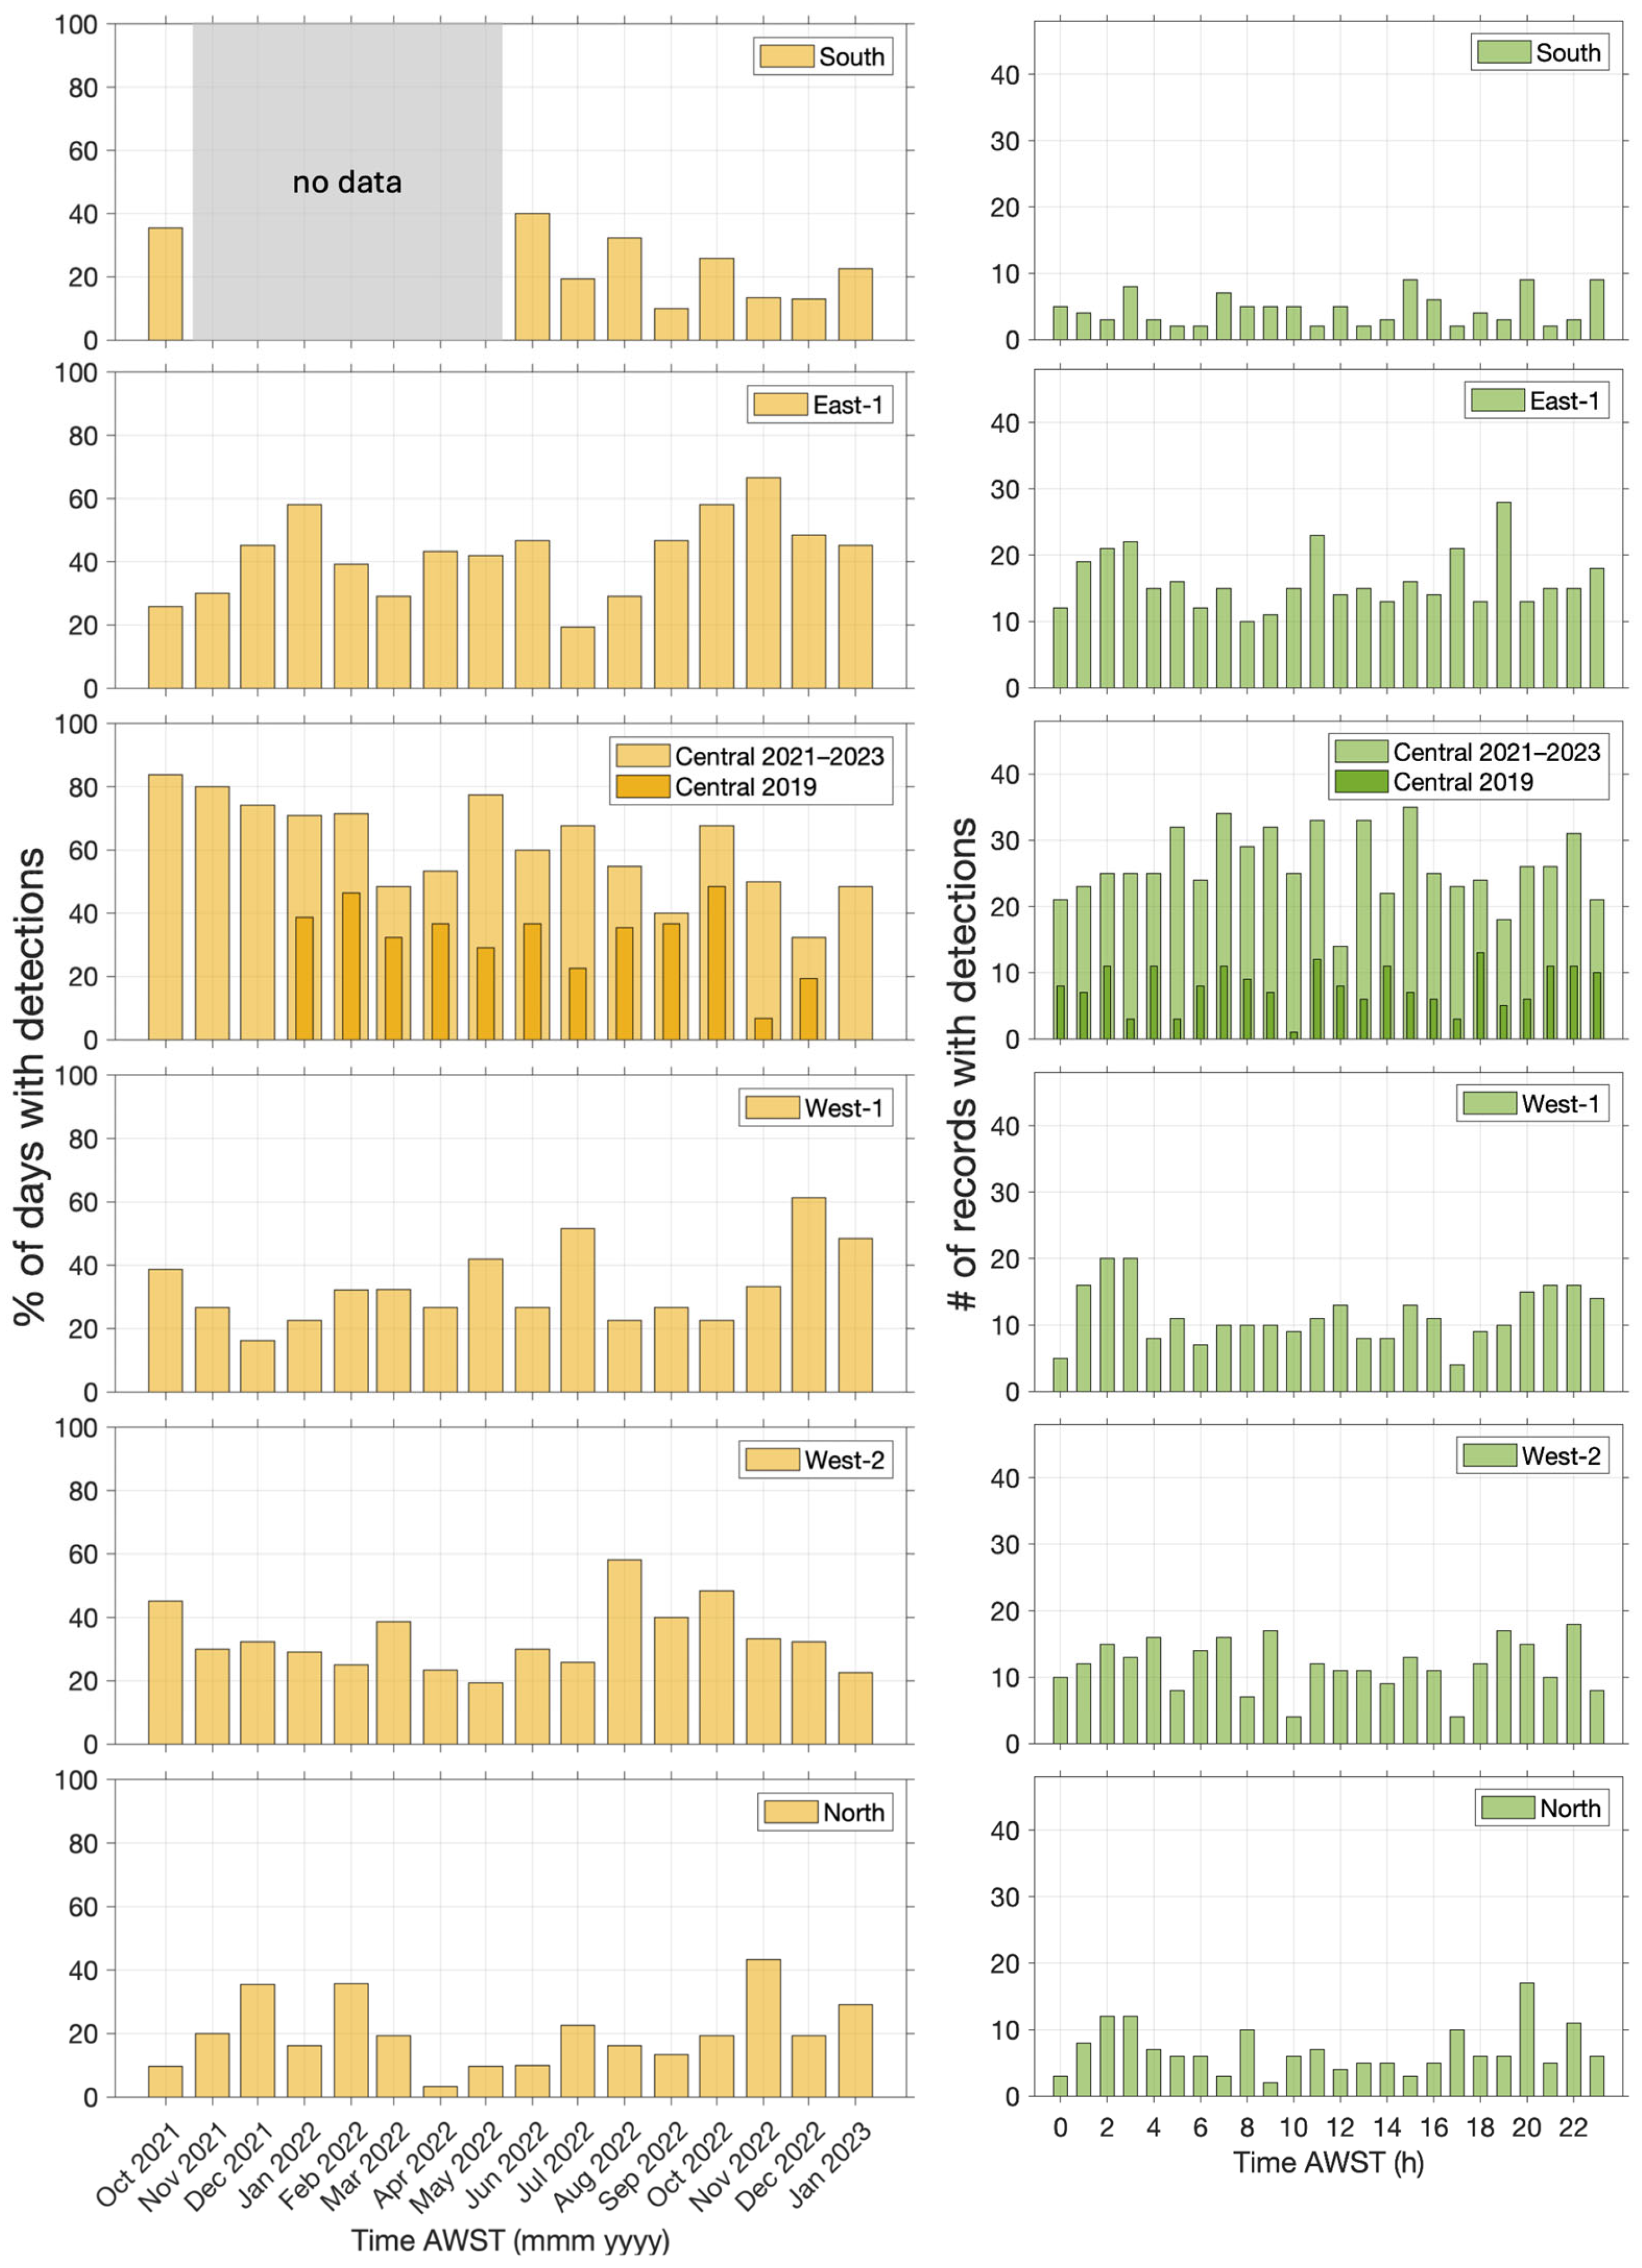
The temporal variation in beaked whale click detections is explored in Figure 7. Detections varied at each site from month to month. However, comparison across different sites does not show any clear temporal patterns (seasonal activity). The hourly distribution of beaked whale clicks was relatively even at each site, with no clear diurnal patterns.
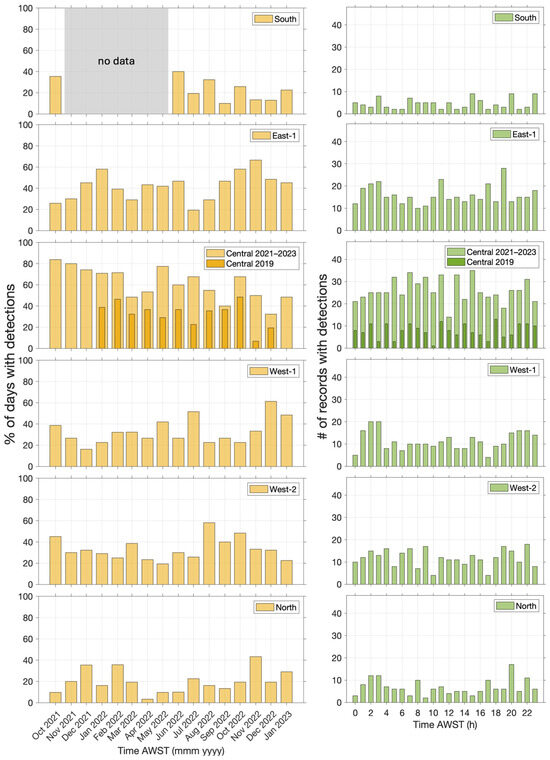
Figure 7.
Temporal distribution of beaked whale clicks at six monitoring sites (East-2 had no detections): percentage of days with detections by month (left) and hourly distribution of detections (right).
Running a GLM for the two sites of greatest number of detections, the percentage of days beaked whales were detected at Central each month correlated with mean gridded sea level (R = 0.61; Table 6). A 2-parameter GLS selected the mean and standard deviation of gridded sea level as predictors (R = 0.65). At East-1, the percentage of days beaked whales were detected each month correlated highest with the standard deviation of gridded sea level (R = −0.59). The highest correlation for a two-parameter GLM selected the standard deviation of gridded sea level and net primary productivity (R = 0.78).
Table 6.
Correlation coefficients of different environmental parameters compared to the percentage of days with beaked whale detections per month at Central site for 2019 and between October 2021 to January 2023 and East-1 between October 2021 to January 2023.
4. Discussion
Over a ~2.5-year PAM program (1 year at 1 site, followed by ~1.5 years at 7 sites spanning a 200 km × 200 km area) on Australia’s Northwest Shelf, beaked whale clicks were detected year-round at all sites but not at the shallow, coastal East-2 site.
The PAM datasets available for our study were acquired for the quantification of ambient ocean noise, sampling at 96 kHz, resulting in a 48 kHz upper frequency limit in analysed sound. This limited available bandwidth (from ~8 Hz to 48 kHz) is not ideal for the identification of all beaked whale species potentially occurring in Northwest Australia, as some species produce echolocation clicks that sweep to higher frequencies [4,5,11,14]. However, the available frequency bandwidth covers the dominant frequency band of beaked whales, allowing us to study the spatio-temporal acoustic activity of beaked whales as a group (rather than to species) across the monitoring area.
Our automated beaked whale click detector first extracted any pulses from the recordings and then classified pulses as beaked whale clicks by cross-correlation of the waveforms with manually extracted beaked whale templates and by comparison of frequency and duration features computed from the waveforms. Manual annotations may be subject to annotator bias, and so, only the authors (experienced bioacousticians in these ambient noise conditions) undertook this task. Odontocete clicks may exhibit distorted waveforms if recorded off-axis (of their biosonar beam) or after propagation through the environment [18,37,38,39,40,41,42,43,44]. Therefore, clicks of poor quality were discarded from analysis, and only Gabor-type signals were considered as potential beaked whales. Given beaked whales exhibit a consistent and species-specific ICI when searching for prey, ICI was chosen as an additional parameter for beaked whale detection; it is more robust to off-axis recording and sound propagation than some of the frequency measures. Finally, detector performance was enhanced by reporting beaked whale acoustic presence on a file (3 and 5 min) basis rather than click-by-click. Tested with 5254 manual annotations, our process achieved a satisfactory performance of 95% Precision and 92% Recall.
Spatially, the highest beaked whale acoustic activity occurred at the Central site (followed by East-1, then West-1). The far West-2, South, and North sites had fewer detections; the East-2 site had none. This increased acoustic activity within the central monitoring area might be related to sea level (both its mean and standard deviation) as shown by the GLM. The absence of beaked whale clicks at East-2 is likely related to the shallow sea depth at this site (<80 m), which makes it unsuitable for foraging. Beaked whales feed on deep-water prey. Moreover, beaked whales do not tend to click when at shallow depths [45]. Elsewhere in Australia, beaked whales are regularly and reliably sighted offshore over deep canyons but never closer to shore enroute to the canyon system [8,46]. Elsewhere in the world, long-term site fidelity has also been found [47,48], along the continental shelf edge but even higher in the presence of canyon features [49], and strongly correlated with deep-water prey fields [50]. We did not have any data on deep-water prey occurrence. We tried a correlation with sea surface primary productivity, but this was poor, likely due to a disconnect between productivity at the surface and fish and squid at great depth (>1 km). Other studies have found a correlation with sea surface temperature [32], which we did not find. In some surveys elsewhere, beaked whale occurrence extended beyond the shelf edge into the abyssal plain [32,51]—as was the case with most of our sites.
Proximity to shipping lanes might influence beaked whale distribution. The deep-water sites with fewer acoustic detections were West-2, North, and South, and all three are close to the major shipping lanes from Australia to Southeast Asia. Shortened foraging dives and fewer prey capture events have been reported near vessels [52] as has a shrinking of the (horizontal) area in which beaked whales were recorded foraging in increased ambient ship noise levels [53].
Beaked whale acoustic presence at all sites lacked strong seasonality, similar to some other parts of the world [54]. Additionally, no diel pattern in beaked whale click detection was present across our study area. While this does not necessarily mean that their foraging behaviour has no diel pattern, our results concur with findings elsewhere in the world [28,45,55,56], where beaked whales were recorded foraging day and night (albeit with differing dive parameters [45]). Conversely, elsewhere in shallower water, beaked whales had a strong preference for night-time foraging, possibly targeting prey higher up in the water column at night-time [57,58]. Nonetheless, there were some temporal patterns at our most active sites (i.e., Central and East-1) that appeared to correlate with the oceanography of the area. Monthly acoustic activity at Central and East-1 was again (as in the above spatial model) best predicted by variations in sea level suggesting eddy structure may relate to their presence. The prediction of beaked whale acoustic activity at East-1 improved when primary productivity was combined with the standard deviation of mean sea level. This could be an indicator for stronger mixing of water layers at East-1, which sits right at the continental shelf edge.
The acoustic activity at the Central site was overall lower in 2019 compared to 2021–2023. Interestingly, the Southern Oscillation Index (SOI) during the first deployment in 2019 tended towards the El Niño phase of the Walker Circulation (mean SOI = −7), which is associated with a weaker Leeuwin current [59], whereas the SOI during the second deployment was in the La Niña phase (mean SOI = 13), which usually means a stronger Leeuwin current [59]. The SOI is expected to affect prey fields. While the acoustic time series in the study area was not long enough to be conclusive with regard to the influence of the SOI on beaked whale acoustic activity, a strong correlation was found with the El Niño Southern Oscillation cycle off Hawaii [60]. Elsewhere, too, Blainville’s and Gervais’ (Mesoplodon europaeus) beaked whale acoustic presence was linked to major currents, the Gulf Stream [32].
Finally, we note that whistles (0.3 s, 12 kHz), which started with a tiny and brief downsweep, then remained flat, then ended with an equally tiny and brief upsweep, and which had harmonic overtones, similar to those reported for diving Blainville’s beaked whales [61], were observed (visually in spectrograms during the manual soundscape inspection) at Central in March 2019, but were not searched for in the 2019 and 2021–2023 recordings.
5. Conclusions
Beaked whales are a cryptic species, rarely sighted at sea. The last 30 years have seen significant advances in beaked whale research through tagging, biotelemetry, genetic sampling, photo-identification, etc. [62]. Our passive acoustic recordings were the first to document a year-round presence, day and night, on Australia’s Northwest Shelf. Given that the automated detector was trained to be very conservative (rejecting off-axis clicks and clicks of poor signal-to-noise ratio), and given that PAM misses animals when they are silent, the presence of beaked whales in this region is likely significant. Future research might use higher sampling frequencies to identify clicks to species. It might look for beaked whales specifically over submarine canyon systems on the Northwest Shelf of Australia, to better understand functional habitat use and needs, for marine spatial planning.
Author Contributions
Conceptualization, C.E.; data collection, R.M. and E.S.; data analysis, E.S., I.P. and A.G.; writing—original draft preparation, E.S. and I.P.; writing—review and editing, C.E., A.G. and R.M.; project administration, C.E.; funding acquisition, C.E. All authors have read and agreed to the published version of the manuscript.
Funding
This research was funded by Chevron Australia.
Institutional Review Board Statement
Passive underwater acoustic recordings were collected as an observational study of soundscape under Curtin University Animal Ethics approval ARE2021-11.
Data Availability Statement
The click templates may be requested from the first author. The CHORUS software package for manual soundscape review is available for download from https://cmst.curtin.edu.au/products/ (accessed on 31 March 2025). Environmental covariates may be downloaded from the Australian Ocean Data Network https://portal.aodn.org.au/ (accessed on 31 March 2025).
Conflicts of Interest
The authors declare no conflicts of interest.
References
- Groom, C.; Coughran, D.K.; Smith, H. Records of beaked whales (family Ziphiidae) in Western Australian waters. Mar. Biodivers. Rec. 2014, 7, e50. [Google Scholar] [CrossRef]
- Klinck, H.; Mellinger, D.K.; Klinck, K.; Bogue, N.M.; Luby, J.C.; Jump, W.A.; Shilling, G.B.; Litchendorf, T.; Wood, A.S.; Schorr, G.S.; et al. Near-real-time acoustic monitoring of beaked whales and other cetaceans using a Seaglider™. PLoS ONE 2012, 7, e36128. [Google Scholar] [CrossRef]
- Alcázar-Treviño, J.; Johnson, M.; Arranz, P.; Warren, V.E.; Pérez-González, C.J.; Marques, T.; Madsen, P.T.; Soto, N.A.d. Deep-diving beaked whales dive together but forage apart. Proc. R. Soc. B 2021, 288, 20201905. [Google Scholar] [CrossRef] [PubMed]
- Johnson, M.; Madsen, P.T.; Zimmer, W.M.X.; de Soto, N.A.; Tyack, P.L. Beaked whales echolocate on prey. Proc. R. Soc. B 2004, 271, S383–S386. [Google Scholar] [CrossRef]
- Baumann-Pickering, S.; Roch, M.A.; Brownell, R.L., Jr.; Simonis, A.E.; McDonald, M.A.; Solsona-Berga, A.; Oleson, E.M.; Wiggins, S.M.; Hildebrand, J.A. Spatio-temporal patterns of beaked whale echolocation signals in the North Pacific. PLoS ONE 2014, 9, e86072. [Google Scholar] [CrossRef]
- Tyack, P.L.; Johnson, M.P.; Zimmer, W.M.X.; de Soto, N.A.; Madsen, P.T. Acoustic behavior of beaked whales, with implications for acoustic monitoring. Ocean 2006, 1–4, 509–514. [Google Scholar] [CrossRef]
- McCullough, J.L.K.; Wren, J.L.K.; Oleson, E.M.; Allen, A.N.; Siders, Z.A.; Norris, E.S. An acoustic survey of beaked whales and Kogia spp. in the Mariana Archipelago using drifting recorders. Front. Mar. Sci. 2021, 8, 664292. [Google Scholar] [CrossRef]
- Wellard, R.; Lightbody, K.; Fouda, L.; Blewitt, M.; Riggs, D.; Erbe, C. Killer whale (Orcinus orca) predation on beaked whales (Mesoplodon spp.) in the Bremer Sub-Basin, Western Australia. PLoS ONE 2016, 11, e0166670. [Google Scholar] [CrossRef]
- Zimmer, W.M.X.; Harwood, J.; Tyack, P.L.; Johnson, M.P.; Madsen, P.T. Passive acoustic detection of deep-diving beaked whales. J. Acoust. Soc. Am. 2008, 124, 2823–2832. [Google Scholar] [CrossRef]
- Madsen, P.T.; Johnson, M.; de Soto, N.A.; Zimmer, W.M.X.; Tyack, P. Biosonar performance of foraging beaked whales (Mesoplodon densirostris). J. Exp. Biol. 2005, 208, 181–194. [Google Scholar] [CrossRef]
- Johnson, M.; Madsen, P.T.; Zimmer, W.M.X.; de Soto, N.A.; Tyack, P.L. Foraging Blainville’s beaked whales (Mesoplodon densirostris) produce distinct click types matched to different phases of echolocation. J. Exp. Biol. 2006, 209, 5038–5050. [Google Scholar] [CrossRef] [PubMed]
- Zimmer, W.M.X.; Johnson, M.P.; Madsen, P.T.; Tyack, P.L. Echolocation clicks of free-ranging Cuvier’s beaked whales (Ziphius cavirostris). J. Acoust. Soc. Am. 2005, 117, 3919–3927. [Google Scholar] [CrossRef] [PubMed]
- Stanistreet, J.E.; Nowacek, D.P.; Baumann-Pickering, S.; Bell, J.T.; Cholewiak, D.M.; Hildebrand, J.A.; Hodge, L.E.W.; Moors-Murphy, H.B.; Van Parijs, S.M.; Read, A.J. Using passive acoustic monitoring to document the distribution of beaked whale species in the western North Atlantic Ocean. Can. J. Fish. Aquat. Sci. 2017, 74, 2098–2109. [Google Scholar] [CrossRef]
- Baumann-Pickering, S.; McDonald, M.A.; Simonis, A.E.; Solsona Berga, A.; Merkens, K.P.B.; Oleson, E.M.; Roch, M.A.; Wiggins, S.M.; Rankin, S.; Yack, T.M.; et al. Species-specific beaked whale echolocation signals. J. Acoust. Soc. Am. 2013, 134, 2293–2301. [Google Scholar] [CrossRef]
- Madsen, P.T.; Kerr, I.; Payne, R. Echolocation clicks of two free-ranging, oceanic delphinids with different food preferences: False killer whales Pseudorca crassidens and Risso’s dolphins Grampus griseus. J. Exp. Biol. 2004, 207, 1811–1823. [Google Scholar] [CrossRef]
- Madsen, P.T.; Aguilar de Soto, N.; Arranz, P.; Johnson, M. Echolocation in Blainville’s beaked whales (Mesoplodon densirostris). J. Comp. Physiol. 2013, 199, 451–469. [Google Scholar] [CrossRef]
- Au, W.W.L.; Ford, J.K.B.; Horne, J.K.; Allman, K.A.N. Echolocation signals of free-ranging killer whales (Orcinus orca) and modelling of foraging for chinook salmon (Oncorhynchus tshawytscha). J. Acoust. Soc. Am. 2004, 115, 901–909. [Google Scholar] [CrossRef]
- Au, W.W.L. The Sonar of Dolphins; Springer: New York, NY, USA, 1993. [Google Scholar]
- Rasmussen, M.H.; Wahlberg, M.; Miller, L.A. Estimated transmission beam pattern of clicks recorded from free-ranging white-beaked dolphins (Lagenorhynchus albirostris). J. Acoust. Soc. Am. 2004, 116, 1826–1831. [Google Scholar] [CrossRef]
- Schotten, M.; Au, W.W.L.; Lammers, M.O.; Aubauer, R. Echolocation recordings and localization of wild spinner dolphins (Stenella longirostris) and pantropical spotted dolphins (S. attenuata) using a four-hydrophone array. In Echolocation in Bats and Dolphins; Thomas, J.A., Moss, C.F., Vater, M., Eds.; University of Chicago Press: Chicago, IL, USA, 2004; pp. 393–400. [Google Scholar]
- Madsen, P.T.; Payne, R.; Kristiansen, N.U.; Wahlberg, M.; Kerr, I.; Møhl, B. Sperm whale sound production studied with ultrasound time/depth-recording tags. J. Exp. Biol. 2002, 205, 1899–1906. [Google Scholar] [CrossRef]
- Madsen, P.T.; Møhl, B.; Nielsen, B.K.; Wahlberg, M. Male sperm whale behavior during exposures to distant seismic survey pulses. Aquat. Mamm. 2002, 28, 231–240. [Google Scholar]
- Klinck, H.; Mellinger, D.K. The energy ratio mapping algorithm: A tool to improve the energy-based detection of odontocete echolocation clicks. J. Acoust. Soc. Am. 2011, 129, 1807–1812. [Google Scholar] [CrossRef] [PubMed]
- Hildebrand, J.A.; Baumann-Pickering, S.; Frasier, K.E.; Trickey, J.S.; Merkens, K.P.; Wiggins, S.M.; Mcdonald, M.A.; Garrison, L.P.; Harris, D.; Marques, T.A.; et al. Passive acoustic monitoring of beaked whale densities in the Gulf of Mexico. Sci. Rep. 2015, 5, 16343. [Google Scholar] [CrossRef] [PubMed]
- Dong, L.; Song, Y.; Lin, W.; Liu, M.; Lin, M.; Li, S. Echolocation signals recorded in the presence of Deraniyagala’s beaked whales (Mesoplodon hotaula) in the western Pacific (South China Sea) indicate species-specificity and intraspecific variation. Mar. Mamm. Sci. 2025, 41, e13179. [Google Scholar] [CrossRef]
- Baumann-Pickering, S.; Trickey, J.S.; Solsona-Berga, A.; Rice, A.; Oleson, E.M.; Hildebrand, J.A.; Frasier, K.E. Geographic differences in Blainville’s beaked whale (Mesoplodon densirostris) echolocation clicks. Divers. Distrib. 2023, 29, 478–491. [Google Scholar] [CrossRef]
- Madhusudhana, S.; Gavrilov, A.N.; Erbe, C. Automatic detection of echolocation clicks based on a Gabor model of their waveform. J. Acoust. Soc. Am. 2015, 137, 3077–3086. [Google Scholar] [CrossRef]
- Kowarski, K.; Delarue, J.; Martin, B.; O’Brien, J.; Meade, R.; Oliver, Ó.; Cadhla, O.; Berrow, S. Signals from the deep: Spatial and temporal acoustic occurrence of beaked whales off western Ireland. PLoS ONE 2018, 13, e0199431. [Google Scholar] [CrossRef]
- Solsona-Berga, A.; DeAngelis, A.I.; Cholewiak, D.M.; Trickey, J.S.; Mueller-Brennan, L.; Frasier, K.E.; Van Parijs, S.M.; Baumann-Pickering, S. Machine learning with taxonomic family delimitation aids in the classification of ephemeral beaked whale events in passive acoustic monitoring. PLoS ONE 2024, 19, e0304744. [Google Scholar] [CrossRef]
- Rankin, S.; Sakai, T.; Archer, F.I.; Barlow, J.; Cholewiak, D.; DeAngelis, A.I.; McCullough, J.L.K.; Oleson, E.M.; Simonis, A.E.; Soldevilla, M.S.; et al. Open-source machine learning BANTER acoustic classification of beaked whale echolocation pulses. Ecol. Inform. 2024, 80, 102511. [Google Scholar] [CrossRef]
- Tian, D.; Uieda, L.; Leong, W.J.; Fröhlich, Y.; Schlitzer, W.; Grund, M.; Jones, M.; Toney, L.; Yao, J.; Tong, J.-H.; et al. PyGMT: A Python interface for the Generic Mapping Tools, v0.15.0; Karlsruher Institut für Technologie: Karlsruhe, Germany, 2025. [Google Scholar] [CrossRef]
- DeAngelis, A.I.; Westell, A.; Baumann-Pickering, S.; Bell, J.; Cholewiak, D.; Corkeron, P.J.; Soldevilla, M.S.; Solsona-Berga, A.; Trickey, J.S.; Van Parijs, S.M. Habitat utilization by beaked whales in the western North Atlantic Ocean using passive acoustics. Mar. Ecol. Prog. Ser. 2025, 754, 137–153. [Google Scholar] [CrossRef]
- McCauley, R.D.; Thomas, F.; Parsons, M.J.G.; Erbe, C.; Cato, D.; Duncan, A.J.; Gavrilov, A.N.; Parnum, I.M.; Salgado-Kent, C. Developing an underwater sound recorder. Acoust. Aust. 2017, 45, 301–311. [Google Scholar] [CrossRef]
- Gavrilov, A.N.; Parsons, M.J.G. A Matlab tool for the characterisation of recorded underwater sound (CHORUS). Acoust. Aust. 2014, 42, 190–196. [Google Scholar]
- Godsill, S.J.; Rayner, P.J. Statistical reconstruction and analysis of autoregressive signals in impulsive noise using the Gibbs sampler. IEEE Trans. Speech Audio Process. 1998, 6, 352–372. [Google Scholar] [CrossRef]
- Beaman, R. AusBathyTopo (Australia) 250m 2023—A High-resolution Depth Model (20230004C); Geoscience Australia: Canberra, Australia, 2023. [Google Scholar]
- Au, W.W.L.; Floyd, R.W.; Haun, J.E. Propagation of Atlantic bottlenose dolphin echolocation signals. J. Acoust. Soc. Am. 1978, 64, 411–422. [Google Scholar] [CrossRef]
- Baumann-Pickering, S.; Wiggins, S.M.; Hildebrand, J.A.; Roch, M.A.; Schnitzler, H.U. Discriminating features of echolocation clicks of melon-headed whales (Peponocephala electra), bottlenose dolphins (Tursiops truncatus), and Gray’s spinner dolphins (Stenella longirostris longirostris). J. Acoust. Soc. Am. 2010, 128, 2212–2224. [Google Scholar] [CrossRef]
- Wahlberg, M.; Jensen, F.; Soto, N.; Beedholm, K.; Bejder, L.; Oliveira, C.; Rasmussen, M.; Simon, M.; Villadsgaard, A.; Madsen, P. Source parameters of echolocation clicks from wild bottlenose dolphins (Tursiops aduncus and Tursiops truncatus). J. Acoust. Soc. Am. 2011, 130, 2263–2274. [Google Scholar] [CrossRef]
- Au, W.; Branstetter, B.; Moore, P.; Finneran, J. The biosonar field around an Atlantic bottlenose dolphin (Tursiops truncatus). J. Acoust. Soc. Am. 2012, 131, 569–576. [Google Scholar] [CrossRef]
- Au, W.; Branstetter, B.; Moore, P.; Finneran, J. Dolphin biosonar signals measured at extreme off-axis angles: Insights to sound propagation in the head. J. Acoust. Soc. Am. 2012, 132, 1199–1206. [Google Scholar] [CrossRef]
- Baumann-Pickering, S.; Yack, T.M.; Barlow, J.; Wiggins, S.M.; Hildebrand, J.A. Baird’s beaked whale echolocation signals. J. Acoust. Soc. Am. 2013, 133, 4321–4331. [Google Scholar] [CrossRef]
- Baumann-Pickering, S.; Roch, M.A.; Wiggins, S.M.; Schnitzler, H.-U.; Hildebrand, J.A. Acoustic behavior of melon-headed whales varies on a diel cycle. Behav. Ecol. Sociobiol. 2015, 69, 1553–1563. [Google Scholar] [CrossRef]
- Shaffer, J.W.; Moretti, D.; Jarvis, S.; Tyack, P.; Johnson, M. Effective beam pattern of the Blainville’s beaked whale (Mesoplodon densirostris) and implications for passive acoustic monitoring. J. Acoust. Soc. Am. 2013, 133, 1770–1784. [Google Scholar] [CrossRef]
- Arranz, P.; de Soto, N.A.; Madsen, P.T.; Brito, A.; Bordes, F.; Johnson, M.P. Following a foraging fish-finder: Diel habitat use of Blainville’s beaked whales revealed by echolocation. PLoS ONE 2011, 6, e28353. [Google Scholar] [CrossRef] [PubMed]
- Salgado Kent, C.; Bouchet, P.; Wellard, R.; Parnum, I.; Fouda, L.; Erbe, C. Seasonal productivity drives aggregations of killer whales and other cetaceans over submarine canyons of the Bremer Sub-Basin, south-western Australia. Aust. Mammal. 2020, 43, 168–178. [Google Scholar] [CrossRef]
- Arcangeli, A.; Campana, I.; Marini, L.; MacLeod, C.D. Long-term presence and habitat use of Cuvier’s beaked whale (Ziphius cavirostris) in the Central Tyrrhenian Sea. Mar. Ecol. 2016, 37, 269–282. [Google Scholar] [CrossRef]
- Smith, K.J.; Trueman, C.N.; France, C.A.M.; Sparks, J.P.; Brownlow, A.C.; Dähne, M.; Davison, N.J.; Guðmundsson, G.; Khidas, K.; Kitchener, A.C.; et al. Stable isotope analysis of specimens of opportunity reveals ocean-scale site fidelity in an elusive whale species. Front. Conserv. Sci. 2021, 2, 653766. [Google Scholar] [CrossRef]
- Waring, G.T.; Hamazaki, T.; Sheehan, D.; Wood, G.; Baker, S. Characterization of beaked whale (Ziphiidae) and sperm whale (Physeter macrocephalus) summer habitat in shelf-edge and deeper waters off the northeast U.S. Mar. Mamm. Sci. 2001, 17, 703–717. [Google Scholar] [CrossRef]
- Hazen, E.L.; Nowacek, D.P.; Laurent, L.S.; Halpin, P.N.; Moretti, D.J. The relationship among oceanography, prey fields, and beaked whale foraging habitat in the Tongue of the Ocean. PLoS ONE 2011, 6, e19269. [Google Scholar] [CrossRef]
- Ferguson, M.; Barlow, J.; Reilly, S.; Gerrodette, T. Predicting Cuvier’s (Ziphius cavirostris) and Mesoplodon beaked whale population density from habitat characteristics in the eastern tropical Pacific Ocean. J. Cetacean Res. Manag. 2006, 7, 287–299. [Google Scholar] [CrossRef]
- Aguilar Soto, N.; Johnson, M.; Madsen, P.T.; Tyack, P.L.; Bocconcelli, A.; Borsani, J.F. Does intense ship noise disrupt foraging in deep-diving Cuvier’s beaked whales (Ziphius cavirostris)? Mar. Mamm. Sci. 2006, 22, 690–699. [Google Scholar] [CrossRef]
- Pirotta, E.; Milor, R.; Quick, N.; Moretti, D.; Di Marzio, N.; Tyack, P.; Boyd, I.; Hastie, G. Vessel noise affects beaked whale behavior: Results of a dedicated acoustic response study. PLoS ONE 2012, 7, e42535. [Google Scholar] [CrossRef]
- Robbins, J.R.; Bell, E.; Potts, J.; Babey, L.; Marley, S.A. Likely year-round presence of beaked whales in the Bay of Biscay. Hydrobiologia 2022, 849, 2225–2239. [Google Scholar] [CrossRef]
- Baird, R.W.; Webster, D.L.; Schorr, G.S.; McSweeney, D.J.; Barlow, J. Diel variation in beaked whale diving behavior. Mar. Mamm. Sci. 2008, 24, 630–642. [Google Scholar] [CrossRef]
- Warren, V.E.; Marques, T.A.; Harris, D.; Thomas, L.; Tyack, P.L.; Soto, N.A.d.; Hickmott, L.S.; Johnson, M.P. Spatio-temporal variation in click production rates of beaked whales: Implications for passive acoustic density estimation. J. Acoust. Soc. Am. 2017, 141, 1962–1974. [Google Scholar] [CrossRef] [PubMed]
- Runte, K.L.; Kowarski, K.A.; Delarue, J.J.-Y.; Maxner, E.E.; Hedgeland, D.; Martin, S.B. We go signaling into the night: Describing an echolocation signal of an unknown beaked whale (Cetacea; Ziphiidae) off West Africa. Mar. Mamm. Sci. 2025, e70002. [Google Scholar] [CrossRef]
- McCullough, J.L.K.; Henderson, E.E.; Trickey, J.S.; Barlow, J.; Baumann-Pickering, S.; Manzano-Roth, R.; Alongi, G.; Martin, S.; Fregosi, S.; Mellinger, D.K.; et al. Geographic distribution of the Cross Seamount beaked whale based on acoustic detections. Mar. Mamm. Sci. 2024, 40, 164–183. [Google Scholar] [CrossRef]
- Feng, M.; Meyers, G.; Pearce, A.; Wijffels, S. Annual and interannual variations of the Leeuwin Current at 32 °S. J. Geophys. Res. Ocean. 2003, 108, 3355. [Google Scholar] [CrossRef]
- Barrios, D.M.; Baird, R.W.; Kratofil, M.A. Beaked whales and El Niño: Evidence for ENSO effects on Blainville’s beaked and goose-beaked whale space use in Hawaiian waters. Mar. Ecol. Prog. Ser. 2024, 751, 189–209. [Google Scholar] [CrossRef]
- Aguilar de Soto, N.; Madsen, P.; Tyack, P.; Arranz, P.; Marrero, J.; Fais, A.; Revelli, E.; Johnson, M. No shallow talk: Cryptic strategy in the vocal communication of Blainville’s beaked whales. Mar. Mamm. Sci. 2012, 28, E75–E92. [Google Scholar] [CrossRef]
- Hooker, S.K.; De Soto, N.A.; Baird, R.W.; Carroll, E.L.; Claridge, D.; Feyrer, L.; Miller, P.J.O.; Onoufriou, A.; Schorr, G.; Siegal, E.; et al. Future Directions in Research on Beaked Whales. Front. Mar. Sci. 2019, 5, 00514. [Google Scholar] [CrossRef]


Disclaimer/Publisher’s Note: The statements, opinions and data contained in all publications are solely those of the individual author(s) and contributor(s) and not of MDPI and/or the editor(s). MDPI and/or the editor(s) disclaim responsibility for any injury to people or property resulting from any ideas, methods, instructions or products referred to in the content. |
© 2025 by the authors. Licensee MDPI, Basel, Switzerland. This article is an open access article distributed under the terms and conditions of the Creative Commons Attribution (CC BY) license (https://creativecommons.org/licenses/by/4.0/).