
A Data Cleaning Method for the Identification of Outliers in Fishing Vessel Trajectories Based on a Geocoding Algorithm


Abstract
1. Introduction
2. Materials and Methods
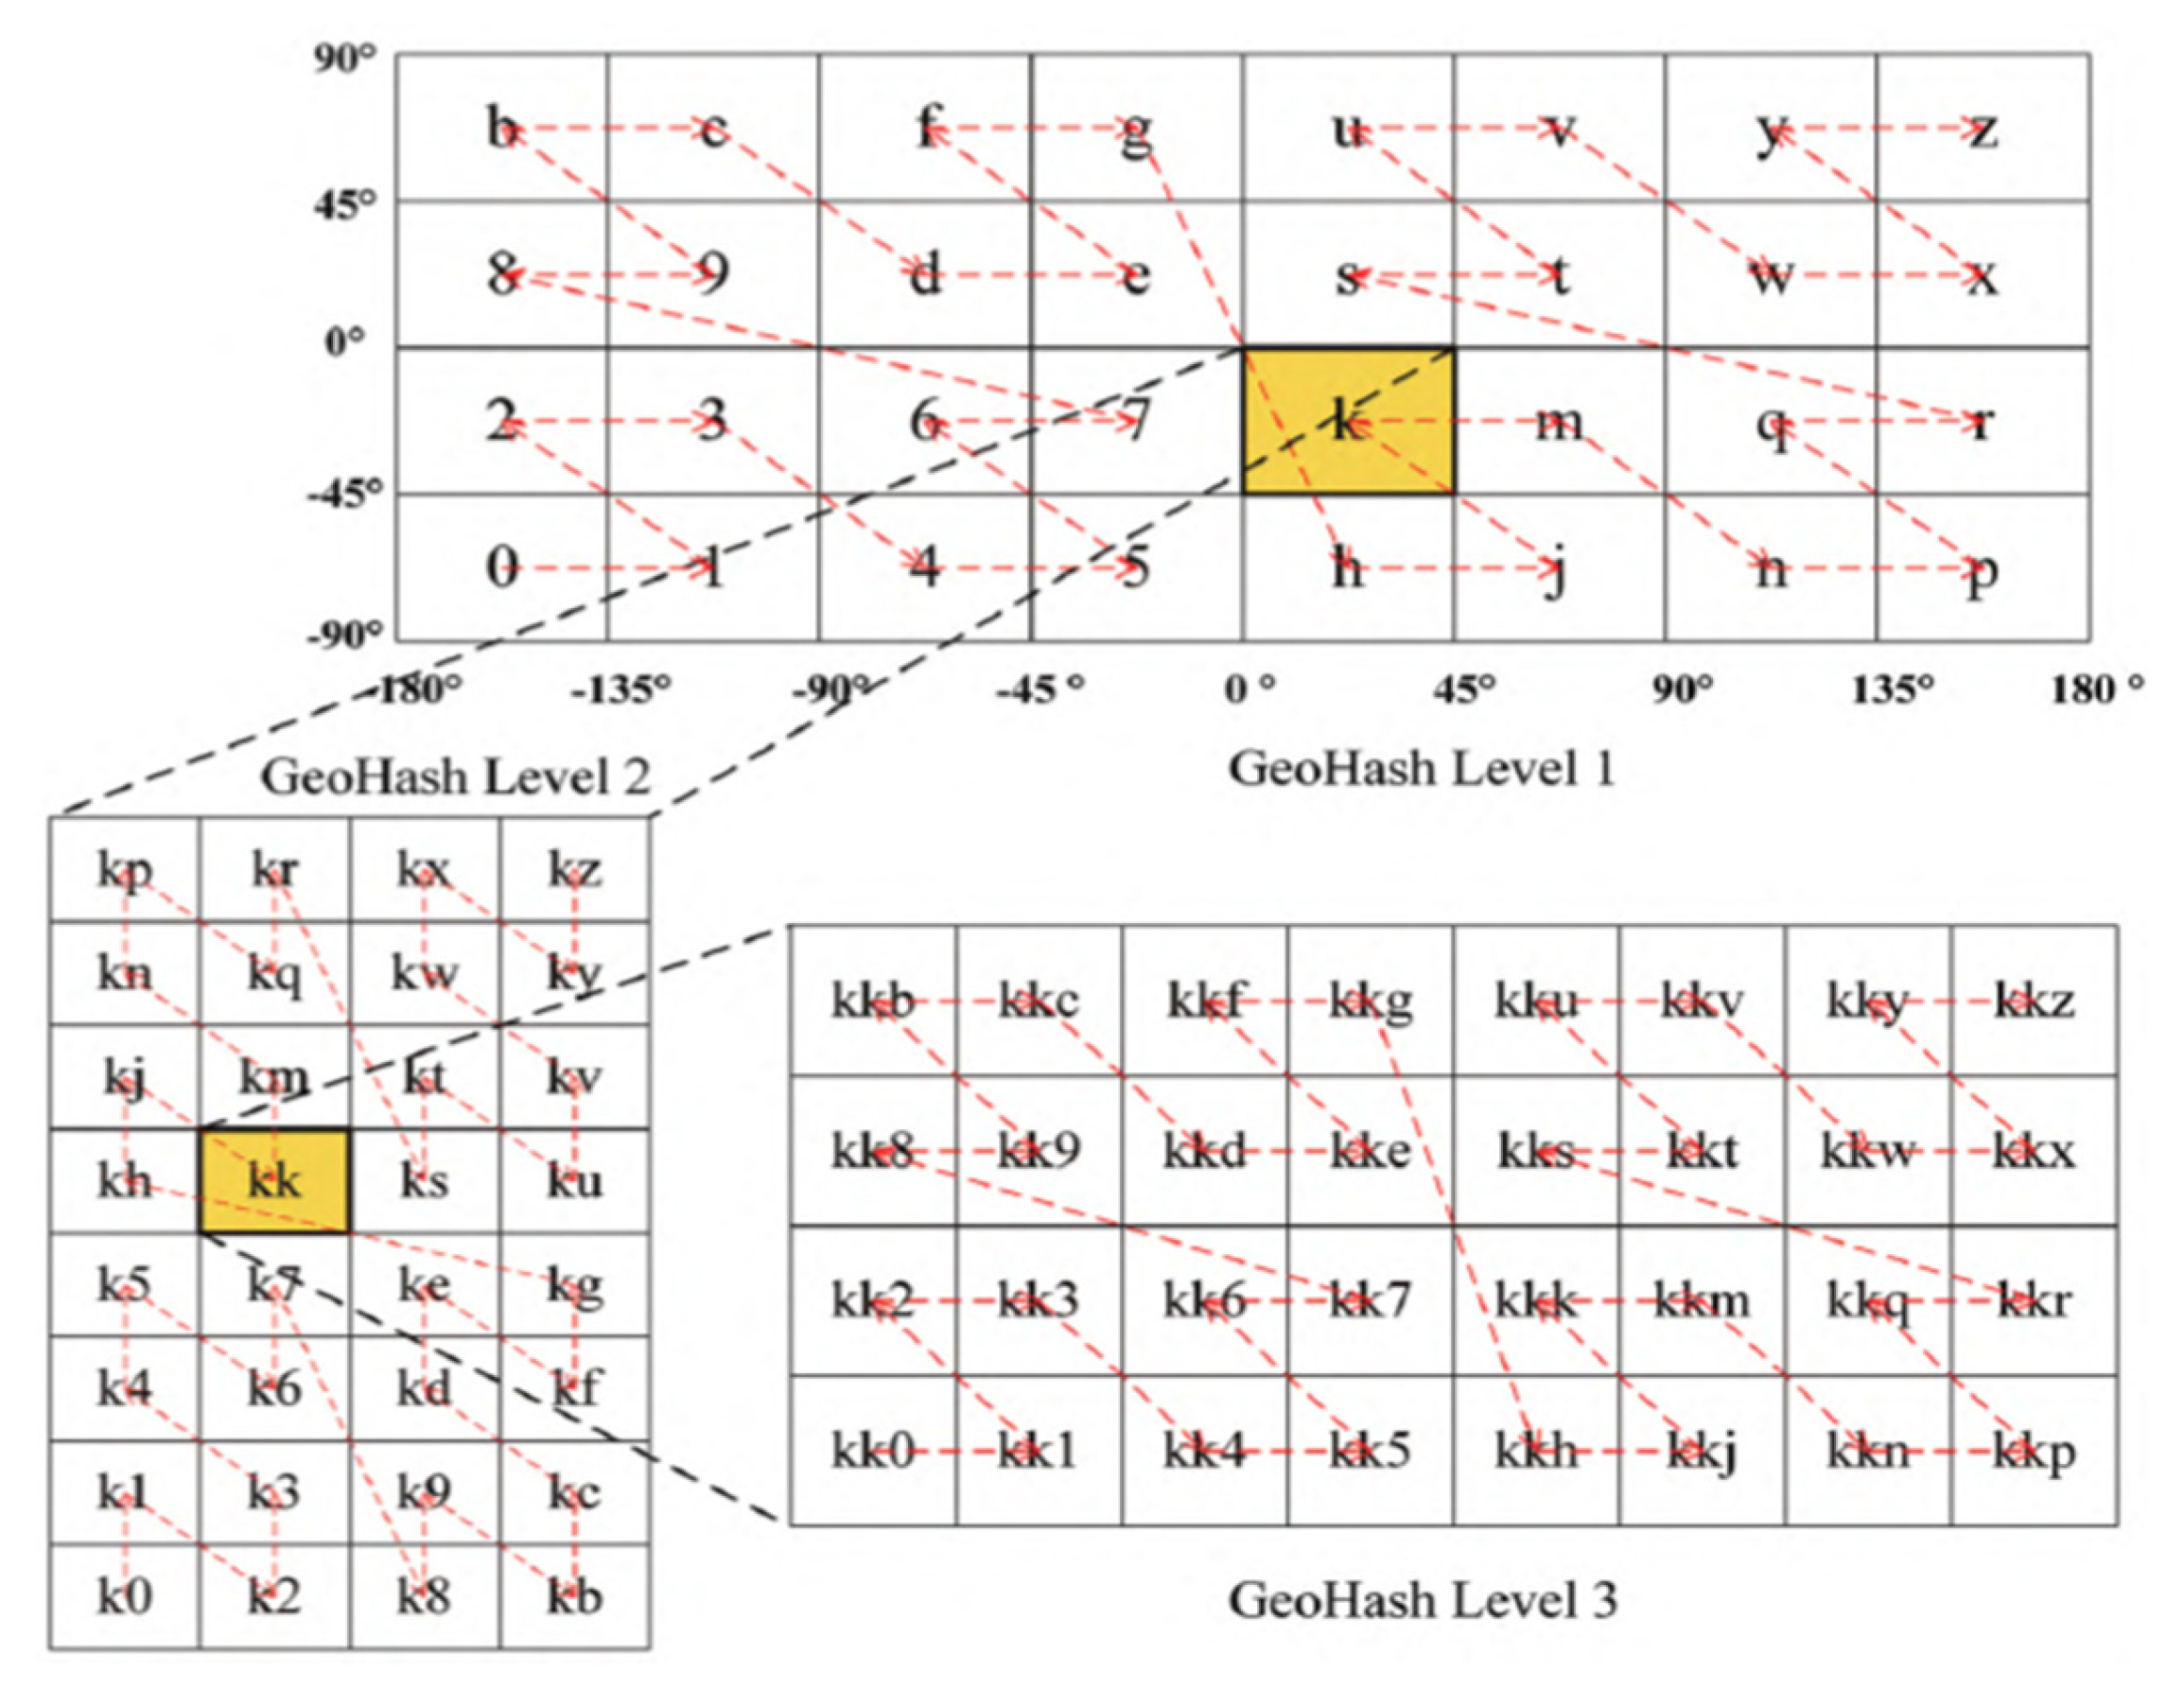
2.1. Geohash Principles
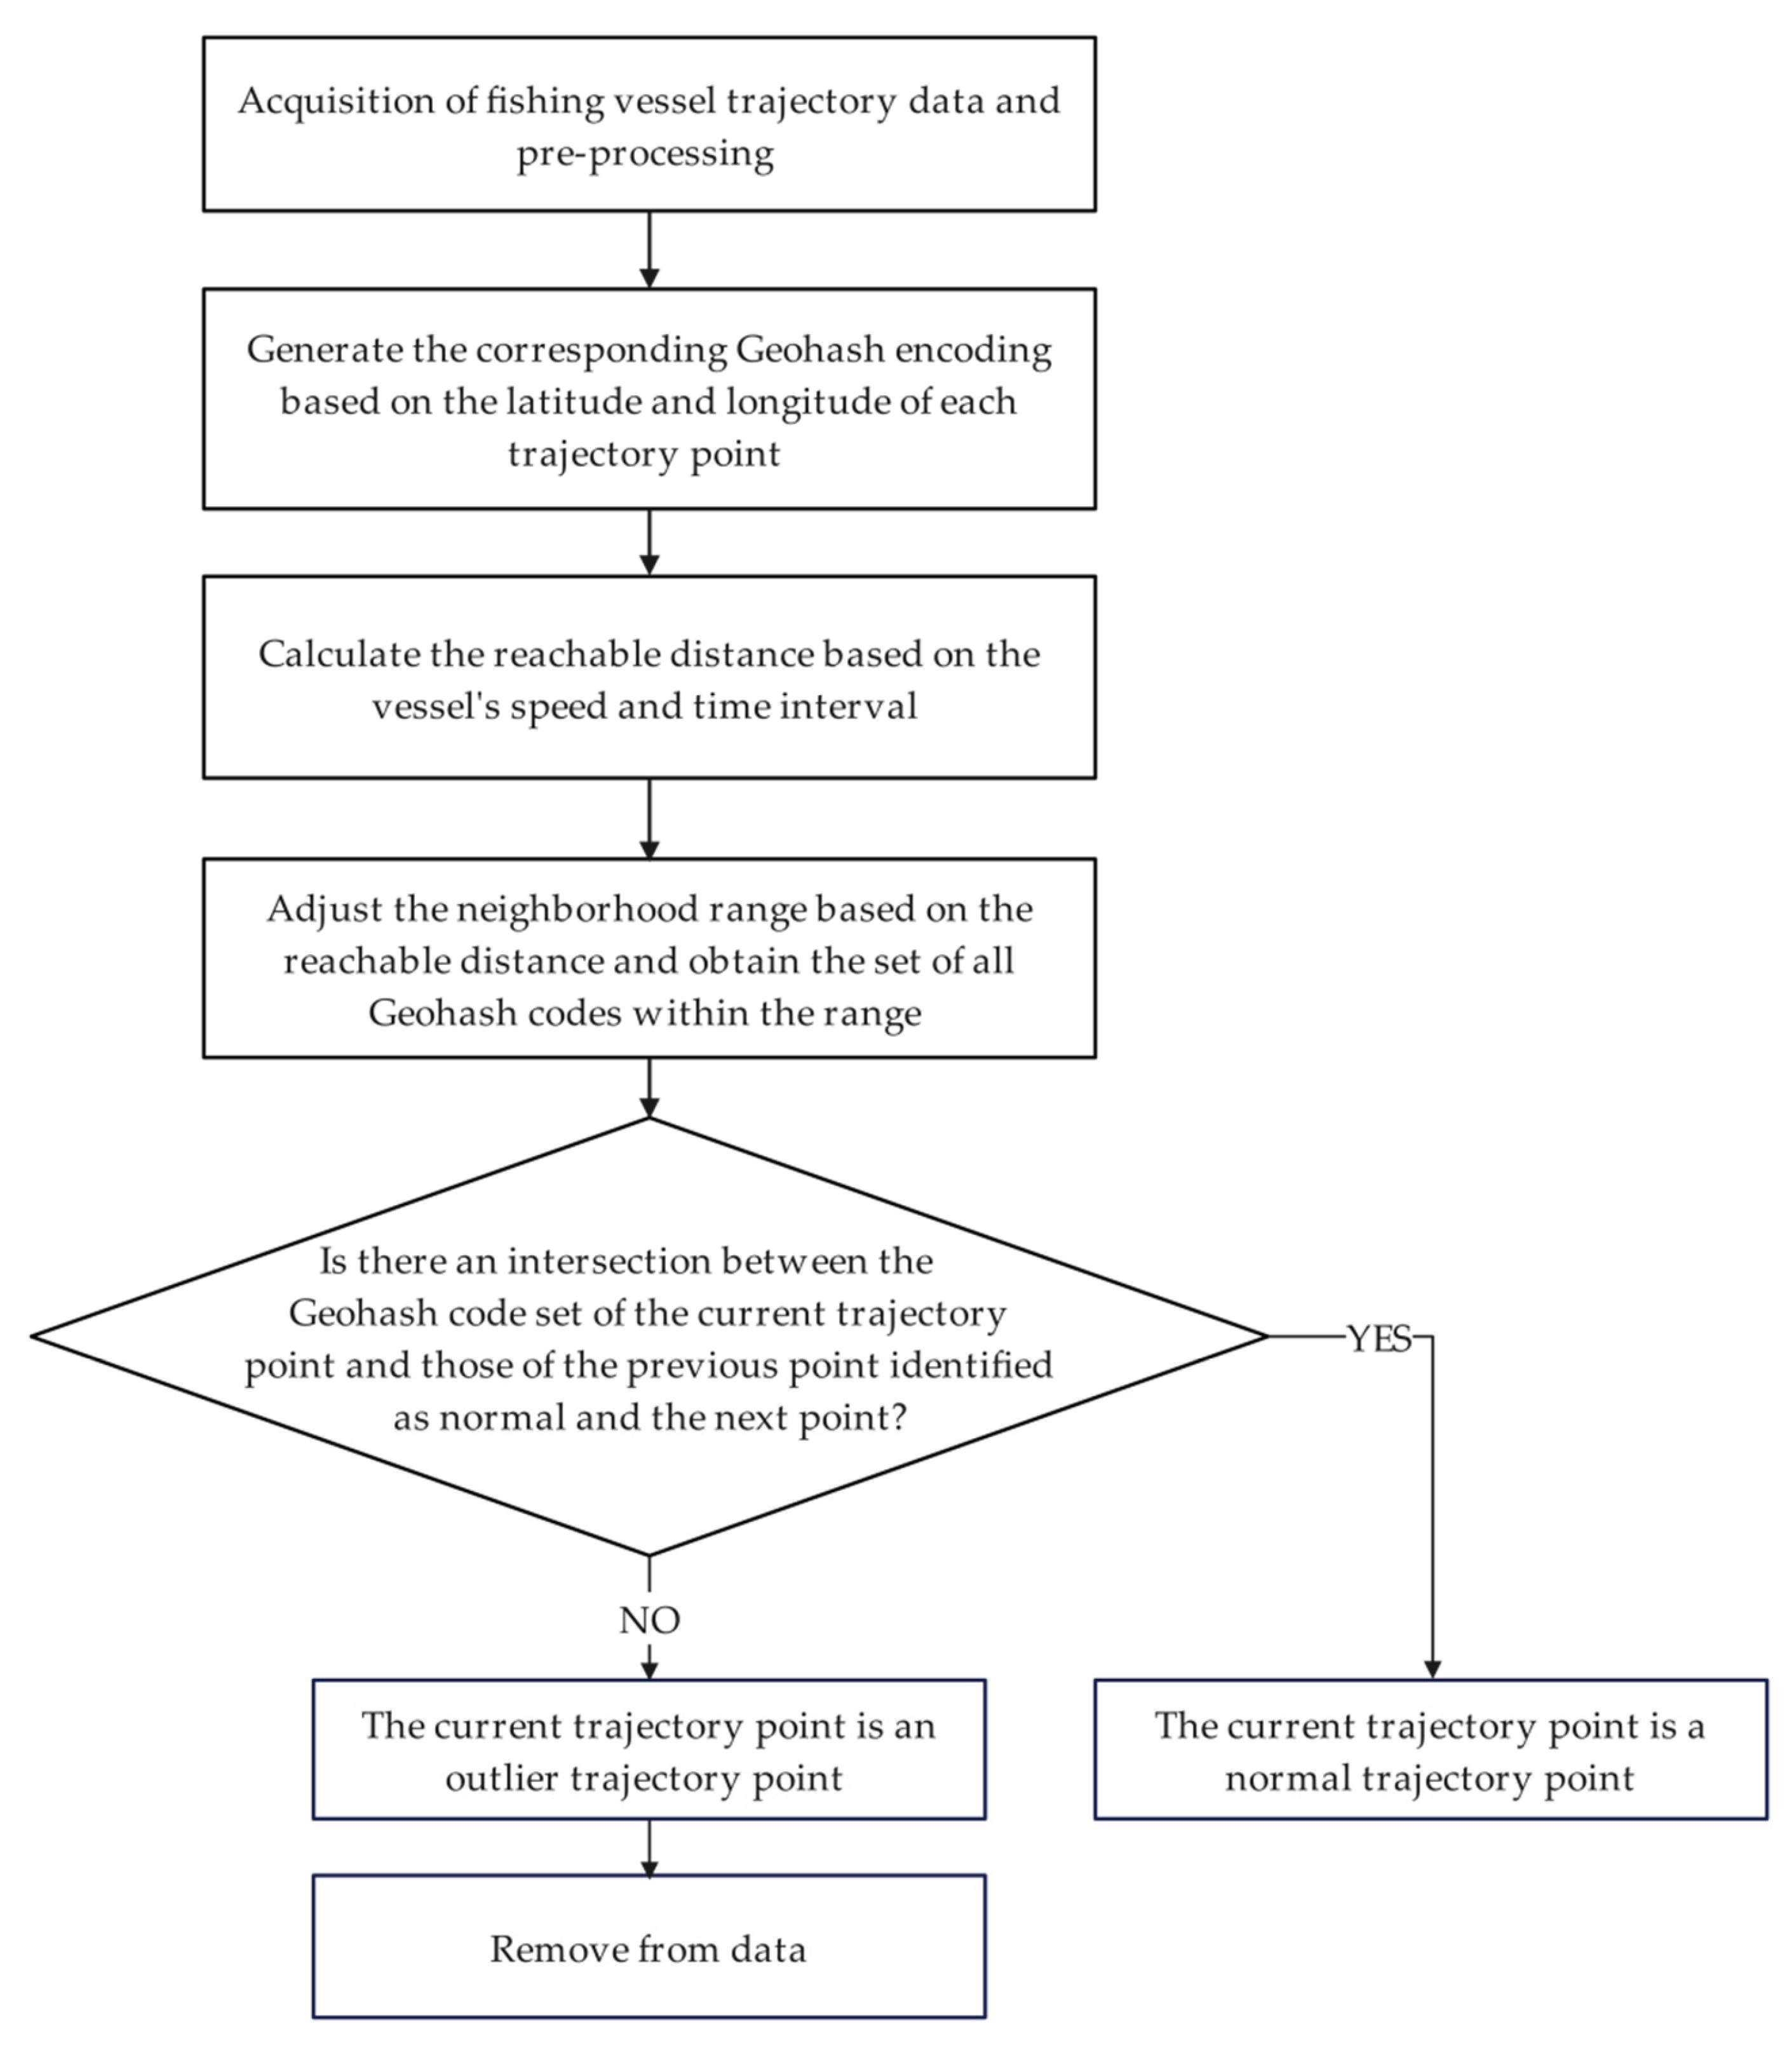
2.2. Identifying Outliers Based on the Filtered Code Set Derived from the Reachable Distance During Navigation
3. Results
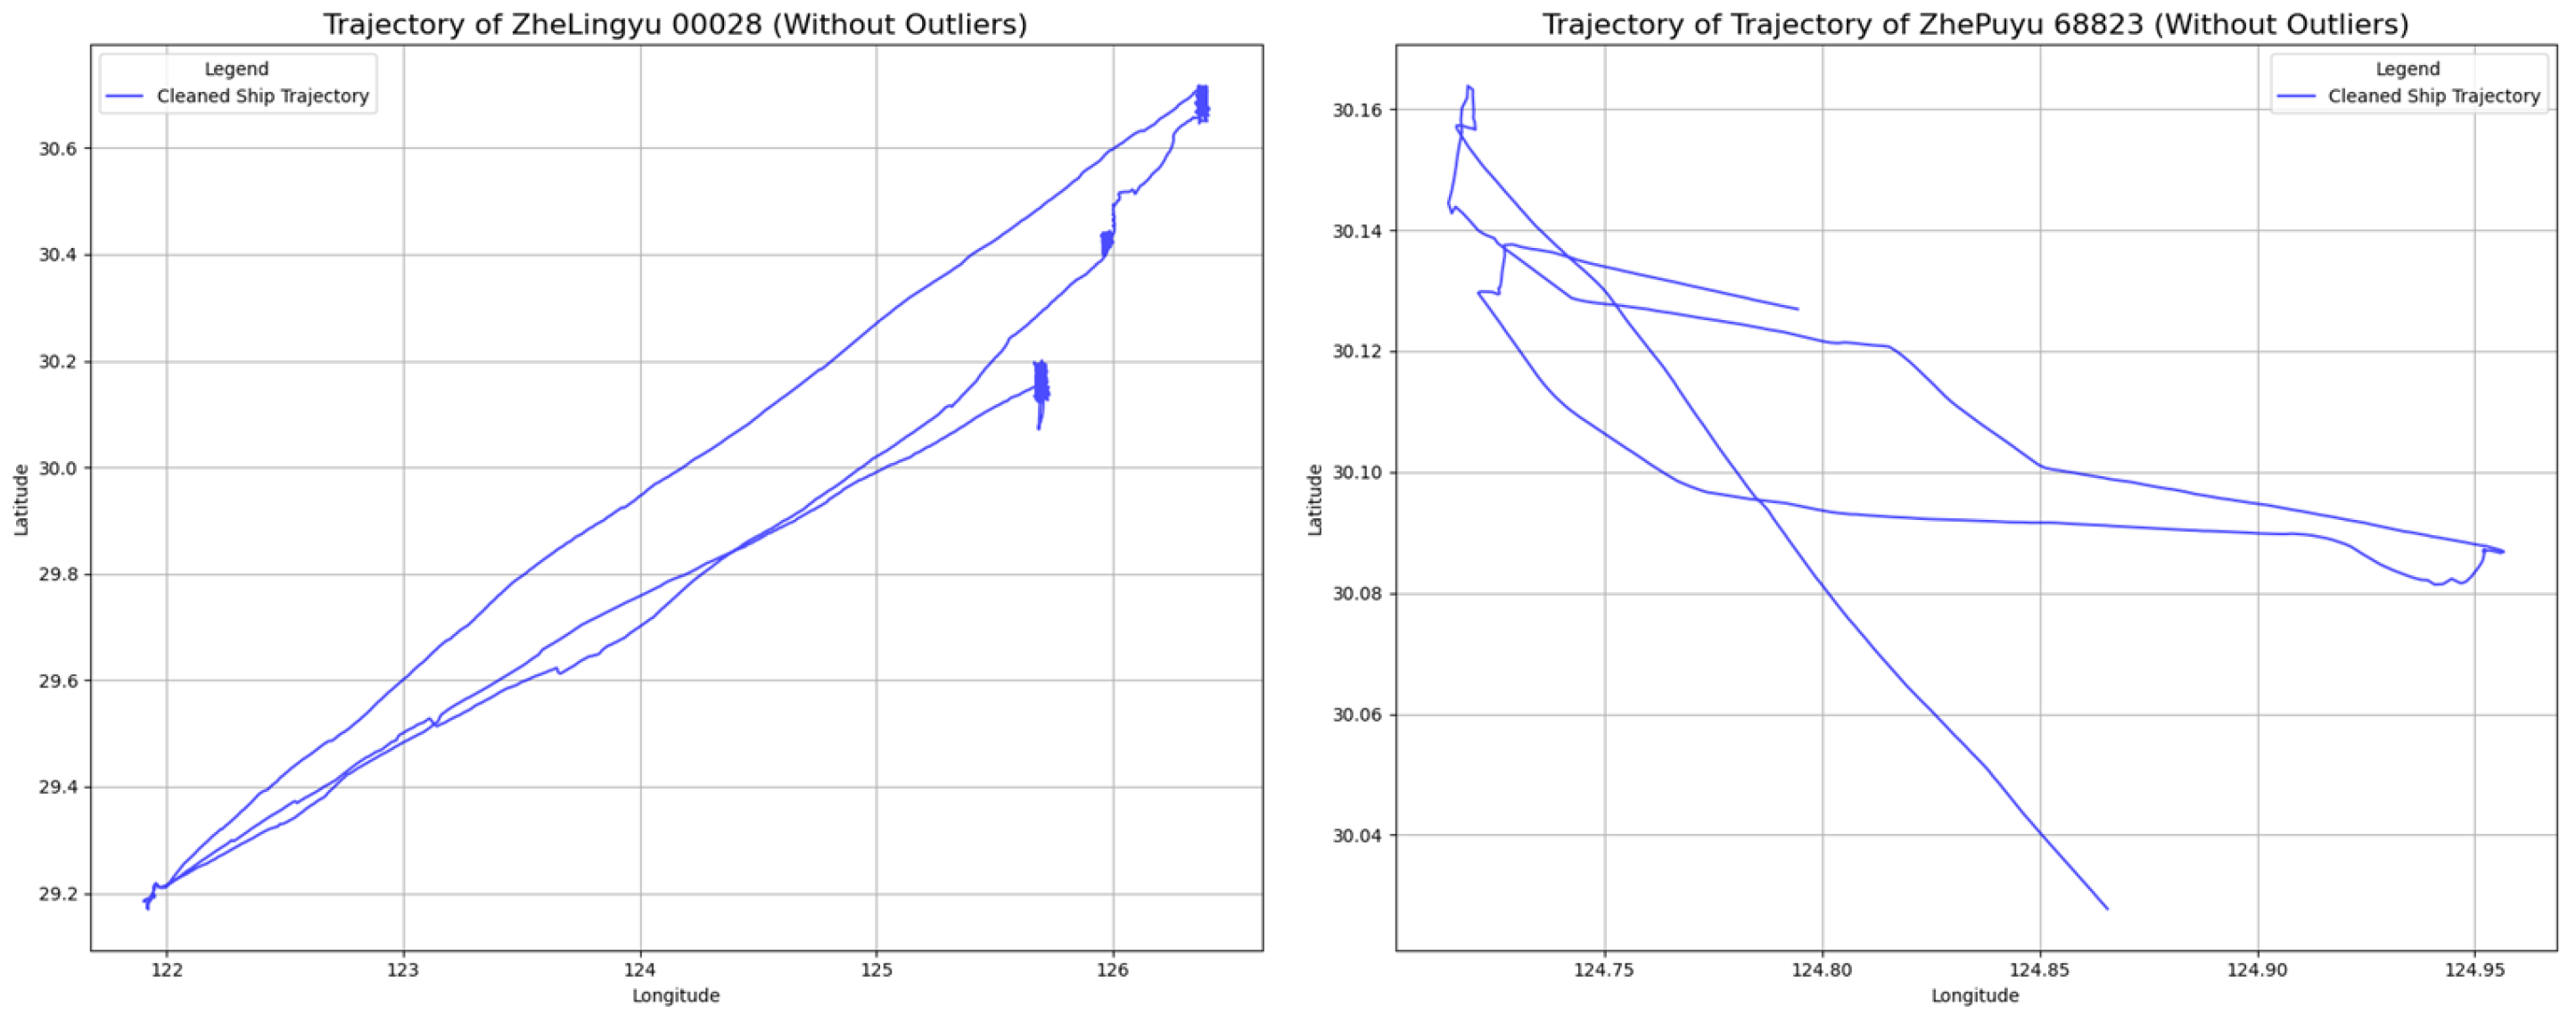
3.1. Data Cleaning
3.1.1. Data and Preprocessing
3.1.2. Geohash Code Generation
3.1.3. Calculating the Reachable Distance Based on the Vessel’s Speed and Time Interval
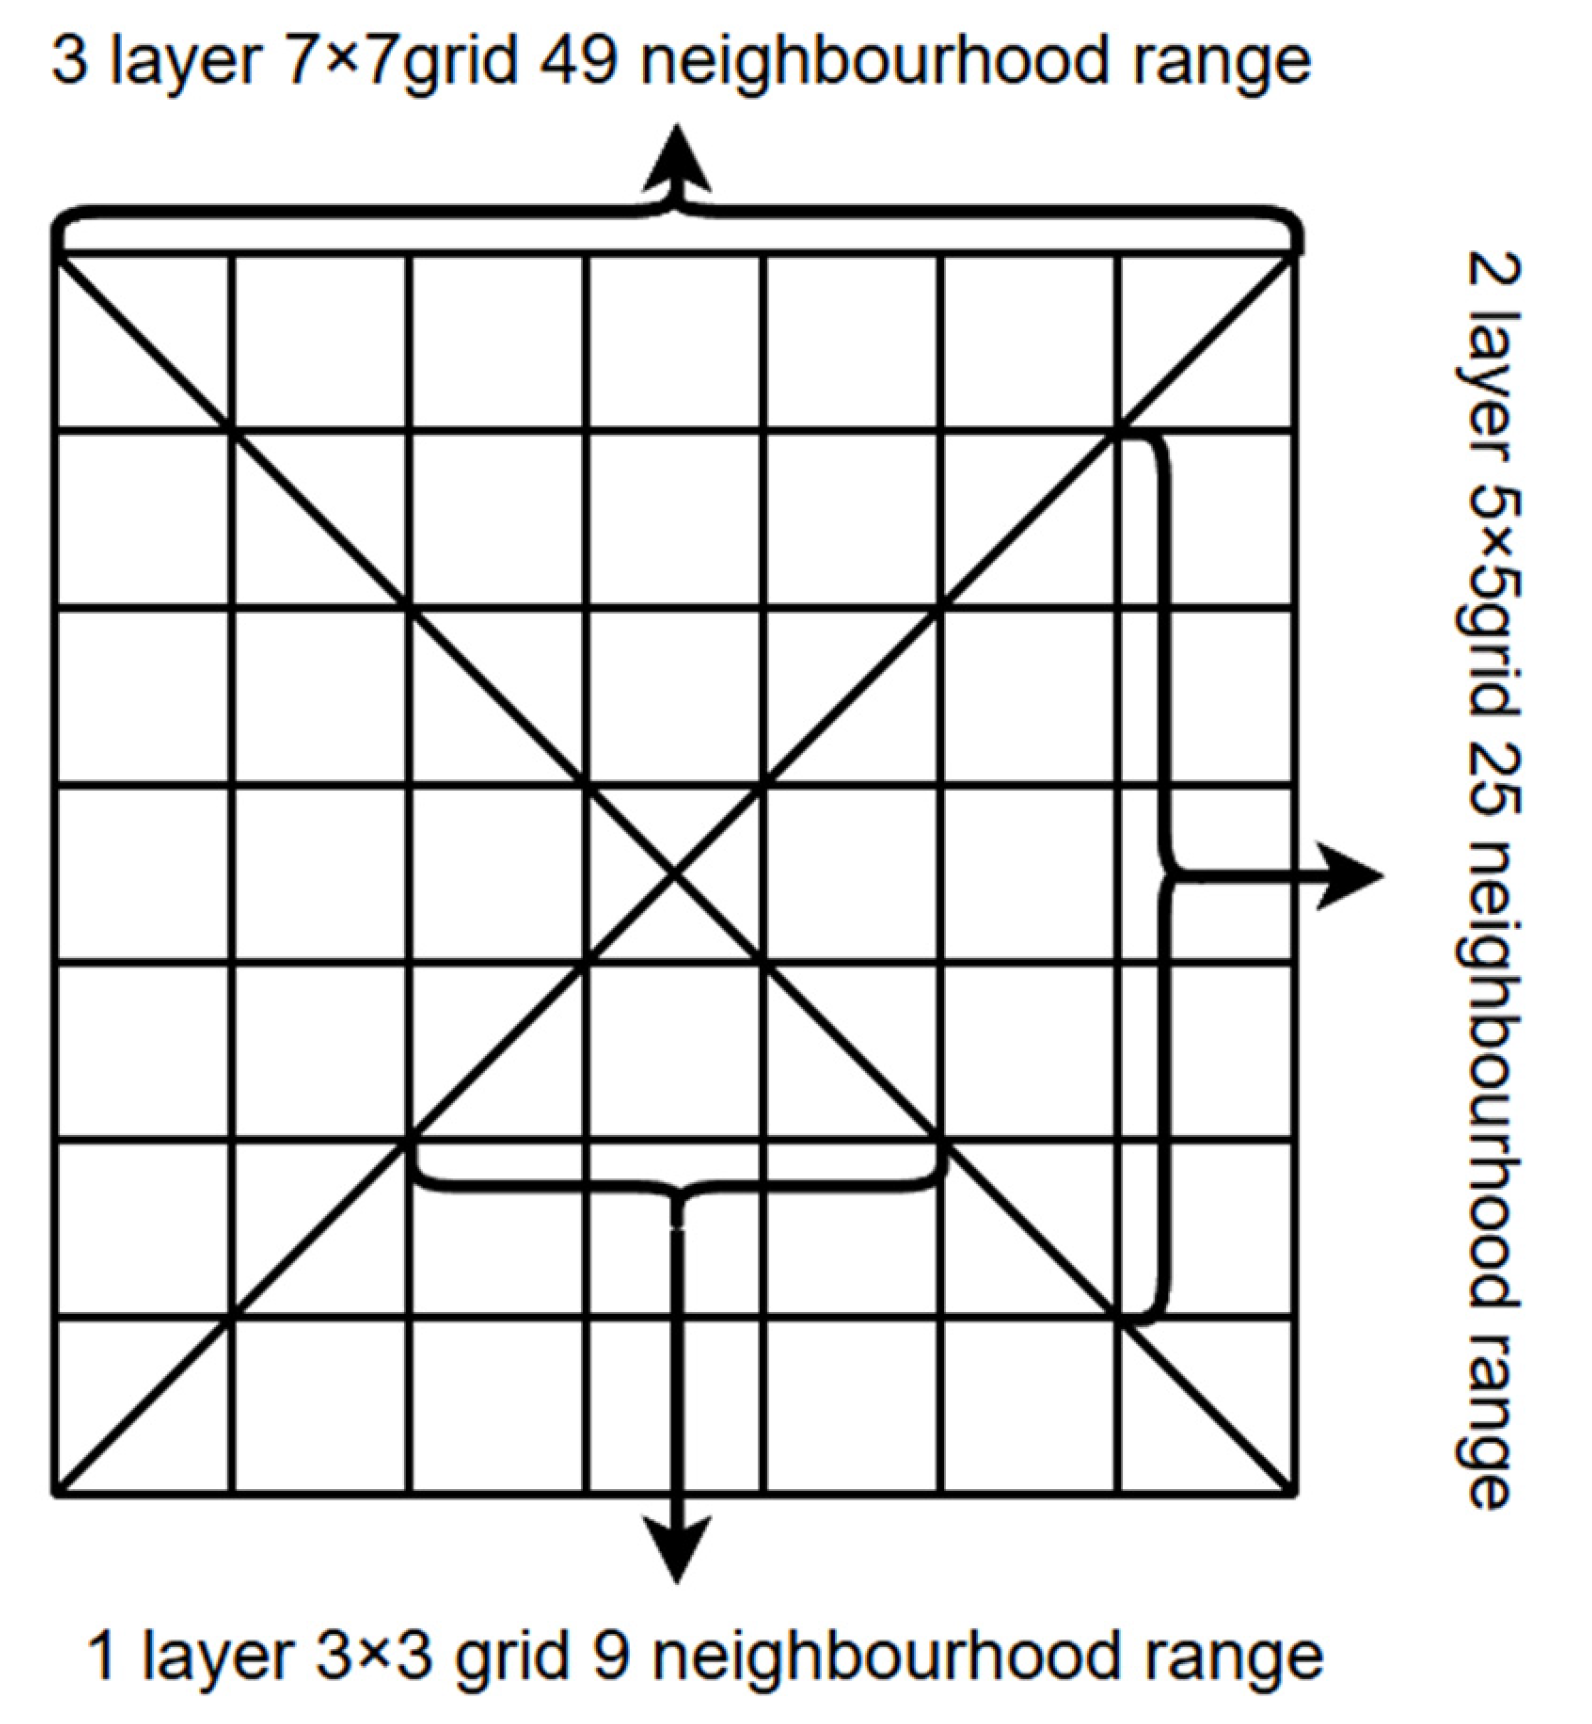
3.1.4. Geohash Layer and Neighborhood Range Adjustment
3.1.5. Obtaining a Collection of Geohash Encodings for a Multi-Layer Neighborhood Range
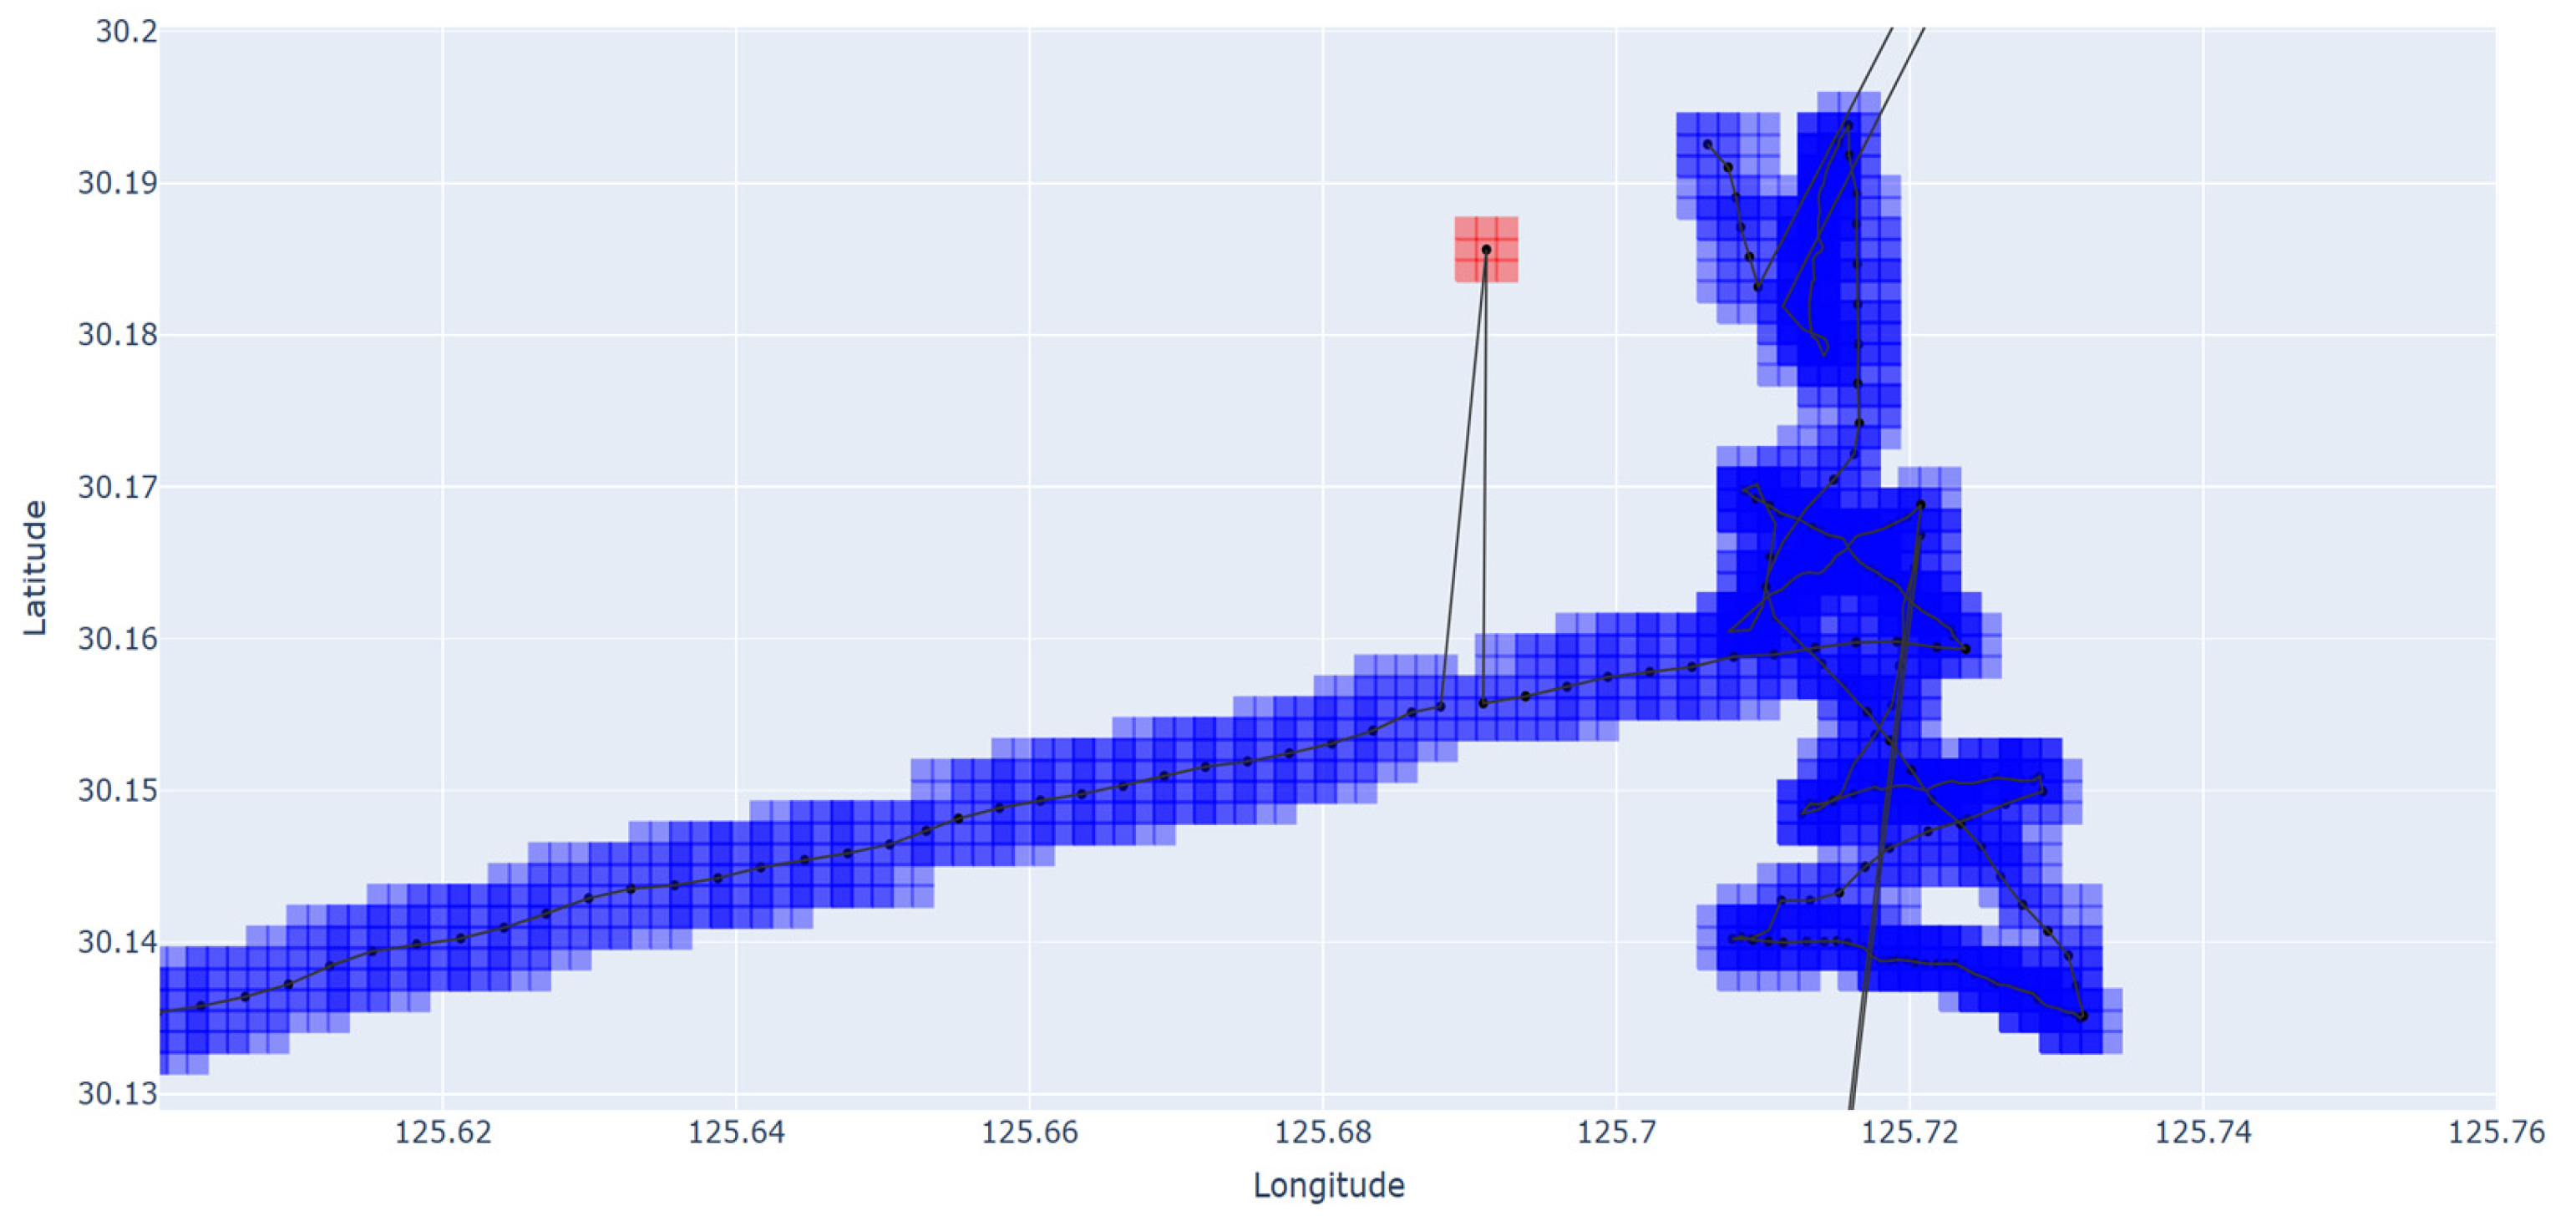
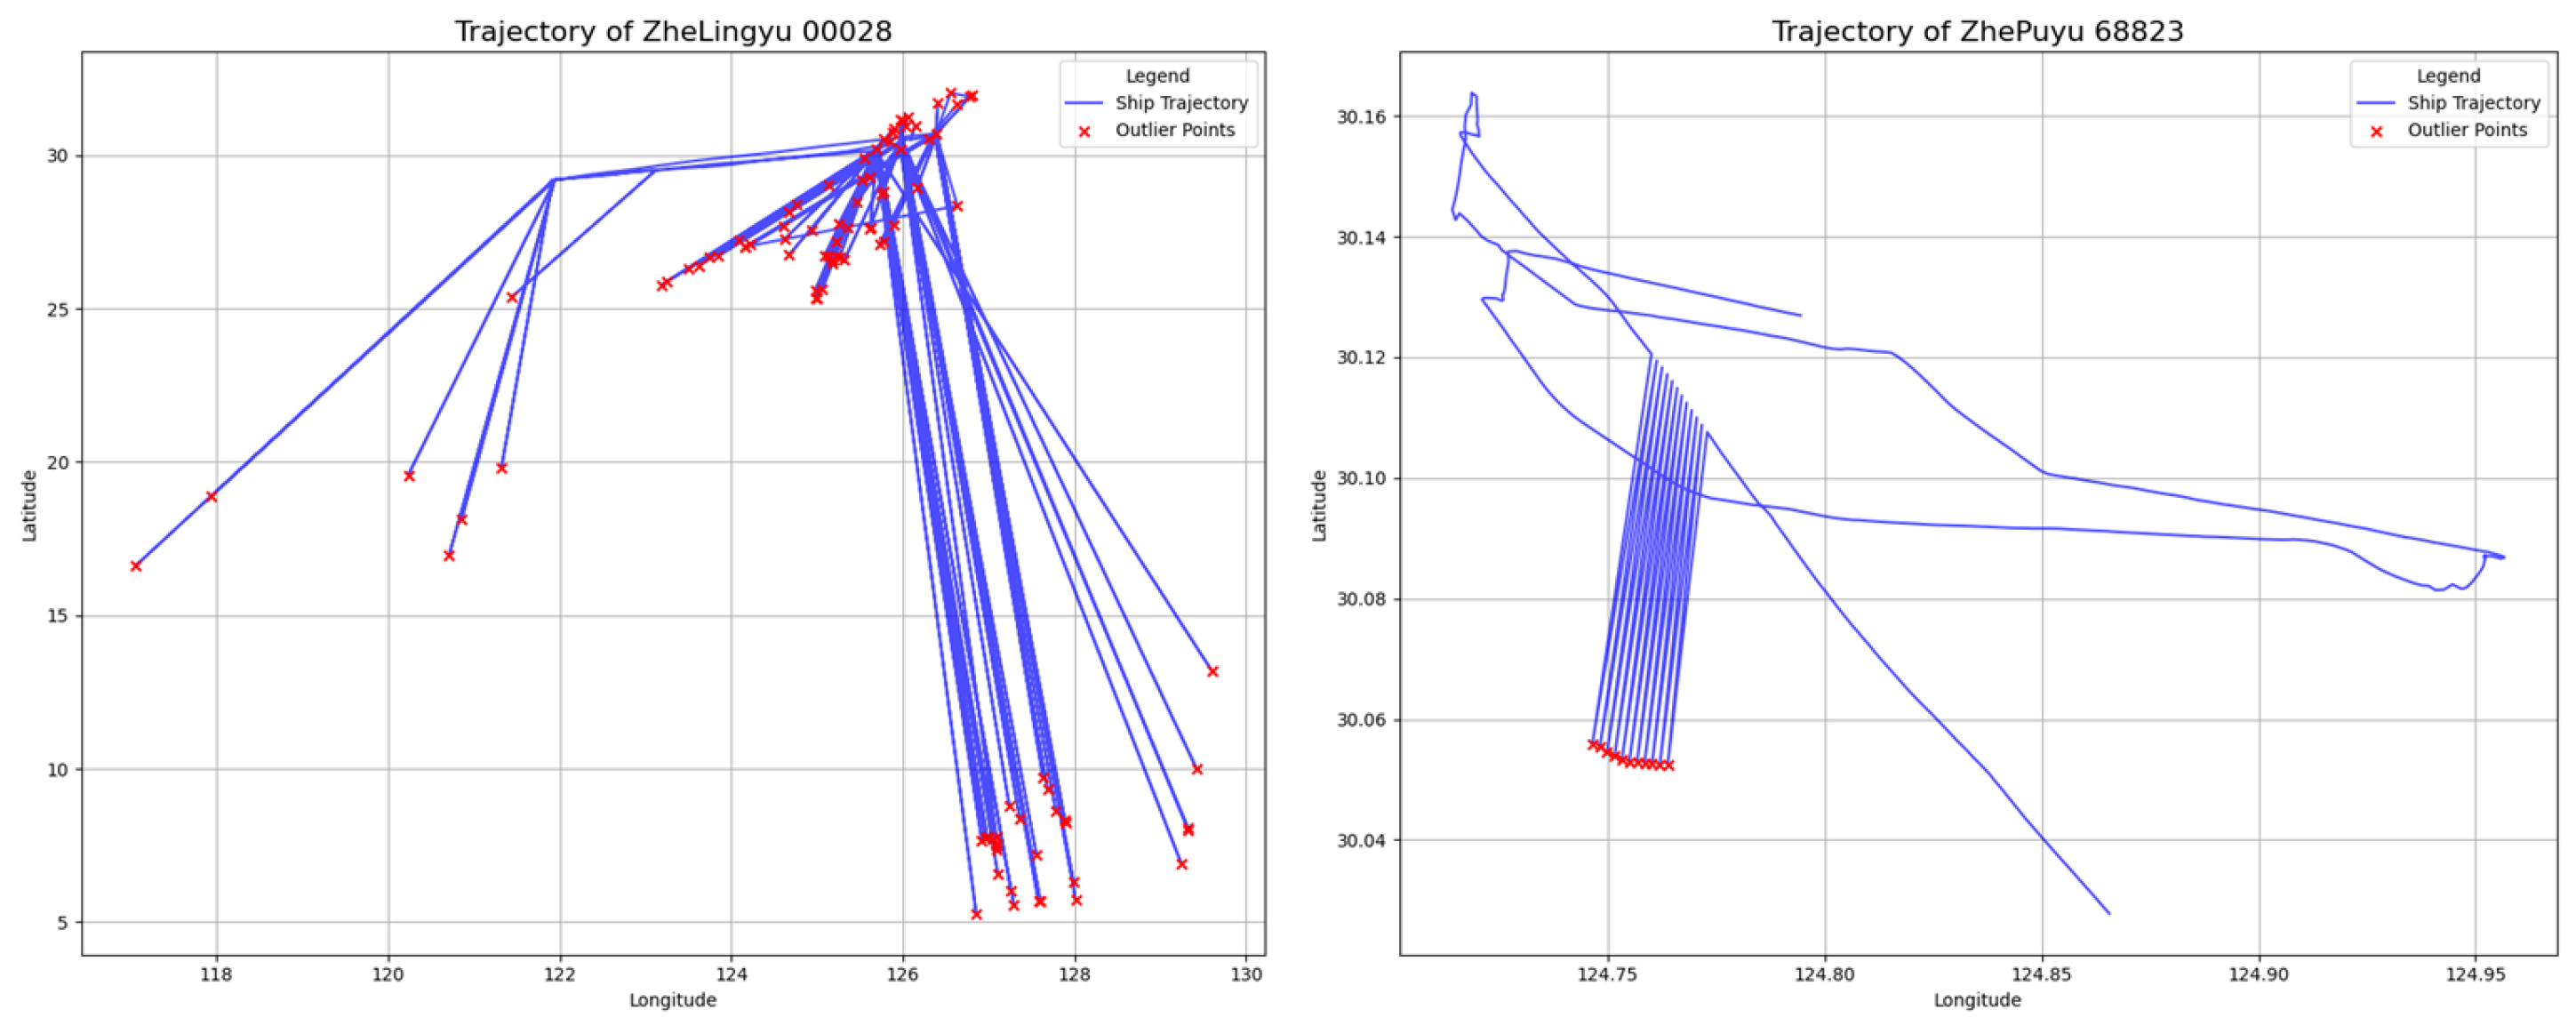
3.2. The Case of Single Outlier Identification
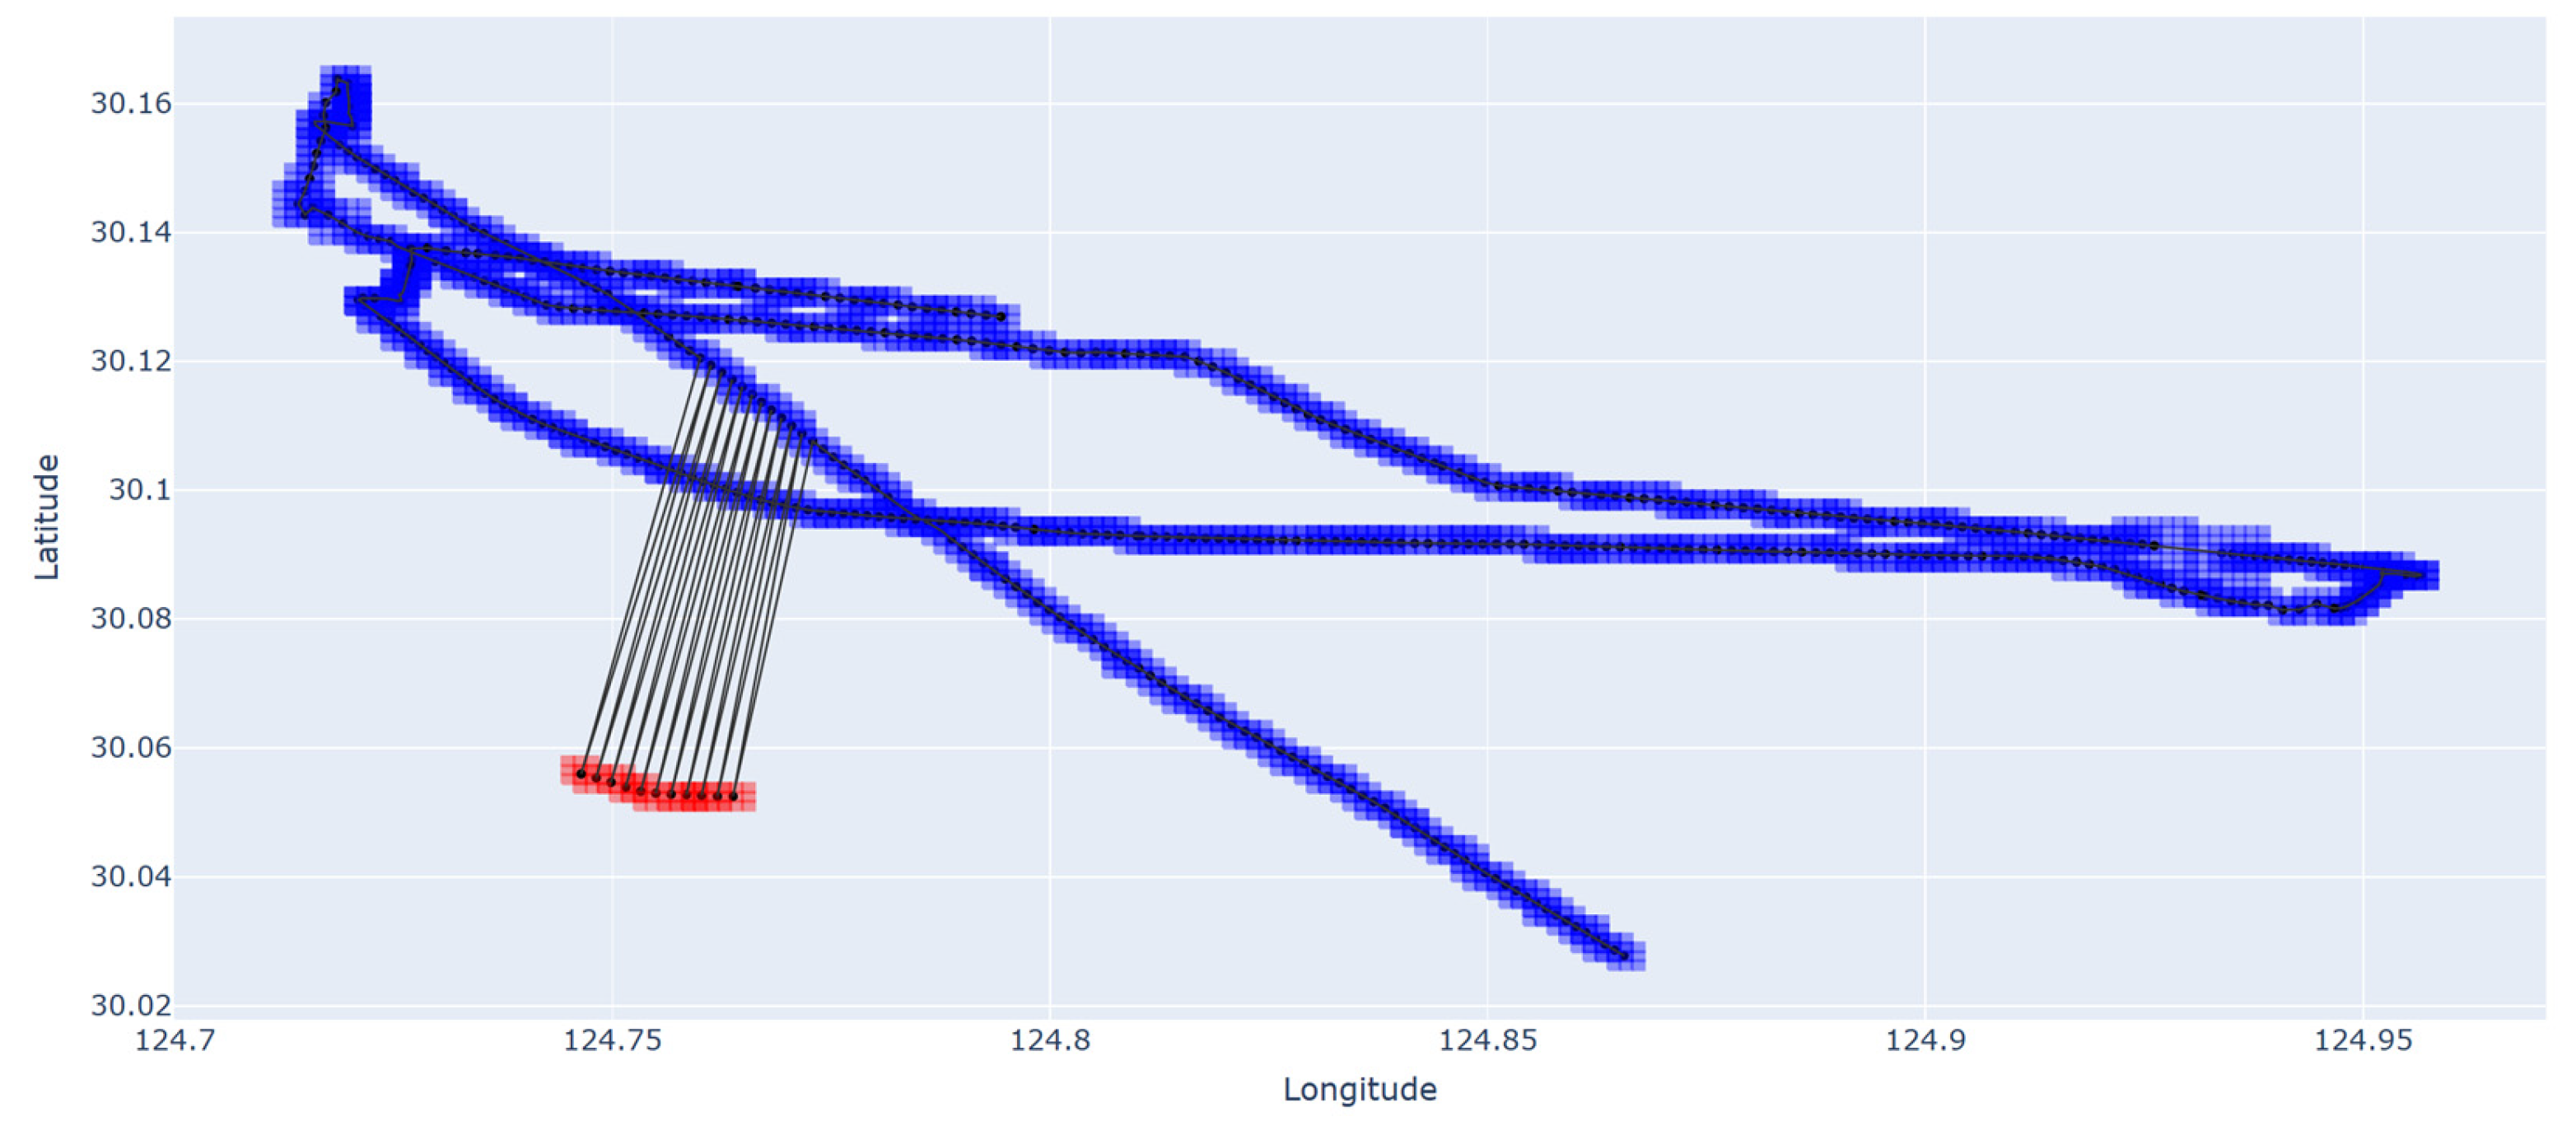
3.3. Outlier Identification with Alternating Normal and Abnormal Trajectory Points
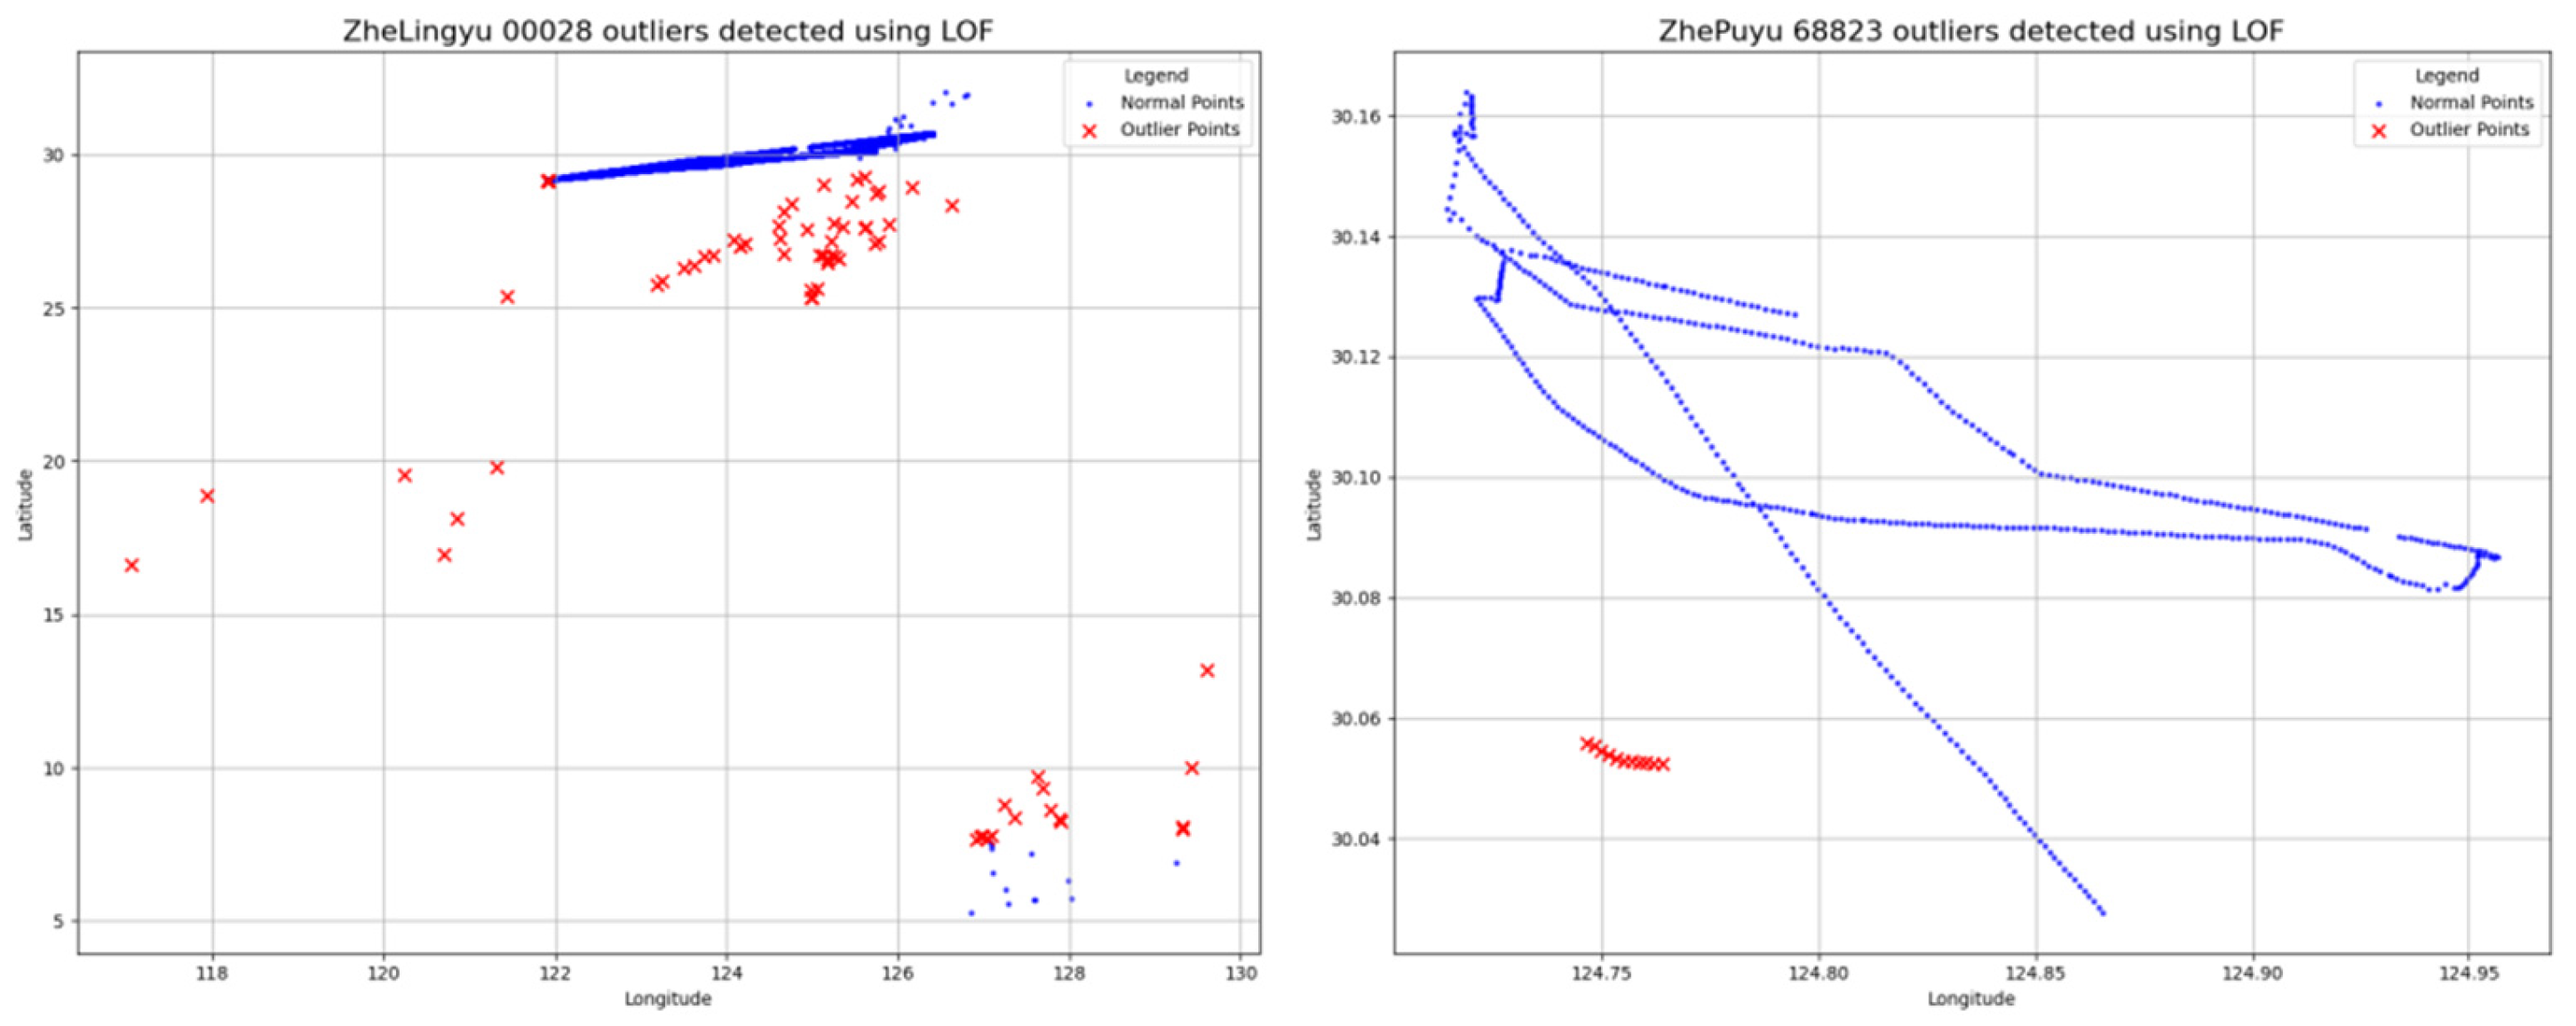
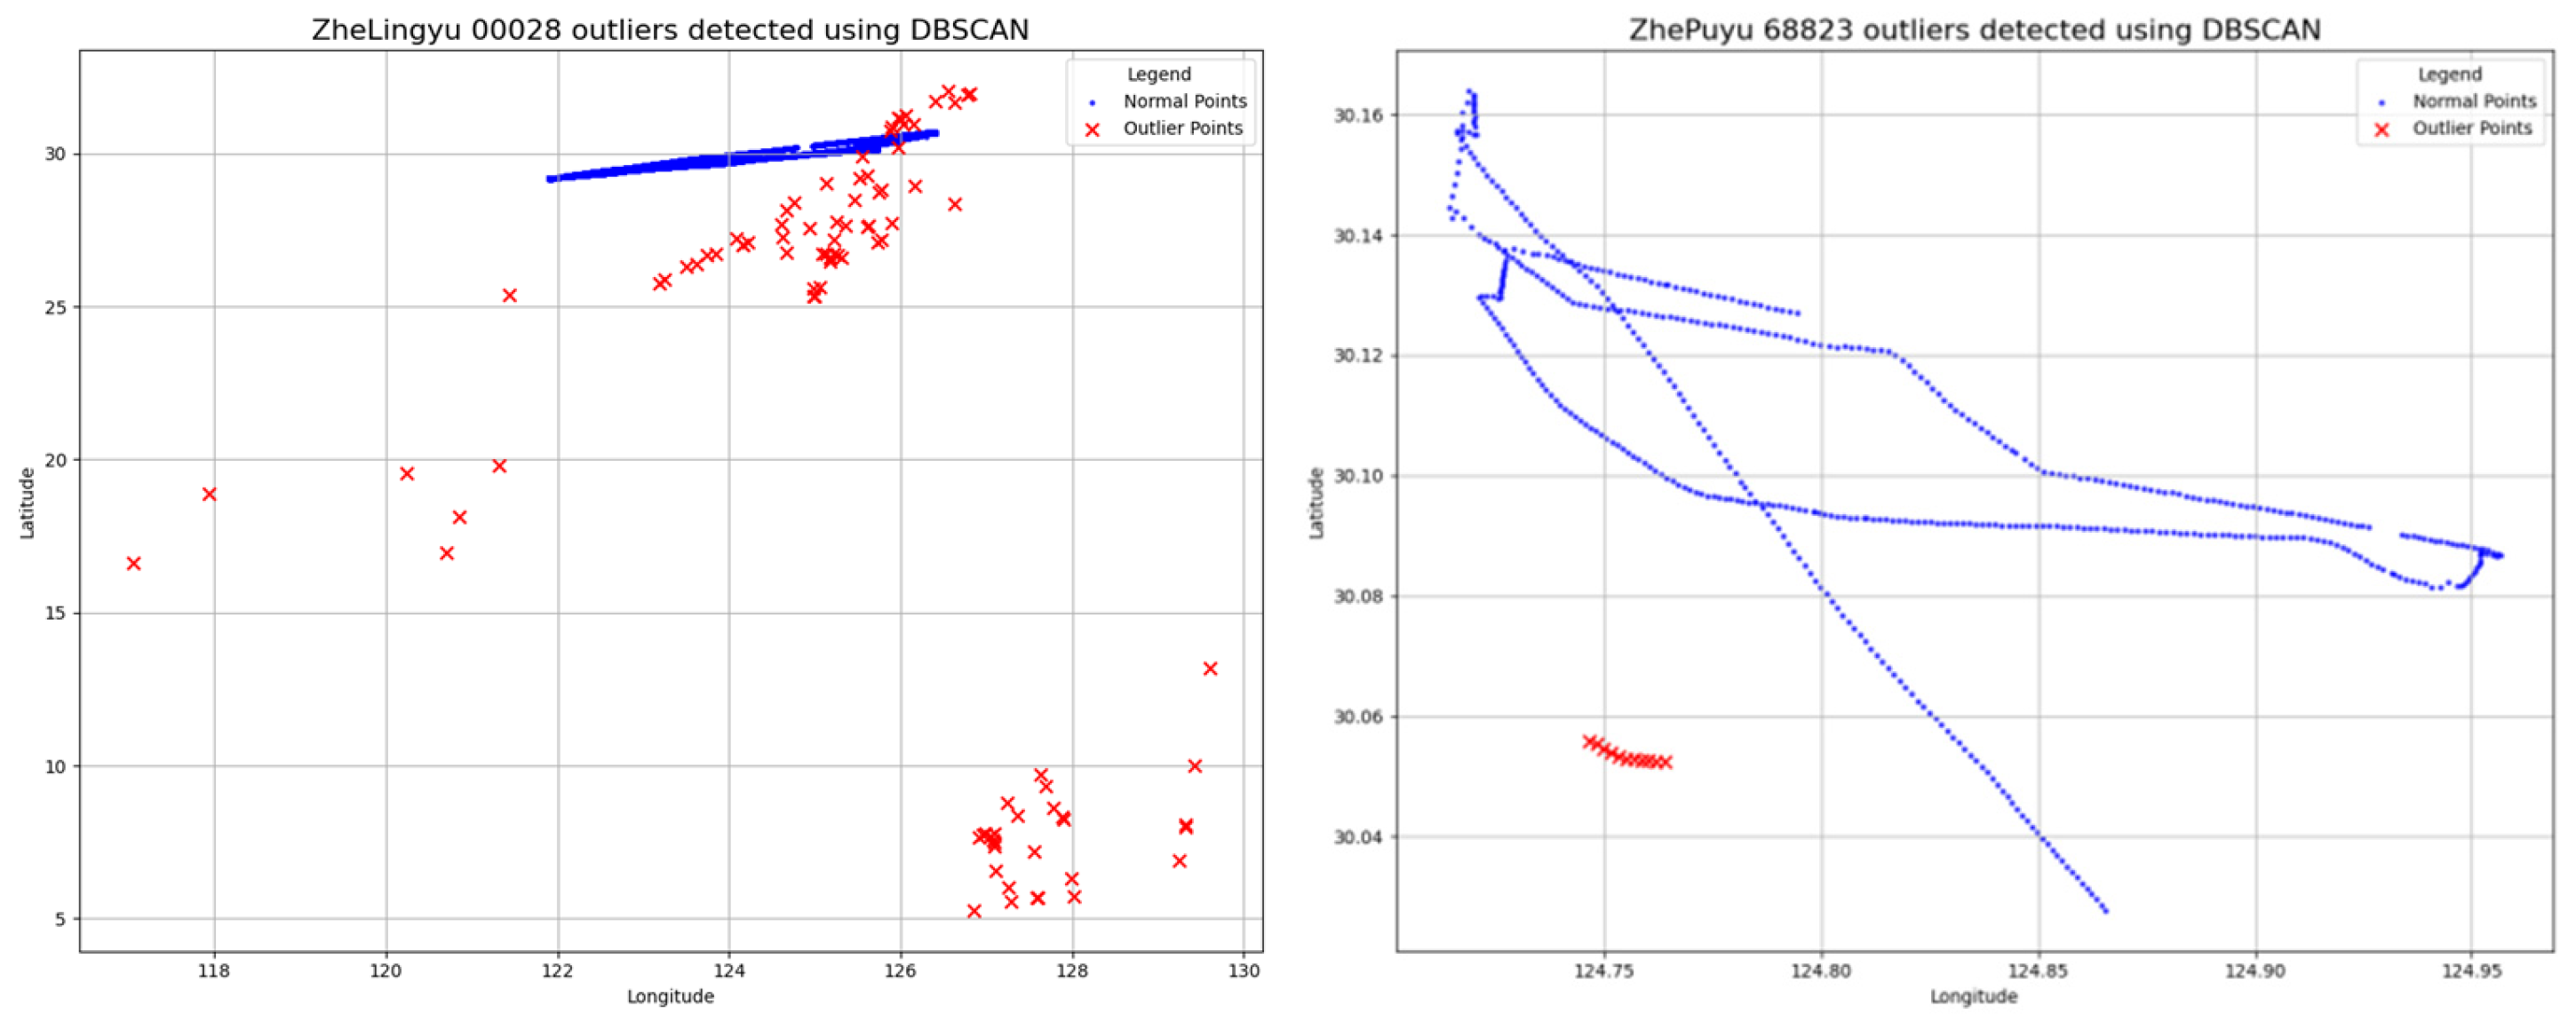
3.4. Comparative Analysis with Methods of LOF, DBSCAN, and Hampel Filter
4. Discussion
5. Conclusions
Supplementary Materials
Author Contributions
Funding
Data Availability Statement
Acknowledgments
Conflicts of Interest
References
- Zhou, W.; Chen, X.; Fan, W.; He, Z.; Yu, L.; Dai, Y.; Wang, L. Application and prospect of location-based information service in marine fishery. World Sci. Technol. Res. Dev. 2015, 37, 611–617. [Google Scholar] [CrossRef]
- Li, C.; Feng, G.; Yao, H.; Liu, R.; Li, Y.; Xie, K.; Miao, Q.A. Survey on Trajectory Anomaly Detection. J. Softw. 2024, 35, 927–974. [Google Scholar] [CrossRef]
- Cao, H.; Tang, H.; Wang, F.; Xu, Y. Survey on Trajectory Representation Learning Techniques. J. Softw. 2021, 32, 1461–1479. [Google Scholar] [CrossRef]
- Hawkins, D. Identification of Outliers; Chapman and Hall: London, UK, 1980. [Google Scholar]
- Sun, S. Research on Ship Trajectory Anomaly Detection and Early Warning in Port Area Based on Spatio-Temporal Trajectory Mining. Ph.D. Thesis, Dalian Maritime University, Dalian, China, 2024. [Google Scholar] [CrossRef]
- Mei, L.; Zhang, F.; Gao, Q. Overview of outlier detection technology. Comput. Appl. Res. 2020, 37, 3521–3527. [Google Scholar] [CrossRef]
- Feng, Z.; Zhu, Y. A survey on trajectory data mining: Techniques and applications. IEEE Access 2016, 4, 2056–2067. [Google Scholar] [CrossRef]
- Han, Z.; Xu, G.; Huang, T.; Ren, W. Vessel Trajectory Outlier Detection Algorithm Based on Adaptive Threshold. Comput. Mod. 2018, 42–47+51. [Google Scholar] [CrossRef]
- Chen, L.; Lv, M.; Ye, Q.; Chen, G.; Woodward, J. A personal route prediction system based on trajectory data mining. Inf. Sci. 2011, 181, 1264–1284. [Google Scholar] [CrossRef]
- Alvares, L.O.; Oliveira, G.; Heuser, C.A.; Bogorny, V. A Framework for Trajectory Data Preprocessing for Data Mining. In Proceedings of the SEKE, Boston, MA, USA, 1–3 July 2009; pp. 698–702. [Google Scholar] [CrossRef]
- Zheng, Y.; Xie, X.; Ma, W.-Y. GeoLife: A collaborative social networking service among user, location and trajectory. IEEE Data Eng. Bull. 2010, 33, 32–39. [Google Scholar]
- Ristic, B.; La Scala, B.; Morelande, M.; Gordon, N. Statistical analysis of motion patterns in AIS data: Anomaly detection and motion prediction. In Proceedings of the 2008 11th International Conference on Information Fusion, Cologne, Germany, 30 June–3 July 2008; pp. 1–7. [Google Scholar]
- Zhen, R.; Shao, Z.; Pan, J.; Zhao, Q. A Study on the Identification of Abnormal Ship Trajectory Based on Statistic Theories. J. Jimei Univ. (Nat. Sci. Ed.) 2015, 20, 193–197. [Google Scholar] [CrossRef]
- Mascaro, S.; Nicholso, A.E.; Korb, K.B. Anomaly detection in vessel tracks using Bayesian networks. Int. J. Approx. Reason. 2014, 55, 84–98. [Google Scholar] [CrossRef]
- Castaldo, F.; Bastani, V.; Marcenaro, L.; Palmieri, F.A.N.; Regazzoni, C. Abnormal vessel behavior detection in port areas based on Dynamic Bayesian Networks. In Proceedings of the International Conference on Information Fusion, Salamanca, Spain, 7–10 July 2014. [Google Scholar]
- Knorr, E.M.; Ng, R.T. Algorithms for Mining Distance-Based Outliers in Large Datasets. In Proceedings of the 24th International Conference on Very Large Data Bases, New York, NY, USA, 24–27 August 1998; pp. 392–403. [Google Scholar]
- Zhang, L.; Hu, Z.; Yang, G. Trajectory Outlier Detection Based on Multi-Factors. IEICE Trans. Inf. Syst. 2014, E97.D, 2170–2173. [Google Scholar] [CrossRef]
- Breunig, M.M.; Kriegel, H.-P.; Ng, R.T.; Sander, J. LOF: Identifying density-based local outliers. ACM Sigmod Rec. 2000, 29, 93–104. [Google Scholar] [CrossRef]
- Liu, J.; Li, H.; Gao, Y.; Yu, H.; Jiang, D. A geohash-based index for spatial data management in distributed memory. In Proceedings of the 2014 IEEE Geoscience and Remote Sensing Symposium, Quebec City, QC, Canada, 13–18 July 2014; pp. 1–4. [Google Scholar] [CrossRef]
- Hafez, I.; Mehedi, H.M.; Raed, H.; Seok, O.J. User Activity and Trip Recognition using Spatial Positioning System Data by Integrating the Geohash and GIS Approaches. Transp. Res. Rec. 2021, 2675, 391–405. [Google Scholar] [CrossRef]
- Jiang, B.; Zhou, W. Comparative Analysis of GeoHash, Google S2 and Uber H3 as Global Geographic Grid Coding Methods. Geomat. Inf. Sci. Wuhan Univ. 2024, 40. [Google Scholar] [CrossRef]
- Yuan, M.; Nara, A. Space-Time Analytics of Tracks for the Understanding of Patterns of Life. In Space-Time Integration in Geography and GIScience; Springer: Dordrecht, The Netherlands, 2015. [Google Scholar] [CrossRef]
- Zhou, W.F.; Sui, X.; Guo, X.T.; Jiang, Y.; Cheng, T. Searching method for marine ship rescue based on grid neighborhood query. J. Geo-Inf. Sci. 2021, 23, 1422–1432. [Google Scholar] [CrossRef]
- Lee, J.G.; Han, J.; Li, X. Trajectory Outlier Detection: A Partition-and-Detect Framework. In Proceedings of the IEEE International Conference on Data Engineering, Cancun, Mexico, 7–12 April 2008; IEEE: Piscataway, NJ, USA, 2008. [Google Scholar] [CrossRef]
- Luan, F.; Zhang, Y.; Cao, K.; Li, Q. Based local density trajectory outlier detection with partition-and-detect framework. In Proceedings of the 2017 13th International Conference on Natural Computation, Fuzzy Systems and Knowledge Discovery (ICNC-FSKD), Guilin, China, 29–31 July 2017; IEEE: Piscataway, NJ, USA; pp. 1708–1714. [Google Scholar]
- Wang, J.; Yuan, Y.; Ni, T.; Ma, Y.; Liu, M.; Xu, G.; Shen, W. Anomalous Trajectory Detection and Classification Based on Difference and Intersection Set Distance. IEEE Trans. Veh. Technol. 2020, 69, 2487–2500. [Google Scholar] [CrossRef]
- Zheng, Y. Trajectory Data Mining: An Overview. ACM Trans. Intell. Syst. Technol. 2015, 6, 1–41. [Google Scholar] [CrossRef]
- Jiang, B.; Zhou, W.; Han, H. Storage and Management of Ship Position Based on Geographic Grid Coding and Its Efficiency Analysis in Neighborhood Search—A Case Study of Shipwreck Rescue and Google S2. Appl. Sci. 2024, 14, 1115. [Google Scholar] [CrossRef]
- He, Y.; Li, Z.; Mou, J.; Chen, P.; Tang, Y. Collision-avoidance path planning for multi-ship encounters considering ship manoeuvrability and COLREGs. Transp. Saf. Environ. 2021, 3, 103–113. [Google Scholar] [CrossRef]
- Chen, X.; Hu, R.; Luo, K.; Wang, Y.; Zhang, L. Intelligent ship route planning via an A∗ search model enhanced double-deep Q-network. Ocean. Eng. 2025, 120956. [Google Scholar] [CrossRef]


| Decimal | 0 | 1 | 2 | 3 | 4 | 5 | 6 | 7 | 8 | 9 | 10 | 11 | 12 | 13 | 14 | 15 |
| Base 32 | 0 | 1 | 2 | 3 | 4 | 5 | 6 | 7 | 8 | 9 | b | c | d | e | f | g |
| Decimal | 16 | 17 | 18 | 19 | 20 | 21 | 22 | 23 | 24 | 25 | 26 | 27 | 28 | 29 | 30 | 31 |
| Base 32 | h | j | k | m | n | p | q | r | s | t | u | v | w | x | y | z |
| Fishing Boat Name | Timestamp | Longitude | Latitude | Speed | Direction |
|---|---|---|---|---|---|
| ZheLingYu 00028 | 2018/01/07 6:05:14 | 125.702288 | 30.1578 | 4.4 | 133 |
| ZheLingYu 00028 | 2018/01/07 6:06:16 | 125.699422 | 30.15748 | 4.6 | 127 |
| ZheLingYu 00028 | 2018/01/07 6:07:18 | 125.696633 | 30.156827 | 4.5 | 126 |
| ZheLingYu 00028 | 2018/01/07 6:08:20 | 125.693811 | 30.1562 | 4.5 | 128 |
| ZheLingYu 00028 | 2018/01/07 6:09:22 | 125.690933 | 30.155744 | 4.5 | 131 |
| ZheLingYu 00028 | 2018/01/07 6:09:50 | 125.691146 | 30.185623 | 4.5 | 131 |
| ZheLingYu 00028 | 2018/01/07 6:10:24 | 125.688022 | 30.155527 | 4.6 | 131 |
| ZheLingYu 00028 | 2018/01/07 6:11:06 | 125.686044 | 30.155133 | 4.6 | 124 |
| ZheLingYu 00028 | 2018/01/07 6:12:08 | 125.6834 | 30.153944 | 4.6 | 122 |
| ZheLingYu 00028 | 2018/01/07 6:13:10 | 125.680611 | 30.153083 | 4.6 | 126 |
| ZheLingYu 00028 | 2018/01/07 6:14:12 | 125.677711 | 30.152444 | 4.6 | 127 |
| ZheLingYu 00028 | 2018/01/07 6:15:14 | 125.674855 | 30.151911 | 4.5 | 129 |
| ZheLingYu 00028 | 2018/01/07 6:16:16 | 125.671988 | 30.151552 | 4.4 | 131 |
| ZheLingYu 00028 | 2018/01/07 6:17:18 | 125.669177 | 30.15095 | 4.5 | 127 |
| ZheLingYu 00028 | 2018/01/07 6:18:20 | 125.666377 | 30.150291 | 4.5 | 127 |
| ZheLingYu 00028 | 2018/01/07 6:19:22 | 125.663555 | 30.149755 | 4.4 | 129 |
| ZheLingYu 00028 | 2018/01/07 6:20:24 | 125.660744 | 30.149322 | 4.4 | 129 |
| ZheLingYu 00028 | 2018/01/07 6:21:26 | 125.657944 | 30.14885 | 4.5 | 128 |
| ZheLingYu 00028 | 2018/01/07 6:22:28 | 125.655155 | 30.148149 | 4.3 | 125 |
| ZheLingYu 00028 | 2018/01/07 6:23:30 | 125.652955 | 30.147344 | 3.5 | 122 |
| Fishing Boat Name | Timestamp | Longitude | Latitude | Speed | Direction |
|---|---|---|---|---|---|
| ZhePuYu 68823 | 2018/01/02 8:09:53 | 124.771677 | 30.10878 | 1.4 | 159 |
| ZhePuYu 68823 | 2018/01/02 8:11:37 | 124.762 | 30.052477 | 1.4 | 137 |
| ZhePuYu 68823 | 2018/01/02 8:11:53 | 124.770488 | 30.109991 | 1.5 | 160 |
| ZhePuYu 68823 | 2018/01/02 8:13:37 | 124.7602 | 30.052602 | 1.5 | 137 |
| ZhePuYu 68823 | 2018/01/02 8:13:53 | 124.769333 | 30.111216 | 1.4 | 162 |
| ZhePuYu 68823 | 2018/01/02 8:15:37 | 124.758466 | 30.05275 | 1.4 | 137 |
| ZhePuYu 68823 | 2018/01/02 8:15:53 | 124.768177 | 30.112441 | 1.3 | 158 |
| ZhePuYu 68823 | 2018/01/02 8:17:37 | 124.756711 | 30.052802 | 1.4 | 134 |
| ZhePuYu 68823 | 2018/01/02 8:17:53 | 124.767044 | 30.113655 | 1.4 | 160 |
| ZhePuYu 68823 | 2018/01/02 8:19:37 | 124.754966 | 30.052961 | 1.4 | 139 |
| ZhePuYu 68823 | 2018/01/02 8:19:53 | 124.765977 | 30.114875 | 1.3 | 161 |
| ZhePuYu 68823 | 2018/01/02 8:21:37 | 124.753255 | 30.053269 | 1.5 | 146 |
| ZhePuYu 68823 | 2018/01/02 8:21:53 | 124.764844 | 30.116033 | 1.4 | 157 |
| ZhePuYu 68823 | 2018/01/02 8:23:37 | 124.751544 | 30.053913 | 1.5 | 145 |
| ZhePuYu 68823 | 2018/01/02 8:23:54 | 124.7637 | 30.117188 | 1.4 | 157 |
| ZhePuYu 68823 | 2018/01/02 8:25:38 | 124.749855 | 30.054658 | 1.5 | 147 |
| ZhePuYu 68823 | 2018/01/02 8:25:54 | 124.7625 | 30.118308 | 1.4 | 160 |
| ZhePuYu 68823 | 2018/01/02 8:27:38 | 124.748155 | 30.05535 | 1.4 | 151 |
| ZhePuYu 68823 | 2018/01/02 8:27:54 | 124.761266 | 30.119394 | 1.4 | 157 |
| ZhePuYu 68823 | 2018/01/02 8:29:38 | 124.746444 | 30.055958 | 1.4 | 144 |
| Geohash Encoding Length | Width | Length |
|---|---|---|
| 1 | 4604.5 km | 5003.8 km |
| 2 | 1072.5 km | 625.5 km |
| 3 | 135.1 km | 156.4 km |
| 4 | 33.9 km | 19.5 km |
| 5 | 4.2 km | 4.9 km |
| 6 | 1.1 km | 610.8 m |
| 7 | 132.2 m | 152.7 m |
| 8 | 33.1 m | 19.1 m |
| 9 | 4.1 m | 4.8 m |
| 10 | 1.0 m | 0.596 m |
| 11 | 129.1 mm | 149 mm |
| 12 | 32.3 mm | 18.6 mm |
| Detection Method | Total Number of Detected Outliers | Verified to be True | Verified to be False |
|---|---|---|---|
| Geohash | 110 | 110 | 0 |
| LOF | 102 | 78 | 24 |
| DBSCAN | 107 | 107 | 0 |
| Hampel filter | 98 | 82 | 16 |
Disclaimer/Publisher’s Note: The statements, opinions and data contained in all publications are solely those of the individual author(s) and contributor(s) and not of MDPI and/or the editor(s). MDPI and/or the editor(s) disclaim responsibility for any injury to people or property resulting from any ideas, methods, instructions or products referred to in the content. |
© 2025 by the authors. Licensee MDPI, Basel, Switzerland. This article is an open access article distributed under the terms and conditions of the Creative Commons Attribution (CC BY) license (https://creativecommons.org/licenses/by/4.0/).
Share and Cite
Zhang, L.; Zhou, W. A Data Cleaning Method for the Identification of Outliers in Fishing Vessel Trajectories Based on a Geocoding Algorithm. J. Mar. Sci. Eng. 2025, 13, 917. https://doi.org/10.3390/jmse13050917
Zhang L, Zhou W. A Data Cleaning Method for the Identification of Outliers in Fishing Vessel Trajectories Based on a Geocoding Algorithm. Journal of Marine Science and Engineering. 2025; 13(5):917. https://doi.org/10.3390/jmse13050917
Chicago/Turabian StyleZhang, Li, and Weifeng Zhou. 2025. "A Data Cleaning Method for the Identification of Outliers in Fishing Vessel Trajectories Based on a Geocoding Algorithm" Journal of Marine Science and Engineering 13, no. 5: 917. https://doi.org/10.3390/jmse13050917
APA StyleZhang, L., & Zhou, W. (2025). A Data Cleaning Method for the Identification of Outliers in Fishing Vessel Trajectories Based on a Geocoding Algorithm. Journal of Marine Science and Engineering, 13(5), 917. https://doi.org/10.3390/jmse13050917