Article

Submarine Groundwater Discharge in the Nice Airport Landslide Area

MARUM—Center for Marine Environmental Sciences, University of Bremen, 28359 Bremen, Germany
*
Author to whom correspondence should be addressed.
J. Mar. Sci. Eng. 2025, 13(5), 909; https://doi.org/10.3390/jmse13050909
Submission received: 31 March 2025 / Revised: 27 April 2025 / Accepted: 28 April 2025 / Published: 3 May 2025

Simple Summary

Nice (France) and the Côte d’Azur, in general, are highly populated tourist destinations where shoreline protection and safety are of utmost importance. Sadly, the area is not only famous for its pristine beaches but also for the catastrophic tsunamigenic submarine landslide that took place in 1979, causing several casualties and damage to on- and offshore infrastructure. Ever since, many national and European studies have been conducted in order to better understand the triggering mechanisms for slope failure and the likelihood of reoccurrence in the future. One of these triggers is the overpressuring of certain sediment layers through groundwater movement. Therefore, groundwater tracing elements were measured in this study to prove the existence of previously postulated submarine groundwater discharge, possibly contributing to destabilizing the submarine slope in the Nice region. Seepage of groundwater was demonstrated in this study but without a significant increase in pore pressure. Further studies, incorporating these new findings, will help to better assess landslide risk in the region.

Abstract

Natural radioactivity was measured and analyzed at the Nice Slope for over a month using radon daughters in order to trace groundwater movement from a coastal aquifer to a nearshore continental shelf. Such groundwater movement may have resulted in submarine groundwater discharge (SGD) and potentially sediment weakening and slope failure. The relationship among major hydrological parameters (precipitation, Var discharge, groundwater level, salinity and water origin) in the area is demonstrated in this study. Time series analyses also helped to detect tidal fluctuations in freshwater input, highlighting the crucial role SGD plays in the slope stability of the still failure-prone Nice Slope, parts of which collapsed in a tsunamigenic submarine landslide in 1979. Earlier deployments of the underwater mass spectrometer KATERINA showed that SGD is limited to the region of the 1979 landslide scar, suggesting that the spatially heterogenous lithologies do not support widespread groundwater charging. The calculated volumetric activities from groundwater tracing isotopes revealed peaks up to ca. 150 counts 214Bi, which is similar to those measured at other prominent SGD sites along the Mediterranean shoreline. Therefore, this rare long-term radioisotope dataset is a valuable contribution to the collaborative research at the Nice Slope and may not remain restricted to the unconfined landslide scar but may charge permeable sub-bottom areas nearby. Hence, it has to be taken into account for further slope stability studies.

1. Introduction

In the North Atlantic sector (incl. the Nordic Seas and Mediterranean Sea), numerous large landslides have been reported for the past 45 ka, most likely because of intensive study and their proximity to massive Quaternary ice sheets [1]. Although these authors argue that the latter failures were driven by lowered hydrostatic pressure as a consequence of isostatic rebound and associated seismicity after the onset of deglaciation, an equally valid explanation could be that aquifer systems utilizing porous, horizontal to gently seaward-dipping delta/prodelta deposits from glacial time may have been maintained during deglaciation and stepped upward in the coastal sedimentary successions. This phenomenon is globally relevant and may explain why many landslides occur in such sediments not far seaward from modern shorelines.
A significant portion of such glacially overprinted, coastal marine environments in Europe is influenced by the flow or persistent seepage of groundwater in the form of submarine groundwater discharge (SGD) [2,3]. Ref. [4] estimated that SGD contributes up to ~6% of the global fluvial input. Although these processes are usually patchy, diffuse and temporarily variable, they play a major role in the region’s hydrogeology and are therefore important for near-shore submarine slopes and their stability. Earlier studies on the shallow Nice Slope in the vicinity of Nice airport and Var River mouth have already established the importance of groundwater discharging in potentially unstable areas [5,6,7,8,9]. The existence of SGD in the 1979 Nice landslide scar (Figure 1a—red line) has already been proven to some extent in these works, and, in particular, the authors of [10] were able to directly measure freshening at the sea surface above the 1979 landslide scar. Additionally, ref. [8] relied on pore water analyses to infer freshwater circulation in the failure scar.
An underwater radionuclide detection sensor was developed in 2008 [11], making it possible to qualitatively and quantitatively measure terrestrial natural radiation in the form of radon daughters (214Pb and 214Bi). The usage of these radioisotopes as a groundwater tracer in marine environments has been extensively studied and proven [11,12,13]. Furthermore, a strong link to short-term fluctuations in SGD due to the current tidal phase has been made by [14]. A change in the hydraulic gradient and the recirculation of seawater due to tidal pumping [15] are thought to be the two main processes responsible for the temporarily variable amounts of freshwater discharge.
By analyzing pore pressure datasets collected over more than a decade, a study [9] further stressed the importance of groundwater exchange between Nice’s hinterland and the near-shore continental shelf for slope stability. Therefore, we deployed one of these radionuclide detection systems, called KATERINA, at a suspected SGD site in the 1979 Nice landslide scar in order to further identify and also quantify the discharged fresh(ened) water. We hypothesize that SGD and its variations play a major role in the slope’s stability. We use time series analyses to help unravel the driving forces of the fluctuations. Further piezometer datasets and other hydrological parameters (precipitation, river discharge, groundwater level and salinity) will be used to describe the hydrogeology of the area.

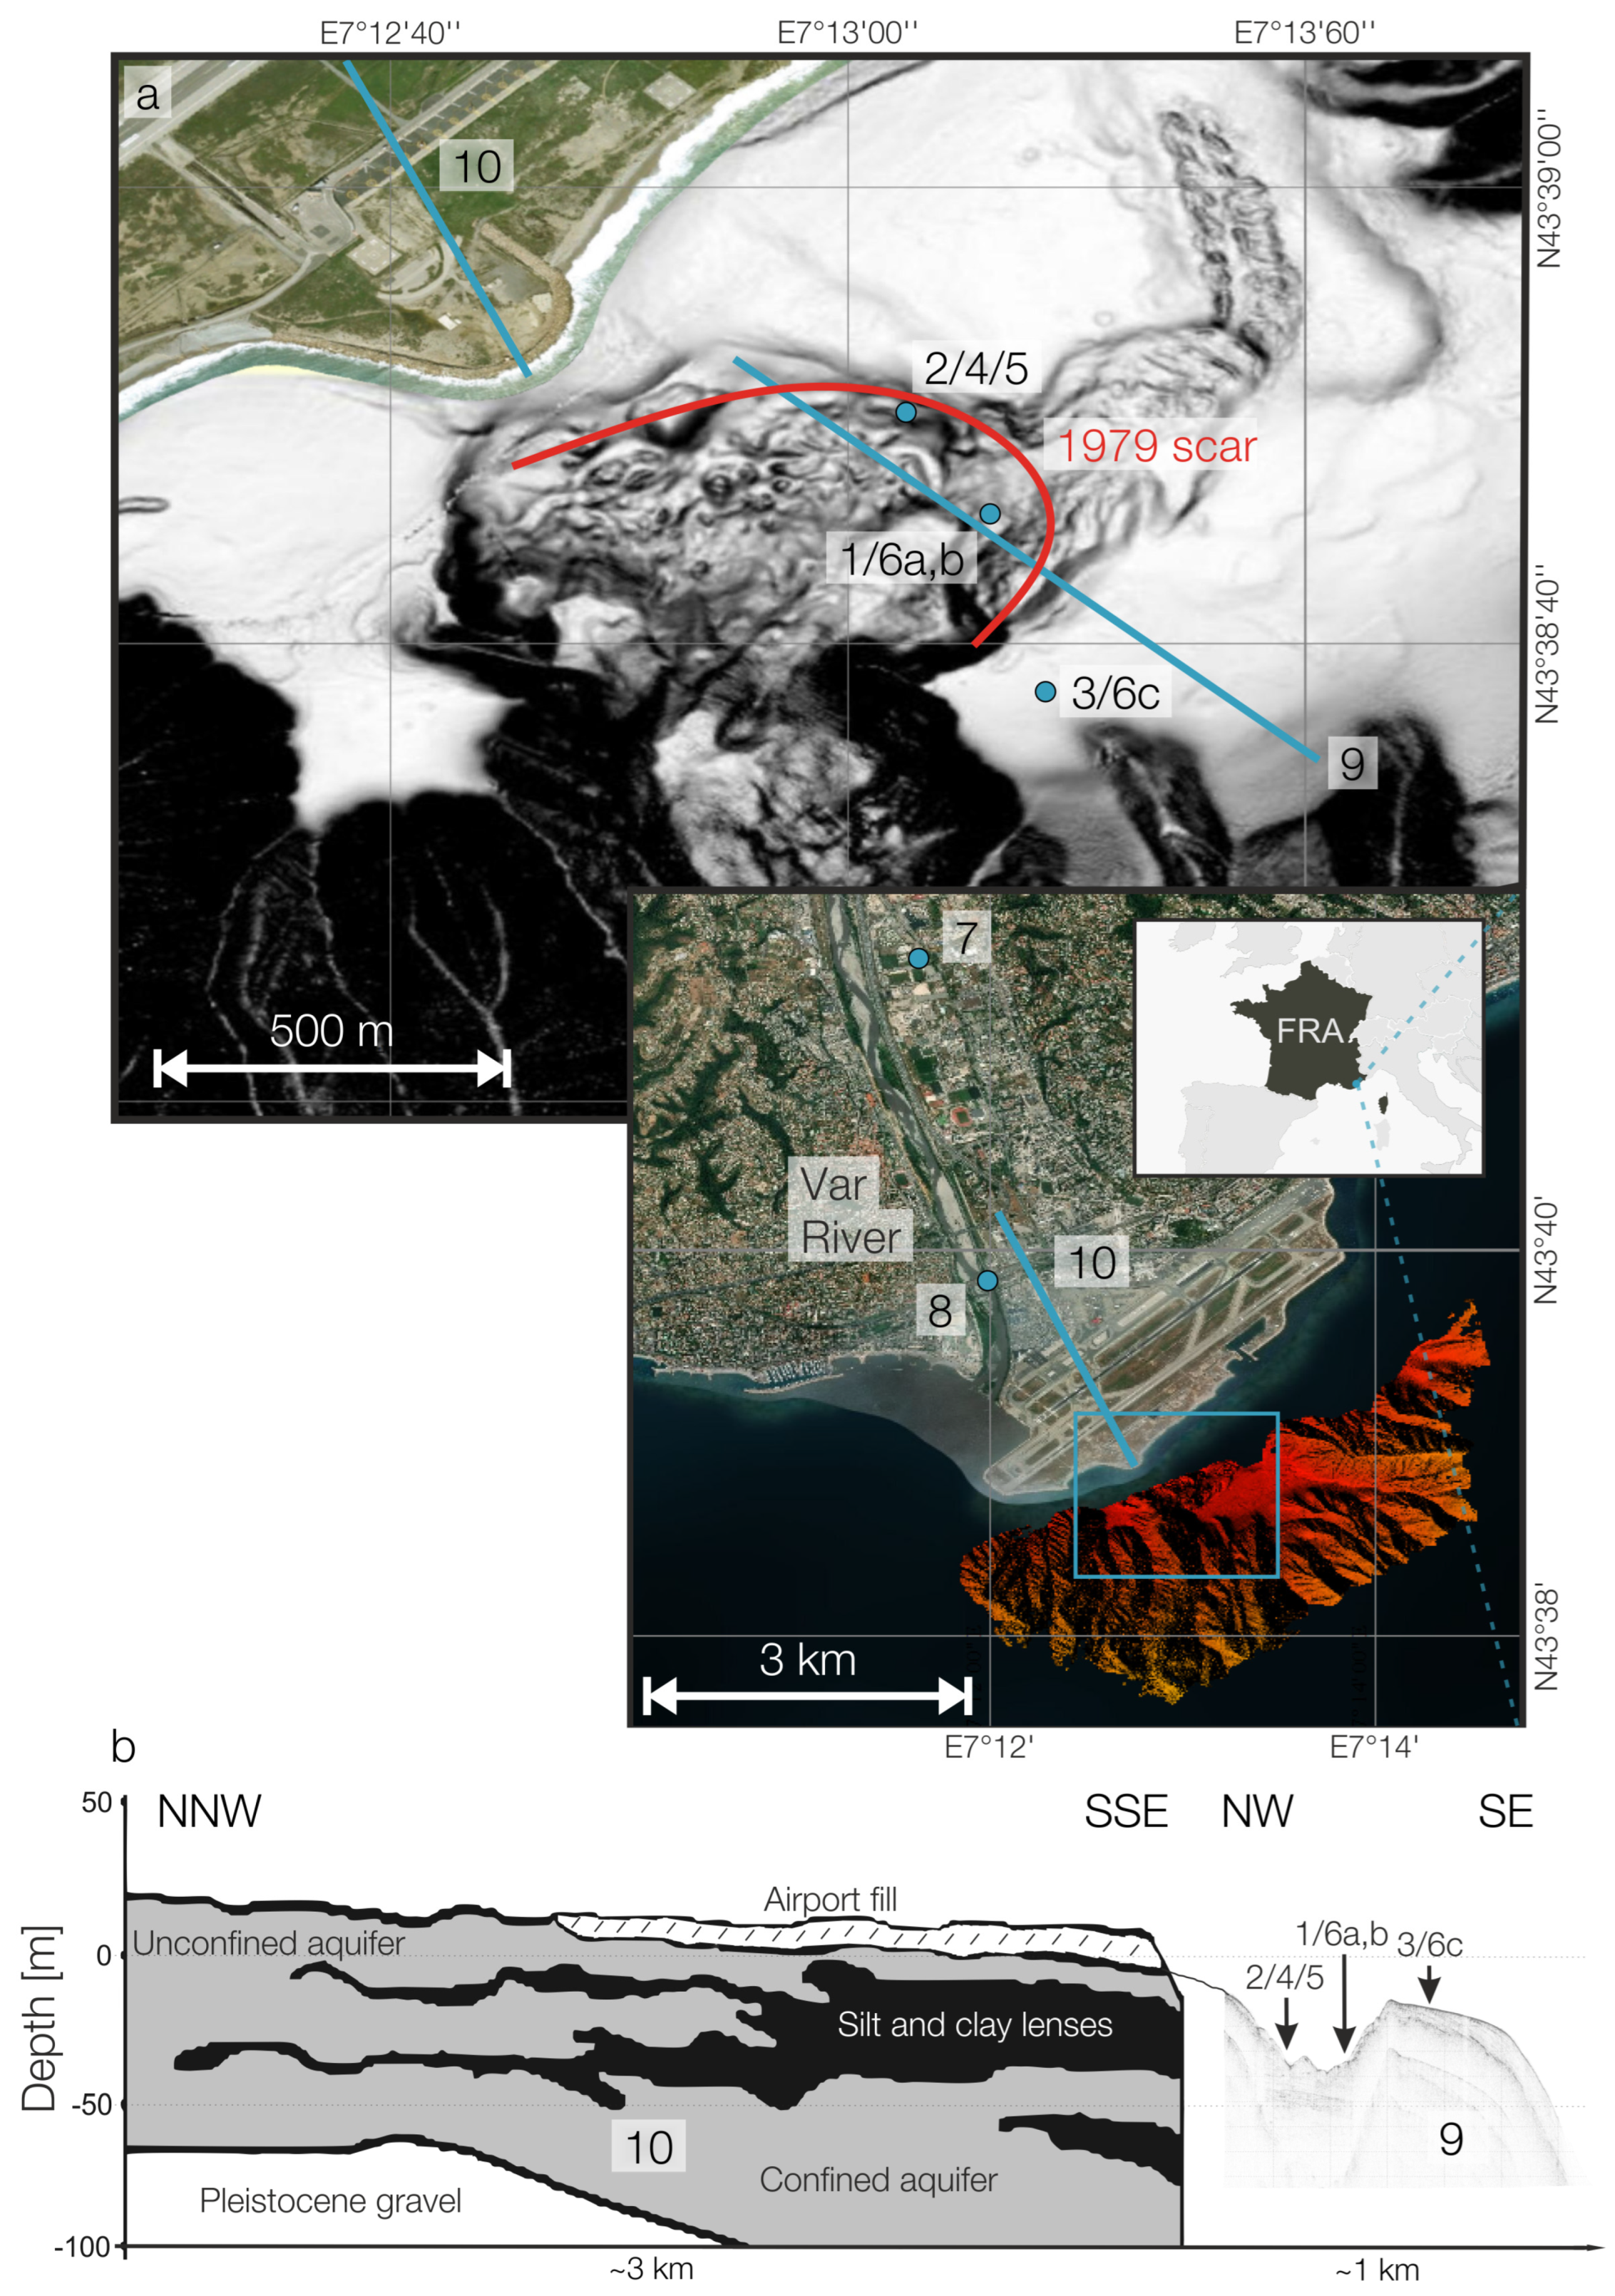
1.1. Geological Background

The study area is situated in the Ligurian Sea, a basin in the western part of the Mediterranean Sea. Rifting processes dating back to the Oligocene led to the formation of the Ligurian Basin, which received a pulse of 1.5 km of Early Pliocene–Quaternary marine sediments deposited during the re-flooding of the Mediterranean Sea after the Messinian Salinity Crisis over the past ~5 Ma years. Gilbert-type fan deltas, consisting of 600–1000 m thick sequences of marls and conglomerates (also known as ‘puddingstones’), filled the Var region bound by the Cap d’Antibes and Cap Ferrat ridges [16]. At the Mediterranean coastline, most of the porous coastal aquifers are located in Plio-Quarternary deposits [17]. The history of these aquifers is closely linked to the Messinian Salinity Crisis, which exposed the margin of the Mediterranean Sea to subaerial erosion [18] and created deep valleys, which were subsequently filled with Pliocene–Quaternary deposits [18].
Today, the continental margin varies strongly in width and structure, with ~250 landslide scars revealed by bathymetric mapping in the area, with larger slides (150–500 m width and 30–90 m height) located predominantly in the deeper regions of the slope, except the 1979 Nice Airport Landslide area [19,20]. The very narrow continental shelf offshore Nice is succeeded by a relatively steep slope down to ~2500 m depth with an average angle of 11°. Steeper and deeply incised canyons in the slope were formed by the Var River [21], which originates in the Maritime Alps at around 3000 m altitude and has a catchment area of around 2800 km2. The Lower Var Valley (LVV), the last 25 km of the 110 km long river, has a moderate gradient of 4.3 m km−1 and is important for the hydrological regime of the working area. Two main aquifers have been described: (1) In the Var Paleo-Valley, conglomerates and marls were deposited at the base of the Pliocene, overlain by a 100 m thick wedge of Holocene alluvial sediments [22]. (2) Below, basal, coarse-grained Pliocene conglomerates (puddingstones) are confined below a thick wedge of shallow marine deltaic mud. A hydrological model and a hydrochemical investigation indicate that the second aquifer layer drains seaward along permeable gently southward-dipping beds at various depths down to ~140 m [10,23,24]. According to [25], the confined Pleistocene aquifer is only responsible for 19–25% of groundwater discharging in this area, leaving the younger unconfined aquifer as the main driver (although hydraulic gradients are low). Using 56 drill holes, ref. [26] demonstrated that the confined aquifer gradually becomes more unconfined moving upstream due to the thinning of the overlying mud lenses (Figure 1b). Several onshore cone penetration test (CPT) measurements carried out at the airport [27] and multiple offshore CPT Penfeld measurements in 2007 conducted at the Nice Slope [22,28] confirmed the existence of these lenses.

1.2. The 1979 Landslide

An extension of the Nice Côte d’Azur Airport was built on the continental shelf offshore Nice in 1979. Later that year, on 16 October, an embankment of this newly built extension, which was meant to be a harbor, collapsed into the sea. It further migrated down the Ligurian slope into the deep basin, cutting two submarine cables 4 to 8 h later at a water depth of ~2500 m [29]. The Nice Airport Landslide (NAIL) scar is 25–40 m in depth, 150–300 m wide and 4.5 km long [29,30]. The large amount of displaced material (~0.0084 km3) was sufficient to generate a 2–3 m high tsunami striking the coast a couple of minutes later [31]. Several studies [7,19,25,29] identified several major triggering factors for this mass wasting event and suggested that a combination of these factors was responsible. The anthropogenic influence through the extra loading of ~11 million tons of material was one of the possible reasons for slope failure [29]. This induced softening of the mechanical properties of the sensitive clay layer and an increase in sediment creep. The last 4 days prior to the failure were dominated by heavy precipitation (250 mm), causing the charging of the slope’s aquifers with freshwater and therefore a rise in pore pressure. Several studies confirmed the connection between the hinterland (Var River) and the Nice Slope through the rise in groundwater level and pore pressure in both areas, respectively [7], and through SGD [8,10]. This confirms the existence of a widespread aquifer in Nice’s underground, which may be highly active during times of high precipitation. Flash floods are very common in the Nice area and can reach even higher accumulations (compared to October 1979) of, e.g., 356 mm of precipitation in 6 h (November 2011). In spring (April–June), this amount of precipitation combined with snow melting is able to raise pore pressure to a level that equals the shear strength of the sediments, thus resulting in slope failure as discussed in [7,32]. On the other hand, no connection to seismic triggering could be made because the nearby Monaco observatory registered no earthquakes on 16 October 1979.

2. Materials and Methods

All the installed measuring devices and conducted surveys in the working area, which were used in order to answer the posed scientific questions, can be found in Figure 1 and Table 1.

2.1. Offshore Data

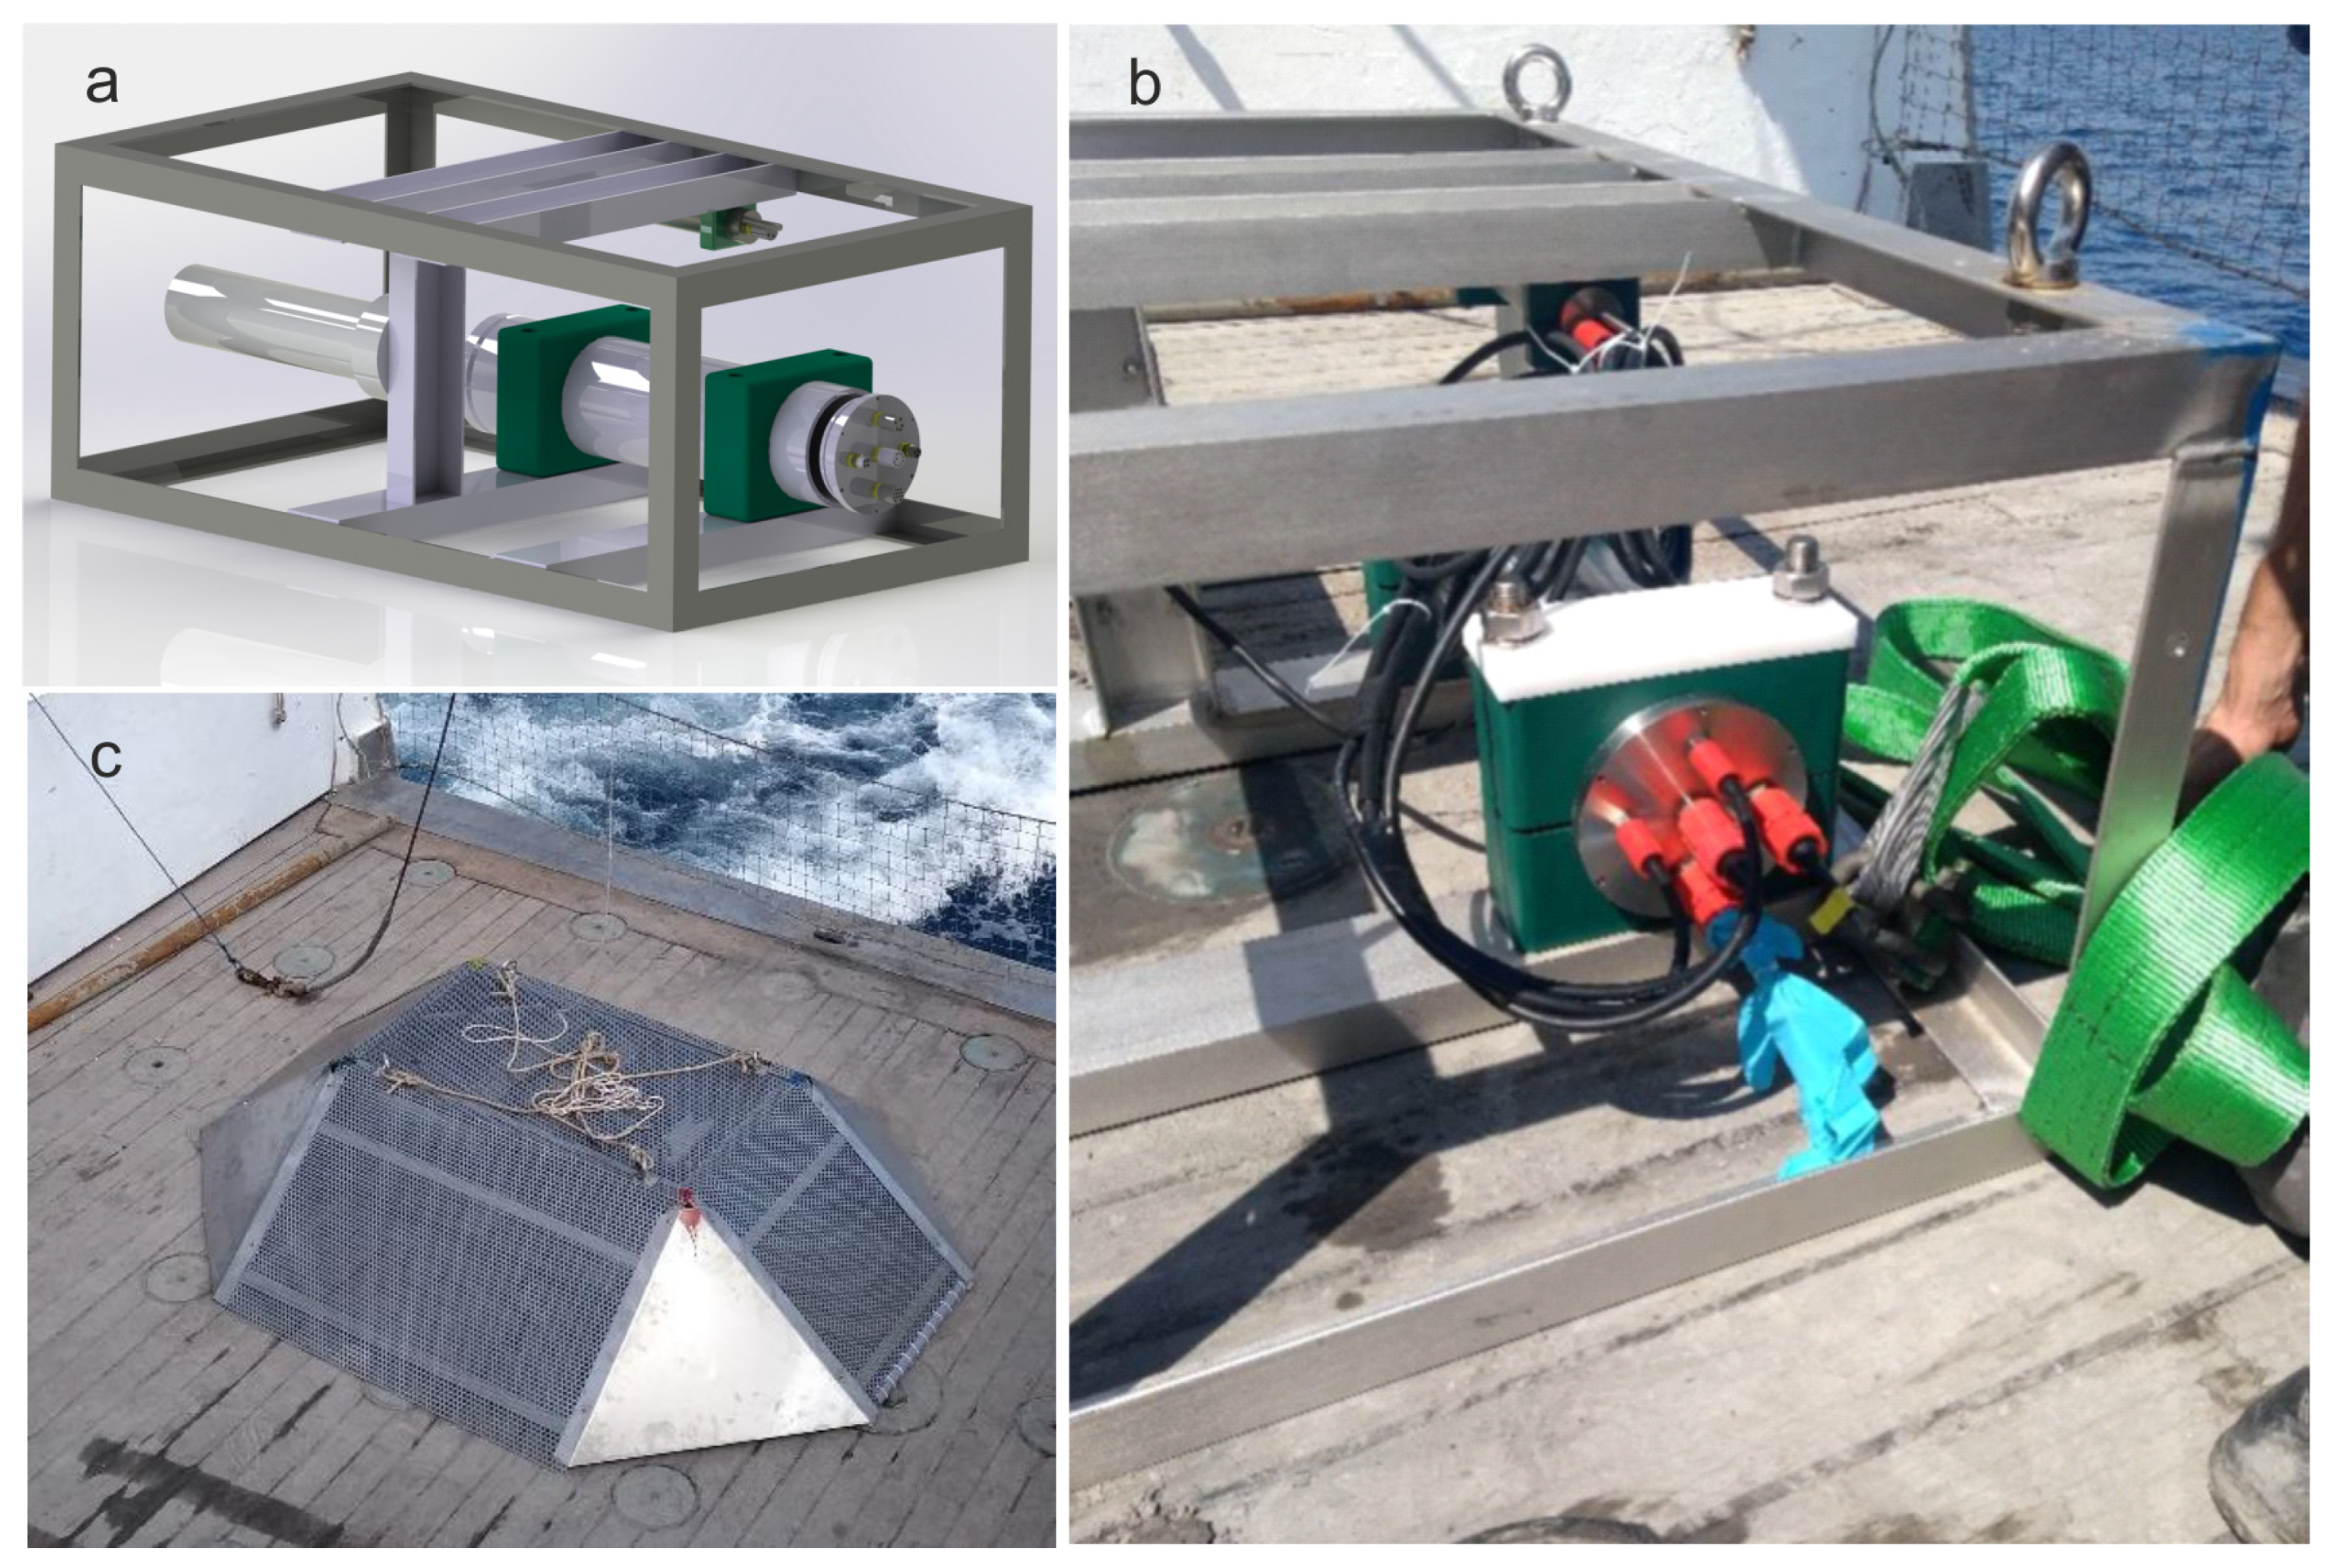
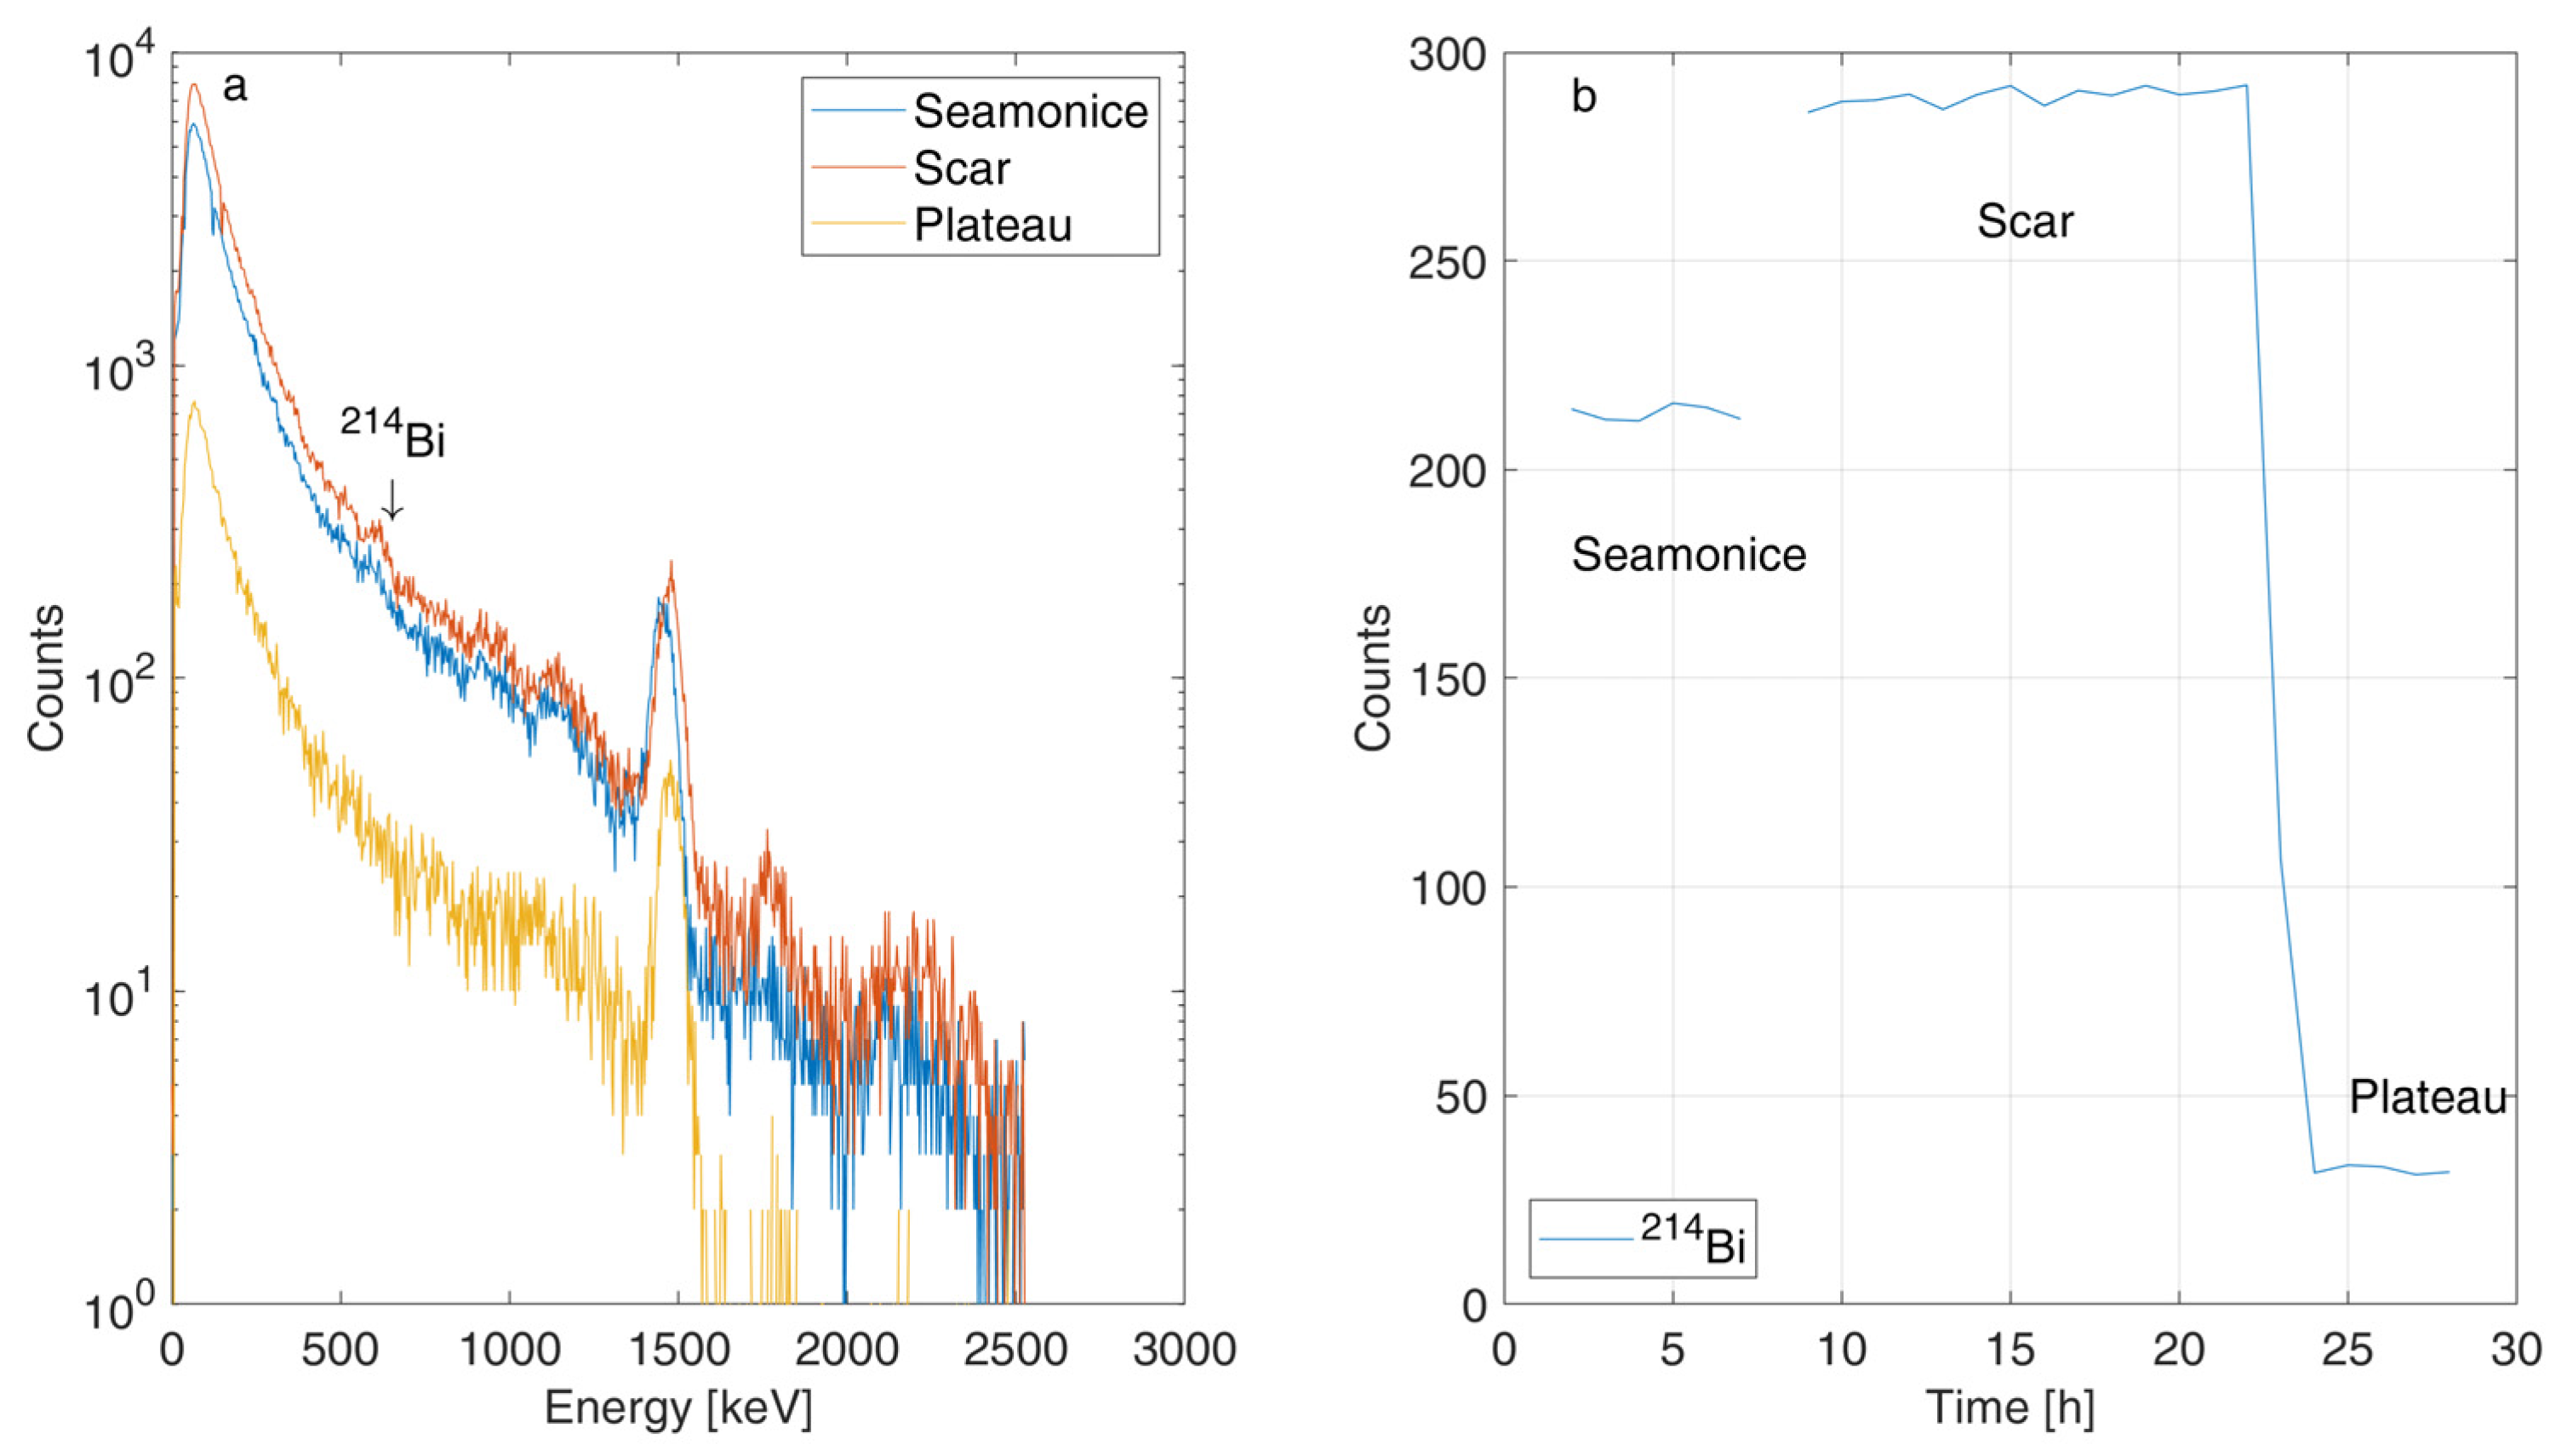
2.1.1. KATERINA and CTD

The KATERINA radioactivity detection system (Figure 2) was developed by the Hellenic Centre for Marine Research (HCMR) in close collaboration with Hydrometeorological and Remote Sensing Technologies (HORST) in 2008. This in situ gamma-ray spectrometer is equipped with a NaI(Tl) crystal able to measure seawater radioactivity both qualitatively and quantitatively [11]. The detection system and a Conductivity–Temperature–Density sensor (CTD) were hooked on top of a stainless steel frame, which is covered by a protective metal mesh (Figure 2b,c) and deployed in the 1979 landslide scar during the FLUID3D-2 cruise in August 2019. Using three 240 m custom-made underwater data and power cables, the system was connected to the EMSO-Ligure Nice real-time network [33]. Every hour, a spectrum with all gamma-ray counts within this time frame is saved and available for download from the real-time network.

2.1.2. Spectra Analysis and FFT
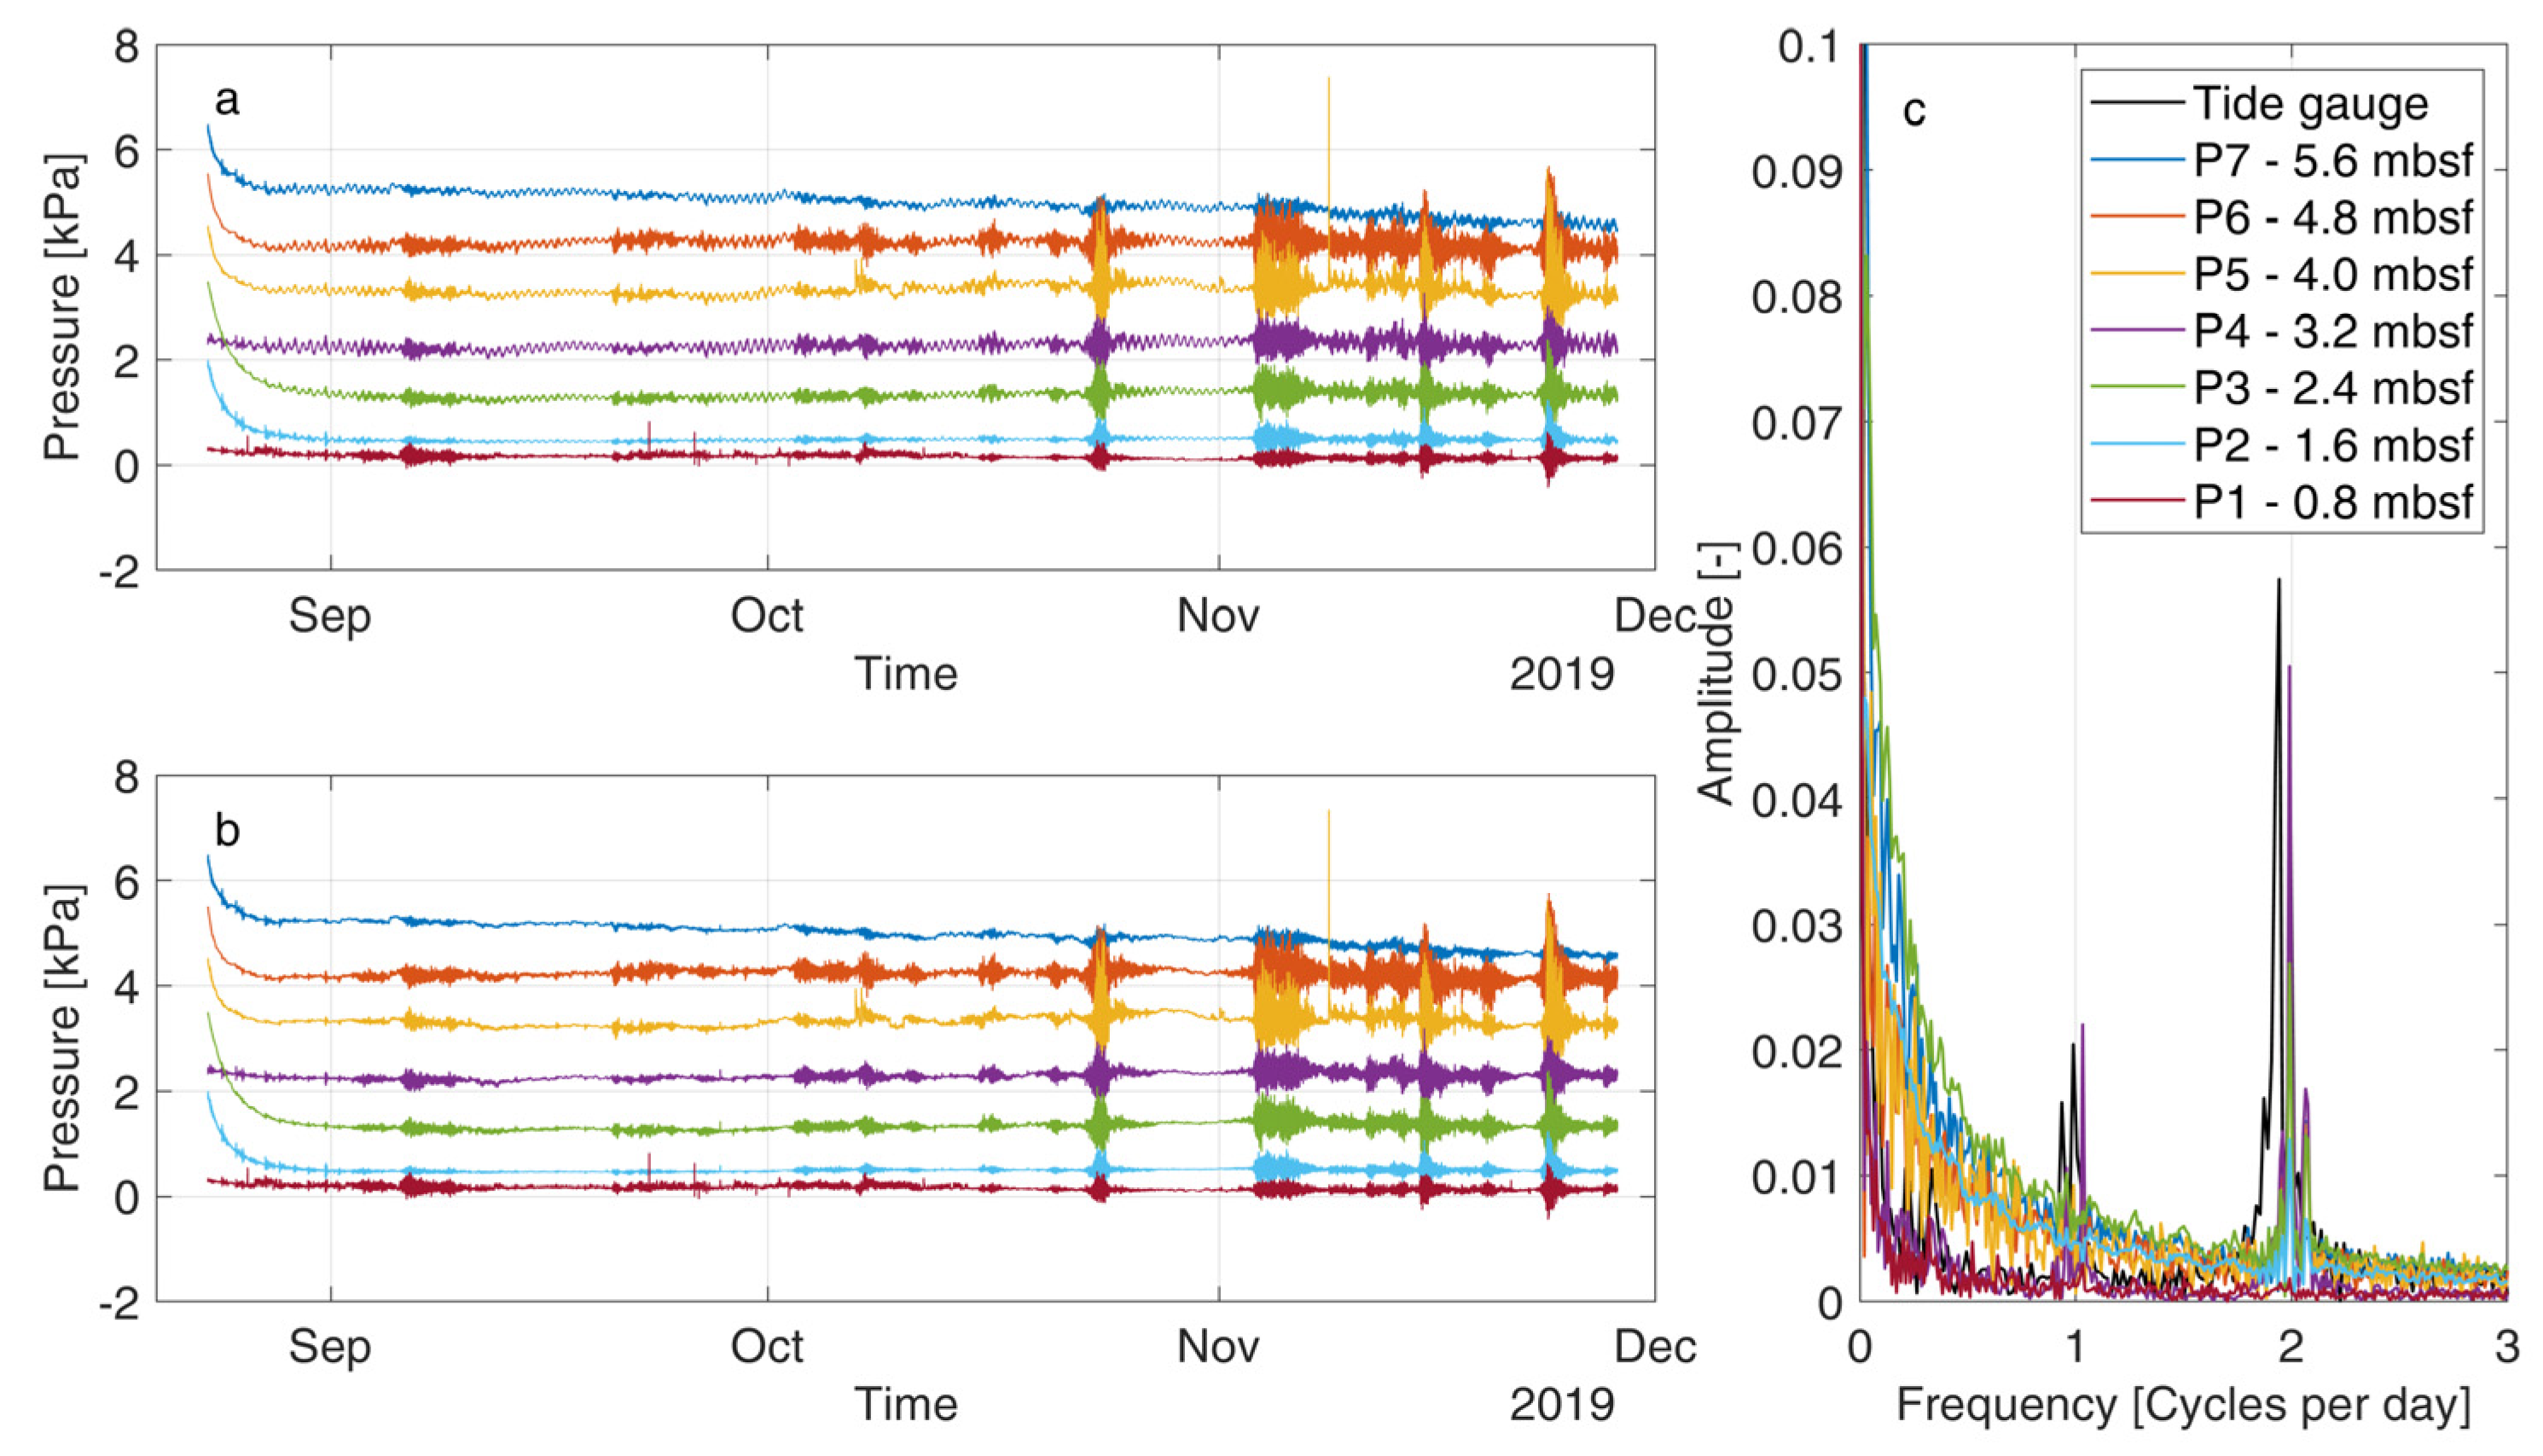
In order to view the hourly acquired gamma-ray spectra over time, the software package “DppMCA SPECTRG v.1.0.0.1” was used. A self-written MATLAB R2016a script then automatically identified specified radon daughter peaks. The gamma-ray energy counts saved at each of the channels forming a peak were averaged. These hourly averaged peak values were then plotted as a continuous time series to measure changes in the amount of groundwater present.
Fast Fourier Transforms (FFTs) are used to convert a signal in a time or space domain into a frequency domain. Here, this was used to determine if the changing gamma-ray energy counts over time are driven by specific frequencies related to typical tidal constituents.

2.1.3. Piezometer

A total of 15 multi-level piezometers have been installed on the Nice continental shelf over the last 16 years in order to measure in situ pore pressure and temperature at different depths. In October 2015, the EMSO-Ligure Nice observatory network was launched to obtain near real-time, long-term and high-resolution datasets from the continental shelf off the coast of the airport. V2-type piezometers (Nke- instrumentation 6 rue Gutenberg—ZI Kérandré 56700 Hennebont—FRANCE) [33,34] recorded these parameters at seven different depths (Table 1, 6b). Piezometer 6b was installed inside the scar (Figure 1a), about 25 m away from the 2011 Seamonice piezometer (Nke- instrumentation 6 rue Gutenberg—ZI Kérandré 56700 Hennebont—FRANCE) (Figure 1a, Point 6a). The pore pressure sensors have an accuracy of ±0.5 kPa, and the temperature sensors have an accuracy of ±0.05 °C [9]. The exact deployment locations and depths can be found in Figure 1a and Table 1, whereas further technical information is given in [33].

2.1.4. Bathymetry

The topographical map of the seafloor in the working area was made by IFREMER (MALISAR, 2009 and AUVNIS, 2010 cruises) (French Institute for Ocean Science, 1625 Rte de Sainte-Anne, 29280 Plouzané, France), whereas more detailed features, further expansions of the map and missed spots were added during the POS500 cruise in 2016. During POS500, the multibeam sonar system Multibeam 3050 from L-3 Communications ELAC Nautik (L-3 Communications ELAC Nautik GmbH | Neufeldtstrasse 10 | 24118 Kiel | Germany) was used in combination with an autonomous underwater vehicle (AUV), called MARUM SEAL 5000 (MARUM, Leobener Str. 8, 28359 Bremen). SEAL hosts two multibeam echosounder systems, a Kongsberg EM2042 (Kongsberg Gruppen ASA, Kirkegårdsveien 45, 3601 Kongsberg, Norway) and a RESON 7125B (Subsea Technology & Rentals Ltd., Units A1 & A2, Blackness Trading Estate, Blackness Road, Altens, Aberdeen, AB12 3LH), which have spatial resolutions of 6 ± 2 decimeters.

2.2. Onshore Data

2.2.1. Groundwater Piezometer

Onshore piezometers have been installed in the working area starting in the 1960s in order to obtain information about the groundwater level. One location was chosen out of around 50 piezometers, which can be found along the LVV. Piezometer P4B is situated on the eastern side of the Var River, only ~3 km north of its river mouth at an altitude of 17 m (Figure 1a, Point 7). A hole was drilled down to 15 m, where the tube of the piezometer was installed on 19 July 2005. The sampling rate for the piezometer was set at 1 measurement per hour and is available on www.ades.eaufrance.fr (URL accessed on 8 December 2020).

2.2.2. Var River Discharge

Several stations measuring river discharge are installed along the Var River and are run by the Eaufrance HYDRO department of the Ministry for the Ecological and Inclusive Transition of France. One of those stations was chosen to look at the Var River discharge pattern over time. The station Y6442015 is situated just ~700 m north of the mouth of the Var River, next to the Nice airport at the Pont Napoleon III Bridge (Figure 1a, Point 8). Recording at this station started on 22 January 2016. The sampling rate varies between 1 and 20 times per day, with an average rate of ~6 times per day. The recorded discharge values are displayed in m3 s−1 [Q] and are equal to the product of the river’s cross-section area [A] and its velocity [v].
Q m 3 s 1 = A m 2 · v m   s 1    
Data are available on www.hydro.eaufrance.fr (URL accessed on 7 September 2021).

3. Results

3.1. Test Run and Placement Search 2018

During the FLUID3D-1 cruise with RV L’Europe in November 2018, the KATERINA detection system was tested in three different locations in order to find the most promising one for longer-term monitoring of submarine groundwater discharge (SGD). Radionuclide counts are displayed on a logarithmic scale due to the smaller amounts present in the high gamma-ray spectrum (Figure 3a). A 6 h long test run on the plateau (Figure 1a, Point 3) showed a very low concentration of the groundwater tracer 214Bi (Figure 3a-yellow and Figure 3b). A clear peak of 40K, the naturally abundant radionuclide in seawater, is visible at 1460 keV at all three locations. Much higher groundwater tracer values (Figure 3a-blue and Figure 3b) were recorded during another 6 h testing period close to the SGD site Seamonice [7] (Figure 1a, Point 1). Another location on the very northern edge of the scar (Figure 1a, Point 2) showed the highest 214Bi values (Figure 3a, orange; and Figure 3b) and was therefore chosen for the placement of the KATERINA system in August 2019 (Figure 1a, Point 4).

3.2. Smoothing of Long-Term Data 2019

The final deployment site for KATERINA was chosen at the very northern part of the 1979 landslide scar (Figure 1a, Point 4). The sediment top layer consists of a homogenous silty clay facies, most likely deposited soon after the 1979 slide [19]. Remnant concrete blocks from the former construction are abundant in the area. Recording began a couple of days after the deployment on 26 August 2019. Due to technical difficulties regarding the instrument channel offsets, data are only available from mid-September onwards. The first longer power outage of the server occurred from 24 to 30 September. Therefore, the nearly continuous record for the whole month of October was used to study the hydrology in the area. The average 214Bi peak area value of each hourly gamma-ray spectrum was plotted over time (Figure 4, in blue). The large data gap from 24 to 30 September 2019 is due to a power outage of the server. On 15 October 2019, a clear increase of ~six counts per hour in the groundwater tracer 214Bi can be observed. The value continues to rise slightly until 28 October 2019, when technical adjustments were made on the KATERINA system. This was successful, but due to the manual shift in the spectra, the results were not comparable to the rest of the dataset. On 8 November 2019, the power supply was turned off due to the installation attempt of a seismometer lance close by during cruise FLUID3D-2 Part 2. Unfortunately, the system could not be accessed anymore after that incident. KATERINA and its cables were recovered during a cruise in early 2021 and reinstalled shortly afterwards (July 2021 by RV Pourquoi pas), but in self-contained mode because the cables were found to be damaged by local fishing activity.
For a clearer view of the dataset, when compiled with the Var River discharge data, the onshore groundwater level measurements and the salinity values were calculated using a 12 h running average (Figure 4, in orange). However, the above-described FFT analysis was made with the raw data.

3.3. Piezometer Data

Piezometer 6b, which was deployed in the failure scar (Figure 1, point 6b), measured pore pressure at seven different depths (Figure 5a). Small overpressures were recorded by all sensors. No large long-term background fluctuations could be observed. When looking at the short-term changes, sinusoidal oscillations are present in the dataset. By performing FFT analysis on the raw data, it is clear that these fluctuations coincide with the typical tidal harmonic constituents for this region (Figure 5c). Hence, these frequencies have been removed from the dataset, as the de-tided pore pressure measurements (Figure 5b). Additional short-term increases of 1–3 kPa in pore pressure can be observed in the dataset. The most prominent ones are on 23 October 2019 and several periods throughout the month of November 2019.

4. Discussion

4.1. Rain Events 2019

After three large rainfall events on 15–16 October (29.3 mm), 21 October (13.2 mm) and 24–25 October (45.2 mm) 2019, a subsequent large increase in Var River discharge (Figure 6, red) was recorded at the Pont Napoleon III bridge northwest of the Nice airport (Figure 1a, Point 8). This was followed by an immediate increase in groundwater level of 1 m (Figure 6, black), registered at station P4B approximately 3 km upriver (Figure 1a, Point 7). Simultaneously, the CTD device mounted on the KATERINA frame (Figure 1a, Point 5) registered a stepwise drop in salinity from 36 to 33 psu and then to a very low value of 30 psu (Figure 6, green). The radionuclide detection system (Figure 1a, Point 4) recorded a sharp increase in the groundwater tracer 214Bi on 15–16 October 2019 and continuously rose until 28 October 2019 (Figure 6, blue).
Both the salinity and the 214Bi values therefore suggest SGD in the 1979 landslide scar. As an alternative explanation, a drop in salinity and 214Bi could also have been caused by the direct input of freshwater from the Var River. This was suggested in a study by [7], where piezometer Seamonice (Figure 1a, Point 6) showed a ~2–6 week delay in pore pressure increase in the outcropping permeable sediments after periods of rain in 2007. Piezometer 6b recorded pore pressure during the time of the KATERINA deployment (Figure 5). Although short-term increases were recorded after three of the four rain events, no background changes in sediment layer pore pressure over the next weeks could be observed (Figure 7). This is most probably explained by either the very heterogeneous lithology in the scar [19], poor penetration and measurement of one of the permeable, discharging layers by the piezometer or easterly winds and storm waves associated with the precipitation events. Most likely, permeable and gently southward-dipping layers in the sub-bottom of the Nice shelf area carry fresh(ened) waters effectively seawards. In the intact shelf/plateau area, they do not seep out of the ground, whereas in the landslide scar, they are no longer confined and cause the observed drop in salinity and increase in 214Bi. Given the lack of confinement, no additional hydraulic gradient is required to measure SGD.
The missing increase in the 214Bi peak after the first larger rain event after the dry summer period on 21 September 2019 could be related to still slowly charging groundwater-bearing aquifers. Furthermore, refs. [14,35] explain the unclear relationship between precipitation, salinity, groundwater tracers and tides, with onshore winds bringing in large amounts of saltwater from the open sea, leading to a disruption of the relationship. However, strong evidence for actual SGD is identified through the use of FFT.

4.2. Using FFT to Identify Submarine Groundwater Discharge

The amount of SGD is strongly related to the tidal phases [4,14]. During flood tide and high tide, when the sea level rises to its highest level, the total pressure at the seafloor reaches its maximum. Therefore, the regional hydraulic gradient is lower, and a smaller amount of SGD is observed. On the other hand, when the water level reaches its lowstand during ebb tide and low tide, the total pressure at the seafloor is the lowest. At that point, SGD can happen on a larger scale due to the lower forces resisting it. In order to prove if freshening of the seawater is taking place due to SGD, typical tidal harmonic constituent frequencies, such as M2 (principal lunar semidiurnal constituent), M4 (Shallow water overtide of the principal lunar constituent) or further combinations of tidal constituents, need to be present in the 214Bi signal. After converting the dataset from a time domain into a frequency domain using FFT, the dominant frequencies in the signal are visible (Figure 8). For a better understanding, the calculated frequencies (in Hz) on the x-axis were transformed into cycles per day. Indeed, clear peaks are visible at the two main tidal constituents M2 (1.93 cpd) and M4 (3.86 cpd). Other higher-frequency signals in the spectra are related to combinations of overlying tidal constituents. This shows that the amount of the groundwater tracer 214Bi fluctuates with the tidal phases and confirms SGD as its source. Ref. [4] showed the relationship between tides, salinity and SGD through radon monitoring at a prominent SGD site in Cabbé, ~20 km northeast of the Nice airport. However, this was only shown for the time period of a single day, with data only available at high tides. By using FFT, we see that this relationship is still accurate for a time frame of over a month. Unfortunately, our radioactivity detection instrument stopped working at the end of October 2019, preventing us from further investigating this relationship for longer time periods, most notably during the winter season known for heavy rain in November each year.

4.3. Long- and Short-Term Pore Pressure Changes

Two main aquifers are responsible for groundwater movement in the area, as suggested by numerous workers [7,9,36]. The lower confined aquifer is responsible for 19–25% of groundwater charging [25], so the upper unconfined aquifer acts as the main driver (Figure 9b). Ref. [7] presented the Seamonice piezometer (Figure 1a, Point 6a) data in their study, where a ~2–6 week delayed but strong long-term increase in pore pressure in the outcropping permeable sediments after periods of rain in 2007 could be measured in the vicinity of the current piezometer 6b location. Unfortunately, a reproduction of this dataset with piezometer 6b was not possible, probably due to the very heterogeneous lithology in the 1979 scar. In this study, a very short SGD response in the form of a 214Bi increase could be measured by the underwater mass spectrometer KATERINA, installed about 10 m shallower, after rain events in November 2019. We now suggest that the instruments are recording data from different aquifers. The KATERINA system seems to be at the outcrop of the upper unconfined aquifer, showing an almost immediate response of groundwater discharge after rain events (Figure 9b, red arrows). On the other hand, piezometers 6a and b were installed at a deeper site connected to the lower confined aquifer, recording a slower, delayed increase in pore pressure representing groundwater flow (Figure 9b, orange arrows). The existence of the two aquifers has been shown in earlier studies, but a clear distinction has never been shown in previous SGD results in the area. Ref. [8] presented pore water data from eight cores taken in the scar and was able to show that freshening of pore water occurs within the failed area but not on cores from the intact plateau bordering the failure scar. By using the underground model of [26] and the new insights from this study, we present an updated map of SGD areas linked to their possible sources (Figure 9a). Considering the different depths of the cores taken and the instrument installations, the freshening of pore water or the increase in pore pressure can be associated with either the upper unconfined aquifer (<~30 m depths) or the lower confined aquifer (>~40 m depths). The two northernmost locations (Figure 9a, red dots) could therefore be linked to the upper unconfined aquifer, whereas five of the other six spots are related to the lower confined aquifer (Figure 9a, orange dots). One core location is between those two benchmarks and could not be categorized (Figure 9a, orange/red dot). The authors of [10] were the first to publish possible SGD data from the area using salinity and temperature measurements in the water column. Four locations around the Nice airport showed the freshening of sea water, for which one location was close enough to be incorporated in this study and could be linked to possible SGD from the lower confined aquifer (Figure 9a, southeastern orange dot). Higher than usual groundwater charging may cause pore pressure increases and could act as a possible trigger mechanism for further submarine landslides in the area. Many studies have been conducted using these pore pressure records in Factor of Safety (FoS) calculations and models [7,9,29,37] and need to be taken into account in the future.

4.4. Quantifying SGD

By using the equations for volumetric activity shown in [11,38], the concentrations of the groundwater tracer 214Bi were calculated for the test run of the KATERINA system in 2018 and the longer-term deployment in 2019. During the testing phase, the instrument was placed at the northern rim of the scar (Figure 1a, Point 2), where most of the counts per hour (277) were measured, yielding a 214Bi concentration of 902 Bq/m3. As expected, seven to eight times lower values (114 Bq/m3) were recorded at the plateau, where SGD does not play a major role in the water composition. This low background concentration is consistent with the values (160 Bq/m3) presented in [38] at a site in the North Aegean Sea. However, the values recorded for SGD were significantly higher (1.4 kBq/m3) in [11]. This is expected when measuring at well-known SGD sites on the Mediterranean shoreline, where freshwater enters the marine realm through an underwater karst outcrop [4]. In choosing the deployment site in 2019, multiple factors had to be taken into account in the planning phase related to the very heterogeneous lithology in the area [19]. KATERINA was placed in the proximity of the SGD site in the scar identified in 2018 (Figure 1a, Point 4). As previously shown, a clear difference in the groundwater-tracing radionuclides could be recorded before and after rainfall. However, the maximum calculated volumetric activity (476 Bq/m3) is only half of what was measured in 2018. This further proves the presence of different lithologies within this small area. Hence, SGD occurrence is most likely very patchy in both space and time but is definitely significant for the regional hydrology.
Moreover, despite the occasional occurrence of GW seepage, there has been overwhelming evidence that freshened fluids occupy the pore space in the shallow sediments on the Nice shelf adjacent to the 1979 landslide scar. Marine expeditions over the past decades, which took place during all seasons in an arbitrary fashion, have provided unambiguous evidence for freshened pore waters in gravity and Kullenberg cores in or adjacent to the arcuate-shaped headwall of the 1979 landslide event ([39,40,41] among others). Note that this observation is valid regardless of potential variations in the hydraulic gradient due to precipitation and snow melt. During a recent project between Univ. Nice, IFREMER and MARUM Bremen, we also carried out cruises offshore Nice and noticed abundant flares in the bottom waters south of Nice airport, so fluid escape is evidenced (S. Migeon, unpublished data). On one hand, this finding supports results from differential bathymetry, which attest to continuous small-scale mass wasting events on the Nice Slope [42], which seem to be associated with excess pore pressures in the sediment. On the other hand, the long-term piezometer results at Seamonice [7] provide quantitative evidence of how close some sub-bottom pore pressure fluctuations bring the effective stress in the sediment to the point of brittle failure. We hence interpret our radionuclide counts and the wealth of findings near the airport as an indication of an enhanced vulnerability of the region for future slope failure.

5. Conclusions

Earlier studies of the Nice Airport Landslide suggested that the Var aquifer system, specifically a shallower, non-confined aquifer, has an impact on the shallow submarine slope. Utilizing an underwater mass spectrometer (KATERINA), we were able to detect and quantify radioisotopes in several locations in the former 1979 landslide scar and also on stable plateau areas offshore Nice. Several rainfall events led to the washing out of radon from the terrestrial environment and transported it into the marine realm, where radon daughters were recorded over time. Hence, a clear relationship between precipitation, Var River discharge, salinity and groundwater discharge could be shown in this work. Further time series analysis supports this hypothesis, showing a strong link between SGD and tidal fluctuations. The calculated volumetric activities from the groundwater tracing elements clearly show the differences between dry and wet periods. The heterogeneity in the area’s lithology could be further validated through the strongly varying concentrations with time and space. A direct link to overpressured sediment layers, possibly resulting in failure and slope movement, could not be made in this study, probably due to the heterogeneous nature of the underground. Unfortunately, the system stopped working at the end of 2019 after communication cables were destroyed and had to be disconnected from the EMSO Ligure-Nice observatory. Hence, we anticipate more widely applicable results and longer time series in the future using a refurbished, self-contained version of KATERINA.

Author Contributions

Conceptualization, C.W. and A.K.; methodology, C.W.; software, C.W.; validation, C.W. and A.K.; formal analysis, C.W.; investigation, C.W.; resources, C.W.; data curation, C.W.; writing—original draft preparation, C.W.; writing—review and editing, A.K.; visualization, C.W.; supervision, A.K.; project administration, A.K.; funding acquisition, A.K. All authors have read and agreed to the published version of the manuscript.

Funding

This study was carried out in the framework of the MODAL project ANR-17-CE01-0017—http://modal-project.cnrs.fr/ (accessed on 2 July 2011). Funding was received through the Franco-German research program by ANR (Agence Nationale de la Recherche) and DFG (grant KO 2108/26-1, Deutsche Forschungsgemeinschaft). Piezometer data and infrastructure funding were received from EMSO-ERIC, namely the Ligure-Nice network through EMSO-Link TNA project MODAL.

Data Availability Statement

The data are available on request. The data presented in this study are available on request to Christoph Witt.

Acknowledgments

In the course of this work, several research cruises were carried out by GENAVIR, and special thanks go out to the captains and many crew members contributing to this study for their round-the-clock work on RVs L’Europe and Pourquois pas? between 2018 and 2021. We thank our French partners, Nabil Sultan, Sebastien Garziglia, Sebastien Migeon, Xavier Bompais and Patrice Woerther, for discussions and support during the MODAL project period. Timo Fleischmann and Christian Zöllner helped build and deploy the long-term instruments for this study. Furthermore, we want to thank Christos Tsabaris (HCMR Greece) for the tremendous groundwork he has conducted in this field and his continuous support in handling our technical and scientific challenges regarding KATERINA. The manuscript benefited from language refinements by Matt Ikari.

Conflicts of Interest

The authors declare no conflict of interest.

References

  1. Maslin, M.; Owen, M.; Day, S.; Long, D. Linking continental-slope failures and climate change: Testing the clathrate gun hypothesis. Geology 2004, 32, 53–56. [Google Scholar] [CrossRef]
  2. Burnett, W.C.; Aggarwal, P.K.; Aureli, A.; Bokuniewicz, H.; Cable, J.E.; Charette, M.A.; Kontar, E.; Krupa, S.; Kulkarni, K.M.; Loveless, A.; et al. Quantifying submarine groundwater discharge in the coastal zone via multiple methods. Sci. Total Environ. 2006, 367, 498–543. [Google Scholar] [CrossRef] [PubMed]
  3. Kim, G.; Hwang, D.-W. Tidal pumping of groundwater into the coastal ocean revealed from submarine 222Rn and CH4 monitoring. Geophys. Res. Lett. 2002, 29, 23-1–23-4. [Google Scholar] [CrossRef]
  4. Tsabaris, C.; Scholten, J.; Karageorgis, A.P.; Comanducci, J.F.; Georgopoulos, D.; Wee Kwong, L.L.; Patiris, D.L.; Papathanassiou, E. Underwater in situ measurements of radionuclides in selected submarine groundwater springs, Mediterranean Sea. Radiat. Prot. Dosim. 2010, 142, 273–281. [Google Scholar] [CrossRef]
  5. Anthony, E.J.; Julian, M. The 1979 Var Delta Landslide on the French Riviera: A Retrospective Analysis. J. Coast. Res. 1997, 13, 27–35. [Google Scholar]
  6. Kopf, A.J.; Kasten, S.; Blees, J. Geochemical Evidence for Groundwater-Charging of Slope Sediments: The Nice Airport 1979 Landslide and Tsunami Revisited. In Submarine Mass Movements and Their Consequences; Mosher, D.C., Shipp, R.C., Moscardelli, L., Chaytor, J.D., Baxter, C.D.P., Lee, H.J., Urgeles, R., Eds.; Springer: Dordrecht, The Netherlands, 2010; pp. 203–214. [Google Scholar] [CrossRef]
  7. Stegmann, S.; Sultan, N.; Kopf, A.; Apprioual, R.; Pelleau, P. Hydrogeology and its effect on slope stability along the coastal aquifer of Nice, France. Mar. Geol. 2011, 280, 168–181. [Google Scholar] [CrossRef]
  8. Oehler, T.; Mogollón, J.M.; Moosdorf, N.; Winkler, A.; Kopf, A.; Pichler, T. Submarine groundwater discharge within a landslide scar at the French Mediterranean coast. Estuar. Coast. Shelf Sci. 2017, 198, 128–137. [Google Scholar] [CrossRef]
  9. Sultan, N.; Garziglia, S.; Bompais, X.; Woerther, P.; Witt, C.; Kopf, A.; Migeon, S. Transient Groundwater Flow Through a Coastal Confined Aquifer and Its Impact on Nearshore Submarine Slope Instability. J. Geophys. Res. Earth Surf. 2020, 125, e2020JF005654. [Google Scholar] [CrossRef]
  10. Guglielmi, Y.; Prieur, L. Locating and estimating submarine freshwater discharge from an interstitial confined coastal aquifer by measurements at sea: Example from the lower Var valley, France. J. Hydrol. 1997, 190, 111–122. [Google Scholar] [CrossRef]
  11. Tsabaris, C.; Bagatelas, C.; Dakladas, T.; Papadopoulos, C.T.; Vlastou, R.; Chronis, G.T. An autonomous in situ detection system for radioactivity measurements in the marine environment. Appl. Radiat. Isot. 2008, 66, 1419–1426. [Google Scholar] [CrossRef]
  12. Burnett, W.C.; Dulaiova, H. Estimating the dynamics of groundwater input into the coastal zone via continuous radon-222 measurements. J. Environ. Radioact. 2003, 69, 21–35. [Google Scholar] [CrossRef] [PubMed]
  13. Jones, D.G. Development and application of marine gamma-ray measurements: A review. J. Environ. Radioact. 2001, 53, 313–333. [Google Scholar] [CrossRef] [PubMed]
  14. Santos, I.R.; Dimova, N.; Peterson, R.N.; Mwashote, B.; Chanton, J.; Burnett, W.C. Extended time series measurements of submarine groundwater discharge tracers (222Rn and CH4) at a coastal site in Florida. Mar. Chem. 2009, 113, 137–147. [Google Scholar] [CrossRef]
  15. Charette, M.A.; Moore, W.S.; Burnett, W.C. Chapter 5 Uranium- and Thorium-Series Nuclides as Tracers of Submarine Groundwater Discharge. In Radioactivity in the Environment; Krishnaswami, S., Cochran, J.K., Eds.; Elsevier: Amsterdam, The Netherlands, 2008; Volume 13, pp. 155–191. [Google Scholar] [CrossRef]
  16. Savoye, B.; Piper, D.J.W.; Droz, L. Plio-Pleistocene evolution of the Var deep-sea fan off the French Riviera. Mar. Pet. Geol. 1993, 10, 550–571. [Google Scholar] [CrossRef]
  17. Lofi, J.; Pezard, P.; Bouchette, F.; Raynal, O.; Sabatier, P.; Denchik, N.; Levannier, A.; Dezileau, L.; Certain, R. Integrated Onshore-Offshore Investigation of a Mediterranean Layered Coastal Aquifer. Ground Water 2012, 51, 550–561. [Google Scholar] [CrossRef]
  18. Lofi, J.; Rabineau, M.; Gorini, C.; Berne, S.; Clauzon, G. Plio–Quaternary prograding clinoform wedges of the western Gulf of Lion continental margin (NW Mediterranean) after the Messinian Salinity Crisis. Mar. Geol. 2003, 198, 289–317. [Google Scholar] [CrossRef]
  19. Kopf, A.J.; Stegmann, S.; Garziglia, S.; Henry, P.; Dennielou, B.; Haas, S.; Weber, K.-C. Soft sediment deformation in the shallow submarine slope off Nice (France) as a result of a variably charged Pliocene aquifer and mass wasting processes. Sediment. Geol. 2016, 344, 290–309. [Google Scholar] [CrossRef]
  20. Migeon, S.; Cattaneo, A.; Hassoun, V.; Dano, A.; Casedevant, A.; Ruellan, E. Failure Processes and Gravity-Flow Transformation Revealed by High-Resolution AUV Swath Bathymetry on the Nice Continental Slope (Ligurian Sea). In Submarine Mass Movements and Their Consequences; Springer: Dordrecht, The Netherlands, 2012; pp. 451–461. [Google Scholar] [CrossRef]
  21. Klaucke, I.; Savoye, B.; Cochonat, P. Patterns and processes of sediment dispersal on the continental slope off Nice, SE France. Mar. Geol. 2000, 162, 405–422. [Google Scholar] [CrossRef]
  22. Sultan, N.; Cochonat, P.; Canals, M.; Cattaneo, A.; Dennielou, B.; Haflidason, H.; Laberg, J.S.; Long, D.; Mienert, J.; Trincardi, F.; et al. Triggering mechanisms of slope instability processes and sediment failures on continental margins: A geotechnical approach. Mar. Geol. 2004, 213, 291–321. [Google Scholar] [CrossRef]
  23. Guglielmi, Y. Hydrogéologie Des Aquifères Plio-Quaternaires de la Basse Vallée du Var (Alpes-Maritimes, France): Contrôle Néotectonique Des Écoulements Souterrains: L’outil, Chimique et Isotopique, Pour L’étude du Fonctionnement et de la Vulnérabilité Des Aquifères. Ph.D. Thesis, Université d’Avignon et des pays de Vaucluse, Avignon, France, 1993. [Google Scholar]
  24. Guglielmi, Y.; Mudry, J. Estimation of Spatial and Temporal Variability of Recharge Fluxes to an Alluvial Aquifer in a Fore Land Area by Water Chemistry and Isotopes. Ground Water 1996, 34, 1017–1023. [Google Scholar] [CrossRef]
  25. Potot, C.; Féraud, G.; Schärer, U.; Barats, A.; Durrieu, G.; Le Poupon, C.; Travi, Y.; Simler, R. Groundwater and river baseline quality using major, trace elements, organic carbon and Sr–Pb–O isotopes in a Mediterranean catchment: The case of the Lower Var Valley (south-eastern France). J. Hydrol. 2012, 472–473, 126–147. [Google Scholar] [CrossRef]
  26. Emily, A.; Tennevin, G.; Mangan, C. Etude Hydrogéologique des Nappes Profondes de la Basse Vallée du Var (Alpes-Maritimes); Conseil Général Alpes Maritimes: Nice, France, 2010; 53p. [Google Scholar]
  27. SolsEssais. Sols Essais Internal Report; SolsEssais: Aix-en-Provence, France, 1994. [Google Scholar]
  28. Leynaud, D.; Sultan, N. 3-D slope stability analysis: A probability approach applied to the nice slope (SE France). Mar. Geol. 2010, 269, 89–106. [Google Scholar] [CrossRef]
  29. Dan, G.; Sultan, N.; Savoye, B. The 1979 Nice harbour catastrophe revisited: Trigger mechanism inferred from geotechnical measurements and numerical modelling. Mar. Geol. 2007, 245, 40–64. [Google Scholar] [CrossRef]
  30. Mulder, T.; Savoye, B.; Syvitski, J.P.M. Numerical modelling of a mid-sized gravity flow: The 1979 Nice turbidity current (dynamics, processes, sediment budget and seafloor impact). Sedimentology 1997, 44, 305–326. [Google Scholar] [CrossRef]
  31. Ioualalen, M.; Migeon, S.; Sardoux, O. Landslide tsunami vulnerability in the Ligurian Sea: Case study of the 1979 October 16 Nice international airport submarine landslide and of identified geological mass failures. Geophys. J. Int. 2010, 181, 724–740. [Google Scholar] [CrossRef]
  32. Dugan, B.; Flemings, P. Fluid flow and stability of the US continental slope offshore New Jersey from the Pleistocene to the present. Geofluids 2002, 2, 137–146. [Google Scholar] [CrossRef]
  33. Bompais, X.; Garziglia, S.; Blandin, J.; Hello, Y. EMSO-Ligure Nice, a Coastal Cabled 540 Observatory Dedicated to the Study of Slope Stability. In Proceedings of the OCEANS 2019—Marseille, Marseille, France, 17–20 June 2019. [Google Scholar]
  34. Garziglia, S.; Sultan, N.; Thomas, Y.; Ker, S.; Marsset, B.; Bompais, X.; Woerther, P.; Witt, C.; Kopf, A.; Apprioual, R. Assessing Spatio-Temporal Variability of Free Gas in Surficial Cohesive Sediments Using Tidal Pressure Fluctuations. J. Geophys. Res. Earth Surf. 2021, 126, e2021JF006131. [Google Scholar] [CrossRef]
  35. Tsabaris, C.; Patiris, D.L.; Karageorgis, A.P.; Eleftheriou, G.; Papadopoulos, V.P.; Georgopoulos, D.; Papathanassiou, E.; Povinec, P.P. In-situ radionuclide characterization of a submarine groundwater discharge site at Kalogria Bay, Stoupa, Greece. J. Environ. Radioact. 2012, 108, 50–59. [Google Scholar] [CrossRef]
  36. Du, M. Modélisation Intégrée Des Ecoulements Souterrains et Des Echanges Nappe-Rivière Dans la Basse Vallée du Var (Integrated Hydraulic Modeling of Groundwater Flow and River-Aquifer Exchanges in the Lower Valley of Var River). Ph.D. Thesis, Université Nice-Sophia Antipolis, Nice, France, 2016. [Google Scholar]
  37. Roesner, A.; Wiemer Gv Kreiter, S.; Wenau, S.; Wu, T.-W.; Courboulex, F.; Spiess, V.; Kopf, A. Impact of seismicity on Nice slope stability—Ligurian Basin, SE France: A geotechnical revisit. Landslides 2019, 16, 23–35. [Google Scholar] [CrossRef]
  38. Tsabaris, C.; Ballas, D. On line gamma-ray spectrometry at open sea. Appl. Radiat. Isot. 2005, 62, 83–89. [Google Scholar] [CrossRef]
  39. Kopf, A.; Alexandrakis, E.C.C.; Blees, J.; Bogus, K.; Dennielou, B.; Förster, A.; Girault, F.E.; Haarmann, T.; Hanff, H.; Hentscher, M.; et al. Report and preliminary results of meteor cruise M73/1: LIMA-LAMO. In Berichte aus dem Fachbereich Geowissenschaften der Universität Bremen, Bremen (Germany), No. 264; Bremen University: Bremen, Germany, 2008; 169p, Available online: https://www.google.com/url?sa=t&rct=j&q=&esrc=s&source=web&cd=&ved=2ahUKEwjR5I30sP-MAxV6SvEDHYFwNskQFnoECBkQAQ&url=https%3A%2F%2Fmedia.suub.uni-bremen.de%2Fbitstream%2Felib%2F3884%2F1%2F00010386.pdf&usg=AOvVaw1chPSfllumETTQqQBfxR9q&opi=89978449 (accessed on 27 April 2025).
  40. Kopf, A.; Apprioual, R.; Blandin, J.; Brulport, J.-P.; Crassous, P.; Fleischmann, T.; Förster, A.; Guyader, G.; Hammerschmidt, S.; Henry, P.; et al. Report and preliminary results of poseidon cruise P386: Nail (Nice Airport Landslide). In Berichte aus dem Fachbereich Geowissenschaften der Universität Bremen, Bremen (Germany), No. 271; Bremen University: Bremen, Germany, 2009; 161p, Available online: https://www.google.com/url?sa=t&rct=j&q=&esrc=s&source=web&cd=&ved=2ahUKEwisorWhzP-MAxUvBNsEHS8oJDAQFnoECA4QAQ&url=https%3A%2F%2Foceanrep.geomar.de%2Fid%2Feprint%2F25647%2F1%2FPOS_386.pdf&usg=AOvVaw0WdknSIlG2YeikQERxJ76X&opi=89978449 (accessed on 27 April 2025).
  41. Kopf, A.; Belke-Brea, M.; Ferentinos, G.; Fleischmann, T.; Geraga, M.; Kufner, S.; Schlenzek, S.; Steiner, A.; Tryon, M.; Wiemer, G. Report and preliminary results of rv poseidon cruise P429: Medfluids: Slope Stability, Mud volcanism, Faulting and Fluid Flow in the Eastern Mediterranean Sea (Cretan Sea, Mediterranean Ridge) and Ligurian Margin (Nice slope). In Berichte aus dem Fachbereich Geowissenschaften der Universität Bremen, Bremen (Germany), No. 286; Bremen University: Bremen, Germany, 2012; 80p, Available online: https://www.google.com/url?sa=t&rct=j&q=&esrc=s&source=web&cd=&ved=2ahUKEwja46O7zP-MAxW8SfEDHfedNwIQFnoECBwQAQ&url=https%3A%2F%2Fmedia.suub.uni-bremen.de%2Fbitstream%2Felib%2F3044%2F1%2F00103965-1.pdf&usg=AOvVaw0ixuQdMkntJZaz2ZqrMHVy&opi=89978449 (accessed on 27 April 2025).
  42. Kelner, M.; Migeon, S.; Tric, E.; Couboulex, F.; Dano, A.; Lebourg, T.; Taboada, A. Frequency and triggering of small-scale submarine landslides on decadal timescales: Analysis of 4D bathymetric data from the continental slope offshore Nice (France). Mar. Geol. 2016, 379, 281–297. [Google Scholar] [CrossRef]
Figure 1. (a): Overview map; 1—KATERINA-Seamonice; 2—KATERINA-Scar; 3—KATERINA-Plateau, 4—F3D2-KT-02; 5—CTD-2019; 6a—Seamonice (PZ1-N2); 6b—F3D2-PZ2L-02; 6c—ST5-PZ2L-01; 7—P4B; 8—Y6442015; 9—HA0102; 10—Profile A-A. (b): Onshore cross-section acquired through CPT measurements and boreholes (10) and NW-SE chirp profile through the 1979 landslide scar (9).
Jmse 13 00909 g001
Figure 2. (a): Sketch of KATERINA, CTD and housing on its frame. Dimensions: 1.2 × 0.5 × 0.7 m (L × W × H). (b): Photograph of the KATERINA frame on board of RV L’Europe. (c): Inset shows the station with its protective cover.
Jmse 13 00909 g002
Figure 3. (a): Hourly gamma-ray spectra of the three different test locations (Seamonice—blue, scar—orange, plateau—yellow). Groundwater tracer 214Bi peak located at 609 keV is best visible in the scar (orange). The peak of 40K, the dominant radionuclide present in seawater, can be seen at 1460 keV. (b): Averaged peak areas of 214Bi plotted over time. Three different amounts of groundwater tracer are present in the three different locations.
Jmse 13 00909 g003
Figure 4. Averaged peak areas of 214Bi plotted over time (blue). A 12 h average was calculated in order to suppress the noise (orange).
Jmse 13 00909 g004
Figure 5. (a): Raw data of all 7 pressure sensors of piezometer 6b. (b): De-tided pore pressure dataset showing short-term fluctuations. (c): FFT analysis results showing the congruence of tidal and pore pressure frequencies.
Jmse 13 00909 g005
Figure 6. Three rain events in October led to a high Var River discharge into the Mediterranean Sea (red) and were followed by an increase in groundwater level (black) and a drop in salinity (green). A small but clear increase in the groundwater tracer 214Bi was recorded (blue).
Jmse 13 00909 g006
Figure 7. Precipitation (red) shows several rain events during the recording period in the region. The continuous rise in groundwater (black) can be observed starting on 12 October. 214Bi (blue) started to increase suddenly at the same time. The piezometer (gray) only recorded short-term increases in pore pressure on all depth levels, either from the artesian pressure from the semi-confined aquifer or storm waves.
Jmse 13 00909 g007
Figure 8. FFT transformed 214Bi values over time into the frequency domain. Clear peaks for the main tidal constituents M2 (1.93 cpd) and M4 (3.86 cpd) are visible in the dataset.
Jmse 13 00909 g008
Figure 9. (a): Updated map of earlier (pore) water freshening sites linked to slow and fast SGD areas, respectively. (b): Underground model and chirp profile HA0102 with the two possible groundwater pathways (unconfined—red; confined—orange) leading to SGD. See text.
Jmse 13 00909 g009
Table 1. Measuring devices used in the framework of this study, with their associated coordinates, altitude and recording period.
#NameCoordinatesAltitude [m]Recording Period
Underwater mass spectrometer KATERINA
1KAT-SeamoniceN 43.6461, E 7.2185−406 h in November 2018
2KAT-ScarN 43.64725, E 7.21748−2914 h in November 2018
3KAT-PlateauN 43.643798, E 7.21862−196 h in November 2018
4F3D2-KT-02 N 43.64725, E 7.21748−2926 August 2019–07 November 2019
CTD—device
5CTD-2019N 43.64725, E 7.21748−2926 August 2019–07 November 2019
Offshore piezometer
6aSeamonice (PZ1-N2)N 43.6461, E 7.2185−4029 November 2006–03 November 2007
6bF3D2-PZ2L-02N 43.64592, E 7.21832−4023 August 2019–28 November 2019
6cST5-PZ2L-01N 43.64423, E 7.2192−1930 April 2015–today
Groundwater piezometer
7P4BN 43.69145, E 7.193981719 July 2005–today
Var discharge
8Y6442015N 43.66407, E 7.20003022 January 2016–today
Chirp
9HA0102N 43.64267, E 7.22291–
N 43.64832, E 7.21592
-25 August 2009
Geological profile
10Profile A-AN 43.66899, E 7.20002–
N 43.64742, E 7.21146
-[23,26]
Disclaimer/Publisher’s Note: The statements, opinions and data contained in all publications are solely those of the individual author(s) and contributor(s) and not of MDPI and/or the editor(s). MDPI and/or the editor(s) disclaim responsibility for any injury to people or property resulting from any ideas, methods, instructions or products referred to in the content.

