Article

Weak Underwater Signals’ Detection by the Unwrapped Instantaneous Phase

1
Italian National Institute of Oceanography and Experimental Geophysics—OGS, 34010 Trieste, Italy
2
Department of Mathematics, Computer Science and Geosciences, University of Trieste, 34100 Trieste, Italy
*
Author to whom correspondence should be addressed.
J. Mar. Sci. Eng. 2025, 13(5), 907; https://doi.org/10.3390/jmse13050907 (registering DOI)
Submission received: 8 April 2025 / Revised: 30 April 2025 / Accepted: 2 May 2025 / Published: 3 May 2025
(This article belongs to the Section Ocean Engineering)

Abstract

:
In marine seismic surveys, weak signals can be overlaid by stronger signals or even random noise. Detecting these signals can be challenging, especially when they are close to each other or partially overlapping. Several normalization methods have already been proposed, but they often lead to distortion. In this paper, we show that the unwrapped instantaneous phase of the associated analytical signal is an effective detection tool and validate it using synthetic and real data examples. This approach does not require user-defined parameters and therefore does not introduce personal bias in the results. We show that weak signals from submarine fluid plumes can be successfully detected by seismic surveys. These plumes can reveal anomalies in shallow sediments such as near-surface gas pockets and soft formations, which can severely affect offshore structures such as platforms and wind farms.

1. Introduction

The technological improvement of recording devices provides time series of data with a large dynamic range, i.e., with more and more significant digits. This increasing accuracy is challenged by noise, especially when weak signals are recorded. Several effective methods to overcome this problem have been presented in the literature, e.g., for seismic exploration (see [1,2,3,4,5,6], among many others) or for general processing problems [7]. Most of them suffer when strong and weak signals coexist. In this work, we apply a classical tool of time series analysis, namely the instantaneous phase, to the detection of weak signals. This method works particularly well when strong and weak signals are very close to each other and partially overlap, making their detection and interpretation difficult. A relevant example in offshore technology is underwater plumes of gas or other fluids emanating from shallow sediments with minimal differences in optical or physical properties. These plumes can be due to shallow gas pockets, which are very dangerous for the stability of offshore platforms. In other cases, they may indicate the release of freshwater or geothermal resources. Mapping and monitoring them is therefore essential information for technical planning, especially for wind farm foundations and geological hazards for offshore engineering [8,9,10,11,12,13,14,15]. For further details, we send the reader to the Guidelines of the International Association of Oil & Gas Producers [16].
The instantaneous phase ϕ t   is the phase of the complex (or analytic) signal c(t) associated with the time series s(t) of real numbers [17,18]:
ϕ(t) = Arg[c(t)] = Arg[s(t) + i H{s(t)}],
where H{.} indicates the Hilbert transform, t is the time, i is the imaginary unit, and Arg is the argument multifunction (see Appendix A for details). The analytic signal c(t) can be represented in polar coordinates in the complex plane as the product of a module A(t) and a complex exponential term with phase ϕ(t):
c(t) = A(t) e(t), where A(t) = |c(t)|.
In geophysical jargon, A(t) is referred to as the envelope and ϕ(t) as the instantaneous phase [19]. The calculation of the complex series c(t) from the real-valued s(t) is straightforward, but the reverse operation is ambiguous. The phase calculation from c(t) does not change when any number k 2π is added to it, and so k is conventionally set to zero, giving the so-called wrapped phase. In this way, discontinuities are introduced that limit the use of this attribute. Various algorithms have been proposed to compute appropriate values for k at these discontinuities, i.e., the unwrapping procedure [20,21,22,23]. These algorithms require arbitrary parameters that lead to user bias in the result. More recently, Poggiagliolmi and Vesnaver [24,25] introduced a simpler algorithm that depends only on the data, which is briefly summarized in the following section.

2. Materials and Methods

Dividing the analytical signal c(t) by its module A(t), we obtain a normalized analytic signal n(t):
n(t) = c(t)/A(t) = e(t).
Its time derivative n′(t) is as follows:
n′(t) = e(t) i ϕ′(t),
where the time derivative ϕ′(t) of the instantaneous phase is the instantaneous frequency. We can multiply both members of (4) by −i n*(t), where n*(t) is the complex conjugate of n(t), obtaining the following:
i   n * ( t ) n ( t ) = i 2   n ( t )   n * ( t )   ϕ t   = ϕ t .
Equation (5) provides the instantaneous frequency of the analytic signal c(t). The instantaneous phase ϕ(t) is obtained by its integral as a function of the elapsed time t:
ϕ t   = 0 t ϕ τ d τ
Equations (5) and (6) allow computing the instantaneous frequency and phase without any user-defined parameters.
The instantaneous frequency is proportional to the centroid f c t of the instantaneous spectrum [26,27,28,29]:
f C t = 1 2   π ϕ t .
The instantaneous frequency is mostly positive, but in a few cases it may be negative too (see Appendix A). Its integral (6), therefore, provides values for the unwrapped instantaneous phase, which usually increase with time.
A relevant property of both instantaneous phase and frequency is their invariance with respect to the signal amplitude. One way to prove it is to go back to the analytic signal definitions (1) and (2). For a scaled version cl(t) = l c(t) of the original signal c(t), its instantaneous phase ϕl(t) is as follows:
ϕl(t) = Arg[cl(t)] = Arg[l c(t)] = Arg[c(t)] = ϕ(t).
As a consequence, this invariance holds for its time derivative too, i.e., the instantaneous frequency. This invariance is a key to detecting weak signals.
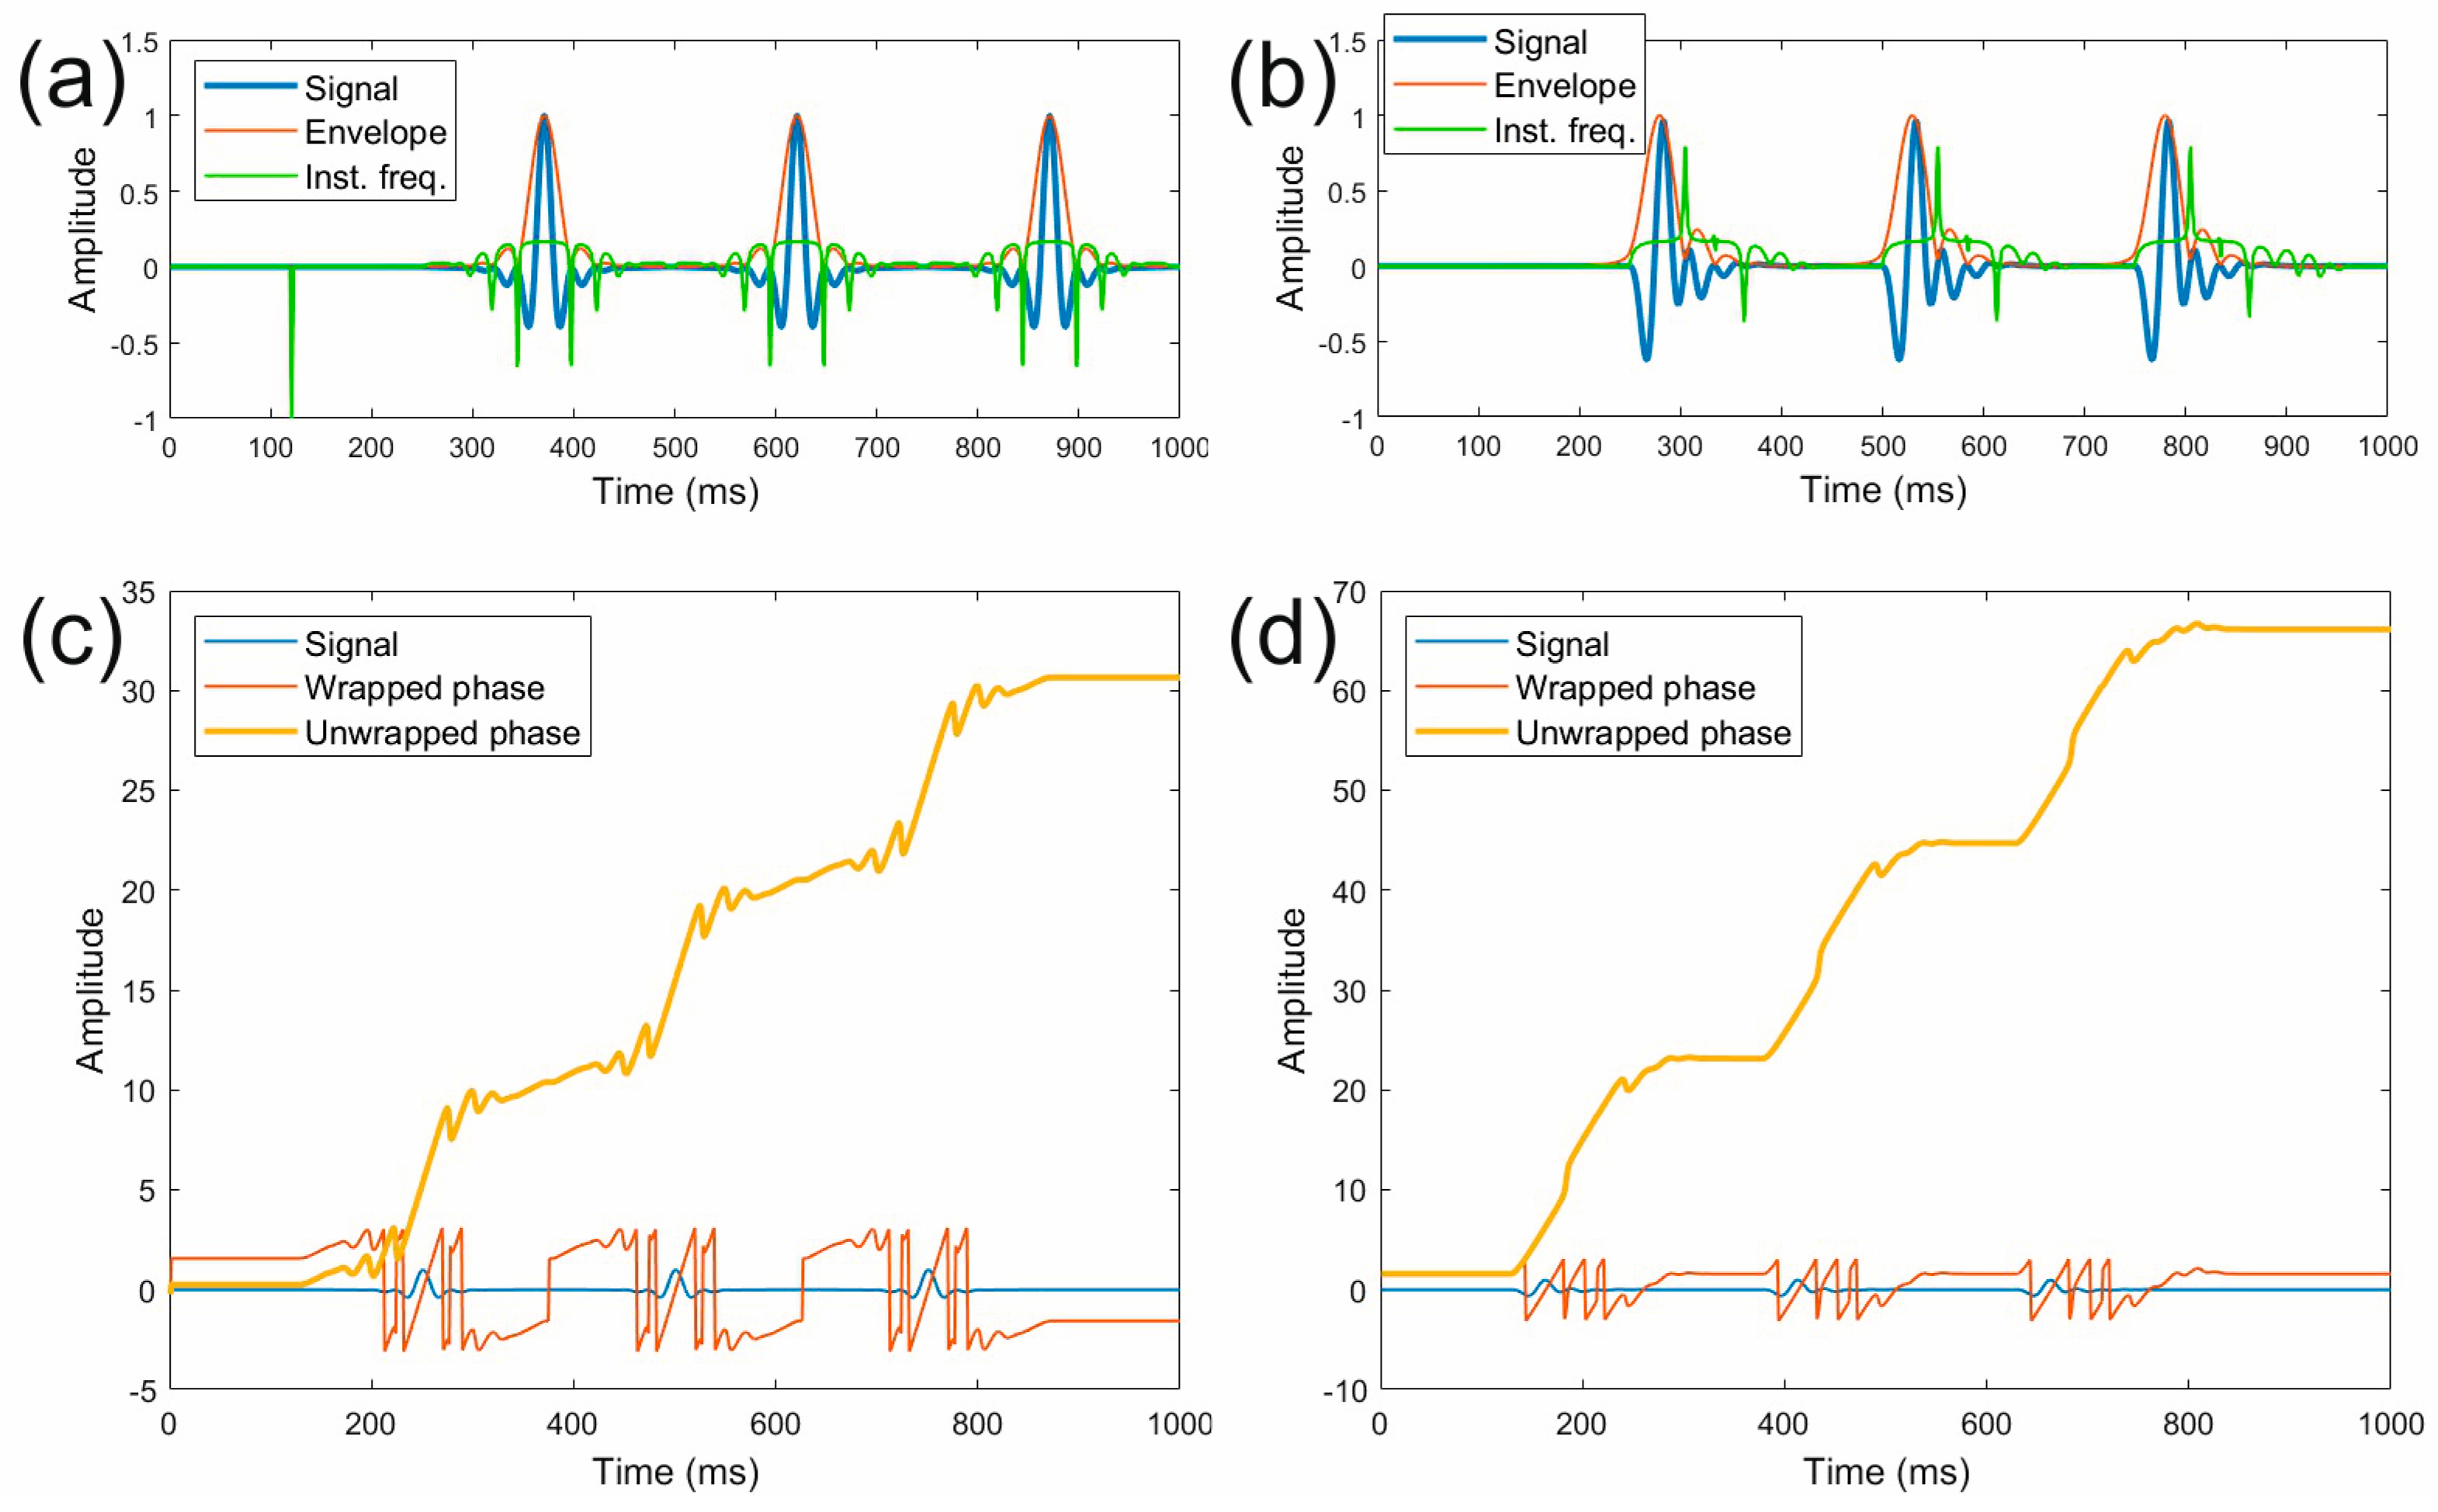
Figure 1 shows the wrapped and unwrapped instantaneous phase for two typical seismic signals, i.e., a symmetric zero-phase wavelet and a physically more realistic minimum-phase wavelet (blue lines). Envelope (in red) and instantaneous frequency (in green) are displayed in the top row. Seismic sources such as Boomer and airguns emit minimum-phase signals, while the zero-phase signals are obtained by sweep correlation from Vibroseis or Chirp recordings [30,31,32,33,34,35,36]. Both wavelets have the same sampling interval of 1 ms and a frequency band limited by an Ormsby filter with corner frequencies of 10, 20, 80, and 100 Hz, which are typical for deep seismic exploration. In both cases, the strong increase of the unwrapped instantaneous phase (in yellow) at the main lobe of the signals is noticeable, which remains in a plateau after the end of the signal. In contrast, the simple wrapped phase (in red) is much more difficult to interpret.
Figure 2 illustrates a key property of the instantaneous phase. We modeled three signals at one-quarter, one-half, and three-quarters of the acquisition time, using both zero-phase and minimum-phase wavelets (blue lines). At each signal arrival time, the instantaneous phase reaches a higher step in both cases (Figure 2c,d). The curves differ not only in their slight oscillations, but also in the scale: the maximum of the amplitude axis is twice as high in the minimum-phase recording as in the zero-phase recording. It is also noticeable that the wrapped phase is identical for both cases (red line in Figure 2c,d), so that a limited time window cannot distinguish them, while they are clearly different for the unwrapped phase. Thus, the unwrapped instantaneous phase is a kind of clock that not only detects weak signals but also preserves a memory of the past. This happens because most values of the instantaneous frequency are positive, except for a few narrow negative spikes. In Appendix A, we show when and why this happens. The integral for each wavelet type is generally positive during the signal span, with some ripple at the spikes, and constant when no signal is present. In Figure 2a, a single-value spike can be seen at about 120 ms, which is due to numerical instabilities. The record values in this range are about 1-13, i.e., 130 dB lower than the maxima.
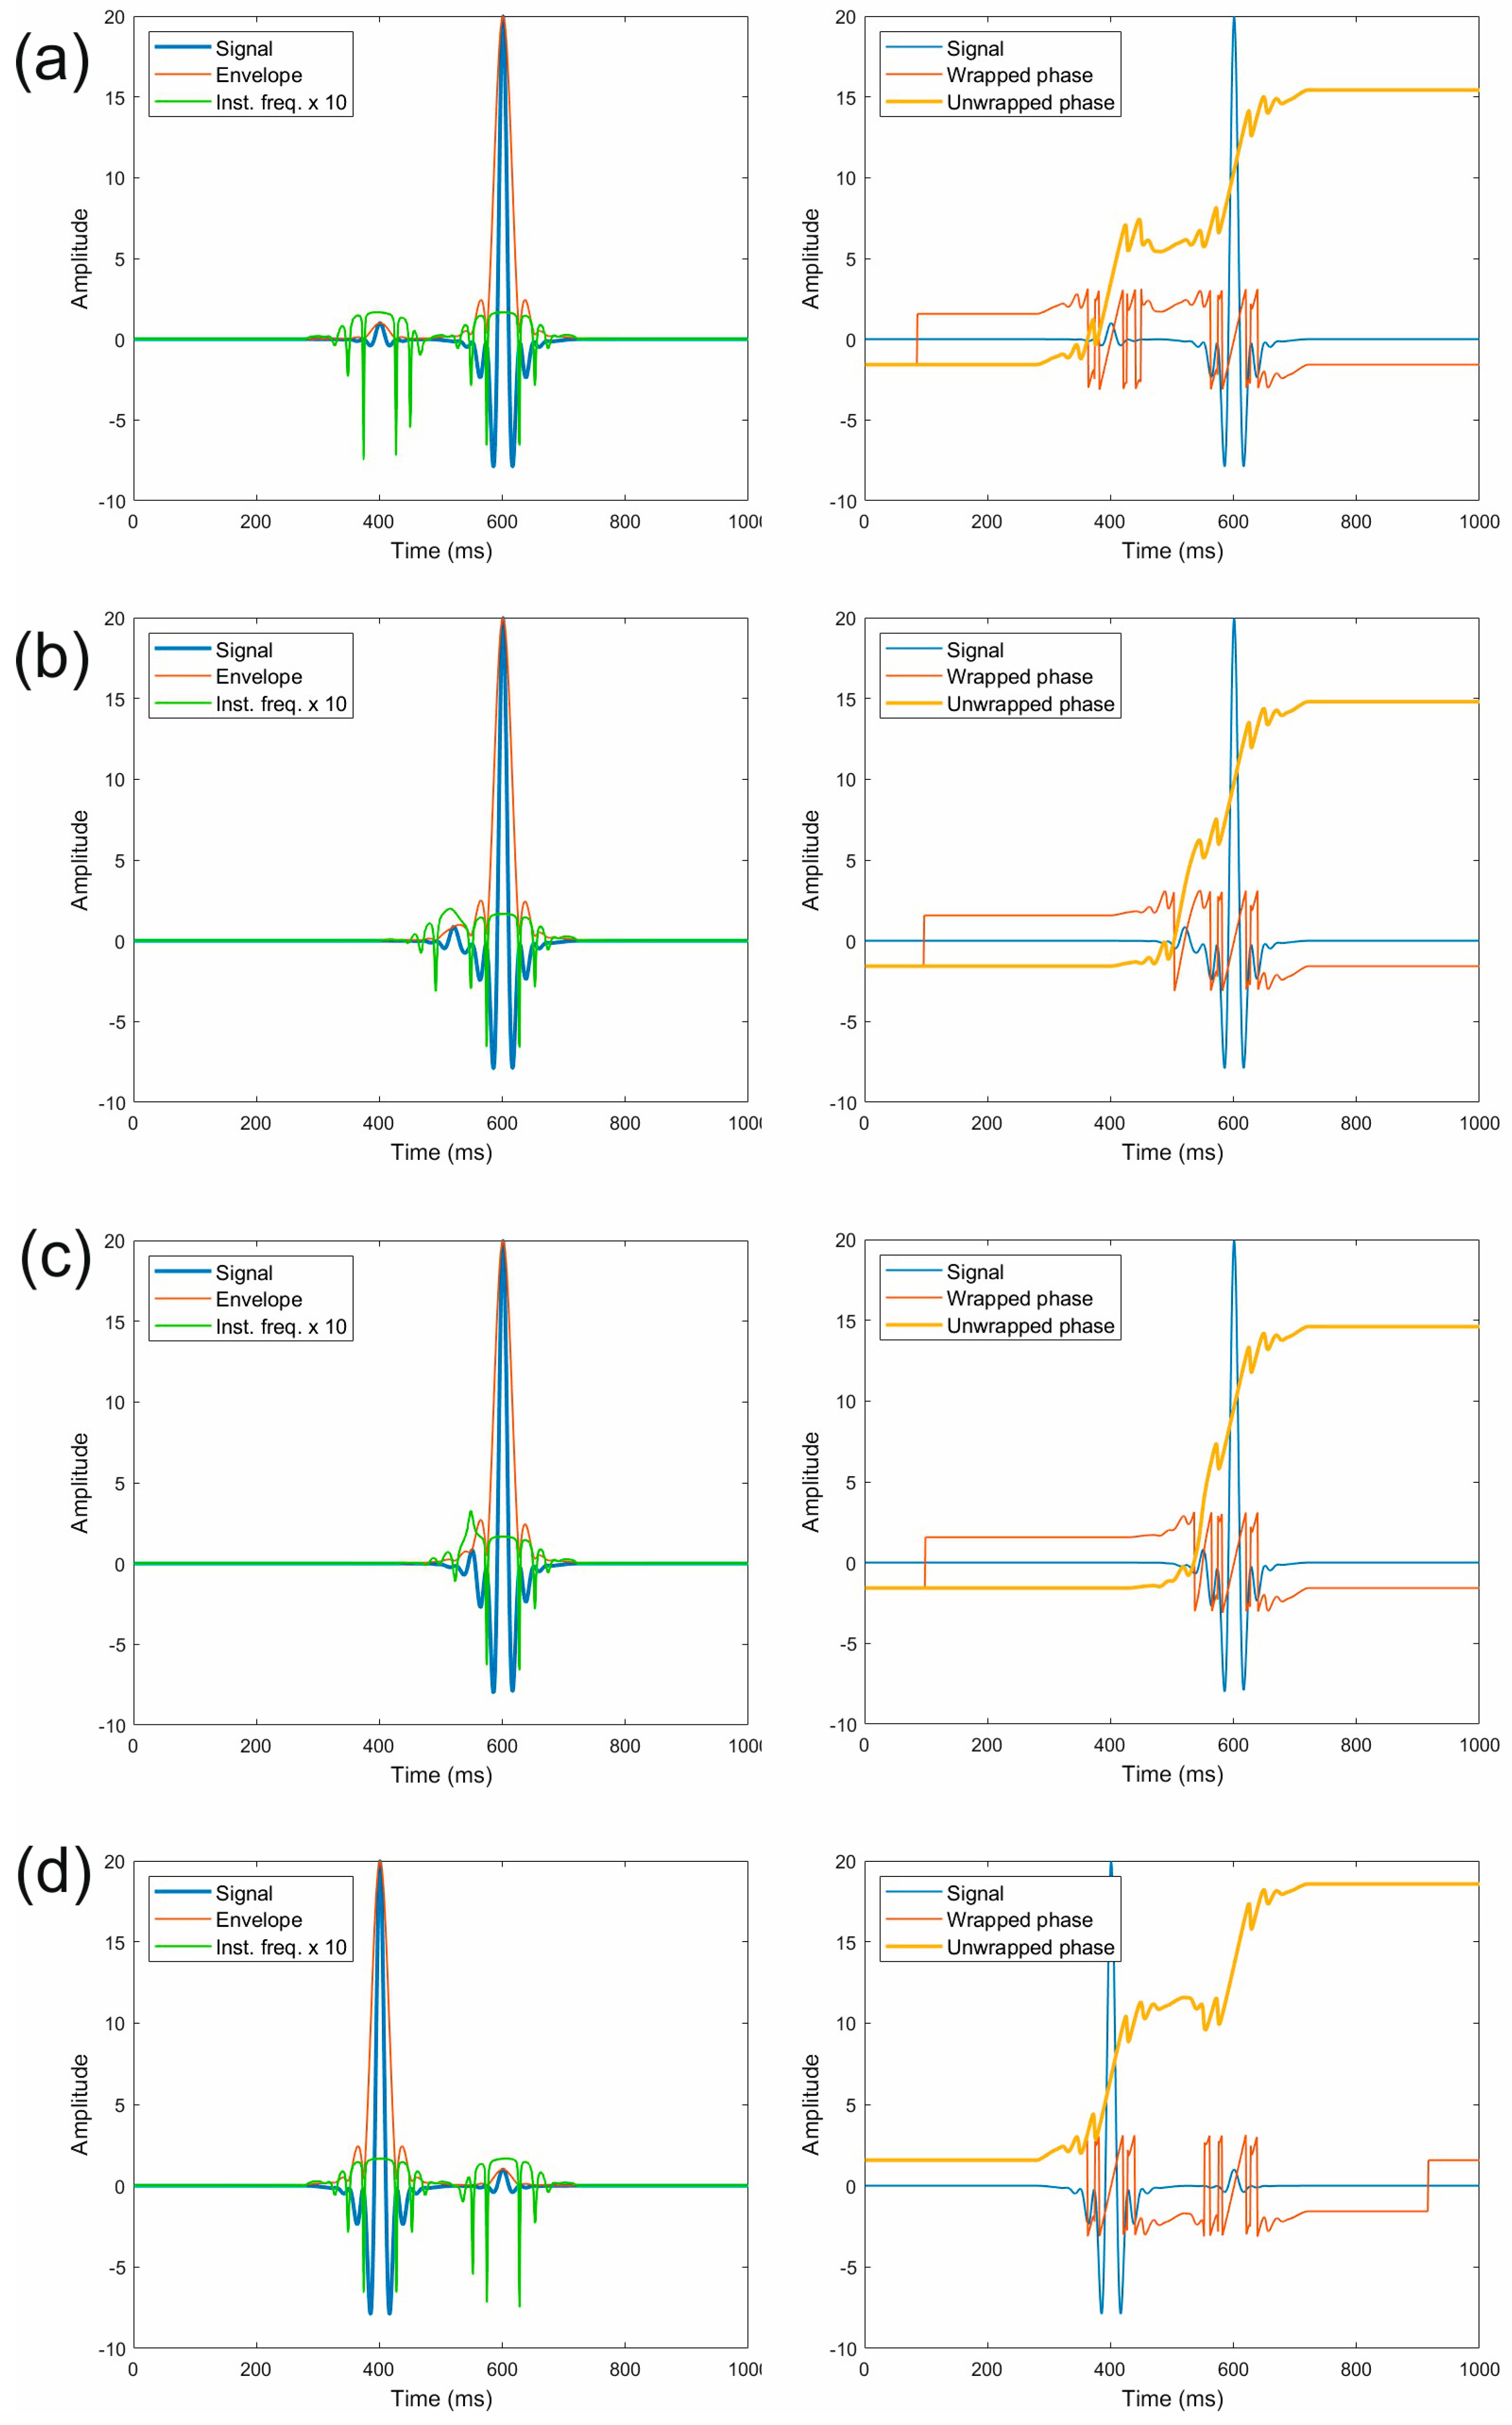
Figure 3 shows a weak and a strong minimum-phase signal separated by four different intervals. The main peak of the strong signal is located at 600 ms, while the weaker one is at 400 ms (Figure 3a), 520 ms (Figure 3b), and 550 ms (Figure 3c). The amplitude of the stronger signal is 20 times larger than that of the weaker one. In the figures, we multiplied the instantaneous frequency (green line) by a factor of 10 to make it better visible. Figure 3a in particular shows that the maximum amplitude of the instantaneous frequency and the shape are almost identical for both signals. If we swap a strong and a weak signal (Figure 3d), we can easily recognize the latter by the instantaneous phase, as a clear step similar to that in Figure 3a can be seen. This shows that the signal order is not relevant for the proposed approach.
In the first case at the top, the weaker signal is barely visible and could be mistaken for one of the side lobes of the larger signal. Its envelope (red line on the left) is well separated from that of the stronger signal, so in principle it could be sufficient to detect it. However, the separation is much more visible in the unwrapped instantaneous phase (yellow line), with a clear plateau for each of the two signals. When the two signals overlap (Figure 3b), but the main lobes of their envelopes are still distinct, the unwrapped phase remains a better indicator. Beyond this limit (Figure 3c), the interpretation becomes questionable, and the weak signal can hardly be distinguished from the side lobes of the stronger one.
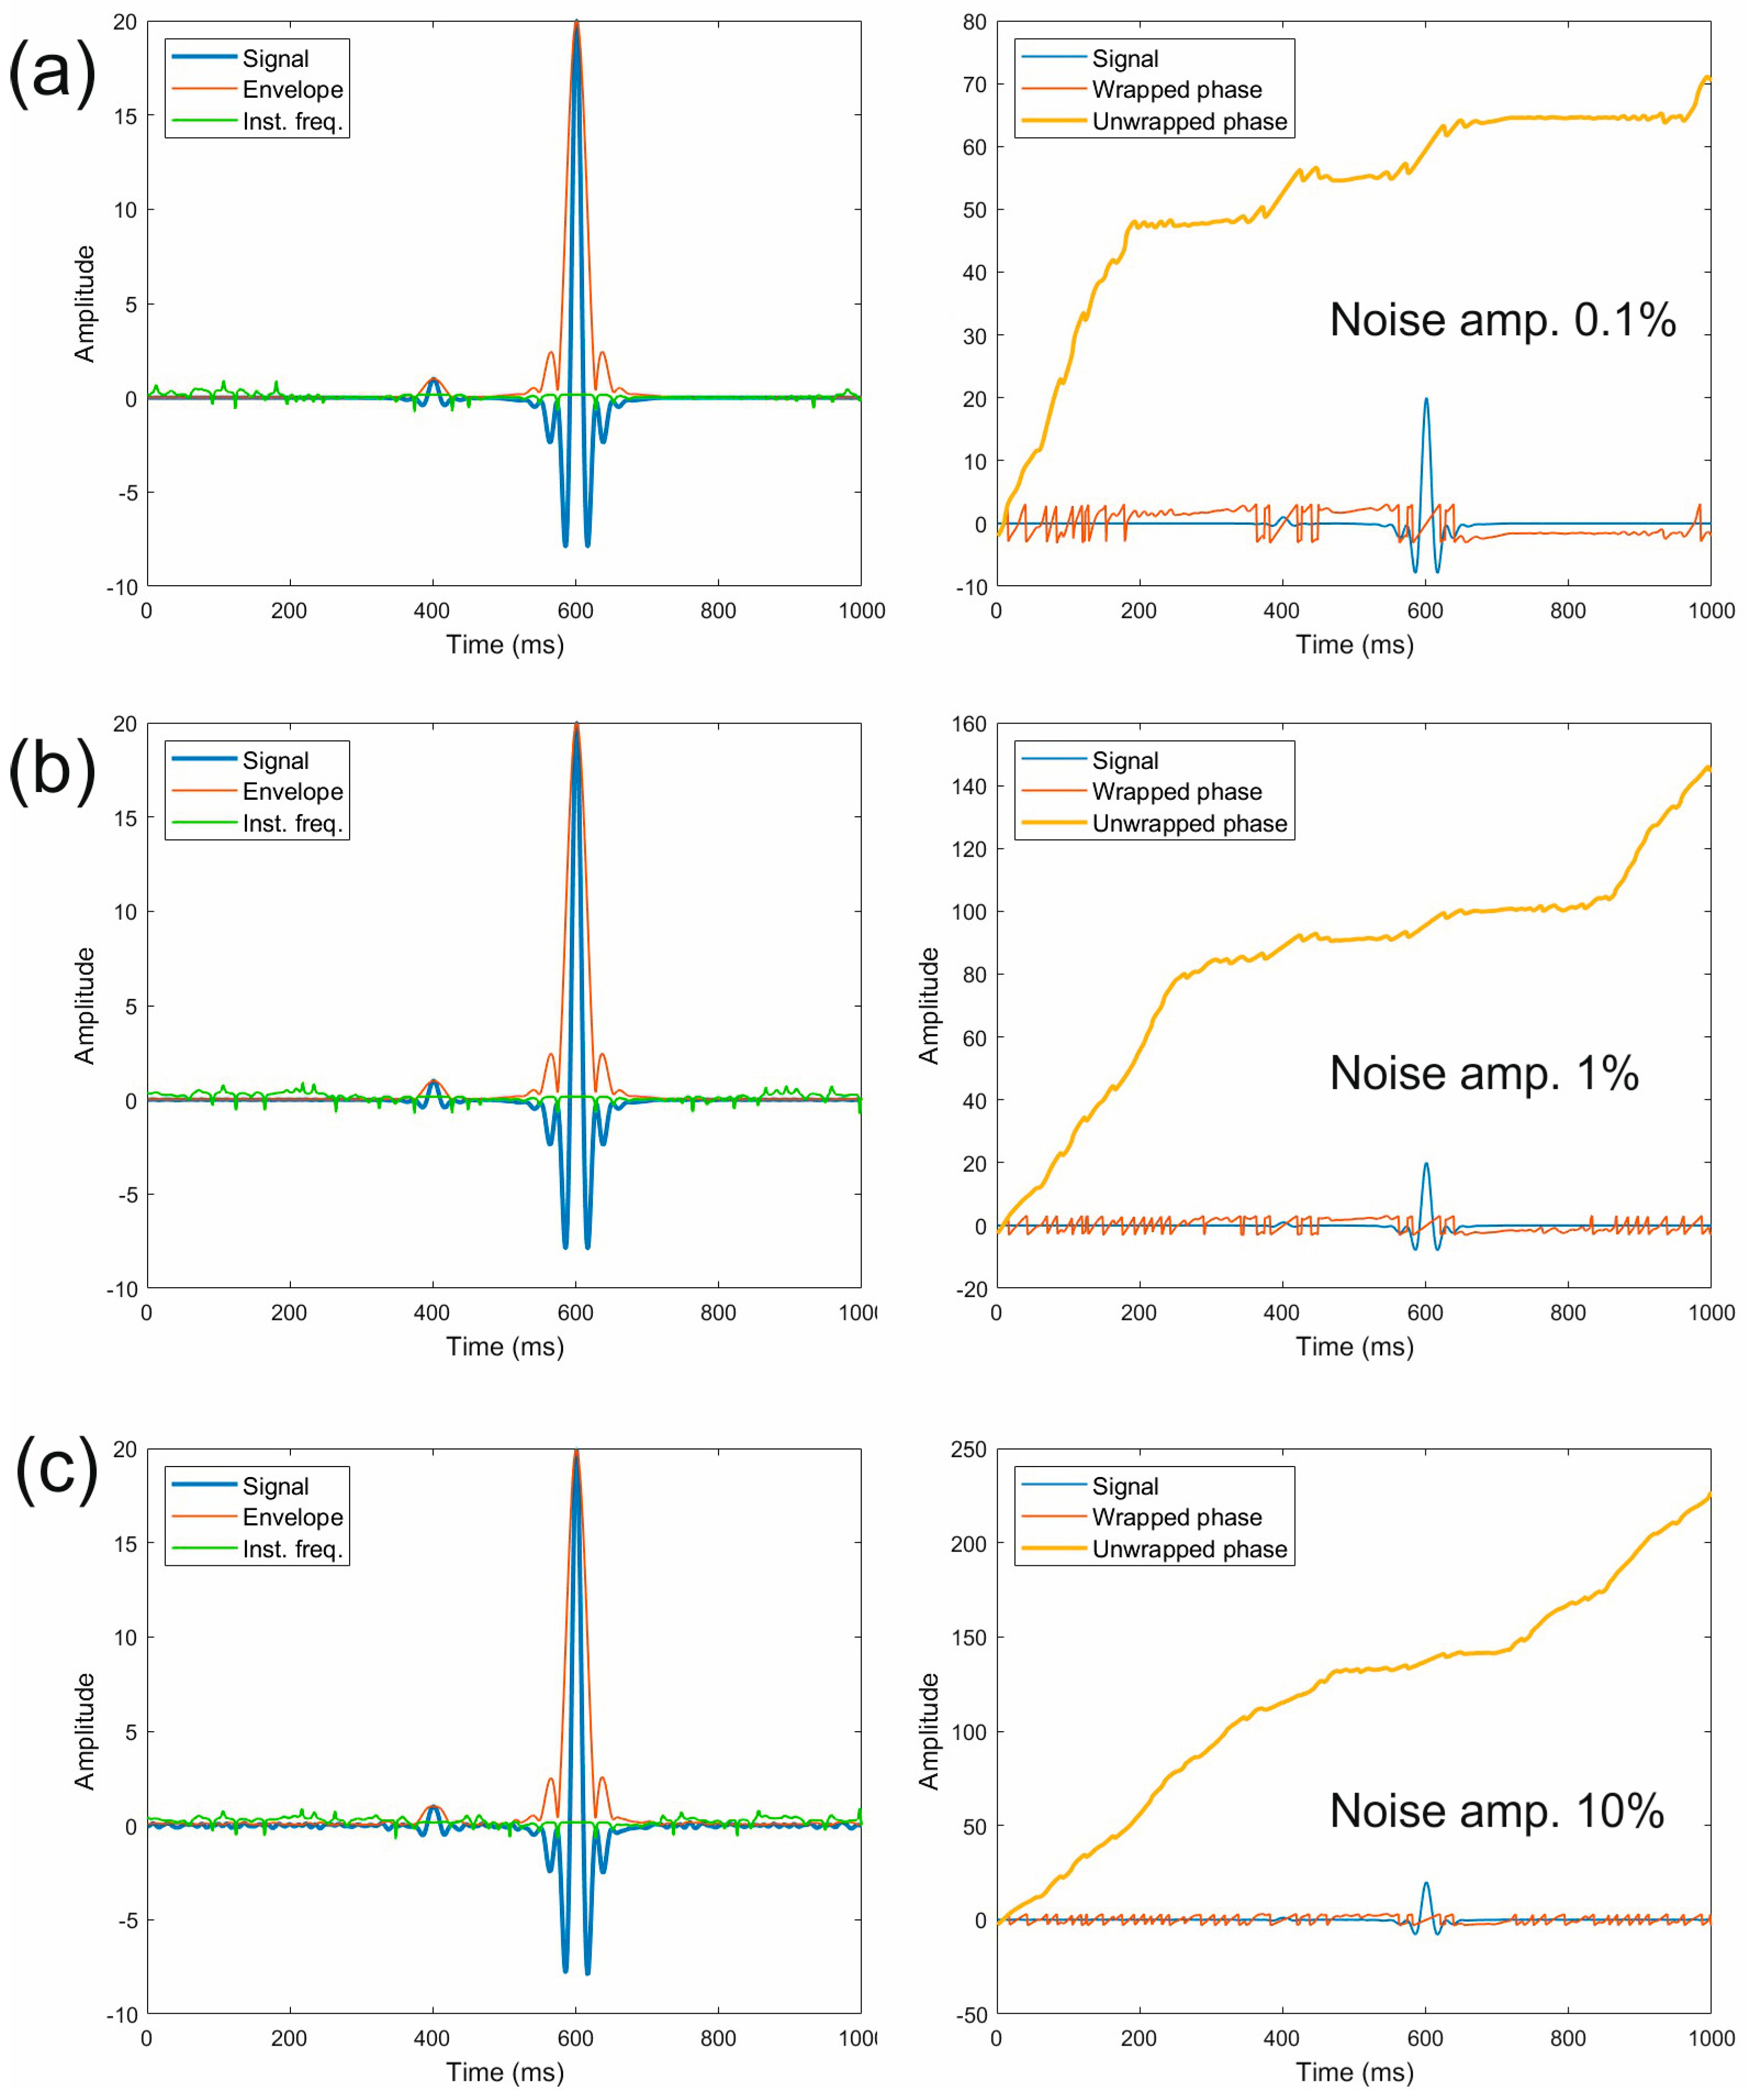
Ambient noise always affects the experimental data and is a disadvantage if it spans the same frequency band as the signal. To test its influence on the proposed approach, we added zero-mean random noise with the same frequency band as the signal and filtered it with a trapezoidal Ormsby filter with corner frequencies of 10, 20, 80, and 100 Hz (Figure 4). We downscaled the noise so that its maximum amplitude was 0.1%, 1%, and 10% of the amplitude of the weaker signal at 420 ms. When the noise contribution is very low (0.1% in Figure 4a), we see the steps and plateaus in the instantaneous phase associated with the two signals. We also notice a steep rise on the left side in the unwrapped phase (yellow line) and large oscillations in the wrapped phase (red line), which extend to the entire trace when the percentage of noise increases (Figure 4b,c). At an intermediate level of 1%, we can still distinguish the steps (Figure 4b), but their interpretation becomes difficult and finally impossible at a level of 10% (Figure 4c). Therefore, 1% is an order of magnitude for an acceptable noise level to successfully apply this method. This level is not high, but it is compatible with most standard quality surveys.

3. Results

The use of the unwrapped instantaneous phase to detect weak signals, which are usually overlain by stronger ones, can be validated by the detection of fluid plumes and local temperature anomalies in seawater within high-resolution seismic surveys [37]. Very strong signals are recorded from direct arrivals, seafloor and surface reflections, and their multiples. The amplitude of the backscattered signal is proportional to the reflection coefficients. Setting the direct arrival to 1 gives about 0.99 for the reflection at the sea surface and values between 0.03 for soft, muddy sediments and 0.45 for oceanic basalts. Usual values for seafloor reflectivity are around 0.15. The highest plume reflection coefficients occur in a contrast between cold water with low salinity and hot, salty water, and are 0.028, although values of 0.01 are more realistic [38]. The corresponding signals are therefore at least an order of magnitude smaller than other reflections, as in the last example in the previous section.
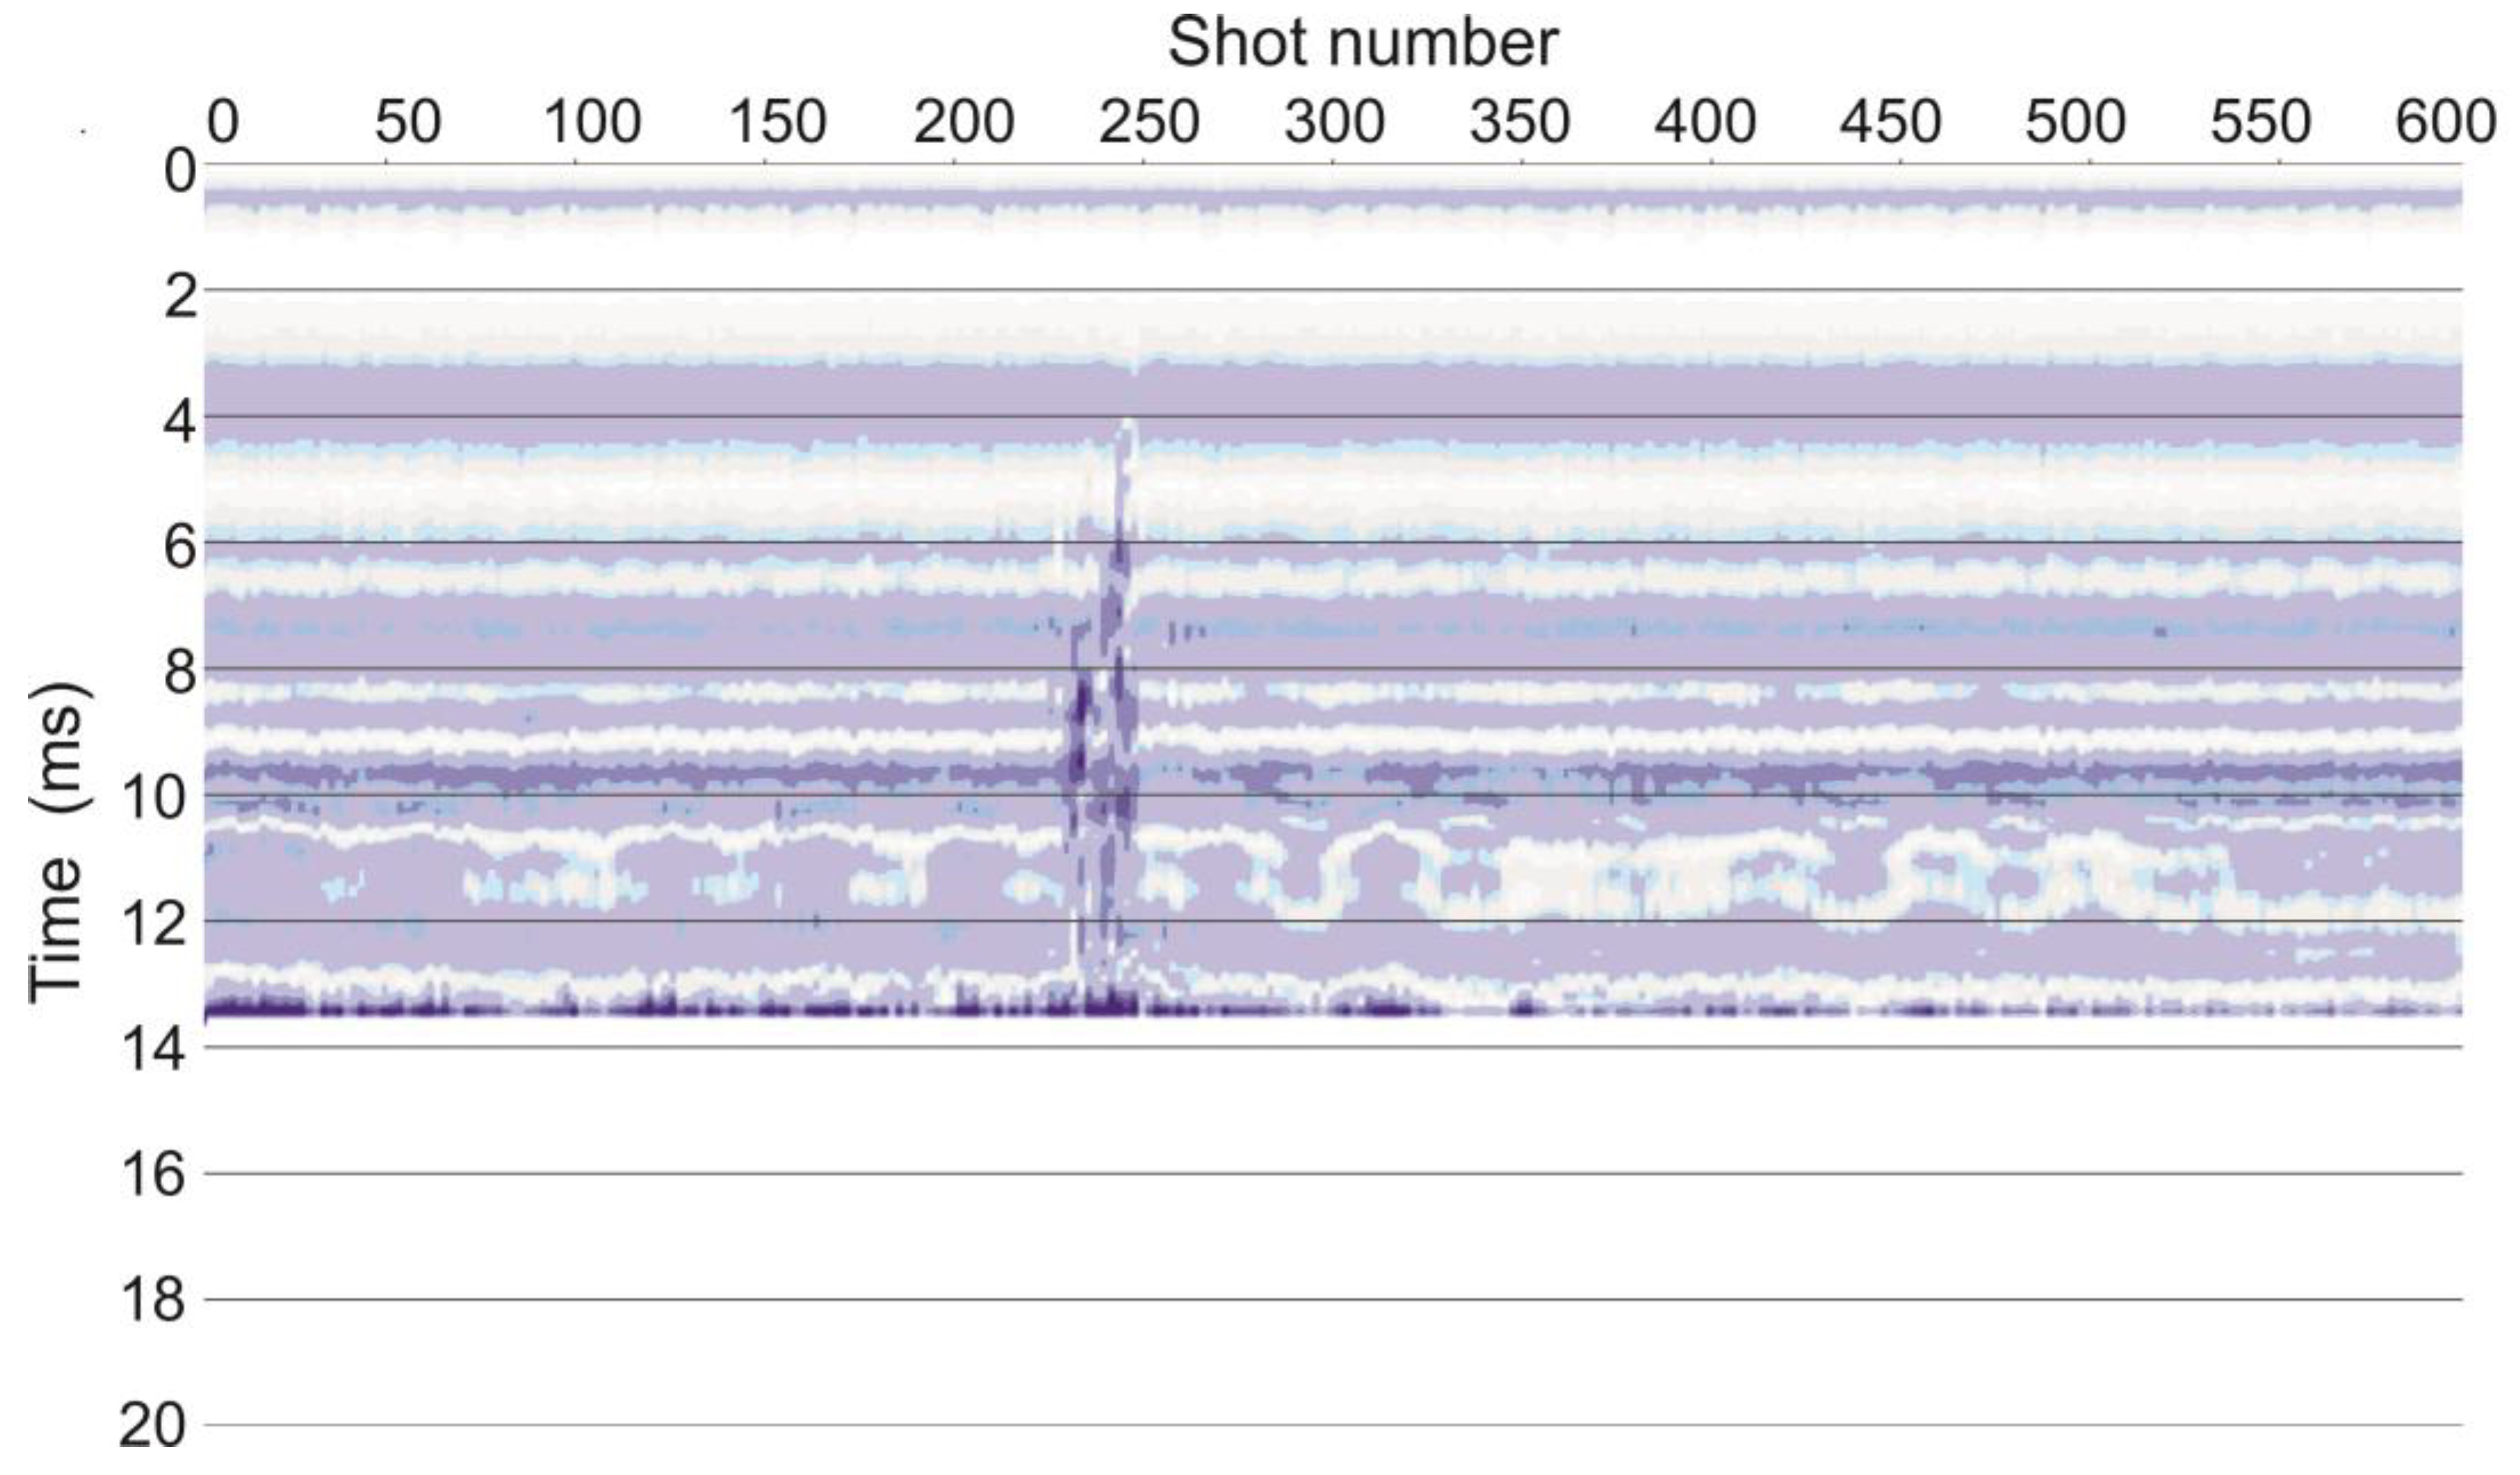
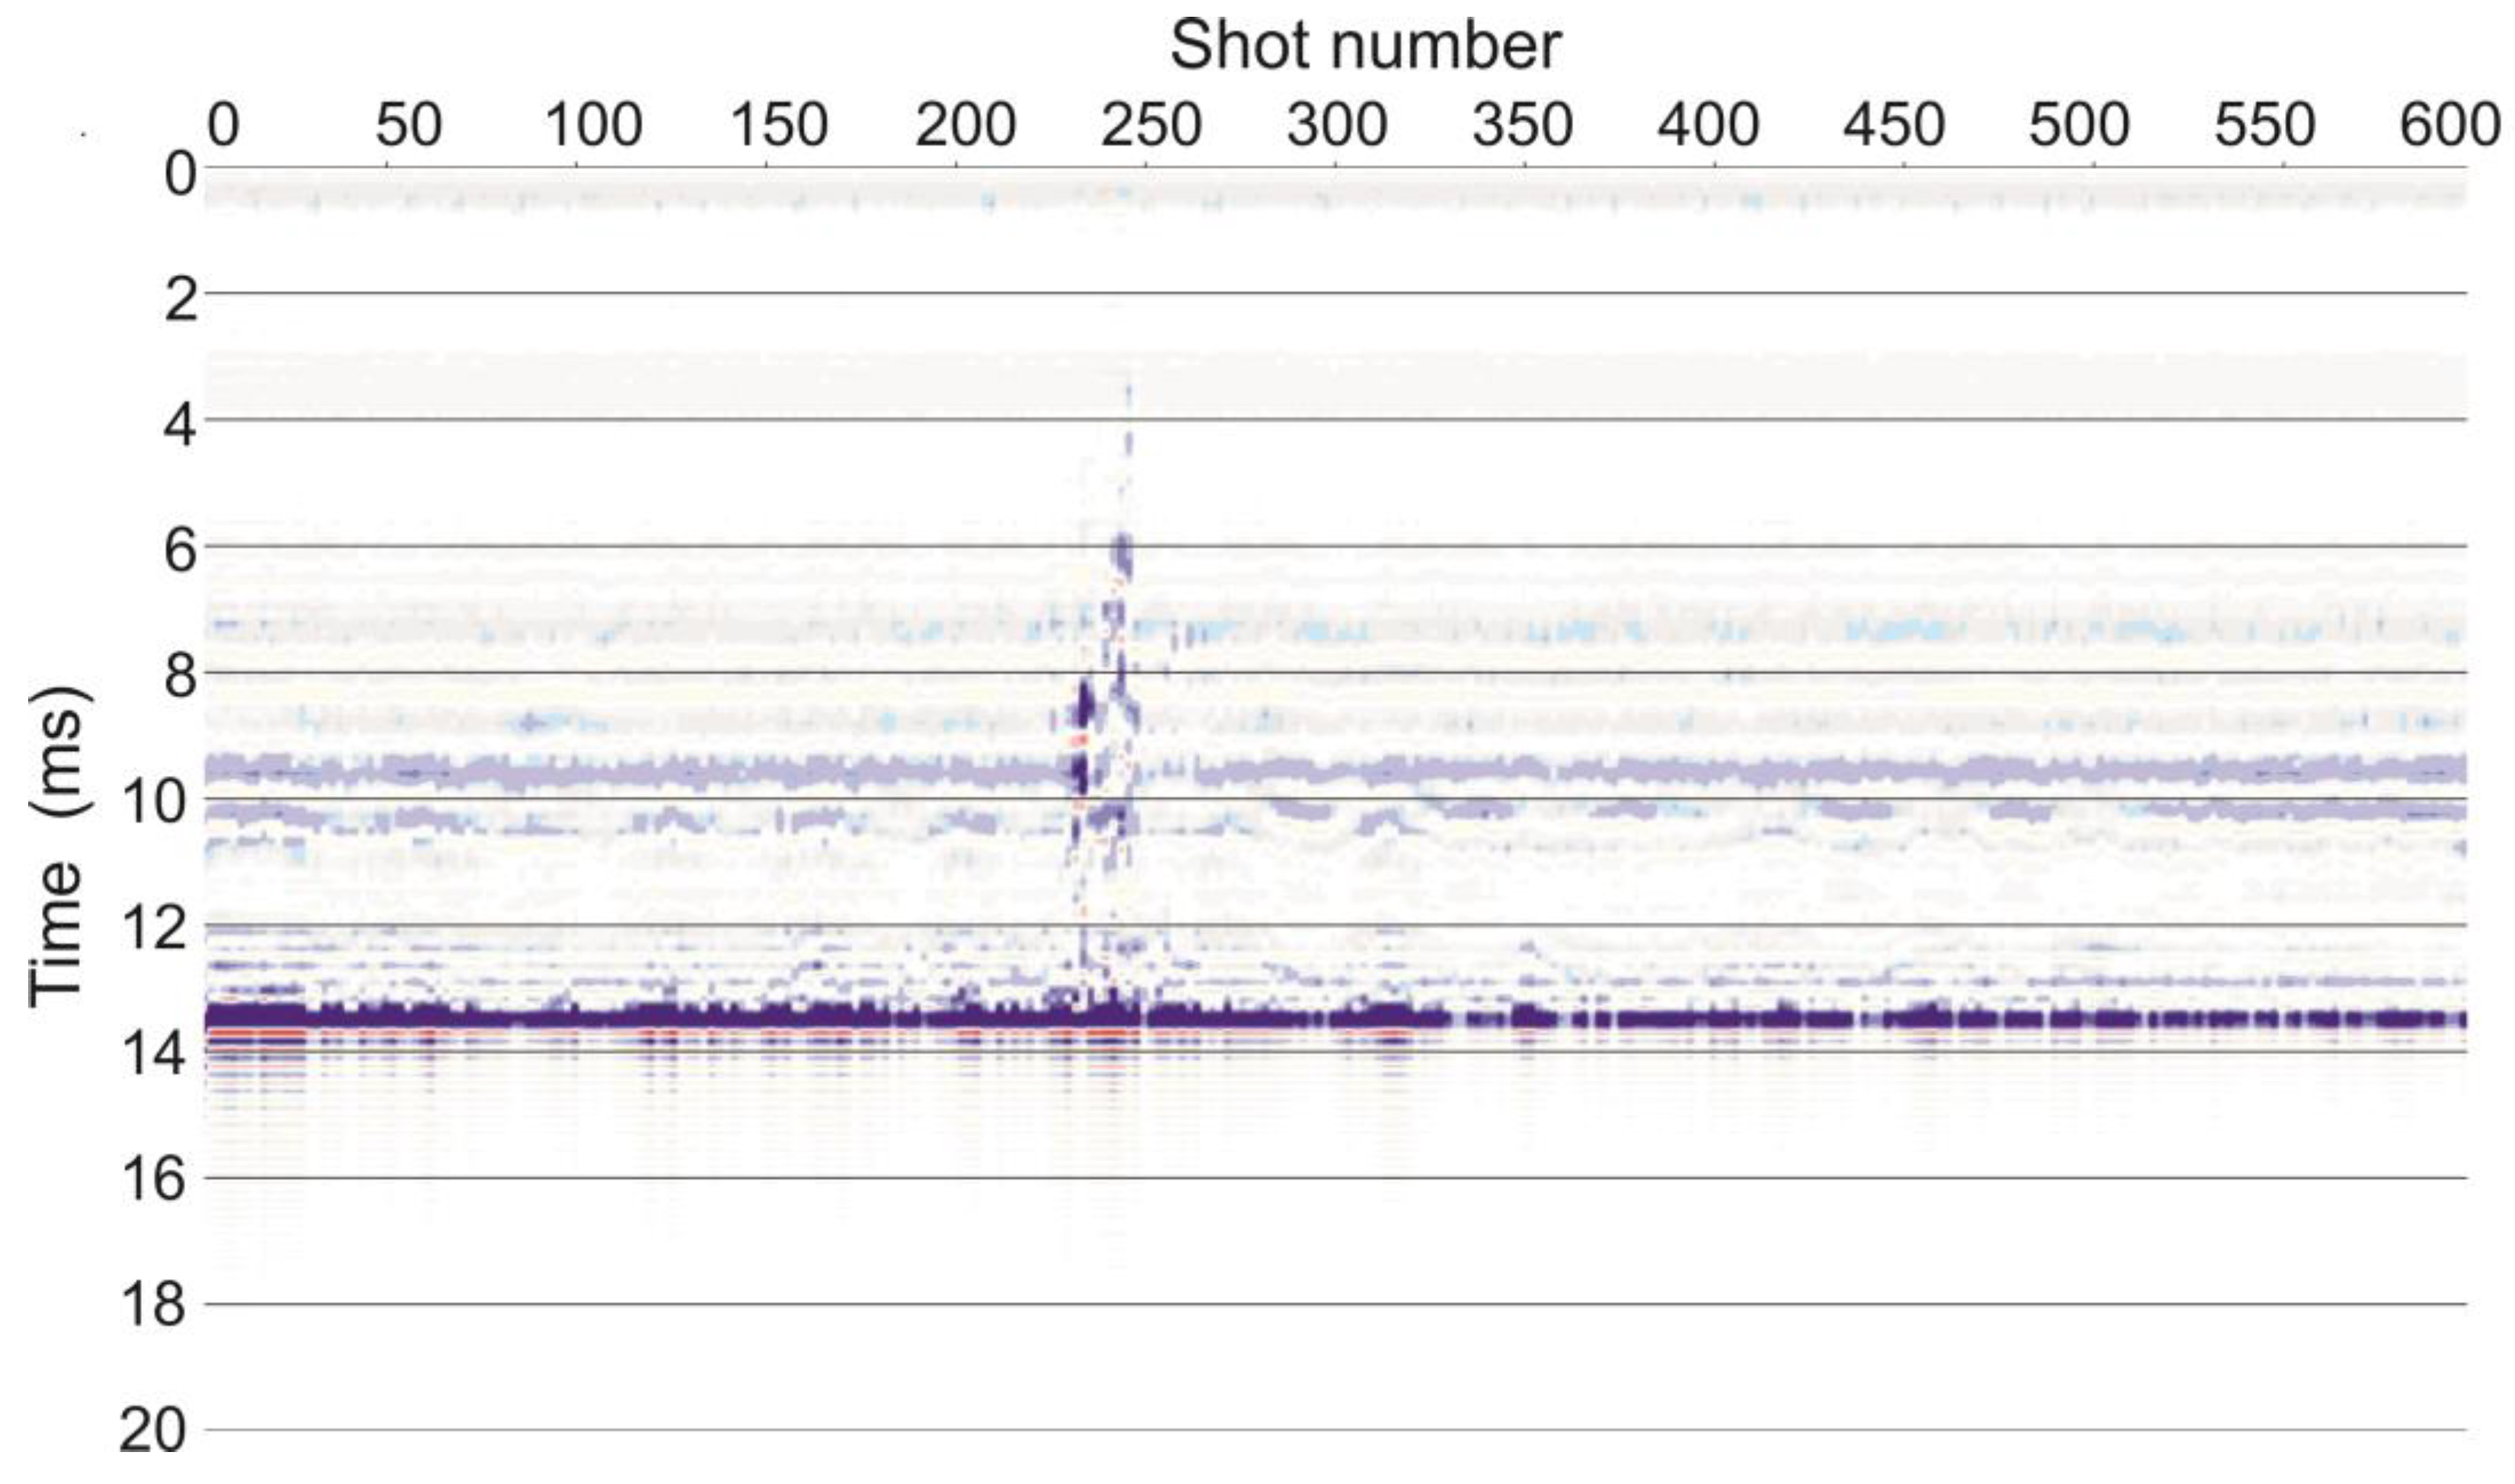
Figure 5 displays a seismic image obtained by a Chirp source emitting a sweep of frequencies, which is processed and converted to a zero-phase signal. The seismic profile was acquired by the vessel OGS-Explora in the northern Adriatic Sea. The acquisition system is a Datasonics CAP-6651 Chirp III model produced by Teledyne Benthos (Falmouth, MA, USA), comprising a 4 × 4 array of transducers. These transducers both emit and record the signals, and thus the records are a perfect zero-offset case. The emitted sweep is correlated and stored by a Teledyne Sonarwiz recording system, which also calculates the envelope. For this reason, the recorded Chirp values are positive or zero. The sampling interval is 132 μs in time and 0.5 m along the profile, while the frequency band ranges from 70 to 2000 Hz. We applied low-cut filtering to remove the low-frequency noise and compensated for the geometrical spreading of the seawater by multiplying each sample by its travel time [39]. The P-velocity of the seawater is about 1500 m/s, and the water depth is 10 m. The reflections from the seafloor and underlying sediments (at and below 14 ms) are much stronger than the weak plume between 6 and 12 ms in the central part, around the shot point 240. Three weak horizontal reflections are barely visible in the water layer at 2, 5m, and 9.5 ms, which is due to water layers with different properties in terms of temperature, density, and salinity.
To emphasize the weak reflections, in a first step, the stronger signal just below the seafloor is muted, i.e., set to zero (Figure 6). For this data, we calculated the instantaneous frequency and the unwrapped instantaneous phase. The instantaneous frequency provides a clear and sharp image of the plume near shot 240 (Figure 7). Of particular interest is its longer branch at the shot point 250, which extends from the seafloor to 3 ms. At 2 ms, it almost touches the interface before disappearing. At this depth (about 2.2 m), the difference in acoustic impedance between the plume and the shallow water layer becomes negligible. Independent ongoing studies (Martina Busetti, personal communication) have proven that this plume is due to low-density cold water penetrating into hotter, saltier water.
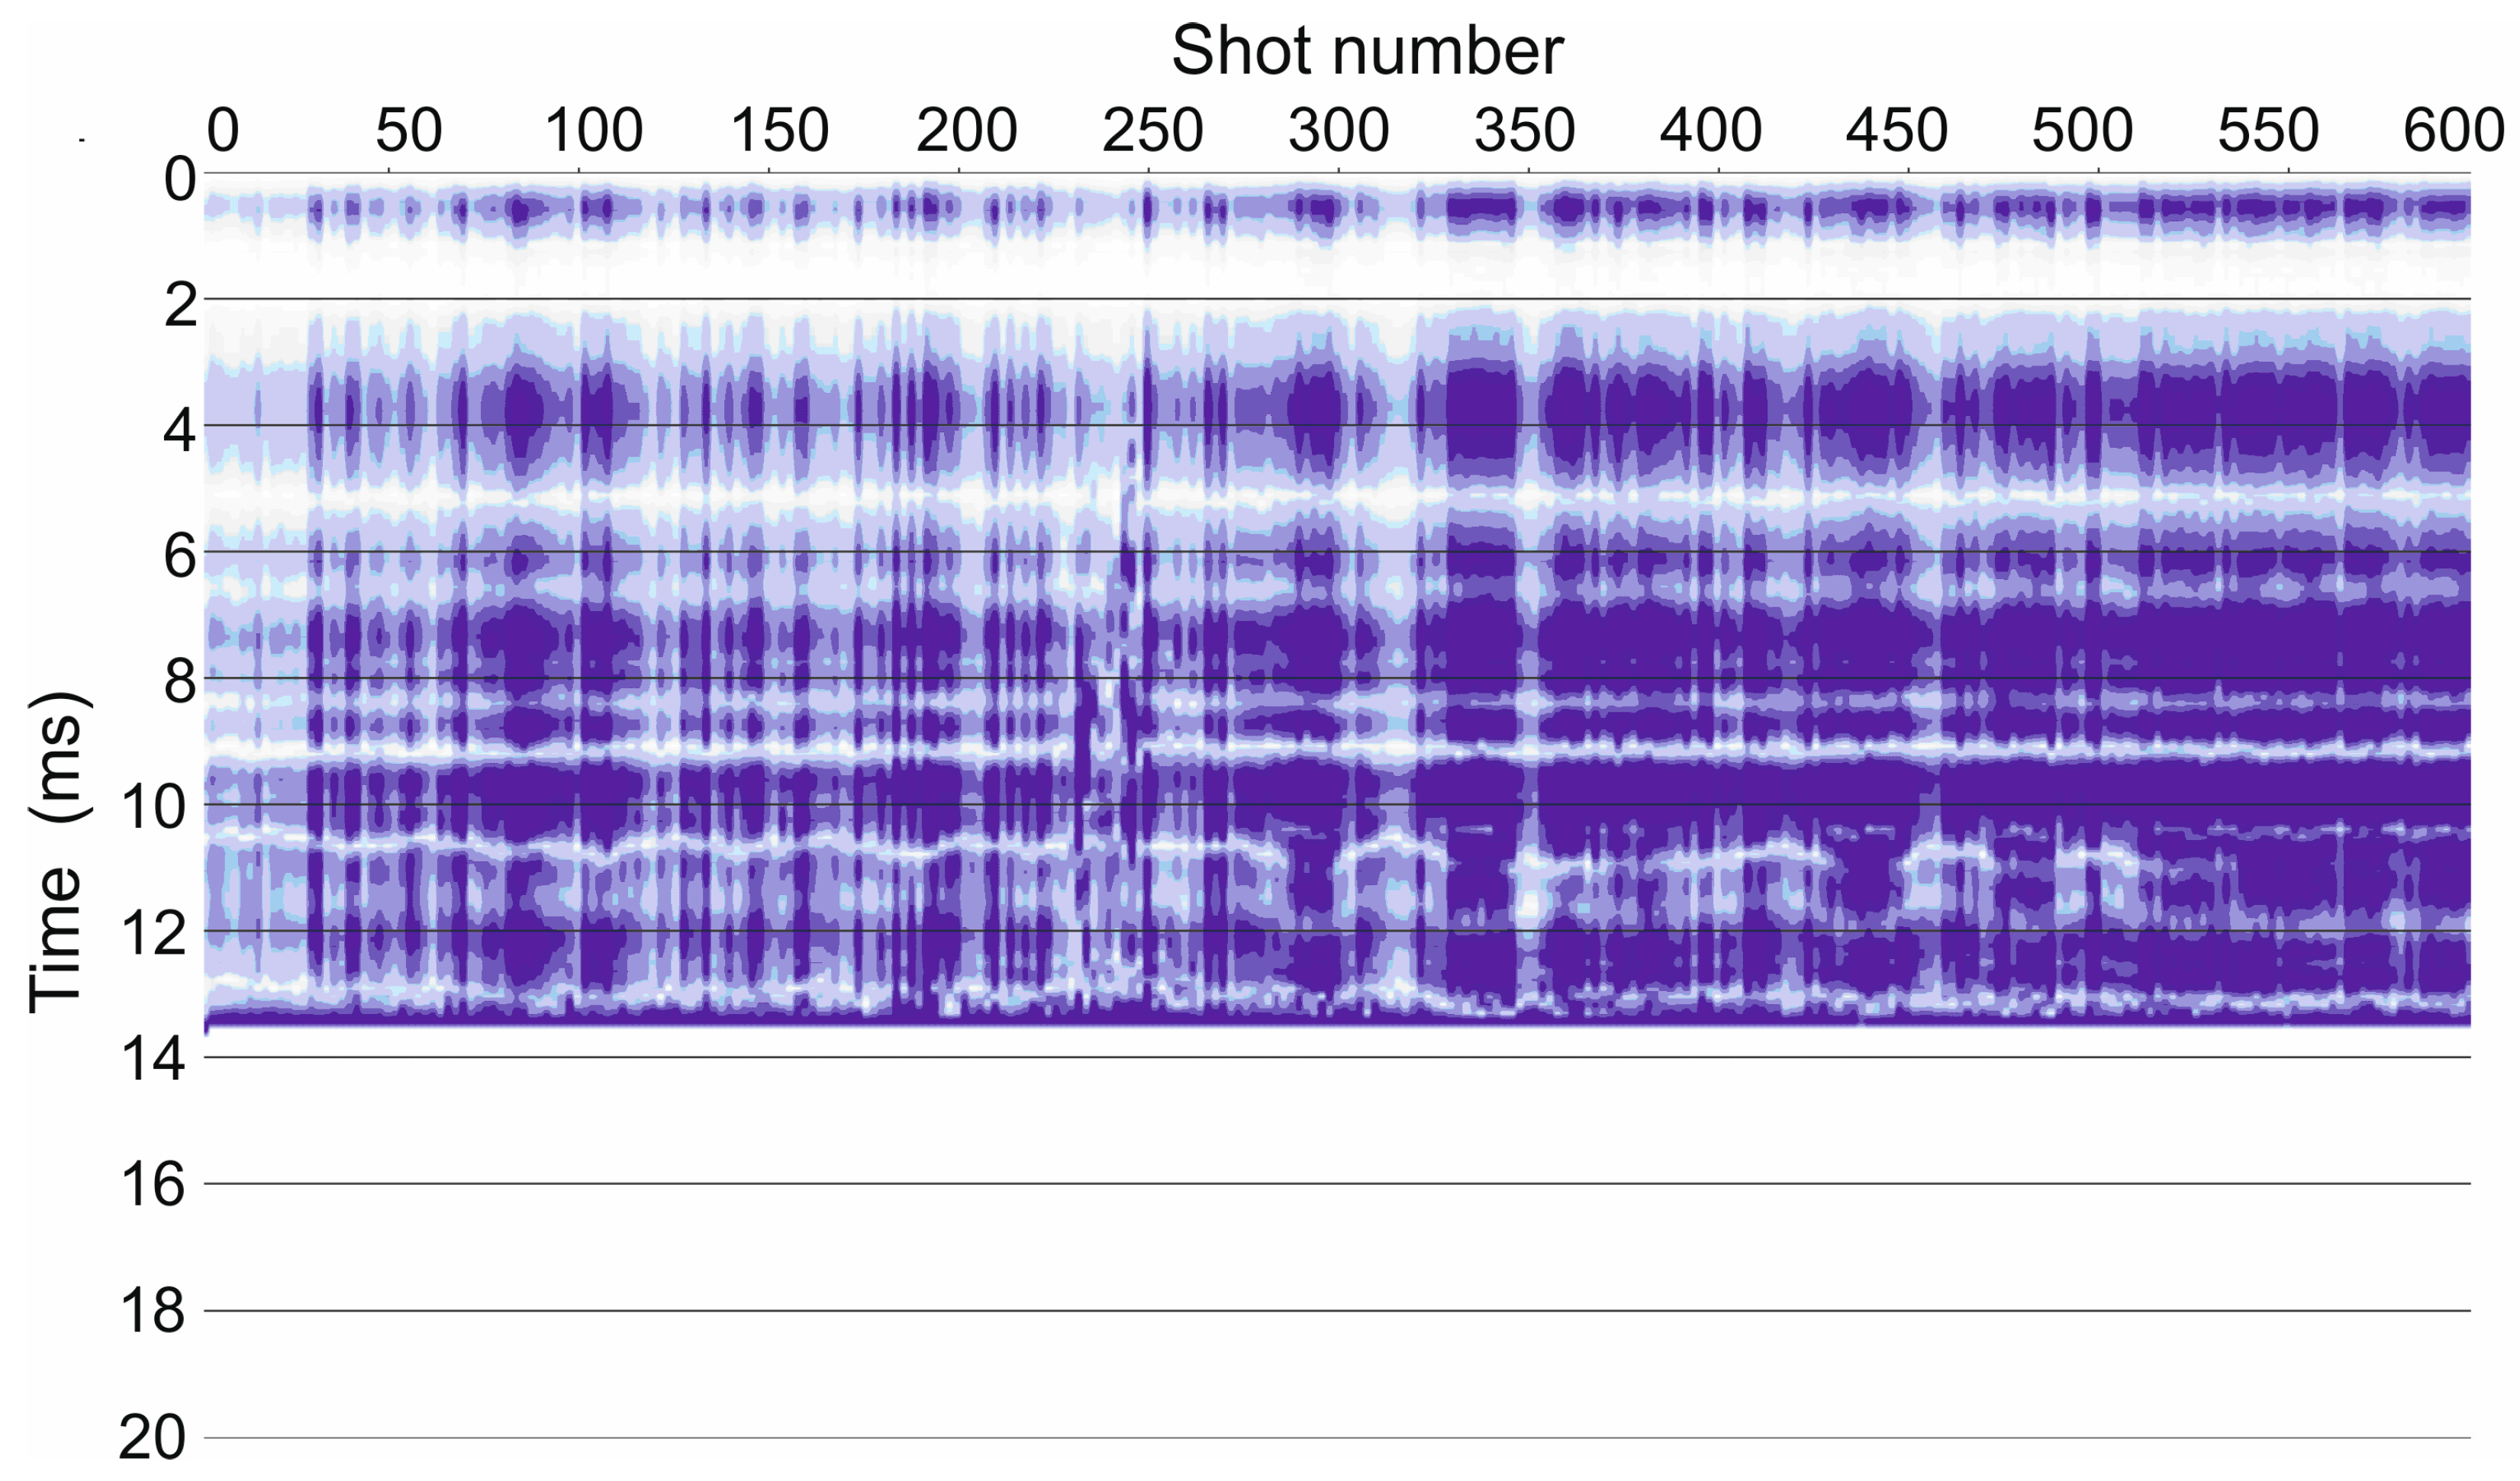
Figure 8 displays the unwrapped instantaneous phase. Although vertically blurred, the central plume is even more clearly recognizable. This also applies to the boundaries of the water layer at 4, 9, and 10 ms.
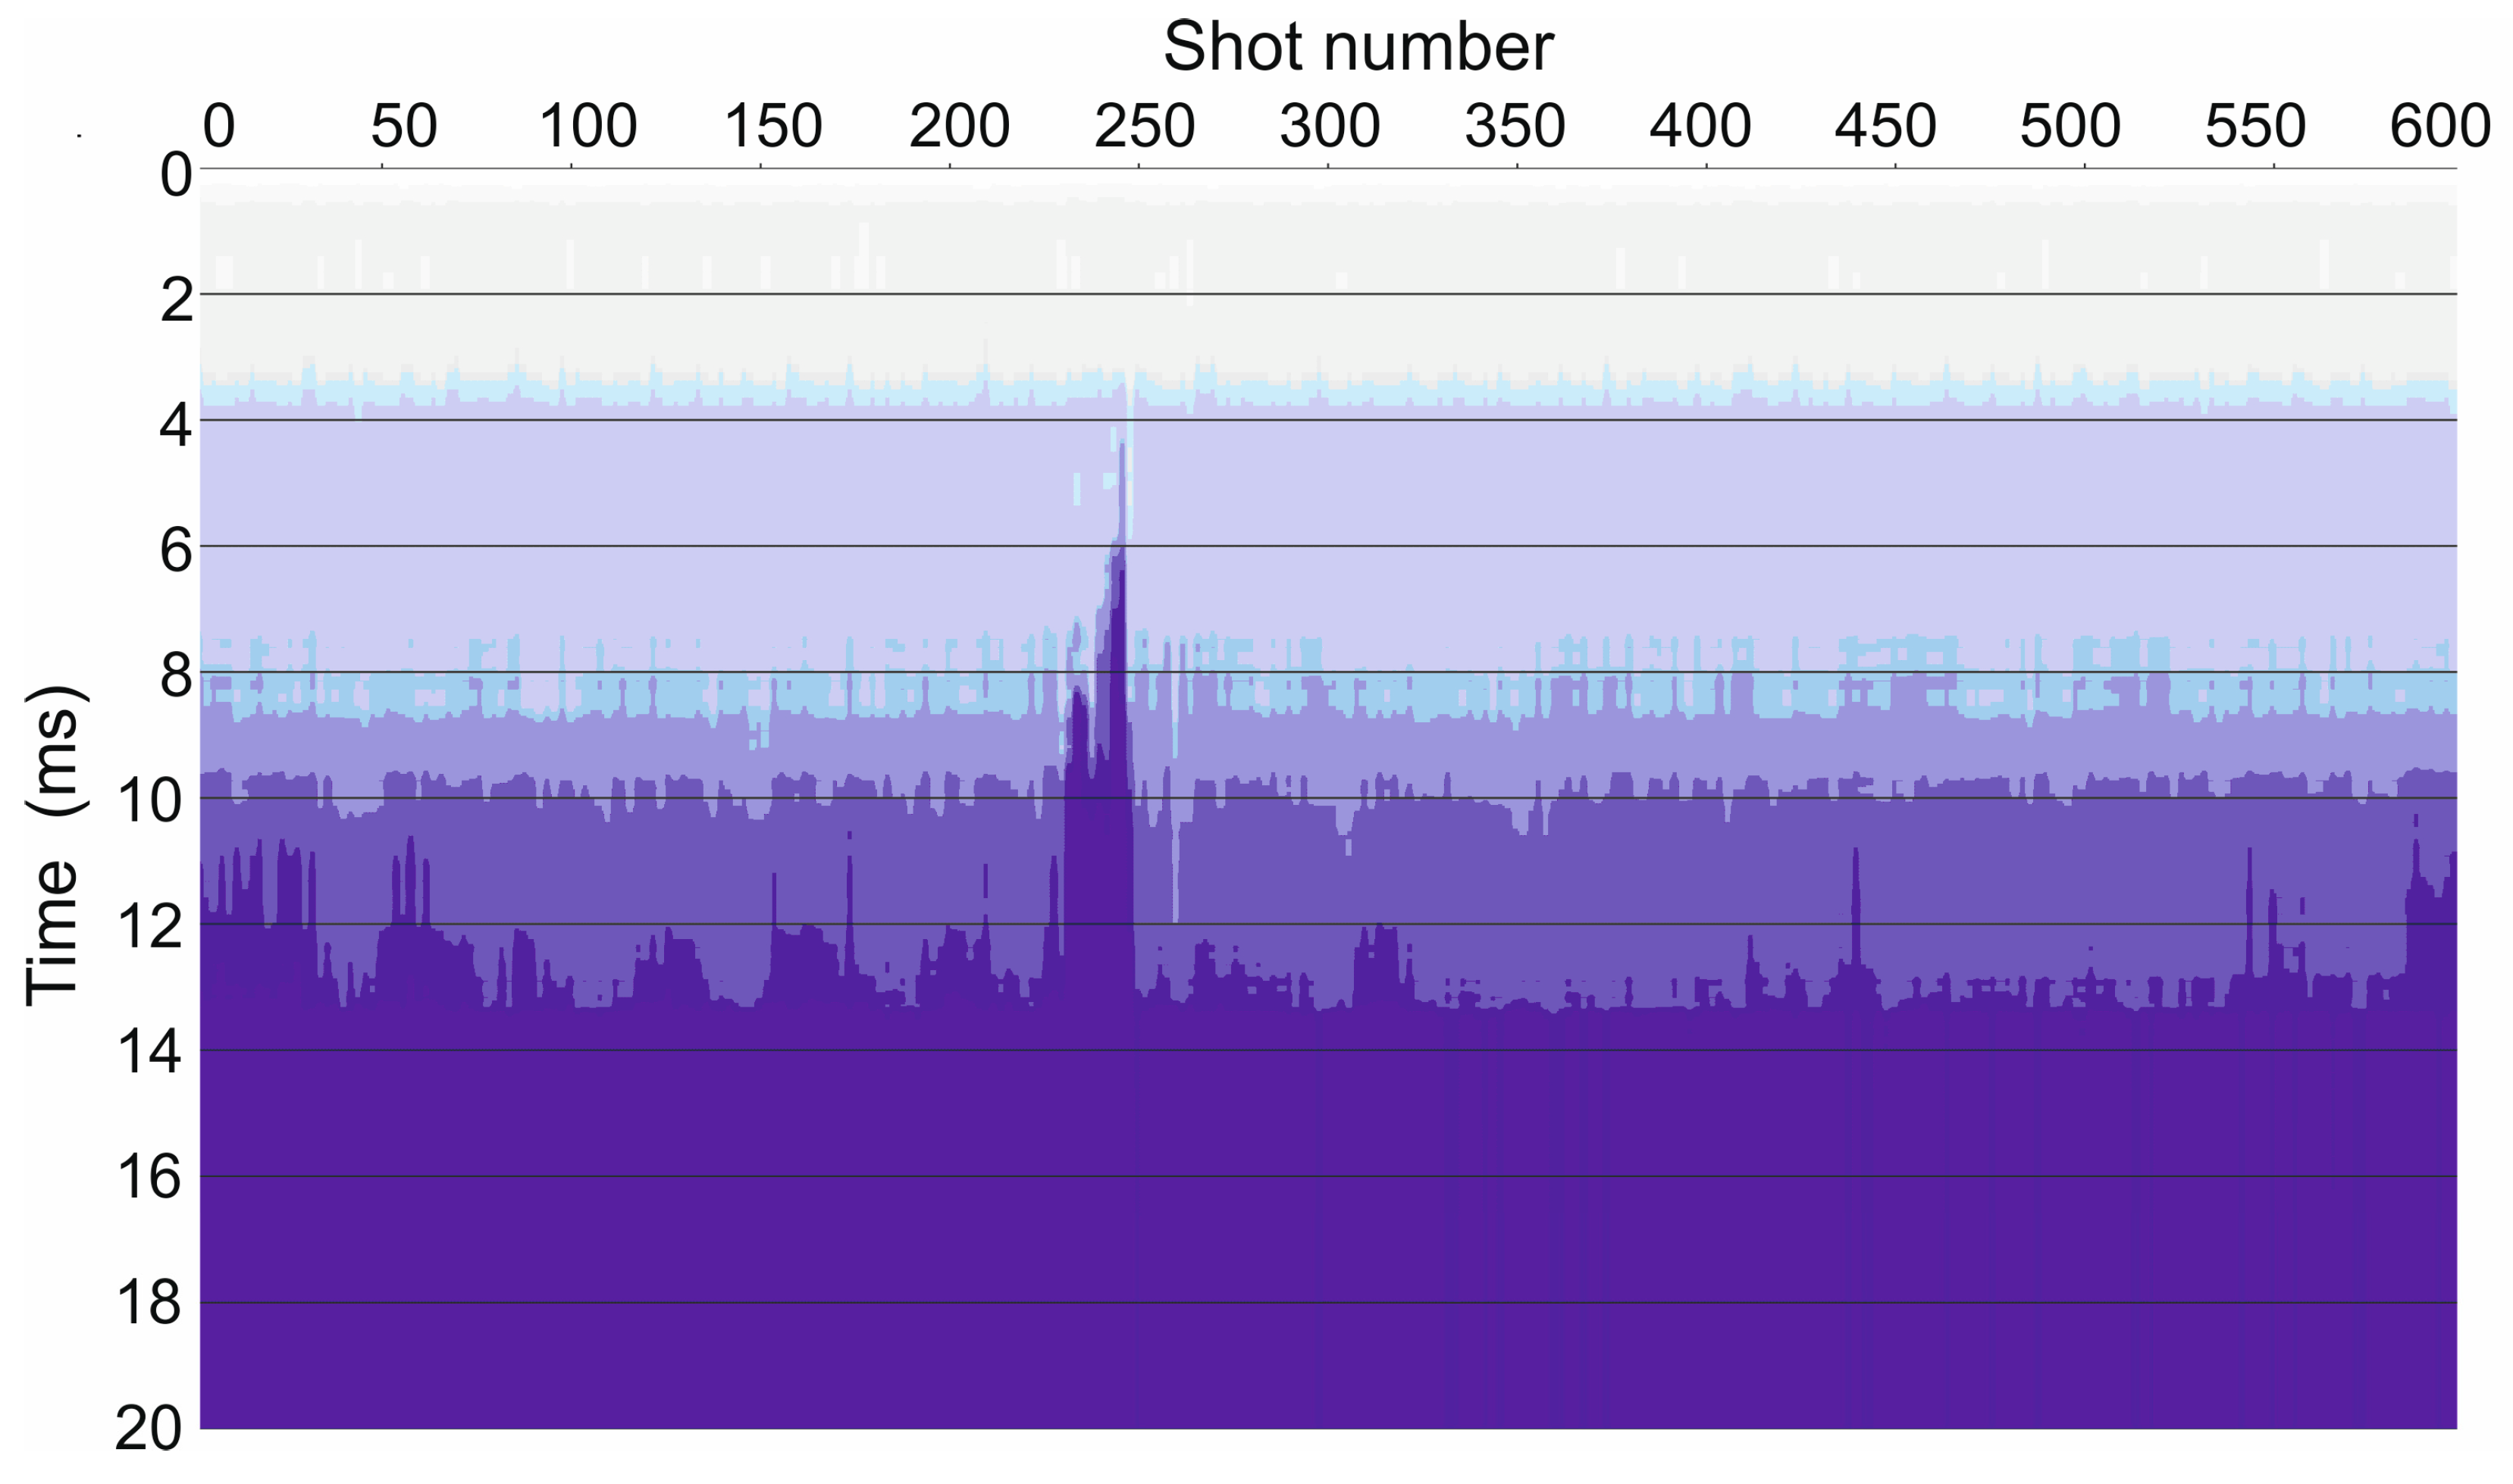
Figure 6 and Figure 7 provide complementary information about this plume. When using a simpler Automatic Gain Control (AGC), as in Figure 9, we obtain a very confusing image in which the central plume is barely recognizable due to the strong artefacts present almost everywhere. The water layers are also obscured by artefacts, making this image hardly usable.

4. Discussion

The significant improvement of the plume images argues in favor of using this approach as a standard instrument for marine surveys in offshore engineering. Another reason is the complete data dependency of these images, i.e., they do not depend on user-defined parameters (unlike AGC or other methods) that can be set arbitrarily. Therefore, they can provide solid information for technical safety in offshore engineering, as plumes can be associated with soft, gas-saturated sediments or shallow gas pockets. Additional applications include the characterization of shallow sediments in the ocean [40], archeological investigations [41], and marine geology [42].
The water depth at the test site was only about 10 m. From a mathematical point of view, there is no limit to the water depth that can be investigated, as a larger time delay due to a deeper seabed does not change the instantaneous phase of the backscattered signal. Since the anelastic absorption of seawater is almost negligible, the decrease in signal amplitude is mainly due to the geometric scattering of the wavefront. In principle, this can in turn be compensated for by a gain function that is proportional to the propagation time t. The operational limit for plume detection is therefore only determined by the Signal/Noise ratio, i.e., our ability to detect our signal in relation to the ambient noise. This noise changes locally and depends on the weather, but is generally stronger at the sea surface and decreases with depth. Therefore, a submarine is the ideal recording setting for deep measurements.
From a computational point of view, we reversed the standard procedure (unwrapping the instantaneous phase and subsequent differentiation) to remove the unwrapping part, which is more prone to numerical errors and certainly influenced by the questionable choice of a threshold parameter. The reverse approach (calculating the instantaneous frequency in the Fourier domain and then integrating to obtain the instantaneous phase) does not require any user-defined parameters and thus provides a fully data-driven result. The real data application example supports the combined use of both complex attributes.
The unwrapped instantaneous phase is a kind of event counter. Figure 2 shows that the start and end values of the record are zero in the case of both the minimum- and zero-phase. However, the values of the associated instantaneous phases are different at the end of the two records and even different between them. In a way, this is not surprising since the calculations are partly performed in the frequency domain: the whole Fourier-transformed function changes even if only one sample changes in the time domain. In other words, this algorithm converts local changes into global ones.

5. Conclusions

The unwrapped instantaneous phase, possibly in conjunction with its derivative, the instantaneous frequency, is an effective tool for detecting weak signals, especially when these are partially overlaid by other, much stronger signals.
A special feature of the unwrapped instantaneous phase is the “memory” of other previous signals. In principle, it can be used as an event counter that is independent of the signal amplitude, i.e., much better than a simple threshold gate. Although its trend is usually increasing, it contains ripples due to the negative values that its derivative, the instantaneous frequency, can take in special cases.
We have tested this approach for the detection of gas and fresh or hot water plumes emerging from seabed sediments and have shown that better images can be obtained than with a conventional algorithm such as Automatic Gain Control (AGC). We therefore recommend the use of this approach when analyzing Chirp or Boomer profiles in areas where offshore platforms or wind farms are planned.

Author Contributions

A.V. contributed to the basic idea, text, figures, and software development; L.B. contributed to the data acquisition and processing; E.D. contributed to Appendix A. All authors have read and agreed to the published version of the manuscript.

Funding

The Chirp profile was carried out by OGS as part of the project “Study of the geological and tectonic evolution of the Gulf of Trieste”, led by Martina Busetti. The work of E. Denich is partially supported by the INdAM under the GNCS Project CUP E53C24001950001, and by the University of Trieste under grant “Programma Regionale (PR) FSE+ 2021/2027 della Regione Autonoma Friuli Venezia Giulia—PPO 2023—Programma specifico 22/23—Decree n.17895/GRFVG dd.19.04.2023 s.m.i., Linea C, Sportello 2023”.

Data Availability Statement

The real data used in this paper can be requested from Martina Busetti (mbusetti@ogs.it). The MatLab scripts developed for this paper can be requested from Aldo Vesnaver (avesnaver@ogs.it).

Acknowledgments

We thank our colleagues at the OGS-Explora vessel for contributing to the Chirp data acquisition.

Conflicts of Interest

The authors declare no conflicts of interest.

Appendix A

The complex signal c t associated with the real-time series s t is defined as
c t = s t + i H { s t }   ,
or, in polar coordinates,
c t = A t e i ϕ t = A t cos ϕ t + i sin ϕ t ,
where H { } denotes the Hilbert transform, A t = c t is the envelope and
ϕ t = A r g c t = A r g s t + i H { s t )
is the instantaneous phase. In the above equation, the argument function Arg is a multifunction, defined as
A r g z = { arg z + 2 k π , k Z } ,
where
arg z = arg x + i y = I m log x + i y
is the principal value of this function, where log is the complex logarithm (see [43], Section 4.2), and returns a value in the range π , π . The derivative of ϕ t (at points where it exists) is called instantaneous frequency and, by using the formula for the derivative of the arctan function, is given by the following:
ϕ t = d d t a r c t a n H { s t } s t = 1 s t 2 + H { s t } 2   s ( t ) d   H { s t } d t H { s t }   d   s ( t ) d t .
When ϕ t is constrained to its principal value, it is called wrapped phase, and we denote it as follows:
ϕ 0 ( t ) = a r g ( c ( t ) ) = a r g ( s ( t ) + i H { s ( t )   } ) .
The function arg c t has the branch cut , 0 , which means that crossing the negative real axis results in a jump discontinuity, with step 2   π . In particular, by definition (A1), this occurs when
s t < 0   and   H { s t } = 0 ,
or equivalently from (A2) when
cos ϕ t < 0   and   sin ϕ t = 0 .
That is, for
ϕ t = π .
Therefore, from
s ( t ) = R e   { c ( t ) } = A ( t )   c o s   ϕ ( t ) ,
the wrapped phase has a discontinuity when
s t = A t .
The discontinuities can be removed by adding 2 k π , k Z . This allows ϕ t to accumulate without limit and produce an unwrapped instantaneous phase. From the instantaneous frequency, the unwrapped phase can be obtained from integral (6).

References

  1. Canales, L.L. Random Noise Reduction; SEG Annual Meeting 1984, Expanded Abstracts; SEG: Tulsa, OK, USA, 1984; pp. 525–527. [Google Scholar] [CrossRef]
  2. Gulunay, N. FXDECON and Complex Wiener Prediction Filter; SEG Annual Meeting 1986, Expanded Abstracts; SEG: Tulsa, OK, USA, 1986; pp. 279–281. [Google Scholar] [CrossRef]
  3. Gulunay, N. Signal leakage in f-x deconvolution algorithms. Geophysics 2017, 82, W31–W45. [Google Scholar] [CrossRef]
  4. Zhu, W.; Mousavi, S.M.; Beroza, G.C. Seismic signal denoising and decomposition using deep neural networks. IEEE Trans. Geosci. Remote Sens. 2019, 57, 9476–9488. [Google Scholar] [CrossRef]
  5. Ji, G.; Wang, C. A Denoising Method for Seismic Data Based on SVD and Deep Learning. Appl. Sci. 2022, 12, 12840. [Google Scholar] [CrossRef]
  6. Li, J.; Trad, D.; Liu, D. Robust seismic data denoising via self-supervised deep learning. Geophysics 2024, 89, V437–V451. [Google Scholar] [CrossRef]
  7. Oppenheim, A.V.; Schafer, R.W. Digital Signal Processing; Prentice-Hall: Englewood Cliffs, NJ, USA, 1975; ISBN 0132146355. [Google Scholar]
  8. White, R.S. Applied high-resolution geophysical methods: Offshore geoengineering hazards. Geophys. J. Int. 1986, 86, 214–215. [Google Scholar] [CrossRef]
  9. Marsset, B.; Missiaen, T.; Noble, M.; Versteeg, W.; Henriet, J.-P. Very high resolution 3D marine seismic data processing for geotechnical applications. Geophys. Prospect. 1998, 46, 105–120. [Google Scholar] [CrossRef]
  10. Minh Hue Le, T.; Eiksund, R.G.; Strøm, P.J.; Saue, M. Geological and geotechnical characterization for offshore wind turbine foundations: A case study of the Sheringham Shoal wind farm. Eng. Geol. 2014, 177, 40–53. [Google Scholar] [CrossRef]
  11. Negro, V.; López-Gutierrez, J.-S.; Esteban, M.D.; Matutano, C. Uncertainties in the design of support structures and foundations for offshore wind turbines. Renewable Energy 2014, 63, 125–132. [Google Scholar] [CrossRef]
  12. Perveen, R.; Kishor, N.; Mohanty, S.R. Off-shore wind farm development: Present status and challenges. Renew. Sustain. Energy Rev. 2014, 29, 780–792. [Google Scholar] [CrossRef]
  13. Monrigal, O.; de Jong, I.; Duarte, H. An ultra-high-resolution 3D marine seismic system for detailed site investigation. Near Surf. Geophys. 2017, 15, 335–345. [Google Scholar] [CrossRef]
  14. Wei Min, P.; Yi Gen, W.; Song Chuan, X.; Hu, B.; Zhang, Y.; Li Zheng, S.; Xiao Li, J. Advancing offshore wind farm site assessments in Guangxi using single-channel seismic method. J. Phys. Conf. Ser. 2024, 2895, 012003. [Google Scholar] [CrossRef]
  15. Wang, R.; Hu, B.; Zhang, H.; Zhang, P.; Li, C.; Chen, F. Seismic interferometry for single-channel data: A promising approach for improved offshore wind farm evaluation. Remote Sens. 2025, 17, 325. [Google Scholar] [CrossRef]
  16. International Association of Oil & Gas Producers (IOGP). Guidelines for the Conduct of Offshore Drilling Hazard Site Surveys; IOGP Report 373-18-1; 2017; pp. 1–46. Available online: https://www.deparentis.com/wp-content/uploads/2020/04/IGOP-373-18-1-1.pdf (accessed on 7 April 2025).
  17. Gabor, D. Theory of communications. J. Inst. Electr. Eng.—Part III Radio Commun. 1946, 93, 429–457. [Google Scholar] [CrossRef]
  18. Ville, J.A. Theorie et application de la notion du signal analytique. Cable Transm. 1948, 2, 61–74. Available online: https://archive.org/details/VilleSigAnalytiqueCablesEtTrans1948Fr (accessed on 1 May 2025).
  19. Taner, M.T.; Koehler, F.; Sheriff, R.E. Complex seismic trace analysis. Geophysics 1979, 44, 1041–1063. [Google Scholar] [CrossRef]
  20. Tribolet, J. A new phase unwrapping algorithm. IEEE Trans. Acoust. Speech Signal Process. 1977, 25, 170–177. [Google Scholar] [CrossRef]
  21. Strand, J.; Taxt, T. Performance evaluation of two-dimensional phase unwrapping algorithms. Appl. Opt. 1999, 38, 4333–4344. [Google Scholar] [CrossRef]
  22. Egidi, N.; Maponi, P. A comparative study of two fast phase unwrapping algorithms. Appl. Math. Comput. 2004, 148, 599–629. [Google Scholar] [CrossRef]
  23. Wang, S. An Improved quality guided phase unwrapping method and its applications to MRI. Prog. Electromagn. Res. 2014, 145, 273–286. [Google Scholar] [CrossRef]
  24. Poggiagliolmi, E.; Vesnaver, A. Instantaneous phase and frequency derived without user-defined parameters. Geophys. J. Int. 2014, 199, 1544–1553. [Google Scholar] [CrossRef]
  25. Vesnaver, A. Instantaneous frequency and phase without unwrapping. Geophysics 2017, 82, F1–F7. [Google Scholar] [CrossRef]
  26. Ackroyd, M.H. Instantaneous spectra and instantaneous frequency. Proc. IEEE 1970, 58, 141. [Google Scholar] [CrossRef]
  27. Saha, J.G. Relationship Between Fourier and Instantaneous Frequency; Expanded Abstracts 1987, SEG Annual Meeting; SEG: Tulsa, OK, USA, 1987; pp. 591–594. [Google Scholar] [CrossRef]
  28. Quan, Y.; Harris, J. Seismic attenuation tomography using the frequency shift method. Geophysics 1997, 62, 895–905. [Google Scholar] [CrossRef]
  29. Lin, R.; Vesnaver, A.; Böhm, G.; Carcione, J.M. Broad-band visco-acoustic Q factor imaging by seismic tomography and instantaneous frequency. Geophys. J. Int. 2018, 214, 672–686, https://doi.org/10.1093/gji/ggy168. Erratum in Geophys. J. Int. 2022, 229, 898–899. [Google Scholar] [CrossRef]
  30. Caldwell, J.; Dragoset, W. A brief overview of seismic air-gun arrays. Lead. Edge 2000, 19, 898–902. [Google Scholar] [CrossRef]
  31. Dragoset, B. Introduction to air guns and air-gun arrays. Lead. Edge 2000, 19, 892–897. [Google Scholar] [CrossRef]
  32. Gutowski, M.; Bull, J.; Henstock, T.; Dix, J.K.; Hogarth, P.; Leighton, T.; White, P. Chirp sub-bottom profiler source signature design and field testing. Mar. Geophys. Res. 2002, 23, 481–492. [Google Scholar] [CrossRef]
  33. Schock, S.G.; LeBlanc, L.R. Chirp Sonar: New technology for sub-bottom profiling. Sea Technol. 1990, 31, 35–43. [Google Scholar]
  34. Schock, S.G.; LeBlanc, L.R.; Mayer, L.A. Chirp sub-bottom profiler for quantitative sediments analysis. Geophysics 1989, 54, 445–450. [Google Scholar] [CrossRef]
  35. Simpkin, P.G. The Boomer sound source as a tool for shallow water geophysical exploration. Mar. Geophys. Res. 2005, 26, 171–181. [Google Scholar] [CrossRef]
  36. Yilmaz, Ö. Seismic Data Analysis; SEG: Tulsa, OK, USA, 2001; p. 2065. [Google Scholar] [CrossRef]
  37. Vesnaver, A.; Busetti, M.; Baradello, L. Chirp data processing for fluid flow detection at the Gulf of Trieste (Adriatic Sea). Bull. Geophys. Oceanogr. 2021, 62, 365–386. [Google Scholar] [CrossRef]
  38. Millero, F.J.; Chen-Tung, C.; Bradshaw, A.; Schleicher, K. A new high-pressure equation of state for seawater. Deep Sea Res. Part A. Oceanogr. Res. Pap. 1980, 27, 255–264. [Google Scholar] [CrossRef]
  39. Vesnaver, A.; Baradello, L. A workflow for processing monochannel Chirp and Boomer surveys. Geophys. Prospect. 2023, 71, 1387–1403. [Google Scholar] [CrossRef]
  40. Lee, T.-G.; Hein, J.R.; Lee, K.; Moon, J.-W.; Ko, Y.-T. Sub-seafloor acoustic characterization of seamounts near the Ogasawara Fracture Zone in the western Pacific using Chirp (3–7 kHz) sub-bottom profiles. Deep Sea Res. Part I Oceanogr. Res. Pap. 2005, 52, 1932–1956. [Google Scholar] [CrossRef]
  41. Hamouda, A.Z.; El-Gendy, N.H.; El-Gharabawy, S.; Salah, M.; Barakat, M.K. Marine geophysical surveys and interpretations on the ancient Eunostos harbor area, Mediterranean coast, Egypt. Egypt. J. Pet. 2023, 32, 47–55. [Google Scholar] [CrossRef]
  42. Toker, M.; Tur, H. Structural patterns of the Lake Erçek Basin, eastern Anatolia (Turkey): Evidence from single-channel seismic interpretation. Mar. Geophys. Res. 2018, 39, 567–588. [Google Scholar] [CrossRef]
  43. Abramowitz, M. Handbook of Mathematical Functions, with Formulas, Graphs, and Mathematical Tables; Dover Publications Inc.: Mineola, NY, USA, 1974; ISBN 978-0-486-61272-0. [Google Scholar]
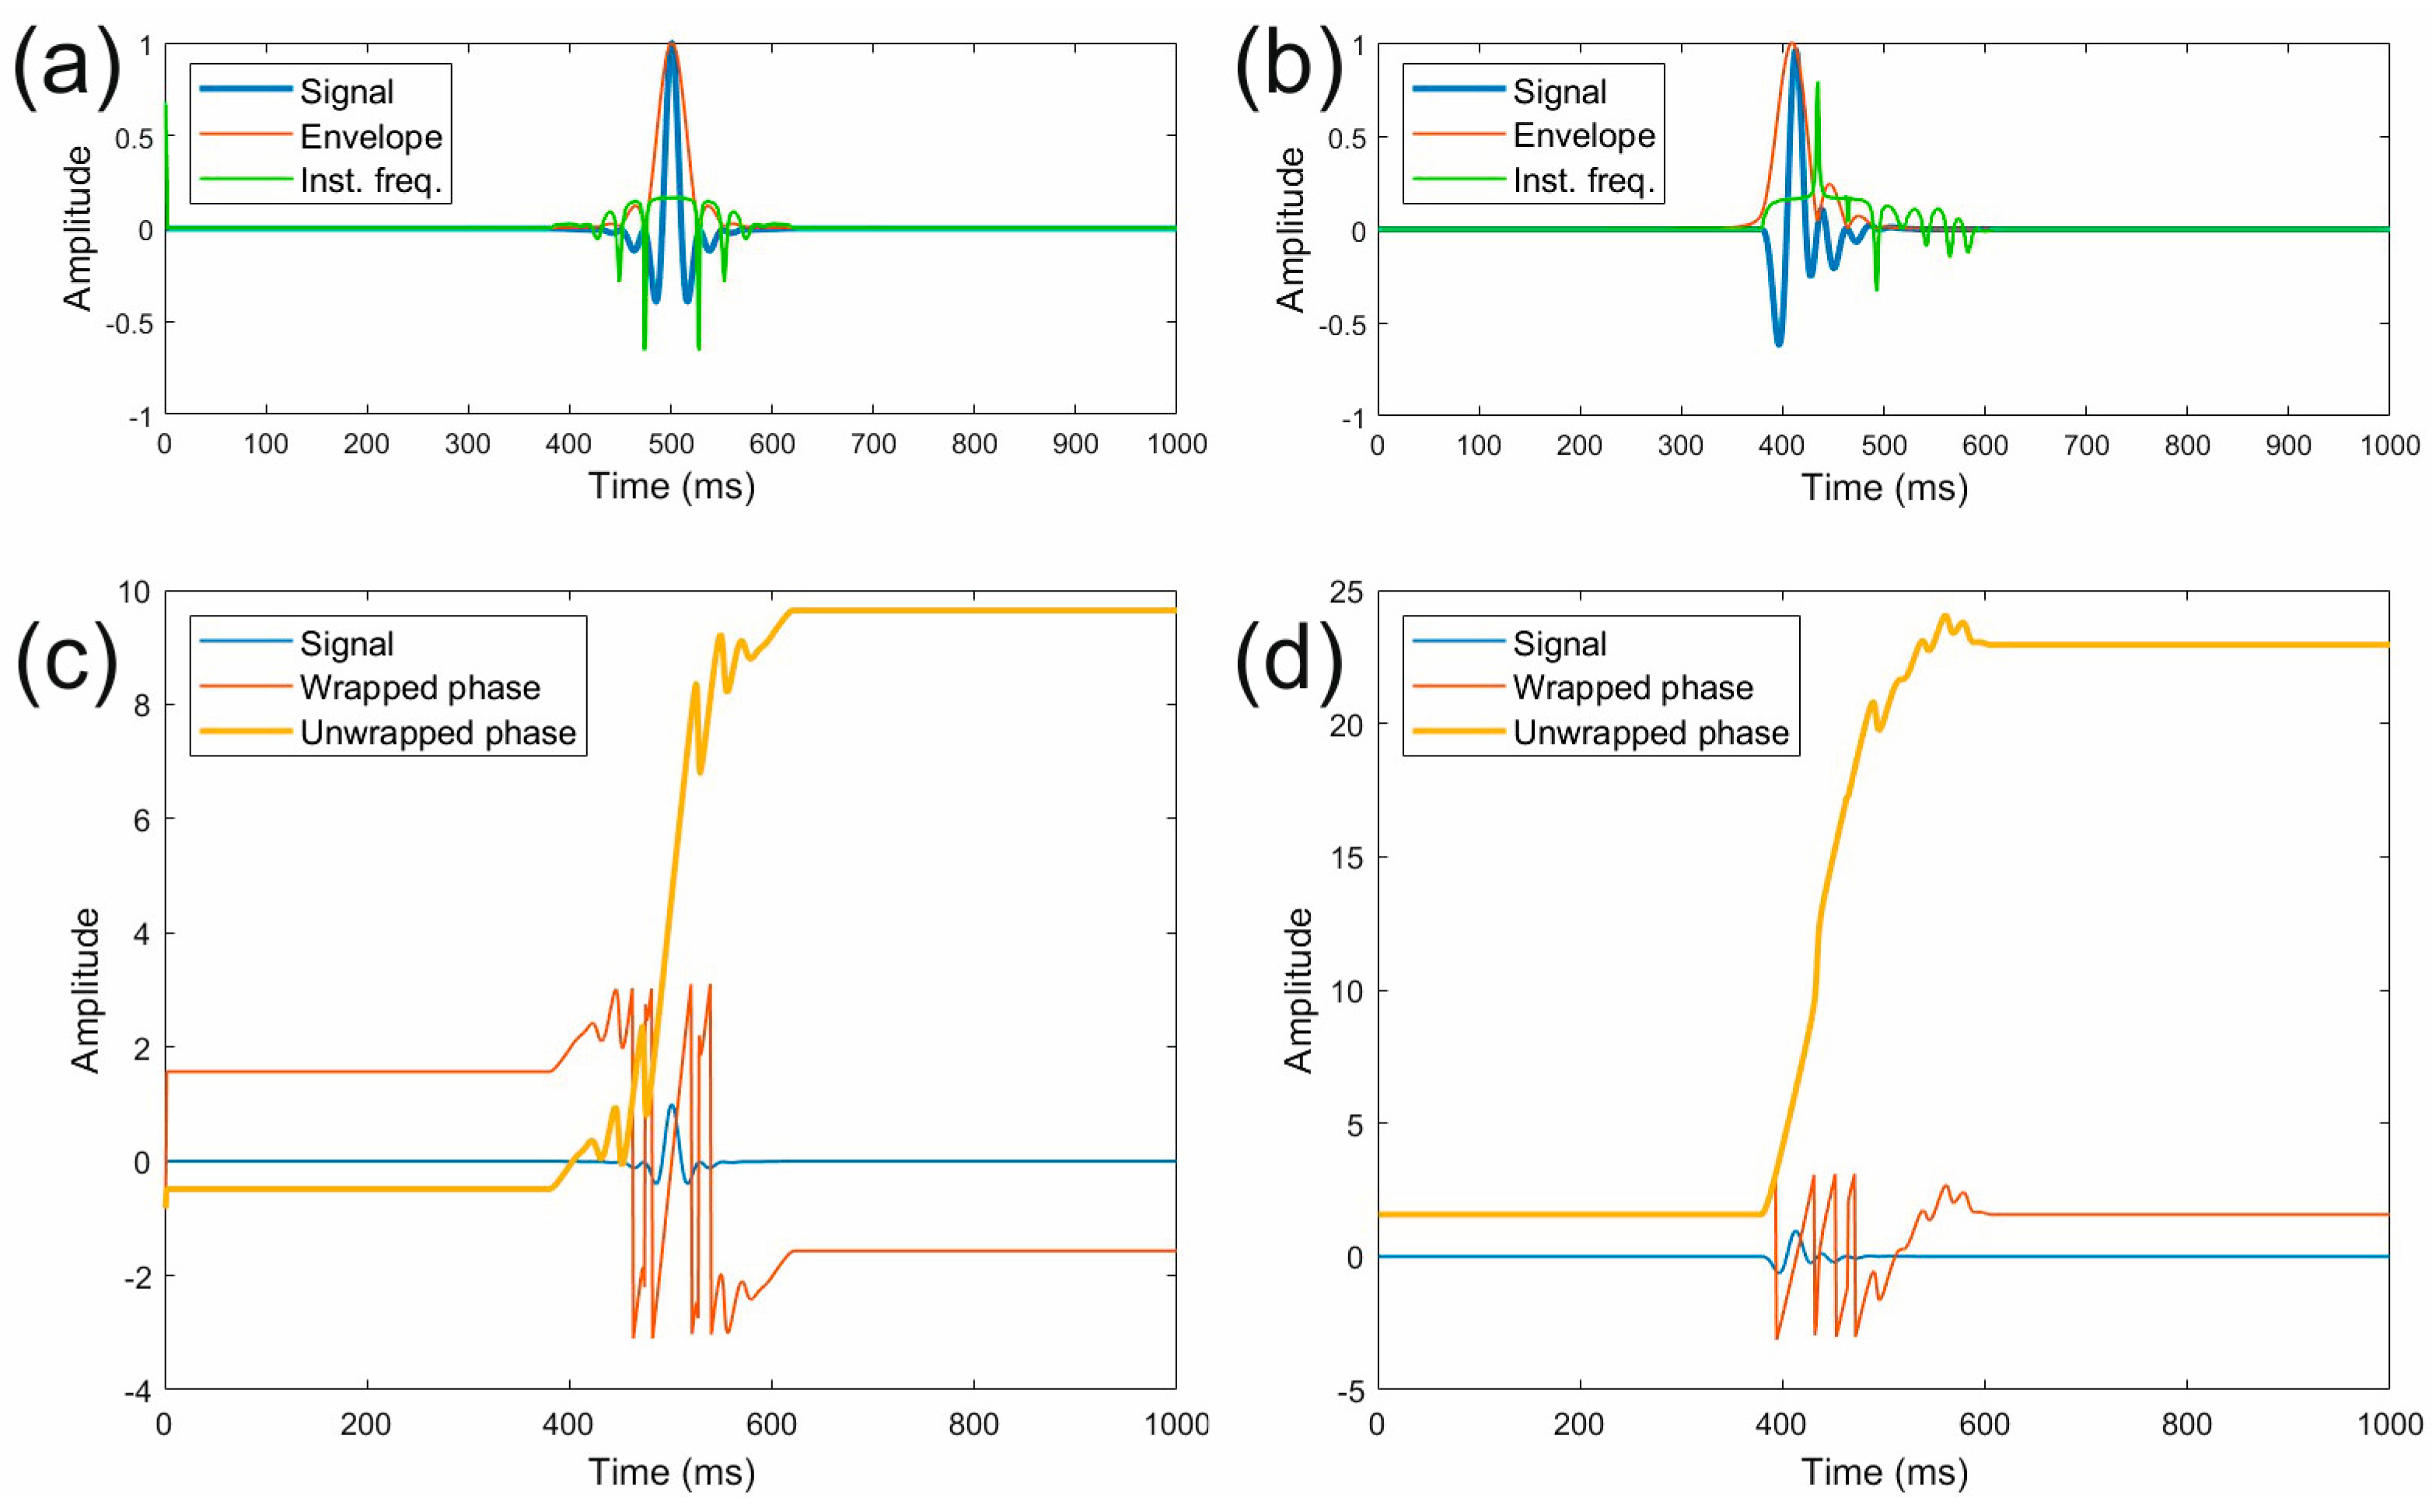
Figure 1. Zero-phase (a) and minimum-phase wavelets (b) with their envelopes and instantaneous frequency, with the underlying corresponding wrapped and unwrapped instantaneous phases (c,d).
Jmse 13 00907 g001
Figure 2. Three zero-phase (a) and minimum-phase wavelets (b) with their envelopes and instantaneous frequency, with the underlying corresponding wrapped and unwrapped instantaneous phases (c,d).
Jmse 13 00907 g002
Figure 3. Three different distances between a weak and a strong minimum-phase signal: no overlap (a), partial overlap (b), significant overlap (c), or swapping the order of the large and small signal (d). The unwrapped instantaneous phase can detect the much weaker signal in the first two cases and in the last one, when the associated envelopes are partially separated, with improved evidence. The instantaneous phase (green line) was scaled by 10 to be better visible in the plots.
Jmse 13 00907 g003
Figure 4. Band-limited random noise with different levels was added to the signals in Figure 3a. The maximum noise amplitude is set in relation to that of the weaker signal: 0.1% (a), 1% (b), and 10% (c).
Jmse 13 00907 g004
Figure 5. Chirp profile acquired at the Adriatic Sea (Italy).
Jmse 13 00907 g005
Figure 6. Profile in Figure 5 after zeroing the signals below the seafloor.
Jmse 13 00907 g006
Figure 7. Instantaneous frequency of the data in Figure 6.
Jmse 13 00907 g007
Figure 8. Unwrapped instantaneous phase of the data in Figure 6.
Jmse 13 00907 g008
Figure 9. Automatic Gain Control (AGC) applied to the data in Figure 6, using a time window of 3 ms.
Jmse 13 00907 g009
Disclaimer/Publisher’s Note: The statements, opinions and data contained in all publications are solely those of the individual author(s) and contributor(s) and not of MDPI and/or the editor(s). MDPI and/or the editor(s) disclaim responsibility for any injury to people or property resulting from any ideas, methods, instructions or products referred to in the content.