Article

Experimental Study on Strength Characteristics of Overconsolidated Gassy Clay

1
Shandong Engineering Research Center of Marine Exploration and Conservation, Ocean University of China, Qingdao 266100, China
2
Laboratory for Marine Geology, Qingdao Marine Science and Technology Center, Qingdao 266237, China
3
Key Laboratory of Intelligent Underground Detection Technology, Anhui Jianzhu University, Hefei 230000, China
*
Author to whom correspondence should be addressed.
J. Mar. Sci. Eng. 2025, 13(5), 904; https://doi.org/10.3390/jmse13050904
Submission received: 22 March 2025 / Revised: 27 April 2025 / Accepted: 29 April 2025 / Published: 30 April 2025
(This article belongs to the Special Issue Advances in Marine Geological and Geotechnical Hazards)

Abstract

:
Gassy clay, commonly encountered in coastal areas as overconsolidated deposits, demonstrates distinct mechanical properties posing risks for submarine geohazards and engineering stability. Consolidated undrained triaxial tests combined with cyclic simple shear tests were performed on specimens with varying overconsolidation ratios (OCRs) and initial pore pressures, supplemented by SEM microstructural analysis. Triaxial results indicate that OCR controls the transitions between shear contraction and dilatancy, which govern both stress–strain responses and excess pore pressure development. Higher OCR with lower initial pore pressure increases stress path slope, raises undrained shear strength (su), reduces pore pressure generation, and induces negative pore pressure at elevated OCR. These effects originate from compressed gas bubbles and limited bubble flooding under overconsolidation, intensifying dilatancy during shear. Cyclic tests reveal gassy clay’s superior cyclic strength, slower pore pressure accumulation, reduced stiffness softening, and enhanced deformation resistance relative to saturated soils. Cyclic pore pressure amplitude increases with OCR, while peak cyclic strength and anti-softening capacity occur at OCR = 2, implying gas bubble interactions.

1. Introduction

Submarine shallow gas refers to methane and other gases continuously generated through microbial degradation of sediments with high organic content buried at certain depths below the seabed [1,2]. These gases predominantly exist in the form of gas pockets and gassy sediments, widely distributed in global coastal and alluvial plain regions [3]. As shown in Figure 1, coastal gassy soil is characterized by discontinuous gas phases and interconnected water phases, with saturation levels typically exceeding 85% [4,5]. Advanced techniques such as scanning electron microscopy (SEM) and computed tomography (CT) scanning reveal that gas bubbles are trapped within the soil matrix in clay-dominated fine-grained gassy soil, exhibiting sizes significantly larger than soil particles and gas pressures reaching 5–6 times the standard atmospheric pressure. The presence of gas profoundly alters the geomechanical properties of gassy soil, including critical parameters such as settlement behavior, liquefaction potential, and shear strength. This results in a marked increase in internal pore pressure, reduced effective stress, and subsequent soil expansion and structural weakening of the soil skeleton [6], collectively diminishing bearing capacity and posing severe risks to engineering safety. Furthermore, under dynamic loads, such as wave action, these conditions may trigger submarine geohazards [7]. For example, the Deepwater Horizon drilling platform in the Gulf of Mexico suffered a catastrophic shallow gas explosion, resulting in severe environmental and economic losses [8]. A water conservancy facility in Anhui Province, China, experienced foundation settlement and structural cracking due to the presence of gassy soil strata [9]. In recent years, some scholars have carried out visual analysis on the microstructure of different types of gassy soil [10,11,12,13]. The unique meso-structure of gassy soil introduces a more complex multiphase coupling mechanism compared to conventional unsaturated soils [14,15].
Research indicates that the effective stress principle remains applicable to gassy soil under high saturation conditions (Sr > 90%), effectively explaining their mechanical behaviors, including compressibility [7] and constitutive relationships [16,17,18]. For fine-grained gassy soil, the total volumetric strain generated under shear loading is attributed to both the saturated soil matrix and gas bubbles [19]. However, since the shear stiffness of gas bubbles is generally negligible, it is conventionally assumed that the total volumetric strain is entirely contributed by the saturated soil matrix. Figure 2 illustrates a representative volume element of fine-grained gassy soil, including three different matrixes: bubbles, pore water, and soil particles. To conveniently regard the volume of the whole gas-bearing soil as V, the volume of bubbles, pore water, and soil particles is regarded as Vg, Vw, and Vs, respectively. Sr is the saturation of the water phase, and ew and ψ are the water void ratio and gas volume fraction, respectively [20]. The three-phase composition of gassy soil per unit volume is shown in Figure 2.
Thomas [21] demonstrated, through one-dimensional consolidation tests, that increased gas content significantly enhances soil compressibility, with compression curves asymptotically approaching those of saturated soils without altering matrix properties. Puzrin et al. [7] emphasized that gas bubbles solely influence the consolidation process without altering the ultimate settlement. Hong [16], utilizing triaxial testing, confirmed that initial gas content and compressibility exhibit negative correlations with increasing initial pore pressure, while enhanced effective stress drives the compressibility of gassy soil to converge toward saturated soil behavior. Ye et al. [22] observed that the ultimate settlement of gassy soil exceeds that of saturated soils and demonstrates a negative correlation with initial pore pressure, with water intrusion into gas cavities accelerating pore pressure dissipation. Notably, large, occluded bubbles drastically modify compression characteristics, inducing post-dissipation creep and long-term consolidation, due to delayed gas pressure equilibration [23,24,25].
Wheeler [26] revealed through undrained shear tests that gas bubbles influence shear strength by modulating the coupled relationship between initial pore pressure and mean effective stress. Hong [16] proposed that gas–liquid interactions dominate the excess pore pressure response: under high initial pore pressure, gas bubble compression induces fracture collapse, reducing strength and amplifying excess pore pressure; under low initial pore pressure, the “bubble flooding” effect is triggered, enhancing strength and suppressing excess pore pressure. Based on continuum mechanics theory, Wheeler [27,28] established two critical pressure models for gas bubbles, elucidating the evolutionary relationship between gas content and gas pressure thresholds, and demonstrated that increasing gas content reduces both the shear modulus and bulk modulus of gassy soil.
Liu [29] demonstrated fine-grained gassy soils’ excess pore pressure and shear strength dependency on initial pore water pressure through triaxial tests, showing higher strength under CTC than RTC. Wang [30] revealed that 3.5% gas content enhanced undrained strength by 18% and reduced consolidation coefficient by 50% via triaxial-consolidation tests, further establishing cone factor-gas content correlations through CPT simulations. Hong et al. [31] demonstrated, through cyclic triaxial tests, that saturated clay’s cyclic stress ratio decayed to 0.74 (50 cycles); low-pressure gassy clay showed CSR = 0.5/slope = 4 (partial drainage); high-pressure specimens exhibited CSR > 1 with higher pore pressure than saturated clay due to micro-crack instability.
Building upon Gao’s critical state model [32], Cai [33] developed an overconsolidated gassy clay bounding surface model, revealing gas cavity-induced soil structure degradation that reduces plastic modulus and shear strength, while partial drainage under undrained conditions enhances stiffness. Validation via undrained triaxial tests on Malaysian and Specwhite Kaolin confirmed model accuracy. In marine environments, overconsolidated gassy soil subjected to geological sedimentation, hydrodynamic conditions, and engineering disturbances [34] may trigger gas segregation and migration as well as geohazards, such as submarine landslides and pipeline ruptures [35,36]. Existing studies predominantly focus on the influence of gas content, saturation, and initial pore pressure on strength, while the effects and mechanisms of overconsolidation states on the mechanical and cyclic behaviors of gassy soil remain unclear. To investigate the mechanical strength characteristics and response mechanisms of overconsolidated gassy clay, this study conducted consolidated undrained triaxial tests and cyclic simple shear tests on gassy clay specimens with different overconsolidation ratios and initial pore pressures. Scanning electron microscopy (SEM) was employed to observe their microstructural characteristics.

2. Experimental Programs

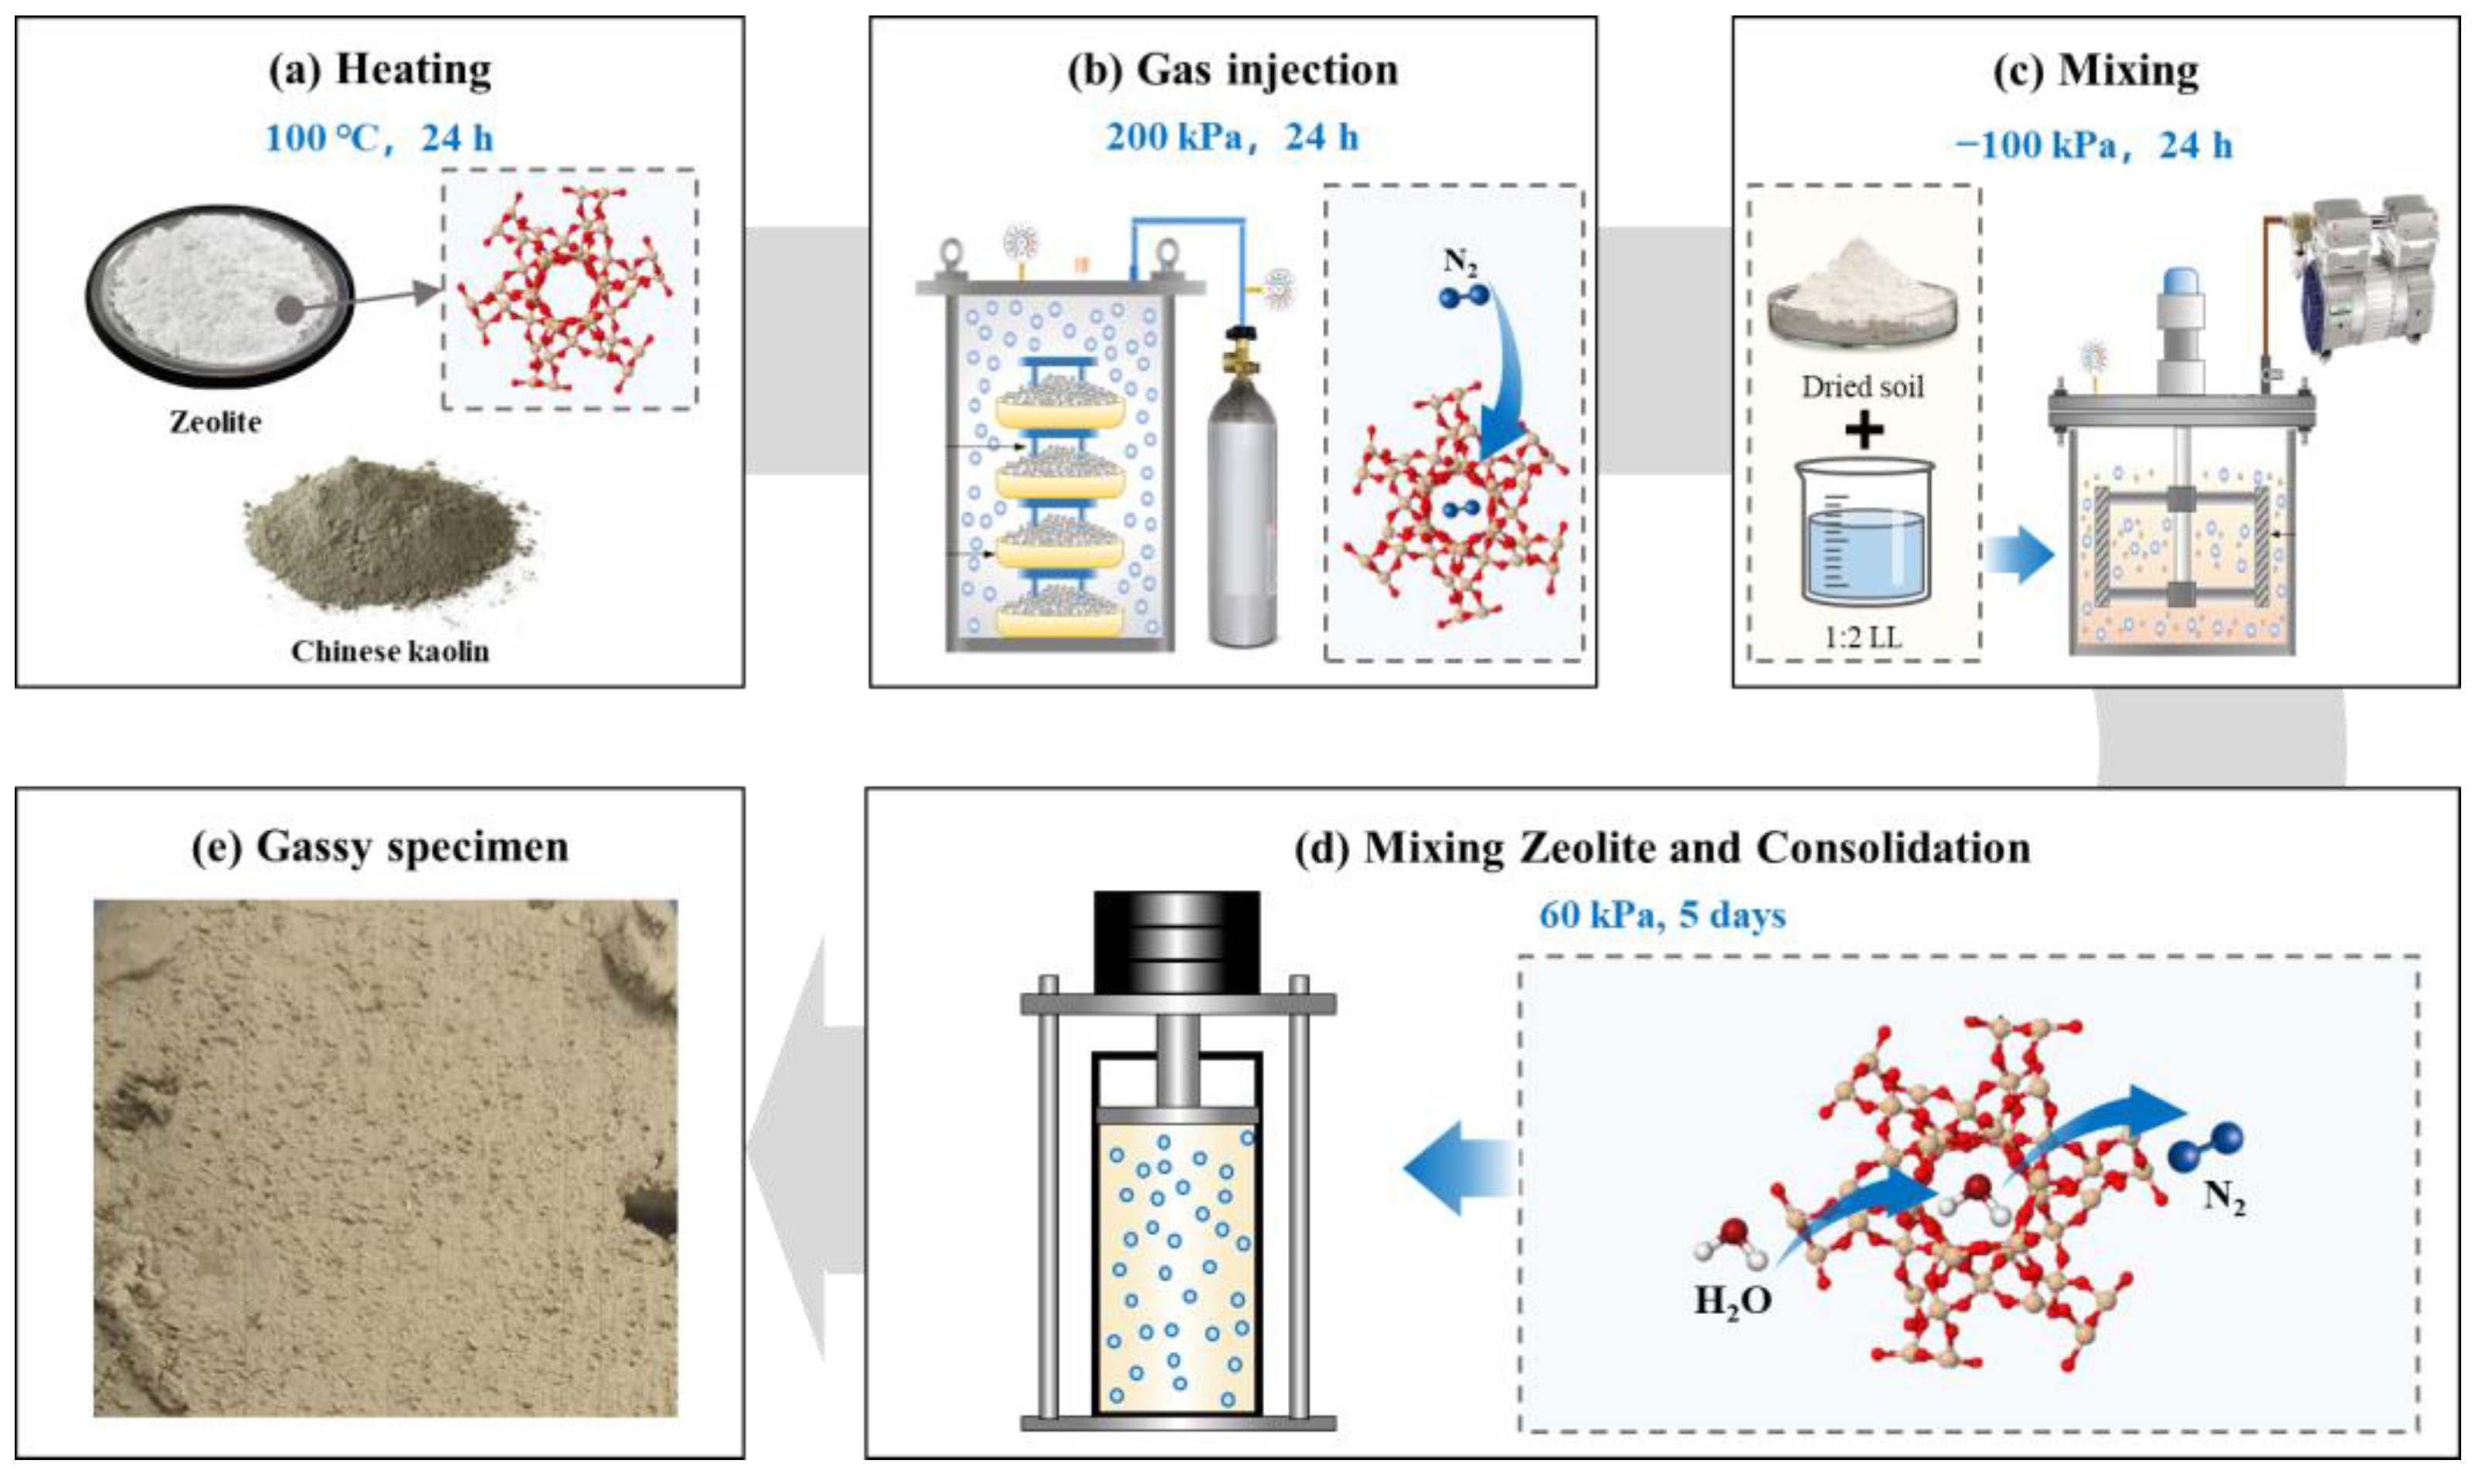
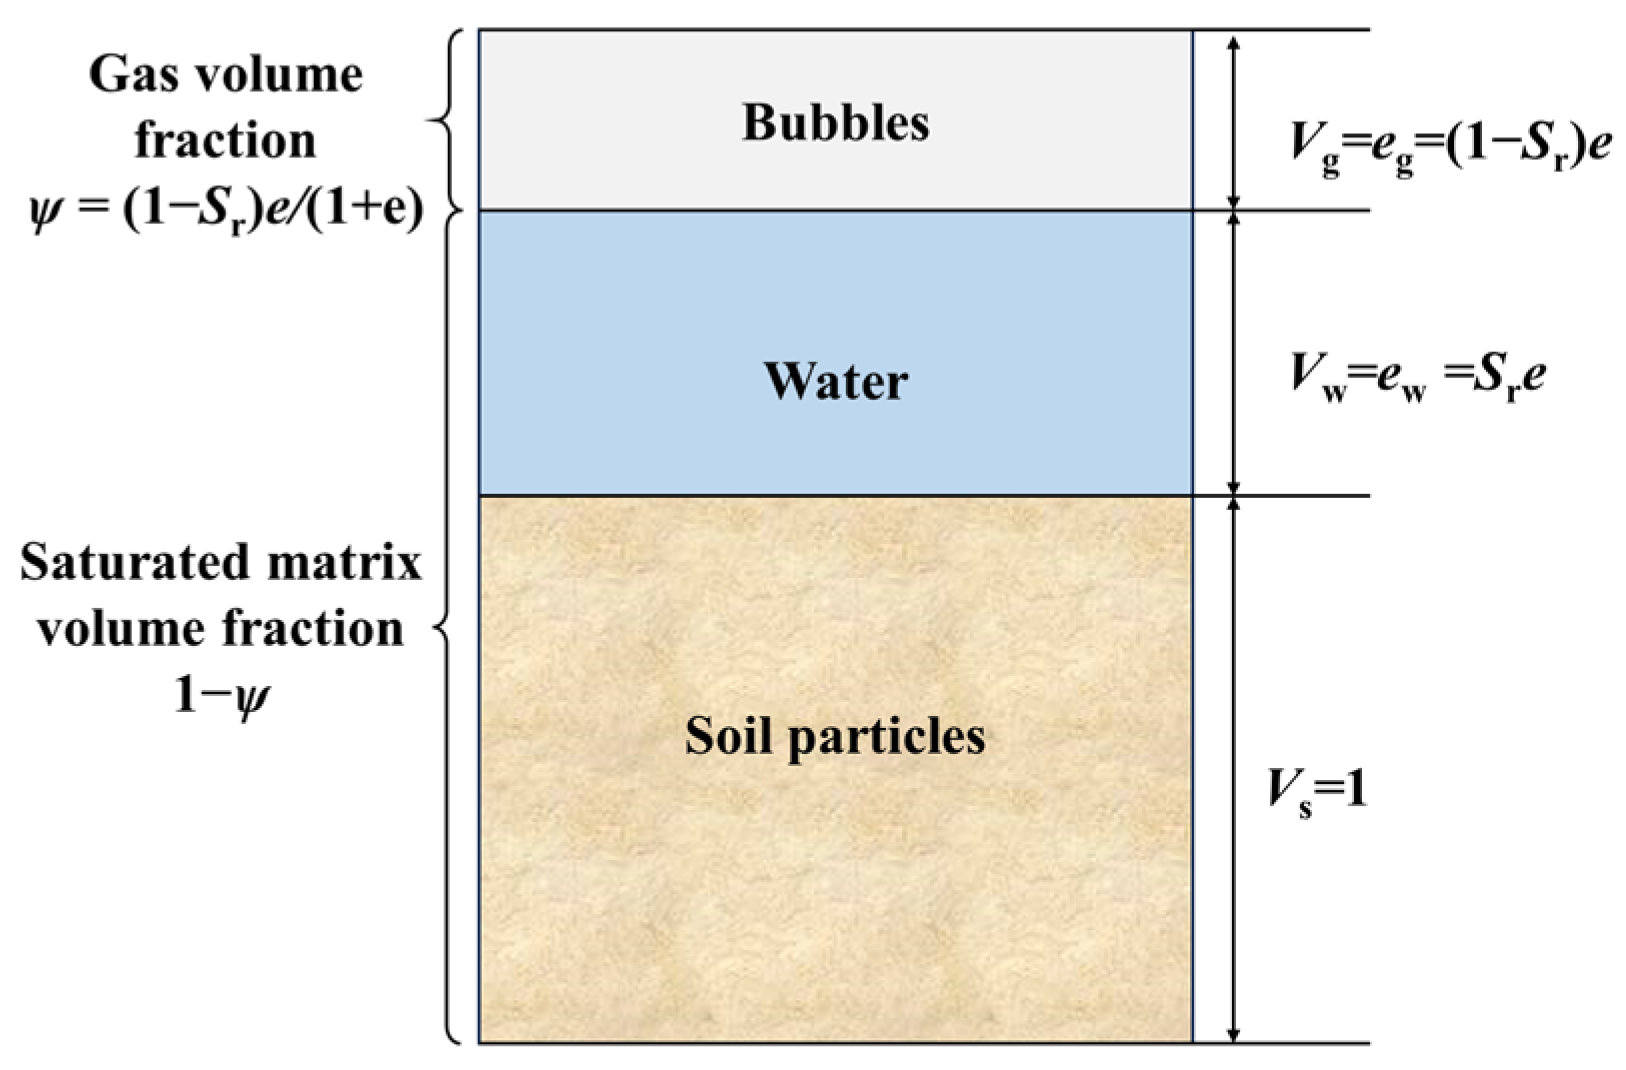
2.1. Testing Material and Preparation of Gassy Specimens

During in situ sampling, gases in gassy soil are prone to exsolution and expansion under pressure variations, causing disturbance and damage to soil specimens [37,38]. This study employed the zeolite molecular sieve technique to prepare reconstituted gassy clay specimens. Chinese kaolin clay was selected as the test soil, wherein gas-absorbed zeolite was incorporated into the slurry to release adsorbed gases [39,40]. Table 1 presents the basic physical property indices of the Chinese kaolin used in the experiments.
The zeolite molecular sieve technique (as illustrated in Figure 3) provides a straightforward and effective methodology with traceable stress history, enabling large-scale preparation of gassy soil specimens whose physical and mechanical properties closely resemble in situ gassy clay. However, this technique exhibits limitations in gas-phase parameter regulation accuracy, particularly in achieving precise quantitative control of gas content. The detailed procedure comprises the following steps: (a) Subject pre-weighed molecular sieve material (zeolite powder, 20% of dry soil mass) to high-temperature drying (105 °C for 24 h), followed by vacuum saturation (−100 kPa for 24 h). Subsequently, introduce N2 into the molecular sieve under high-pressure conditions (200 kPa for 24 h). (b) Mix dry soil (kaolin) with deaerated water at a mass ratio of 1:2 times the Liquid Limit (LL) through thorough homogenization, followed by vacuum saturation under −100 kPa for 24 h. (c) Blend the N2-saturated zeolite powder with the saturated slurry under thorough mixing, facilitating gas–water exchange between the zeolite and slurry to induce bubble nucleation. This process closely replicates bubble formation mechanisms observed in marine sediments. (d) Transfer the slurry to a cylindrical chamber and apply 60 kPa of vertical stress incrementally until pre-consolidation completion.

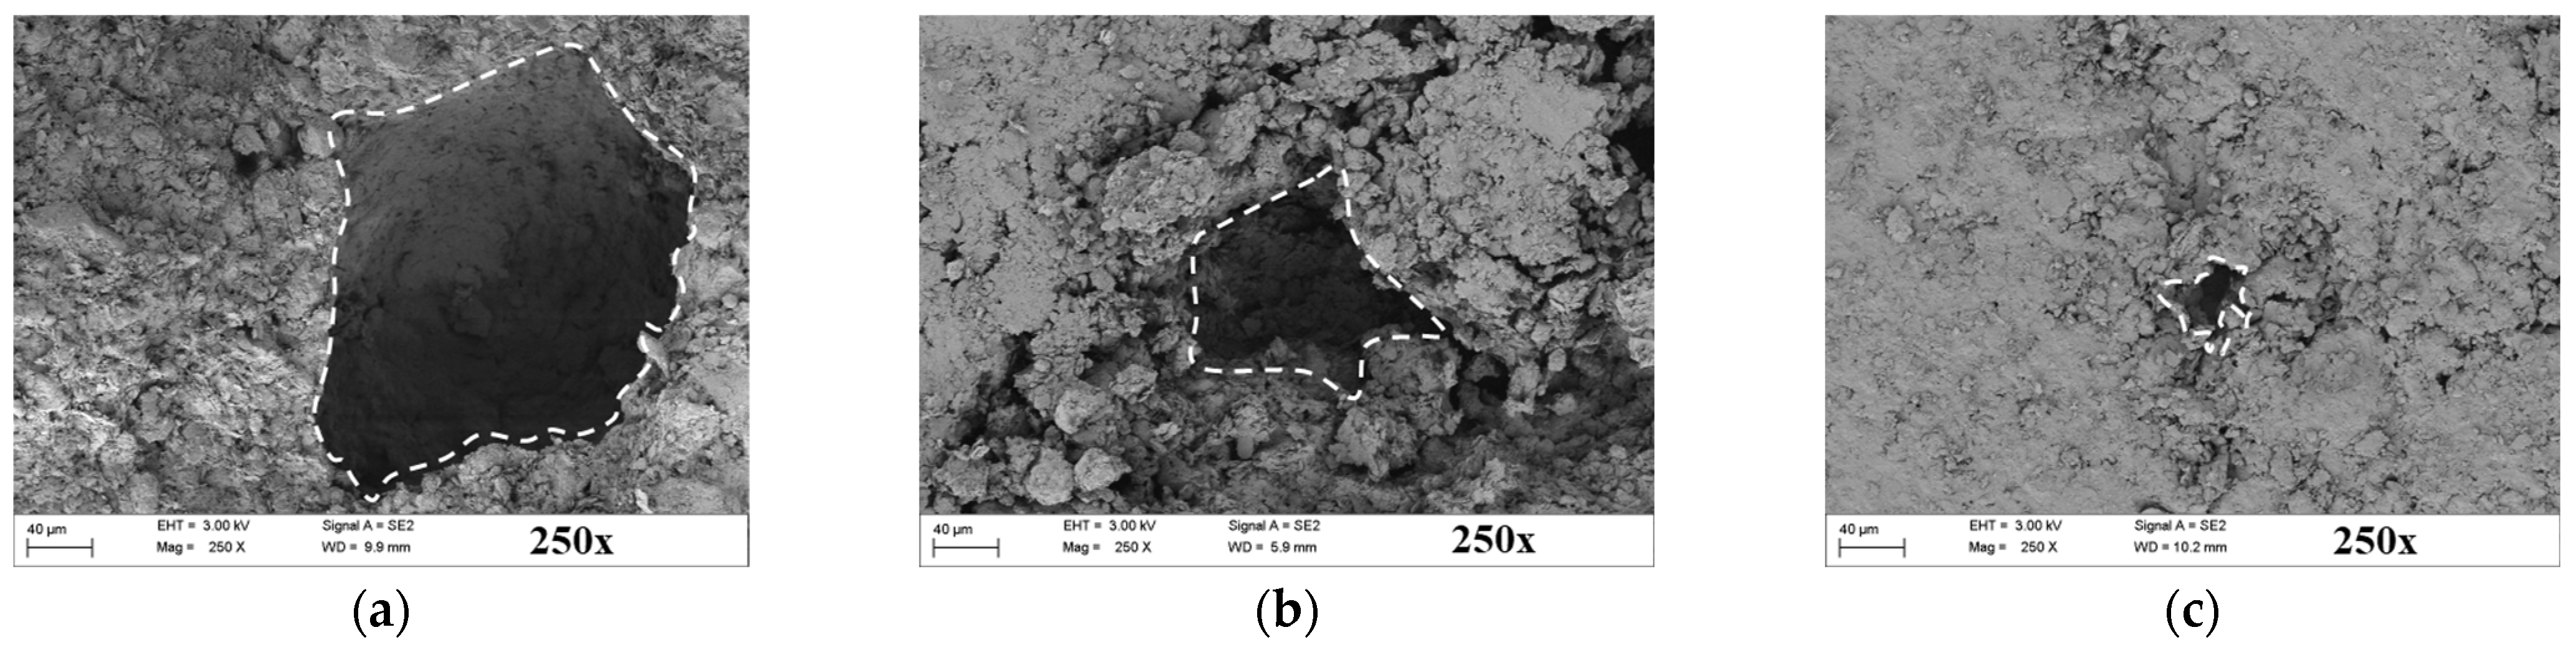
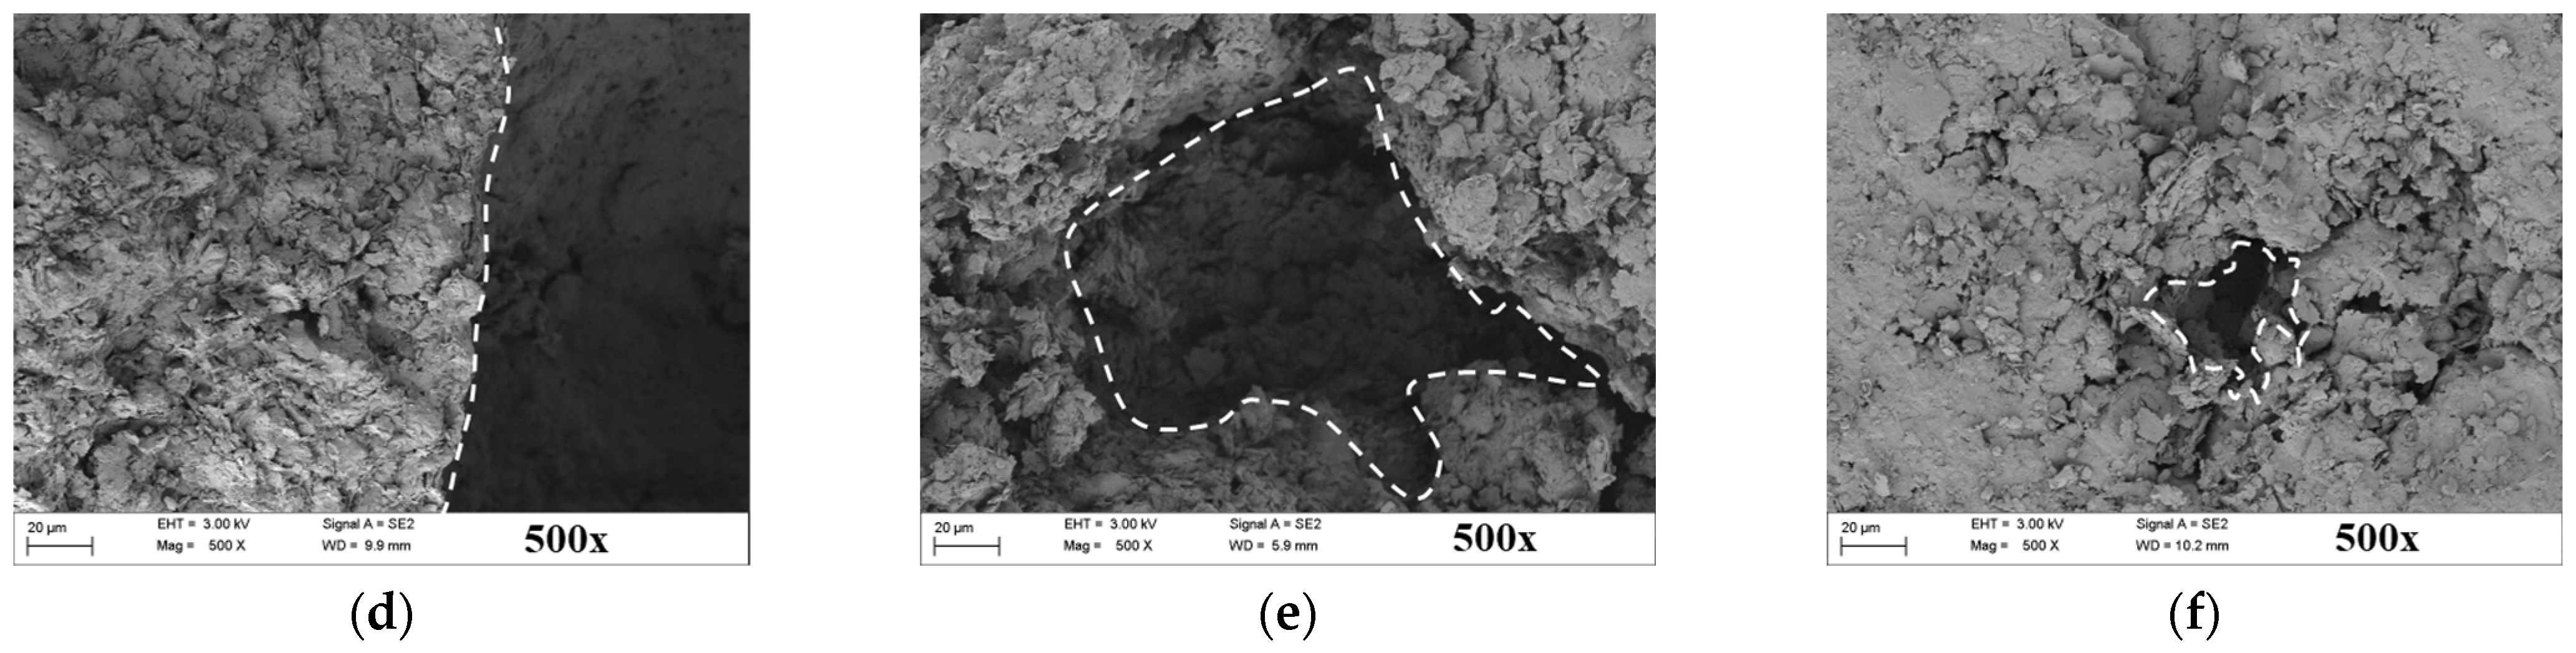
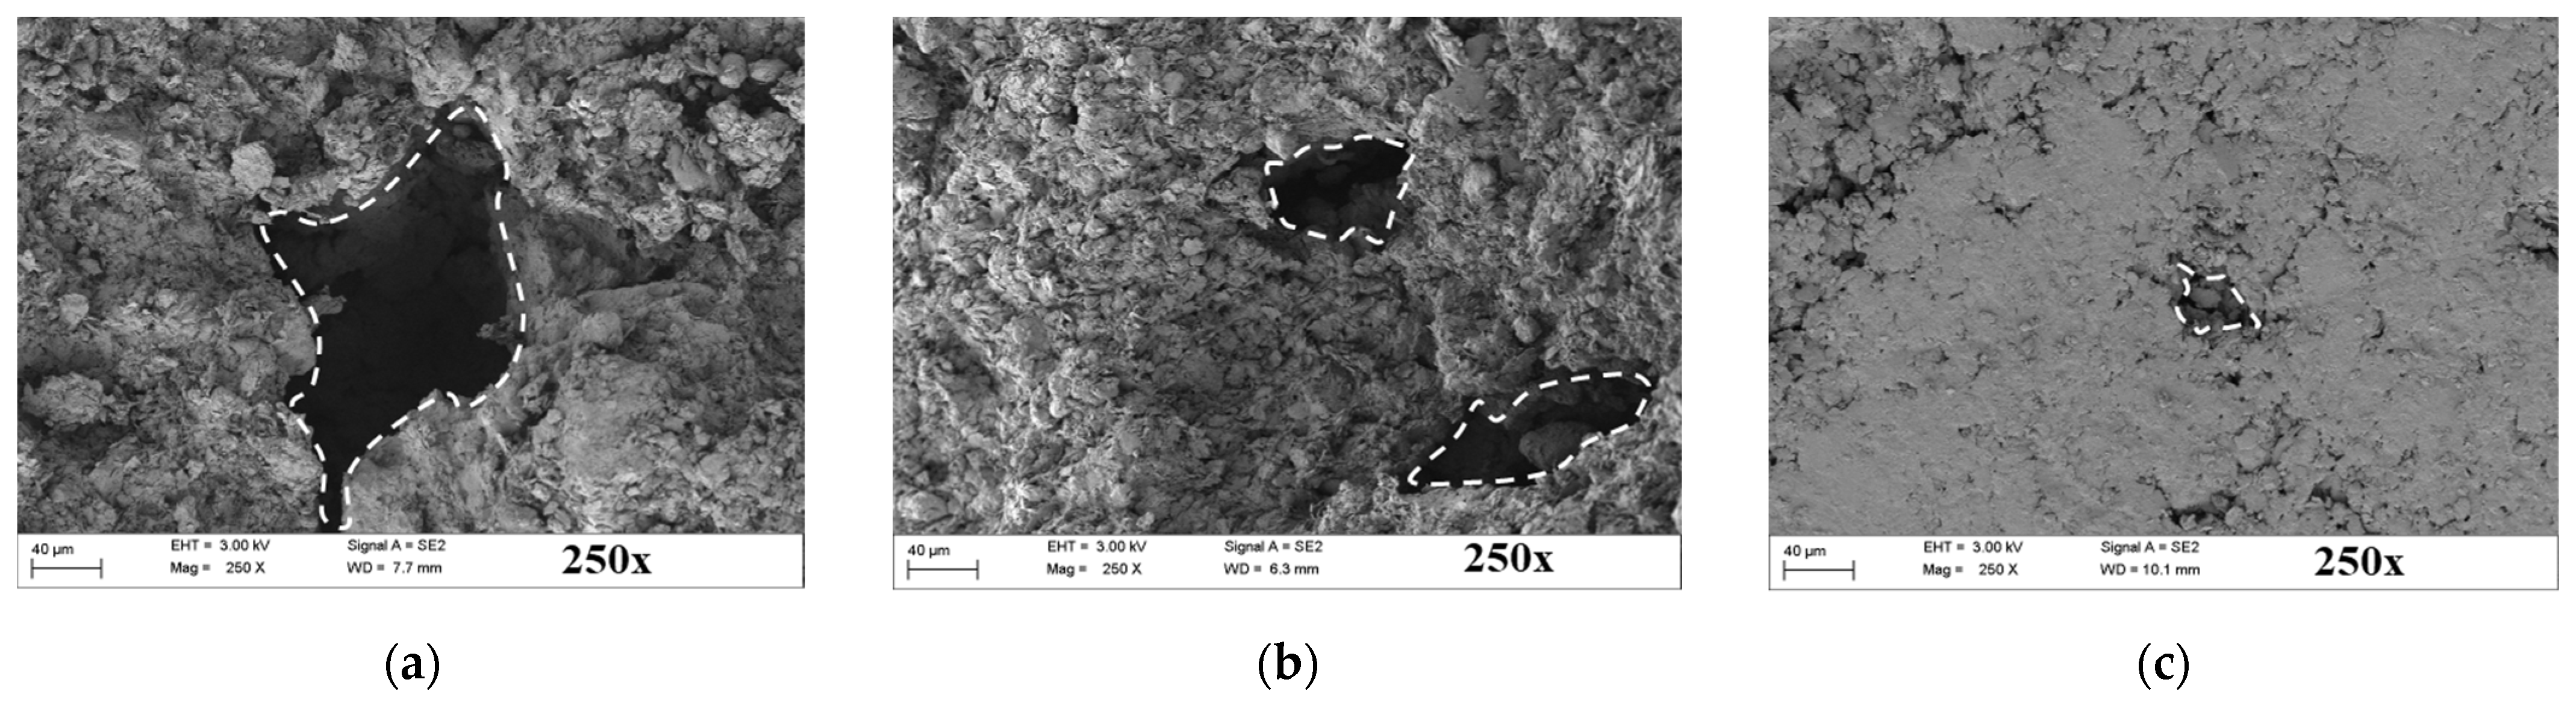
2.2. Scanning Electron Microscope Test

Microstructural characterization of overconsolidated gassy clay was conducted using a ZEISS Sigma 360 scanning electron microscope (Germany), which enables secondary electron imaging, backscattered electron observation, and morphological analysis under variable vacuum conditions. This study focused on gassy clay with overconsolidation ratios (OCR) of 1, 2, and 4. Specimen preparation utilized a GDS Advanced Consolidation System through the following protocol: normally consolidated samples (OCR = 1) were obtained by incrementally loading gassy clay specimens to 100 kPa. For overconsolidated specimens (OCR = 2 and 4), samples were first loaded incrementally to 200 kPa and 400 kPa, respectively, then unloaded to 12.5 kPa, and, subsequently, reloaded to 100 kPa.
The prepared overconsolidated gassy clay was dried, and a 1 cm³ sample was carefully extracted. Using tweezers, the specimen was adjusted to maintain the fresh fracture surface facing upward and fixed to the specimen stub with double-sided adhesive tape, minimizing disturbances such as contact or vibration. The stub was gently transferred to the vacuum chamber for gold sputtering. The vacuum pump was activated to evacuate air and maintain vacuum conditions. Gold sputtering was then performed on the specimen surface to enhance conductivity, improve image quality, protect the sample, and reduce charging effects, thereby providing optimal conditions for observation and analysis. The workflow is illustrated in Figure 4.
Figure 3. The main process of gassy soil preparation using the zeolite molecular sieve technique.
Jmse 13 00904 g003
Figure 4. The main process of SEM test.
Jmse 13 00904 g004

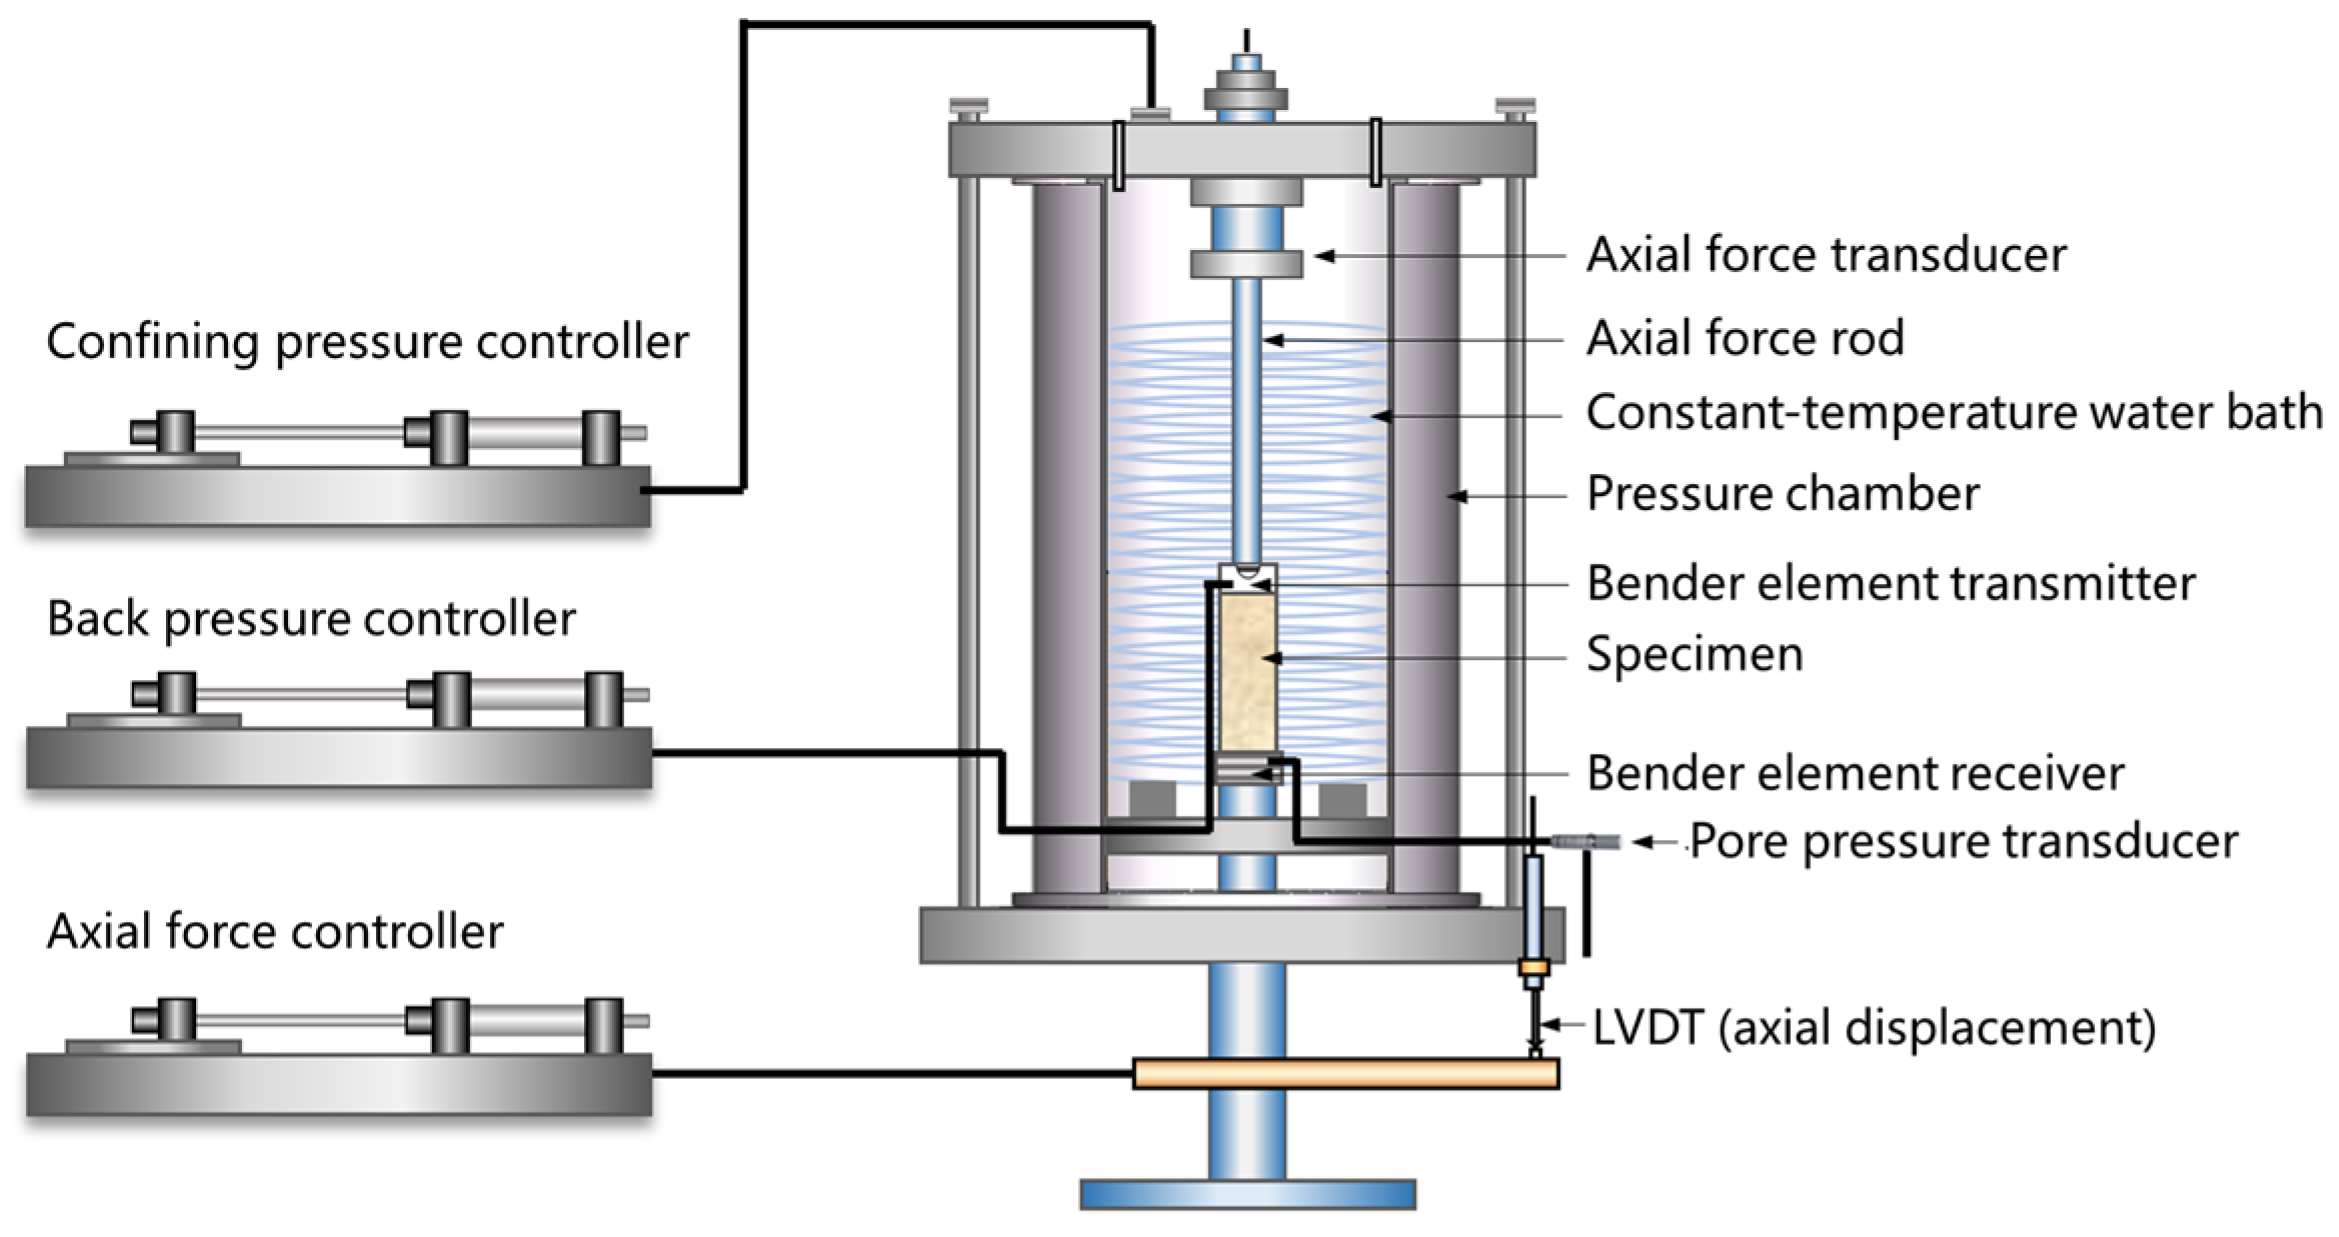
2.3. Consolidated-Undrained Triaxial Compression Test

Consolidated undrained compression tests were conducted on overconsolidated gassy clay using the GDS dynamic triaxial testing system, as illustrated in Figure 5.
The remolded gassy clay specimens were trimmed into triaxial samples with dimensions of 50 mm in diameter and 100 mm in height. During the consolidation phase, initial pore water pressures were set to u0 = 0 kPa and 200 kPa, with a mean effective stress p0 = 100 kPa. Normally consolidated specimens (OCR = 1) underwent isotropic consolidation under 100 kPa effective confining pressure for 48 h. Overconsolidated specimens (OCR = 2 and 4) were first consolidated isotropically under 200 kPa and 400 kPa effective confining pressures for 48 h, respectively, followed by unloading to 100 kPa and reconsolidation for 48 h. Consolidation completion criteria required full dissipation of excess pore pressure or negligible volumetric change. Post-consolidation, drainage valves were closed, and undrained shear testing commenced at a controlled axial strain rate of 0.05%/min until shear failure occurred or axial strain reached 20%. The experimental program and specimen numbering are detailed in Table 2.

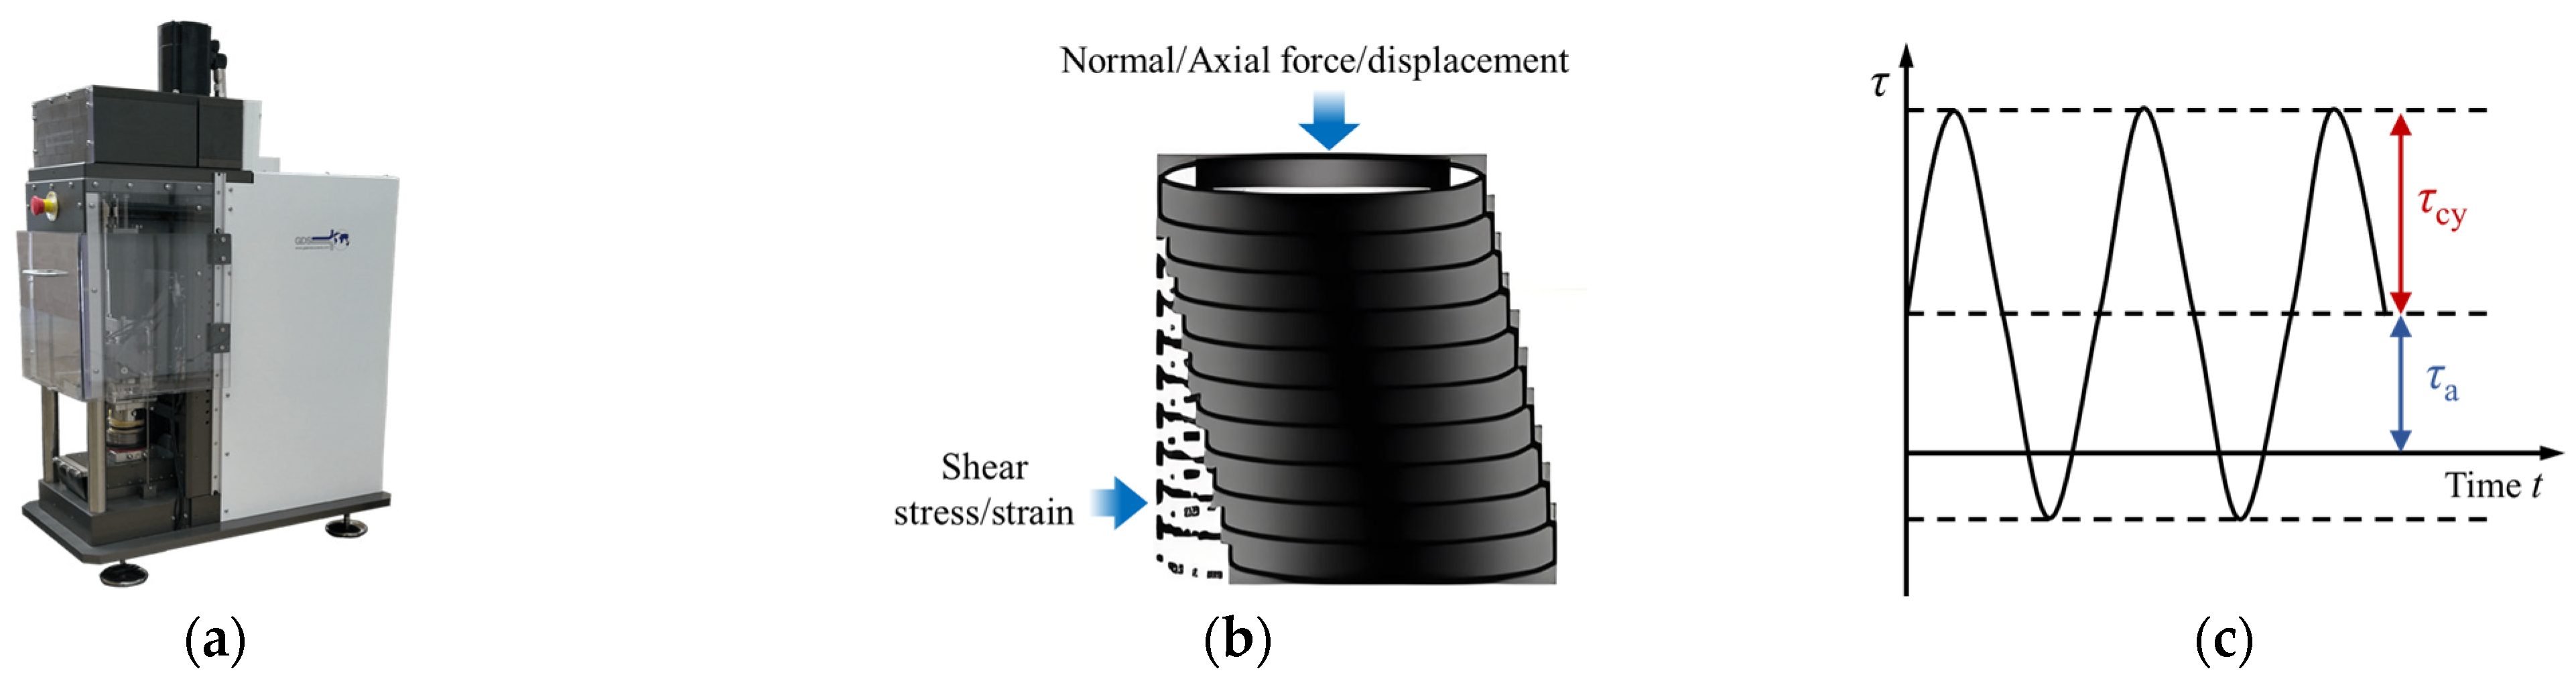
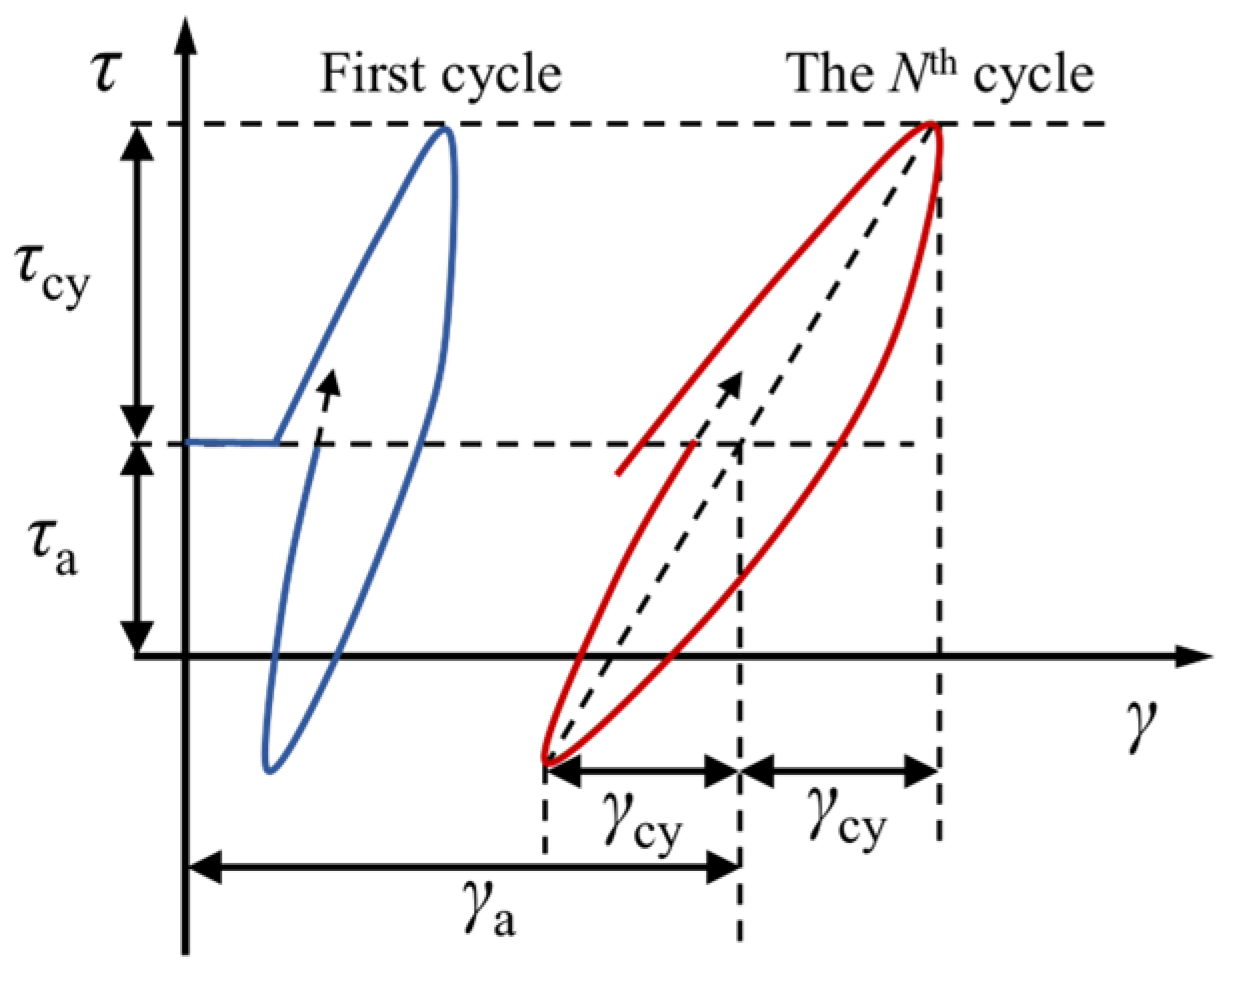
2.4. Cyclic Simple Shear Test

Cyclic simple shear tests on overconsolidated gassy clay were conducted using the GDS cyclic simple shear apparatus, as illustrated in Figure 6a. Figure 6c illustrates the parameter definitions for mean shear stress (τa) and cyclic shear stress (τcy) in cyclic simple shear testing, expressed mathematically as follows:
τ a = ( τ max + τ min ) / 2
τ cy = ( τ max τ min ) / 2
where τa is the mean shear stress (static shear stress), τcy is the cyclic shear stress (dynamic shear stress), and τmax and τmin are the maximum and minimum shear stresses within a single cycle.
This study conducted cyclic simple shear tests on gassy soil and saturated soils with varying overconsolidation ratios (OCRs) under two dynamic shear stress ratios (τcy/τmax), excluding mean shear stress. The experimental program is detailed in Table 3, where τmax represents the maximum shear stress measured via static simple shear tests. The procedure comprises the following: (a) Preparation of simple shear specimens using a ring knife method: samples (70 mm diameter × 20 mm height) were trimmed with filter papers placed on both top and bottom surfaces. (b) Mounting of the rubber membrane-encased specimen onto the shear apparatus base, followed by sequential installation of lubricated shear rings. (c) Consolidation under vertical stresses of 100, 200, and 400 kPa with drainage valves open. Upon vertical displacement stabilization (24 h), unloading to 100 kPa achieved OCR = 1, 2, and 4. Specimens were then equilibrated for 24 h. (d) The vertical loading system was locked to maintain a constant volume. Horizontal shear force was applied at 0.1 mm/min until shear strain reached 16%, with τmax recorded at termination. (f) Repeating steps (a)–(c), followed by application of sinusoidal cyclic shear stresses with amplitudes of 0.5τmax or 0.25τmax at 0.1 Hz until the cumulative shear strain attained 16%.

3. Experimental Results and Discussion

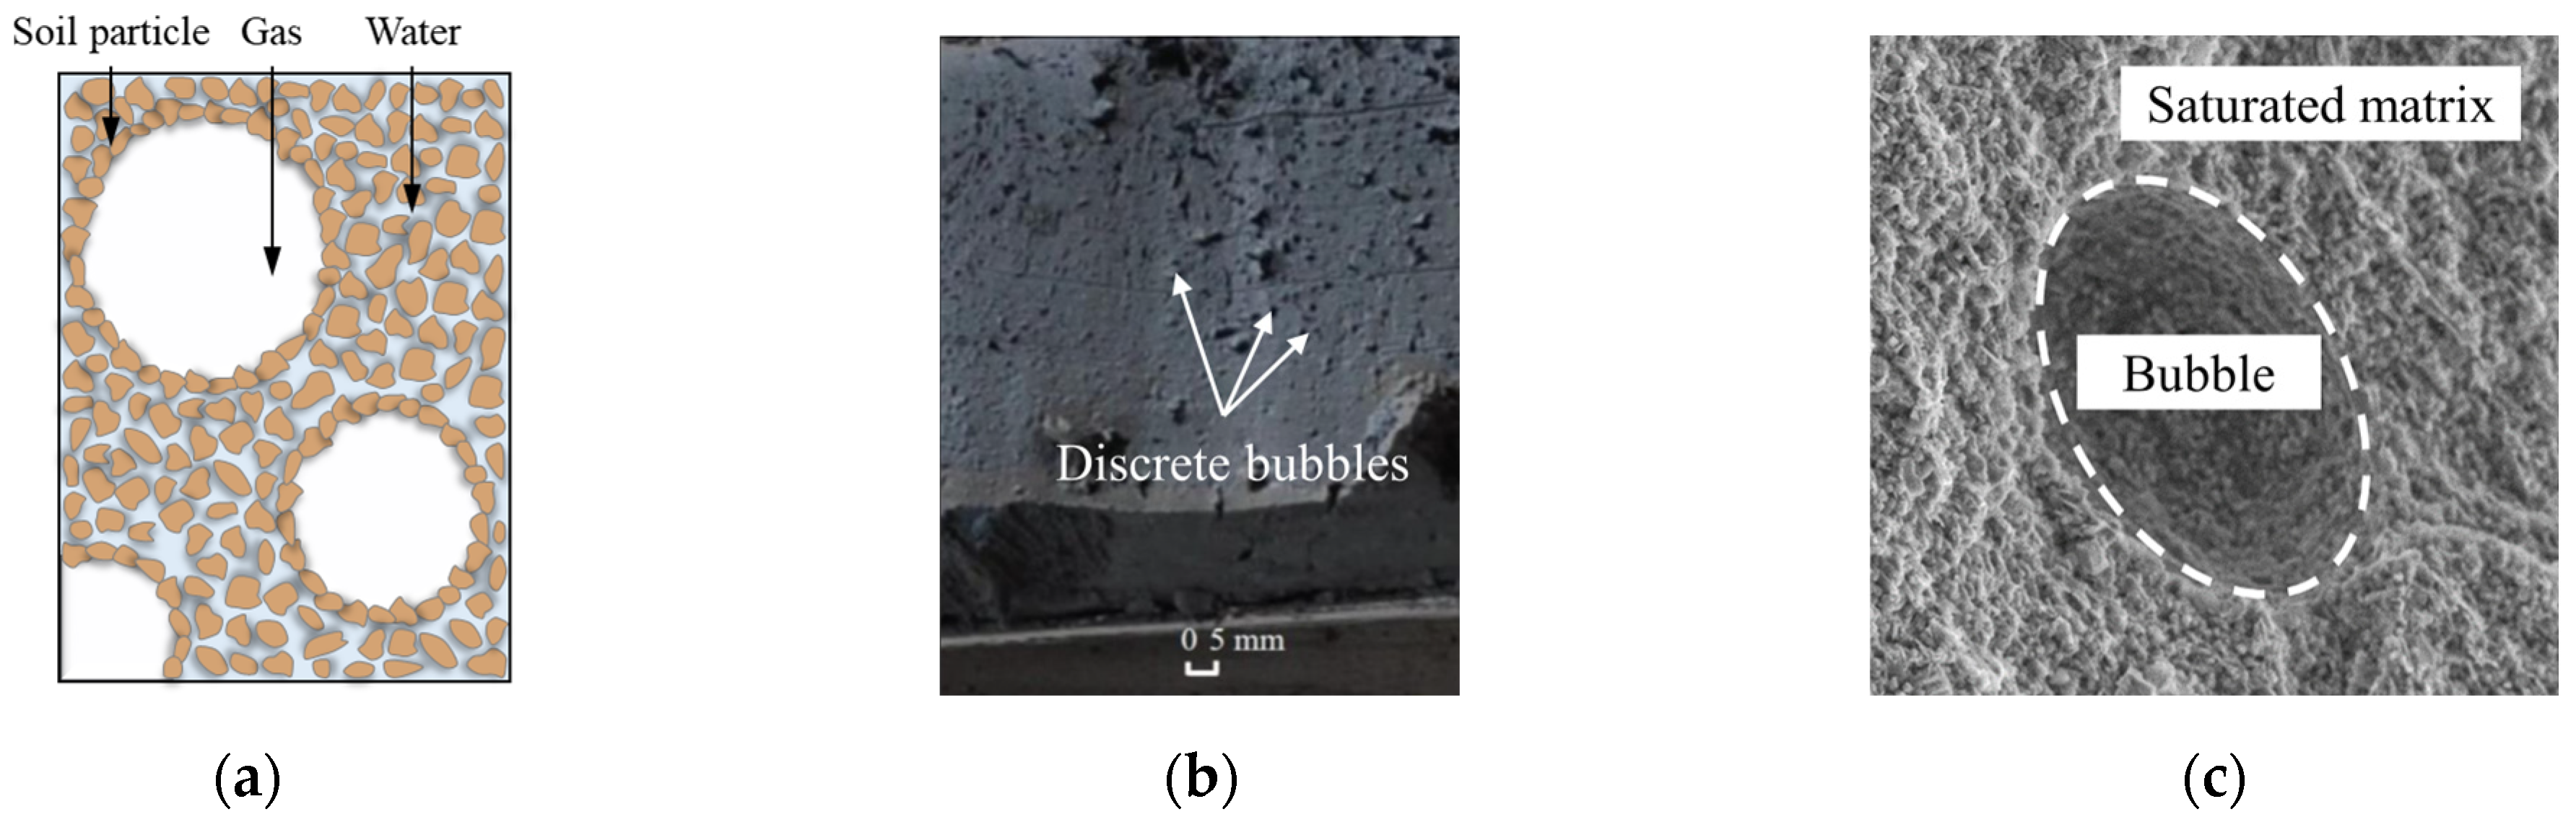
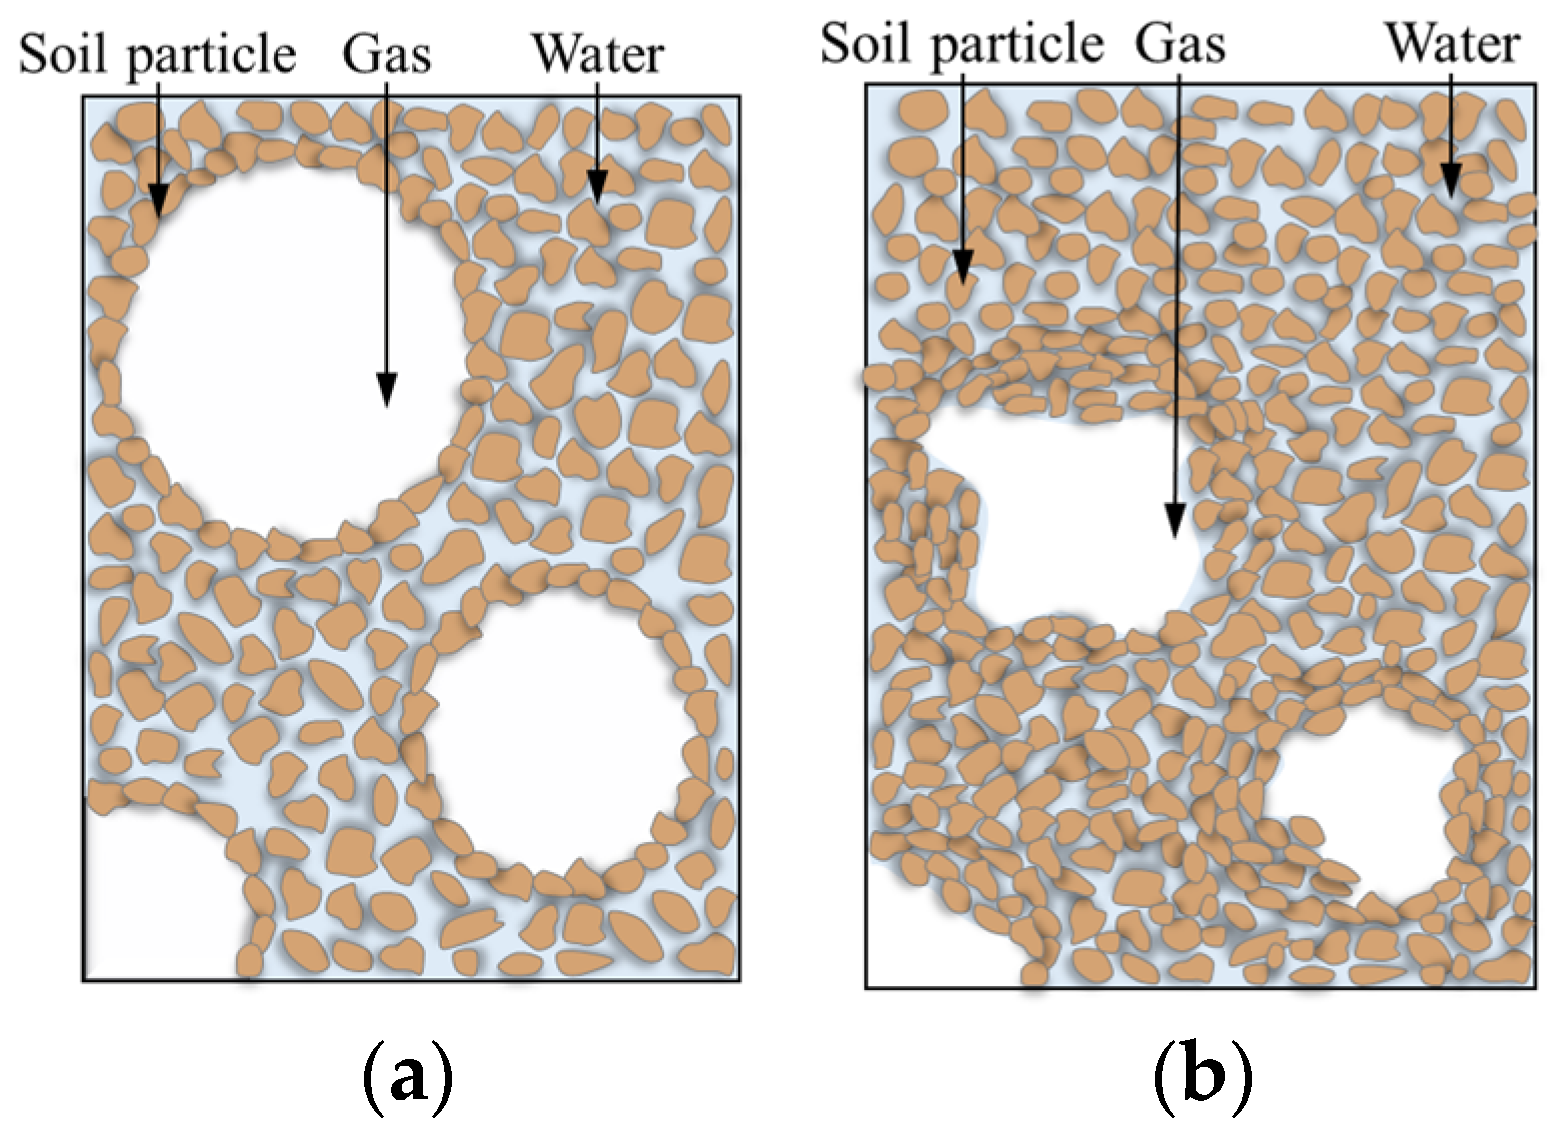
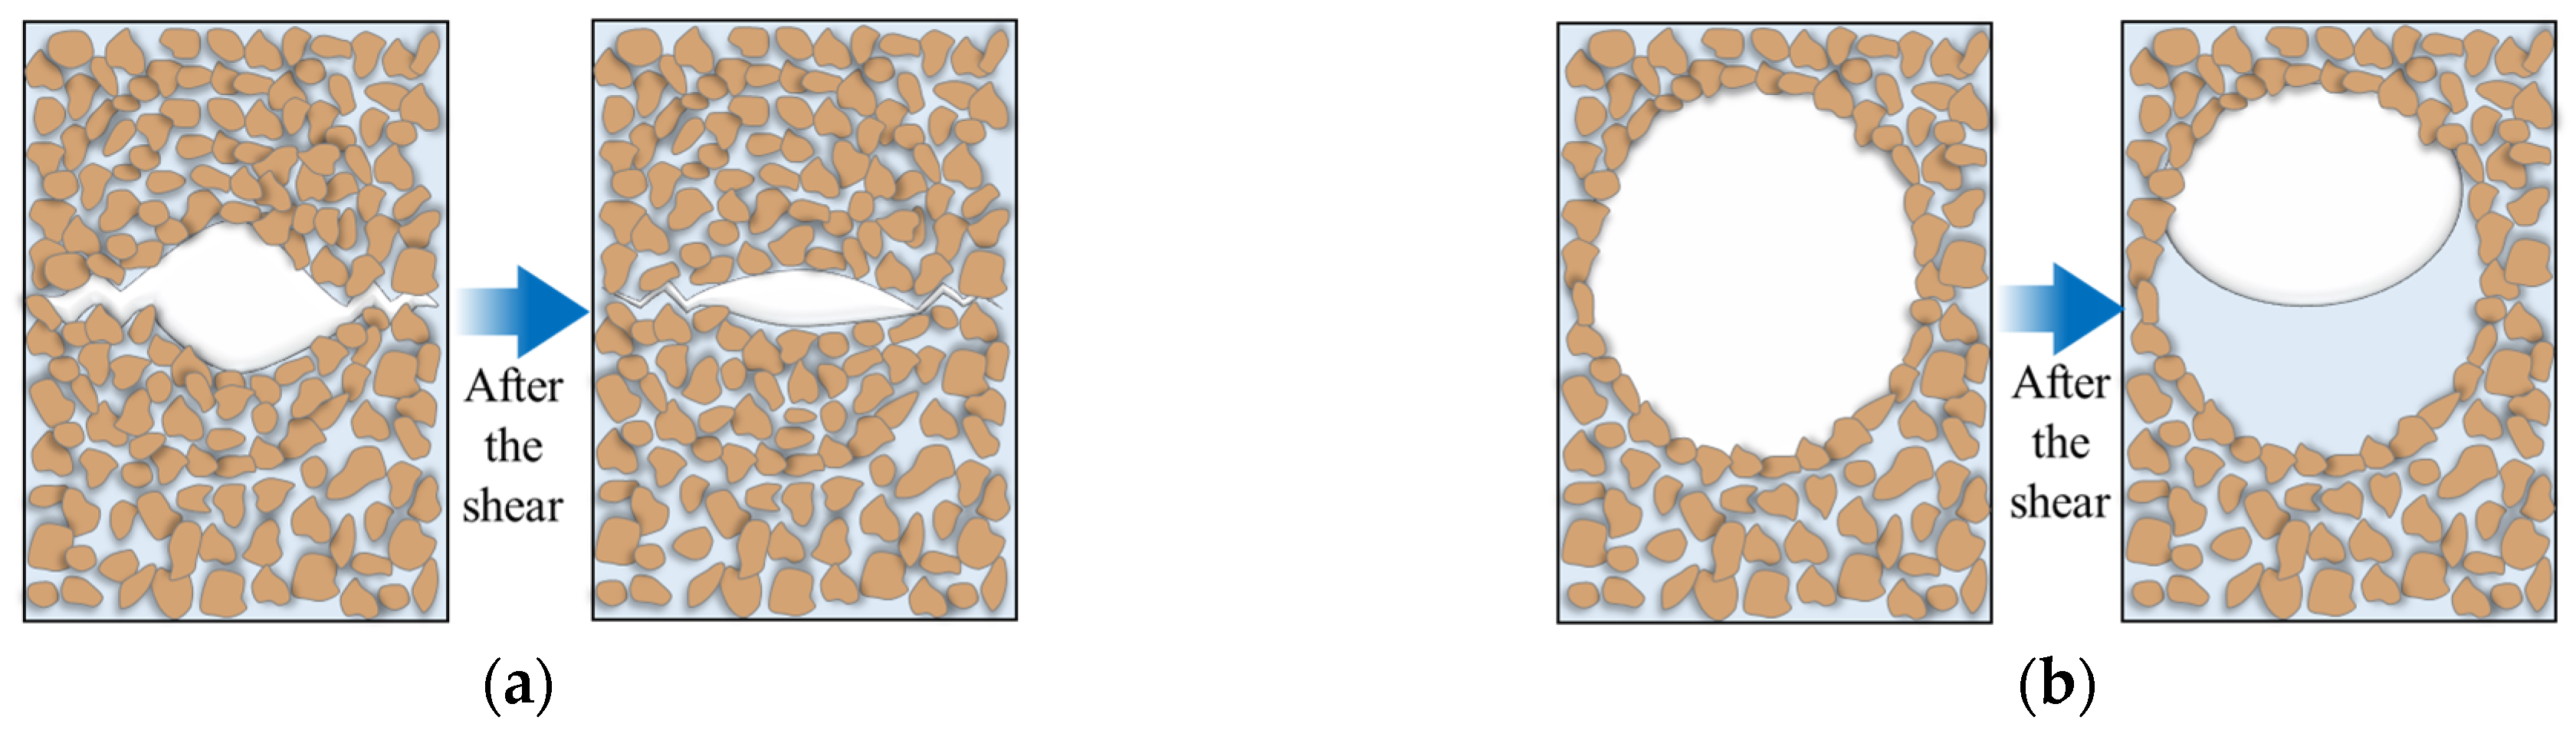
3.1. Micromorphological Characteristics

Microstructural analysis of remolded gassy clay was conducted through scanning electron microscopy (SEM) at 250× and 500× magnifications (Figure 7), revealing distinct gas bubble structures (the dashed line boxs in white) and their spatial distribution relative to soil particles. The observed microstructure aligns with natural gassy clay reported by Hong [10] from Zhoushan sediments at 5 m water depth, validating the reliability of the specimen preparation method. With increasing overconsolidation ratio (OCR), bubble volume decreased progressively: at OCR = 2, bubble volume reduced to approximately 30% of the normally consolidated state (OCR = 1), transitioning from spherical to collapsed configurations (Figure 7b,d); at OCR = 4, bubble volume further diminished to below 10% of the baseline, exhibiting pronounced collapse (Figure 7c,f).
The observed microstructural alterations may be attributed to the elevated preconsolidation pressure inducing significant irrecoverable plastic deformation in the gassy clay, resulting in tighter particle packing, reduced void ratio, and disruption of stress concentration at soil particle–gas bubble interfaces. Under sustained external pressure (as schematized in Figure 8), gas bubbles underwent volumetric compression accompanied by partial gas dissolution into pore water. Post-unloading, the dissolved gas exhibited negligible re-entrainment into bubbles, while both bubble volume and intergranular porosity demonstrated limited rebound capacity, rendering the microstructure irrecoverable to its pre-overconsolidation state.

3.2. Consolidated Undrained Shear Characteristics

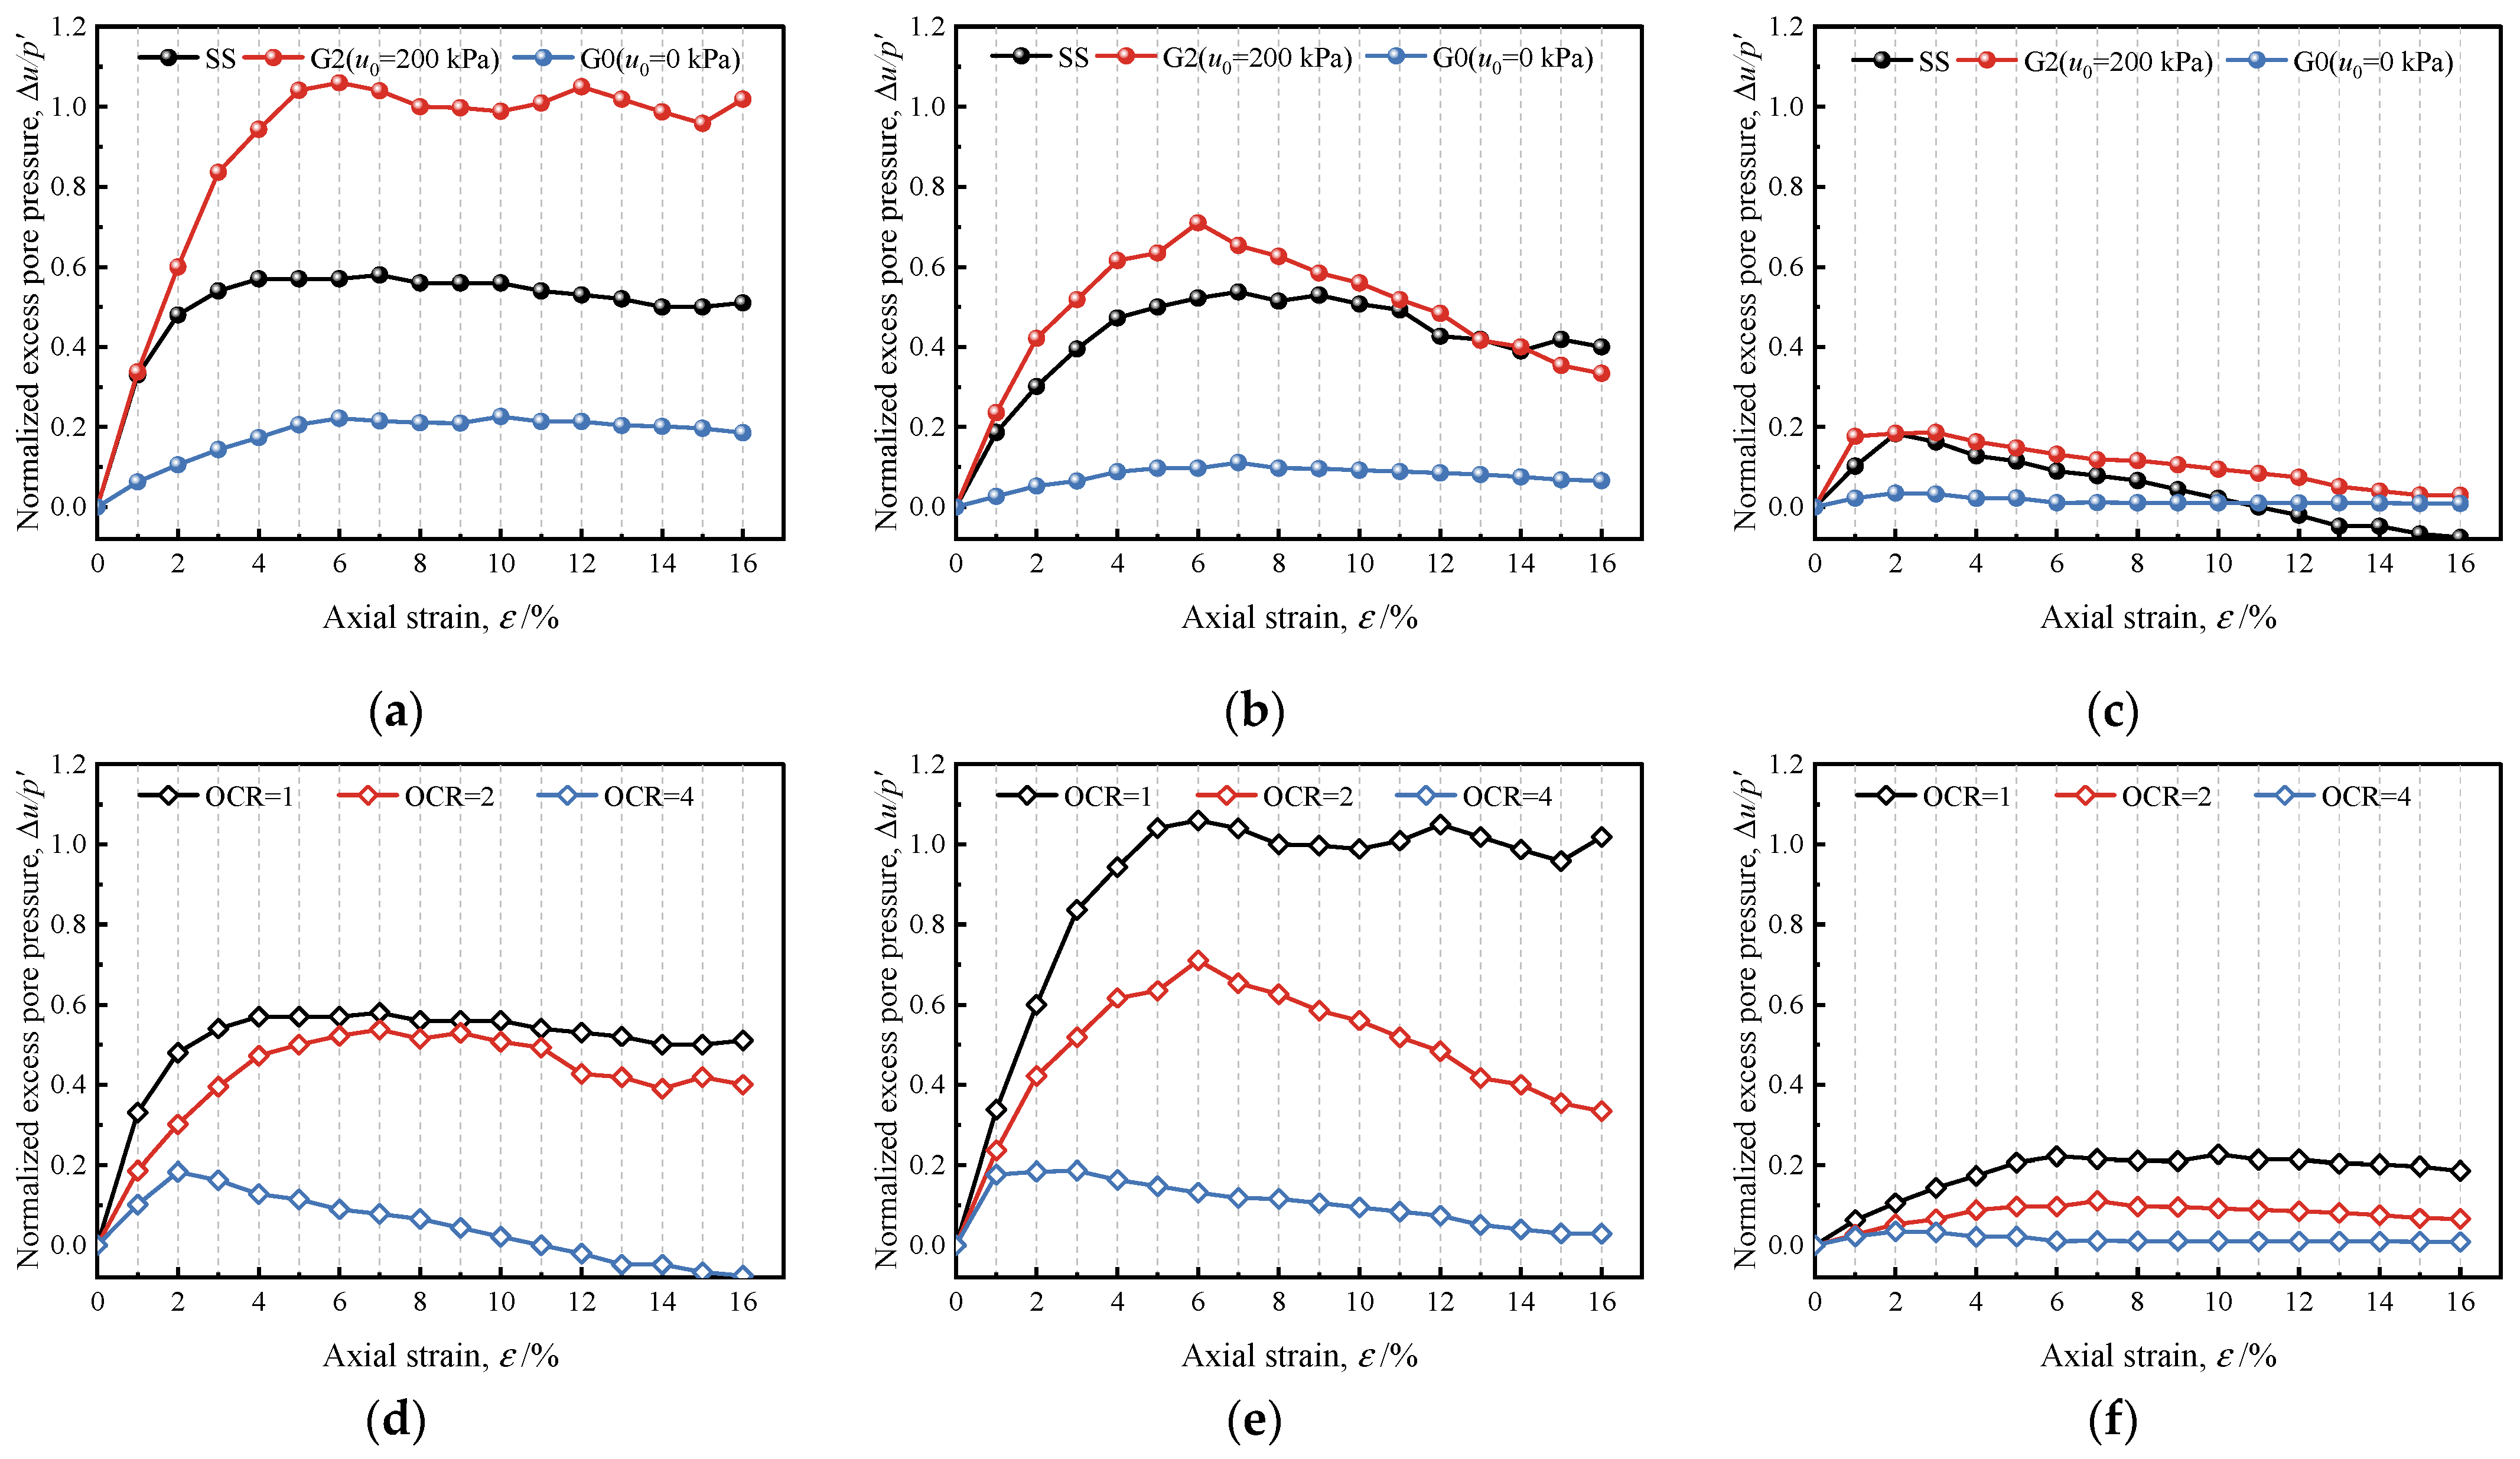
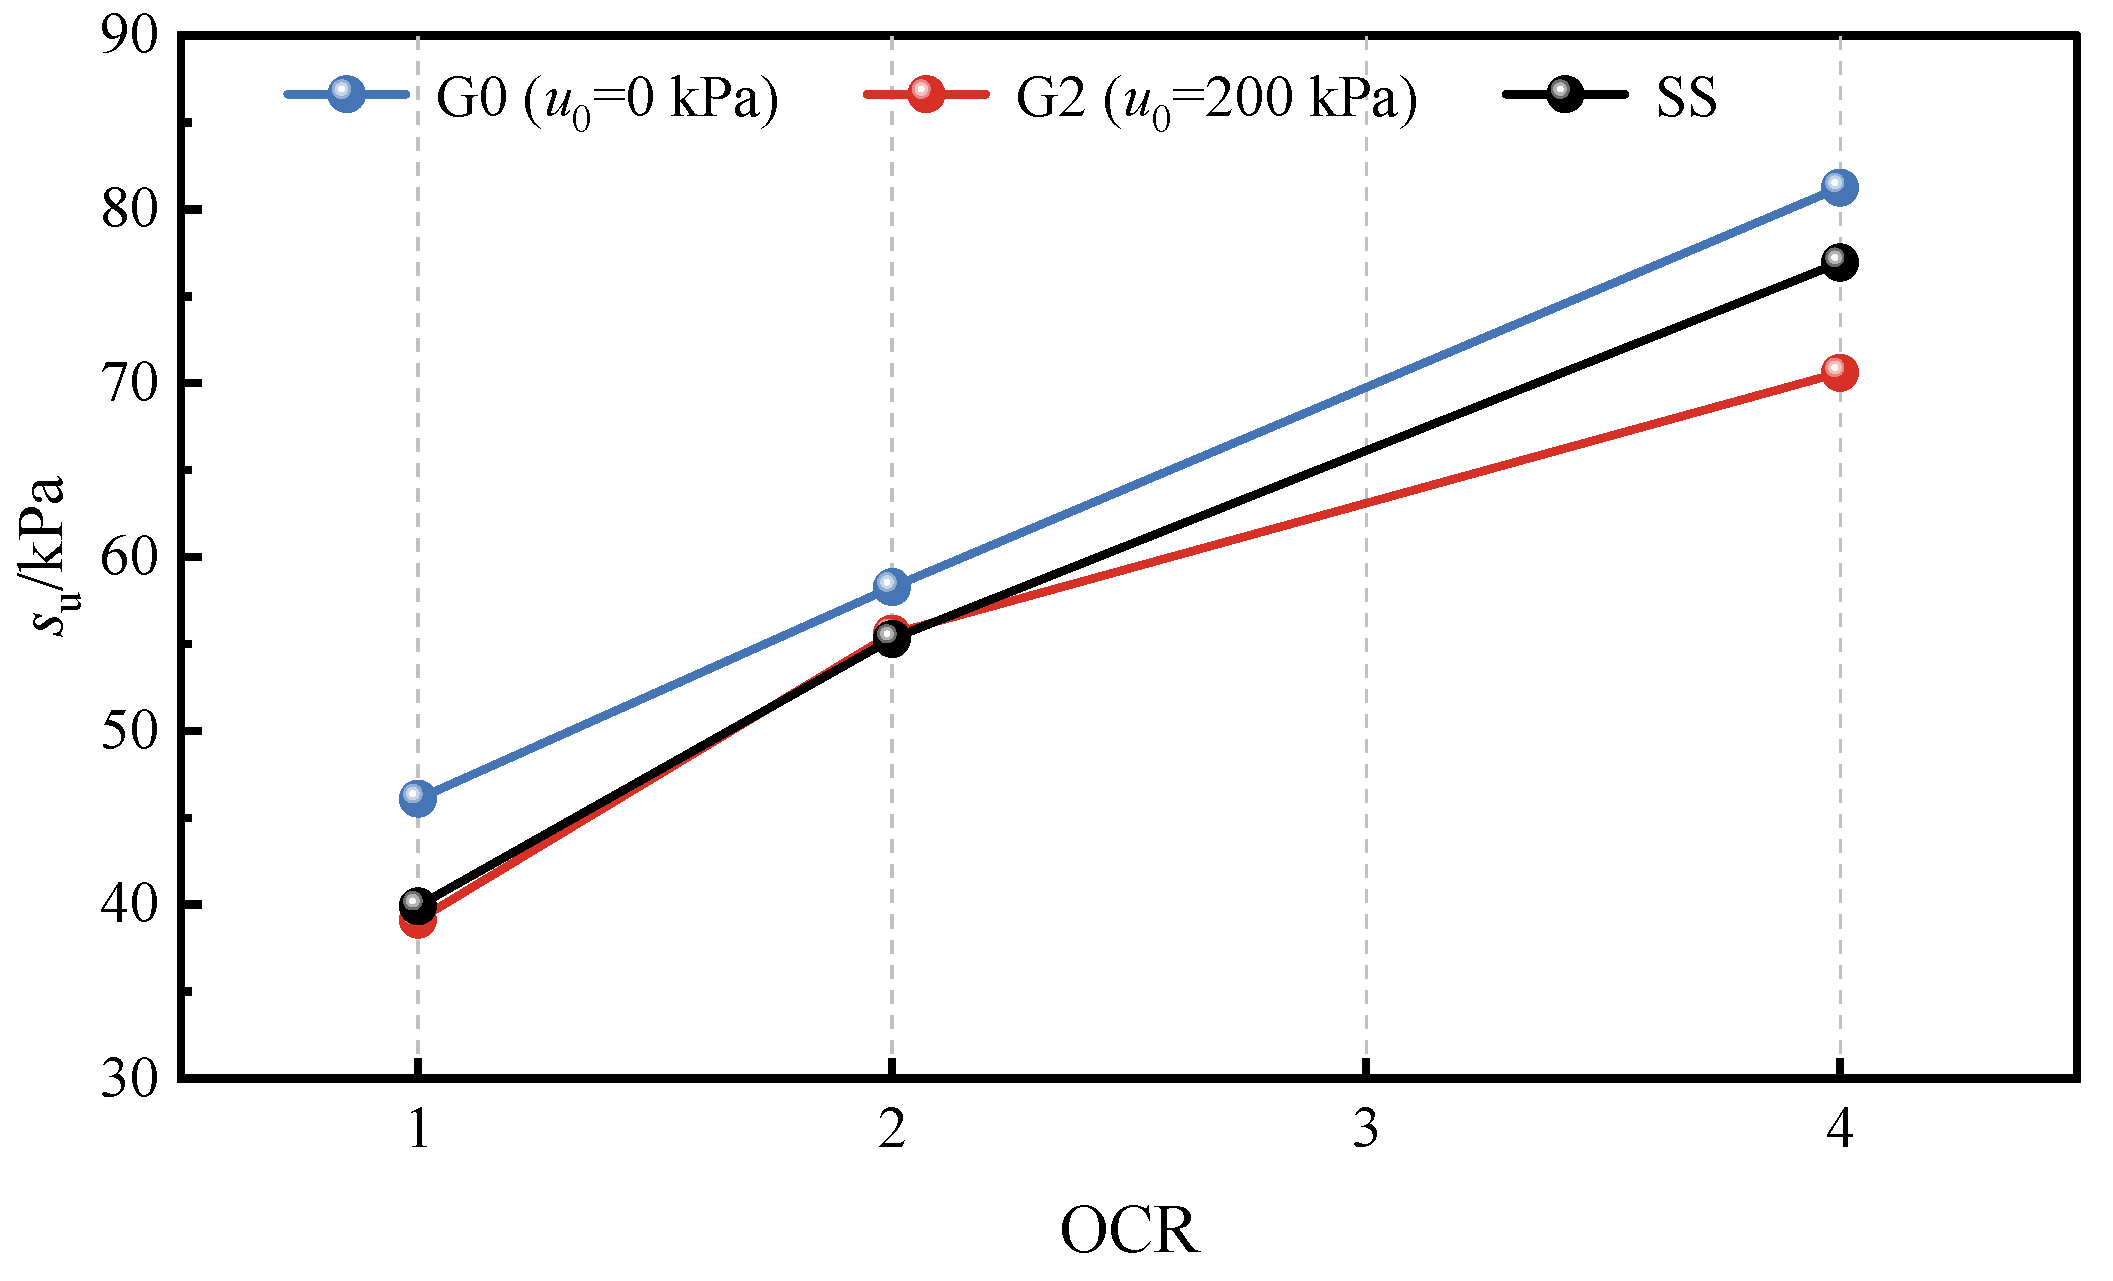
3.2.1. Excess Pore Pressure

The excess pore water pressure (Δu) in soils exhibits a critical relationship with shear strength, directly influencing the shear process. Figure 9 compares Δu evolution during undrained shear between gassy soil and saturated soils across varying overconsolidation ratios (OCR = 1, 2, 4) and initial pore water pressures (u0 = 0, 200 kPa), where Δu is normalized by the effective consolidation pressure p′.
Figure 9 demonstrates that gassy soil and saturated soil with OCR = 1 both exhibited positive excess pore pressure (Δu/p′) with analogous response trends. At axial strains below 5%, Δu/p′ increased rapidly in a near-linear manner with strain; beyond 5% axial strain, the Δu/p′ growth rate decelerated and stabilized, maintaining a plateau until specimen failure. As OCR increased, Δu evolution diverged markedly: specimens with OCR = 2 displayed lower peak Δu/p′ than normally consolidated counterparts, followed by Δu/p′ reduction upon exceeding 10% axial strain before eventual stabilization. For OCR = 4 specimens, peak Δu/p′ further diminished, with Δu/p′ commencing decline at just 2% axial strain and exhibiting significant decline, particularly in saturated soils, where negative Δu/p′ emerged.
The generation of excess pore pressure arises from shear-induced contraction, progressive particle rearrangement, and pore collapse, which promotes shear contraction tendencies, thereby generating positive excess pore pressure. In overconsolidated specimens, preconsolidation pressure enhances initial compaction (lower void ratio), leading to shear dilatancy tendencies. At higher OCR, pronounced dilatancy dominates: initial shear generates positive excess pore pressure until peak strength, followed by excess pore pressure reduction or even negative excess pore pressure due to volumetric expansion exceeding pore water replenishment. For gassy soil, gas bubbles mitigate both the attenuation of shear contraction (at lower OCR) and the intensification of shear dilatancy (at higher OCR). Specifically, at OCR = 2, gassy soils exhibit higher peak excess pore pressure than saturated soils due to the delay of the weakening of shear contraction; at OCR = 4, the excess pore pressure reduction amplitude in gassy soil is significantly smaller than in saturated soils, with no marked negative excess pore pressure observed, as bubbles buffer the enhancement shear dilatancy and the dissipation pore pressure.
Figure 9 reveals that the excess pore pressure (Δu/p′) response of gassy soil correlates with initial pore pressure conditions. At higher initial pore pressure (u0 = 200 kPa), gassy soils exhibit greater Δu/p′ than saturated soils; this Δu disparity diminishes progressively with increasing overconsolidation ratio (OCR). This behavior stems from gas bubbles inducing localized pore development and expansion within the soil matrix, generating microcracks and voids. Under elevated pore pressure, intensified stress concentration at bubble–soil interfaces amplifies during shear, causing collapse of bubble-adjacent voids and subsequent gas/void compression. These mechanisms enhance the shear contraction of gassy soil, thereby elevating Δu/p′.
For overconsolidated gassy clay specimens with an initial consolidation pore pressure u0 = 200 kPa, scanning electron microscopy (SEM) imaging of shear failure planes revealed representative microstructural features, as shown in Figure 10. At elevated initial pore pressures, shear-induced collapse of cracks and voids adjacent to gas bubbles (the dashed line boxs in white) occurred, accompanied by significant bubble compression (mechanism illustrated in Figure 11a). Conversely, under lower initial pore pressures (u0 = 0 kPa), higher gas content and larger bubble dimensions allowed pore water ingress into bubbles during shear, a phenomenon termed “bubble flooding” (Figure 11b), which reduces measured excess pore pressure. The trigger condition of bubble flooding can be calculated by the formula presented by Wheeler [24]:
u w u g = 2 T R
where uw is the pore pressure at the bubble interface, ug is the ambient pore water pressure, T is the temperature-dependent water surface tension, and R is the curvature radius of the water meniscus (equivalent to bubble radius).
Due to shear dilatancy, soil volume expansion facilitates water reentry from bubbles into the saturated matrix, mitigating excess pore pressure decline. In low initial pore pressure conditions, the excess pore pressure reduction trend at higher OCR is attenuated. This is attributed to the lower initial gas content and smaller bubble volume in highly overconsolidated specimens, which limit shear dilatancy.

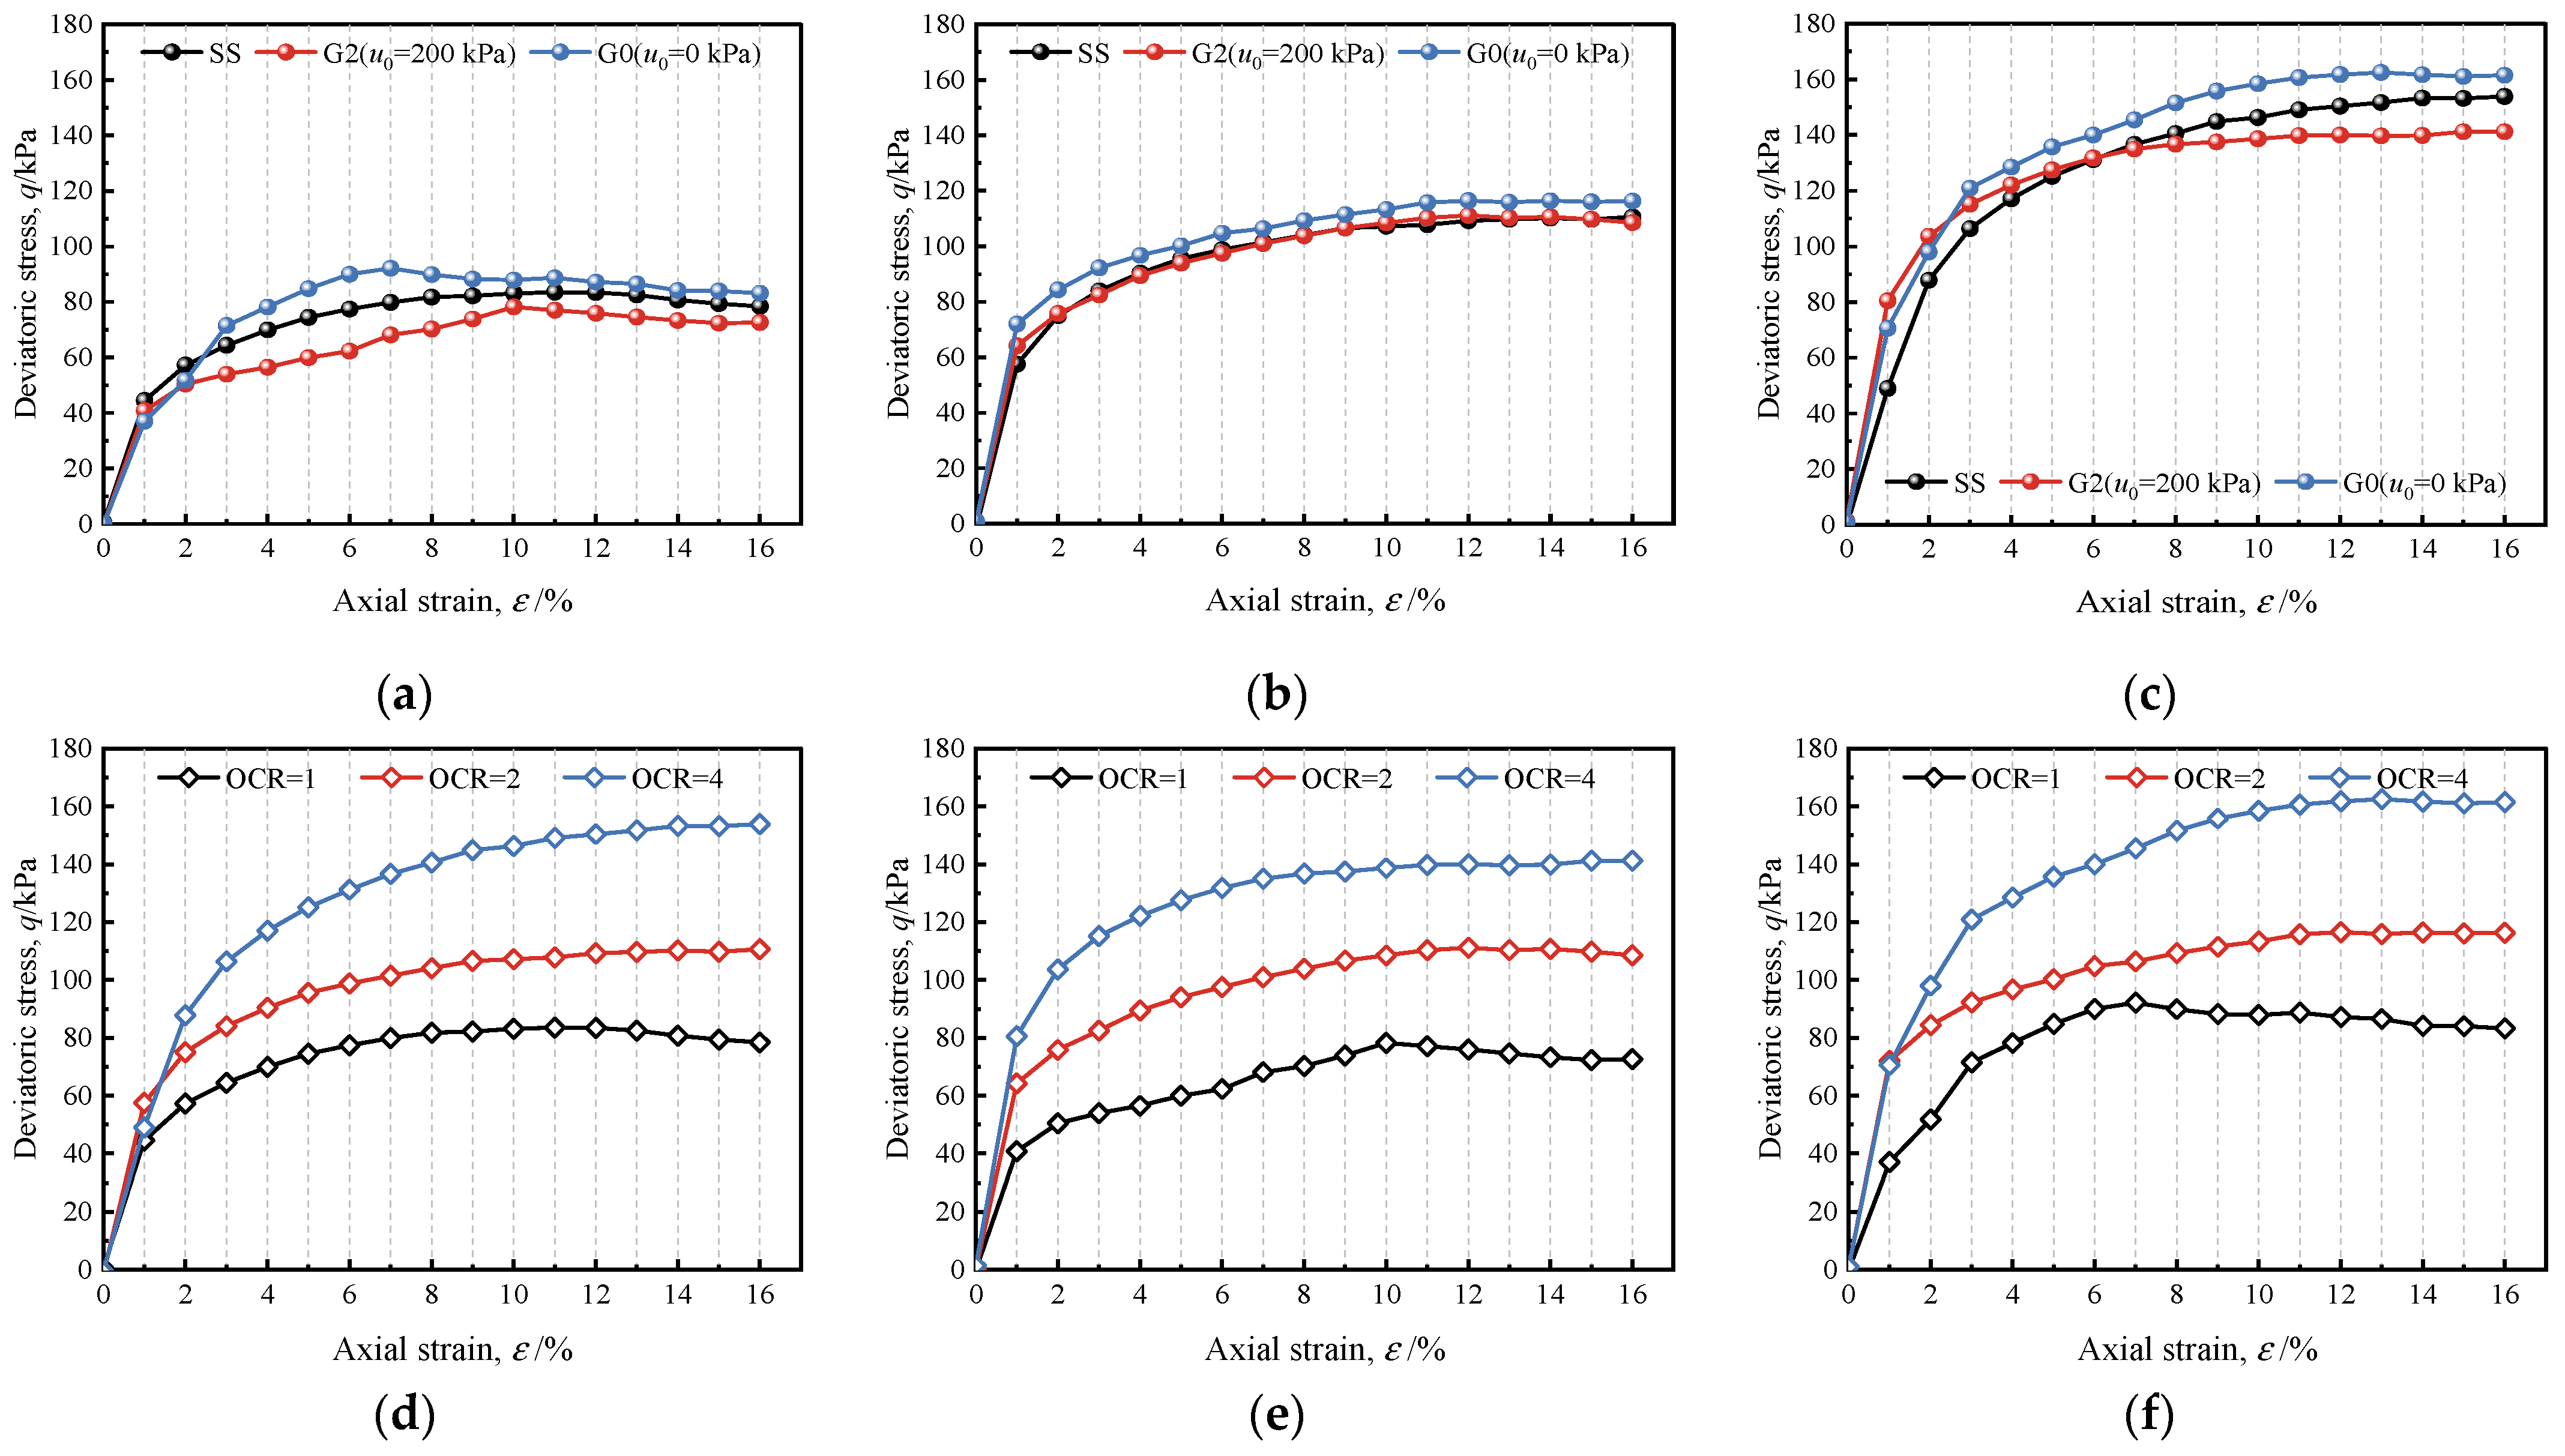
3.2.2. Stress–Strain Relationship
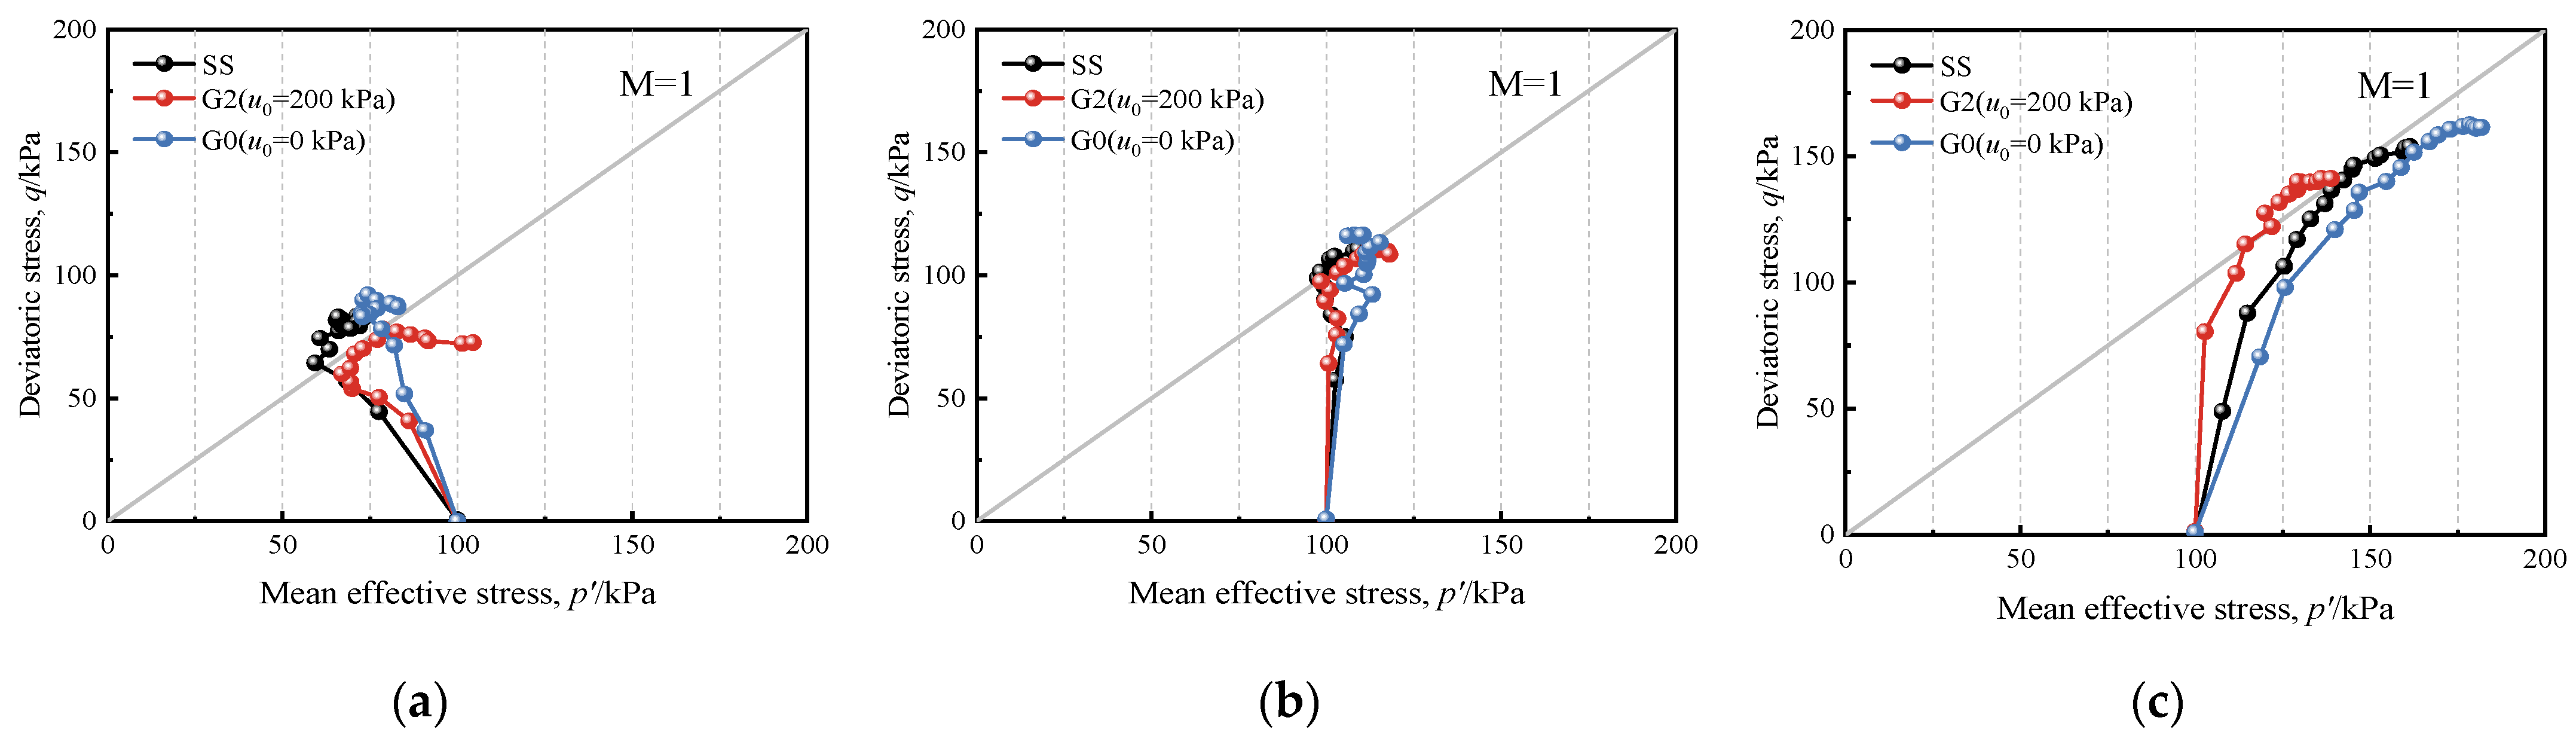
The stress–strain relationship of soils reflects the undrained shear strength during shear. The stress–strain curves of overconsolidated gassy clay and saturated soils, as shown in Figure 12, exhibit similar patterns: during axial strains (ε) below 3%, the deviatoric stress (q) increases rapidly, with gassy clay under lower initial pore pressure (u0 = 0 kPa) showing smaller q, likely attributed to larger bubble size and higher compressibility in low-pore-pressure conditions. As ε increases to 3–8%, the q growth rate slows, but gassy clay at u0 = 0 kPa accelerates and surpasses other specimens. When ε exceeds 10%, all specimens reach peak q and stabilize.
The undrained shear strength (su) in triaxial testing is calculated using the radius of Mohr’s circle, which is taken as half of the failure strength(qf). qf can be determined as either the peak deviatoric stress or the deviatoric stress corresponding to an axial strain of 15% (ε = 15%). Figure 13 demonstrates the undrained shear strength (su) of gassy soil and saturated soils under different overconsolidation ratios (OCRs).
For OCR = 1, gassy soils exhibit higher su than saturated soils at low initial pore pressure (u0 = 0 kPa) but lower su at u0 = 200 kPa, with a 22% reduction in su observed as u0 increases from 0 to 200 kPa. This reduction is attributed to larger bubble volume in gassy soil at low initial pore pressure, where bubble flooding enhances shear strength. For OCR = 2, su increases for both soil types: G2 specimens (u0 = 200 kPa) show a 42% increase, while G0 specimens (u0 = 0 kPa) improve by 26%, likely due to compressed bubbles reducing void collapse and weakening shear contraction. For OCR = 4, compared to OCR = 2, G2 and G0 specimens exhibit further su increases of 27% and 39%, respectively, with gassy soil at low initial pore pressure showing greater enhancement, consistent with Section 3.2.1 analyses on bubble-mediated mitigation of shear contraction attenuation and shear dilatancy intensification

3.2.3. Stress Path

Figure 14 illustrates the stress path curves of gassy soils and saturated soils, showing similar trends for specimens with identical overconsolidation ratios (OCRs) but significant divergence across different OCR values. With a rising OCR and decreasing initial pore pressure, the stress path slope progressively increases, which is consistent with previous research results [32,33]. For OCR = 1, the soil initially exhibits elastoplastic behavior during shear, characterized by rapid accumulation of excess pore pressure (excess pore pressure) and gradual reduction in mean effective stress (p′); gassy soils with lower initial pore pressure (u0 = 0 kPa) demonstrate smaller excess pore pressure, resulting in less pronounced p′ reduction. At later shear stages, dilative behavior emerges, slowing the growth of deviatoric stress (q) and excess pore pressure, with p′ reaching its minimum value. For OCR = 2, stress paths adopt an S-shaped trajectory. At the initial stage of shear, the soil is in an elastic state, and the mean effective stress p′ gradually increases. As the pores of the overconsolidated soil are compressed, the soil is in a state of dilatancy during the shear process, resulting in a small increase in the excess pore pressure and a decrease in the late shear period, and the mean effective stress p′ decreases somewhat, but the decrease is lower than that of the soil with OCR = 1. Under OCR = 4, p′ displays a sustained ascending trend prior to critical state attainment, driven by lower void ratio and enhanced dilatancy in highly overconsolidated soils, which suppresses excess pore pressure generation and gradually decreases after the strain reaches its peak, thereby sustaining p′ increase.
The stress path slope of gassy clay with high initial pore pressure is smaller than that of saturated soils under a high overconsolidation ratio (OCR = 4), while closely resembling saturated soils at lower OCR values (OCR = 1, 2). This behavior likely arises from the smaller reduction in excess pore pressure observed in high-OCR gassy clay with high initial pore pressure compared to saturated soils, resulting in a less pronounced increase in mean effective stress (p′). For gassy clay with low initial pore pressure, the excess pore pressure generated under high OCR conditions is significantly lower than in both saturated soils and high-pore-pressure gassy clay, leading to the fastest growth of mean effective stress (p′) during shear.

3.3. Cyclic Shear Characteristic

A total of nine cyclic simple shear tests were conducted according to the program outlined in Table 3. Among these, the gassy clay specimen G025 subjected to cyclic shear at 0.25τmax did not fail even after 10,000 cycles, prompting analysis of its first 1000 cycles to characterize pre-failure behavior [41].

3.3.1. Dynamic Strain

Figure 15 defines the parameters for mean shear strain (γa) and cyclic shear strain (γcy) in cyclic simple shear testing, expressed as follows:
γ a = ( γ max + γ min ) / 2
γ cy = ( γ max γ min ) / 2
where γmax and γmin denote the maximum and minimum shear strains within a single cycle.
This study excludes mean shear stress and mean shear strain. Cyclic shear stress (τcy) is set to 0.5τmax and 0.25τmax. The cyclic shear strain for each cycle is calculated via stress-strain hysteresis loops, with its evolution against cycle count plotted in Figure 16. Under a cyclic shear stress of 0.5τmax, gassy clay exhibits greater cyclic failure resistance (higher cycle counts to failure) than saturated soils across all overconsolidation ratios (OCRs). This enhanced performance likely stems from bubble flooding during shear, which mitigates cyclic pore pressure accumulation and delays failure initiation. At a lower cyclic shear stress of 0.25τmax, gassy clay remains unfailed regardless of OCR, with cyclic shear strain accumulating gradually (maximum < 1%) throughout testing. This demonstrates that increasing the cyclic shear stress ratio (τcy/τmax) under constant OCR conditions accelerates failure susceptibility in gassy clay during cyclic loading.
Under cyclic shear stress of 0.5τmax, the cyclic failure cycles of gassy clay and saturated soils exhibit distinct trends across overconsolidation ratios (OCRs): at OCR = 1, gassy clay (NG05 = 169) surpasses saturated soil (NSS = 141); at OCR = 2, gassy clay (NG05 = 928) significantly exceeds saturated soil (NSS = 87); at OCR = 4, gassy clay (NG05 = 497) remains higher than saturated soil (NSS = 157). The failure cycles of gassy clay first increase then decrease with rising OCR (peaking at OCR = 2), while saturated soils show the opposite trend (lowest at OCR = 2, highest at OCR = 4). This divergence is attributed to OCR-dependent shear strength variations and bubble compression in overconsolidated gassy clay, which modify its dilative/contractive behavior under cyclic loading.

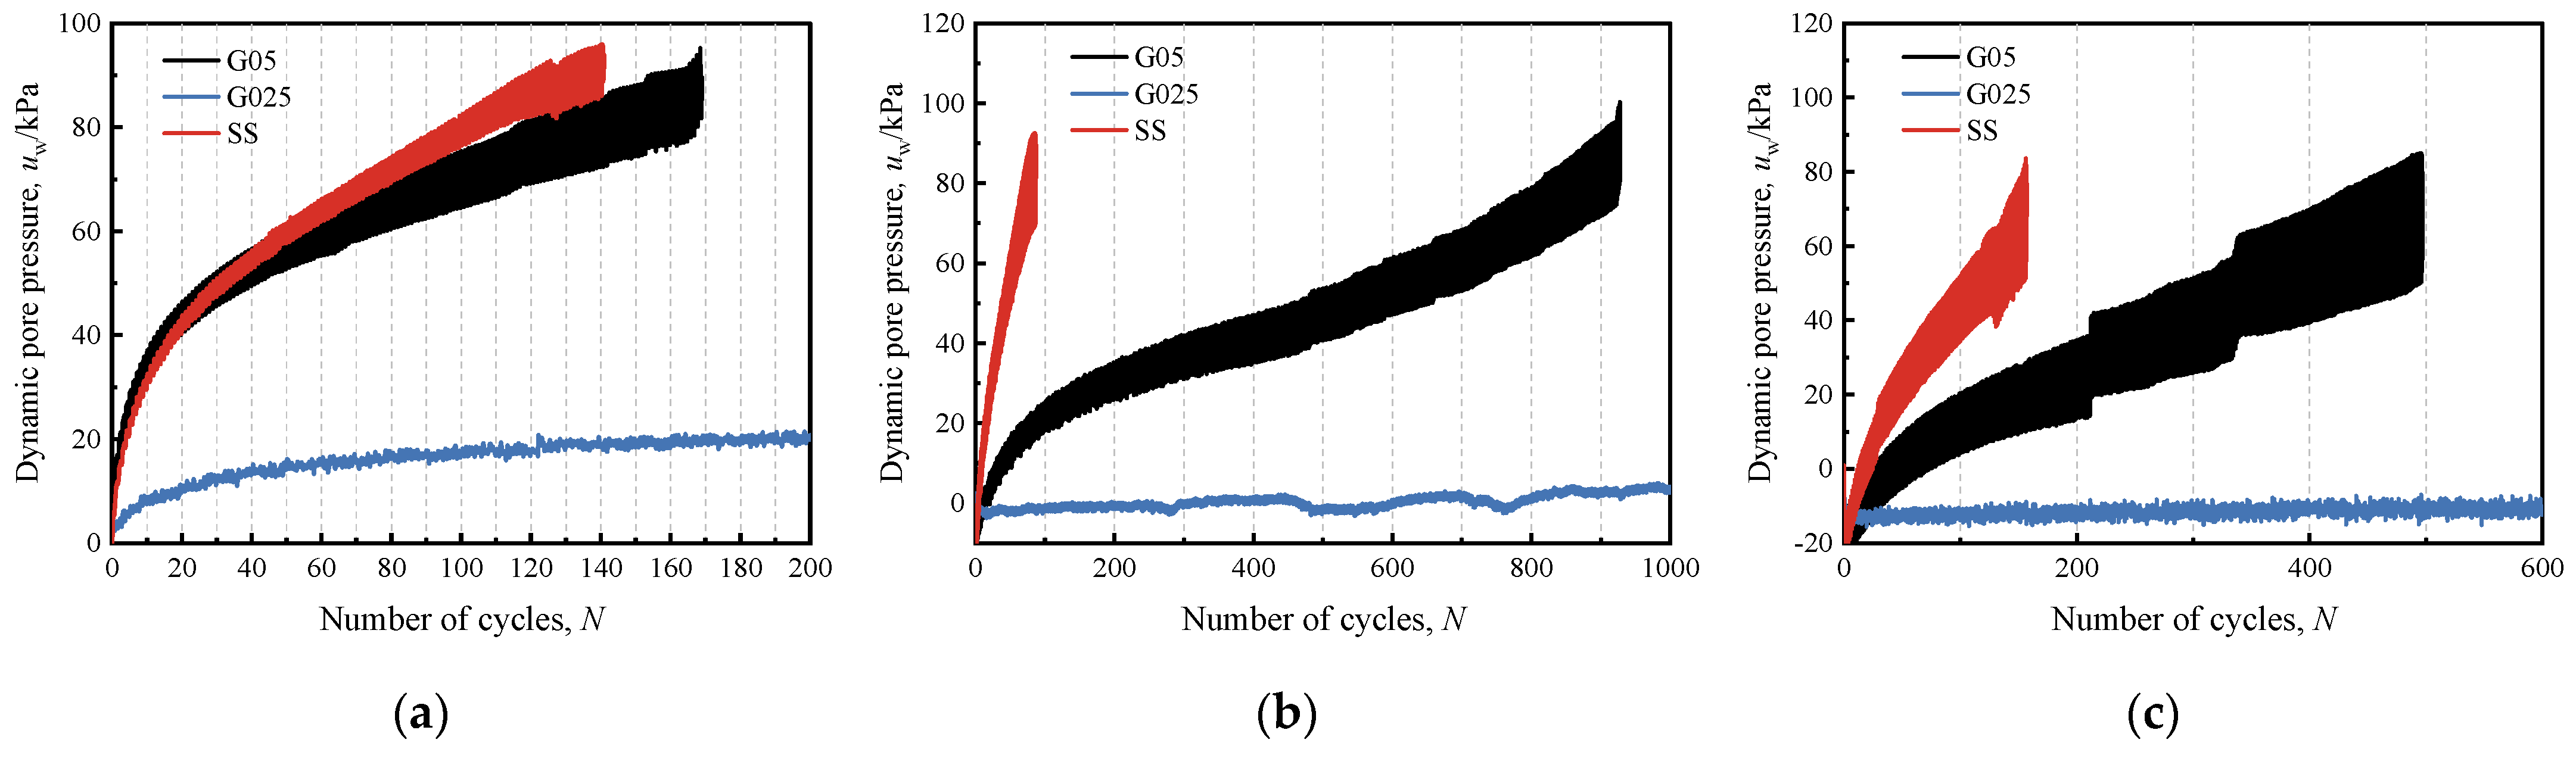
3.3.2. Dynamic Pore Pressure

In cyclic simple shear testing, where the specimen height is maintained constant, the cyclic pore pressure is calculated from the variation in axial stress. Figure 17 illustrates the cyclic pore pressure evolution curves for gassy clay and saturated soils under different overconsolidation ratios (OCRs). The cyclic pore pressure evolution during shear exhibits three distinct phases: initially, at low cycle counts, pore pressure increases sharply; subsequently, it enters a prolonged phase of gradual growth with increasing amplitude; approaching the maximum cycle count, pore pressure surges rapidly again until failure occurs.
In cyclic simple shear testing, normally consolidated soils exhibit a gradual increase in cyclic pore pressure from zero at low cycle counts, whereas overconsolidated soils (OCR = 1, 2, 4) initially develop negative pore pressure before transitioning to positive values. For OCR = 4, the pore pressure reduction is most pronounced (uw < −20 kPa), attributable to the denser structure and amplified dilative tendencies of overconsolidated soils, which suppress pore pressure generation or even induce negative pore pressure during the initial shear phase. As shear progresses, soil deformation and particle rearrangement drive cumulative pore pressure growth until failure.
A comparative analysis of cyclic pore pressure evolution between gassy clay and saturated soils under identical overconsolidation ratios (OCRs) and cyclic shear stress ratios (τcy/τmax) reveals that gassy clay consistently exhibits slower pore pressure accumulation, with saturated soils demonstrating higher pore pressure values at equivalent cycle counts. This behavior arises from bubble flooding in gassy clay during shear, where partial pore water ingress into bubbles suppresses cyclic pore pressure increases. Furthermore, gassy clay’s pore pressure response diverges across varying τcy/τmax conditions: under lower cyclic shear stress ratios, pore pressure accumulates gradually, yielding significantly lower values at identical cycle counts compared to higher τcy/τmax conditions.
Under identical cycle counts, the cyclic pore pressure amplitude increases with rising overconsolidation ratio (OCR), reaching a maximum of 18 kPa for OCR = 4 gassy clay, with gassy soils consistently exhibiting higher amplitudes than saturated soils. This behavior may stem from the enhanced dilative behavior of highly overconsolidated soils under cyclic loading, where greater particle rearrangement amplifies pore pressure generation. Simultaneously, the presence of gas bubbles in gassy clay further modifies dilative tendencies, though the precise mechanistic interplay between bubble dynamics and dilatancy remains unresolved and warrants further investigation.

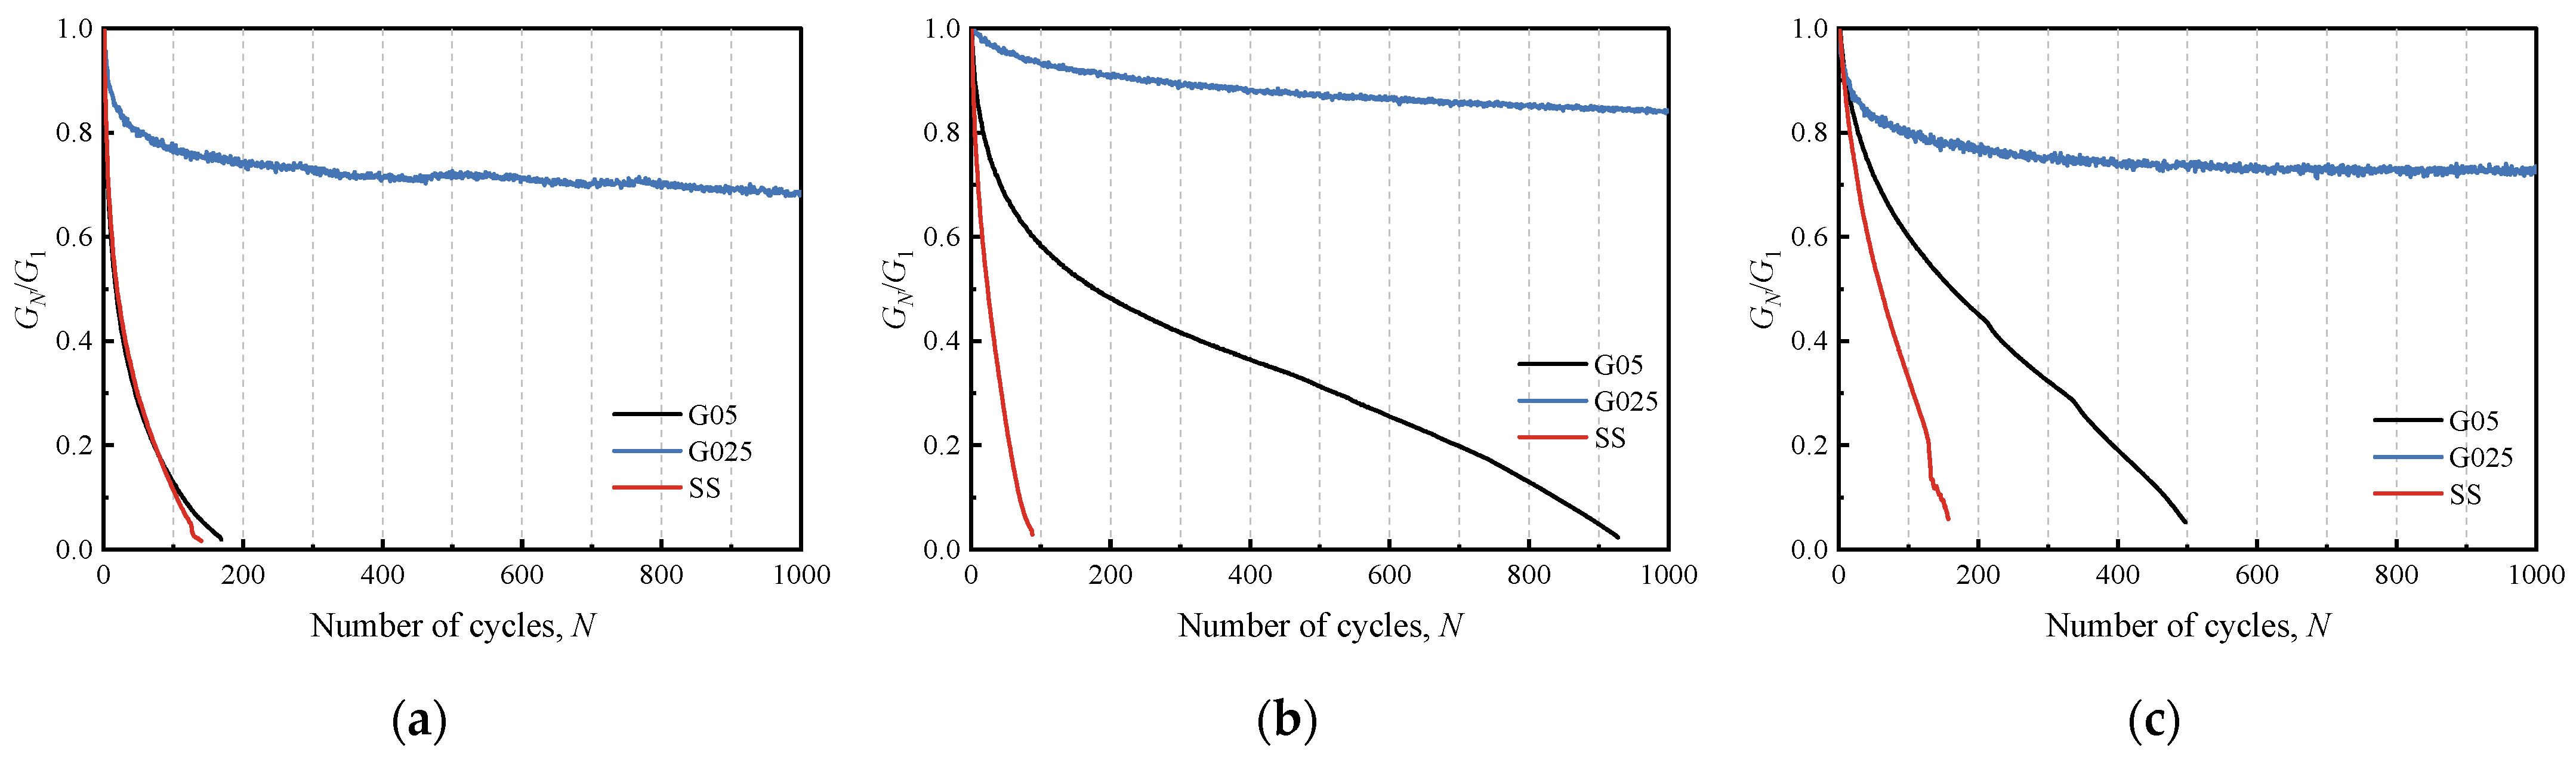
3.3.3. Stiffness Softening Coefficient

The dynamic shear modulus (G), reflecting soil stiffness, is calculated from stress–strain hysteresis loops, as shown in Figure 18a, defined by the slope of the line connecting the coordinate origin to the stress peak of the hysteresis loop. Figure 18b demonstrates that increasing cycle counts lead to greater soil deformation, characterized by expanding hysteresis loop areas, progressive loop dispersion, and inclination toward the X-axis, indicating continuous stiffness softening. The stiffness softening coefficient, expressed as GN/G1 (ratio of dynamic shear modulus at the Nth cycle to the 1st cycle), quantifies stiffness degradation under cyclic loading.
Experimental results for the stiffness softening coefficient (GN/G1) of overconsolidated gassy clay and saturated soils under varying cyclic shear stresses are shown in Figure 19. At a constant overconsolidation ratio (OCR), the stiffness softening coefficient of gassy clay decreases more gradually with increasing cycle counts than that of saturated soils under identical cyclic shear stress ratios (τcy/τmax), indicating superior resistance to deformation and softening in gassy clay. This behavior likely stems from bubble flooding during shear, where partial pore water migration into gas bubbles reduces plastic strain accumulation. Furthermore, gassy clay subjected to lower cyclic shear stress (0.25τmax) exhibits significantly smaller reductions in GN/G1 compared to higher stress (0.5τmax), demonstrating that stiffness softening intensifies with larger τcy/τmax values.
Under cyclic shear stress of 0.25τmax, the stiffness softening magnitude of gassy clay within the first 1000 cycles initially increases then decreases with rising overconsolidation ratio (OCR): at OCR = 1, stiffness decreases by 32%; at OCR = 2, by 16%; and at OCR = 4, by 28%. A similar pattern emerges under 0.5τmax, where the stiffness softening rate first decreases, then increases with higher OCR values, indicating that OCR = 2 gassy clay exhibits the strongest resistance to deformation and minimal softening under constant τcy/τmax conditions. This trend directly explains why the cyclic failure cycles of gassy clay first rise and then decline with increasing OCR.

4. Conclusions

This study systematically investigates the microstructural and strength characteristics of overconsolidated gassy clay, elucidating the influence of overconsolidation ratio (OCR) and initial pore water pressure on its mechanical behavior, thereby providing critical theoretical and empirical foundations for constitutive modeling and engineering applications:
(1) Gassy clay was prepared via a porous medium infiltration method, with SEM imaging revealing that, under normal consolidation, soil particles primarily exist in granular or fragmentary forms, with gas distributed in discrete macro-bubbles. Increasing OCR induces irrecoverable plastic deformation, tighter particle packing, reduced porosity, and bubble compression, transitioning from spherical to collapsed morphologies.
(2) Triaxial tests demonstrate that the stress path and the response of excess pore pressure in the undrained shear process are closely related to the change of shear contraction and dilatancy of soil under an overconsolidation state. With rising OCR and decreasing initial pore pressure, the stress path slope progressively increases, mean effective stress (p′) rises with deviatoric stress (q), and undrained shear strength (su) significantly improves, which is basically consistent with the experimental results of Gao, Cai et al. [32,33]. From OCR = 1 to 4, the shear strength of G0 increased by 76% and that of G2 increased by 80%, but the variation amplitudes were both lower than that of SS (93%). Excess pore pressure diminishes at higher OCR, even yielding negative pore pressure, attributable to suppressed bubble flooding and enhanced dilatancy under low initial pore pressure and overconsolidation.
(3) Cyclic simple shear tests reveal that, under 0.5τmax cyclic shear stress, gassy clay exhibits markedly higher cyclic failure resistance than saturated soil. At OCR = 2, the number of cycles to failure for gassy clay (NG05) peaked at 928, which is significantly higher than that of saturated clay (NSS = 87). Gassy clay remaining unfailed at 0.25τmax with minimal cumulative shear strain. Cyclic pore pressure evolution follows three phases: rapid initial increase, stabilized mid-term growth, and pre-failure surge. Overconsolidated soils generate negative pore pressure early due to dilatancy, which is less than −20 kPa at OCR = 4. Gassy clay’s bubble-mediated suppression of pore pressure accumulation results in slower growth but higher amplitudes (increasing with OCR). Hysteretic stress–strain curves confirm gassy clay’s lower stiffness softening rate, superior deformation resistance, and optimal anti-softening capacity at OCR = 2; higher τcy/τmax exacerbates softening.

Author Contributions

Conceptualization, T.L., L.Z. and Y.Z. (Yan Zhang); methodology T.L. and C.Q. software, Y.Z. (Yan Zhang); validation, L.Z. and Y.Z. (Yuanzhe Zhan); formal analysis, T.L. and C.Q.; investigation L.Z., Y.Z. (Yan Zhang), C.Z. and J.J.; resources, T.L., L.Z. and Y.Z. (Yuanzhe Zhan); data curation, L.Z., C.Z. and J.J.; writing—original draft preparation, L.Z.; writing—review and editing, T.L., L.Z. and Y.Z. (Yan Zhang); visualization, L.Z.; supervision, T.L. and C.Q.; project administration T.L.; funding acquisition, T.L. All authors have read and agreed to the published version of the manuscript.

Funding

This research was funded by the National Natural Science Foundation of China (NO. 42207172, NO. 42277139) and the University Natural Science Research Project of Anhui Province (2023AH030037).

Data Availability Statement

The original contributions presented in this study are included in the article; further inquiries can be directed to the corresponding author.

Acknowledgments

The authors would like to thank Yi Jiang and Yue Zhao for their help during the experiment. Thanks to the Shandong Engineering Research Center of Marine Exploration and Conservation for providing the test equipment.

Conflicts of Interest

The authors declare no conflicts of interest.

References

  1. Guo, Z.; Liu, L.; Liu, Z.; Pan, Y.; Shen, X.; Lei, L. Experimental and numerical challenges in multiscale study on geomechanical and hydrological systems. Adv. Geo-Energy Res. 2025, 15, 95–98. [Google Scholar] [CrossRef]
  2. Guo, Z.; Gao, X.; Wu, H.; Liu, L.; Lei, L. Failure patterns in layered gas-storage systems. Adv. Geo-Energy Res. 2024, 12, 183–193. [Google Scholar] [CrossRef]
  3. Liu, T.; Yang, X.; Zhang, Y. A Review of Gassy Sediments: Mechanical Property, Disaster Simulation and In-Situ Test. Front. Earth Sci. 2022, 10, 15–35. [Google Scholar] [CrossRef]
  4. Kortekaas, S.; Sens, E.; Sarata, B. Shallow gas hazard linked to worldwide delta environments. In Frontiers in Offshore Geotechnics II; CRC Press: Boca Raton, FL, USA, 2010; pp. 221–225. [Google Scholar]
  5. Anderson, A.L.; Hampton, L.D. Acoustics of gas-bearing sediments I. Background. J. Acoust. Soc. Am. 1980, 67, 1865–1889. [Google Scholar] [CrossRef]
  6. Whelan, T.; Coleman, J.M.; Suhayda, J.N.; Roberts, H.H. Acoustical penetration and shear strength in gas-charged sediment. Mar. Geotechnol. 1977, 2, 147–159. [Google Scholar] [CrossRef]
  7. Puzrin, A.; Tront, J.; Schmid, A.; Hughes, J. Engineered use of microbial gas production to decrease primary consolidation settlement in clayey soils. Geotechnique 2011, 61, 785–794. [Google Scholar] [CrossRef]
  8. Chen, Z.; Lai, X.; Liao, L.; Huang, P. Submarine shallow gas detection method based on MIP-CPT technology: A case study in the Zhoushan sea area of the East China Sea. Acta Pet. Sin. 2016, 37, 8–16. [Google Scholar]
  9. Xie, C.Y. Shallow natural gas in riverside soft soils along the Yangtze River in Anhui Province and its impact on hydraulic structures. Water Resour. Hydropower Express 2000, 21, 6–12. [Google Scholar]
  10. Liu, L.; De Kock, T.; Wilkinson, J.; Cnudde, V.; Xiao, S.; Buchmann, C.; Uteau, D.; Peth, S.; Lorke, A. Methane bubble growth and migration in aquatic sediments observed by X-ray μCT. Environ. Sci. Technol. 2018, 52, 2007–2015. [Google Scholar] [CrossRef]
  11. Abegg, F.; Anderson, A.L. The acoustic turbid layer in muddy sediments of Eckernfoerde Bay, Western Baltic: Methane concentration, saturation and bubble characteristics. Mar. Geol. 1997, 137, 137–147. [Google Scholar] [CrossRef]
  12. Best, A.I.; Tuffin, M.D.J.; Dix, J.K.; Bull, J.M. Tidal height and frequency dependence of acoustic velocity and attenuation in shallow gassy marine sediments. J. Geophys. Res. Solid Earth 2004, 109, B08101. [Google Scholar] [CrossRef]
  13. Kim, G.Y.; Narantsetseg, B.; Kim, J.W.; Chun, J.H. Physical properties and micro-and macro-structures of gassy sediments in the inner shelf of SE Korea. Quat. Int. 2014, 344, 170–180. [Google Scholar] [CrossRef]
  14. Hong, Y.; Wang, L.; Yang, B.; Zhang, J. Stress-dilatancy behaviour of bubbled fine-grained sediments. Eng. Geol. 2019, 260, 105196. [Google Scholar] [CrossRef]
  15. Sobkowikz, J.C. The Mechanics of Gassy Sediments. Ph.D. Thesis, University of Alberta, Edmonton, AB, Canada, 1982. [Google Scholar]
  16. Grozic, J.; Nadim, F.; Kvalstad, T. On the undrained shear strength of gassy clays. Comput. Geotech. 2005, 32, 483–490. [Google Scholar] [CrossRef]
  17. Hong, Y.; Wang, X.; Wang, L.; Gao, Z. A state-dependent constitutive model for coarse-grained gassy soil and its application in slope instability modelling. Comput. Geotech. 2021, 129, 103847. [Google Scholar] [CrossRef]
  18. Sultan, N.; Garziglia, S. Mechanical behaviour of gas-charged fine sediments: Model formulation and calibration. Geotechnique 2014, 64, 851–864. [Google Scholar] [CrossRef]
  19. Hong, Y.; Wang, L.; Ng, C.W.; Yang, B. Effect of initial pore pressure on undrained shear behaviour of fine-grained gassy soil. Can. Geotech. J. 2017, 54, 1592–1600. [Google Scholar] [CrossRef]
  20. Wheeler, S.J. A conceptual model for soils containing large gas bubbles. Geotechnique 1988, 38, 389–397. [Google Scholar] [CrossRef]
  21. Thomas, S.D. The Consolidation Behaviour of Gassy Soil. Ph.D. Thesis, Oxford University, Oxford, UK, 1987. [Google Scholar]
  22. Ye, Z.B.; Li, J.R.; Ye, Q.Y.; Chen, X.X.; Zhou, W.T. Experimental study on consolidation settlement characteristics of fine-grained gassy soil. Found. Treat. 2022, 4, 472–478. [Google Scholar]
  23. Sills, G.C.; Wheeler, S.J.; Thomas, S.D.; Gardner, T.N. Behaviour of offshore soils containing gas bubbles. Geotechnique 1991, 41, 227–241. [Google Scholar] [CrossRef]
  24. Qin, A.; Sun, D.; Zhang, J. Semi-analytical solution to one-dimensional consolidation for viscoelastic unsaturated soils. Comput. Geotech. 2014, 62, 110–117. [Google Scholar] [CrossRef]
  25. Wang, L. On the consolidation and creep behaviour of layered viscoelastic gassy sediments. Eng. Geol. 2021, 293, 296–298. [Google Scholar] [CrossRef]
  26. Wheeler, S.J. The undrained shear strength of soils containing large gas bubbles. Geotechnique 1988, 38, 399–413. [Google Scholar] [CrossRef]
  27. Wheeler, S.J.; Sham, W.K.; Thomas, S.D. Gas pressure in unsaturated offshore soils. Can. Geotech. J. 1990, 27, 79–89. [Google Scholar] [CrossRef]
  28. Wheeler, S.J.; Gardner, T.N. Elastic moduli of soils containing large gas bubbles. Geotechnique 1989, 39, 333–342. [Google Scholar] [CrossRef]
  29. Liu, T.; Qing, C.; Zheng, J.; Ma, X.; Chen, J.; Liu, X. Study on the Mechanical Behavior of Fine-Grained Gassy Soil Under Different Stress Conditions. J. Mar. Sci. Eng. 2025, 13, 373. [Google Scholar] [CrossRef]
  30. Wang, H.; Zhang, Y.; Cai, G.; Liang, Y.; Liu, T.; Chen, J. Study on the CPTu inversion methods for strength and consolidation parameters of gassy soil with different gas contents. Appl. Ocean. Res. 2024, 146, 146103960. [Google Scholar] [CrossRef]
  31. Hong, Y.; Chen, X.Y.; Wang, L.Z.; Yang, B.; Sanchez, M. Distinct Undrained Cyclic Behavior of Fine-Grained Gassy Soil at Various Initial Pore Water Pressures. J. Geotech. Geoenviron. Eng. 2021, 147, 06020027. [Google Scholar] [CrossRef]
  32. Gao, Z.; Cai, H.; Hong, Y.; Lu, D. A critical state constitutive model for gassy clay. Can. Geotech. J. 2022, 59, 1033–1045. [Google Scholar] [CrossRef]
  33. Cai, H.; Gao, Z.; Hong, Y.; Zhang, J. A bounding surface model for gassy clay. Comput. Geotech. 2023, 161, 105565. [Google Scholar] [CrossRef]
  34. Nie, Y.; Luan, M.T.; Tang, X.W.; Guo, Y.; Zhang, Z.D.; Song, Y.X. Study on shear characteristics of overconsolidated clay under monotonic and coupled cyclic loading. Rock Soil Mech. 2009, 30, 2616–2622. [Google Scholar]
  35. Bouriak, S.; Vanneste, M.; Saoutkine, A. Inferred gas hydrates and clay diapirs near the Storegga Slide on the southern edge of the Vøring Plateau, offshore Norway. Mar. Geol. 2000, 163, 125–148. [Google Scholar] [CrossRef]
  36. Maslin, M.; Mikkelsen, N.; Vilela, C.; Haq, B. Sea-level-and gas-hydrate-controlled catastrophic sediment failures of the Amazon Fan. Geology 1998, 12, 26–52. [Google Scholar] [CrossRef]
  37. Sultan, N.; De Gennaro, V.; Puech, A. Mechanical behaviour of gas-charged marine plastic sediments. Géotechnique 2012, 62, 751–766. [Google Scholar] [CrossRef]
  38. Zhang, R.; Lunne, T. Deepwater sample disturbance due to stress relief. Chin. J. Geotech. Eng. 2003, 25, 356–360. [Google Scholar]
  39. Hong, Y.; Zhang, J.F.; Wang, L.Z.; Liu, T. On evolving size and shape of gas bubble in marine clay under multi-stage loadings: Microcomputed tomography (μCT) characterization and cavity contraction analysis. Can. Geotech. J. 2020, 57, 1072–1091. [Google Scholar] [CrossRef]
  40. Lehane, B.M.; O’Loughlin, C.D.; Gaudin, C. Rate effects on penetrometer resistance in kaolin. Géotechnique 2009, 59, 41–52. [Google Scholar] [CrossRef]
  41. Tan, J. Research on Shear Characteristics of Soft Clay with Different Consolidation Degrees Under Static and Dynamic Loads. Master’s Thesis, Wenzhou University, Wenzhou, China, 2021. [Google Scholar] [CrossRef]
  42. Li, P.F.; Bi, Q.; Zhang, Y.H.; Yan, H.G.; Ren, B.; Tong, M. Research on the Cyclic Loading Characteristics of Silty Soil in the Sea Area of Eastern Guangdong. Mar. Sci. Bull. 2024, 43, 497–509. [Google Scholar]
Figure 1. Typical gassy clay and its microscopic scanning image [14]: (a) Gassy clay structure; (b) gassy clay samples in Zhoushan sea area; (c) SEM image of typical gassy soil.
Jmse 13 00904 g001
Figure 2. Three-phase composition diagram of gas-bearing soil per unit volume.
Jmse 13 00904 g002
Figure 5. Schematic diagram of GDS dynamic triaxial apparatus.
Jmse 13 00904 g005
Figure 6. Schematic diagram of GDS cyclic shear test system: (a) GDS cyclic simple shear apparatus; (b) schematic diagram of shear deformation; (c) shear stress parameters.
Jmse 13 00904 g006
Figure 7. Microstructure of overconsolidated gassy soil: (a) OCR = 1, 250×; (b) OCR = 2, 250×; (c) OCR = 4, 250×; (d) OCR = 1, 500×; (e) OCR = 2, 500×; (f) OCR = 4, 500×.
Jmse 13 00904 g007aJmse 13 00904 g007b
Figure 8. Schematic diagram of microstructure change in overconsolidated gassy soil: (a) normal consolidation; (b) overconsolidation.
Jmse 13 00904 g008
Figure 9. Excess pore pressure response of gassy soil with different overconsolidation ratios and initial pore pressure: (a) OCR = 1; (b) OCR = 2; (c) OCR = 4; (d) SS; (e) G2; (f) G0.
Jmse 13 00904 g009
Figure 10. Microstructure of gassy soil after undrained shear failure: (a) OCR = 1; (b) OCR = 2; (c) OCR = 4.
Jmse 13 00904 g010
Figure 11. Schematic diagram of undrained shear process in gassy soil: (a) pore collapse at high initial pore pressure; (b) bubble flooding at low initial pore pressure.
Jmse 13 00904 g011
Figure 12. Stress–strain relationship of gassy soil with different overconsolidation ratios and initial pore pressure: (a) OCR = 1; (b) OCR = 2; (c) OCR = 4; (d) SS; (e) G2; (f) G0.
Jmse 13 00904 g012
Figure 13. Variation curve of undrained shear strength with overconsolidation ratio OCR.
Jmse 13 00904 g013
Figure 14. Stress paths of overconsolidated gassy soil: (a) OCR = 1; (b) OCR = 2; (c) OCR = 4.
Jmse 13 00904 g014
Figure 15. Schematic diagram of shear strain parameters in cyclic simple shear test [42].
Jmse 13 00904 g015
Figure 16. Cyclic shear strain curves of overconsolidated gassy soil under different dynamic shear stresses: (a) OCR = 1; (b) OCR = 2; (c) OCR = 4.
Jmse 13 00904 g016
Figure 17. Dynamic pore pressure curves of overconsolidated gassy soil under different dynamic shear stresses: (a) OCR = 1; (b) OCR = 2; (c) OCR = 4.
Jmse 13 00904 g017
Figure 18. Stress–strain hysteresis curve and shear modulus diagram: (a) Shear modulus calculation diagram; (b) stress–strain hysteresis curve.
Jmse 13 00904 g018
Figure 19. Stiffness softening coefficient curves of overconsolidated gassy soil under different dynamic shear stresses: (a) OCR = 1; (b) OCR = 2; (c) OCR = 4.
Jmse 13 00904 g019
Table 1. Index properties and mechanical parameters of Chinese kaolin.
ParameterMeasured Value
Liquid limit: %40
Plastic limit: %23
Plasticity index17
The angle of friction: °25.4
Coefficient of earth pressure at rest0.59
Critical stress ratio1
Table 2. Triaxial test scheme.
Sample TypeZeolite Content (%)Initial Pore
Water Pressure (kPa)
OCRInitial Mean Operative Stress (kPa)
Saturated (SS)0Saturation1, 2, 4100
Gassy (G0)200
Gassy (G2)20200
Table 3. Cyclic simple shear test scheme.
Sample TypeZeolite Content (%)Dynamic Shear Stress Ratios (τcy/τmax)OCRCyclic Shear Stress τcy (kPa)
Saturated (SS)00.5114.6
224.8
434.9
Gassy (G05)200.5115.5
222.9
437.0
Gassy (G025)200.2517.8
211.5
418.5
Disclaimer/Publisher’s Note: The statements, opinions and data contained in all publications are solely those of the individual author(s) and contributor(s) and not of MDPI and/or the editor(s). MDPI and/or the editor(s) disclaim responsibility for any injury to people or property resulting from any ideas, methods, instructions or products referred to in the content.

