1. Introduction
Digital transformation in the shipping and maritime industries is of strategic importance. It is shaped mainly by the rapid developments in digital technologies and the increasing demands for enhanced operational efficiency, sustainability and competitiveness across the global maritime supply chain. The integration of innovative technologies in the maritime sector, including artificial intelligence (AI), machine learning (ML), blockchain, the Internet of Things (IoT), Big Data analytics, digital twins, autonomous vessels, and enhanced cybersecurity measures, has facilitated significant advancements in maritime logistics, port operations, and vessel management [
1,
2]. Maritime digital transformation aims to support decision-making in maritime operational processes, streamline fleet management tasks, enhance safety and environmental performance and reduce vessel environmental impact.
Despite the increasing adoption of innovative technologies, the maritime sector remains a complex and fragmented domain. There are various levels of digital maturity across different maritime sub-sectors. Previous research has examined diverse aspects of maritime digital transformation, ranging from industry-wide systematic reviews to bibliometric analyses that highlight specific technological trends or research gaps. However, prior studies primarily focus on predefined technological domains or specific industrial sub-sectors, hence leading to scope-limited findings. Additionally, the methodological frameworks employed across existing studies demonstrate substantial variation, encompassing systematic literature reviews (SLRs), conceptual papers, or bibliometric network analyses. Even though each contributes uniquely to the maritime sector research, their findings are sometimes isolated and do not significantly impact the broader transformation of the maritime landscape [
3,
4].
To bridge this research gap, the present study employs a network-based bibliometric analysis approach to provide a holistic perspective on the digital transformation of the shipping industry. Unlike many prior studies that categorize research into predefined technological areas, this study takes an unbiased, data-driven approach to map the broader research maritime landscape. Through a data-driven approach, this study uses graph-theoretical methods and natural language processing (NLP) to examine research trends systematically. Specifically, co-authorship and co-citation networks are analyzed using community detection algorithms and thematic clustering techniques to identify influential research clusters, collaboration patterns, and emerging topics in the field. Finally, analyzing an extensive dataset of scientific publications, this study identifies dominant research clusters, major contributing institutions, and key technological themes such as fuel efficiency, risk management, AI, and cybersecurity—providing a data-driven understanding of maritime digital transformation trends.
This study makes three key contributions. First, it conducts a detailed bibliometric analysis of the digital transformation in the maritime industry. Second, it applies network science to define structural patterns in research collaborations and citation networks. Finally, it employs machine learning-based thematic clustering to uncover emerging research directions, offering insights into future advancements in digital shipping technologies. Through this multi-dimensional approach, this study provides a robust foundation for academia, industry professionals, and policymakers to support data-driven decisions to navigate the evolving landscape of digital transformation in the maritime sector. More specifically, academia can leverage our thematic analysis to invest in and research topics that have been so far overlooked or which are rising within the industry. Professionals may use our findings to identify relevant research hubs with which to collaborate, as well as trending topics on which to invest. To conclude, policymakers may look at the geographical distribution of research centers and actuate policies to foster knowledge dissemination globally.
2. Literature Review
Previous work has investigated the state of the art of digital transformation in shipping and maritime industries. Such research varied both in methodologies, domain of applications, and limitations. In this section, we offer an overview of the most relevant published reviews, compared to our study.
In 2019, ref. [
5] published a systematic literature review to cover the advances in digitizing maritime transportation. The authors started from a large set of articles (2900); however, being an SLR, they then applied stringent filters to reduce the initial set to a far smaller one (only 99 studies). It focuses on eight specific digital domains and three industry sub-sectors. Both domains and sub-sectors were defined as input to the analysis. The authors could identify interesting research trends. However, the selection of digital domains a priori potentially limits the extension of their results. In [
6], the authors review the effects of digital transformation in a well-defined sub-domain of the maritime industry, namely that of unmanned vessels. The authors describe their work more as a conceptual paper rather than a proper SLR. In addition, their conclusions are limited to the specific sub-domain they have chosen for their analysis. Finally, covering a sub-domain which is still being discovered, the research is by definition limited to qualitative analysis.
In the same year, a bibliometric study was published by the authors of [
7]. In their work, the authors applied network-based measures to investigate co-citations among 279 articles. Their bibliographic coupling analysis highlighted four key research clusters within the domains of big data and artificial intelligence. The articles were published before the explosion of generative AI, hence their recommendations are mostly of legacy machine learning algorithms. Their study is similar to ours with regard to methodology. However, the graph analysis is applied to a limited set of predefined technologies.
Another interesting work is the SLR published by the authors of [
1]. In their work, the authors set up to identify the major barriers, drivers, and successful factors for digital transformation in maritime transport. The work is of particular interest because the authors are not focused on predefining technological or industrial domains. Instead, their effort remains open to any possible conclusion. Their analysis highlighted the influence of blockchain and autonomous shipping technologies, and paved the way for the development of effective strategies to support successful digital transformation in the field. As a literature review, the authors curated a limited set of 139 articles from which they drew their findings and conclusions.
In [
8], the authors present a bibliometric analysis on the digitization in both maritime transport and seaports. As a bibliometric analysis, their methodology is similar to the one applied in this study. Specifically, the authors applied thematic analysis to explore the state of the art within the field of research and identify key areas and gaps. Starting with over 8000 articles, the authors filtered them down to 280 for the subsequent analysis. Such filtering was performed manually, hence leading to some extensive human effort. This, on the one hand, guaranteed a curated final set of articles. However, it also potentially limited the extent of the results. In addition, as any other filtering technique, it may have included biases in the process. Moreover, the authors recognized some of the limitations related to the tools they used for the conceptualization of topics. The work was published before the impressive development of state-of-the-art transformer neural networks, which means the authors were not able to leverage modern tools such as context-sensitive embedding systems.
Another bibliometric study was published by [
9]. Similarly to what previously mentioned for other works, this work focuses on predefined technological domain, specifically on the application of artificial intelligence in shipping. The work is based on a relatively larger set of articles, 476, and the methodology is similar to the one applied in our work, including the identification of influential papers, countries, and institutions. The main difference with our work is in the limited technological domain being investigated.
A similar study is the bibliometric one by the authors of [
10]. Once again, the methodology in place reflects the one adopted in our work. The number of examined publication was 201, and the focus was given to the digital transformation as a mean for decarbonizing the shipping industry.
To conclude, we refer to the work of [
11]. Despite not being an SLR nor a bibliometric study, this work is of interest because it presents a road-map for digital transformation as it is applied in a real-case scenario. While building their road-map, the authors analyzed the state of the art of digital transformation in shipping industry, suggesting relevant strategies for its successful implementation.
In comparison to the works cited in this section, our work is rooted in graph theory, applied to a large cohort of scientific publications, and not limited by predefined technological or industrial sub-domains.
3. Materials and Methods
In this section, we describe the methodology followed for the data collection and analysis.
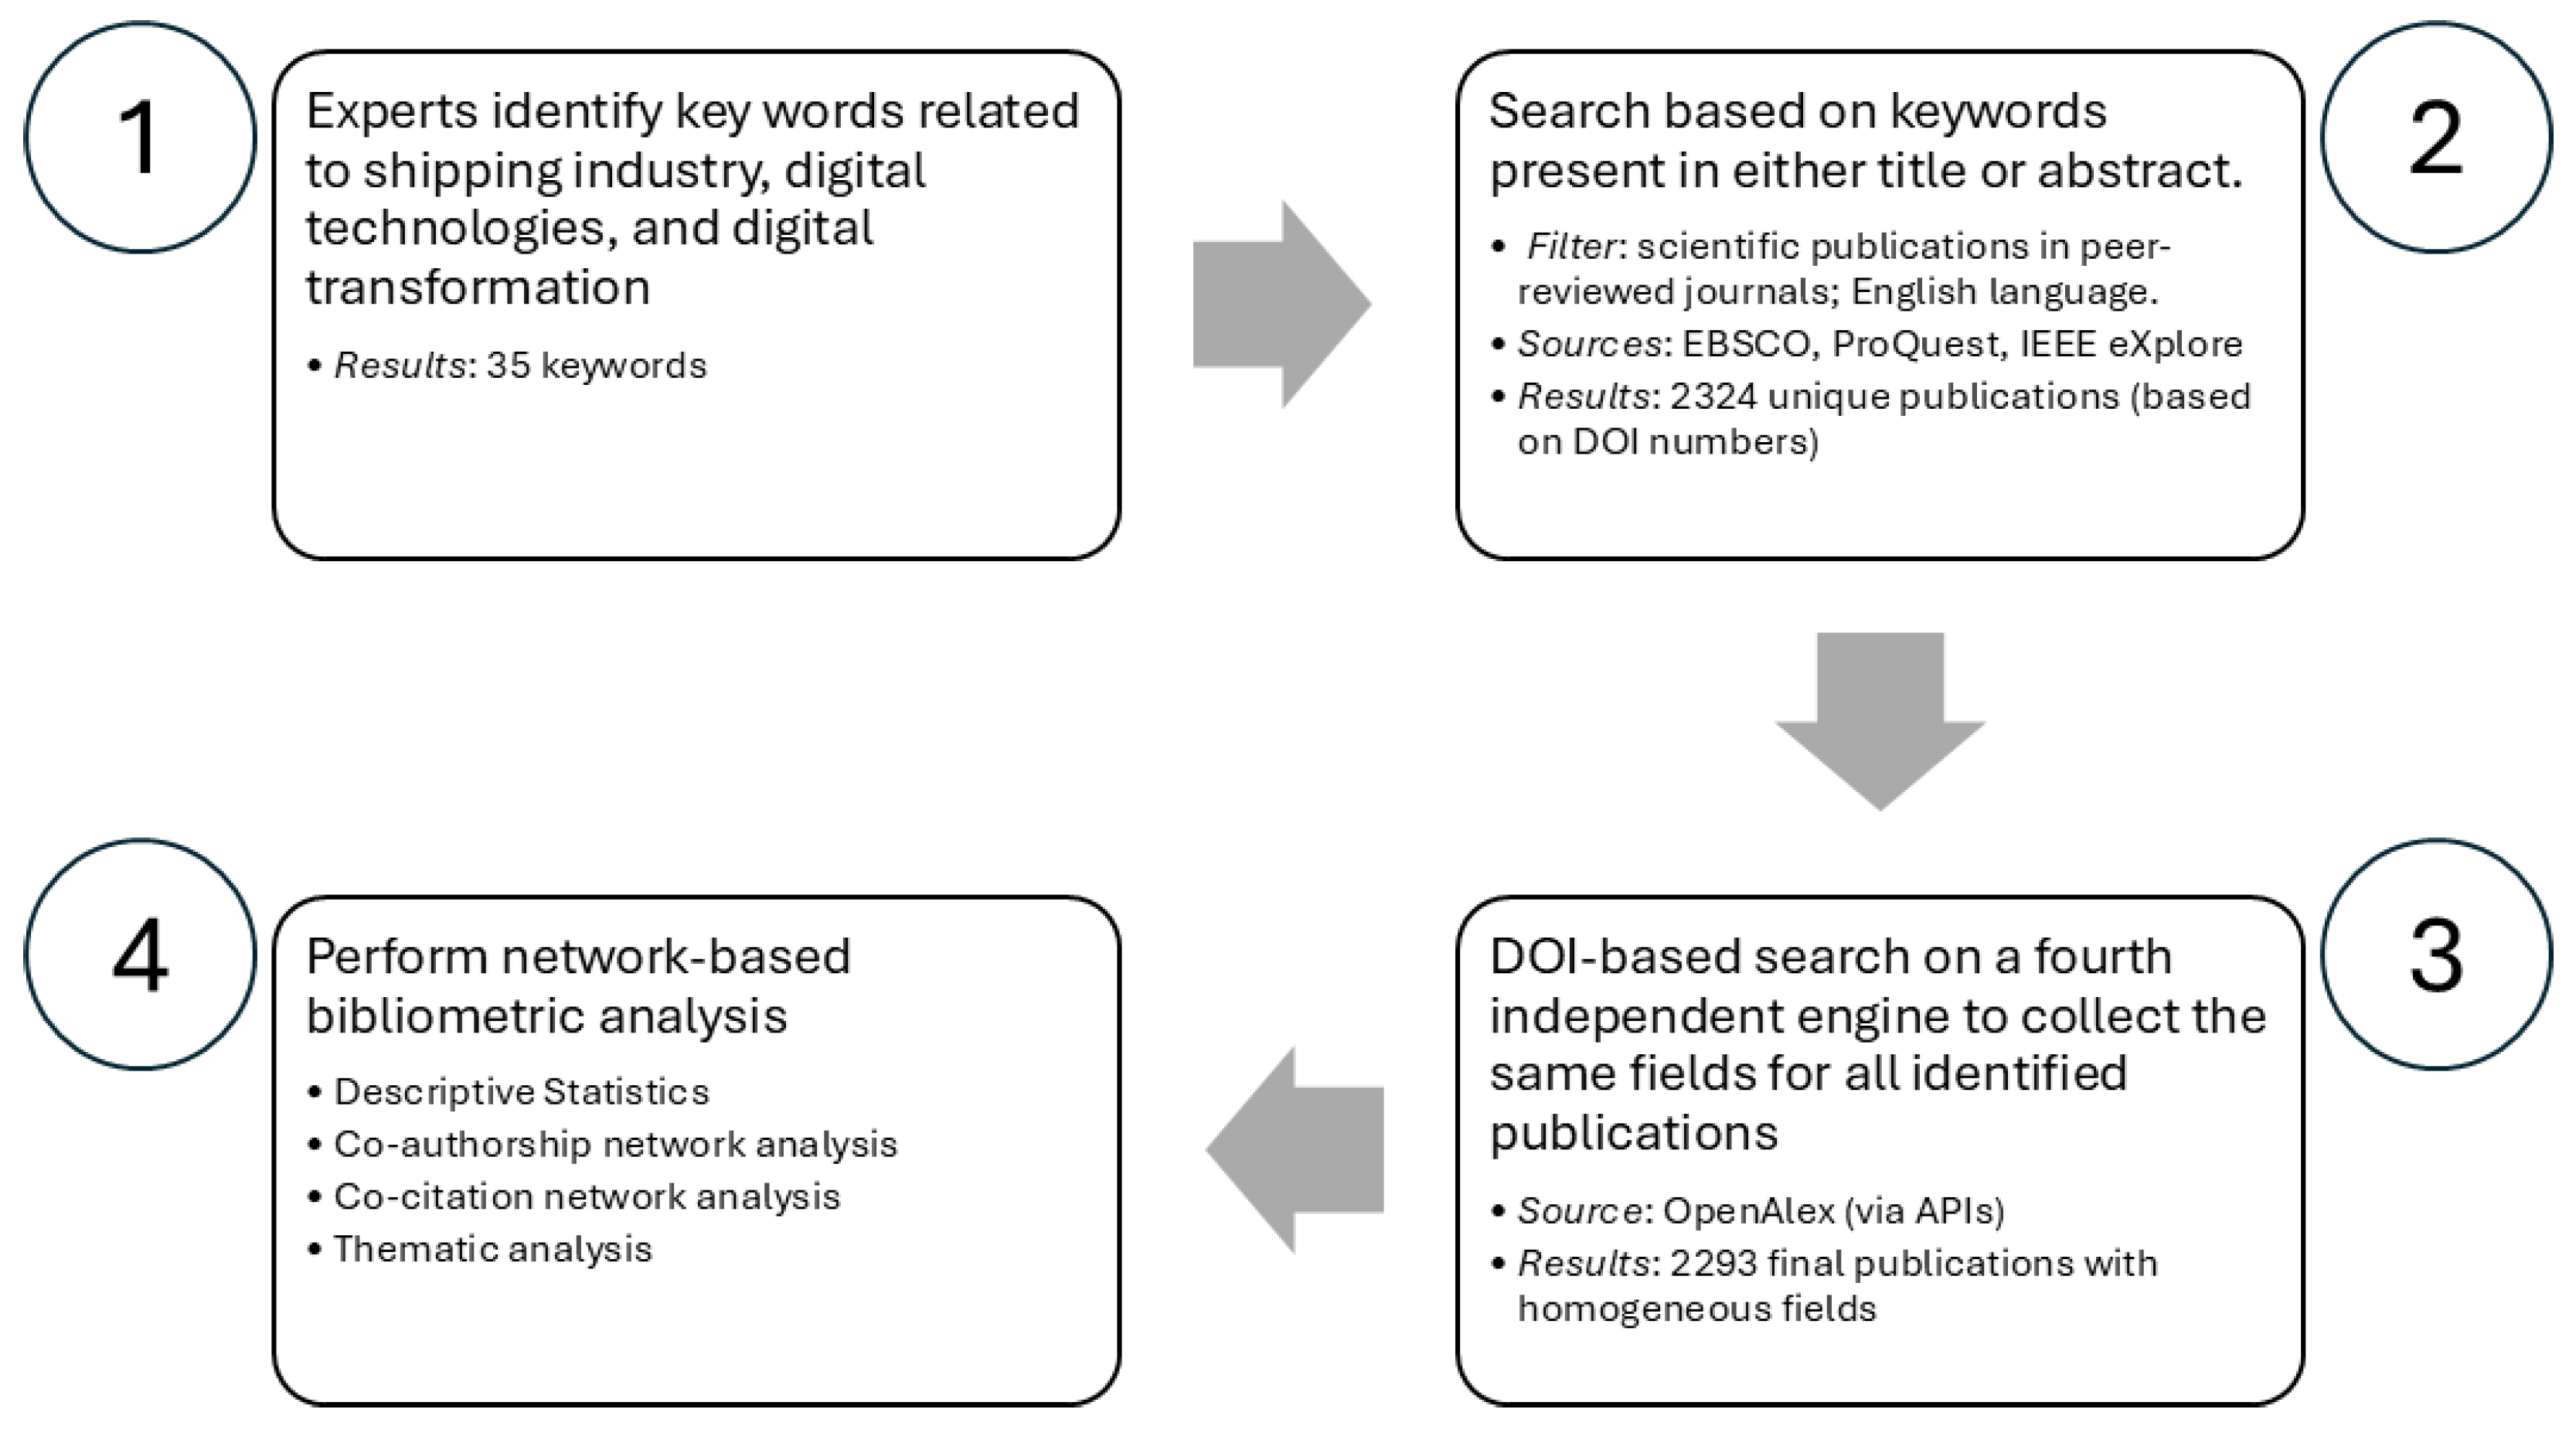
Figure 1 shows the overall methodology discussed in this section, while results and implications are discussed in the upcoming sections.
3.1. Keyword Identification and Data Collection
Experts were asked to identify the most relevant keywords related to the shipping industry and to digital technologies and digital transformation. Their analysis resulted in 35 keywords, listed in
Table 1. The chosen experts have both academic and industrial backgrounds and, although unconscious bias can never be fully excluded, they have mitigated the risks by independently identifying the keywords and subsequently reach a consensus.
Data were collected from three research engines: EBSCO [
12], ProQuest [
13], and IEEE eXplore [
14]. The search was performed on the 22 October 2024. For each engine, we retrieved scientific articles containing any of the digital transformation-related keywords and any of the shipping industry-related keywords in either their title or abstract. The exact query for each engine is available on request. Our results were constrained using the following criteria: (a) only studies in English, and (b) only scientific contributions published in peer-reviewed journals.
Table 2 shows the results.
All search engines provided the digital object identifier (DOI) for the articles. This allowed us to screen the resulting set and identify 2324 unique articles for the subsequent analysis. Duplicates have been identified using the DOI and removed from further analysis. One challenge of using different data engines is the variety of attributes they return for each article. In order to have the same information for each article, we queried a fourth search engine for all the 2324 articles. We chose OpenAlex [
15], which has been shown to be suitable for bibliometric analysis [
16]. Our final result set comprised 2293 scientific publications.
3.2. Descriptive Statistics
We started our analysis evaluating descriptive statistics across our article set. More specifically, we calculated the following:
The distribution of the number of publications per year;
The distribution of publications across authors, identifying the most prolific authors;
The distribution of publications across institutions, identifying the research centers with the highest number of publications;
The distribution of publications across countries.
3.3. Co-Authorship Network Analysis
As a second step, we built and analyzed the network of co-authorship. Network analysis was performed in Python 3.11, using the NetworkX package [
17]. We identified 7723 distinct authors. We built the network using authors as nodes, and setting bi-directional links between them if there existed at least one publication that they co-authored. For each link, we stored within the graph object information about the authors’ institutions and countries for further analysis.
To determine which distribution best fit the data, we ran statistical tests comparing the likelihood of power-law distribution against the exponential distribution, the log-normal distribution, and the truncated power-law distribution.
Next, we focused on the largest connected component of the network, made of 883 authors and 2753 links between them. The choice of focusing on the largest component was dictated mostly by computational limitations.
Working on the largest component, we applied the Louvein community [
18] algorithm to identify the major communities of authors and investigated the distribution of institutions and countries across communities.
To conclude, we analyzed the network for small-world behavior. More specifically, we calculated both the clustering coefficient and the average path length and compared them to random networks of equivalent size.
3.4. Co-Citation Network Analysis
We built a co-citation network of nodes (i.e., articles) and links (i.e., co-citation between two articles). The resulting graph had 1298 nodes. The degree distribution was tested for power-law characteristics against other plausible distributions (exponential, log-normal, and truncated power-law).
Next, we identified the most influential articles (i.e., the top 10 in terms of received citations). Our goal was to check if the most cited articles were literature reviews. As presented in the following section, this turned out not to be the case, allowing us to draw relevant considerations over the demand of SLRs at the conjunction of digital transformation and shipping industry.
We then moved our attention to the top 20% cited papers and analyzed their topics. To achieve this, we created a sub-network using only the top 20% cited papers and applied the Louvein community algorithm [
18]. Next, for each community, we collected the titles and applied natural language processing (NLP) to model their topics (BERTTopic [
19]).
To conclude, we applied different centrality measures to the top 20% graph to identify the 5 most relevant articles. These were analyzed in more detail in terms of covered research area as a preliminary trend analysis, which is further developed in our next analysis section.
3.5. Thematic Analysis
Working on the entire set of articles (2290), we performed a thematic analysis to identify the major topic of research. The titles were pre-processed with the following steps:
Next, we applied tokenization and embedded each title using BERT [
20]. The resulting vectors were analyzed for unsupervised clustering. More specifically, we adopted two methods to identify the ideal number of clusters: the Calinski–Harabasz index [
21] and the Davies–Bouldin index [
22]. Having identified the best number of clusters, we applied the unsupervised K-means algorithm and calculated the centroid for each cluster. Next, the 10 articles closest to the corresponding centroid were identified for each cluster; BERTTopic was applied to extract the common themes.
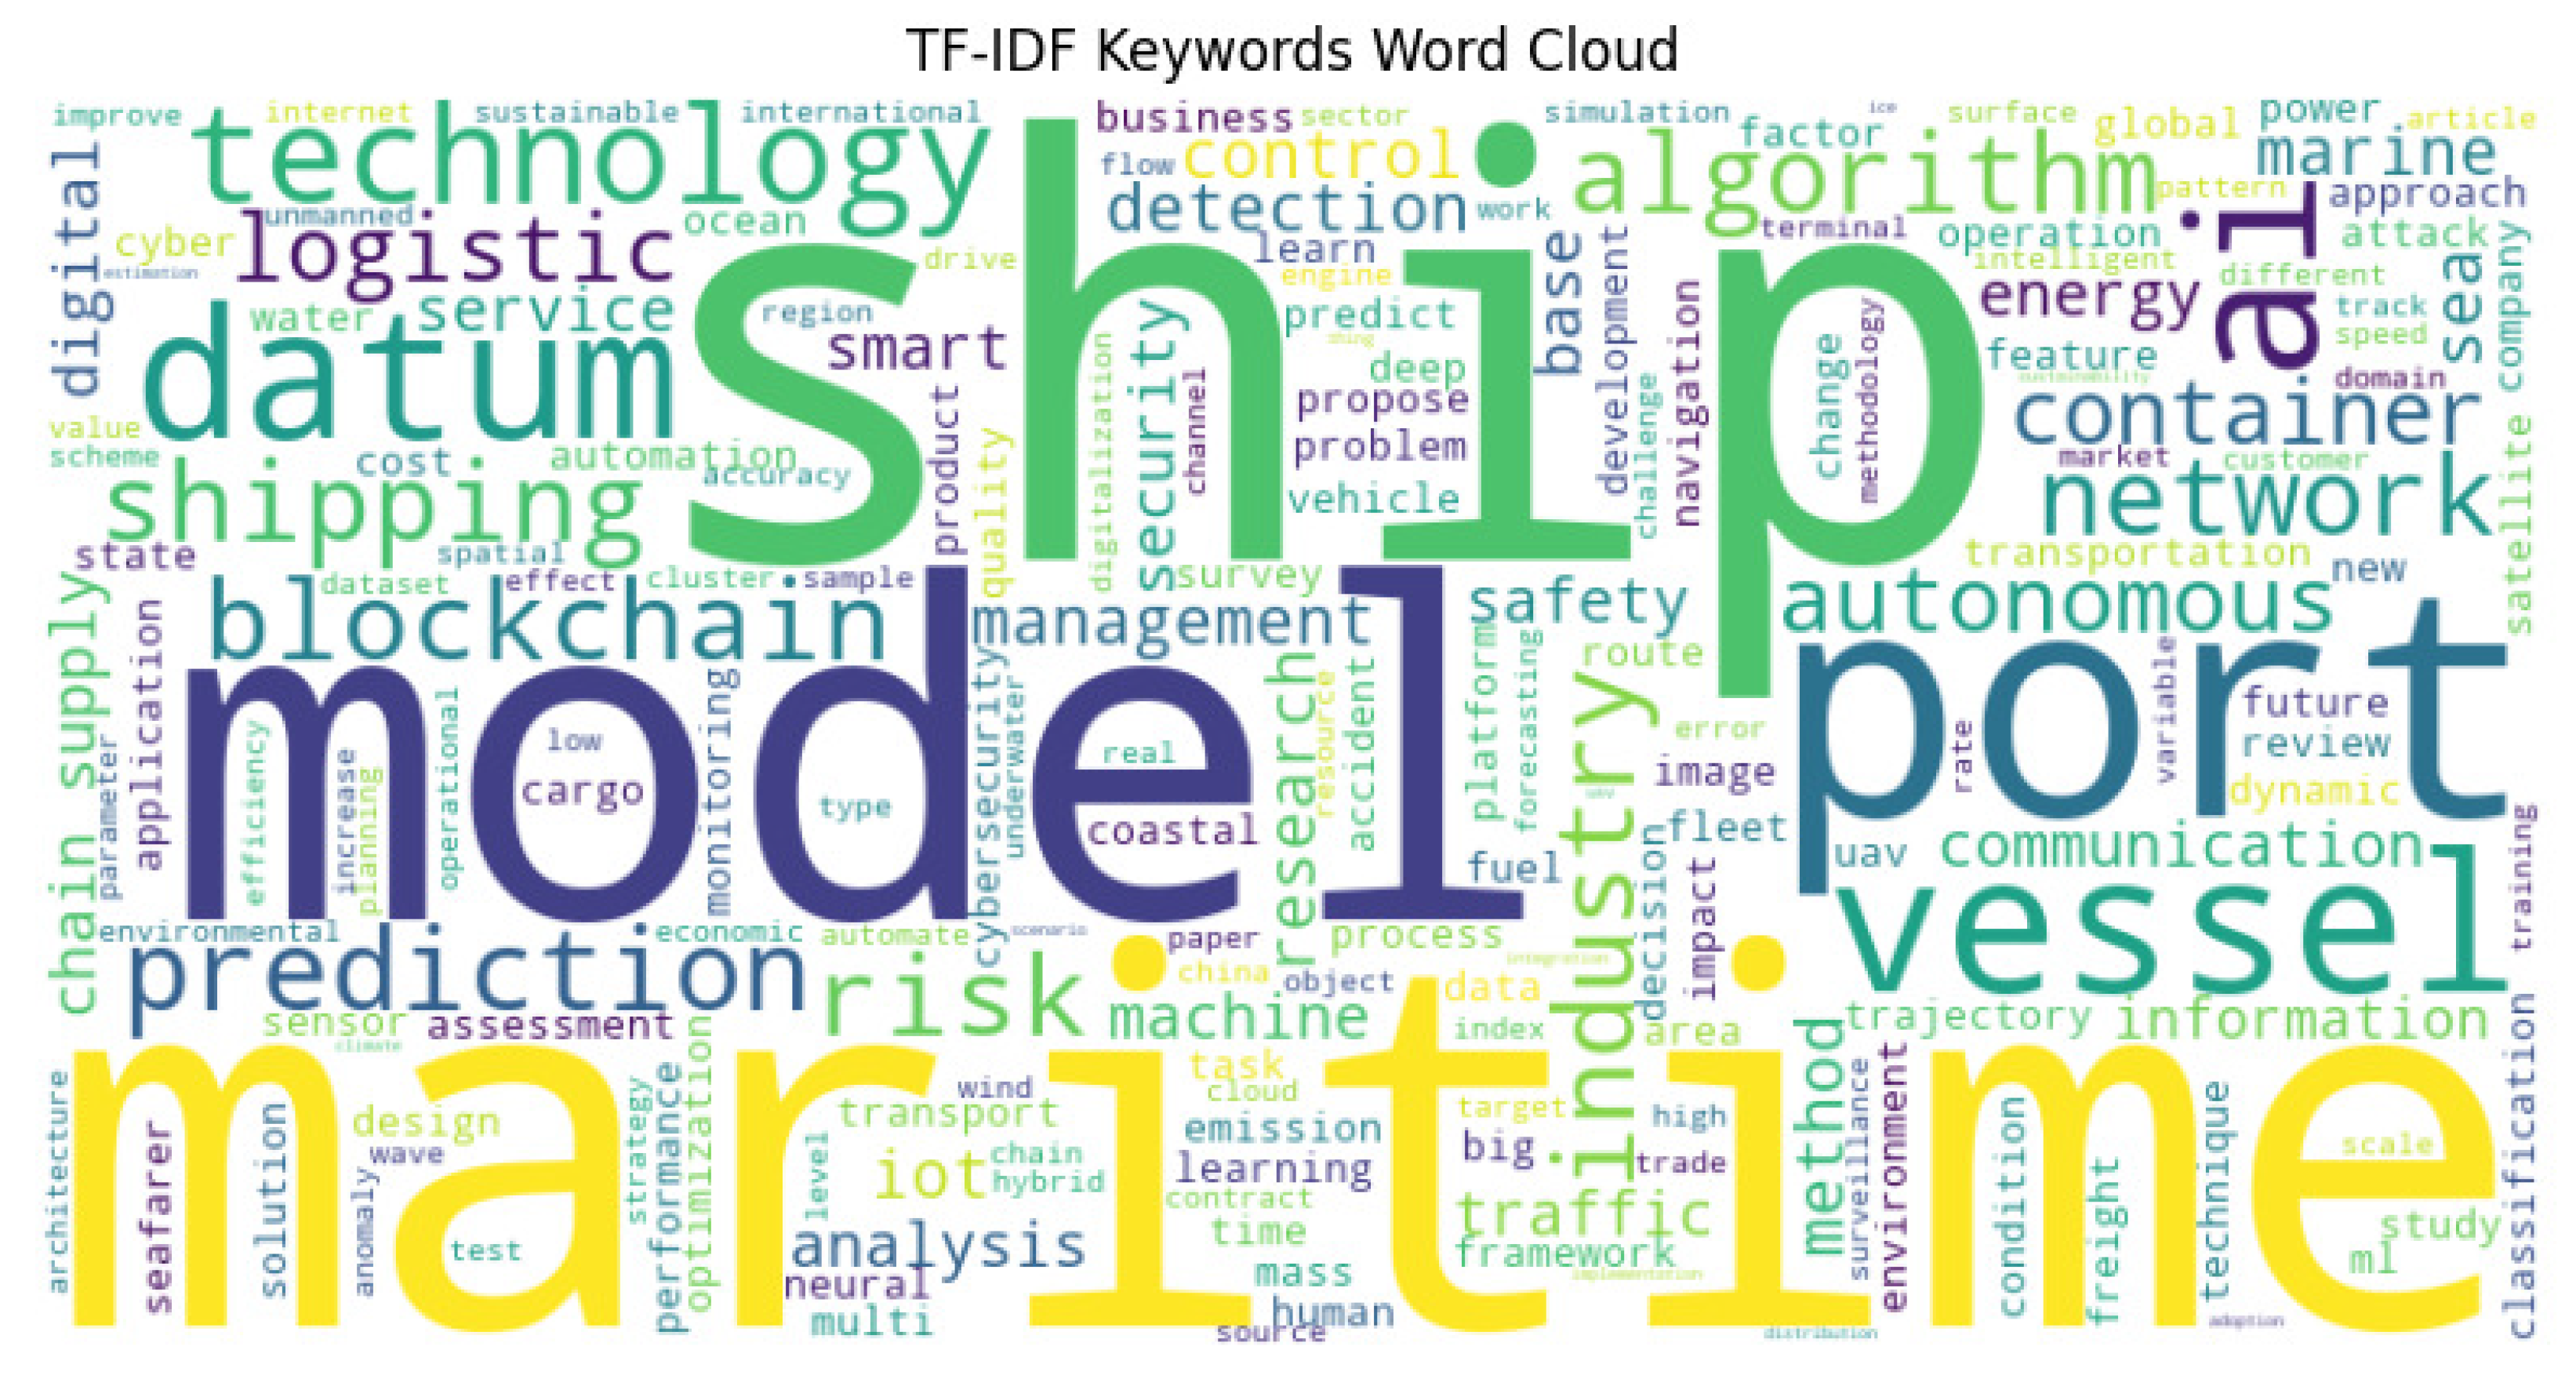
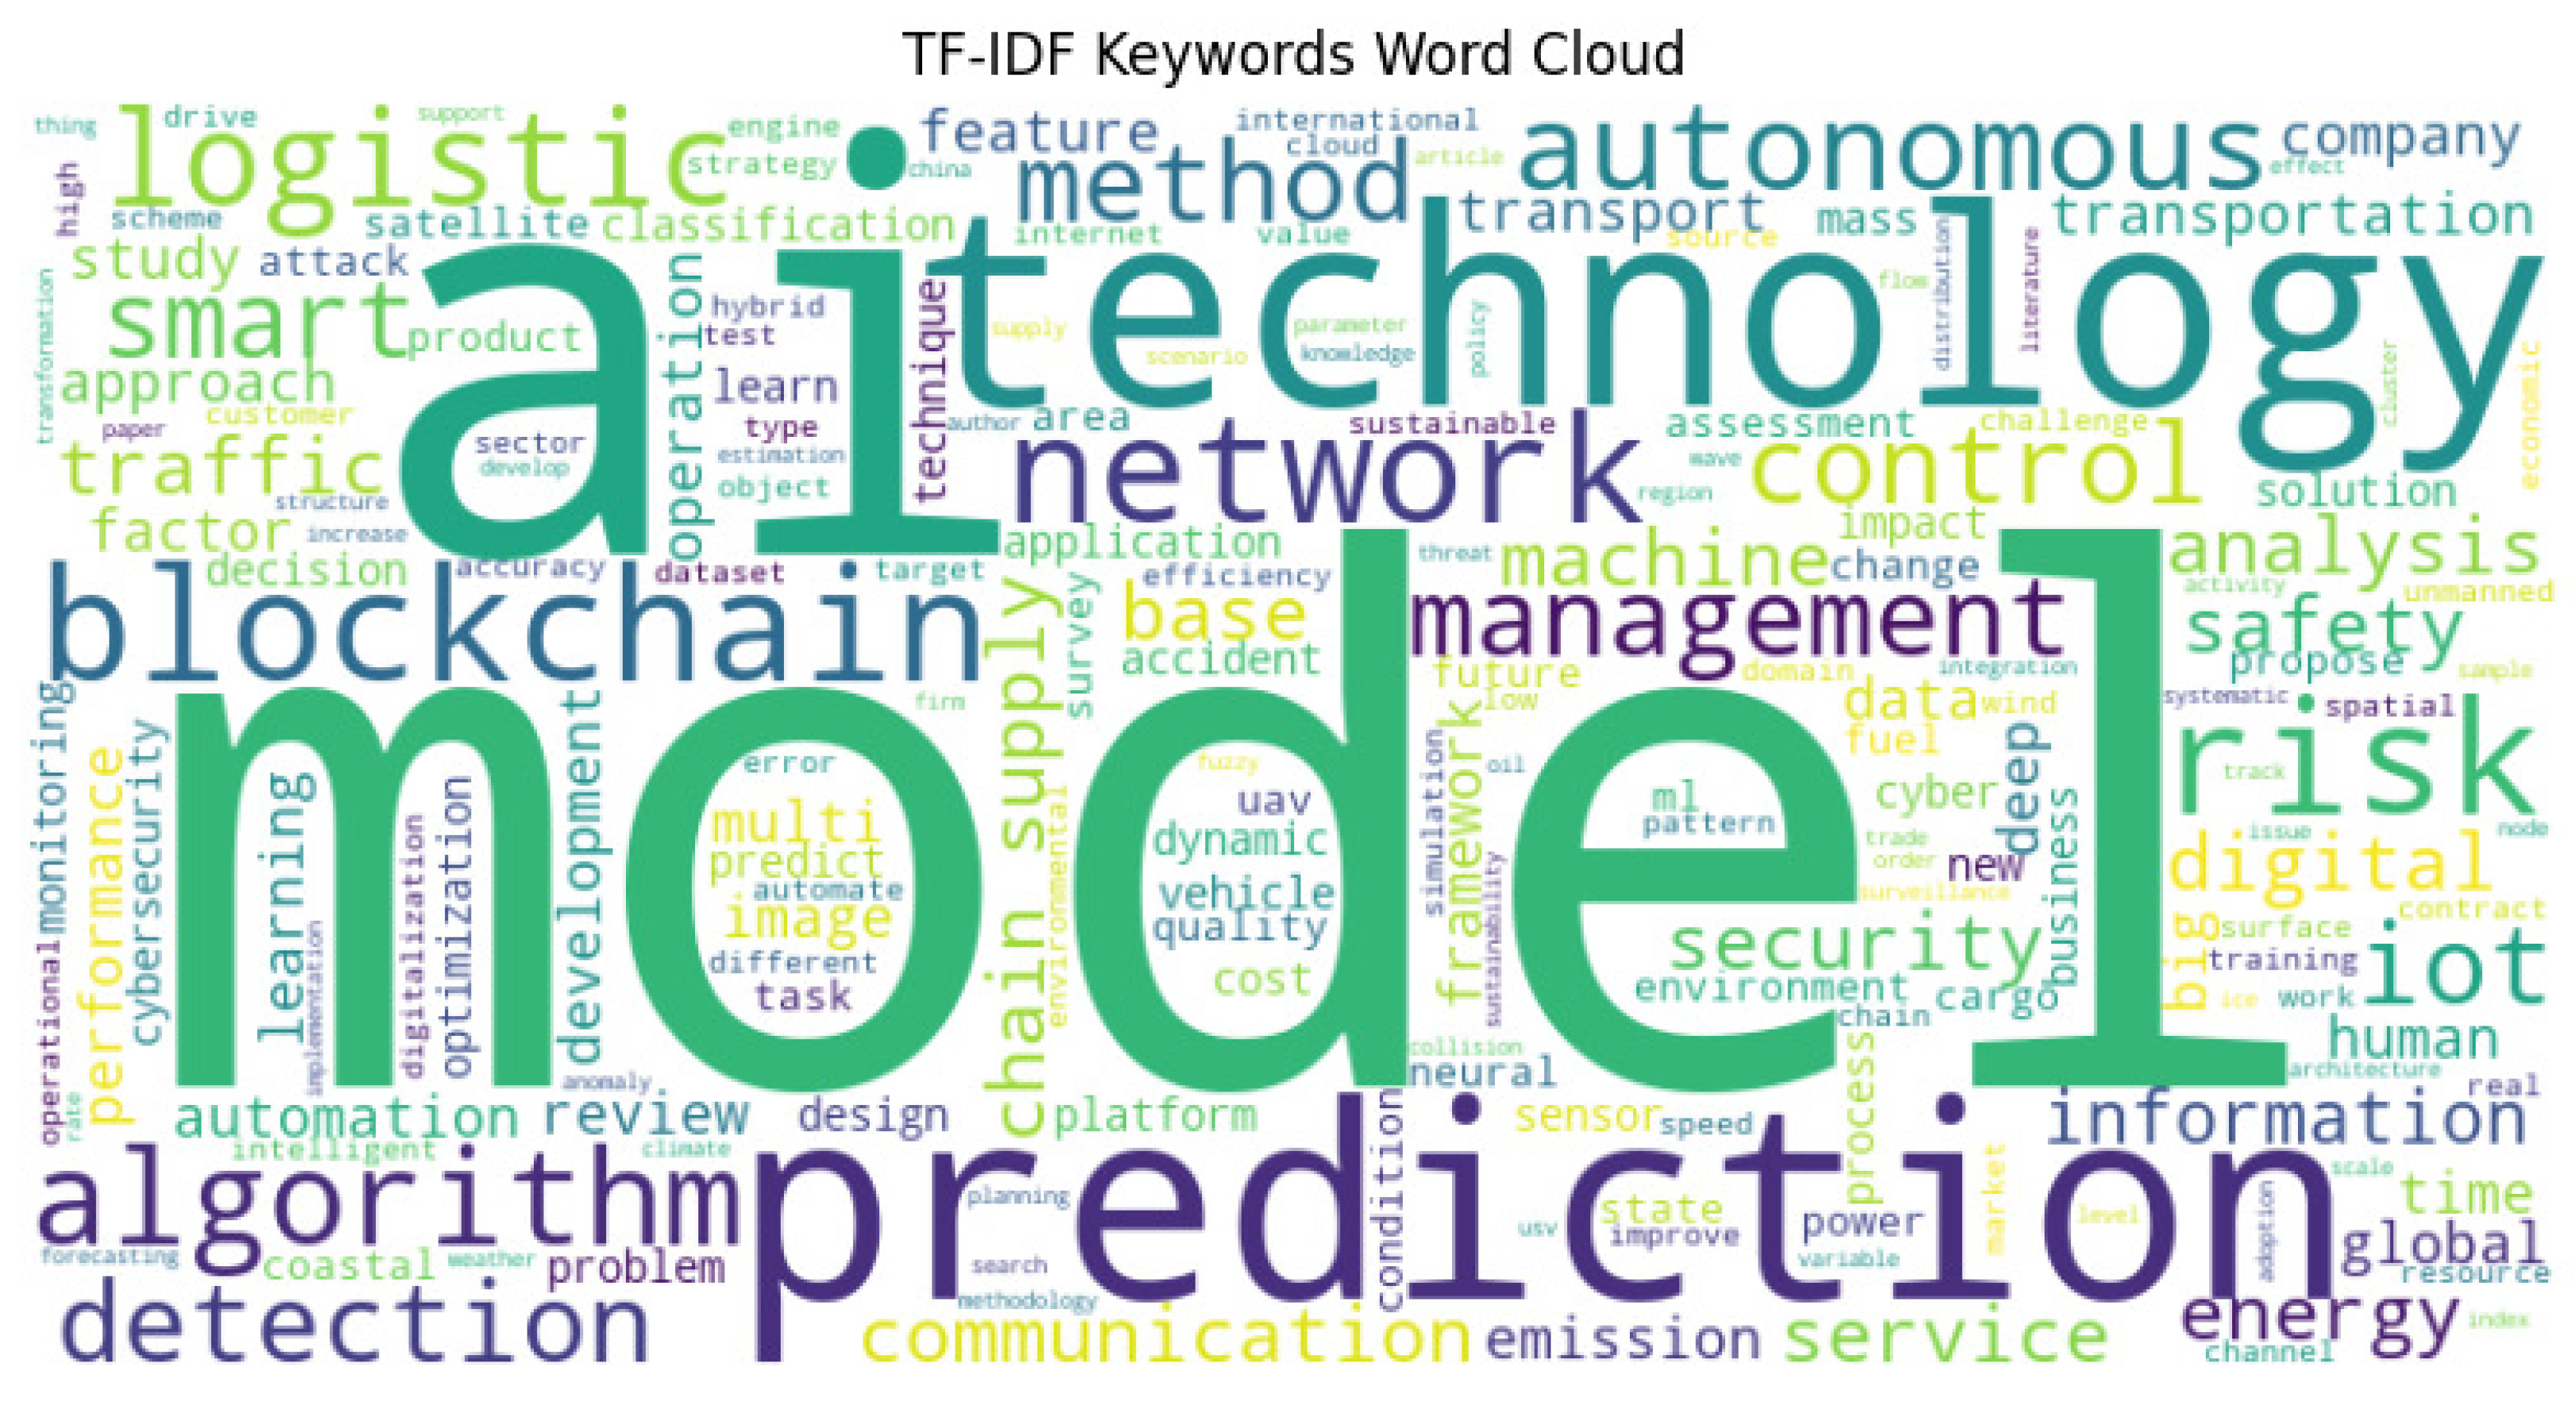
We concluded our thematic analysis by building two word clouds. Using both titles and abstracts from all articles, we applied the TF-IDF algorithm to each word and used it as weight when building the clouds. The first cloud was built over the entire set of words in titles and abstracts, while the second cloud was built after removing all shipping-related terms (hence focusing on the digital technologies only).
4. Results
In this section, we present the results of our analysis. We then discuss them in the next section.
4.1. Descriptive Statistics
Figure 2 shows the distribution of articles across years. Although the first publications date as far back as the 1960s, only from the year 2005 do we see an increasing interest in the effects of digital transformation within the shipping and maritime industry. The number of publication increased minimally and not steadily between 2005 and 2015. From 2015 onward, we see an exponential increase in the number of publications. After reaching a peak in 2023, the trend seems to have stabilized. Considering that our data were collected at the end of October 2024, we can reasonably argue that the year 2024 has not witnessed a significant increase in publication compared to the previous year.
Figure 3 show the top 20 authors, the top 20 institutes, and the top 20 countries in terms of number of publications. Considering the authors, we note how the 0.03% of all authors in our cohort (20 out of 7723) cover over 2.9% of the total publications, suggesting a skewed distribution of publications across authors. When looking at the top institutions, we see they cover over 21% of the total publications (see
Table 3), while the top 5 countries cover up to 50% of total publications (see
Table 4). Looking deeper into the top institute, one can notice how many of these universities have strong historical bindings with the sea. Consider, as examples, the Dalian Maritime University, the Shangai Maritime University, and the Delft Technical University. Similarly, looking at the most representative countries, one can see they all have strong maritime industry and economy.
4.2. Co-Authorship Network Analysis
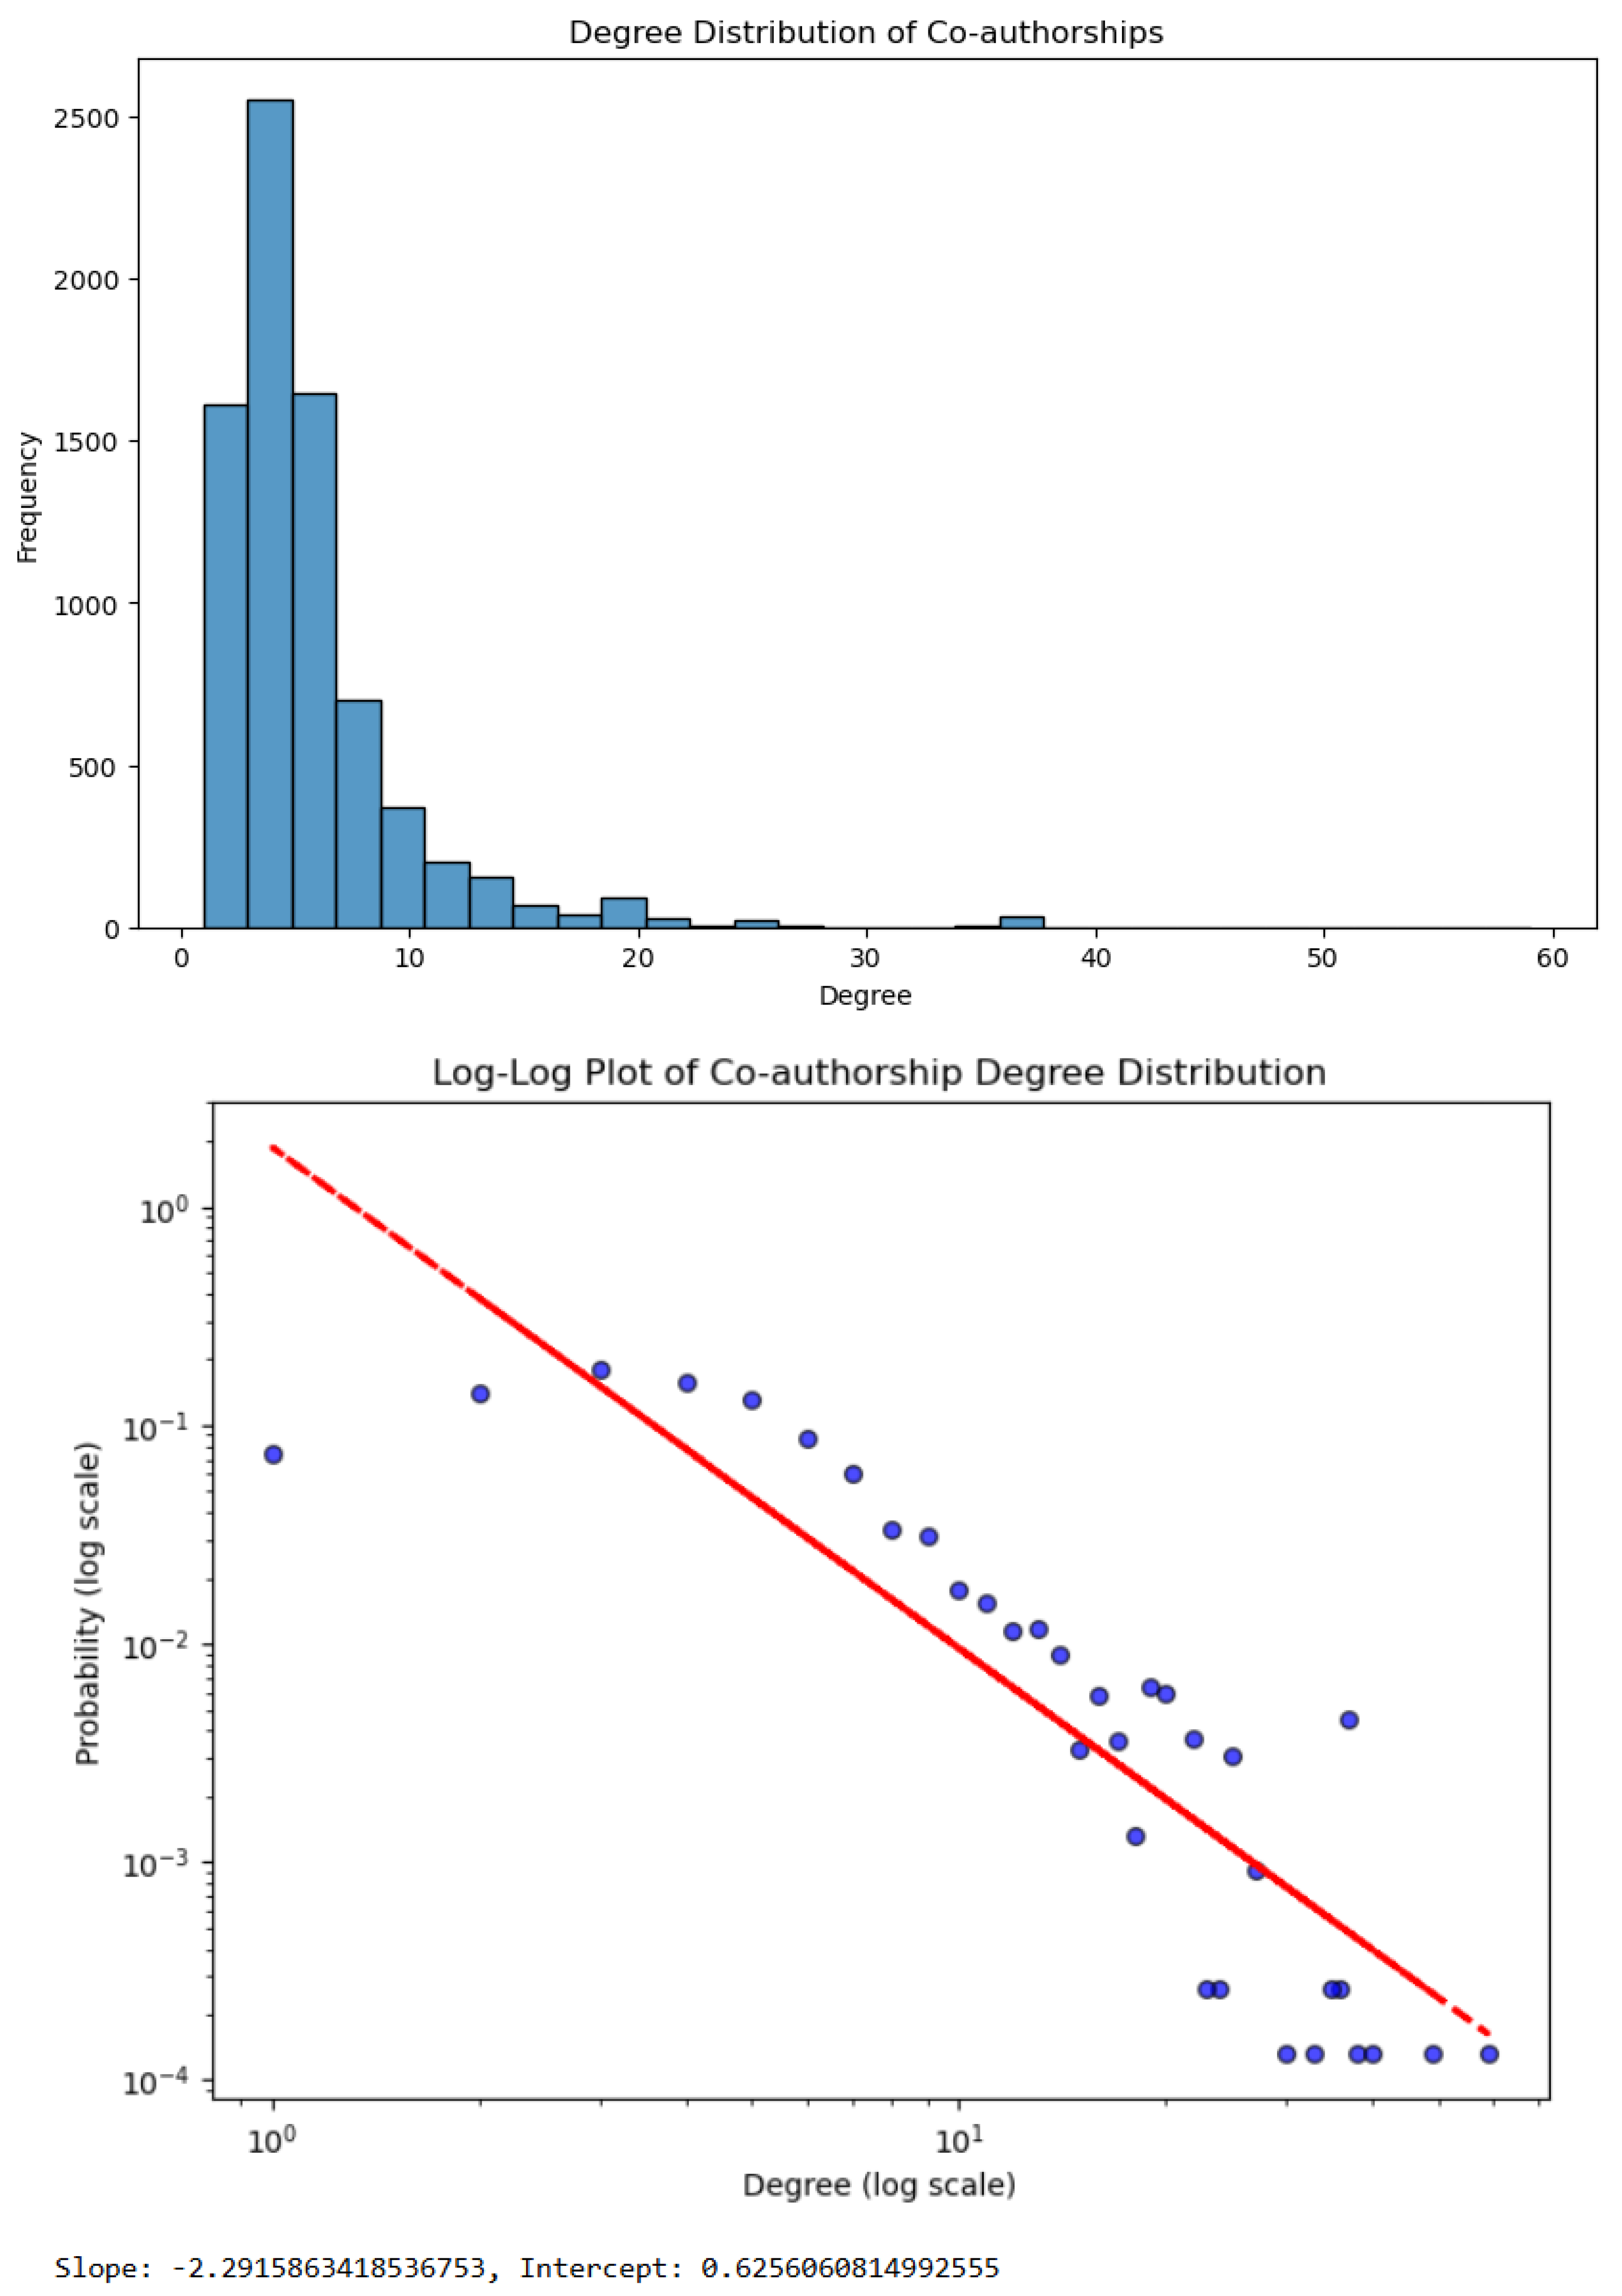
The degree distribution of the co-authorship network seems to follow a power-law curve (see
Figure 4). The degree distribution of a complex network provides insights on the network’s topology. It is drawn by plotting the distribution of the number of links (i.e., edges) within the network. In a random network, the degree distribution follows a Gaussian law, with most nodes having an average number of links. Most real complex networks deviate from randomness due to the principles which see them evolving over time. However, several distributions may present similar curves. To establish which is the best fitting model, we ran statistical tests, calculating the log-likelihood and
p-value between different pairs. The power-law distribution was a significantly more accurate fit than the exponential one (
p < 0.01). However, the comparison between power-law and truncated power-law distributions, as well as the one between power-law and log-normal distributions, did not lead to significantly different results (
p = 0.32 and
p = 0.39, respectively). The results confirm the heavy-tail characteristic of the degree distribution (which holds true for both log-normal and power-law), but without further indicating the possible nature of such a heavy-tail [
23,
24,
25,
26].
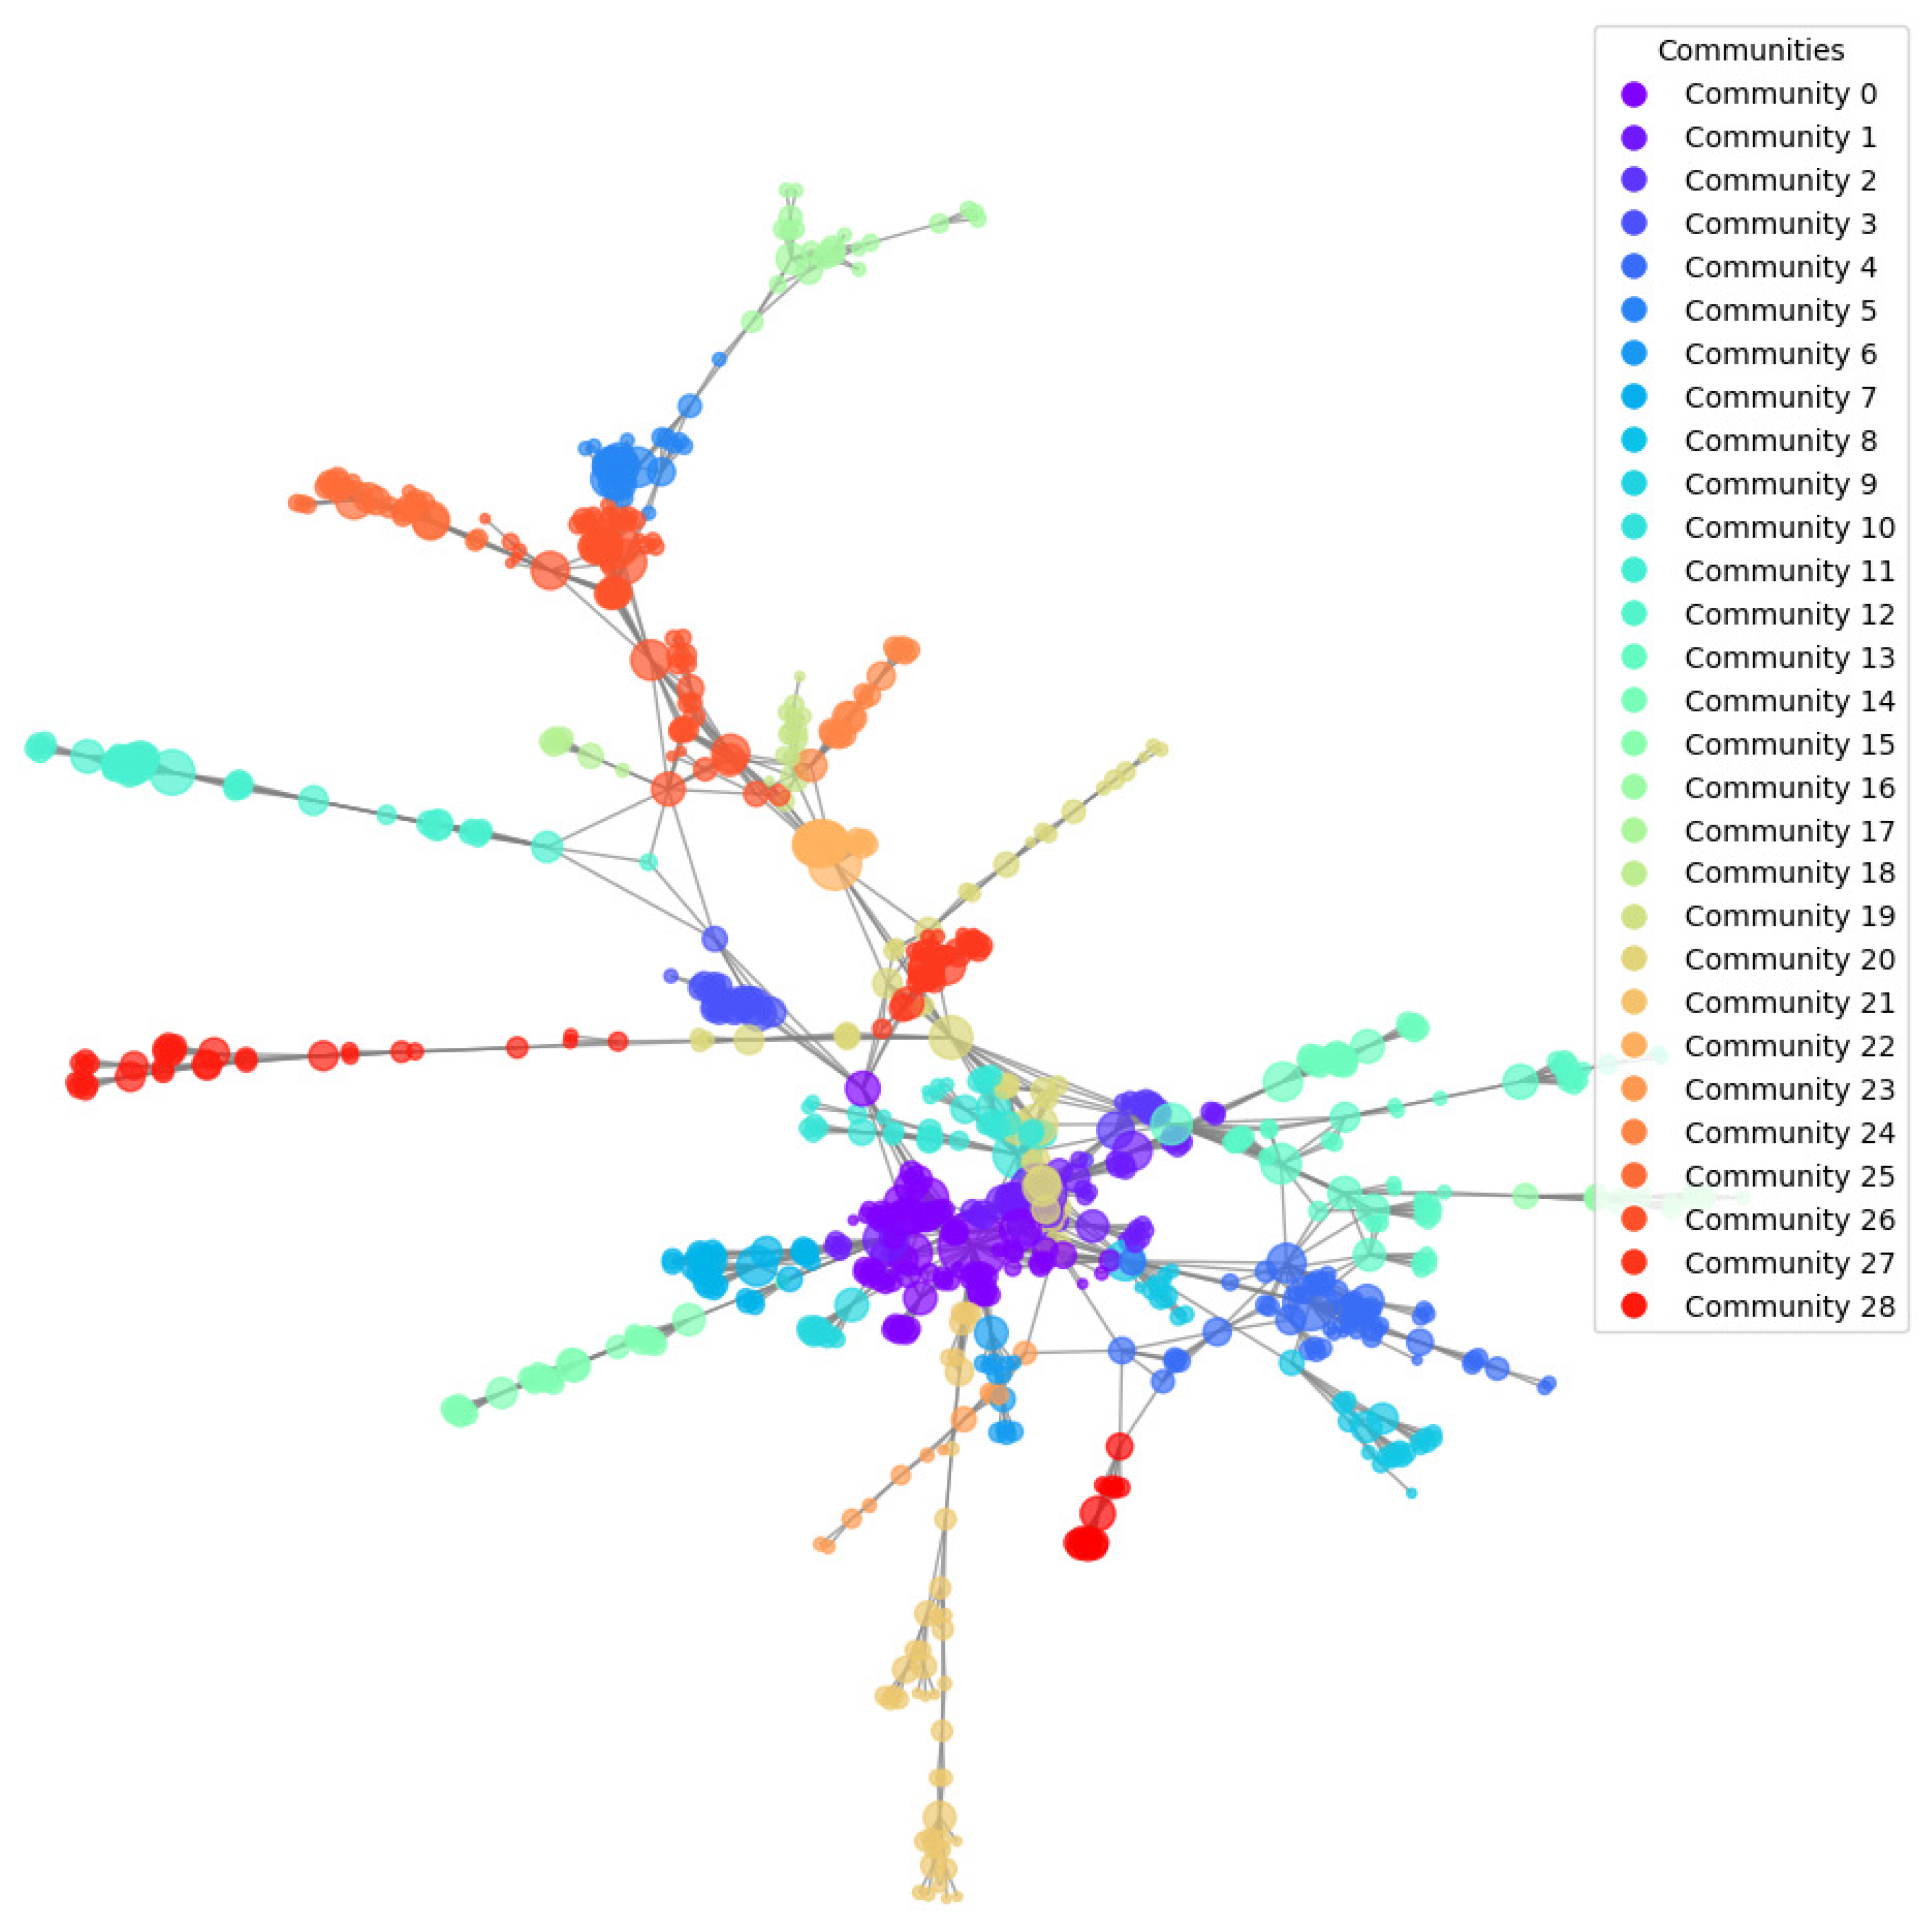
As a second step in our co-authorship network analysis, we identified the largest component of the network (made of 2753 authors) and identified its main communities using the Louvain algorithm [
18]. We identified 28 communities (see
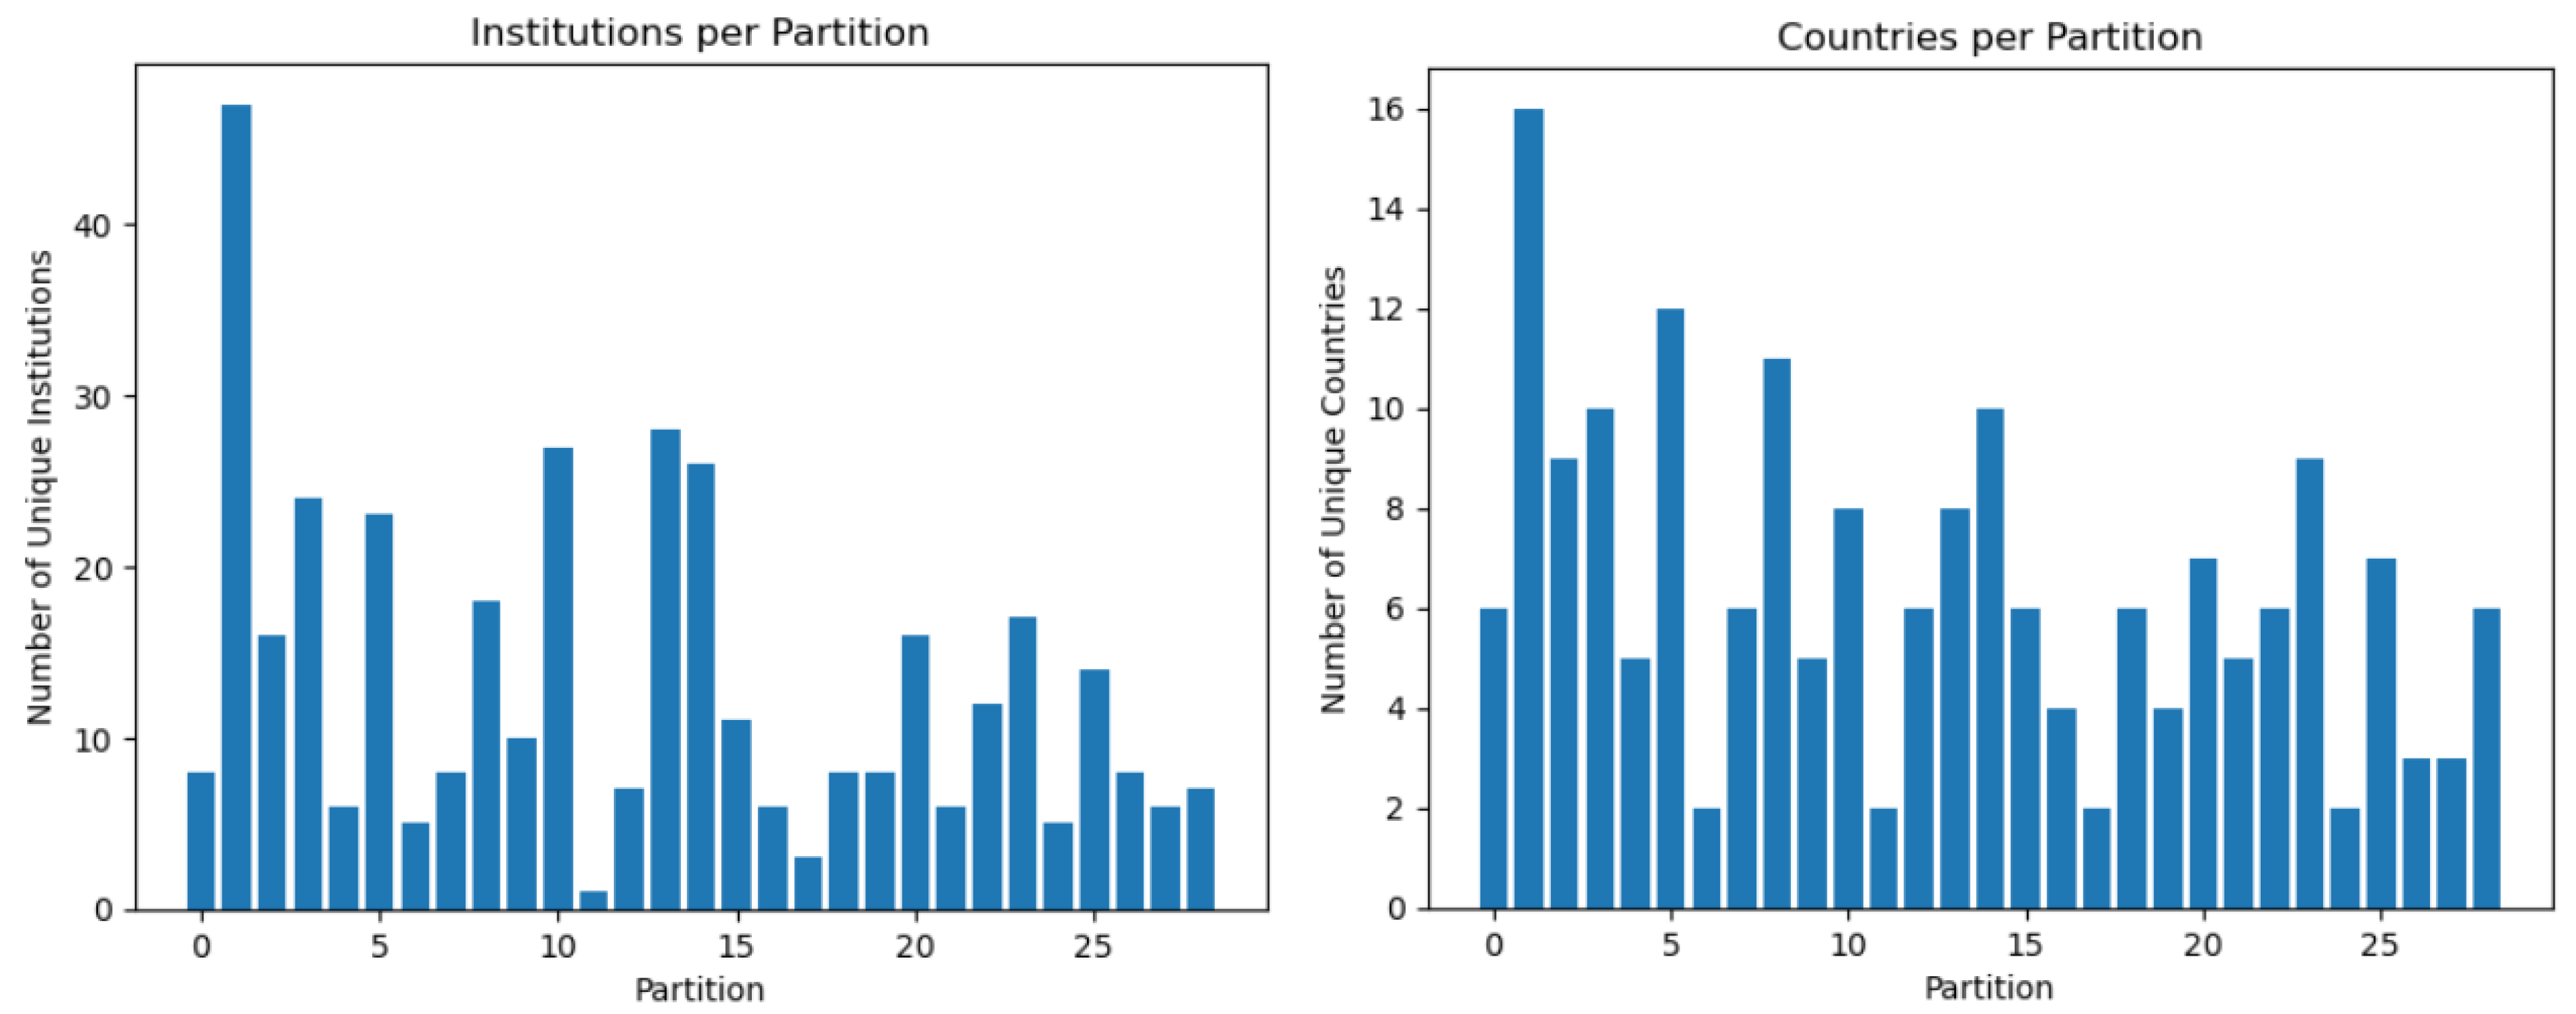
Figure 5) and mapped the distribution of institutions and countries linked to the authors on them. The results highlight a high level of international collaborations within each community, as well as a high level of national collaborations (within the same country). This can be seen in
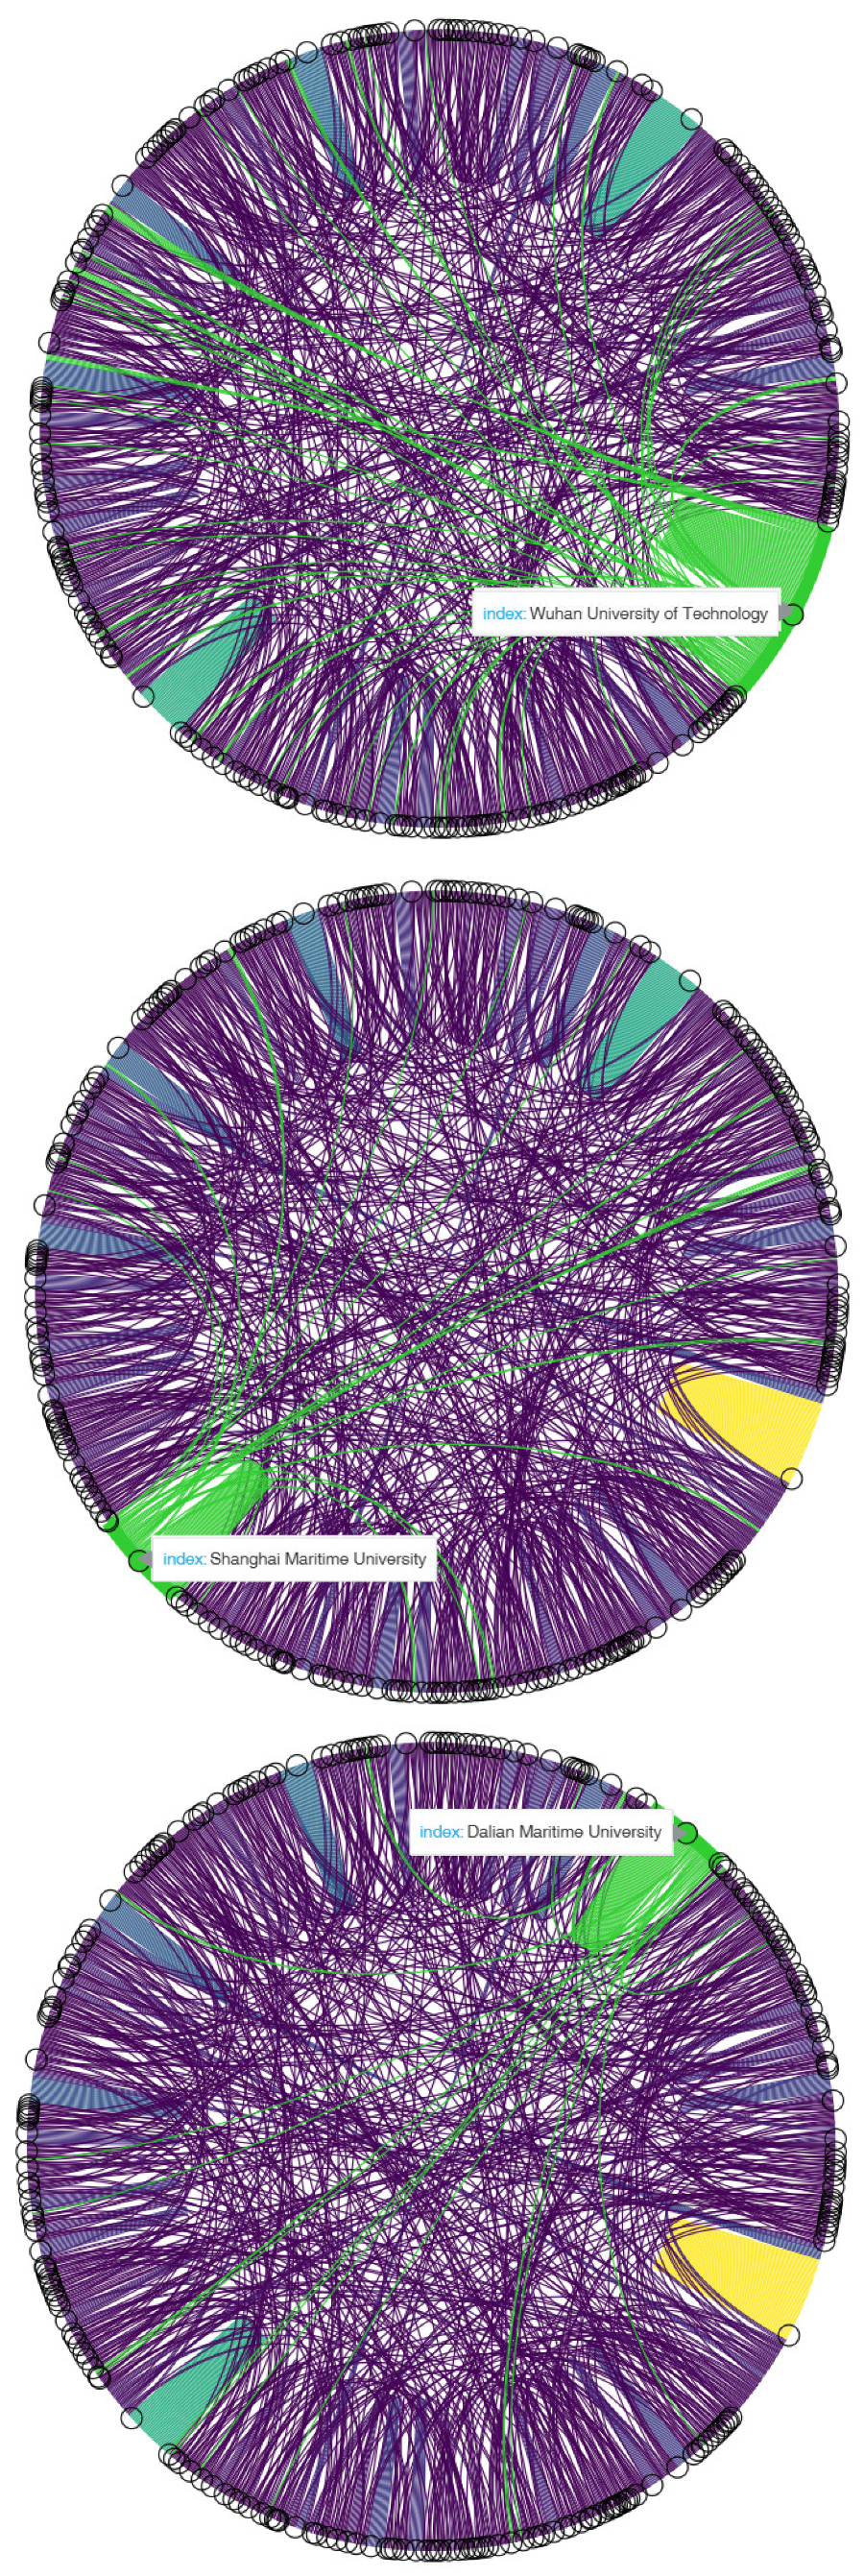
Figure 6, where we show the number of different countries and institutions per community; the distribution is rather uniform across communities, suggesting that each of them includes different institutions and countries. Furthermore, our network analysis does not show any closed cluster of collaborations. Communities are all well inter-connected, suggesting that the niche nature of this field (i.e., digital transformation in shipping) leads global actors to collaborate extensively in advancing research. In
Figure 7 and
Figure 8, we show the chord charts for both country and institution mapping on the co-authorship communities.
Lastly, we evaluated the small-world properties of the co-authorship network. To perform this, we calculated both clustering coefficient and average path length and compared them with equivalent random networks. Our results show a higher clustering coefficient (0.83 vs. 0.007) and a higher average path (7.1 vs. 3.9). In a proper small-world topology, one would expect a high clustering coefficient and small average path. Our results, instead, suggest that communities are strongly locally organized, but somehow lack efficiency in cross-community communication.
4.3. Co-Citation Network Analysis
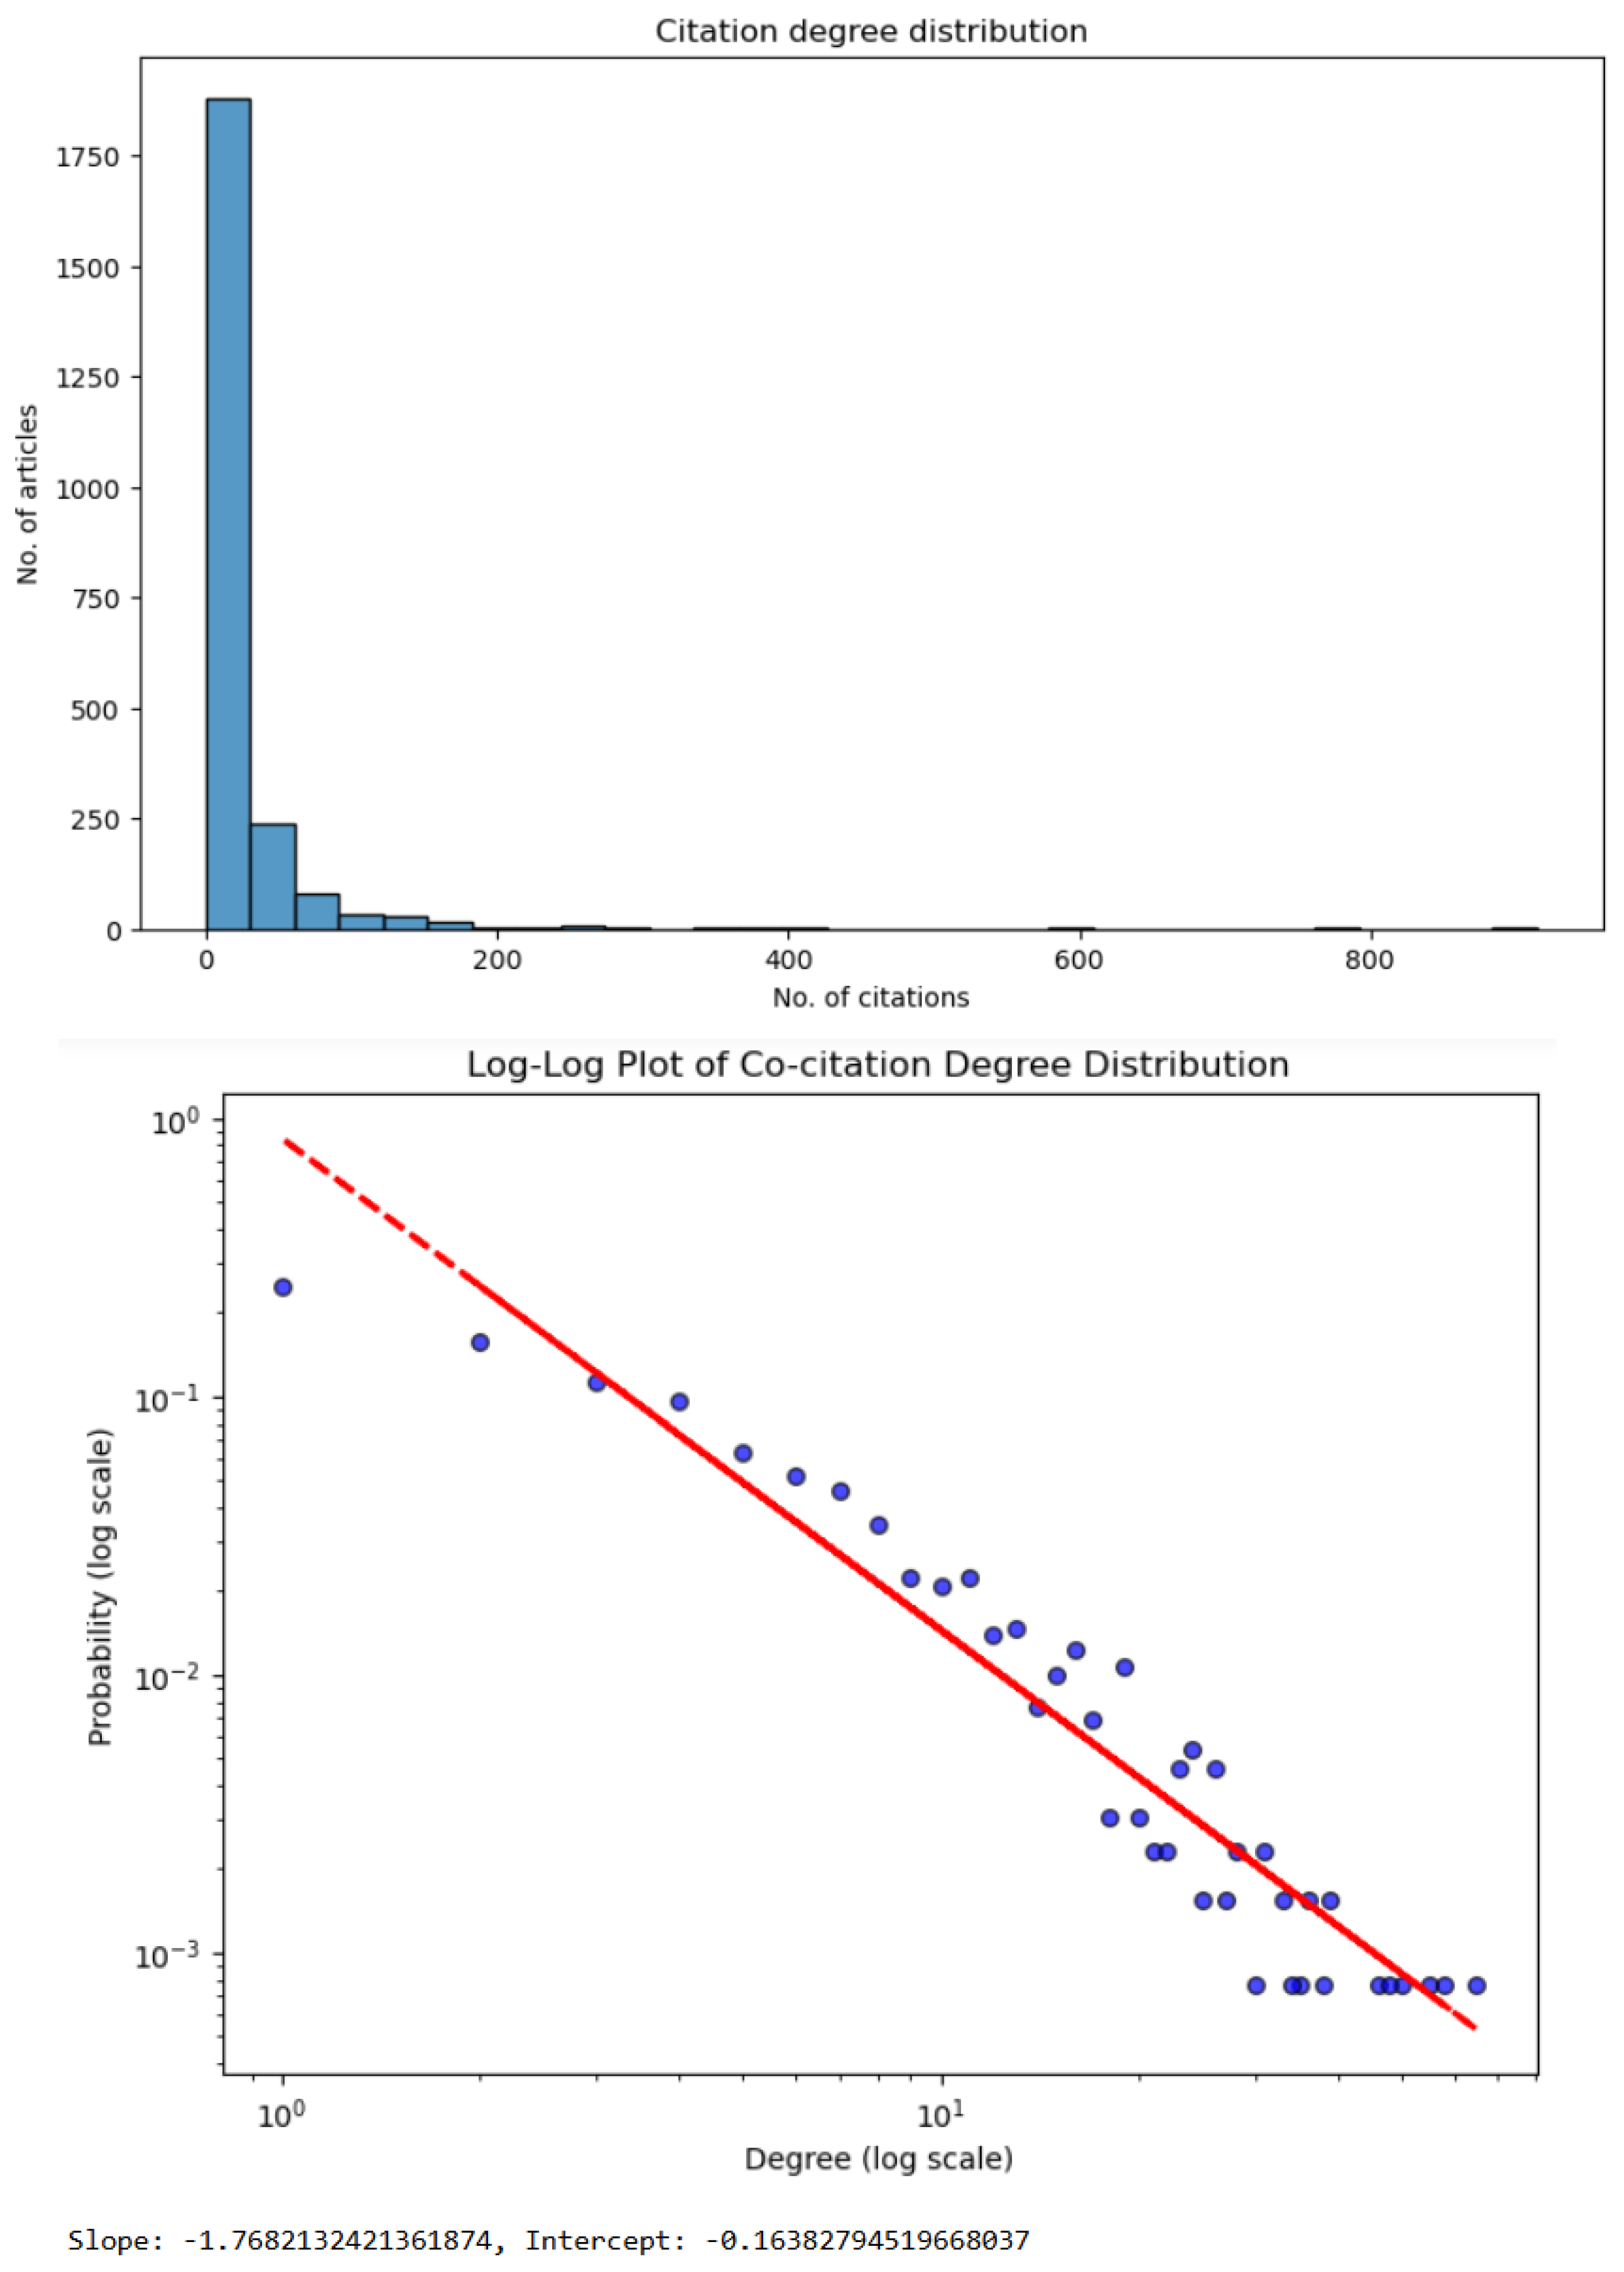
The co-citation network was analyzed for its largest connected component (made of 1298 articles). The results on the degree distribution are similar to those we obtained for the co-authorship network. More specifically, the statistical comparison between degree distribution excluded an exponential distribution (
p < 0.05) and did not favor a power-law distribution against log-normal or truncated power-law distribution (
p = 0.06 and
p = 0.9, respectively).
Figure 9 shows the degree distribution.
Using the degree distribution, we identified the most influential articles (i.e., top 10 articles with the highest number of co-citations).
Table 5 shows such influential works. One can see that among the most influential works, we find SLRs and bibliometric studies, supporting the relevance of such publications within the industry.
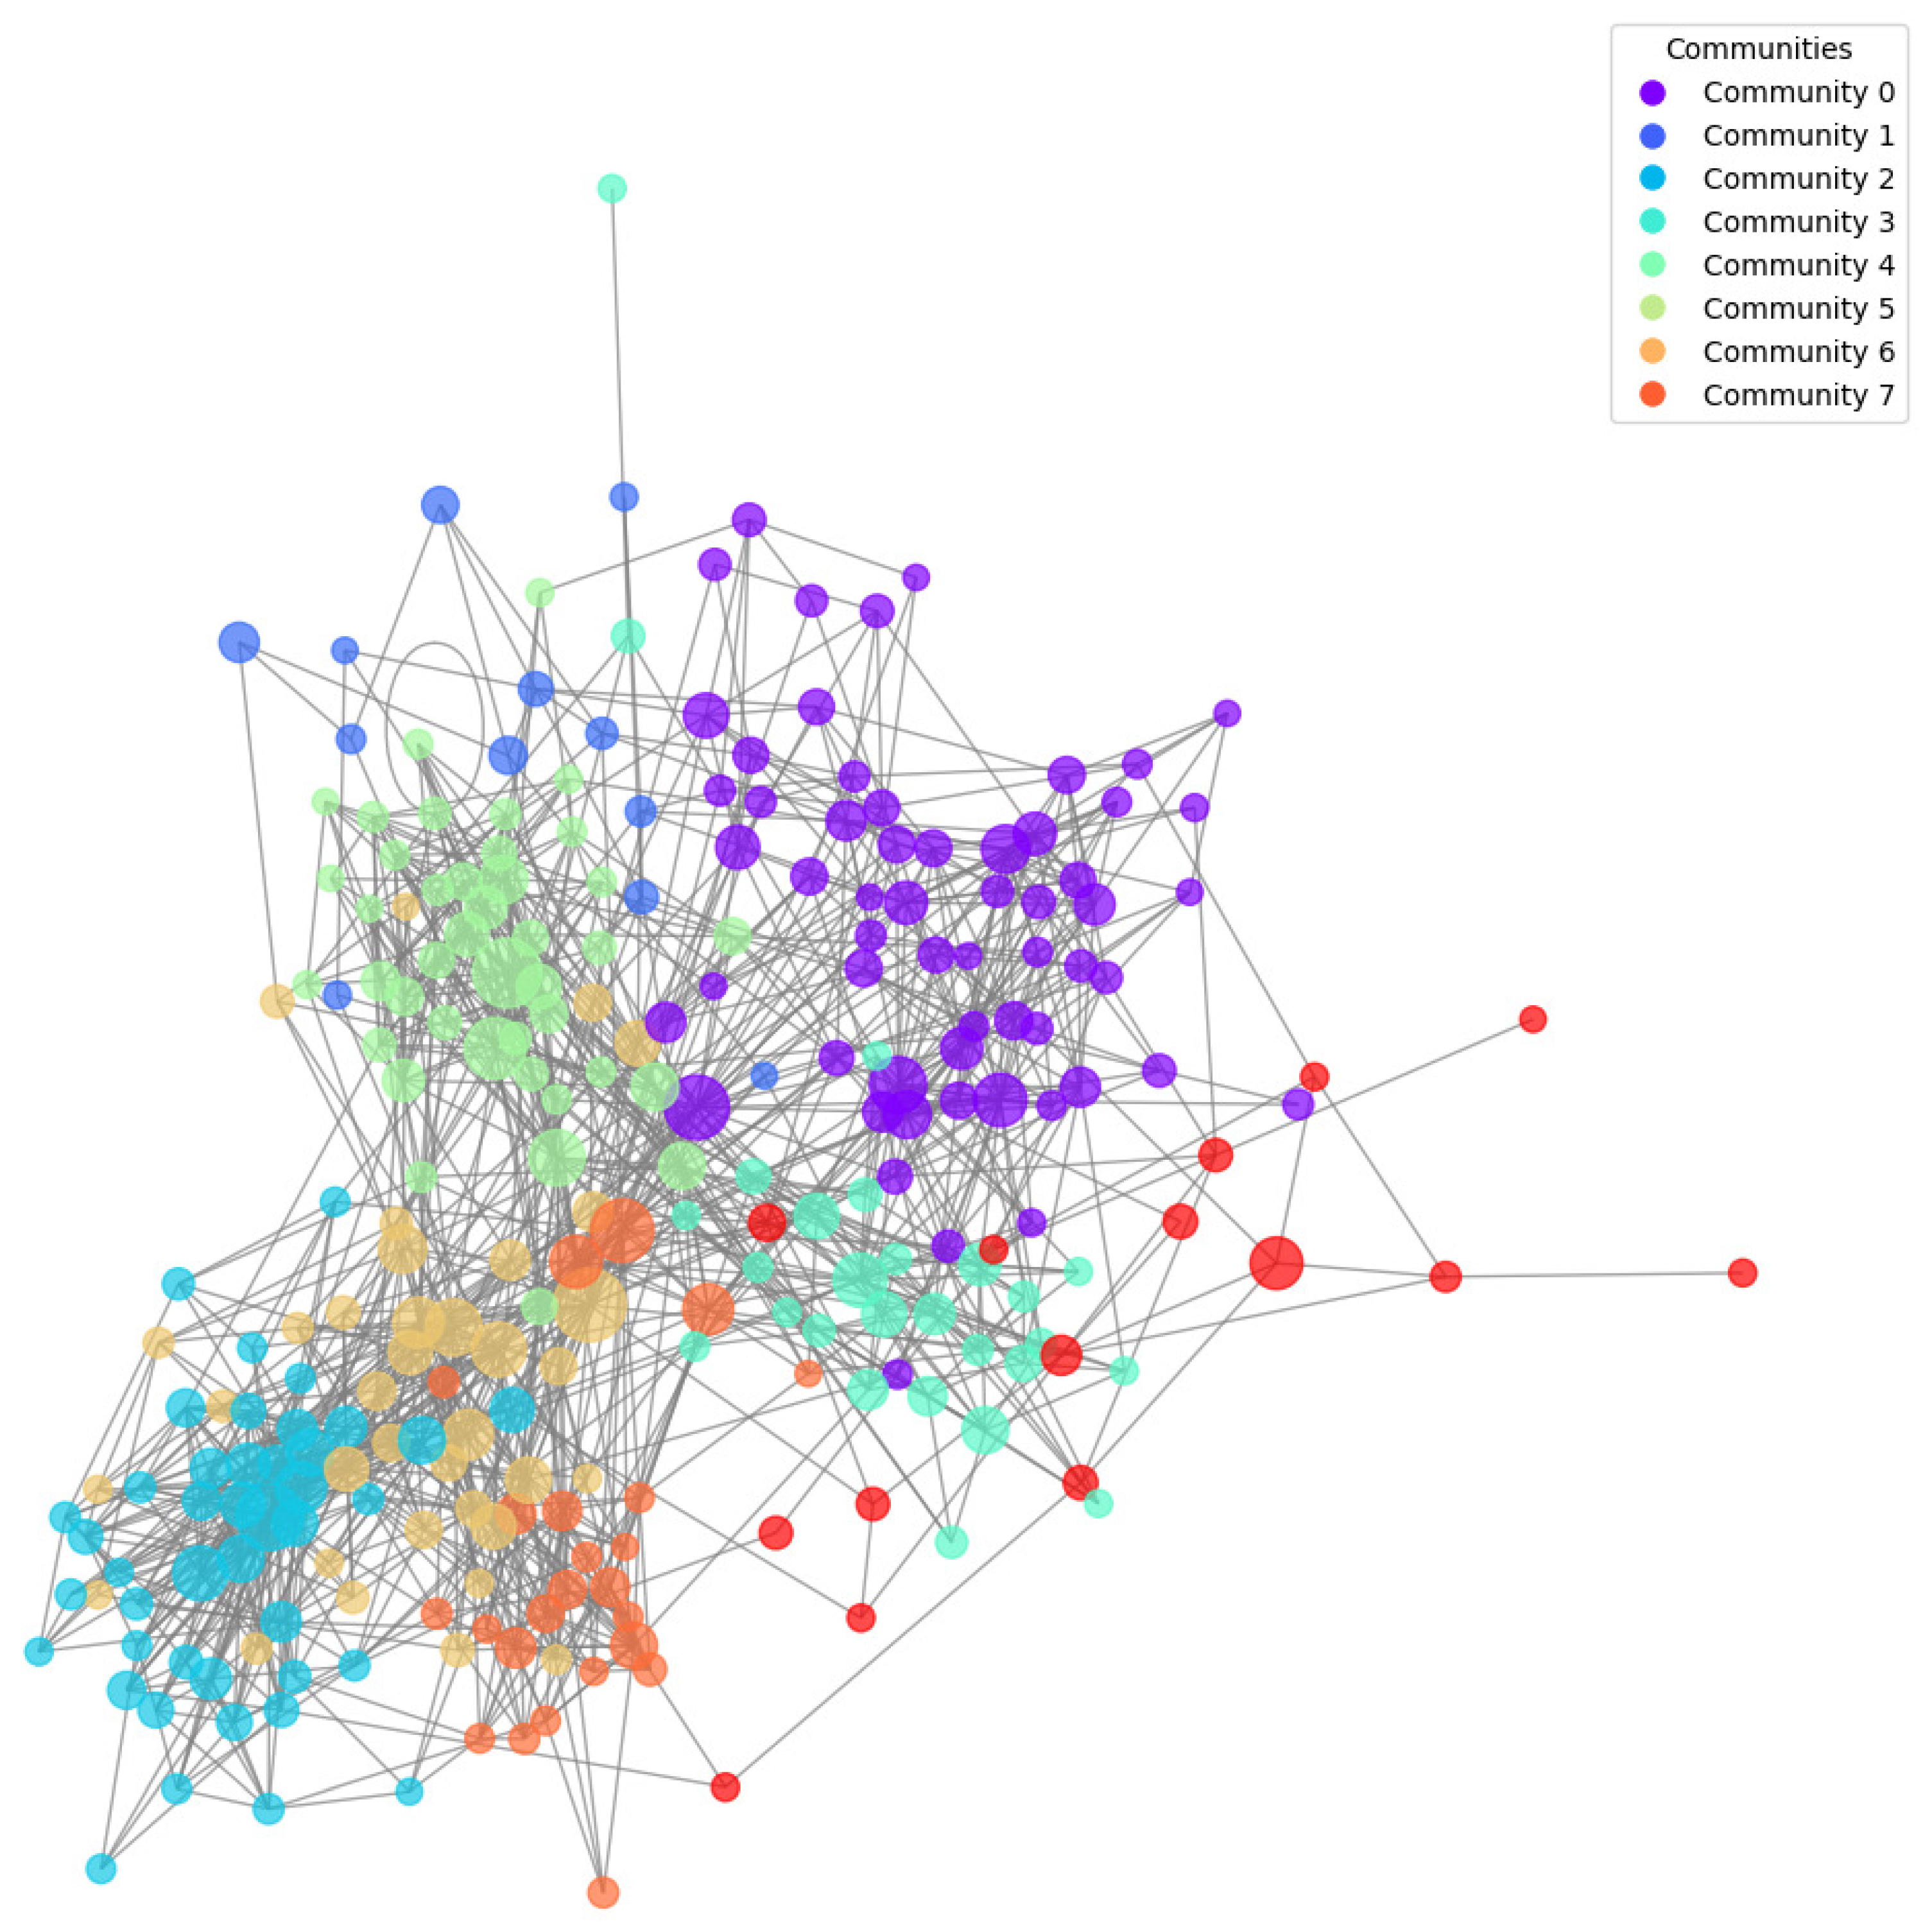
Next, we created a sub-graph considering only the 20% most cited articles (257 nodes). We identified the communities using the Louvain algorithm and performed a topic analysis on the titles of the articles per community.
Table 6 reports the main topics for each of the seven communities we identified, while
Figure 10 shows the color-mapped communities.
Finally, we adopted several centrality measures to identify the most relevant articles. More specifically, we identified the top five articles for five different centrality measures: degree centrality, betweenness centrality, closeness centrality, eigenvector centrality, and page rank. We combined the results and identified 10 relevant articles for further analysis. We then looked in more detail into the theme covered in these articles to extrapolate relevant research areas in the field. The results are shown in
Table 7.
4.4. Thematic Analysis
For the thematic analysis, we considered all titles from the 2290 articles. After having pre-processed, tokenized, and vectorized all titles, we used clustering methods to identify the best number of clusters for the vectors. More specifically, we used the Calinski–Harabasz index and the Davies–Bouldin index. The curves are shown in
Figure 11. All indexes pointed to eight ideal clusters. For each cluster, we calculated the centroid and then selected the 10 closest vectors (i.e., articles) to each centroid. Focusing on their titles, we highlighted the main themes for each cluster. Results are shown in
Table 8.
Next, we built word clouds for our articles. In this case, we used both title and abstract words. The first word cloud was built using all words after pre-processing them. The second word cloud was built after removing shipping-related key words. This allowed us to focus on technical key words for the second word cloud. Both word clouds were based on TF-IDF analysis and are shown in
Figure 12 and
Figure 13.
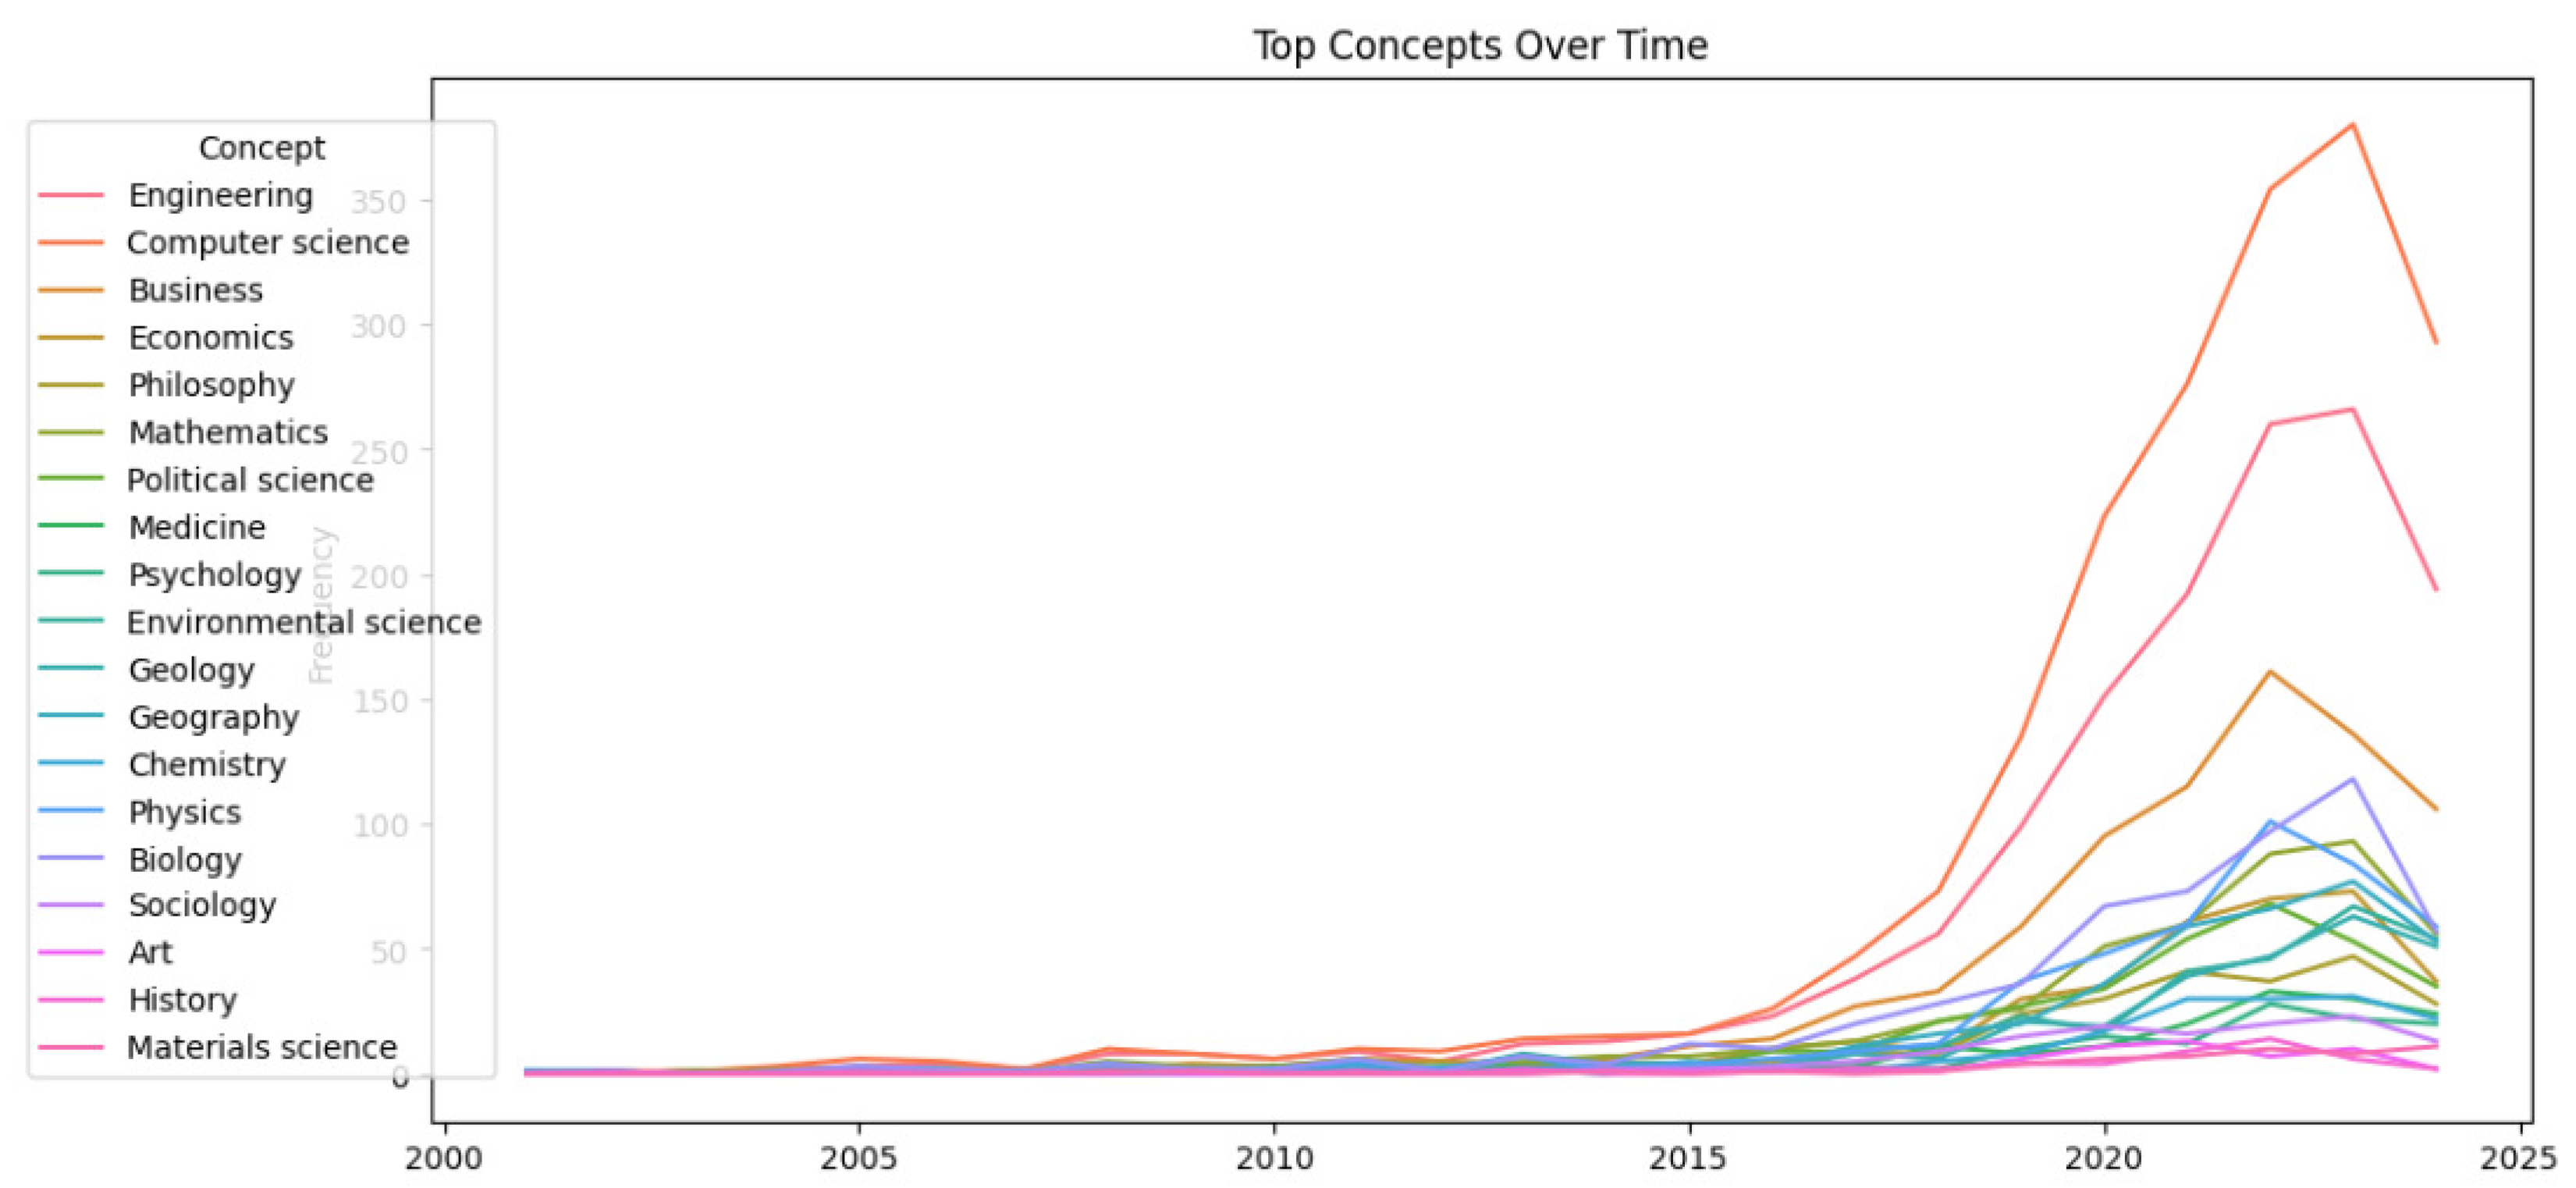
As a last analysis, we focused on the concept tags reported by OpenAlex for each paper. OpenAlex organized topics in a tree-like structure which is a modification of the one produced by [
27]. Specifically, there are 19 root-level concepts: engineering, computer science, business, economics, philosophy, mathematics, political science, medicine, psychology, environmental science, geology, geography, chemistry, physics, biology, sociology, art, history, and materials science. We have collected the root-level concepts related to the publications in our study and plot the number of corresponding papers over time (see
Figure 14).
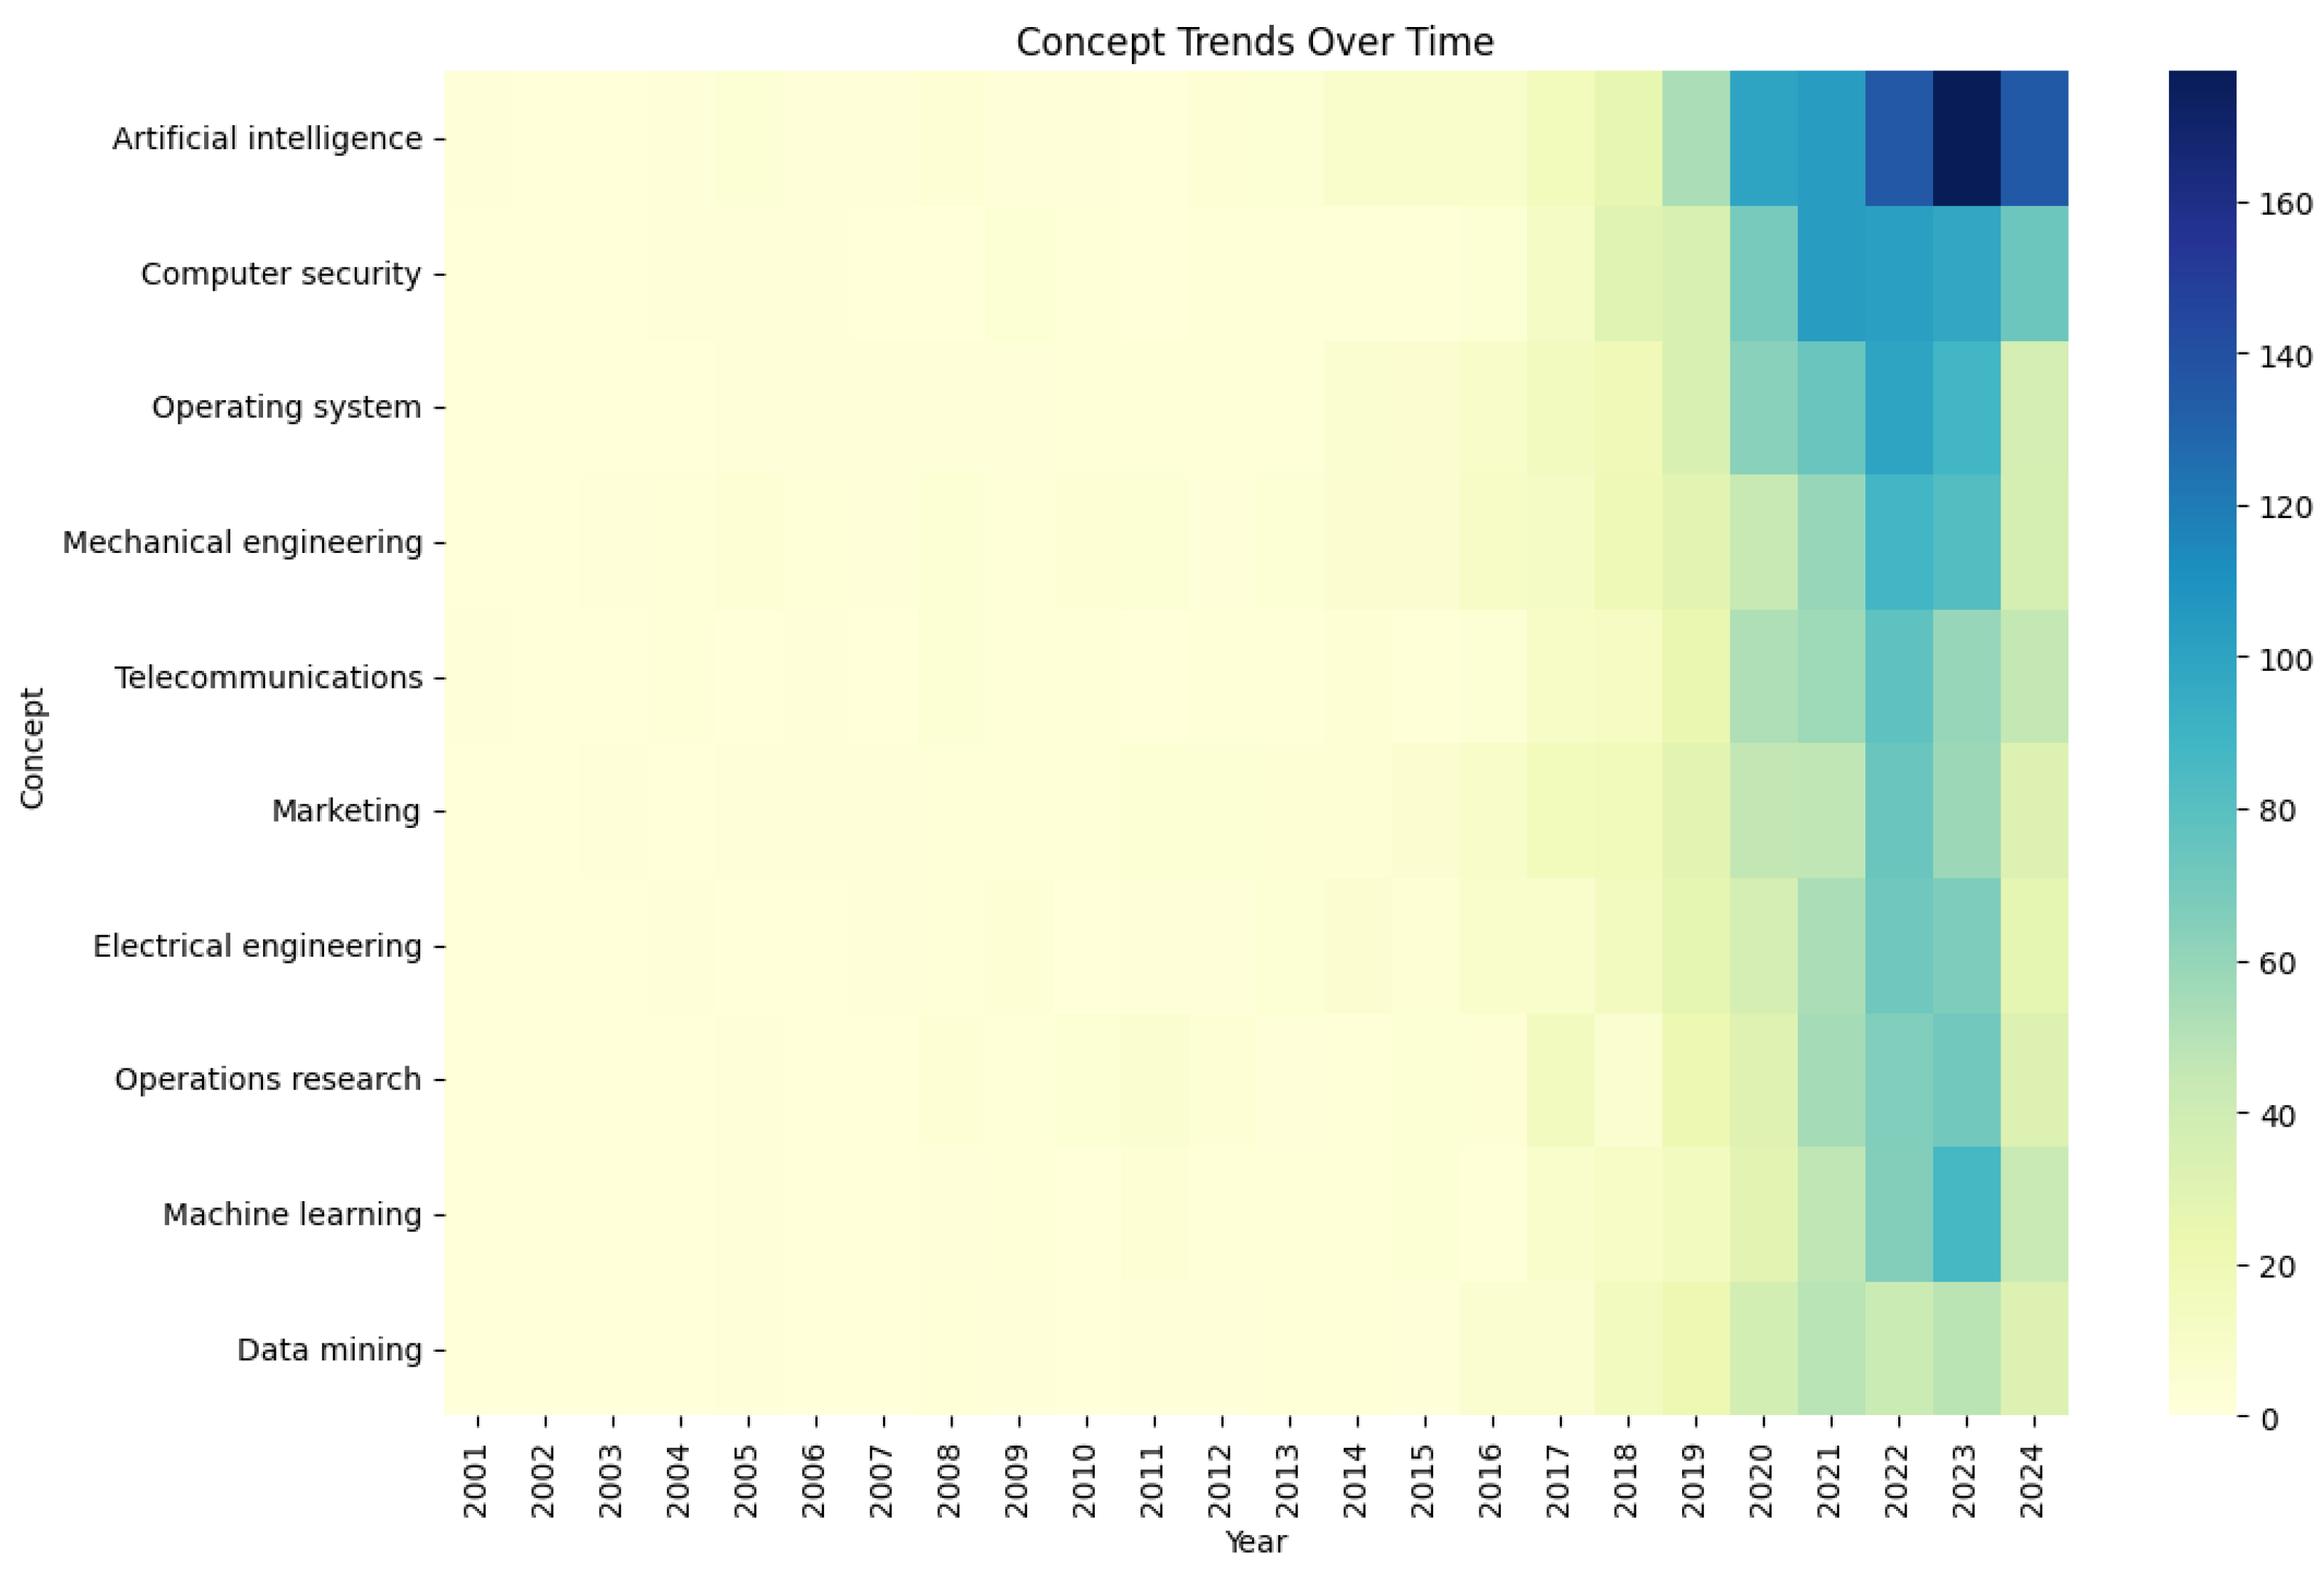
The predominant top-level concept over time are engineering, computer science, and business. We next focused on the second and third level of concepts of OpenAlex, limiting our search to those having as parents either engineering, computer science, or business. Among those, we selected the 10 most relevant and showed their evolution over time in a heat-map (see
Figure 15).
5. Discussion
5.1. Descriptive Analysis
Our work shows a significant increase in publications related to digital transformation in the shipping industry starting from 2005, with an exponential rise after 2015. Such growth indicates a growing recognition of the importance of digital technologies in the maritime sector. However, the data from the last year (October 2024) may suggest an inflection point, with the number of publication no longer increasing. Further analysis performed in the upcoming months may help in validating this finding. If this were to be confirmed, then further investigation would be needed to understand the reason for such an inflection: researchers could be moving to different sub-areas currently not fully identified yet, or it may as well be that financial funding for research in this sector is being reduced.
When analyzing the most prolific authors, we can found out that a very small percentage of all authors (approximately 0.03%) is responsible for over 2.9% of all publications. This finding suggests a skewed distribution of author contribution to the field, with the potential risk of limited research perspective and narrowing research venues. Ideally, one would prefer a more distributed contribution among different authors and teams. To achieve this, the industry and funding agencies should provide opportunities to lesser known authors to expand the horizon and outcome of their research.
The issue is also reflected at institutional and global levels. The top 20 institutions account for over 21% of all publications and the top 20 countries to over 50%, once again indicating a concentration of research efforts in specific locations. This is not completely surprising since the shipping industry and its related research is particularly attracting for institutes and countries with a long-standing historical binding with the sea. However, new technologies make it possible to conduct relevant research even in countries where harbors and the sea are not central to the economy. As an example, one could think of digital twin applications modeling complex systems: advances in such fields could be expected independently from the location of institutes and the geography of the country, allowing more researchers in the future to contribute to this field.
5.2. Co-Authorship Analysis
The degree distribution of the co-authorship network exhibits a heavy-tail behavior. This was confirmed by the statistical analysis comparing power-law versus exponential distributions. However, the statistical tests could not discriminate between power-law and log-normal distributions, preventing us to draw conclusions on the mechanism at the origins of such a heavy-tail. The presence of authors with a high number of co-authors highlights once again the niche nature of such research fields, where few co-authors have reached outstanding international recognition for their work and have participated in several research works, playing the role of hubs within the co-authorship network. As the field further evolves, one hope is to see a less-skewed distribution, with more authors acquiring leading roles and collaborating with each other.
Looking at communities, it appears clear that the network is highly cohesive. Clusters of co-authorship are present across the entire network, and such communities are strongly interconnected with each other. This can also be seen looking at the distribution of institutions and countries across communities of co-authors. Each community contains more than just one institute or one country, suggesting that the research on digital transformation in shipping industry thrives on national and international collaborations. This could be the consequence of the niche nature of this research area, which brings different groups to join forces across borders in their research endeavors. Some institutes and countries play a central role in connecting the entire network. Important hubs are the Wuhan University of Technology, the Shanghai Maritime University, and the Dalian Maritime University; country-wise, the most important hubs are China, Singapore, and the United Kingdom. In order to mitigate this unbalanced situation, funding agencies should promote research at the crossroad of digital transformation and shipping in other areas, such as within the European Union.
Lastly, the analysis of small-world properties for the co-author network leads to interesting insights. The high clustering coefficient paired with a high average path suggests that, despite having tightly local structures, more work should be performed to strengthen the collaboration among such clusters. Research groups should be incentivized to extend their collaborations beyond their usual collaborators in order to favor knowledge transfer and advance this field of research.
5.3. Co-Citation and Thematic Analysis
The co-citation network also exhibits heavy-tail behavior, although in this case the evidence is not supported by statistical analysis. More data should be collected to further validate the heavy-tail nature of its degree distribution. When clustered in communities, the co-citation analysis allowed us to identify the main topics of research across the entire period under investigation. The important areas of research are related to (a) the optimization and prediction of fuel consumption and, in general, energy efficiency, with machine learning playing a key role; (b) safety and risk management, once again supported by machine learning-based predictive maintenance and edge computing; (c) logistics, port operations, and supply chain, supported by big data analysis, cloud computing, and blockchain technologies; (d) the integration of Industry 4.0 technologies for smart ports; (e) and cybersecurity, supported by IoT and machine learning.
When looking at themes over the year, the most predominant contributions came from engineering, computer science, and business science. The first two contributed mostly within sub-areas such as artificial intelligence, computer security, operating systems, mechanical and electrical engineering, telecommunications, and data mining. Business-wise, the main areas of research are focused on marketing and operations research. One can see how artificial intelligence and computer security have become a very hot topic of research in the most recent years, while other fields, such as marketing and telecommunications, seem to be in decline. Similarly, innovative technologies such as blockchain and cloud IoT do not emerge as predominant thematic trends. This could be interpreted as a potential gap to fill by research groups in the upcoming years.
5.4. Related Literature
Other researchers have published literature reviews related to digital transformation and shipping or the maritime industry. In [
1], the authors have identified drivers, barriers, and successful factors for digital transformation specifically within the sub-field of maritime transportation. While reporting relevant insights on a lack of awareness and strategies to facilitate digital transformation, their study maintains focus on a specific area of the shipping industry. The authors also confirm that previous overviews of digital transformation in the maritime transport sector were scarce, further confirming the need of a more systematic and holistic literature review. The results are based on a classical SLR, rather than adopting a network-based approach.
Another relevant review was published by the authors of [
28]. In their work, the authors focused specifically on blockchain and its application in the digital transformation of ports and shipping. The research is presented as a review article, rather than a proper SLR, and has particular focus on the supply chain. To clarify, a holistic view of digital transformation on the shipping industry was not the goal of this research and is therefore missing. Similarly, the work from [
29] focuses mostly on digital transformation for logistics.
In [
6], the authors cover a rather innovative field of research, namely the intersection of digital transformation in unmanned vessels. Their review paper draws useful insights on the implications that unmanned vessels will have on the identity of the shipping industry. Once again, this review focuses on a specific sub-areas of the shipping industry, leaving space for a comprehensive review of digital transformation implications across the entire industry.
The two most relevant reviews to compare our work with are [
5,
8]. The first work by the authors of [
5] is a systematic literature review covering eight main technological domains and three industry sub-sectors. Starting with approximately 3000 research papers, the authors narrow the selection down to 191 by filtering the original set through titles and abstracts. In addition to the 191 articles, the authors analyze all the referred papers of their subset, hence adding another 23 publications to their analysis. Although similar to our work in their wide analysis of technological themes, the article is not based on network theory and does not provide holistic results across all the originally identified 3000 papers. Hence, their work is driven by the themes selected up-front, rather than identifying the most relevant themes as an output of the research. They conclude that maritime industry is moving towards digital transformation at different speeds within the different technological domains.
The second work from [
8] is the closest to ours. The authors do perform a bibliometric analysis leveraging some network theory concepts. Once again, their starting point is the recognition of a scarcity of reviews at the intersection of digital transformation and the maritime and shipping industry. Starting from over 8000 journal and conference articles, the authors manually filtered their initial set to exclude some categories such as ship building and design, and surveillance. The final number of papers reduced to 280 papers, which were used for the downstream analysis. Their bibliometric analysis focused on countries and authors (i.e., most cited authors), in addition to thematic areas. It is particularly interesting how their analysis identified artificial intelligence as a field not strongly researched. Considering that their work was published in 2022, their results are in agreement with ours. However, our analysis covers the years up to 2024 and highlights how artificial intelligence has become a dominant research field within the industry. Moreover, the authors acknowledge the limitation of manual filtering, applied to reduce the total number of articles and guarantee high relevance of the publications. Although we understand the importance of article relevance, in our work, we also recognize the added value of a large cohort in order to identify gaps in research and obtain statistically more robust results. To conclude, their work does mention the use of centrality measures, but without specifying which centrality was adopted, hence not allowing us to directly compare our results.
6. Conclusions and Future Work
This study provides a comprehensive bibliometric analysis of digital transformation research in the shipping industry. The key findings indicate a significant increase in publications since 2005, with exponential growth after 2015. However, the data from the last year suggest a possible inflection point, which requires further investigation to determine if research interest is shifting or if financial constraints are affecting the field. Additionally, the analysis of authorship patterns reveals a concentration of contributions among a small percentage of researchers, institutions, and countries, which may limit diversity in research perspectives. Encouraging broader participation through funding opportunities and institutional support could help mitigate this imbalance.
The co-authorship network analysis highlights the presence of a highly cohesive research community with strong national and international collaborations. While this structure has facilitated knowledge sharing, the dominance of a few key hubs suggests that fostering new collaborations among underrepresented researchers and institutions could further enhance the field. Additionally, the examination of co-citation networks has identified key thematic areas of research, including fuel consumption optimization, risk management, logistics and supply chain operations, smart ports, and cybersecurity. Notably, artificial intelligence has emerged as a dominant topic, while fields like telecommunications and marketing appear to be in decline.
A comparison with the existing literature reviews confirms that previous studies have primarily focused on specific sub-fields such as maritime transportation, blockchain applications, or unmanned vessels. While these reviews provide valuable insights, they lack the holistic approach presented in this work. Compared to earlier bibliometric analyses, our findings indicate a growing emphasis on artificial intelligence, highlighting a shift in research priorities over recent years. Furthermore, our study benefits from a more comprehensive dataset, reducing the biases associated with manual filtering and enabling a broader understanding of research gaps.
Future research should focus on validating the observed inflection point in publication trends and investigating the underlying reasons behind potential shifts in research focus. Additionally, more efforts should be directed at fostering interdisciplinary collaborations and expanding participation beyond dominant institutions and countries. Further refinement of bibliometric methodologies, including more advanced statistical validation of network structures, would also enhance our understanding of the evolution of digital transformation in the shipping industry. By addressing these areas, future studies can provide even deeper insights into the trajectory of this rapidly evolving field.
To conclude, our study presents some limitations which should be addressed in future work. First of all, we have limited our analysis to journal publications; while this choice has allowed us to focus on more solid scientific articles, it may have excluded some recent findings (usually published first in a conference, and later on consolidated in journal publications). Secondly, we have selected specific databases for our search; in the future, we could extend our work to other relevant databases and check if the results are consistent with our findings. Lastly, we have limited our research to studies conducted in English only. Our choice was dictated by the need to evaluate the publications; however, we acknowledge that this may have excluded relevant articles published in different languages.


