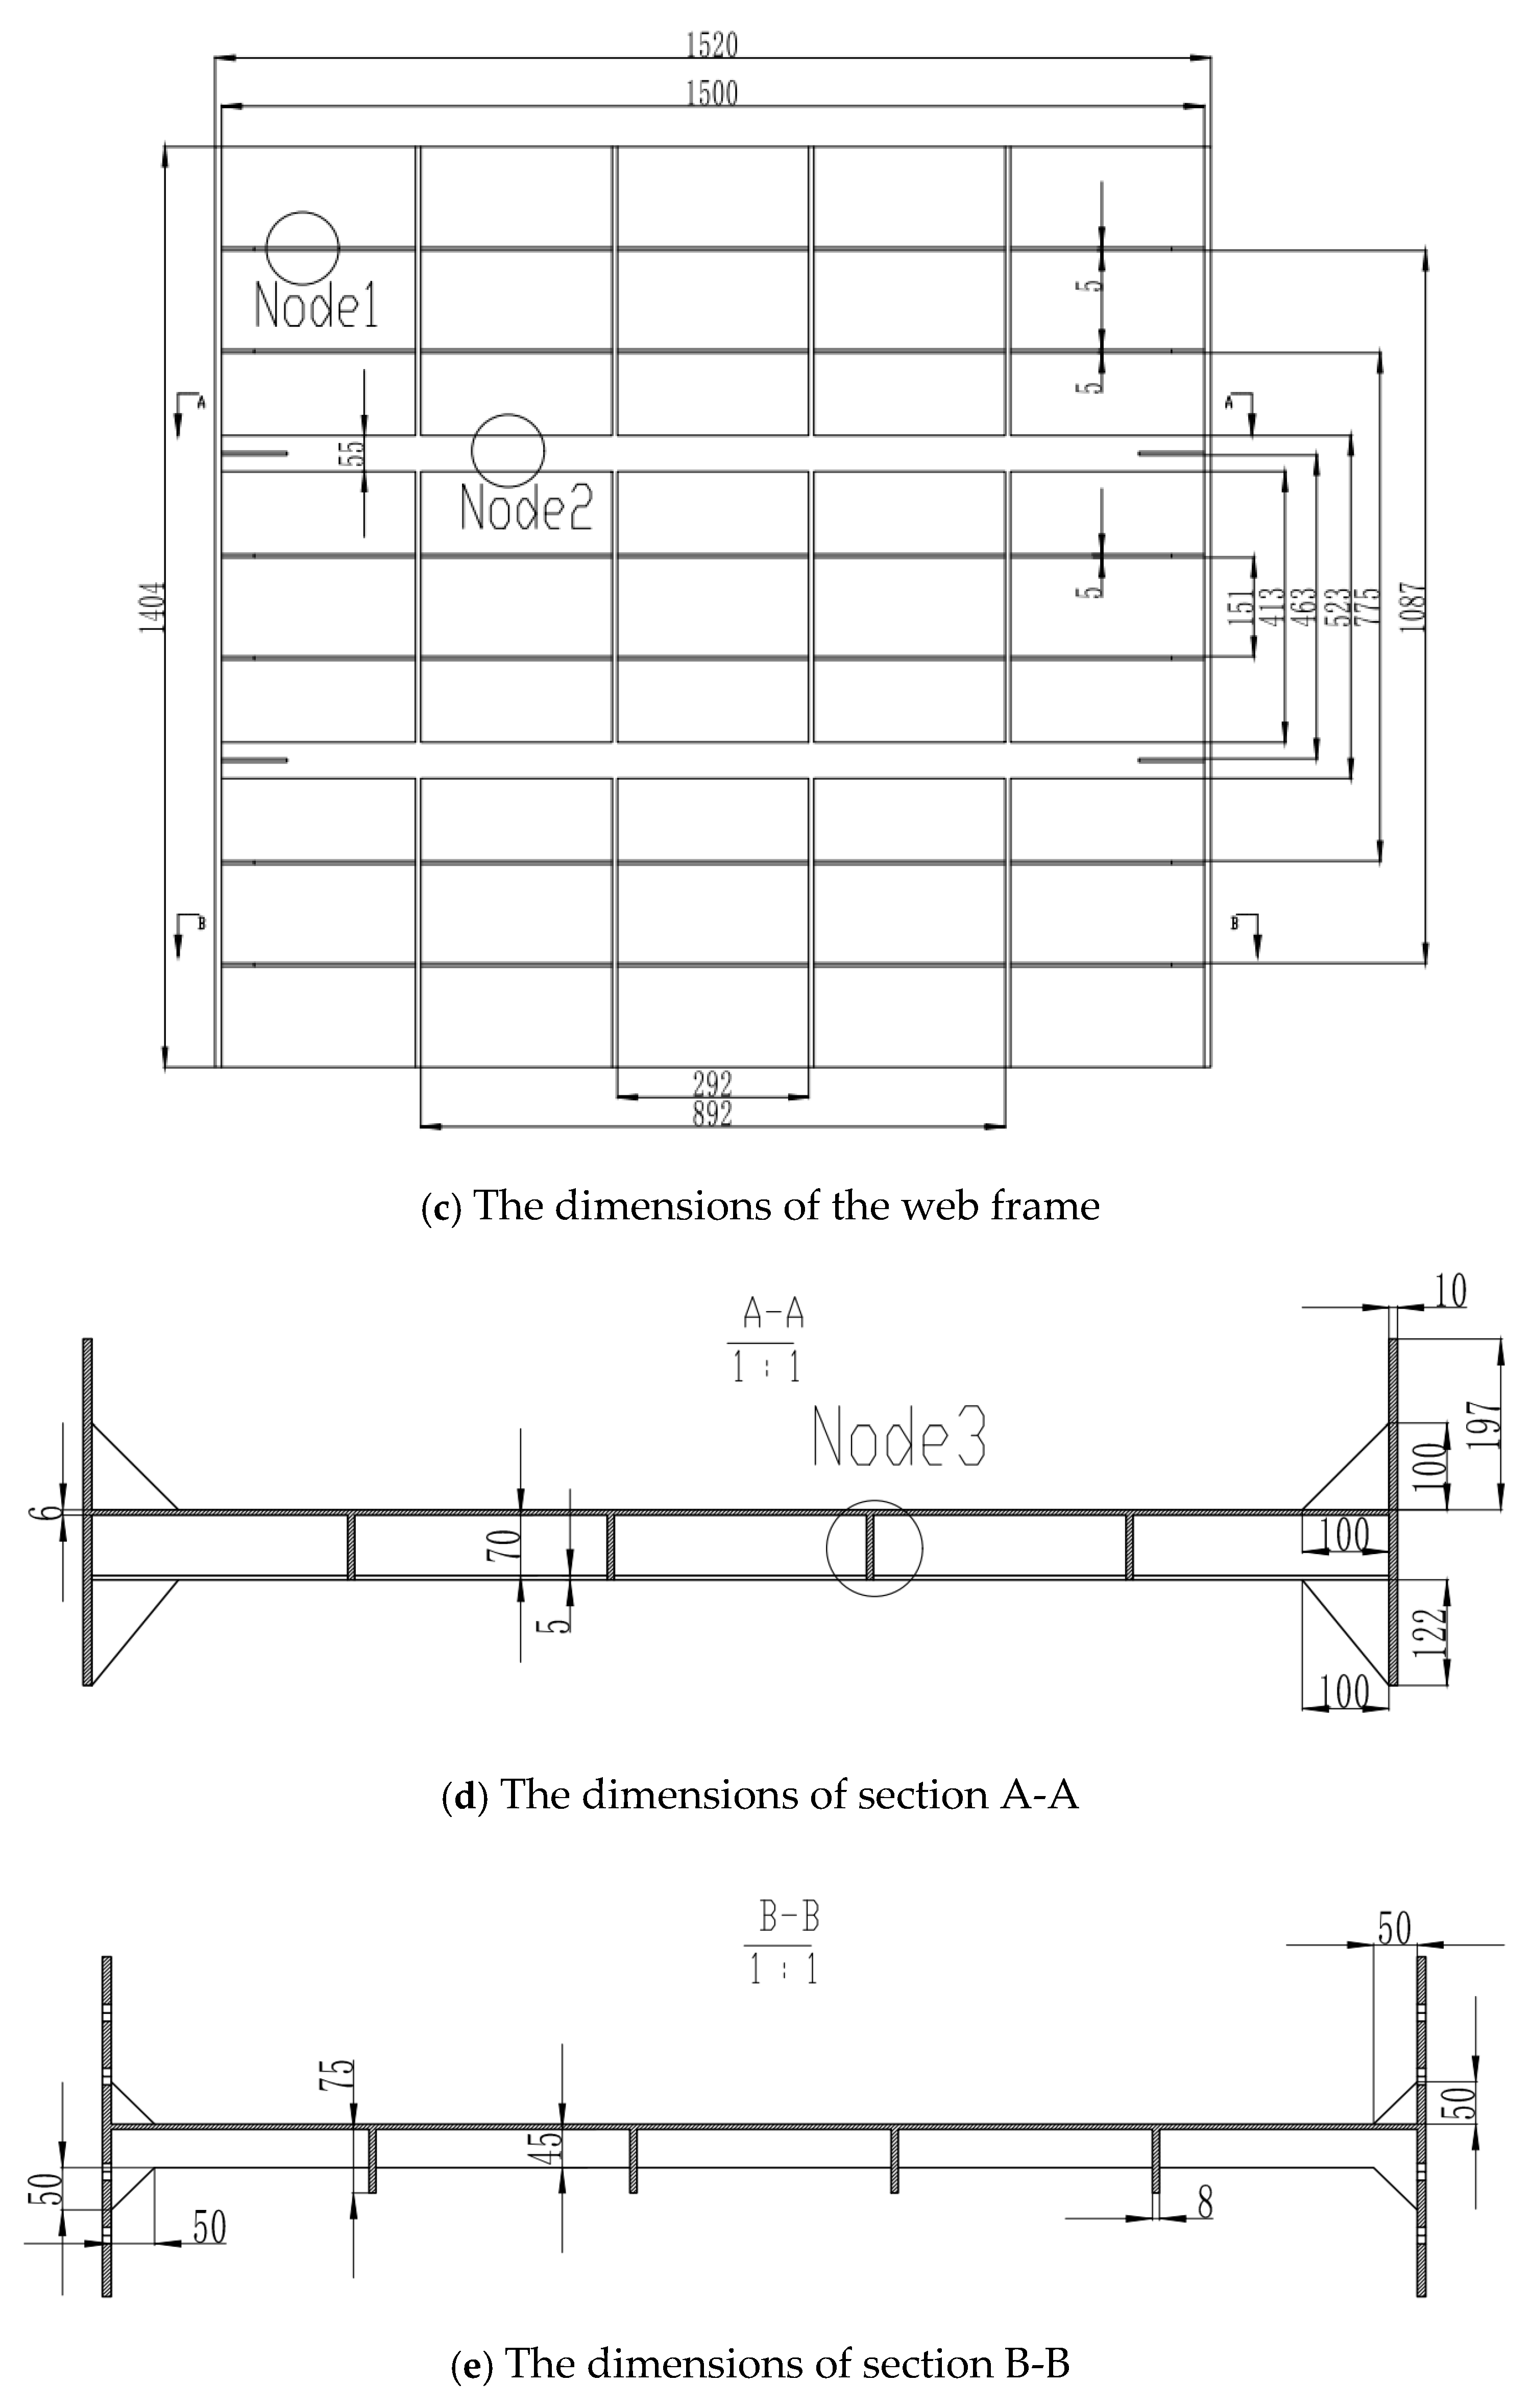
Figure 1.
The dimension diagram of the specimen.
Figure 1.
The dimension diagram of the specimen.
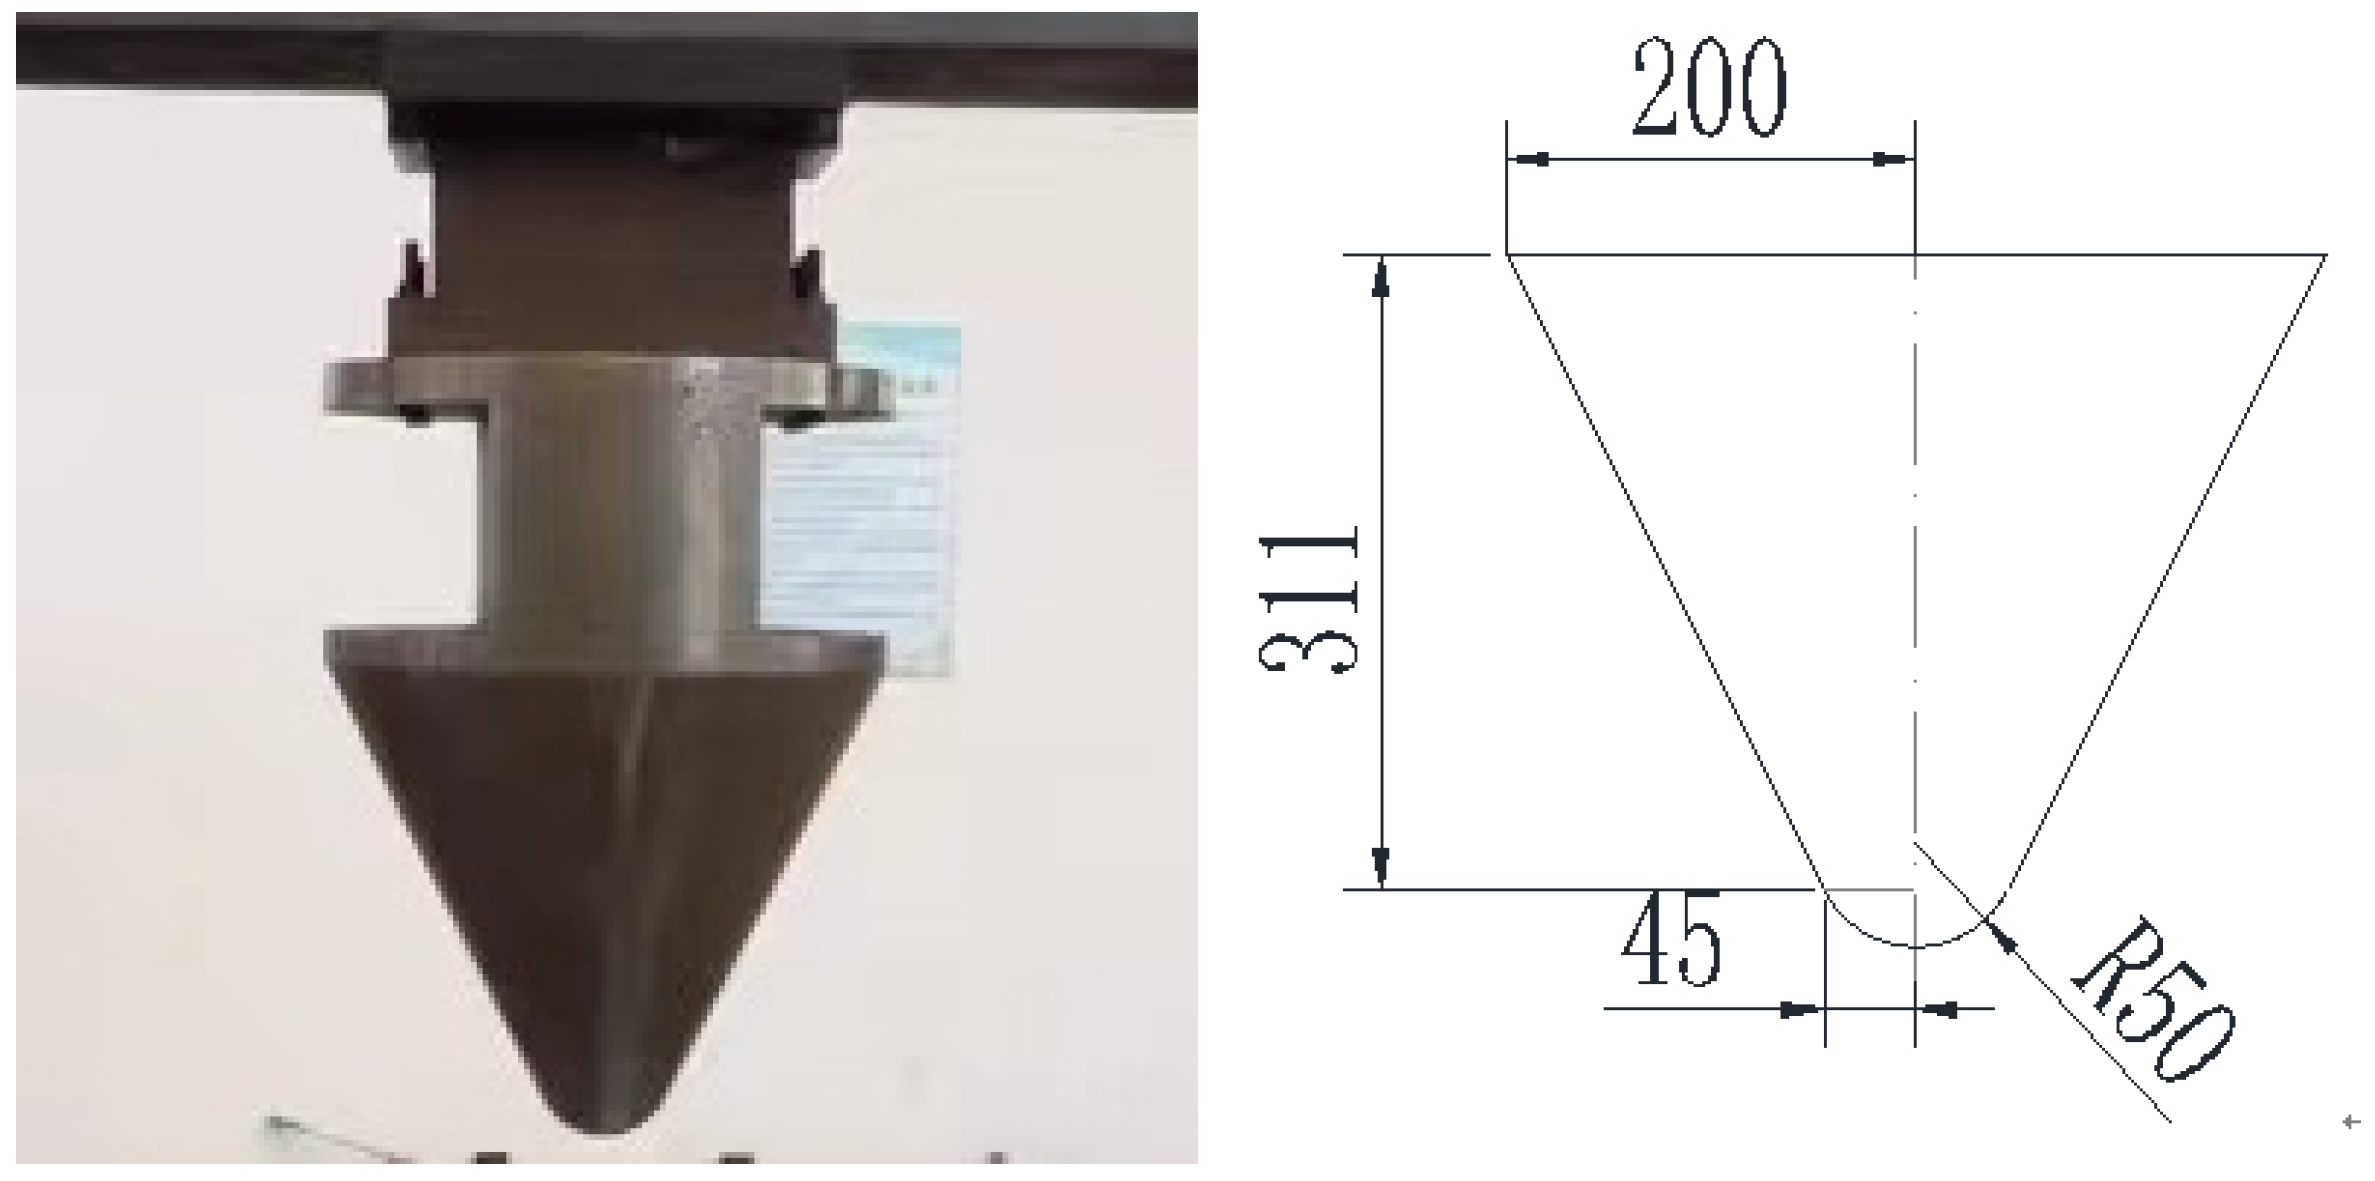
Figure 3.
The object and dimension of the conical hammer head (unit: mm).
Figure 3.
The object and dimension of the conical hammer head (unit: mm).
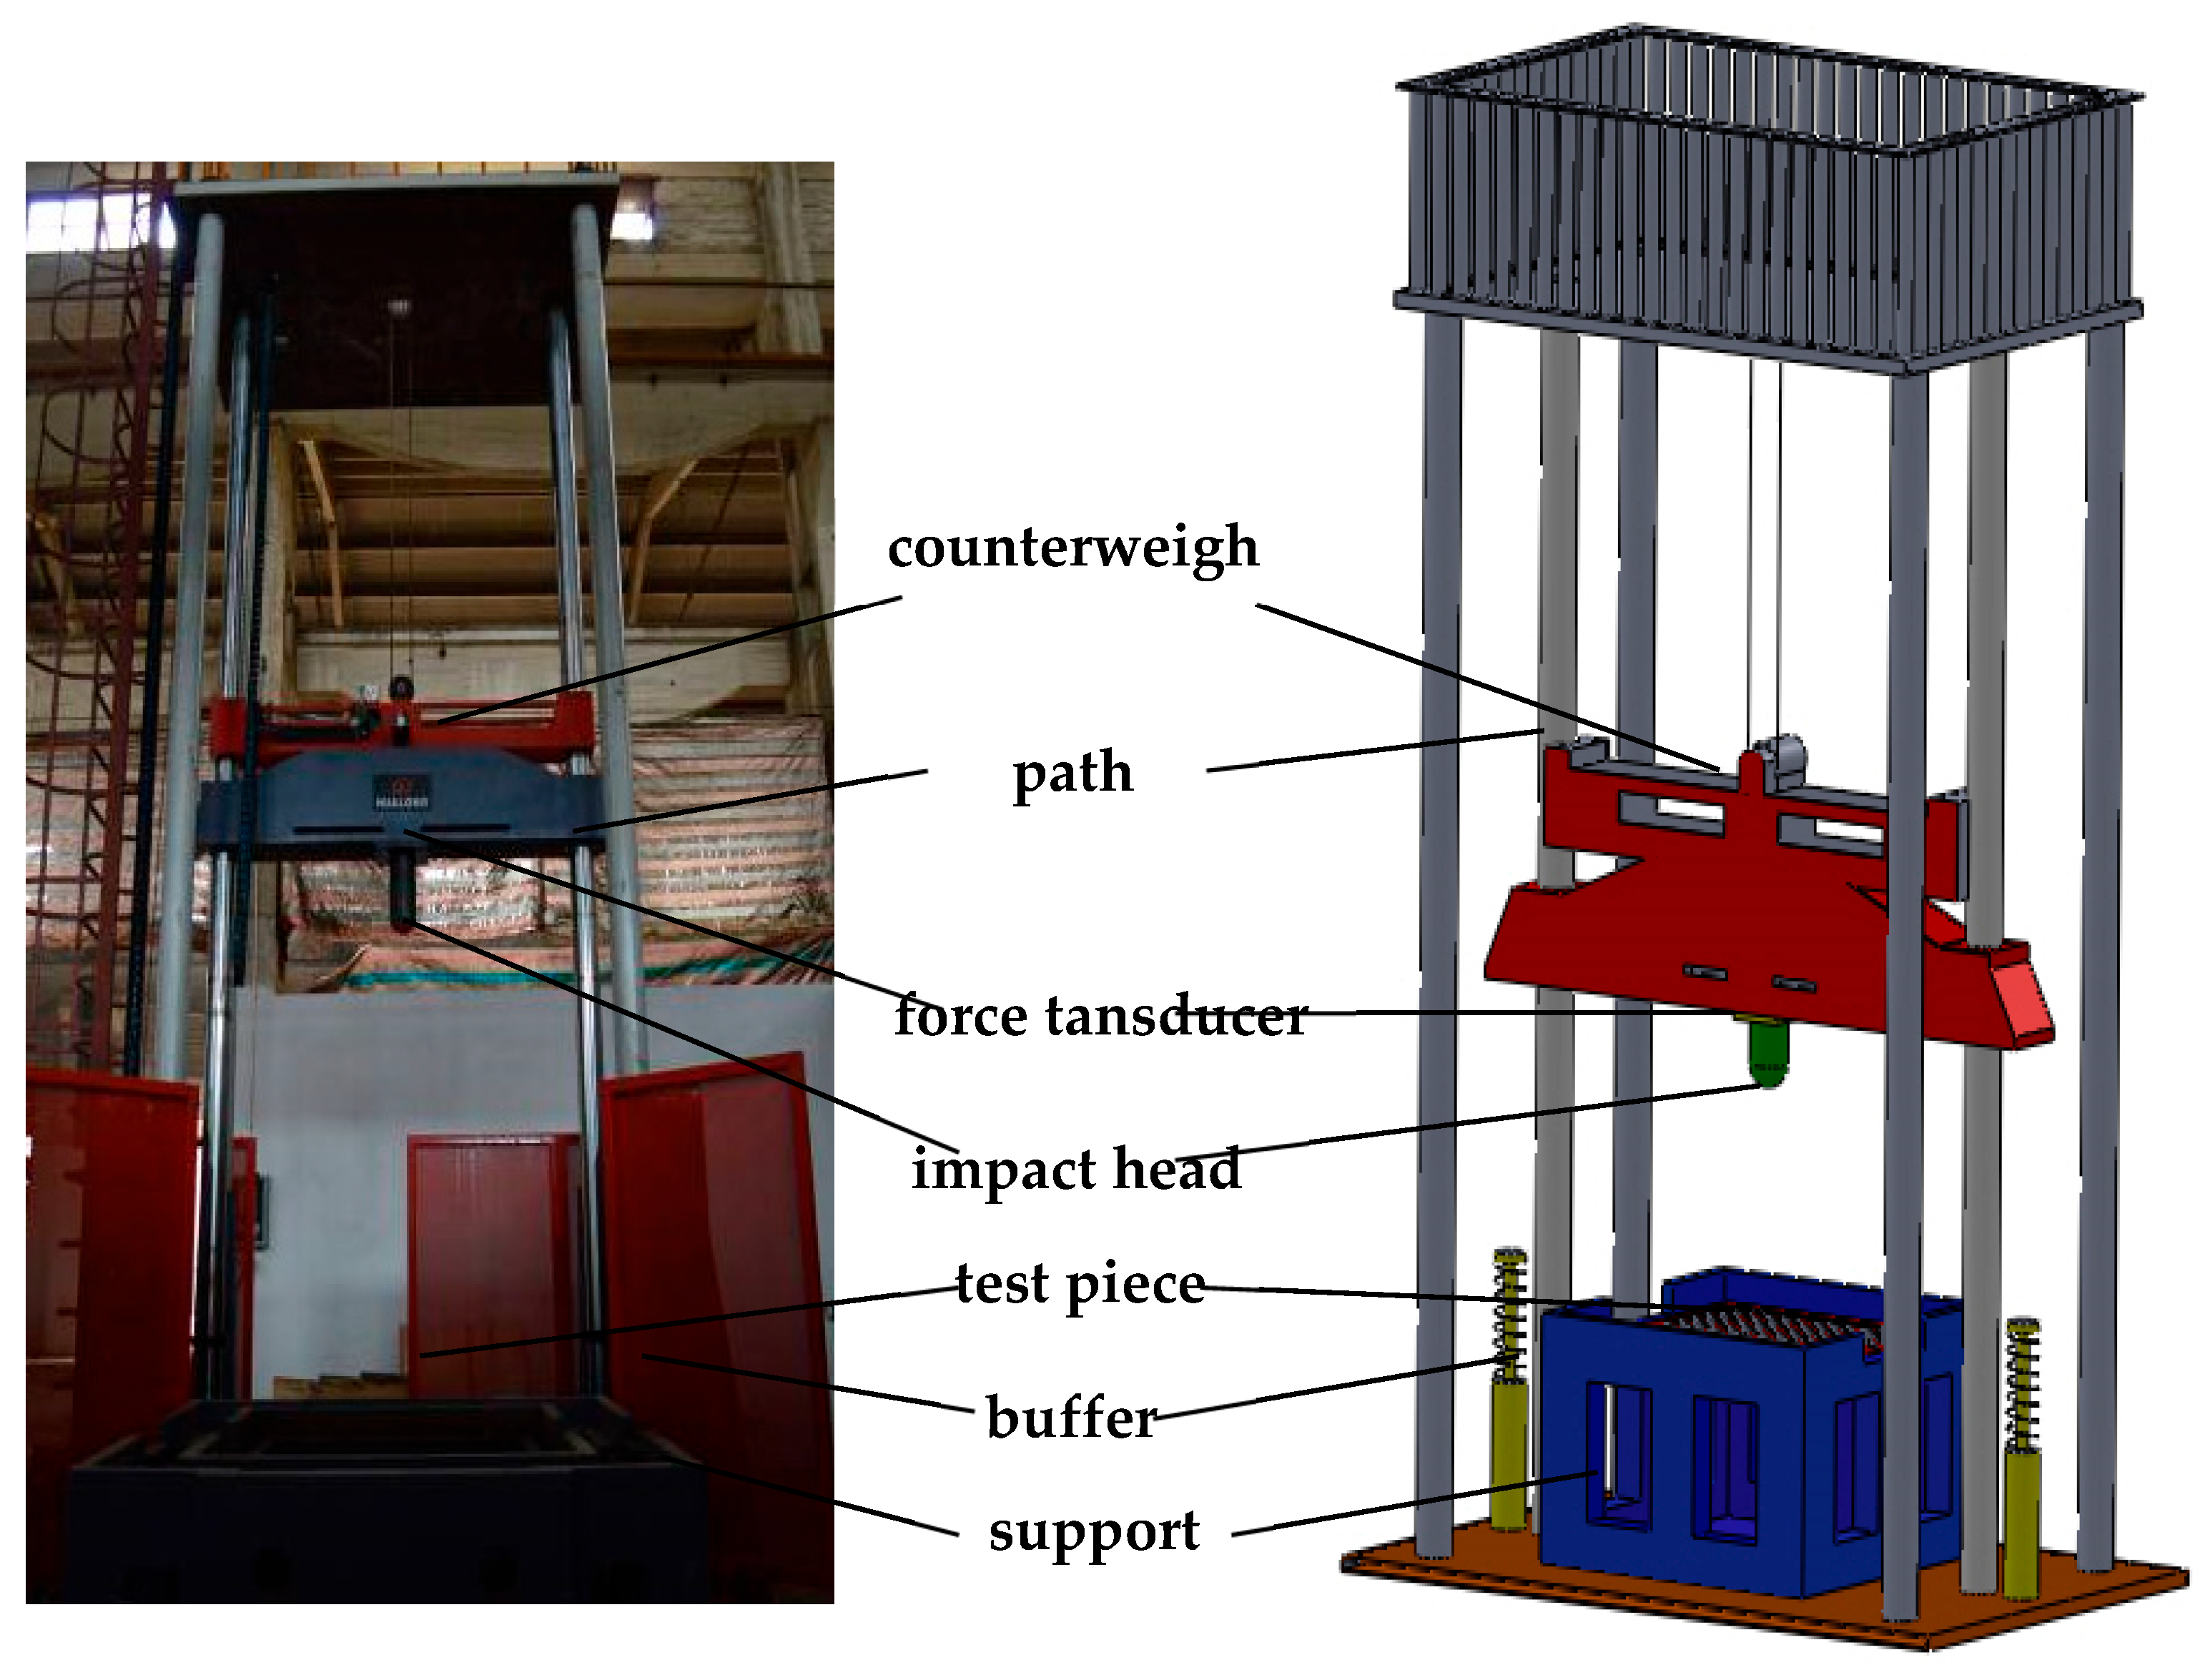
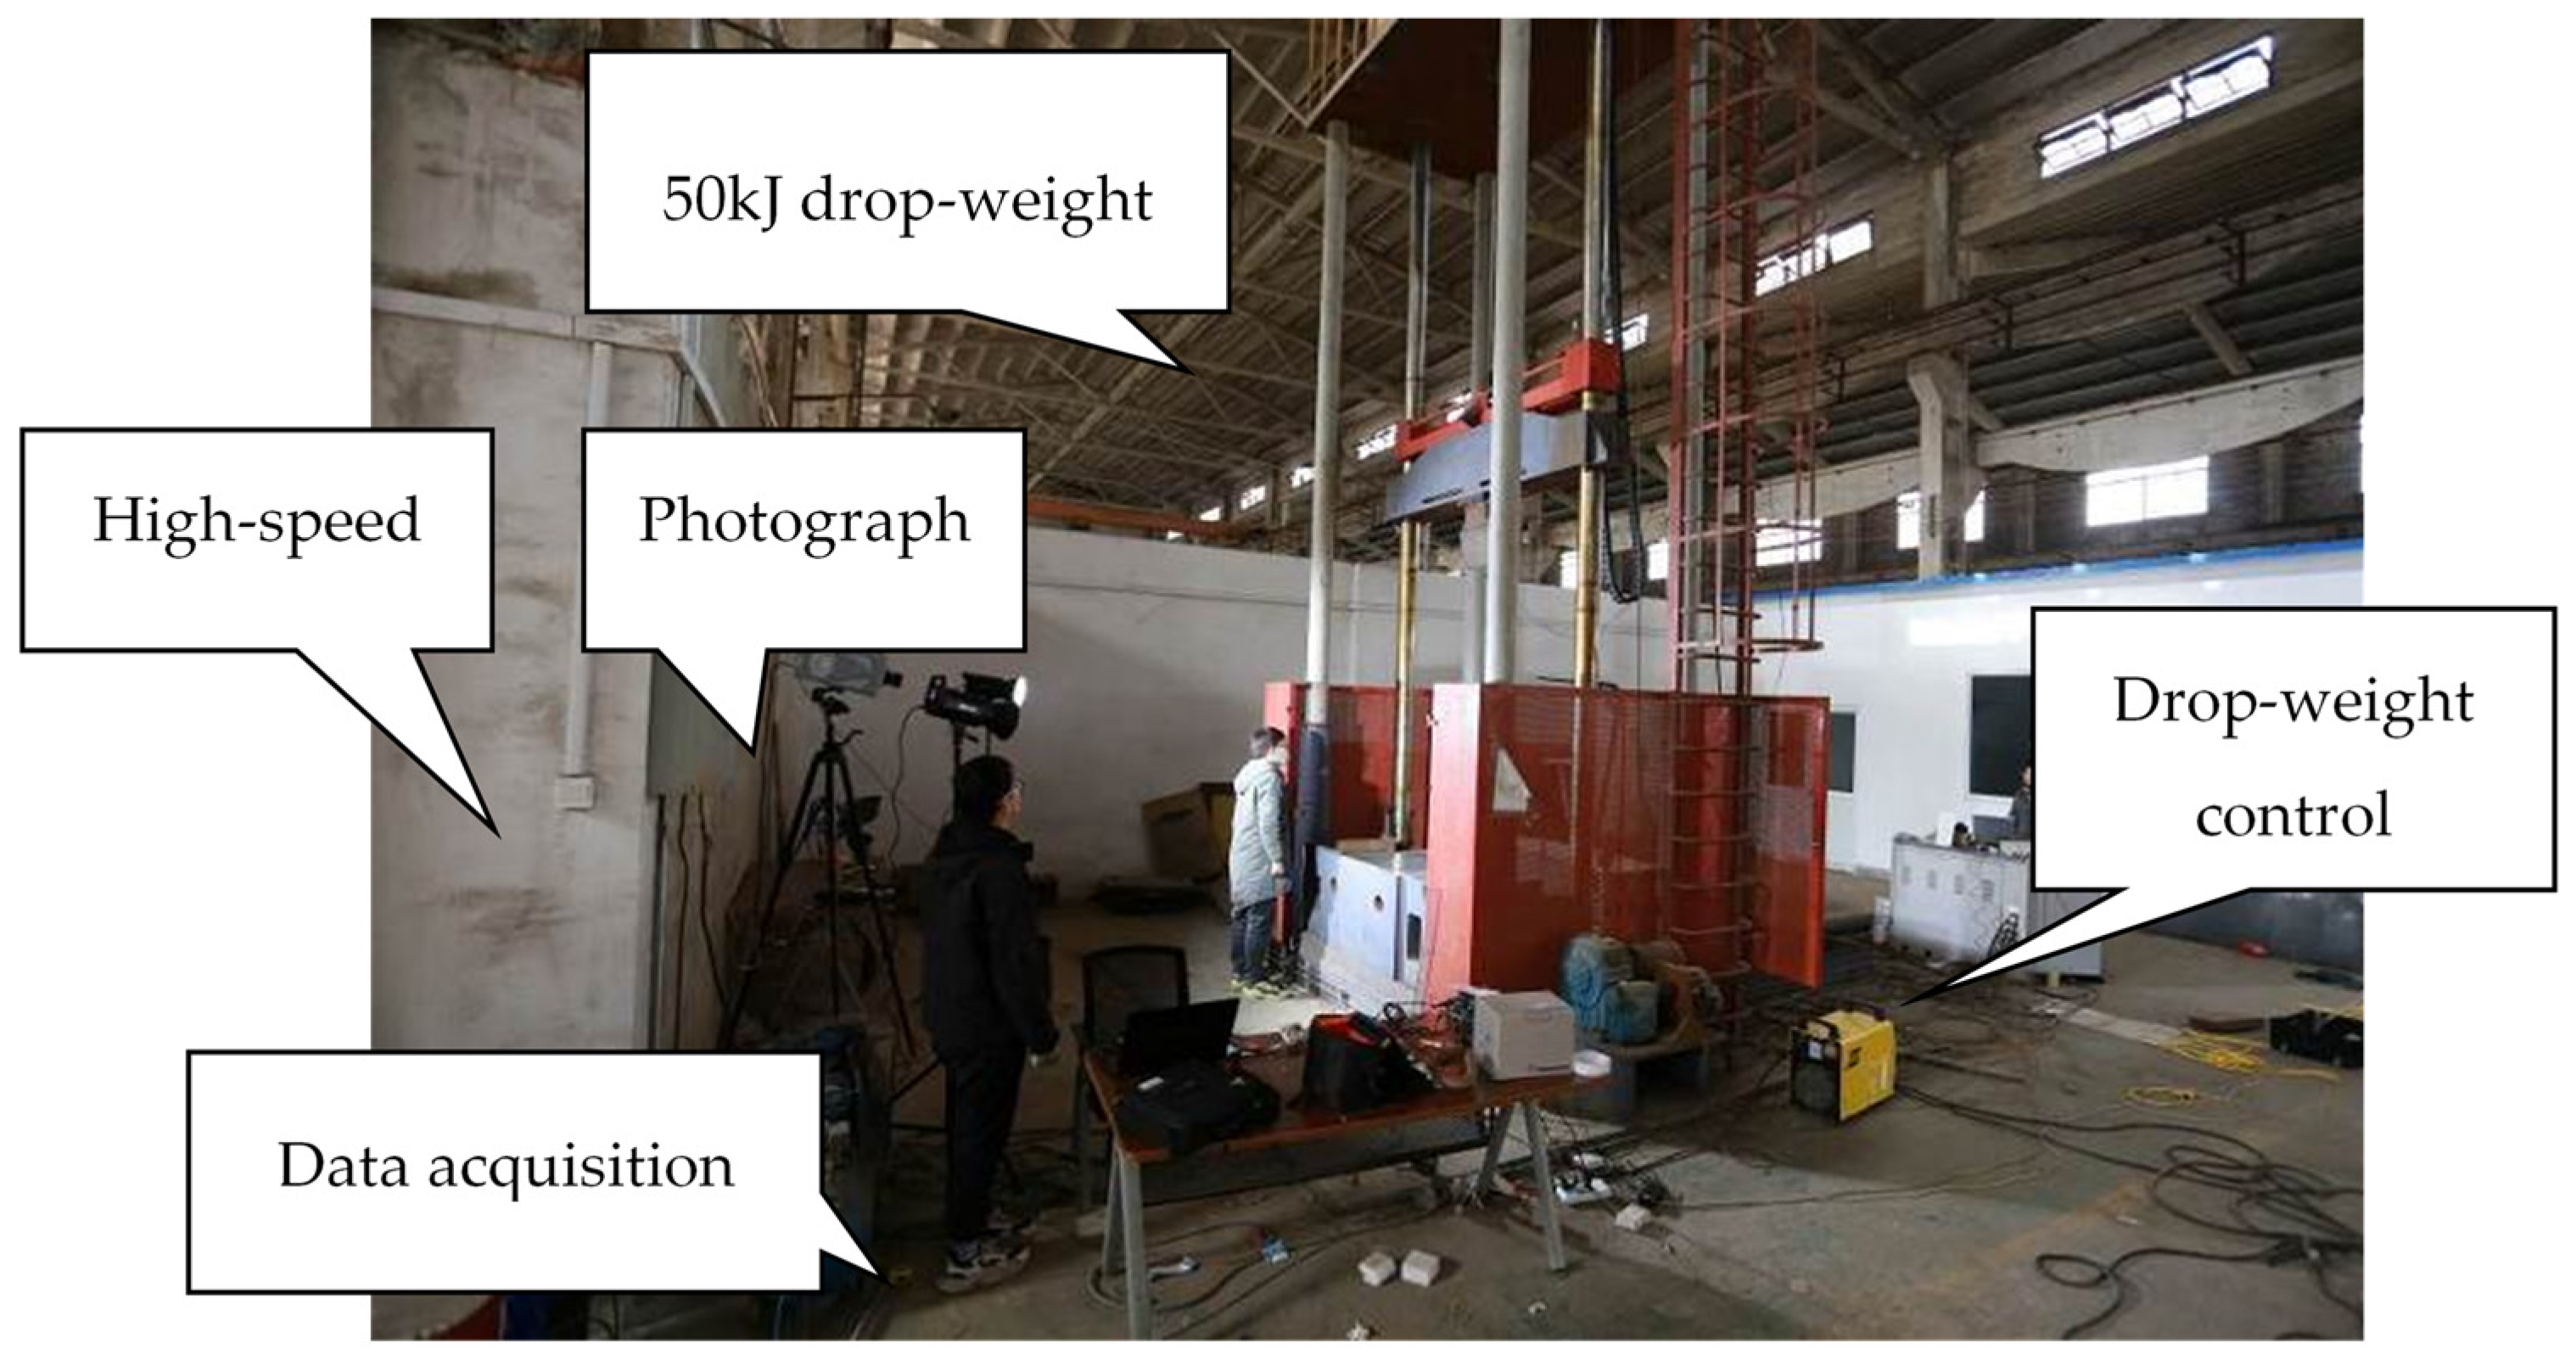
Figure 5.
The composition and schematic diagram of drop-weight impact test system.
Figure 5.
The composition and schematic diagram of drop-weight impact test system.
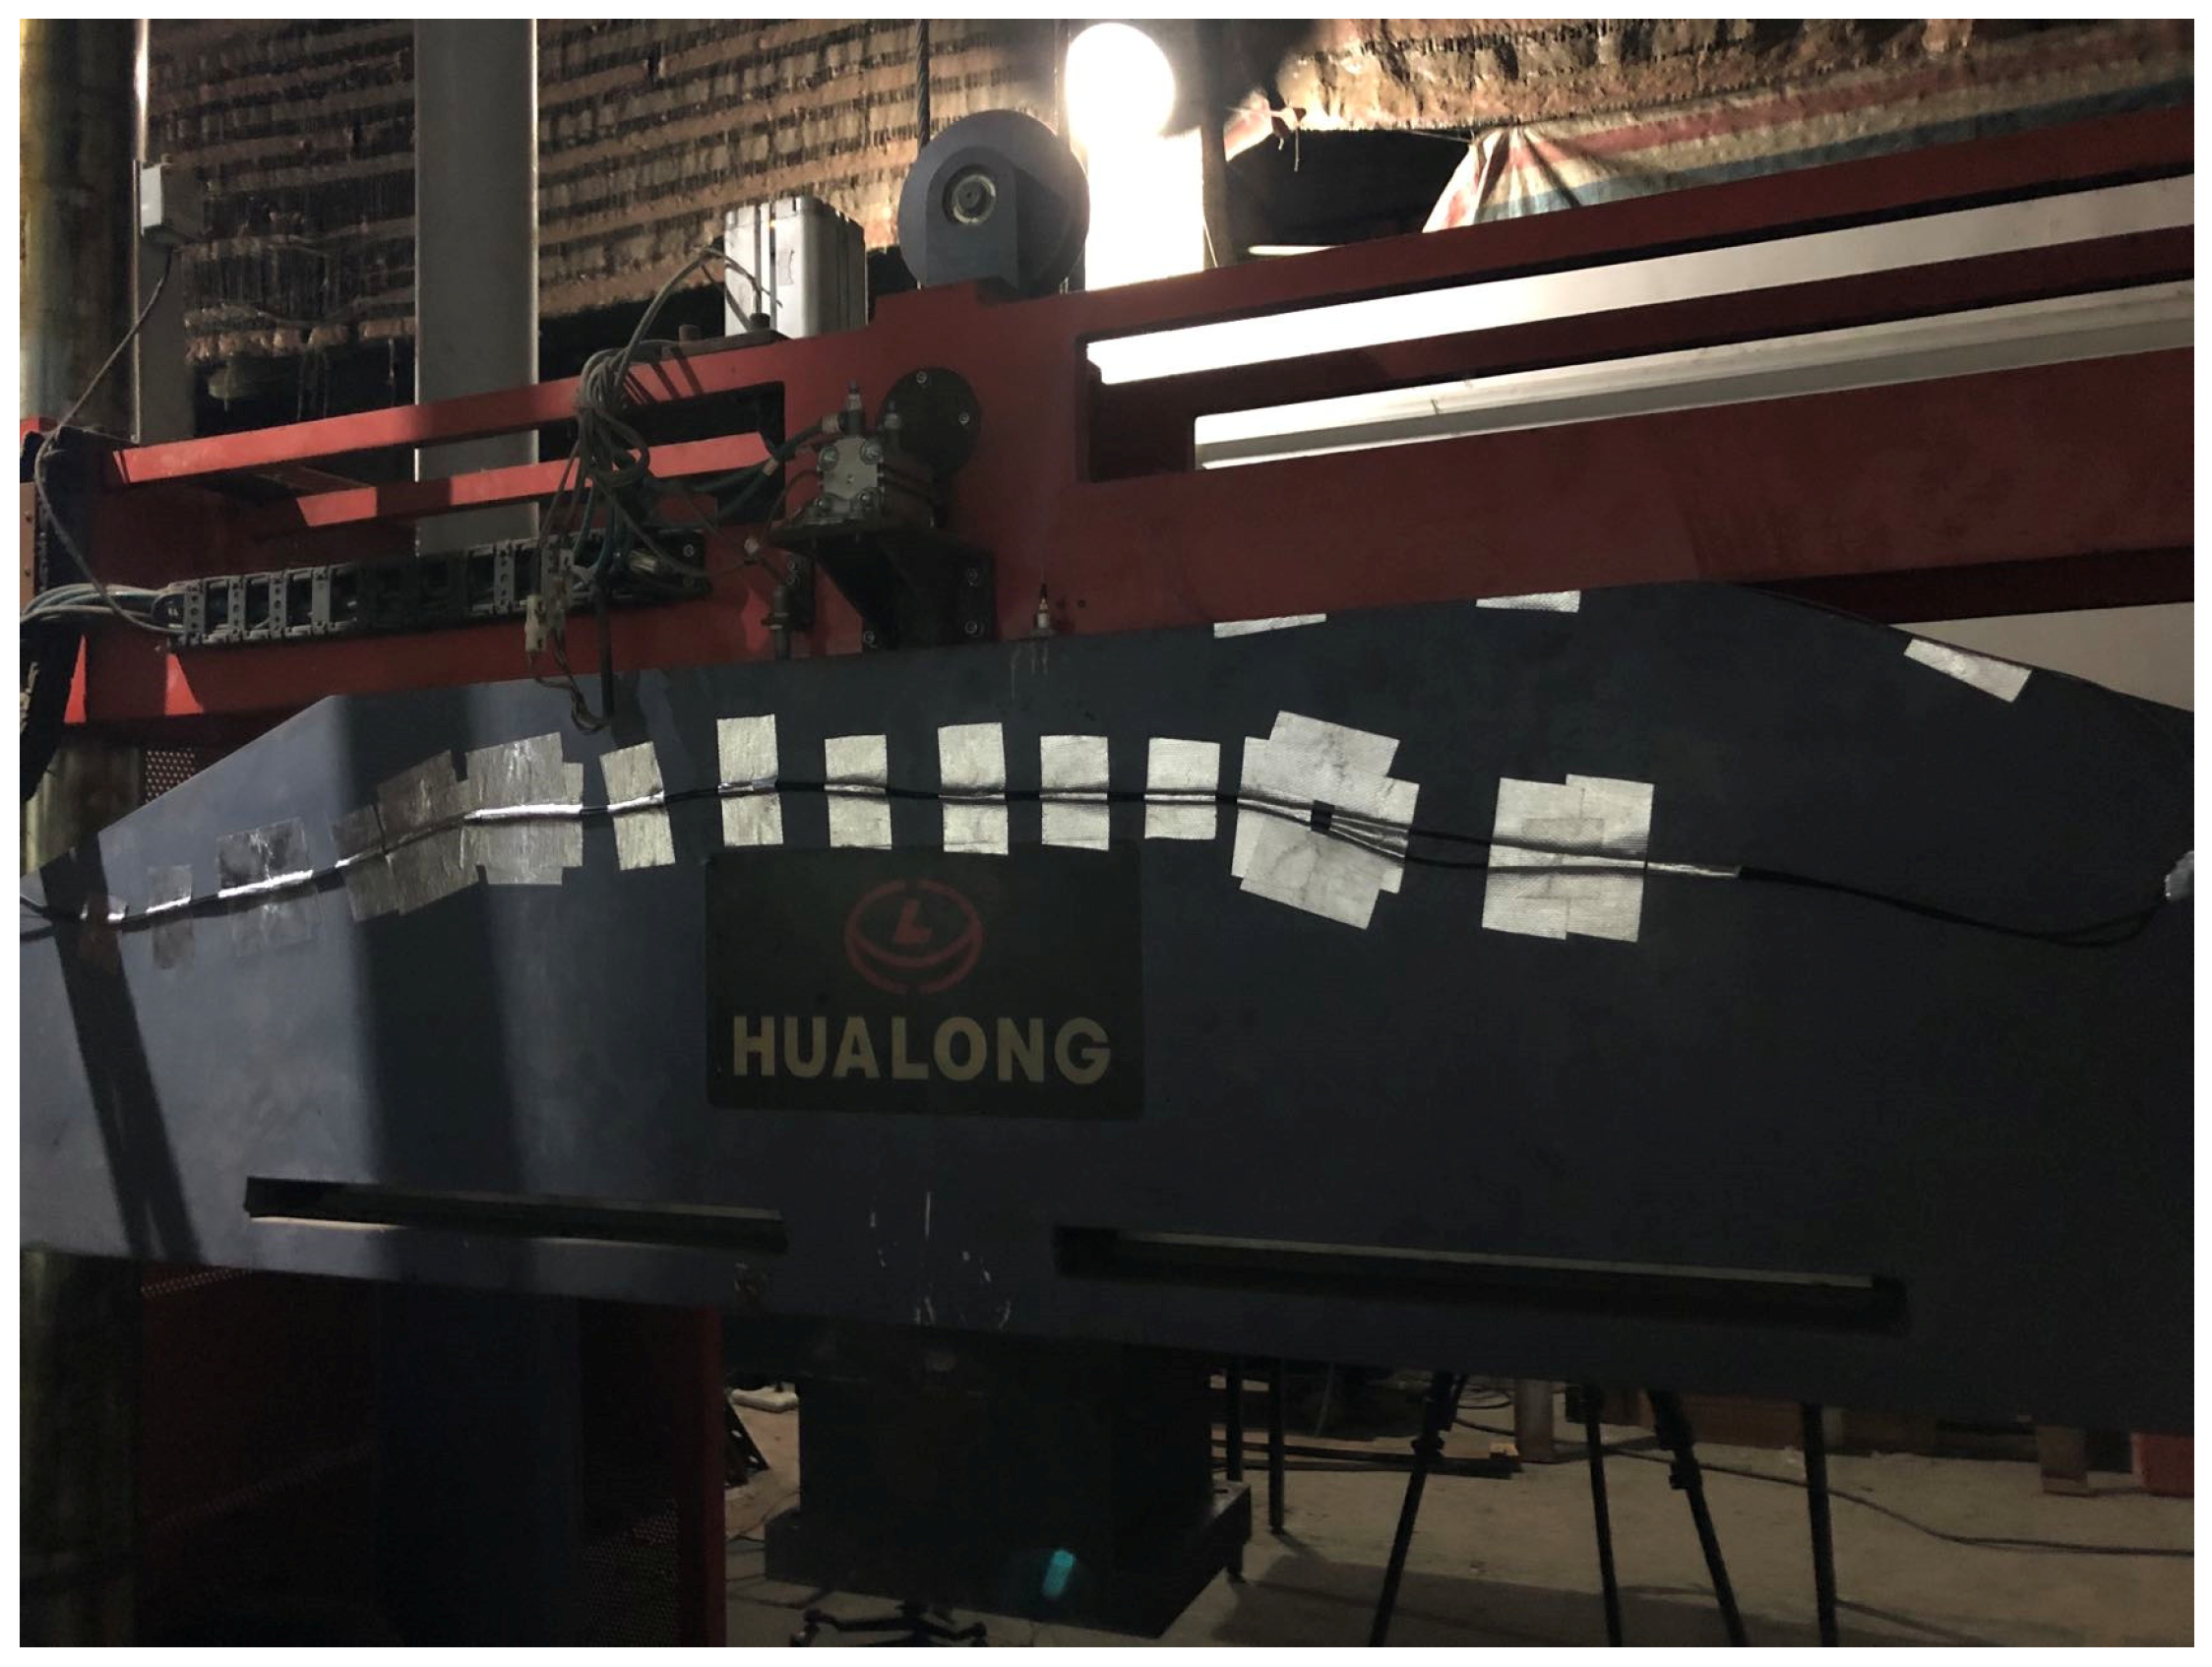
Figure 6.
Schematic diagram of the test support.
Figure 6.
Schematic diagram of the test support.
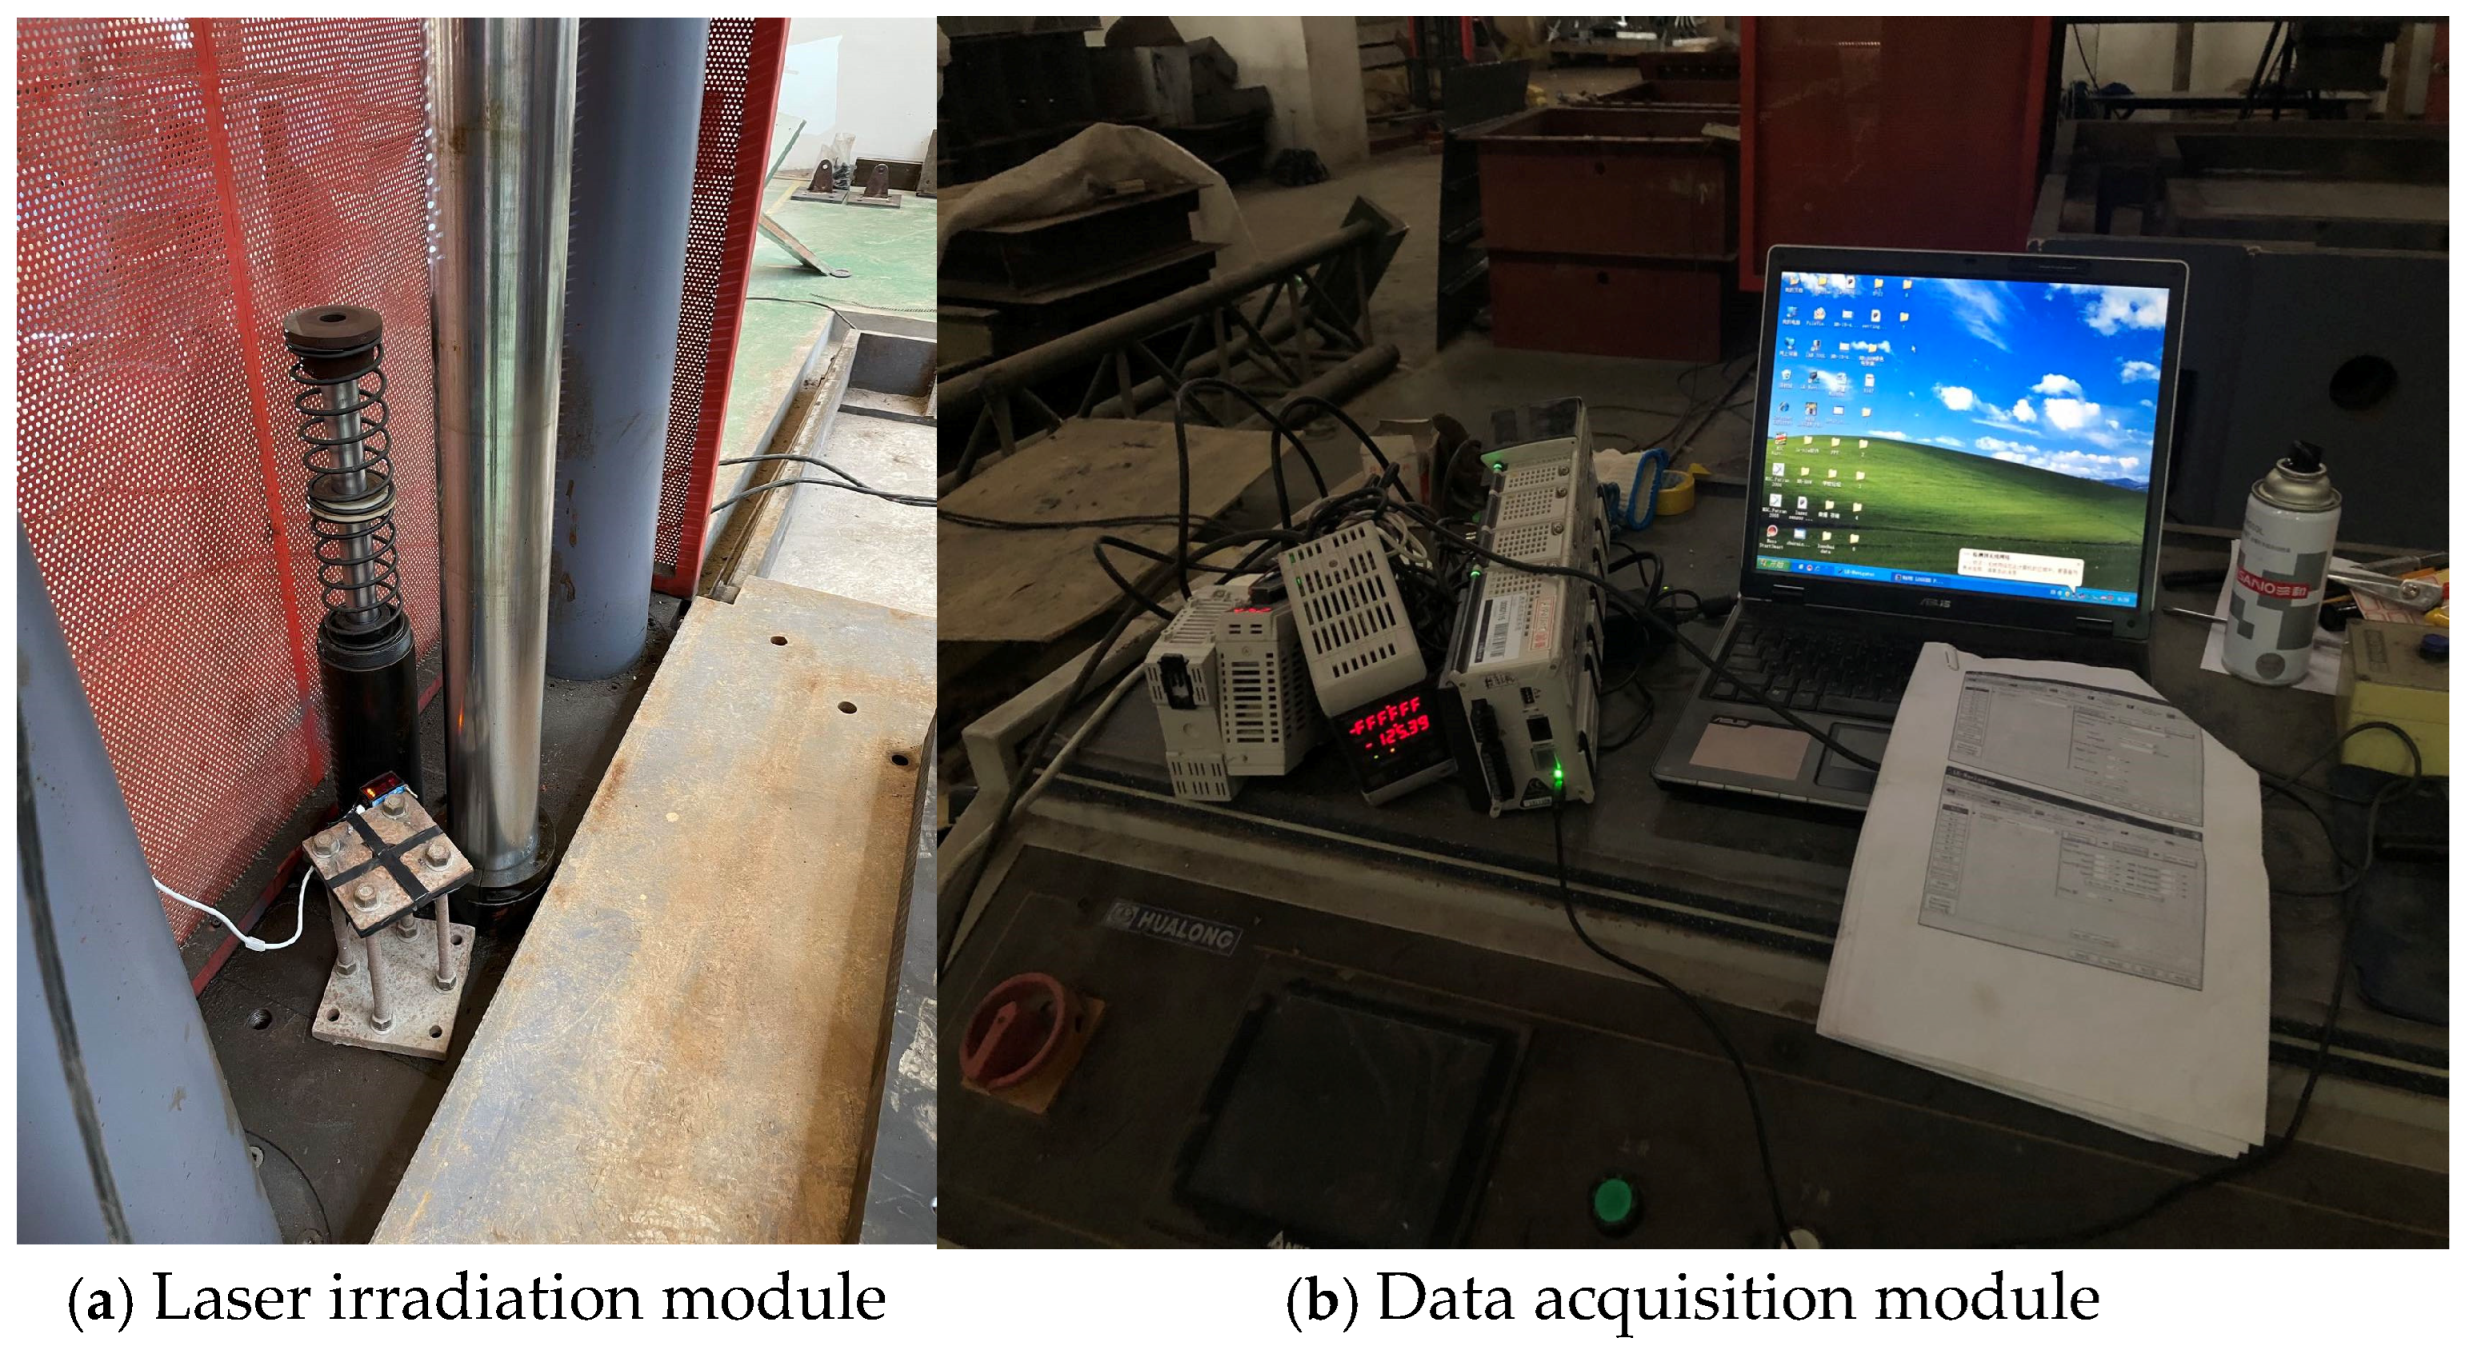
Figure 7.
Laser range finder and acquisition equipment.
Figure 7.
Laser range finder and acquisition equipment.
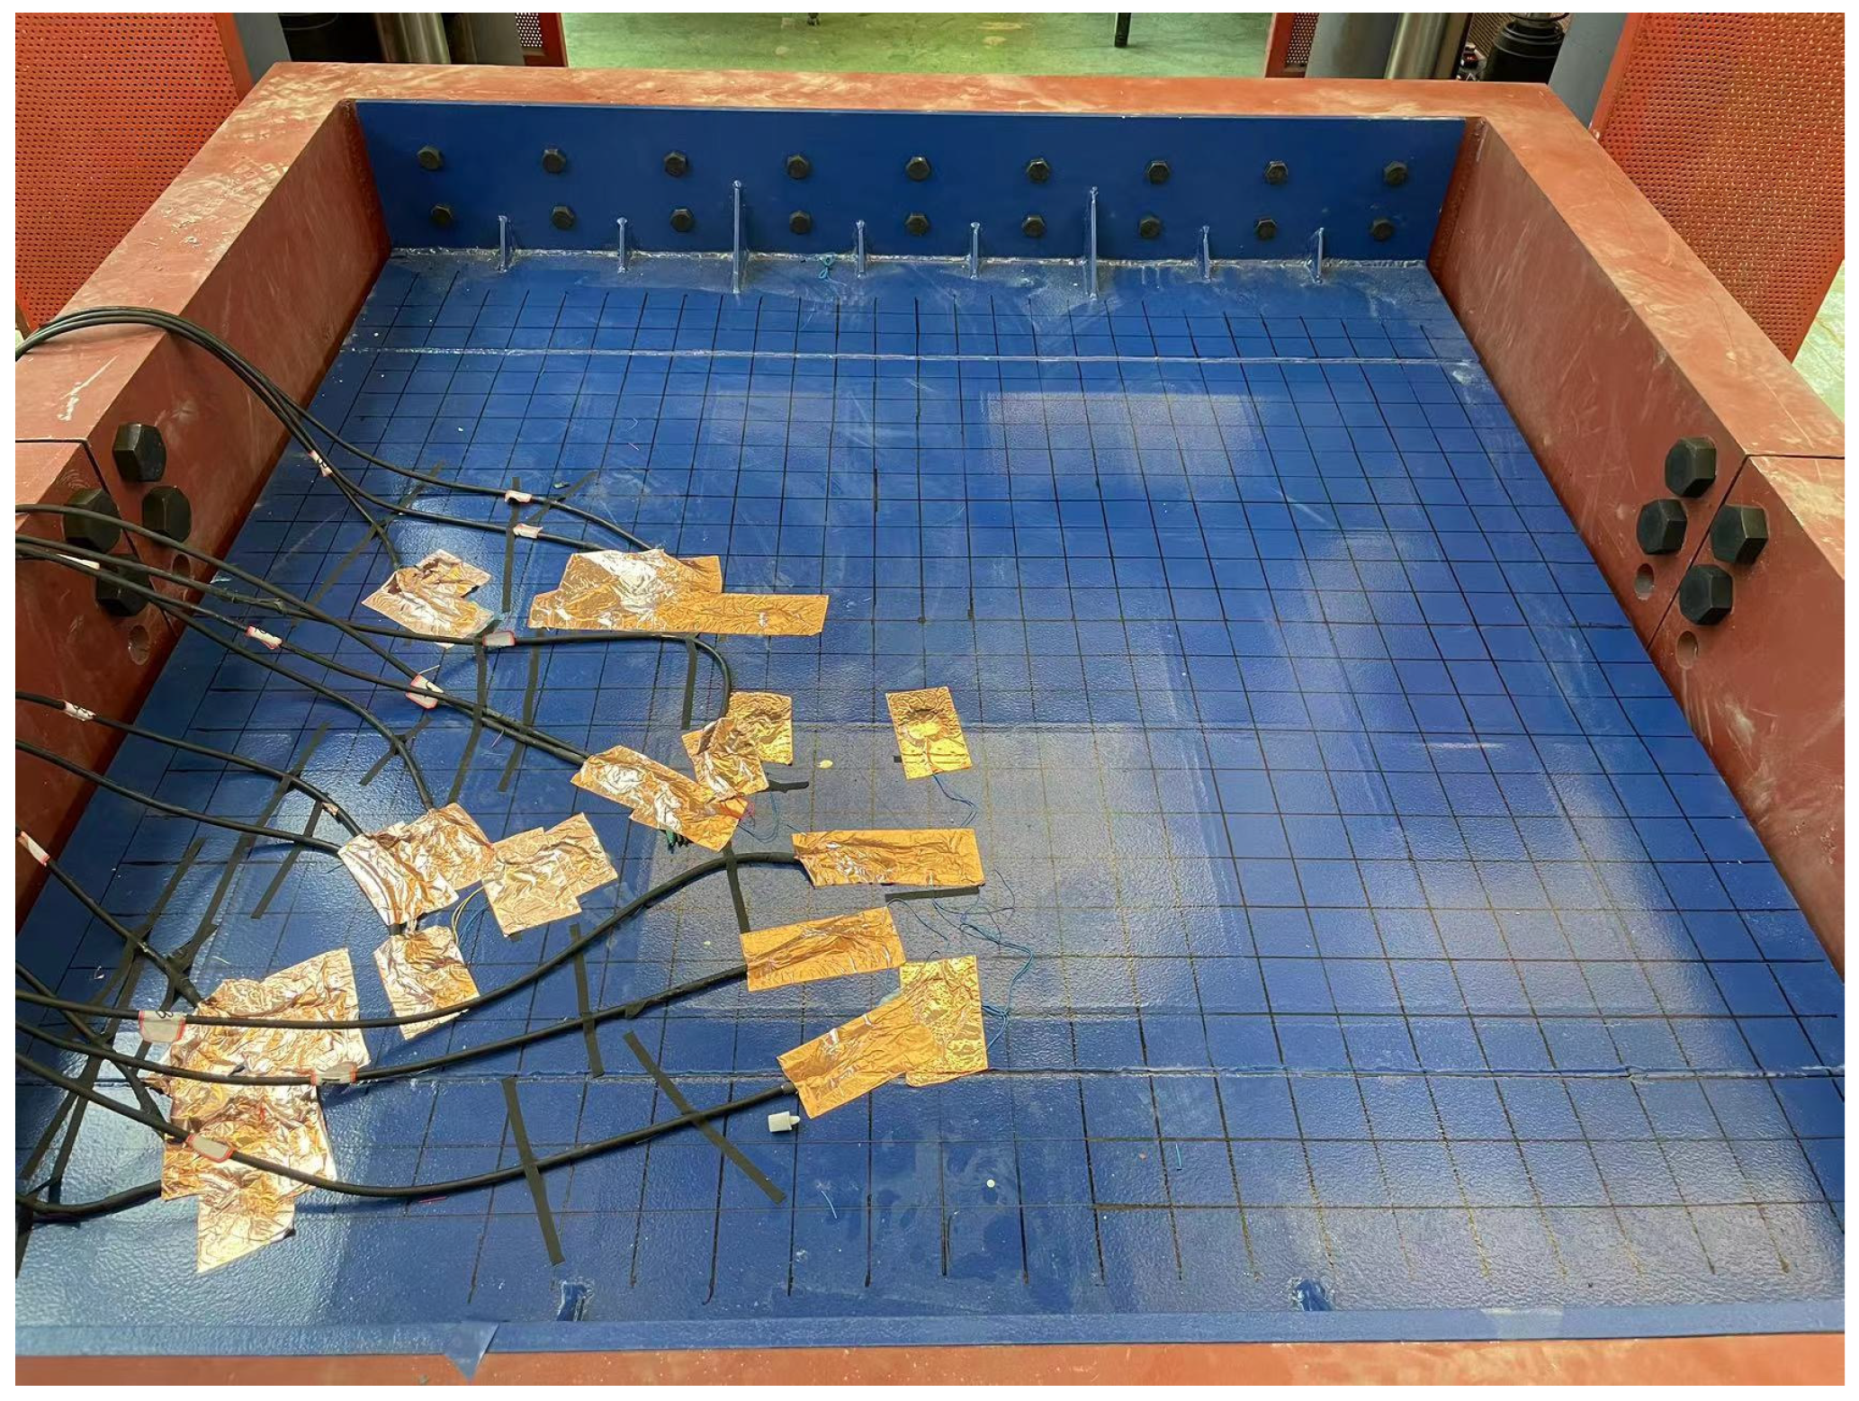
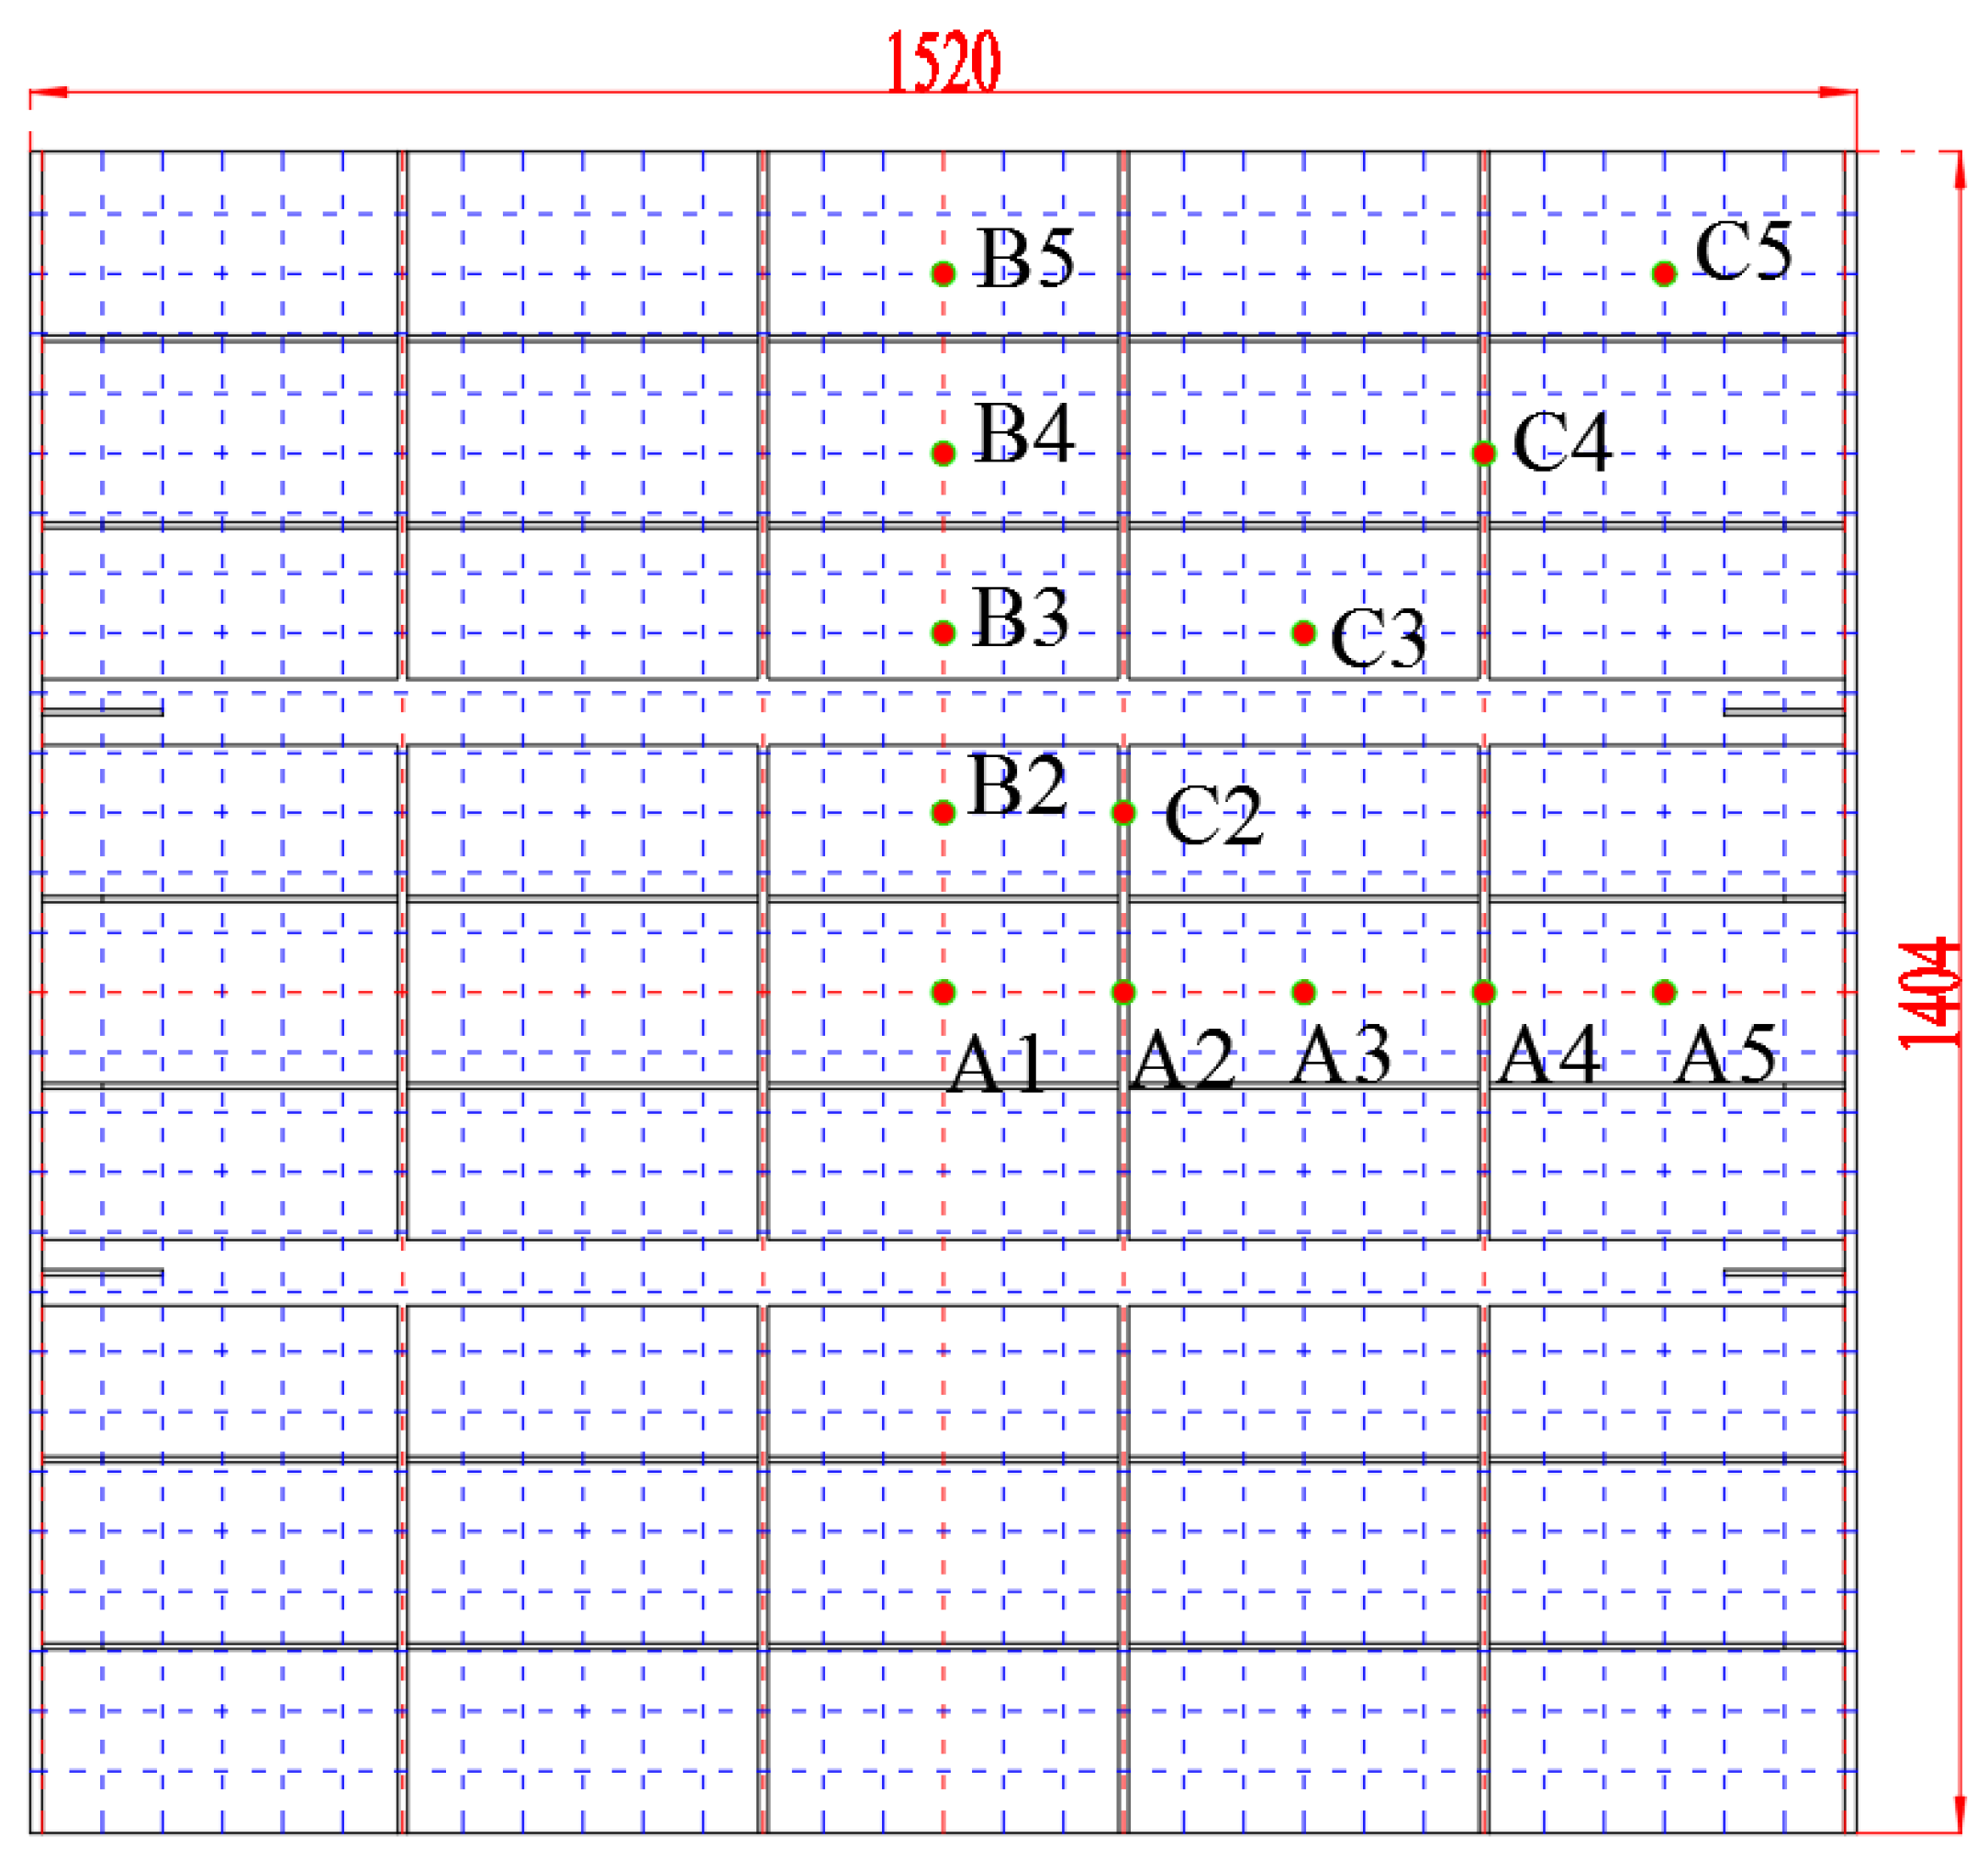
Figure 8.
Falling body collision grid line and strain measuring point arrangement.
Figure 8.
Falling body collision grid line and strain measuring point arrangement.
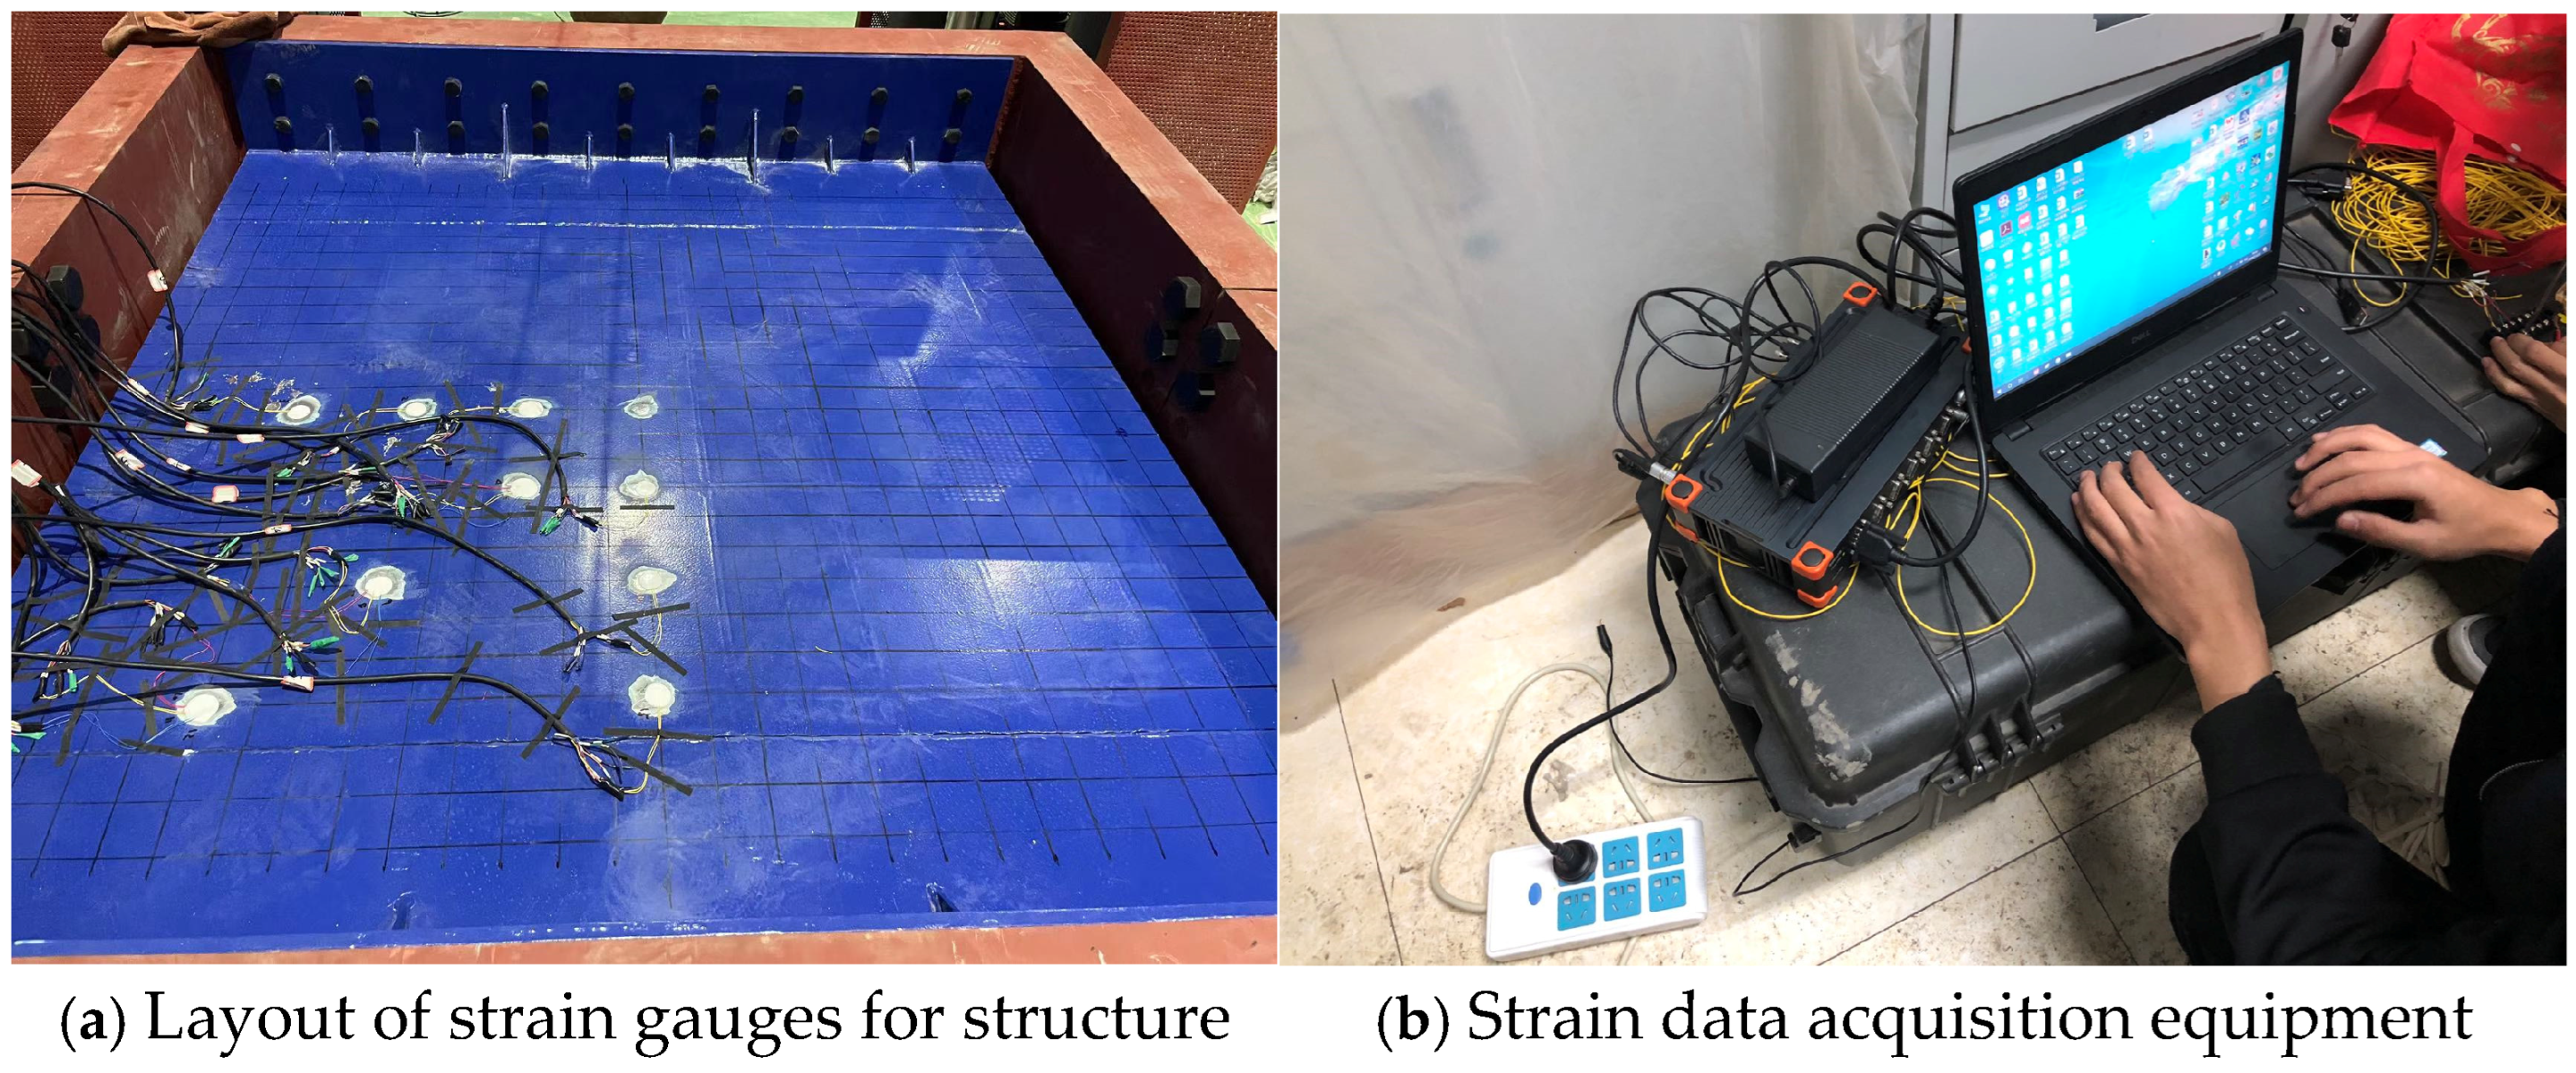
Figure 9.
Strain gauge cloth and data acquisition.
Figure 9.
Strain gauge cloth and data acquisition.
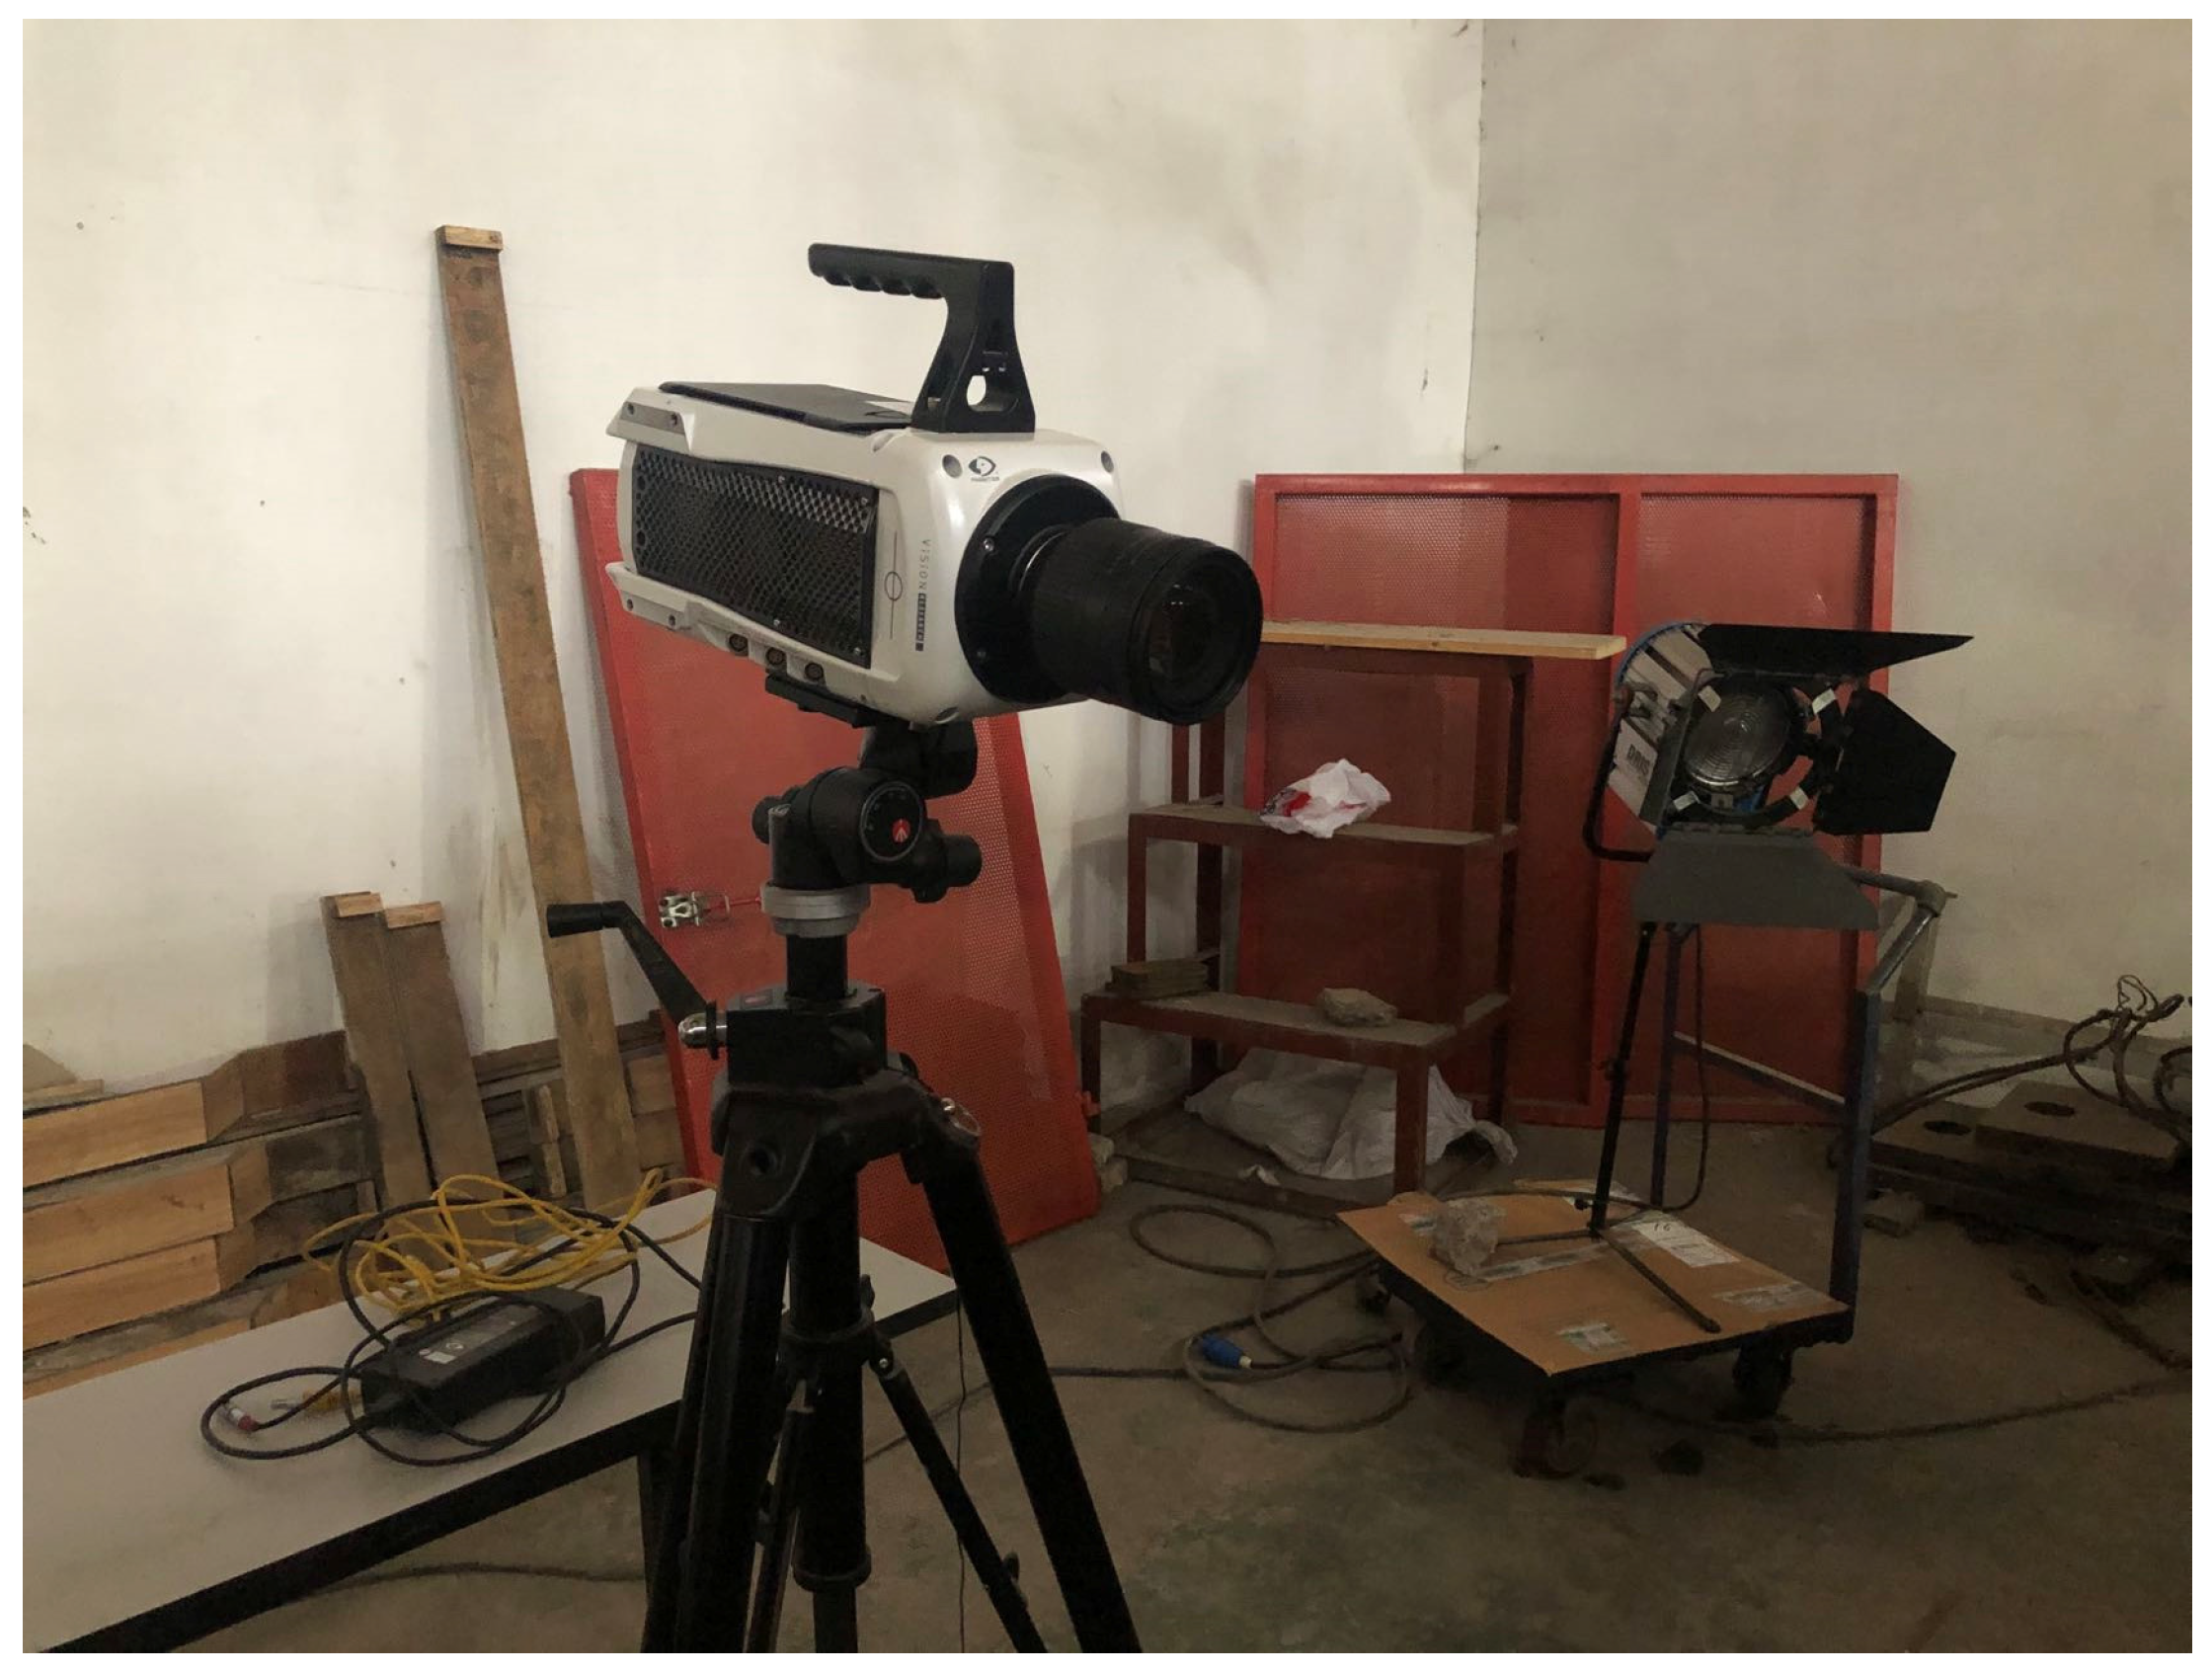
Figure 10.
High speed camera.
Figure 10.
High speed camera.
Figure 11.
Acceleration sensor.
Figure 11.
Acceleration sensor.
Figure 12.
The installation and debugging of test equipment.
Figure 12.
The installation and debugging of test equipment.
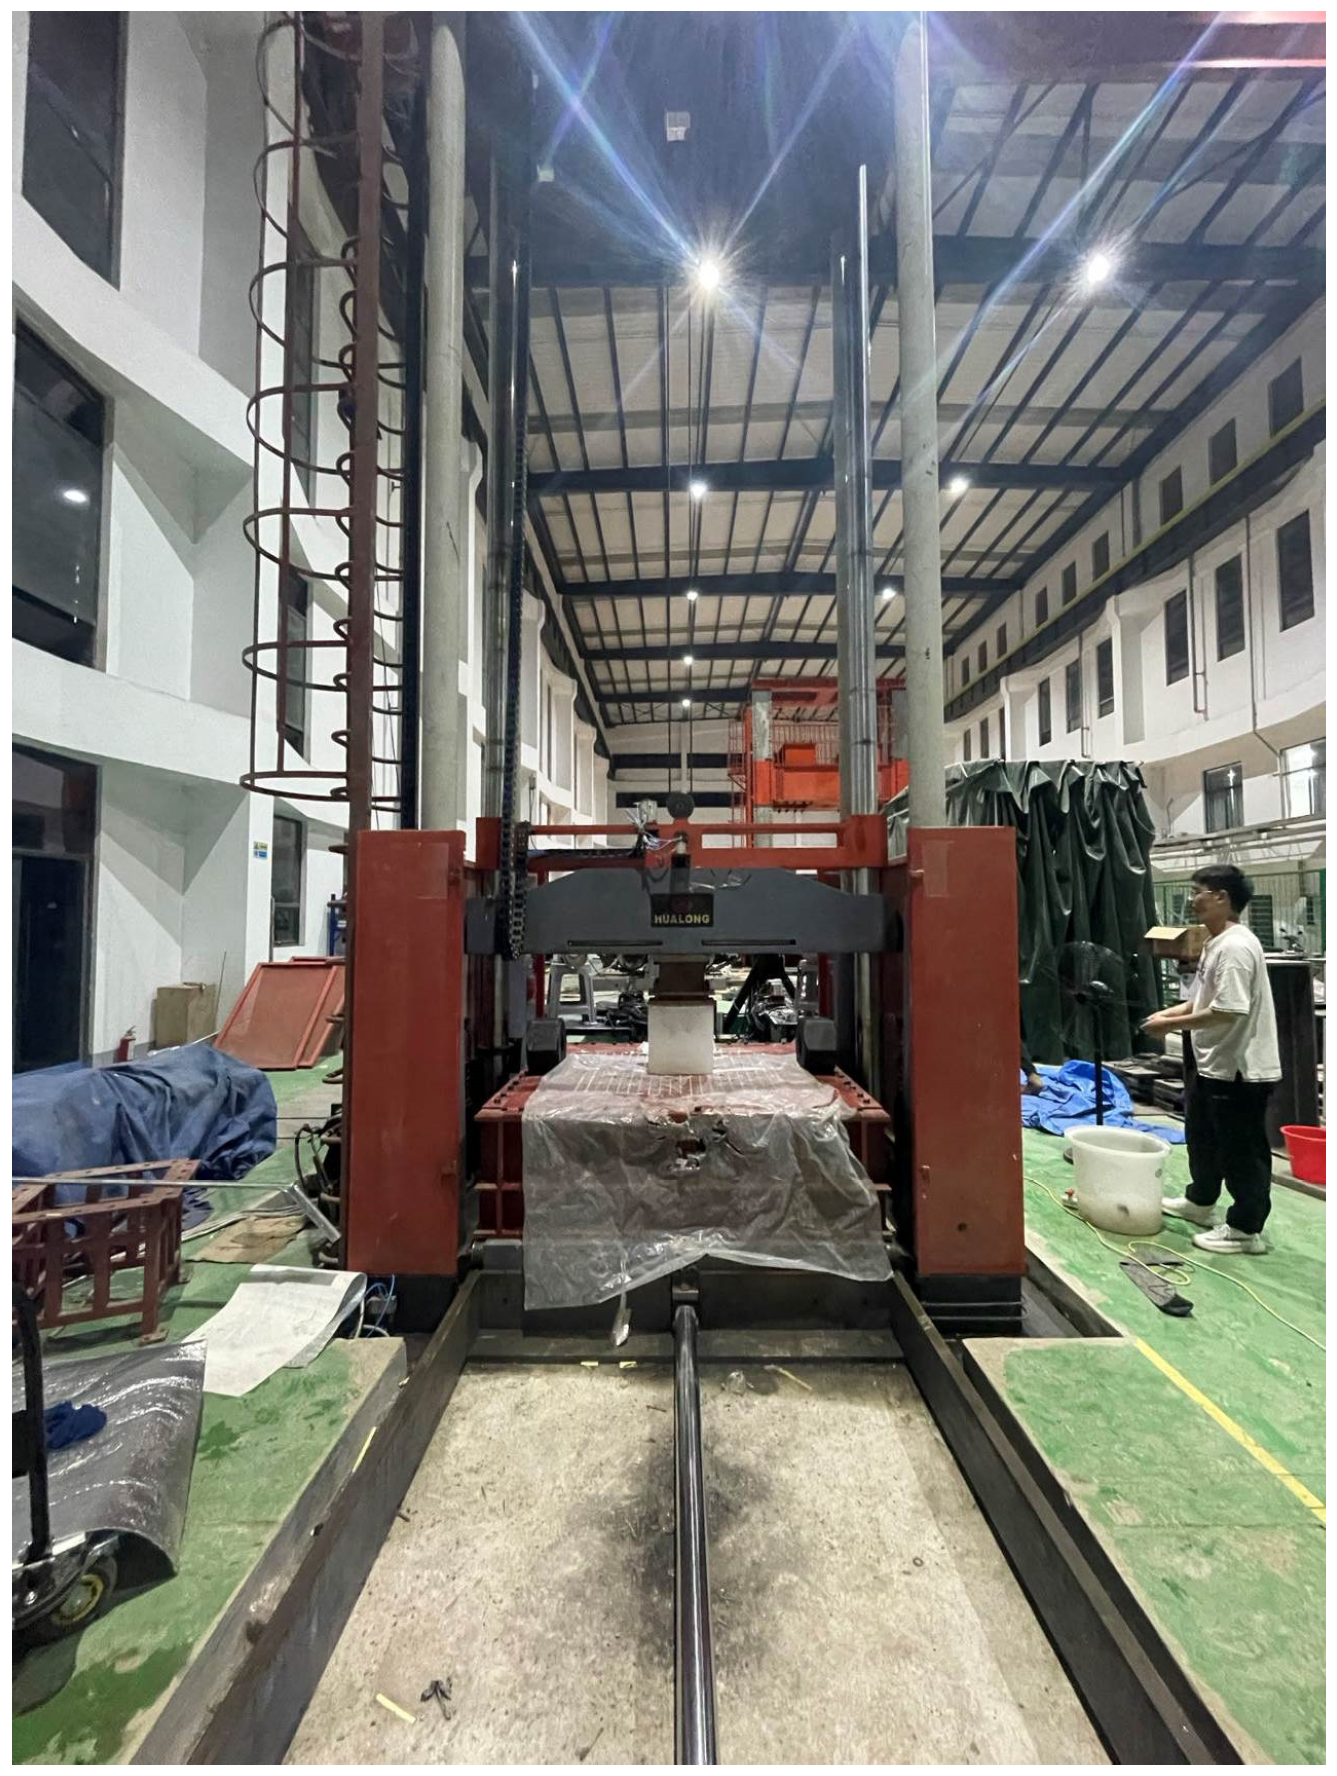
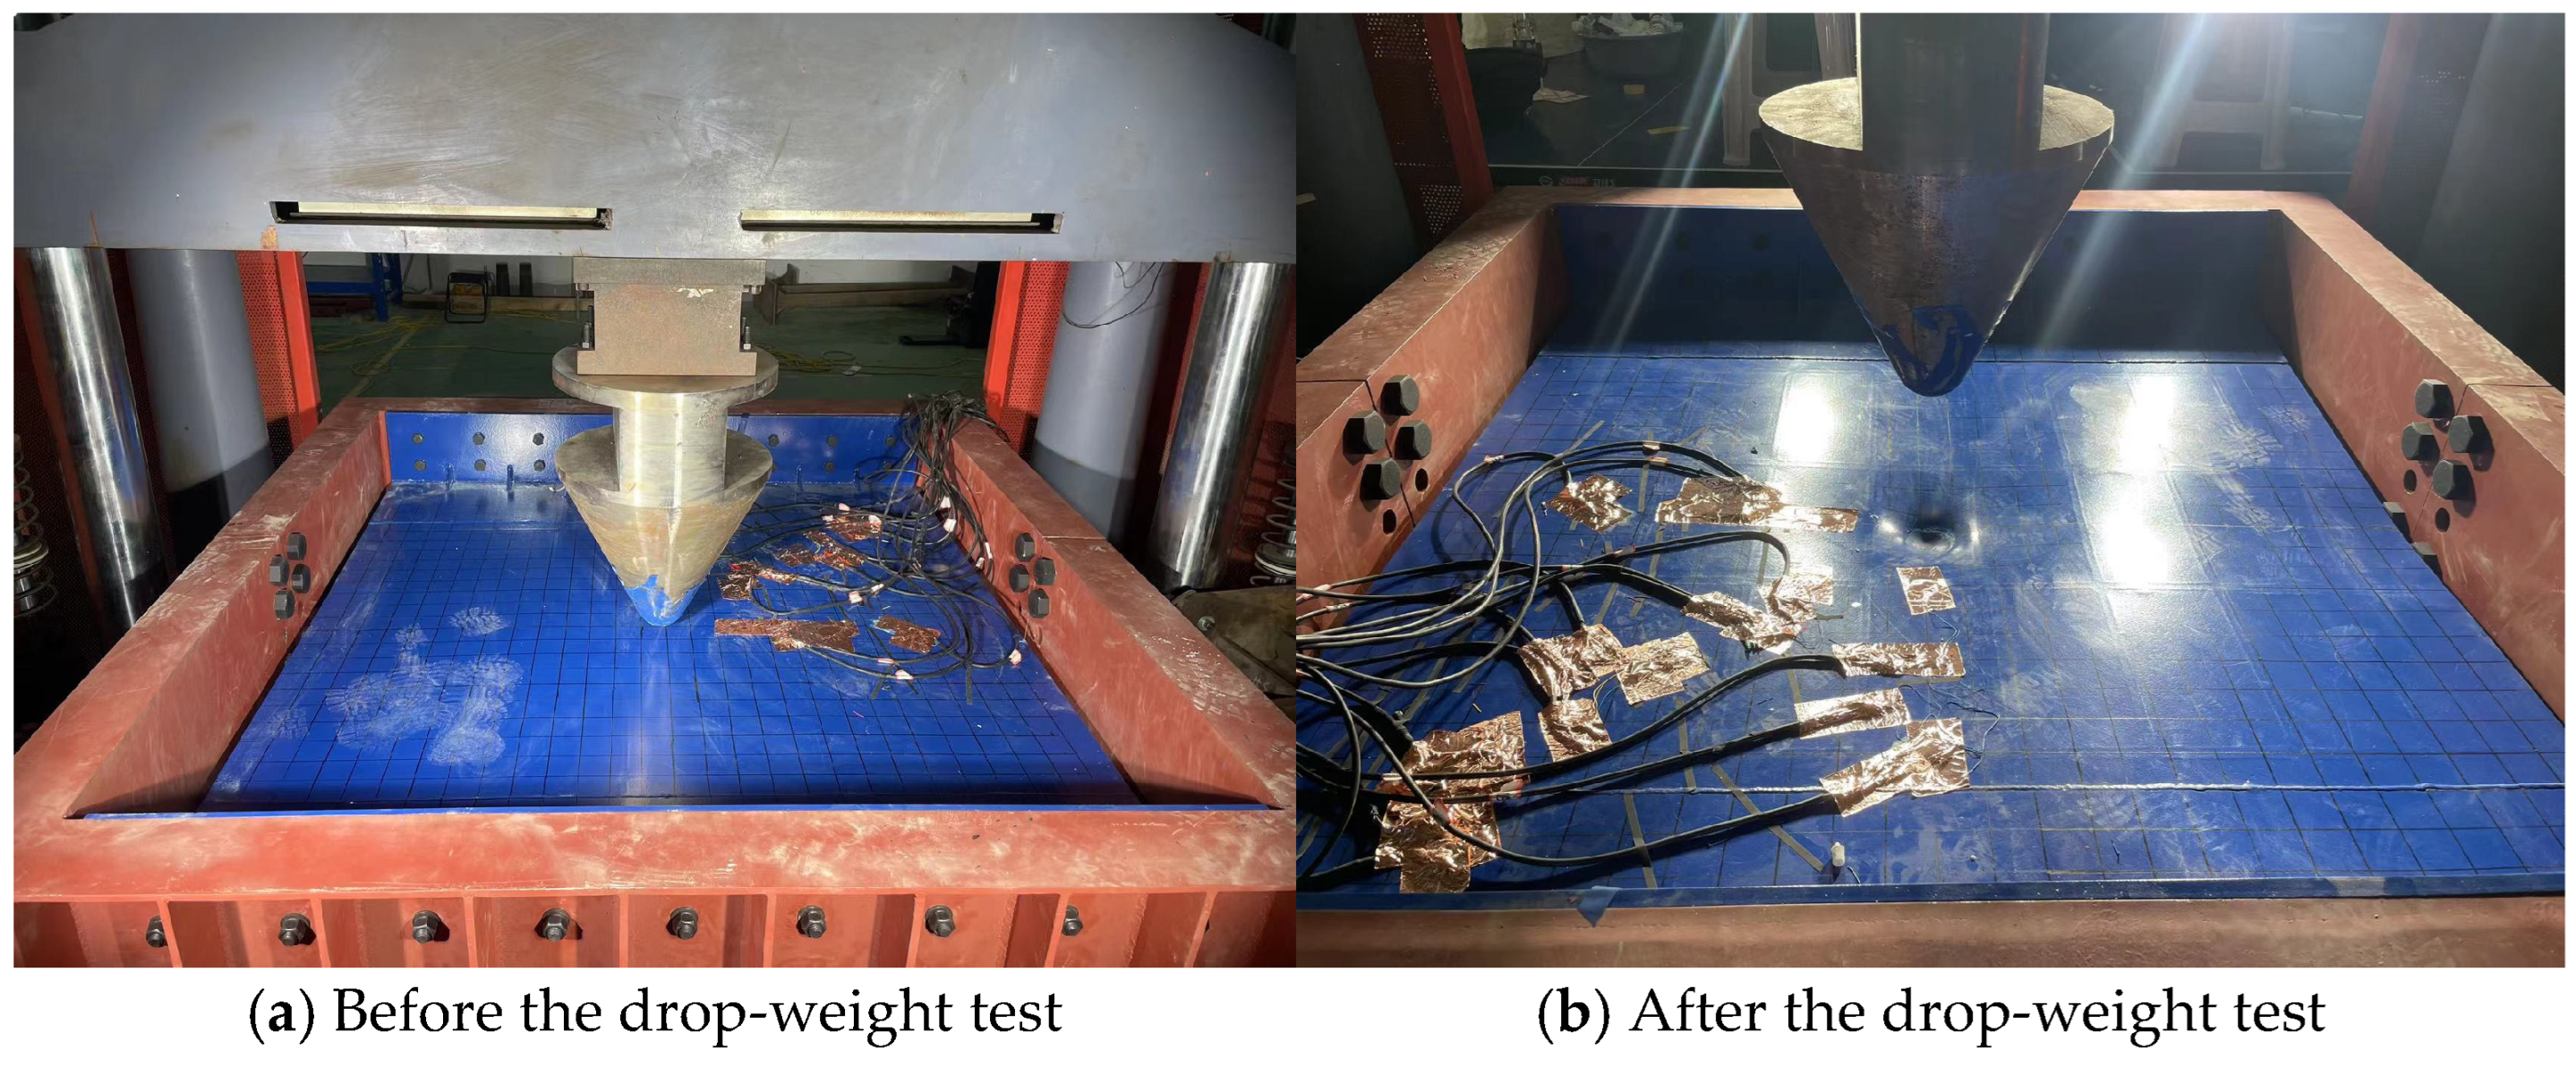
Figure 13.
Drop-weight test.
Figure 13.
Drop-weight test.
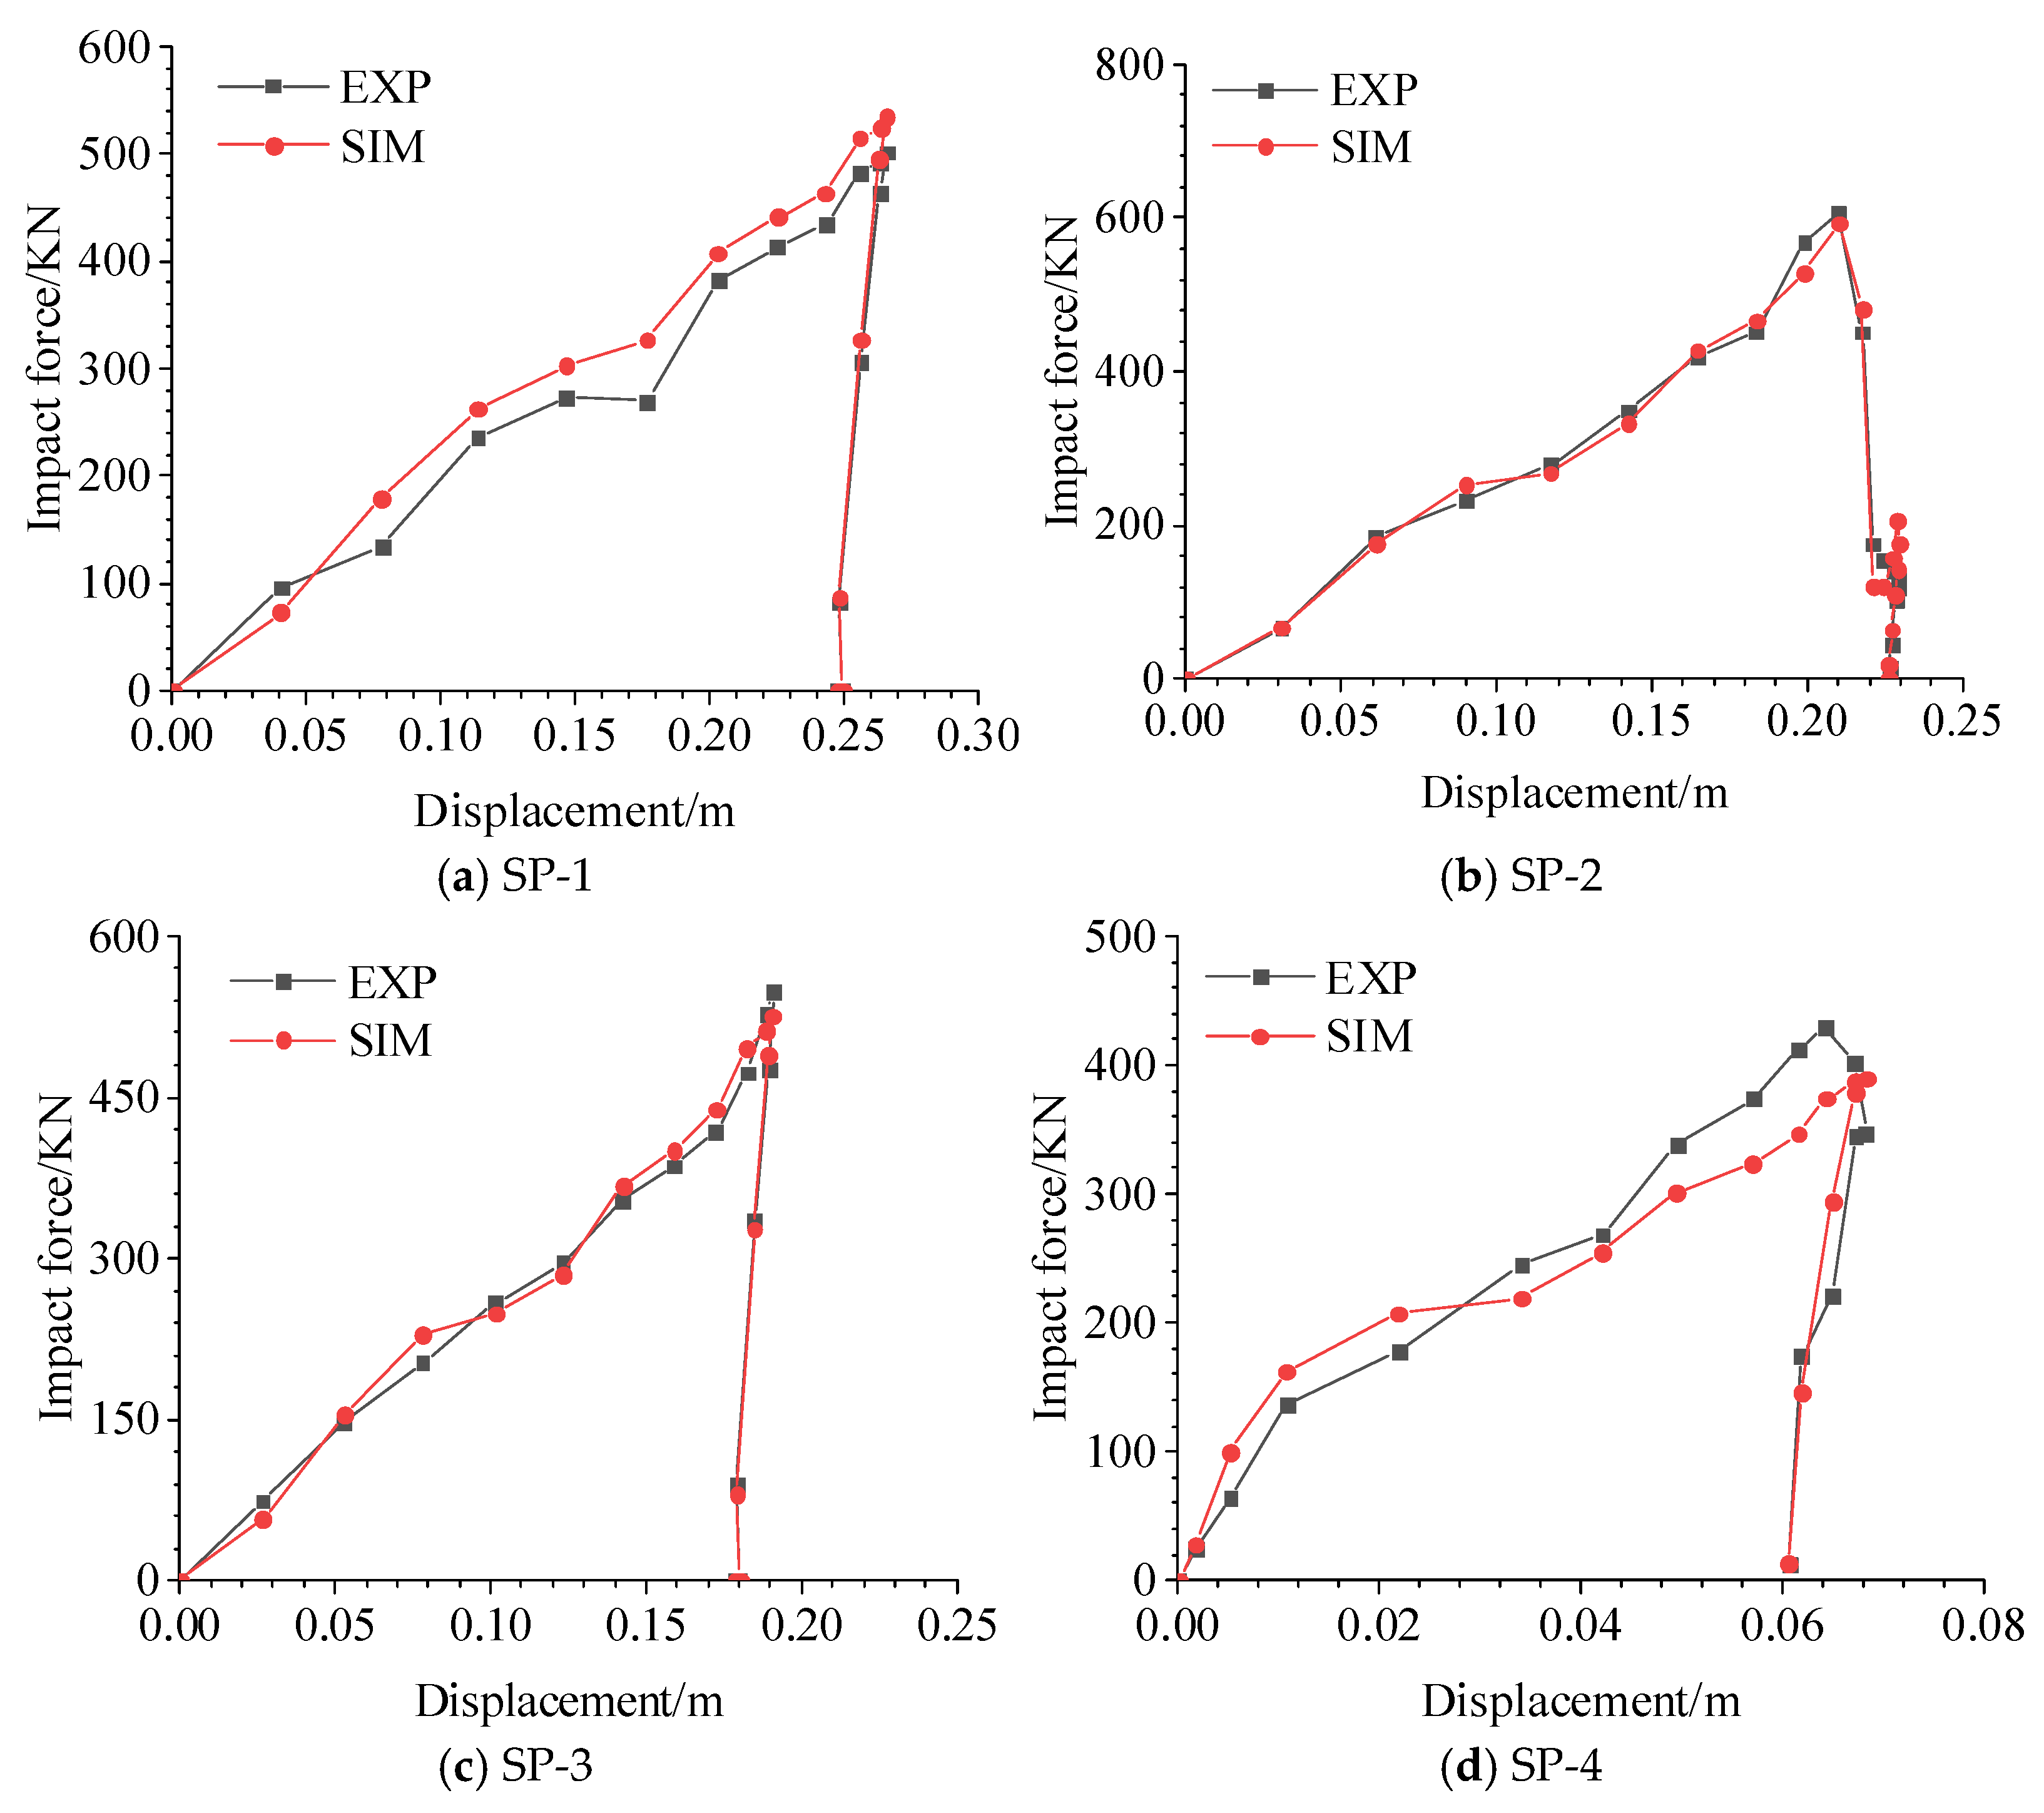
Figure 14.
Impact force–displacement curves under different working conditions.
Figure 14.
Impact force–displacement curves under different working conditions.
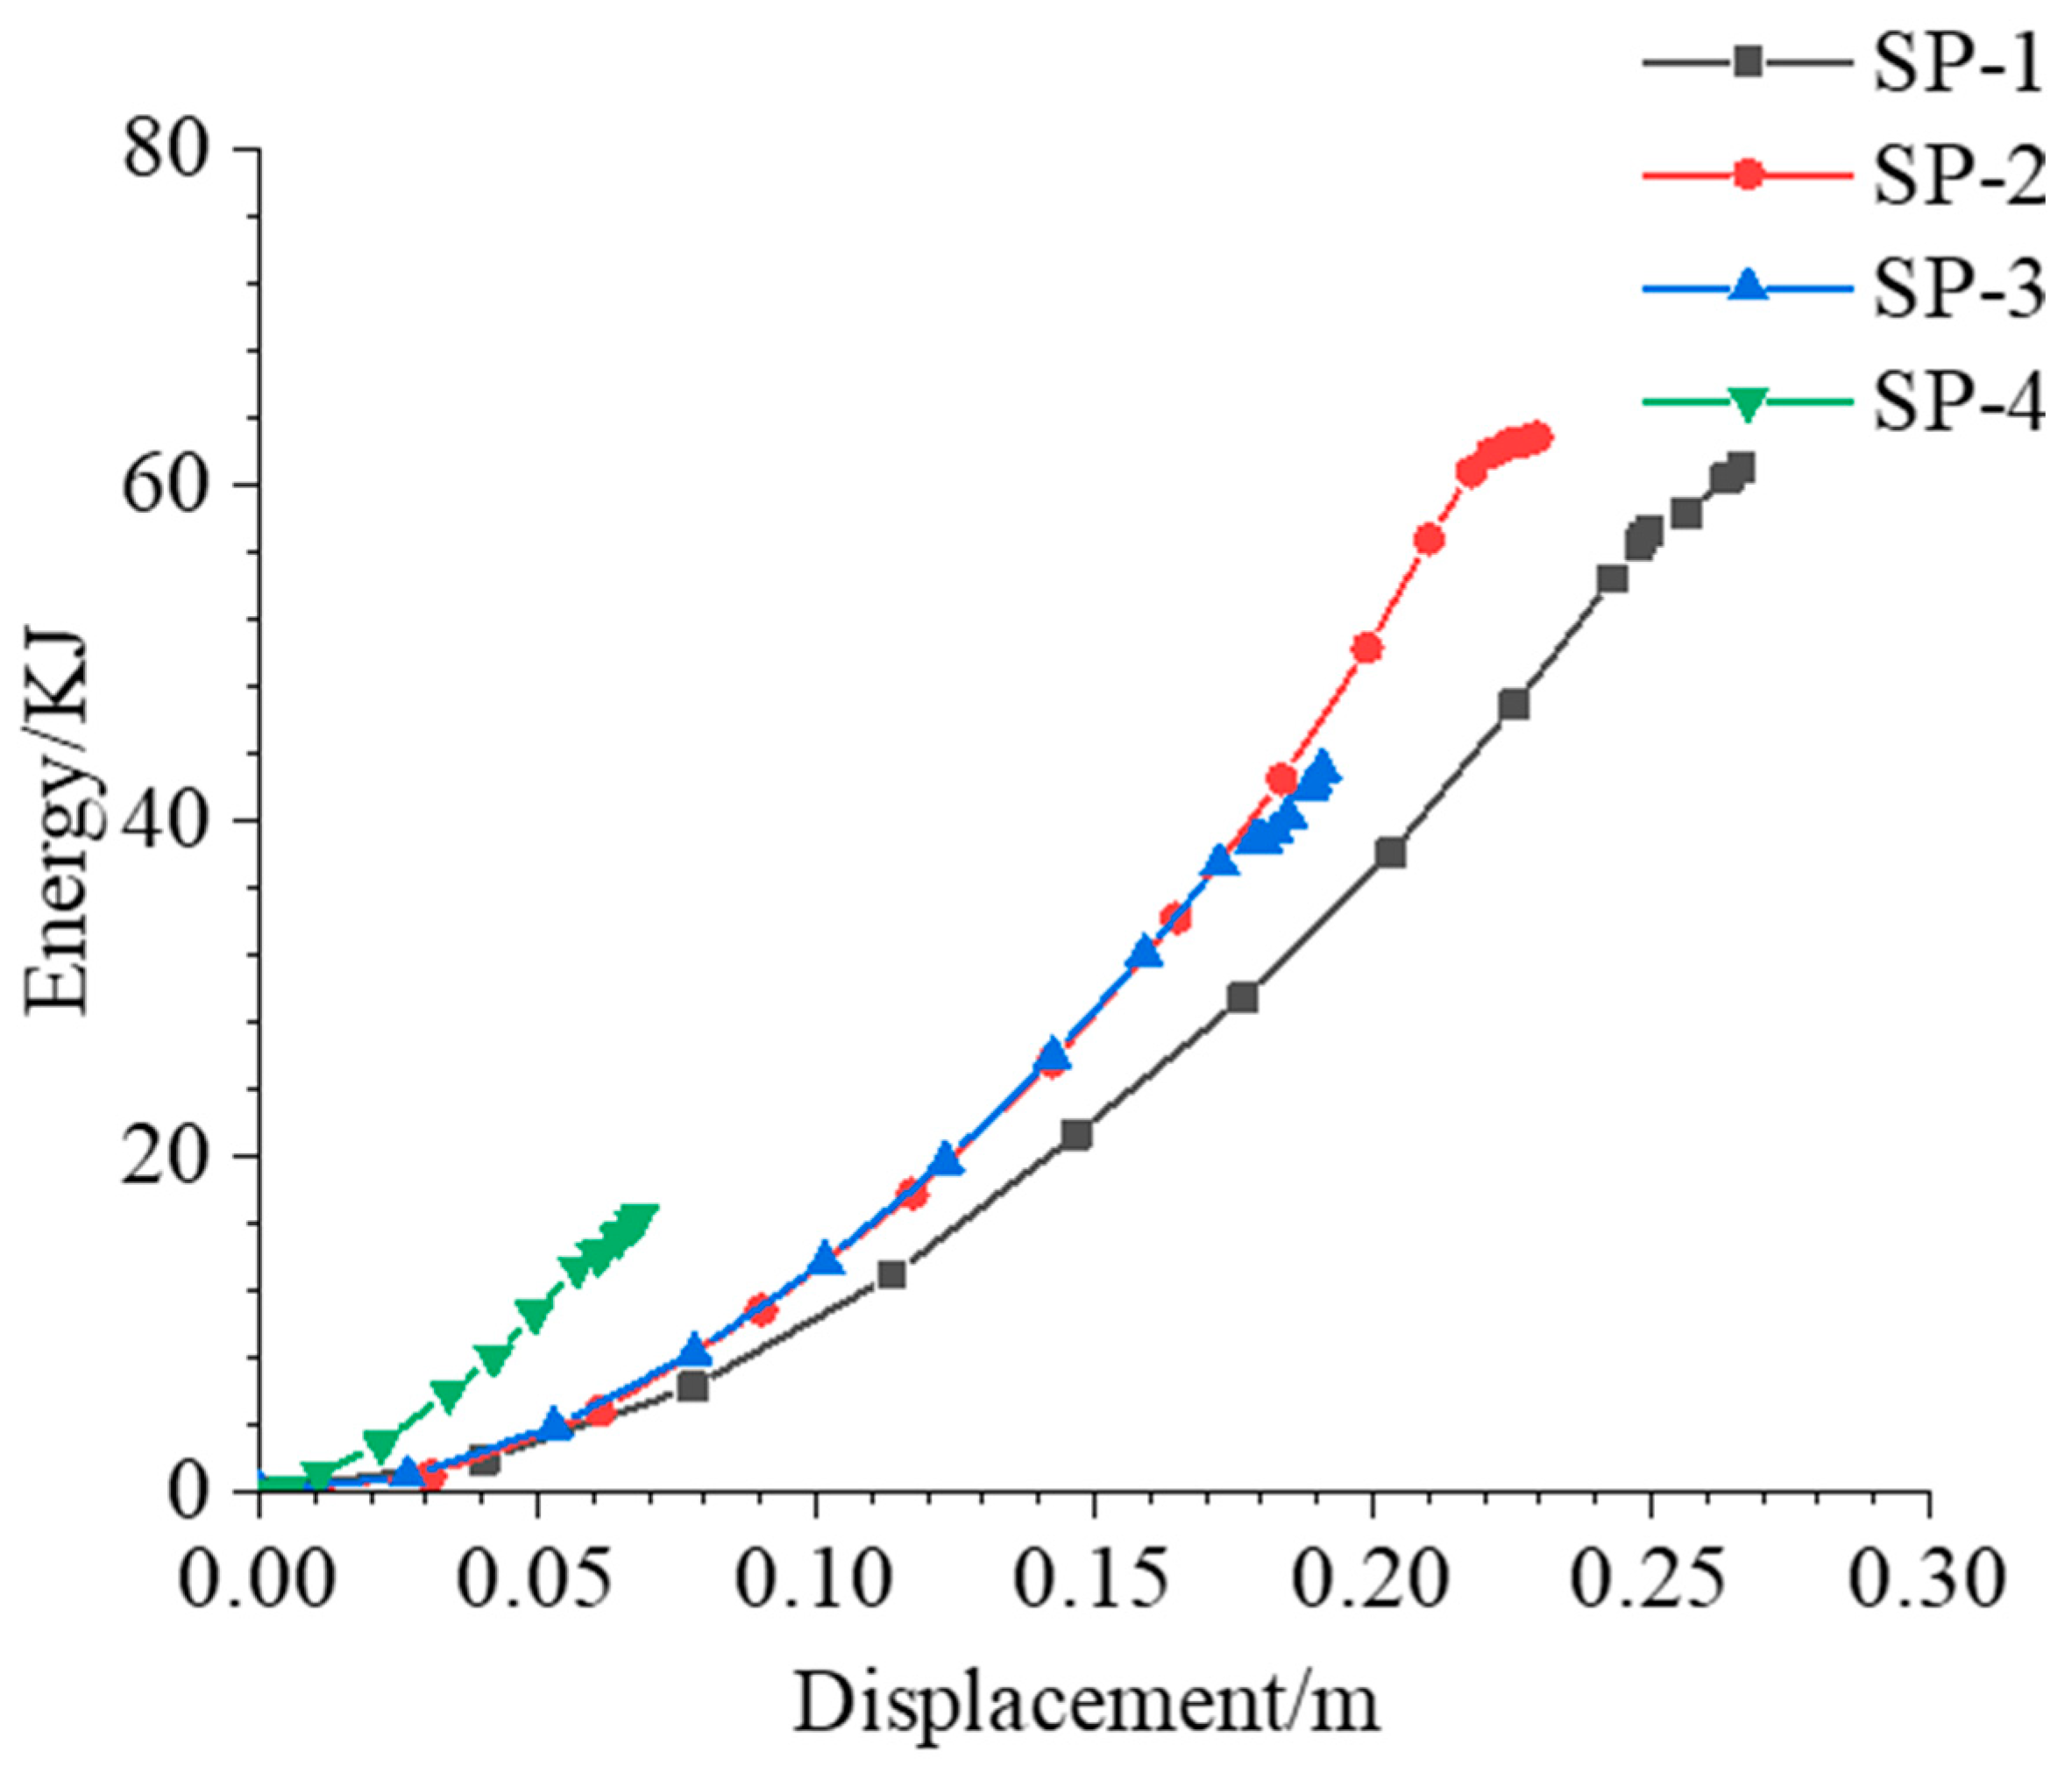
Figure 15.
Energy–displacement curves under different working conditions.
Figure 15.
Energy–displacement curves under different working conditions.
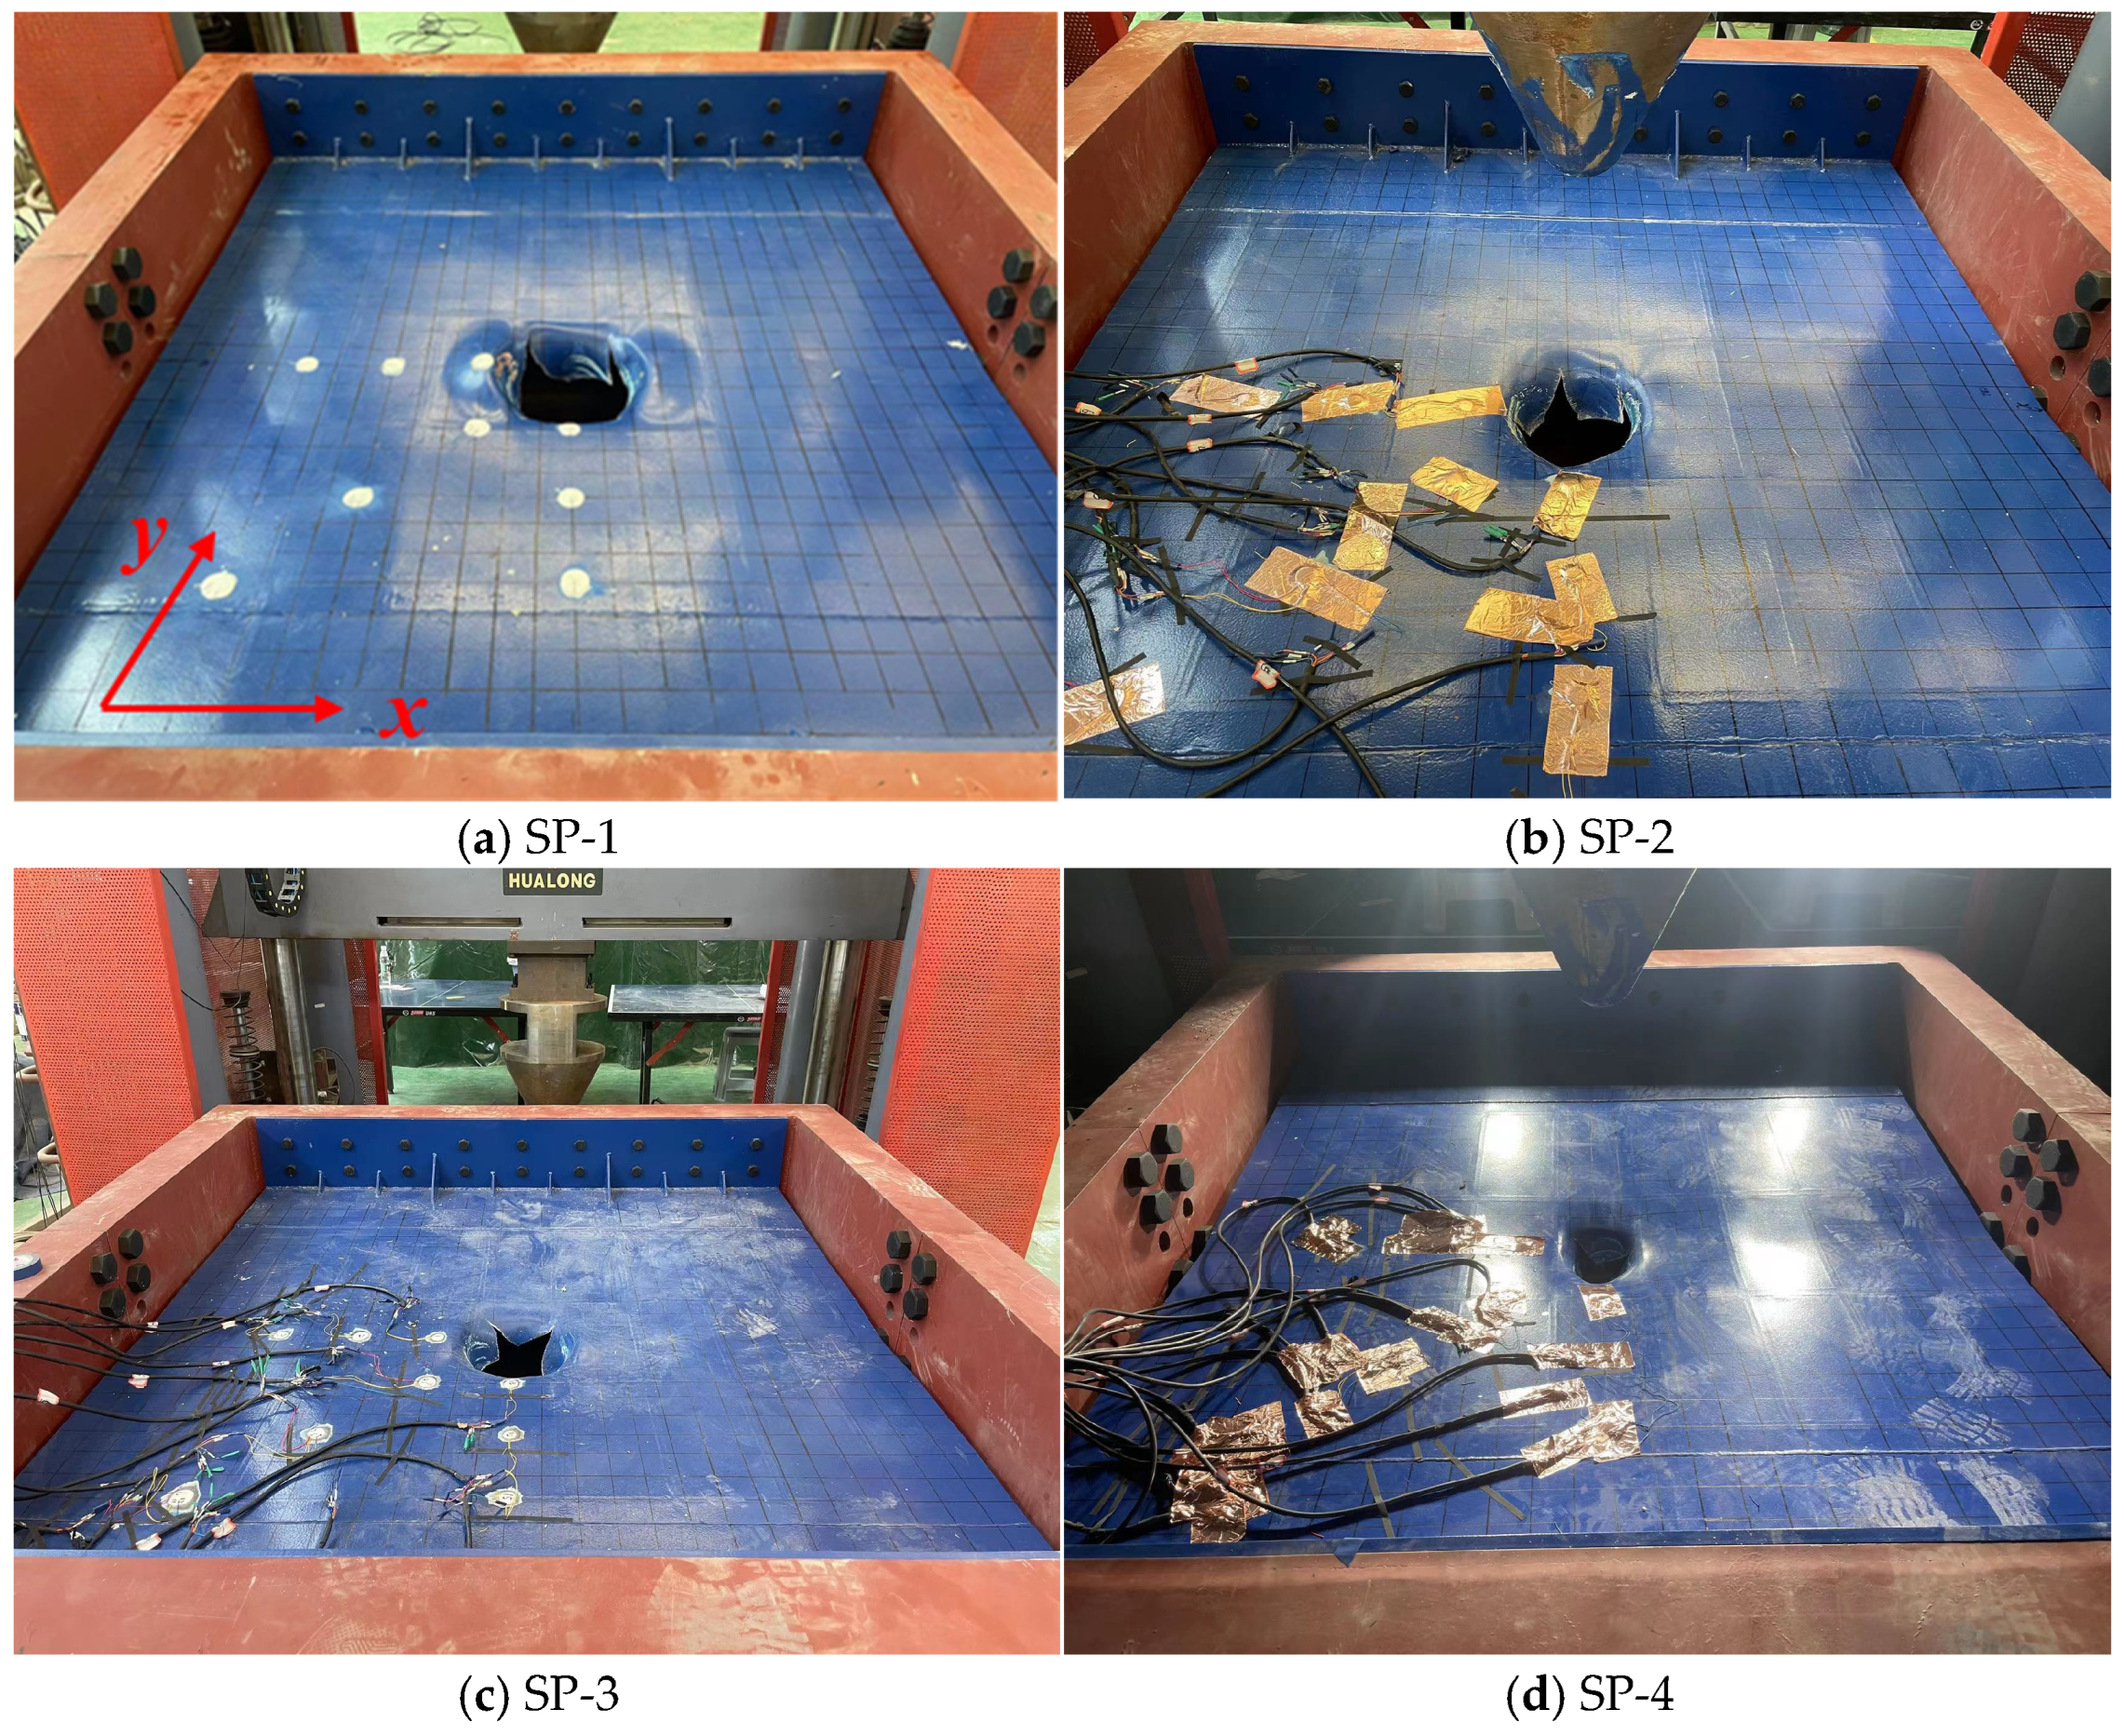
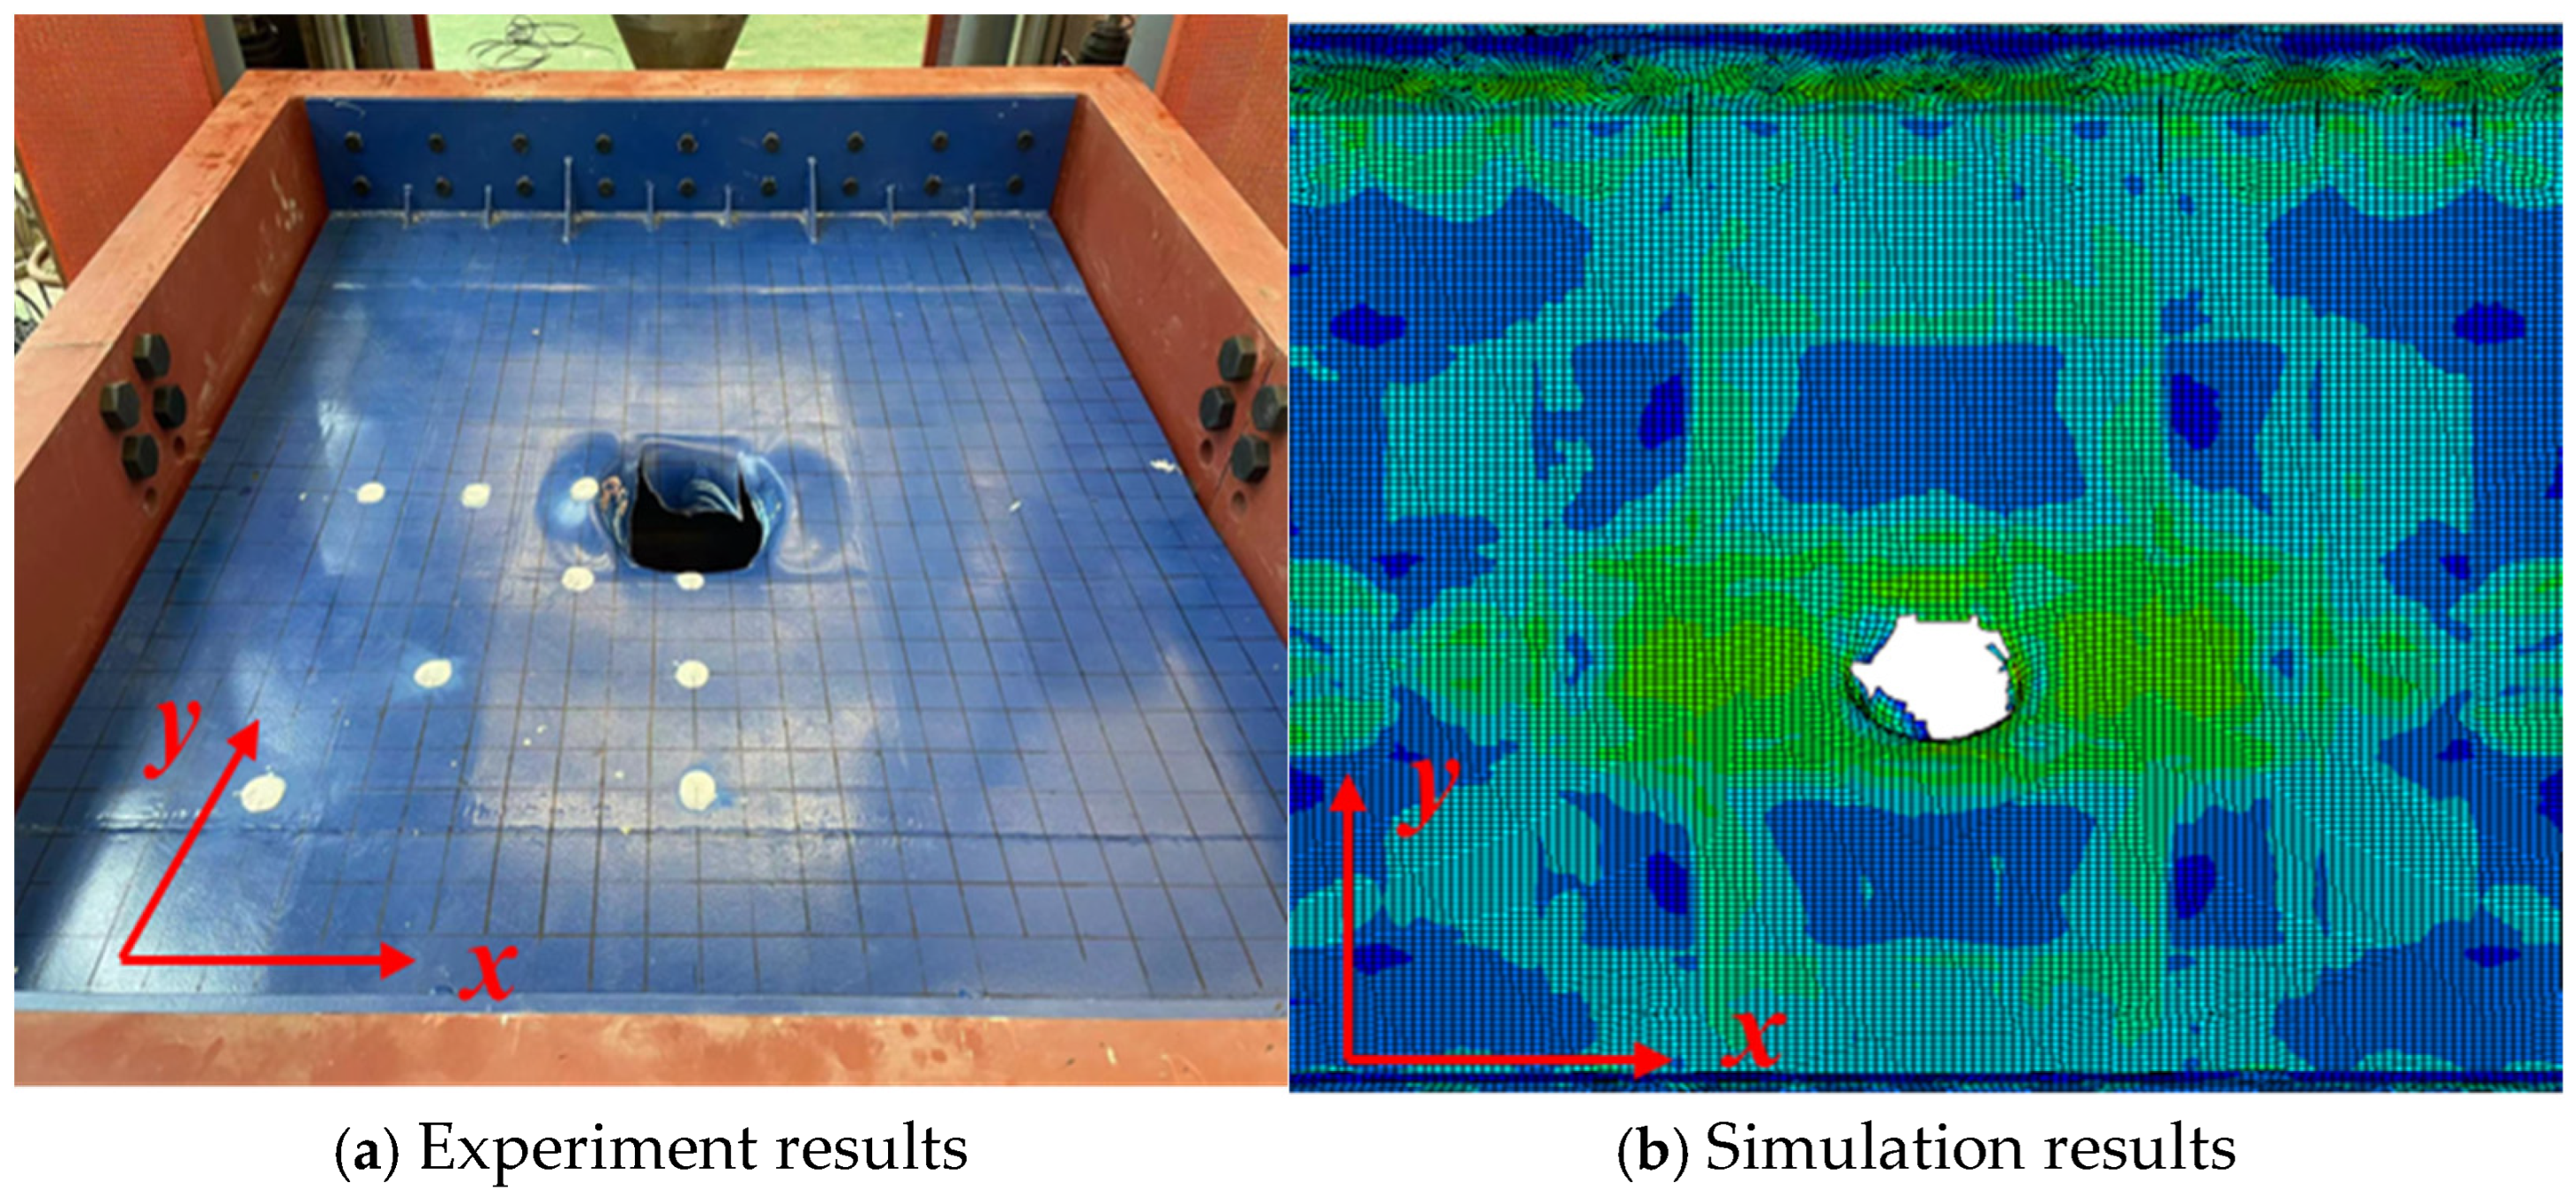
Figure 16.
Damage deformation under different working conditions.
Figure 16.
Damage deformation under different working conditions.
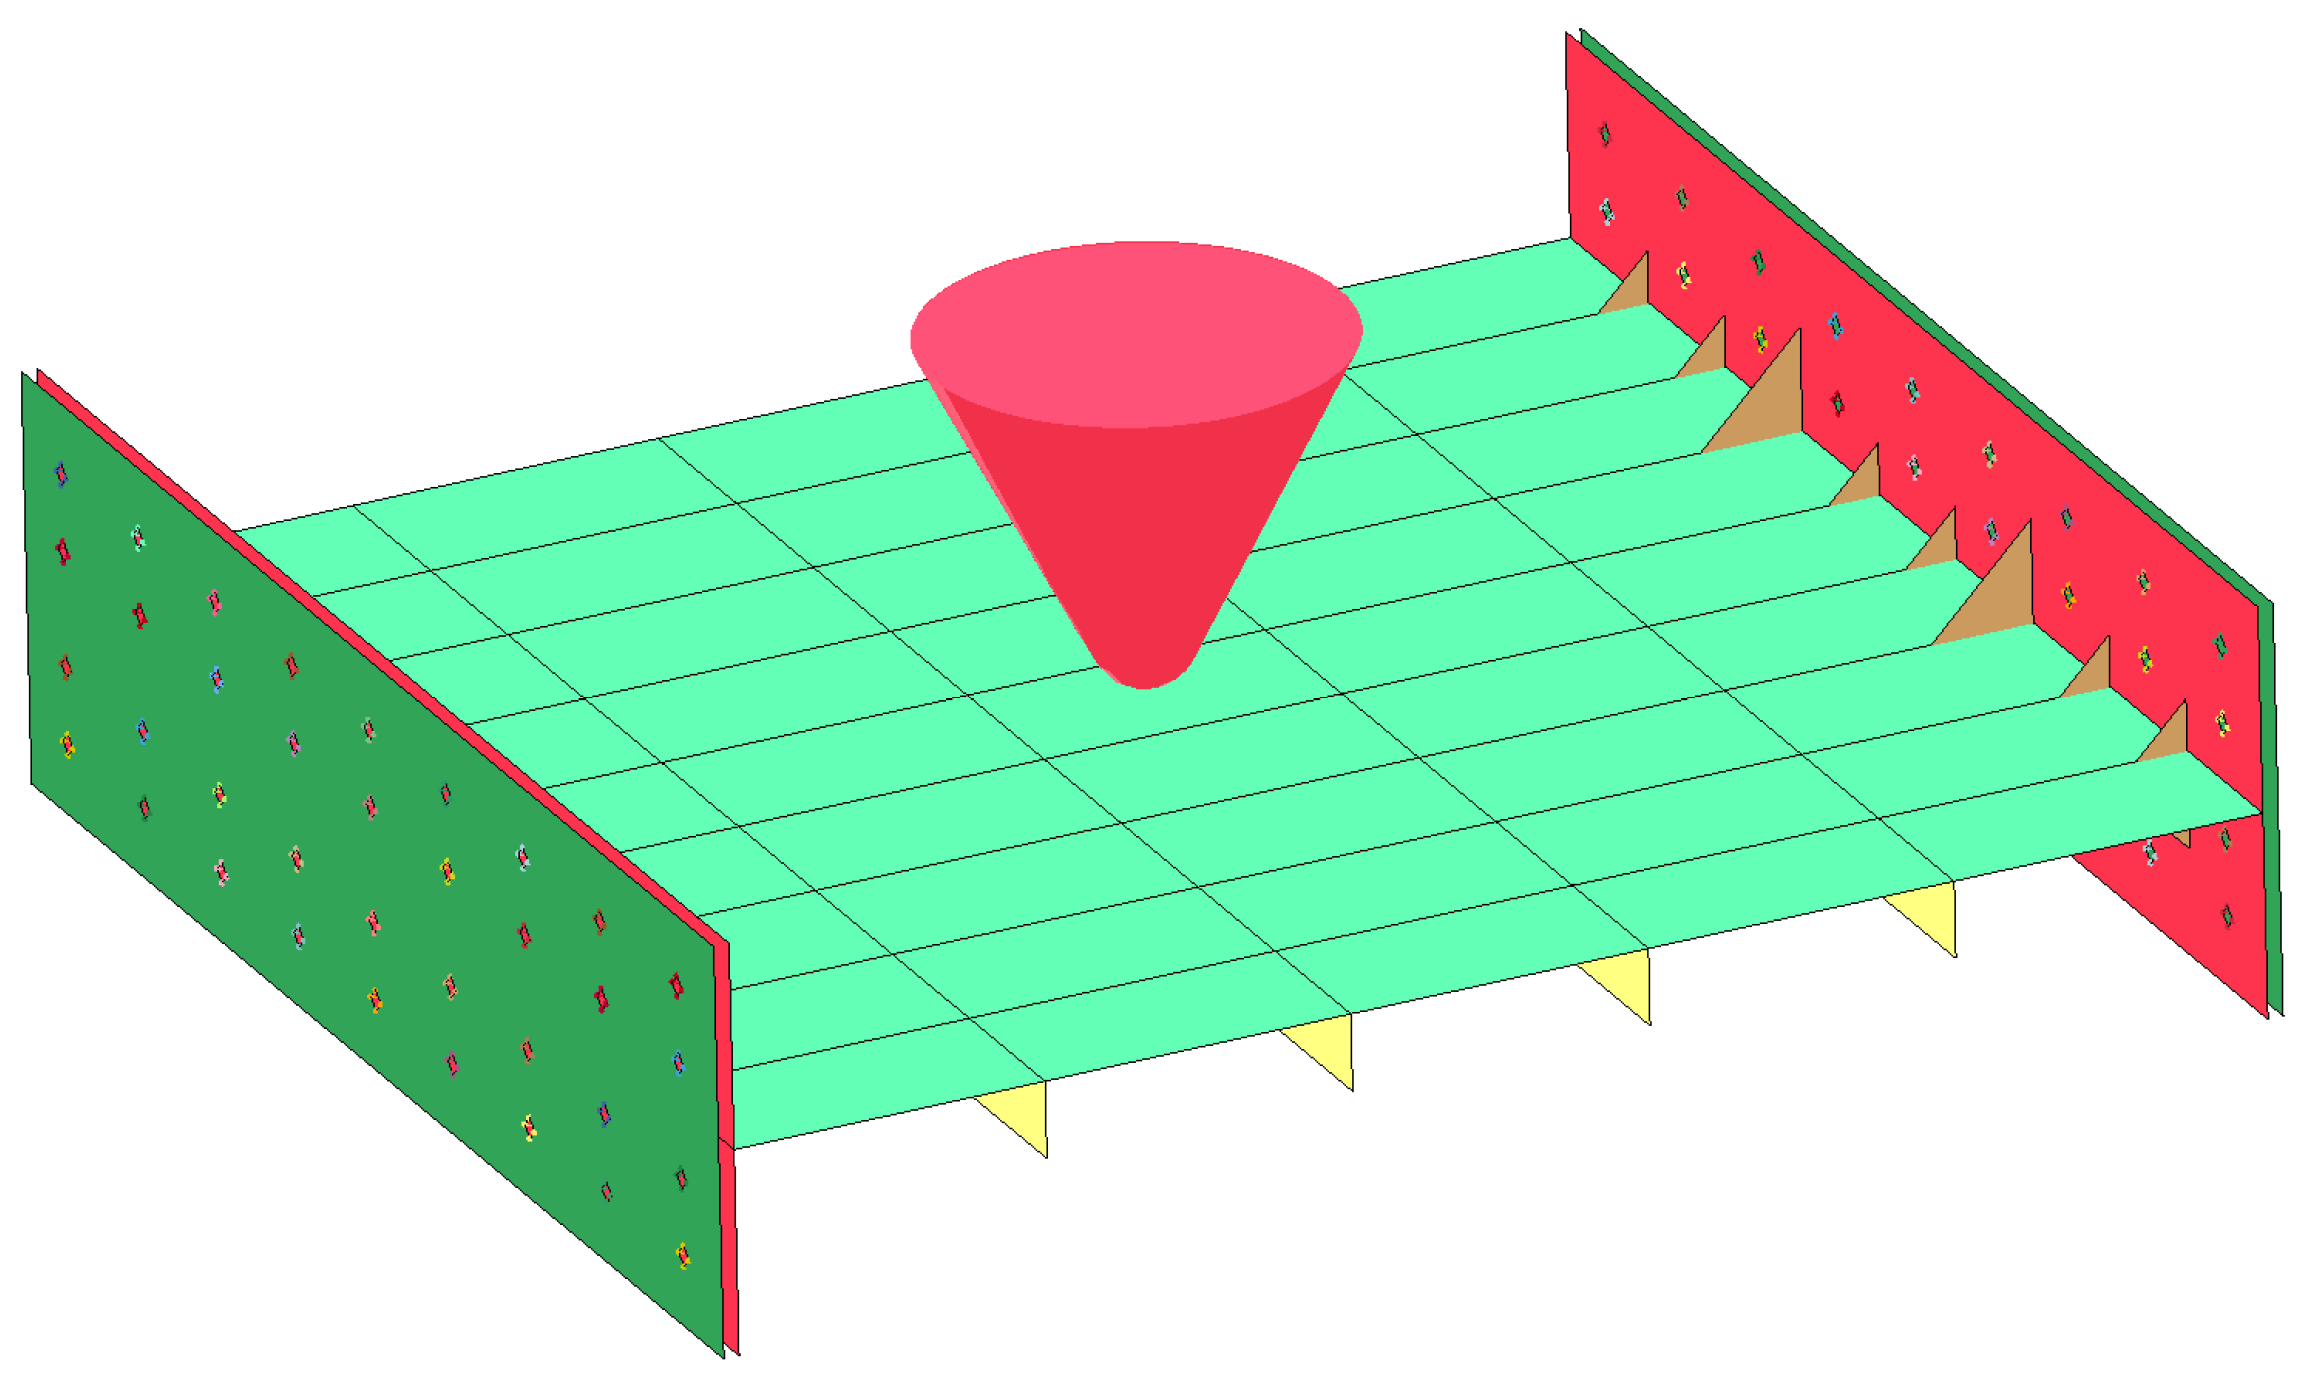
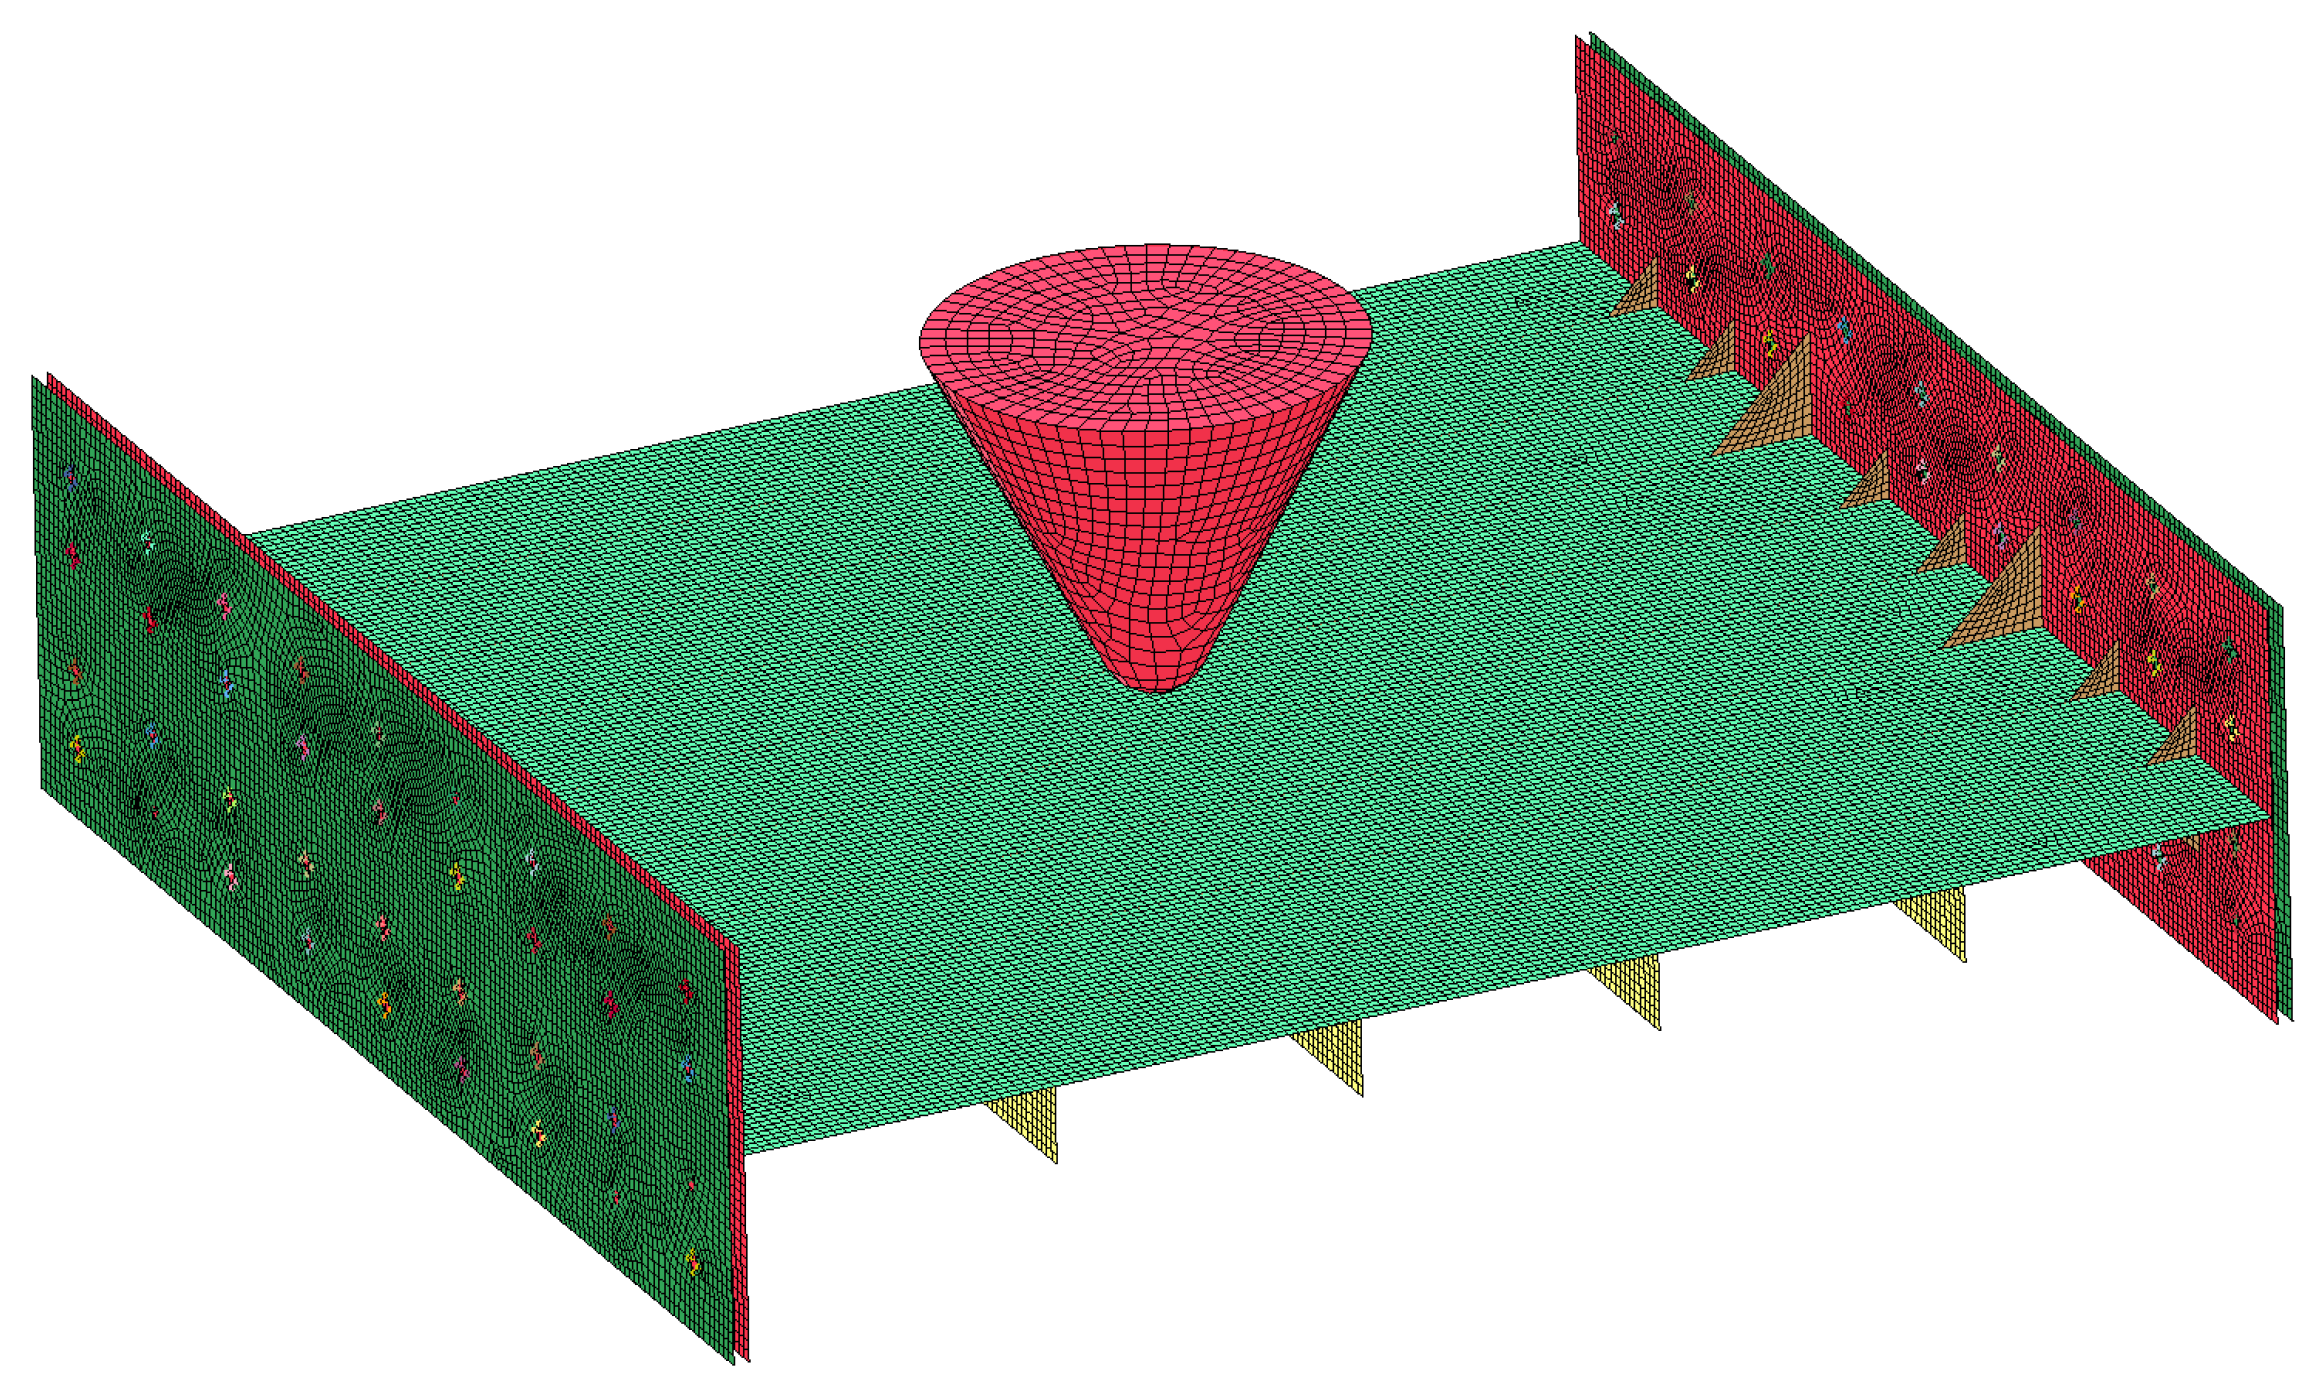
Figure 17.
The finite element model of drop-weight impact.
Figure 17.
The finite element model of drop-weight impact.
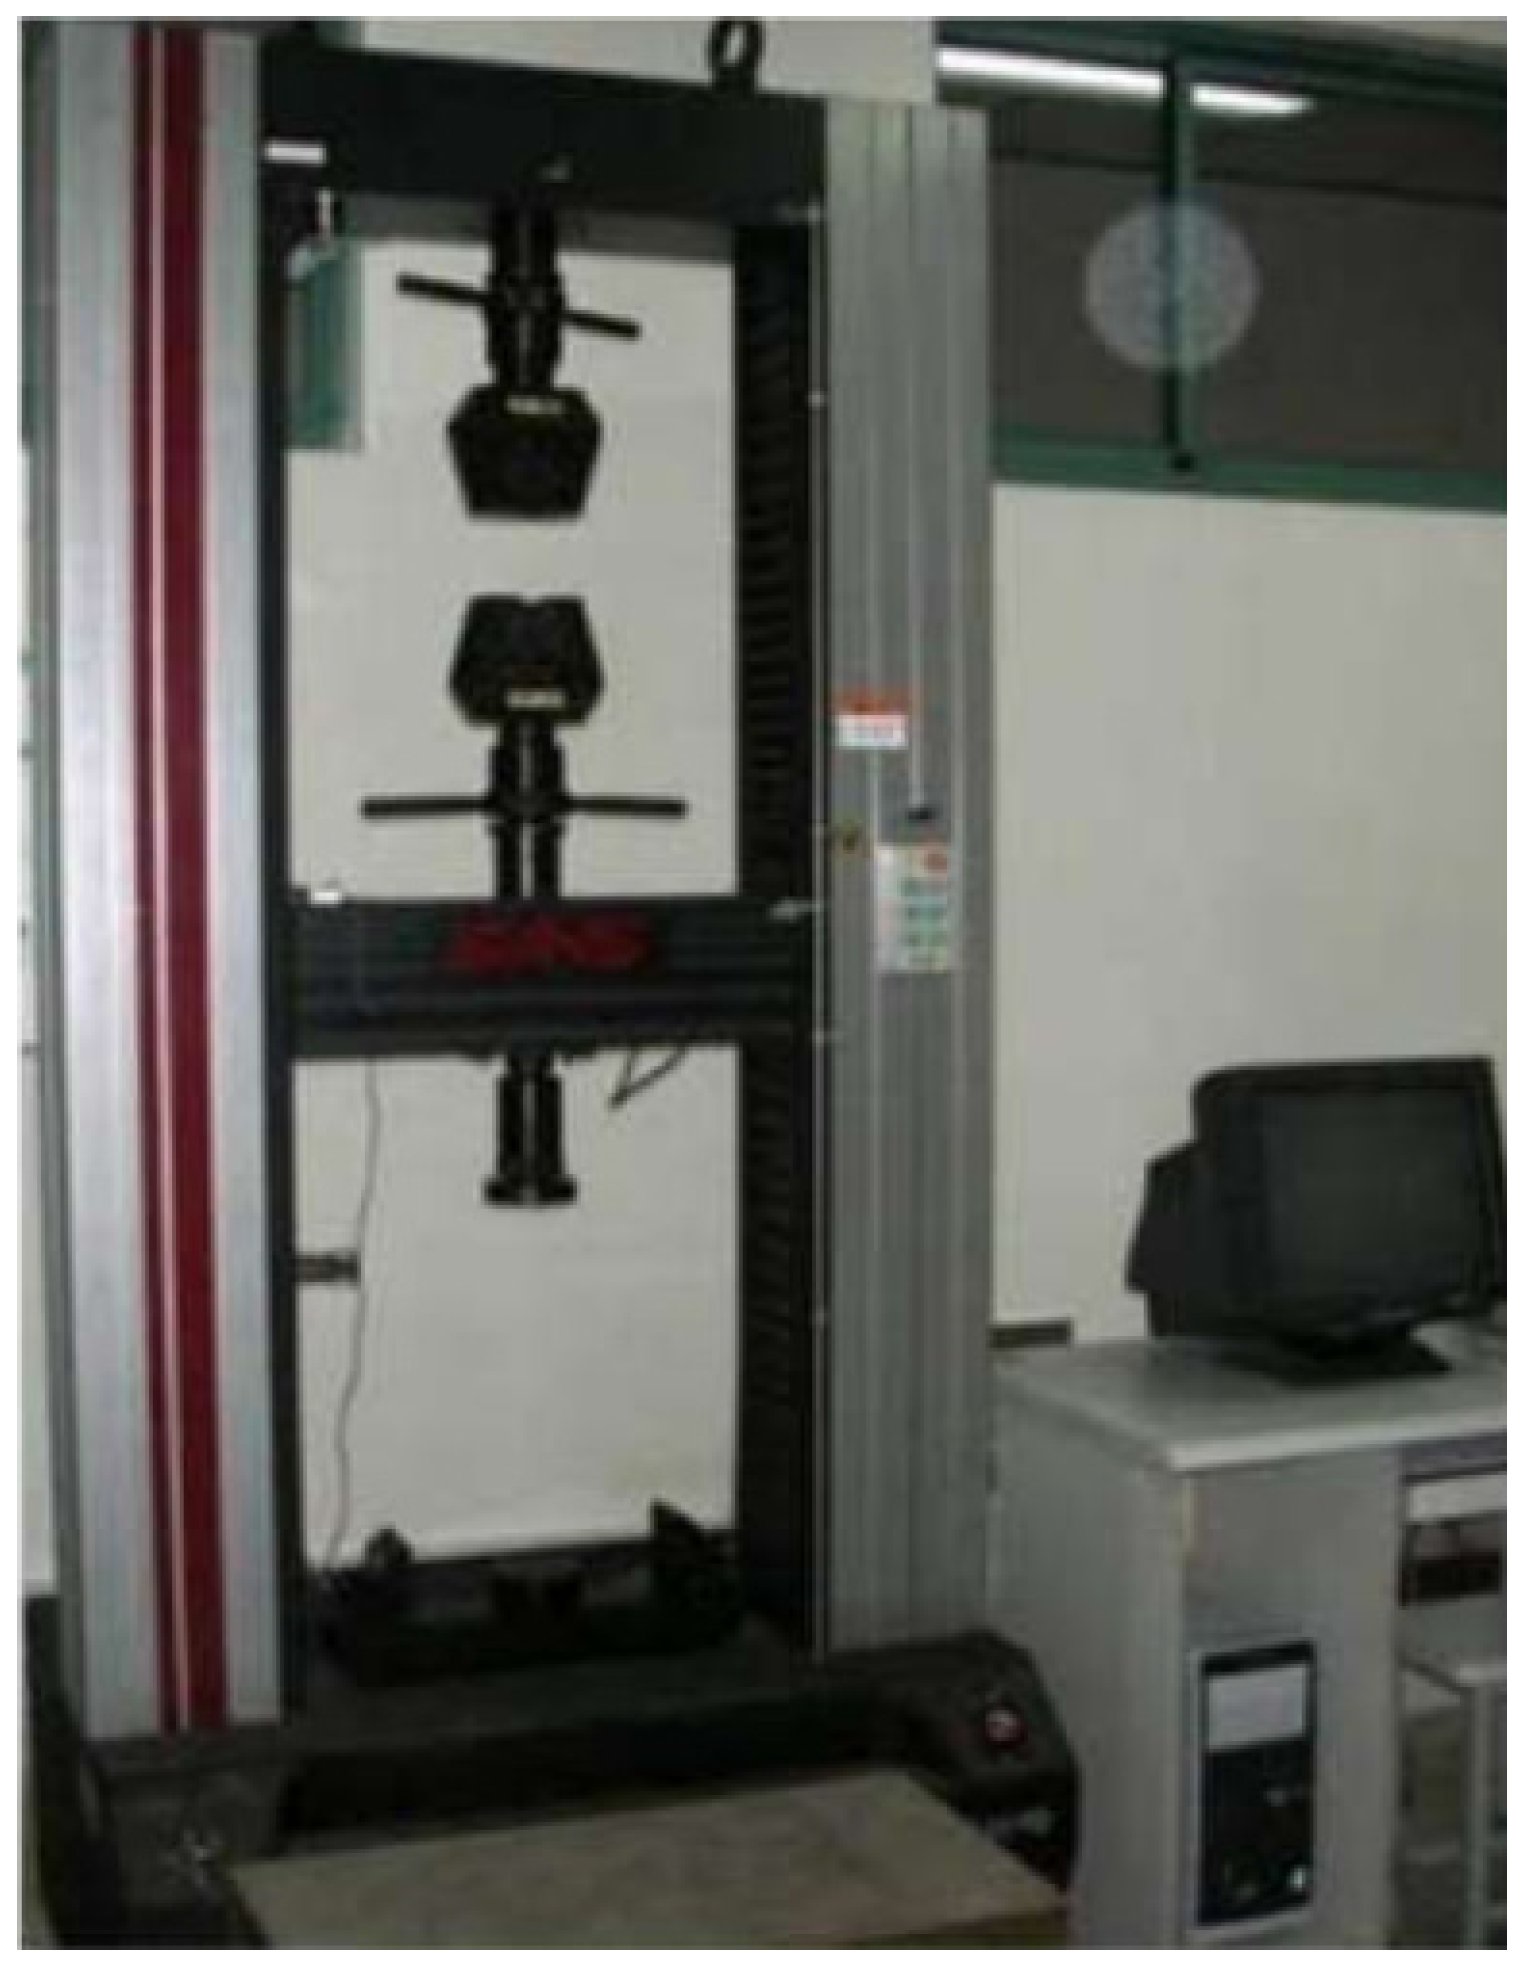
Figure 18.
Quasi-static tensile test of material.
Figure 18.
Quasi-static tensile test of material.
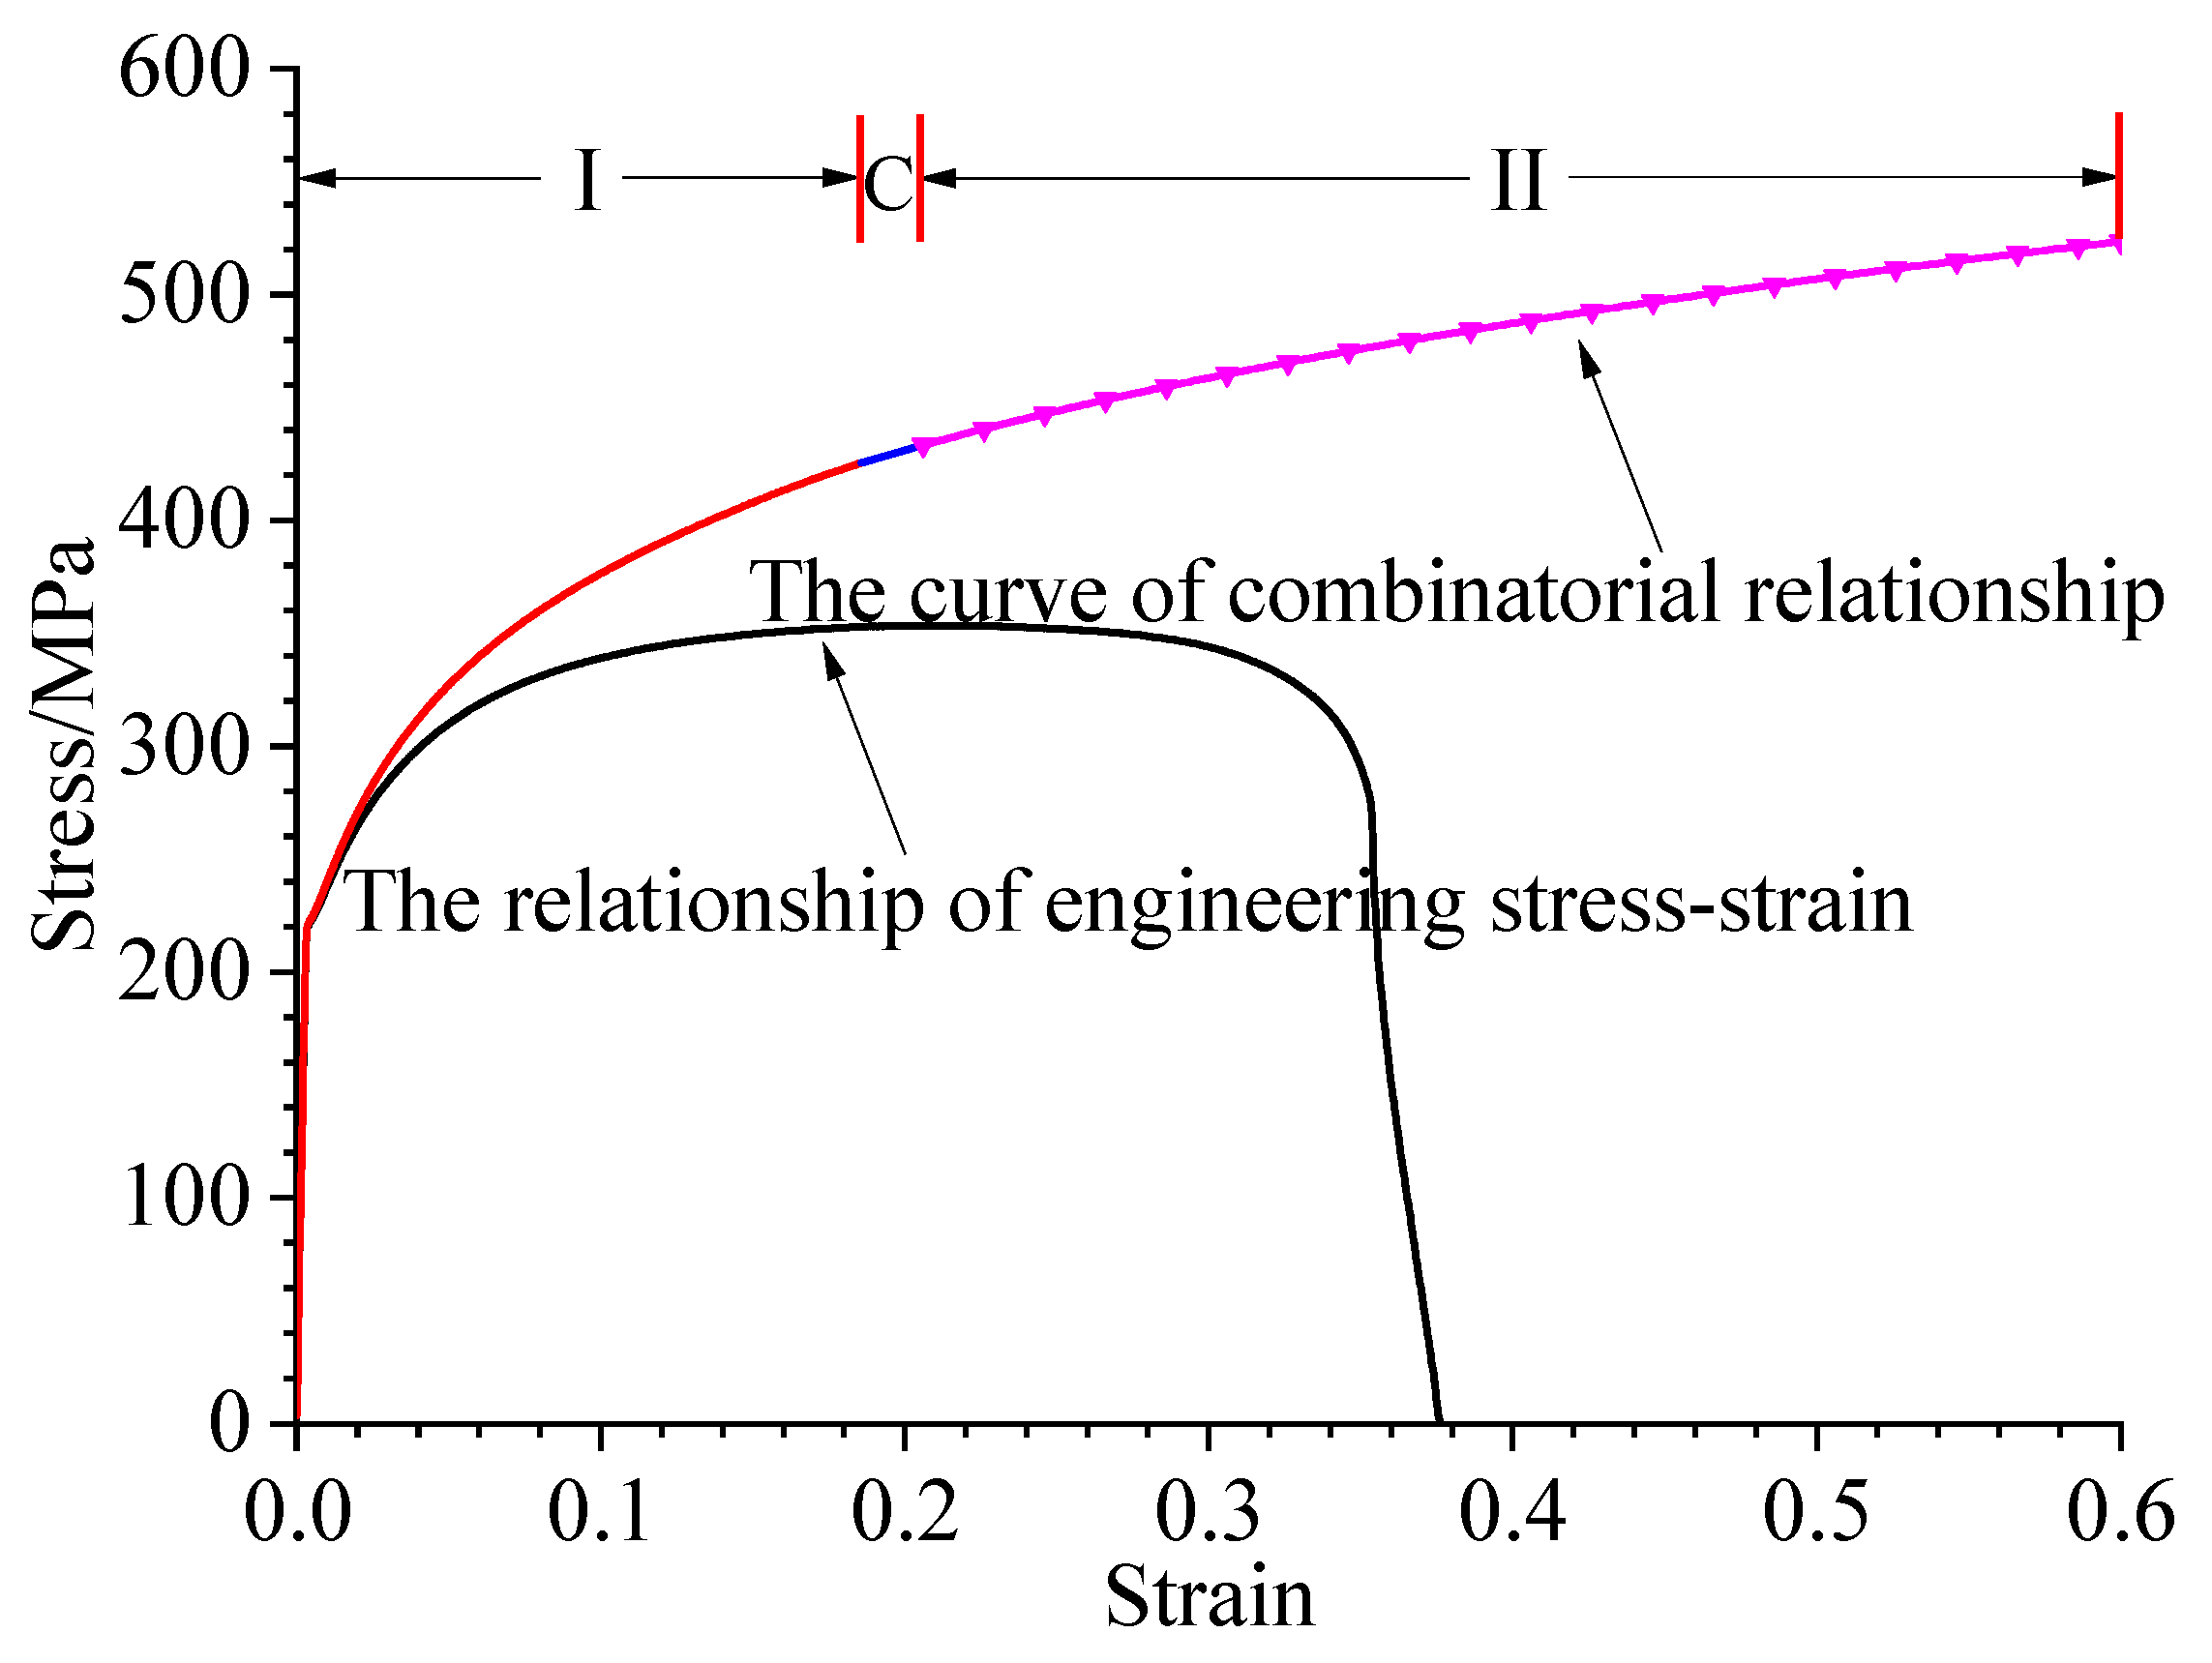
Figure 19.
Material curve.
Figure 19.
Material curve.
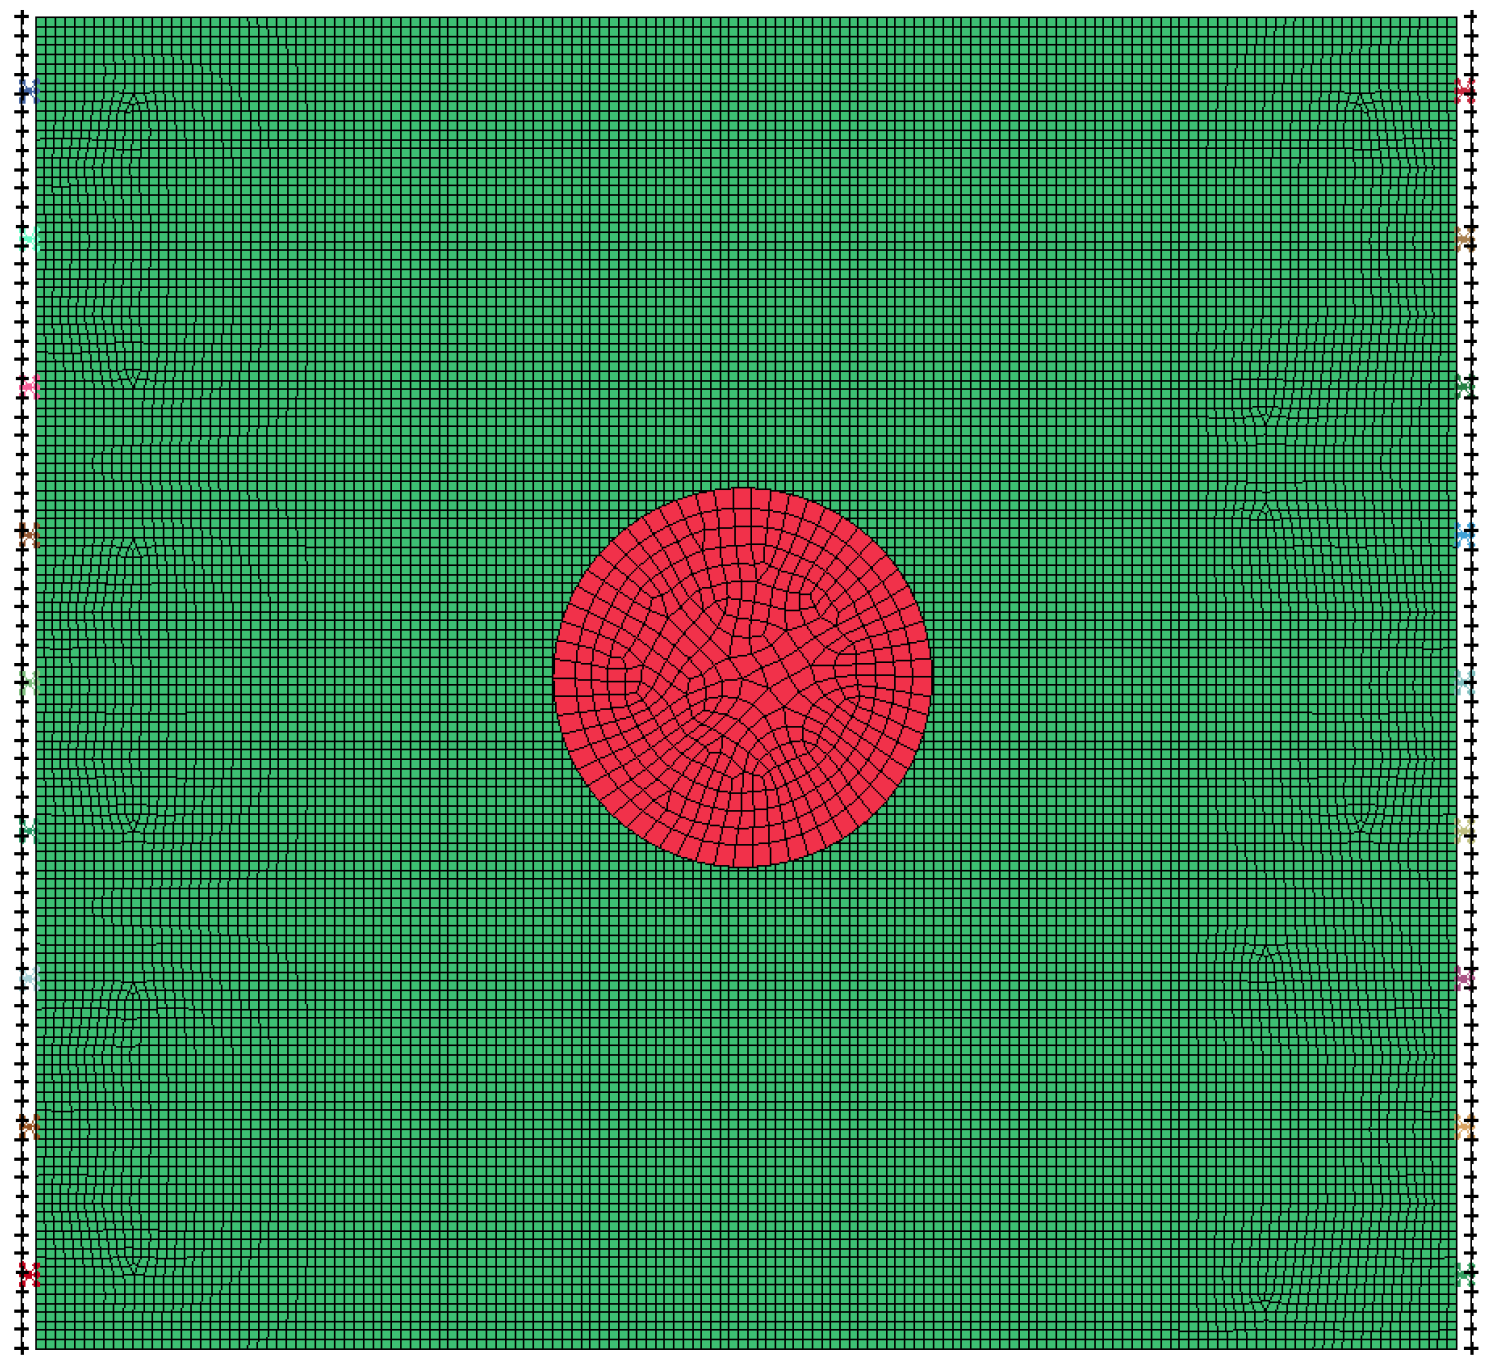
Figure 20.
The grid division of the structure.
Figure 20.
The grid division of the structure.
Figure 21.
Boundary constraints.
Figure 21.
Boundary constraints.
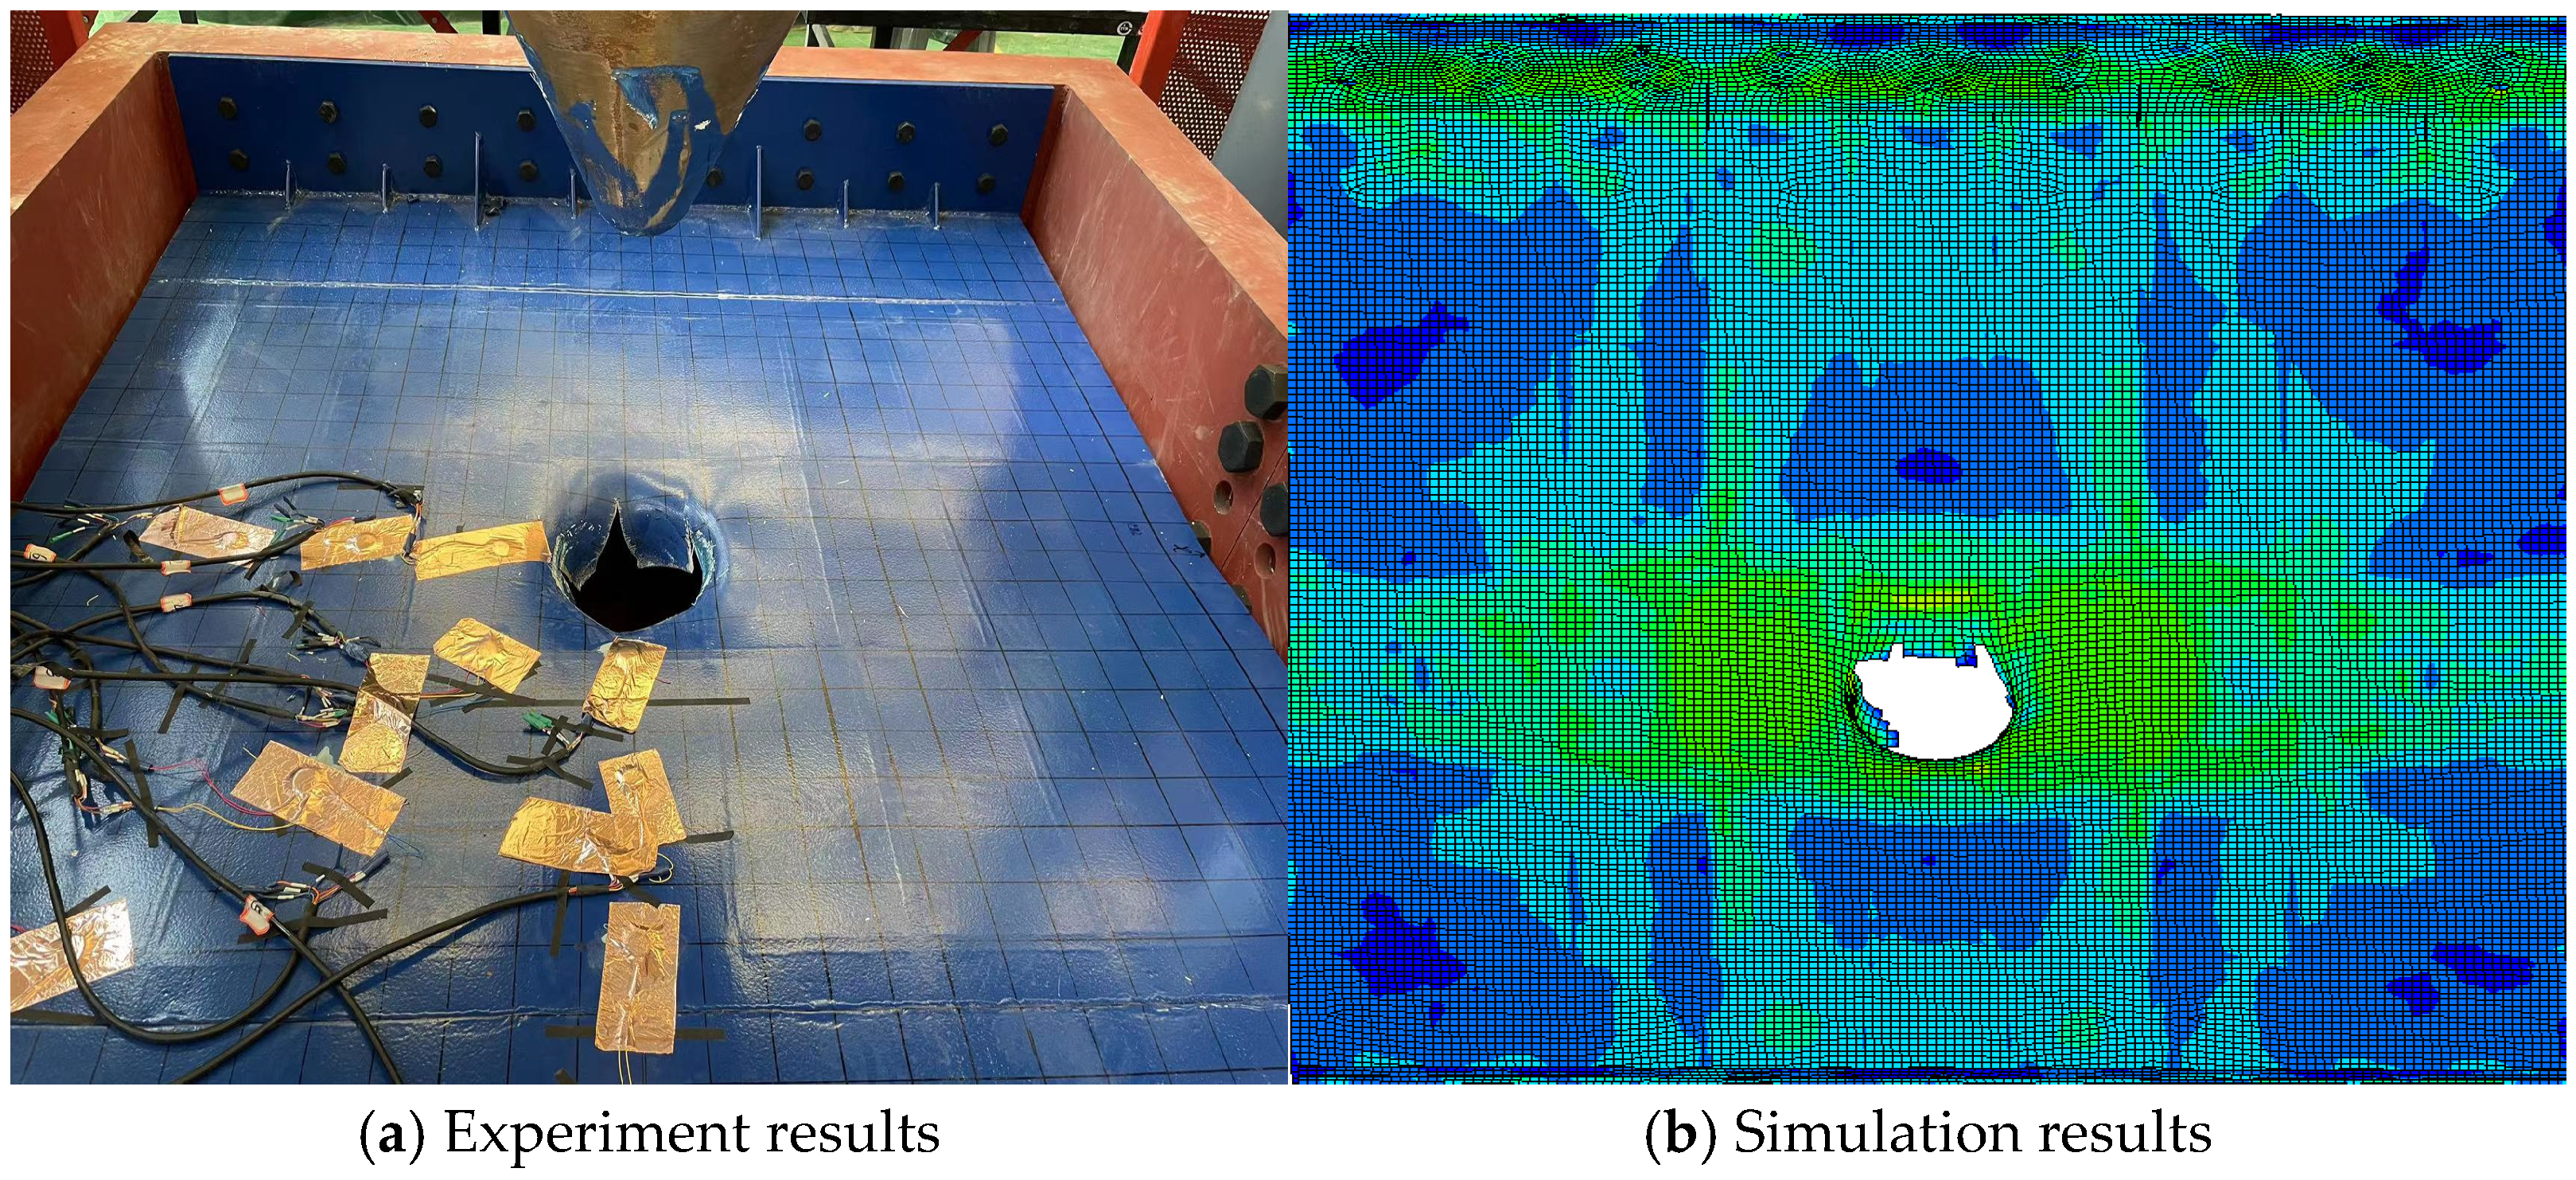
Figure 22.
Damage deformation under SP-1 working condition.
Figure 22.
Damage deformation under SP-1 working condition.
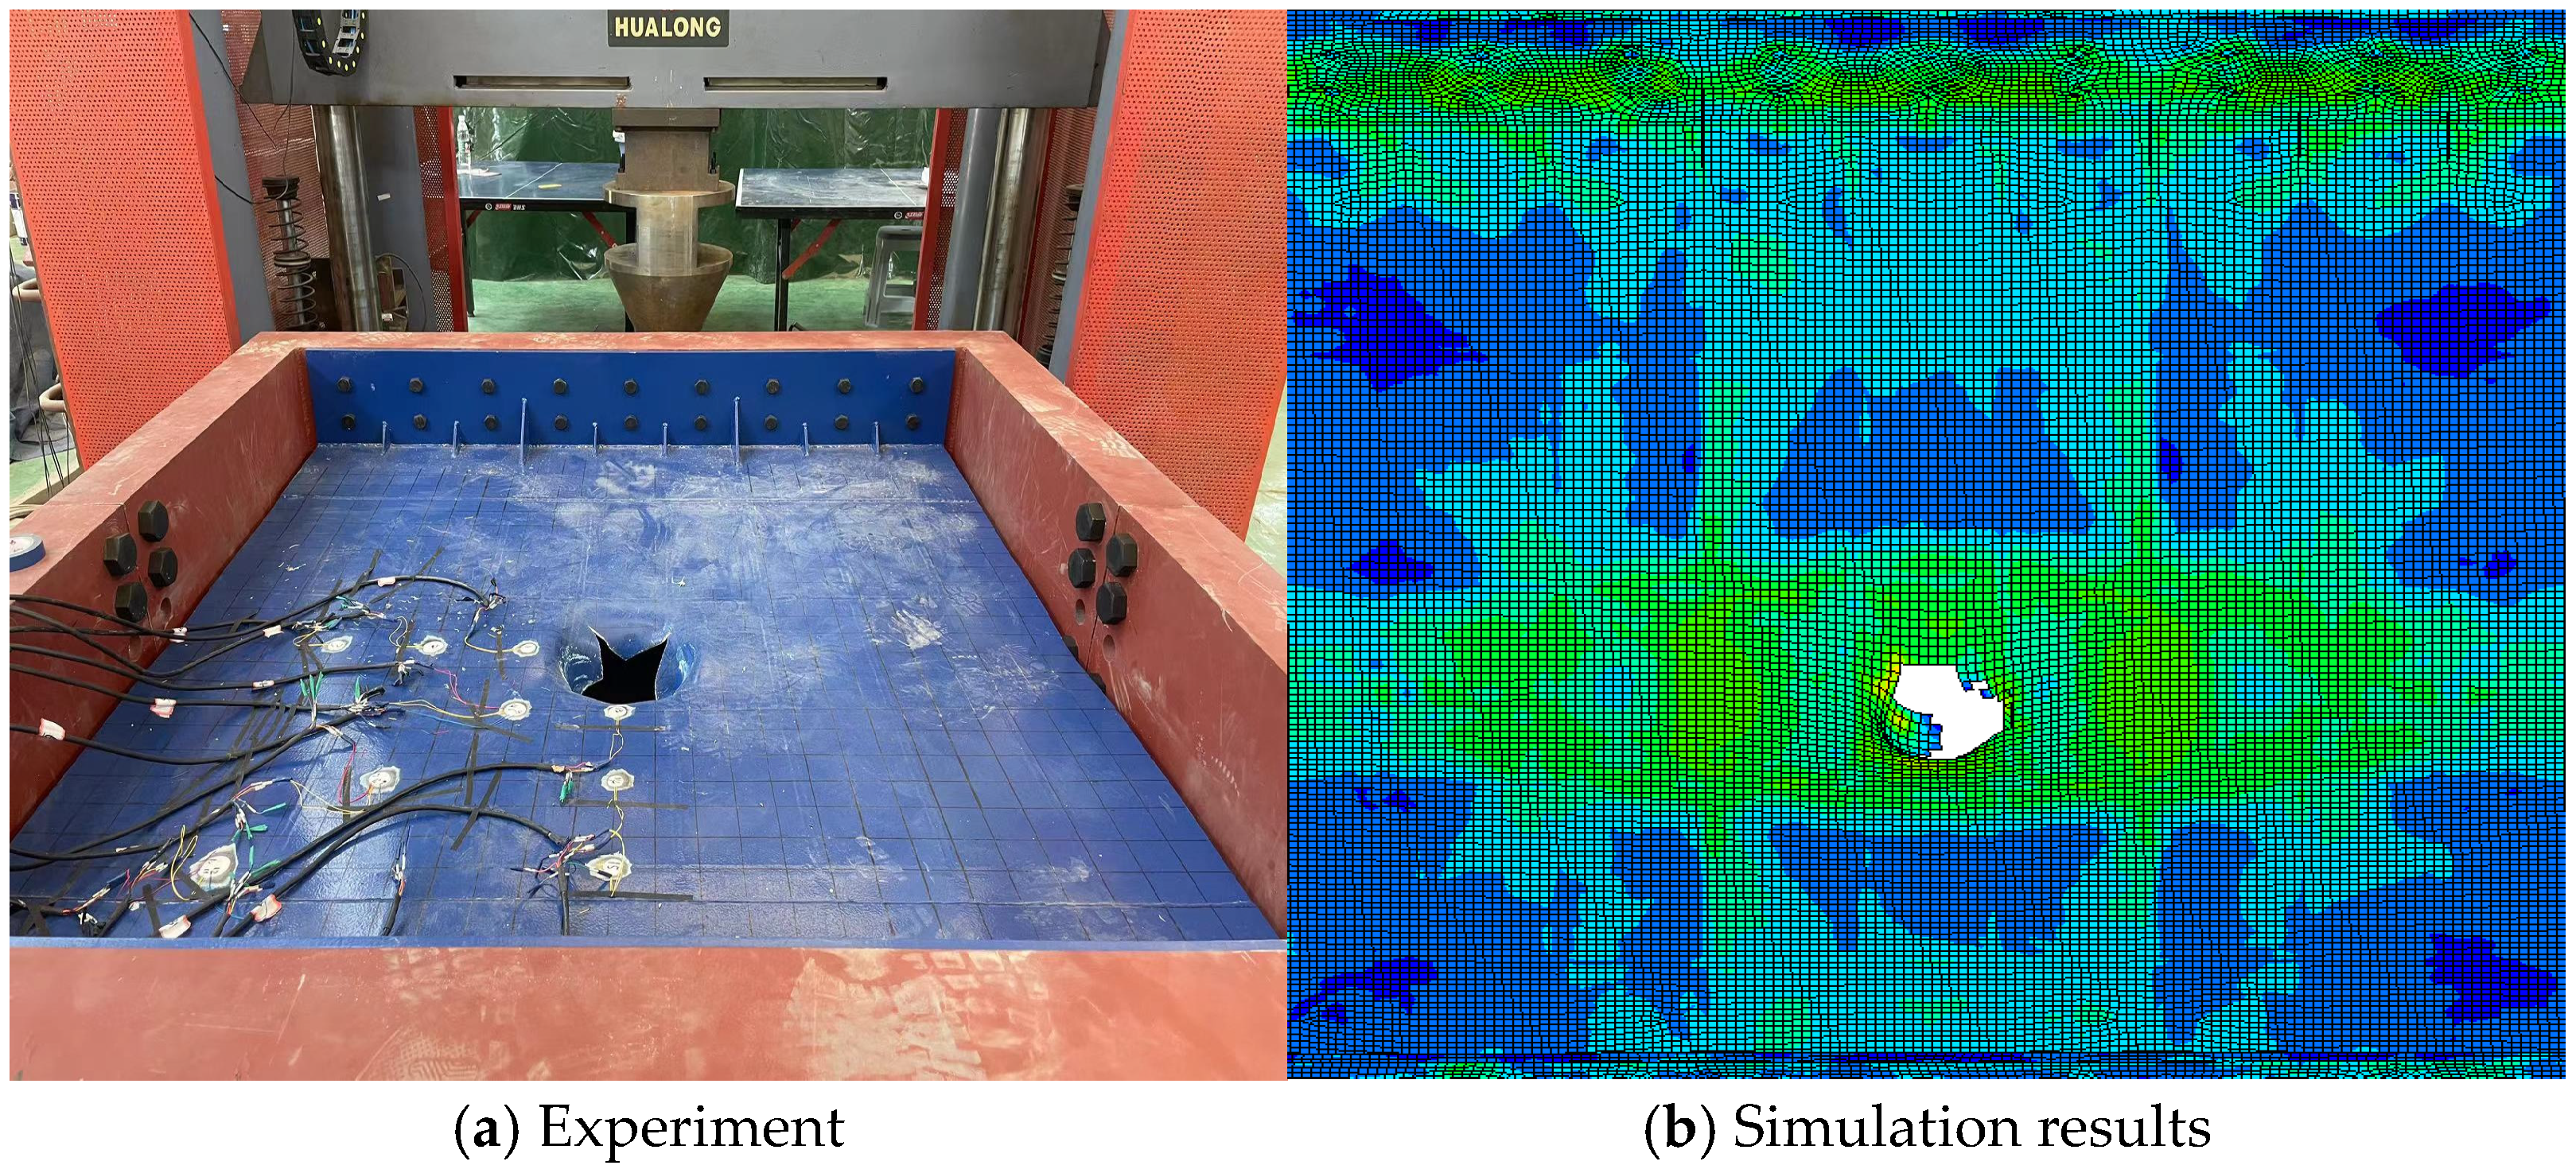
Figure 23.
Damage deformation under SP-2 working condition.
Figure 23.
Damage deformation under SP-2 working condition.
Figure 24.
Damage deformation under SP-3 working condition.
Figure 24.
Damage deformation under SP-3 working condition.
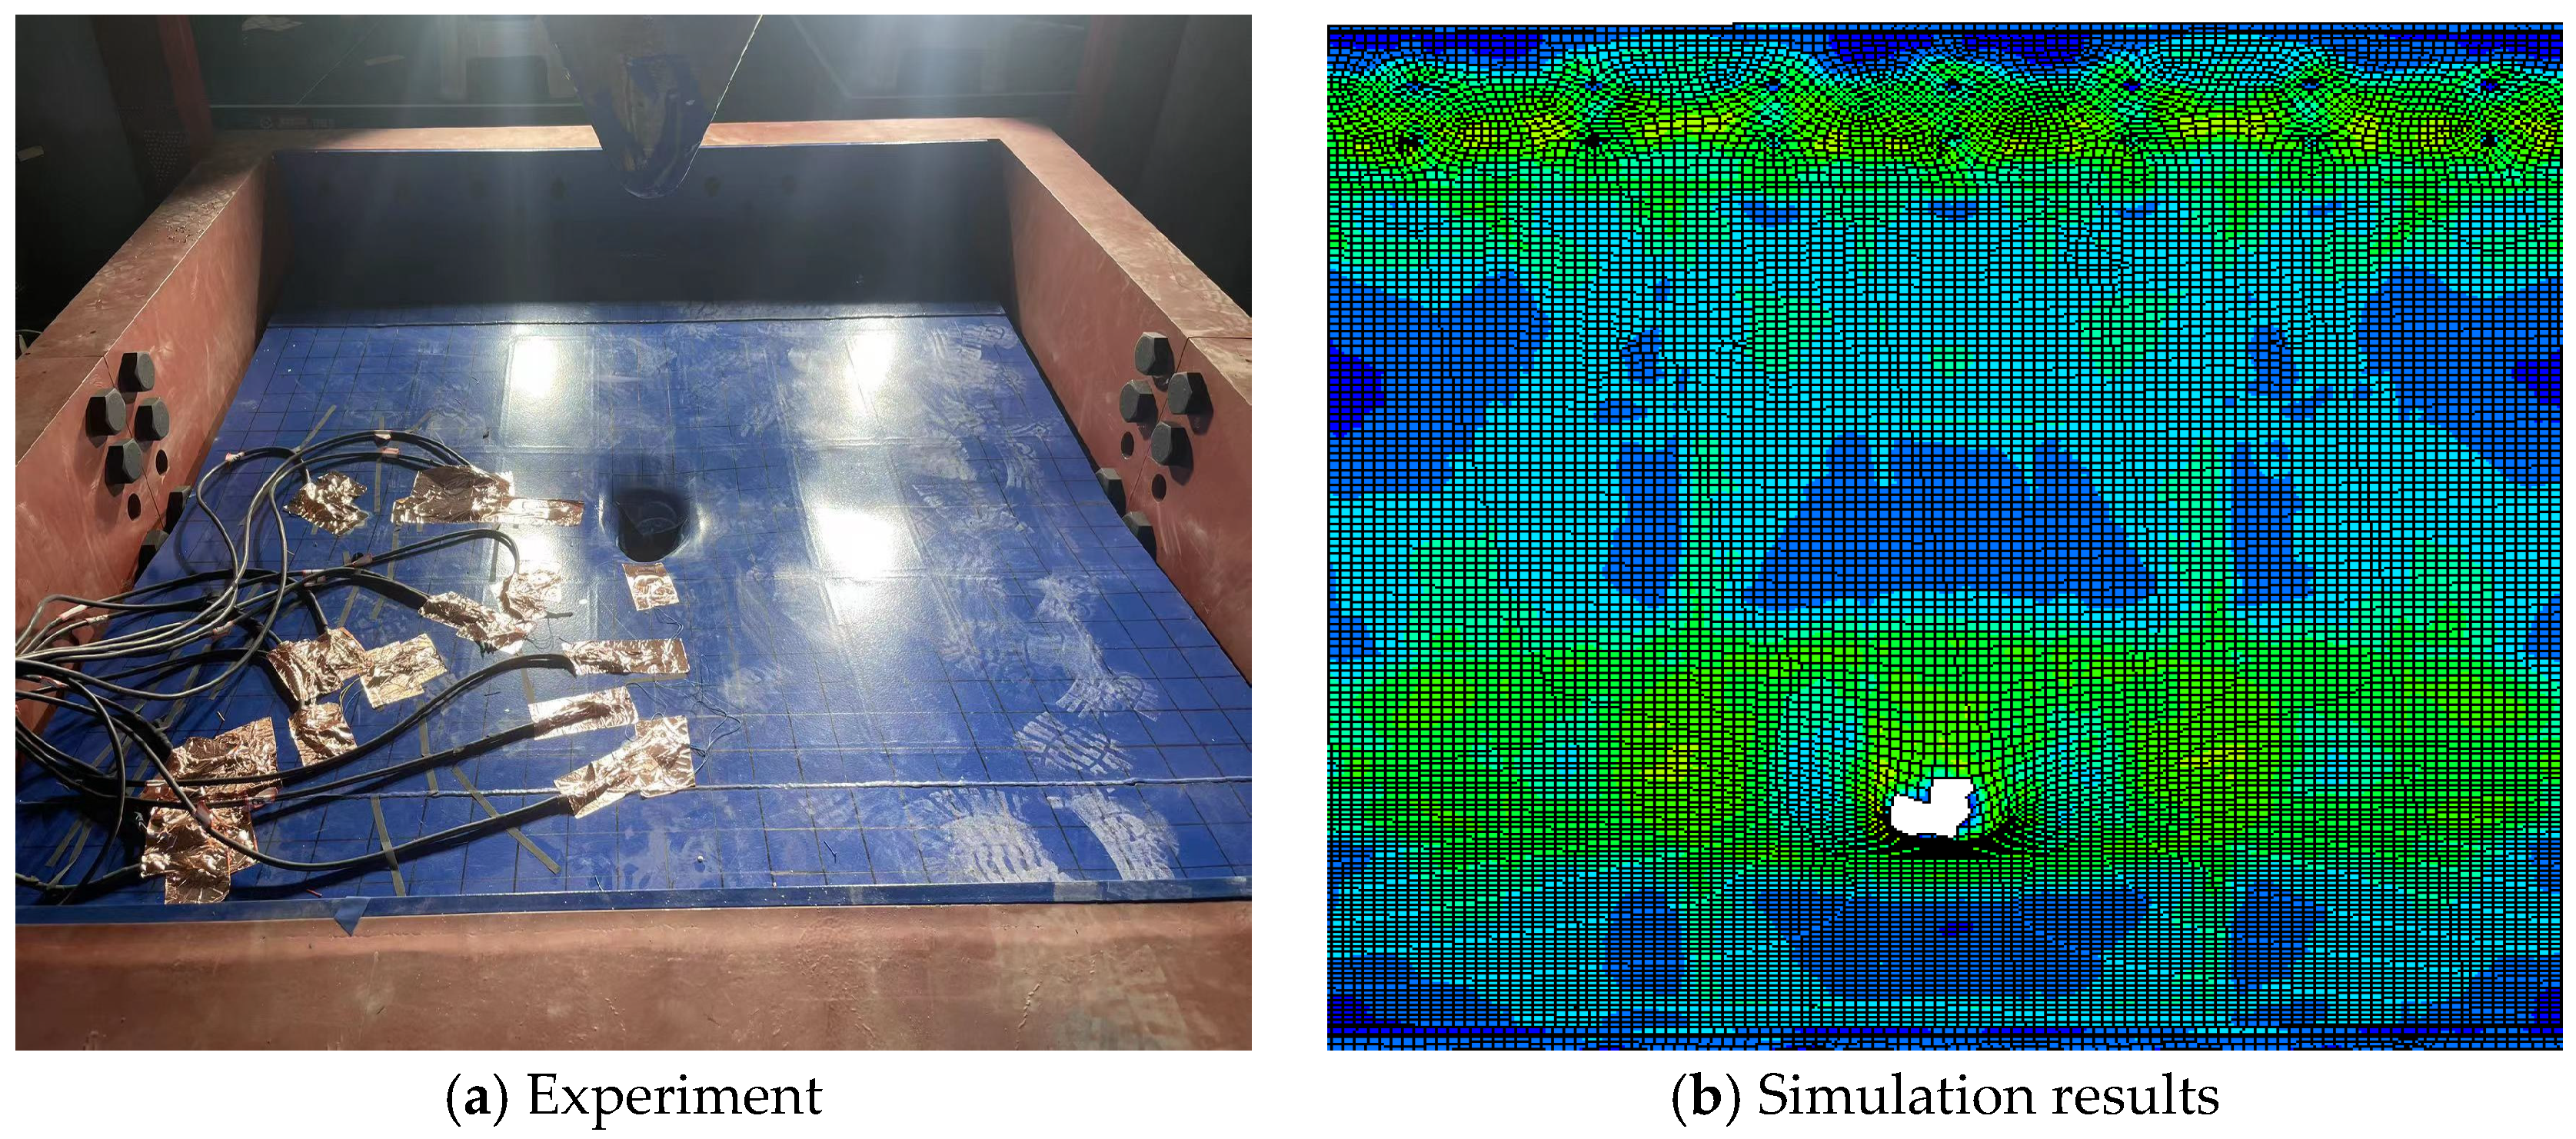
Figure 25.
Damage deformation under SP-4 working condition.
Figure 25.
Damage deformation under SP-4 working condition.
Figure 26.
Force–displacement comparison under various conditions.
Figure 26.
Force–displacement comparison under various conditions.
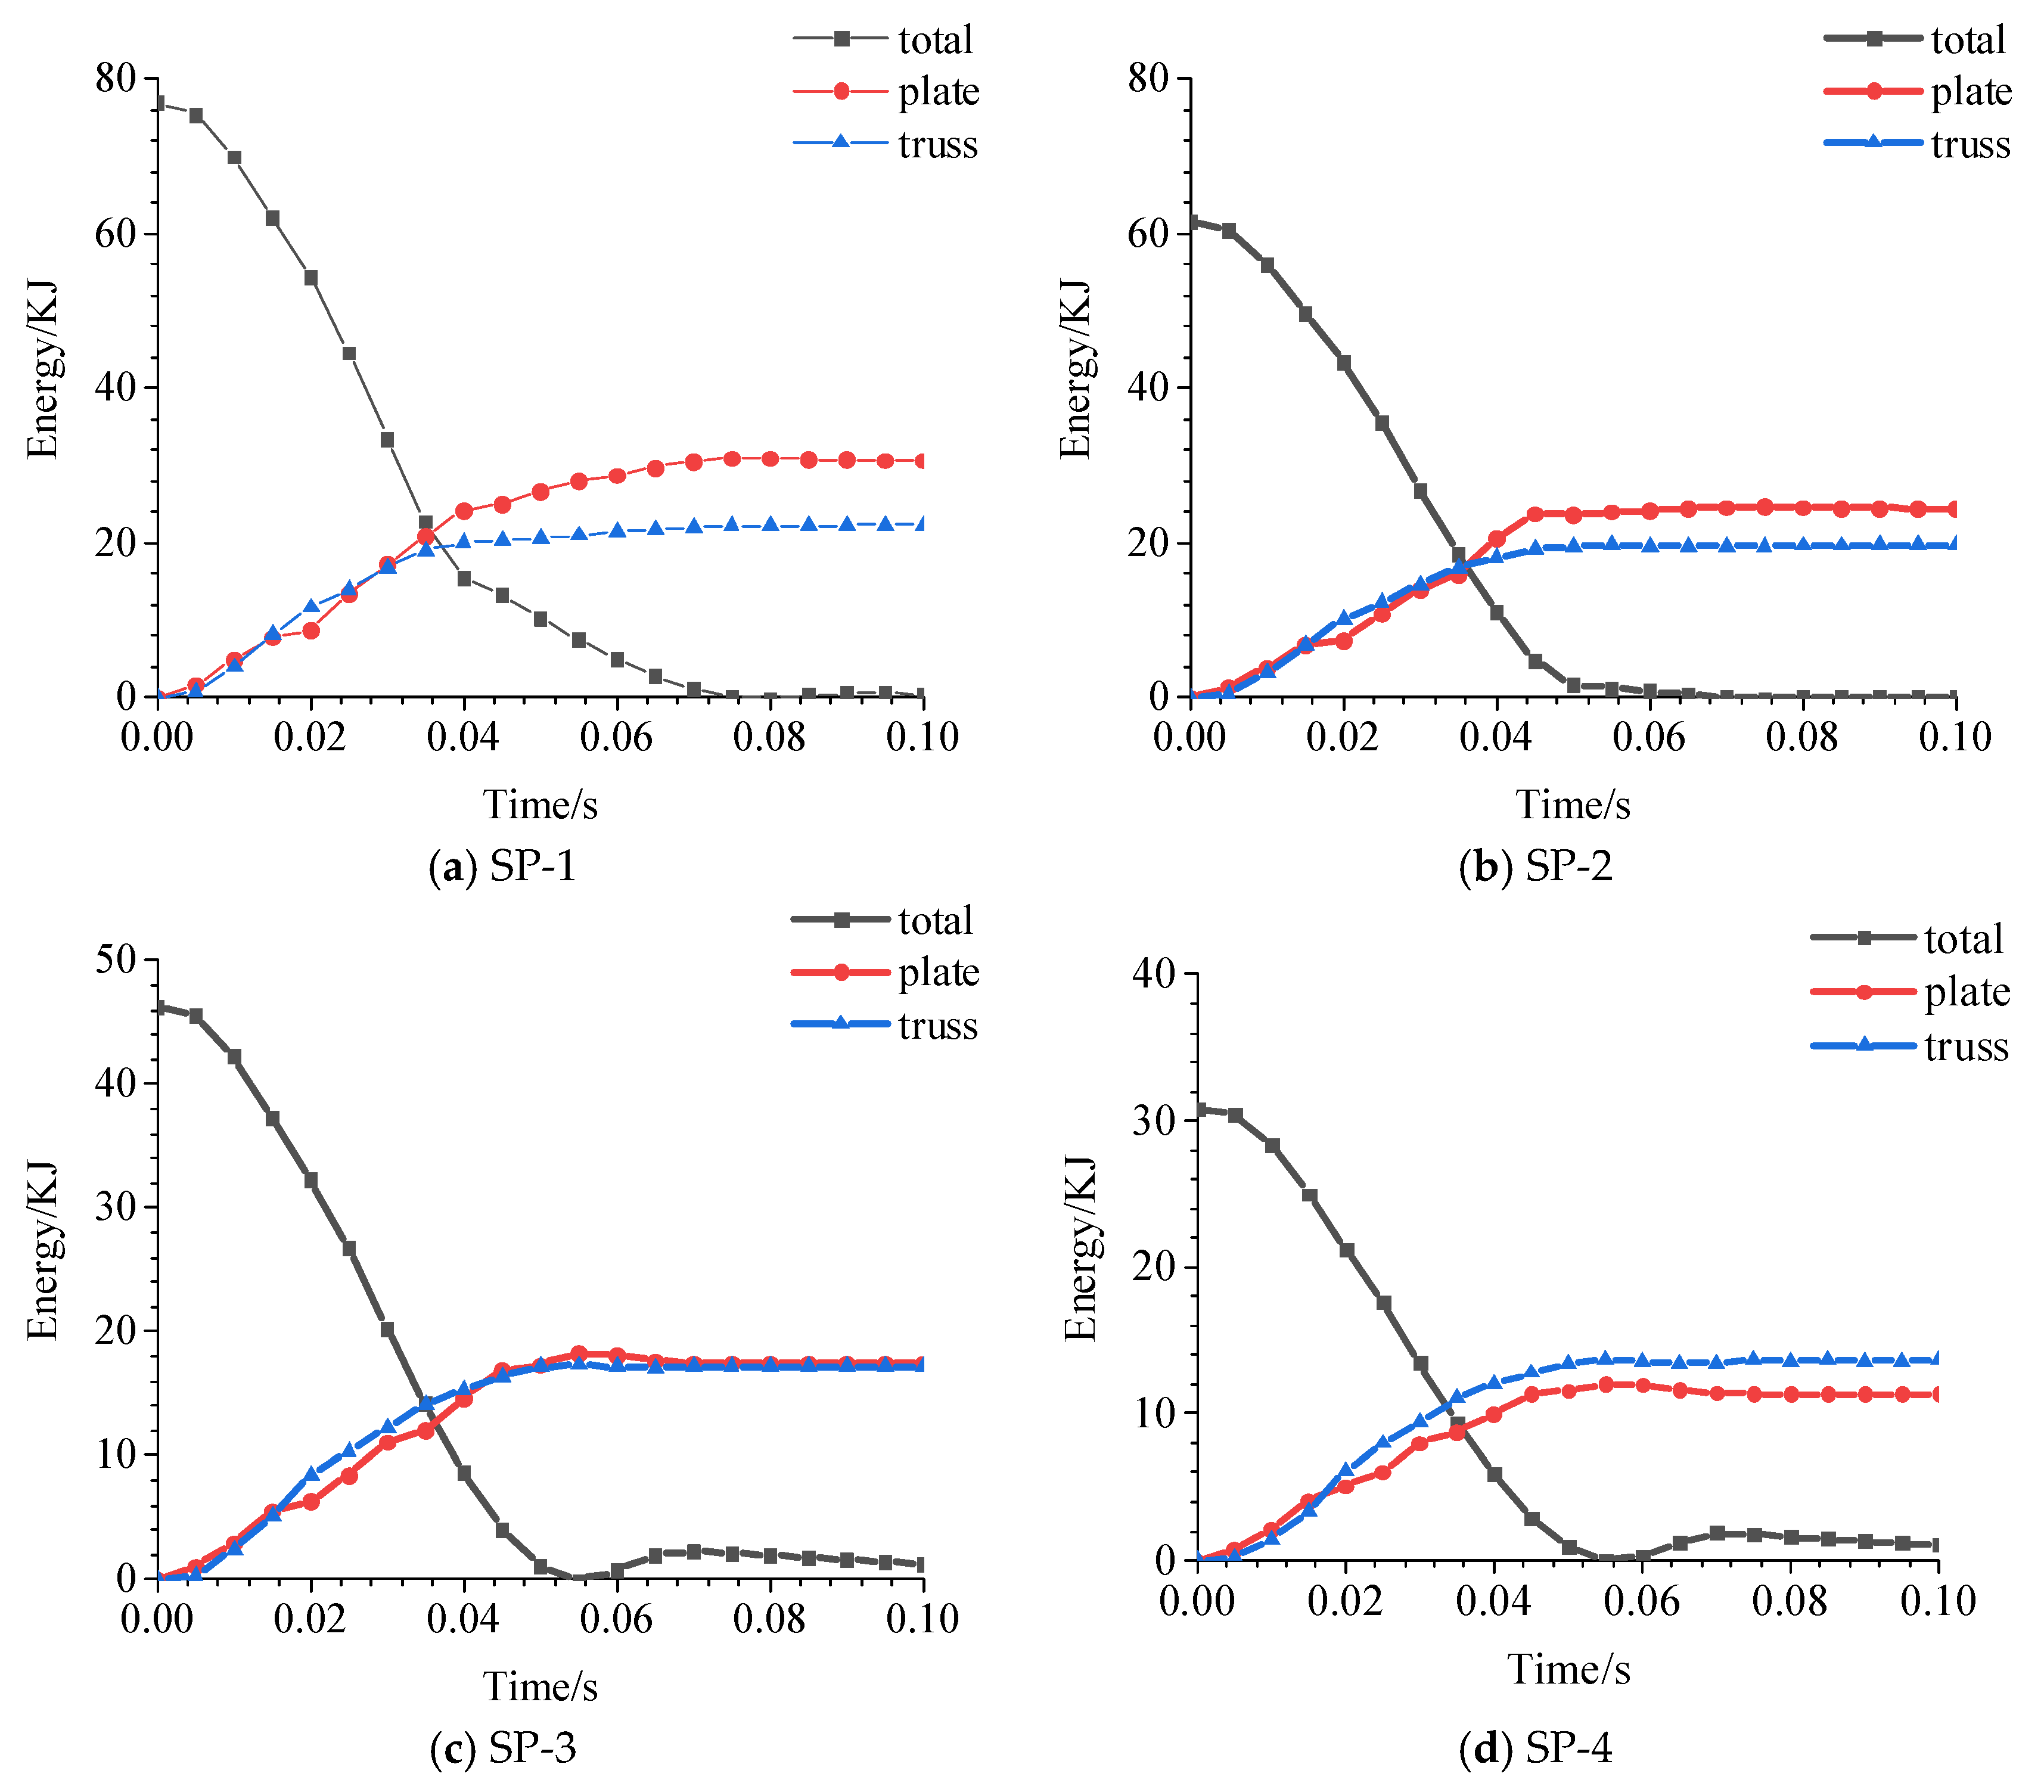
Figure 27.
Energy–time histories of total, plate, and truss components under various conditions.
Figure 27.
Energy–time histories of total, plate, and truss components under various conditions.
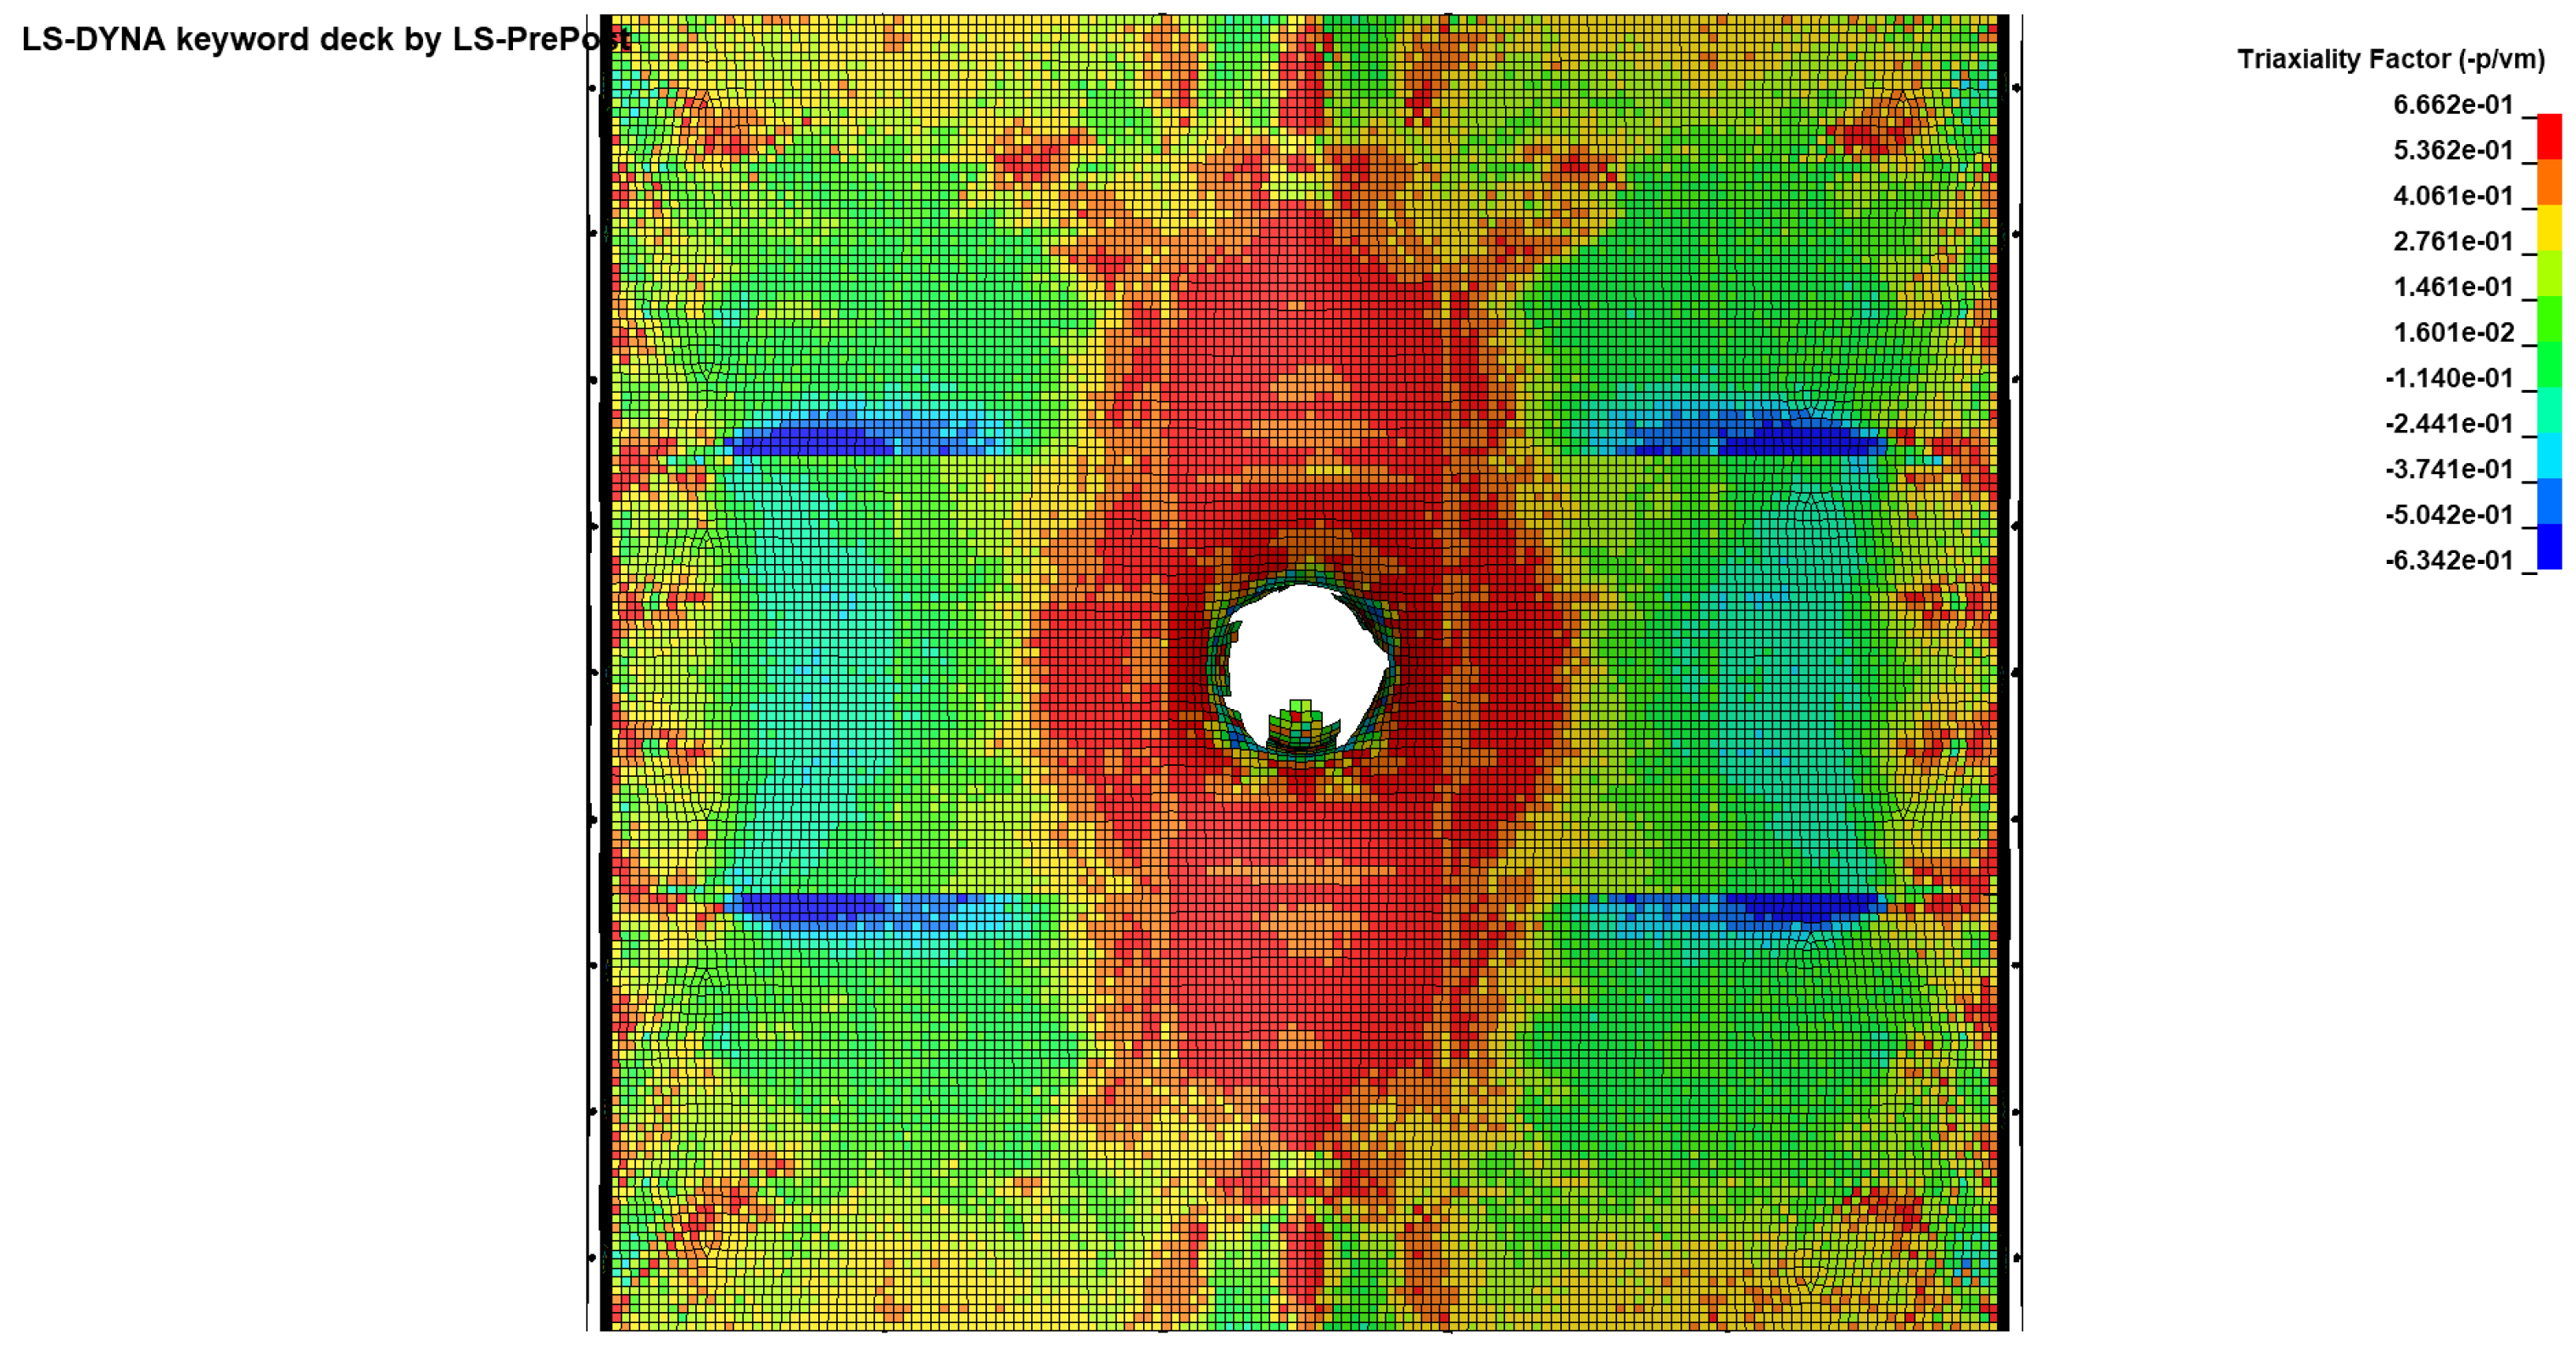
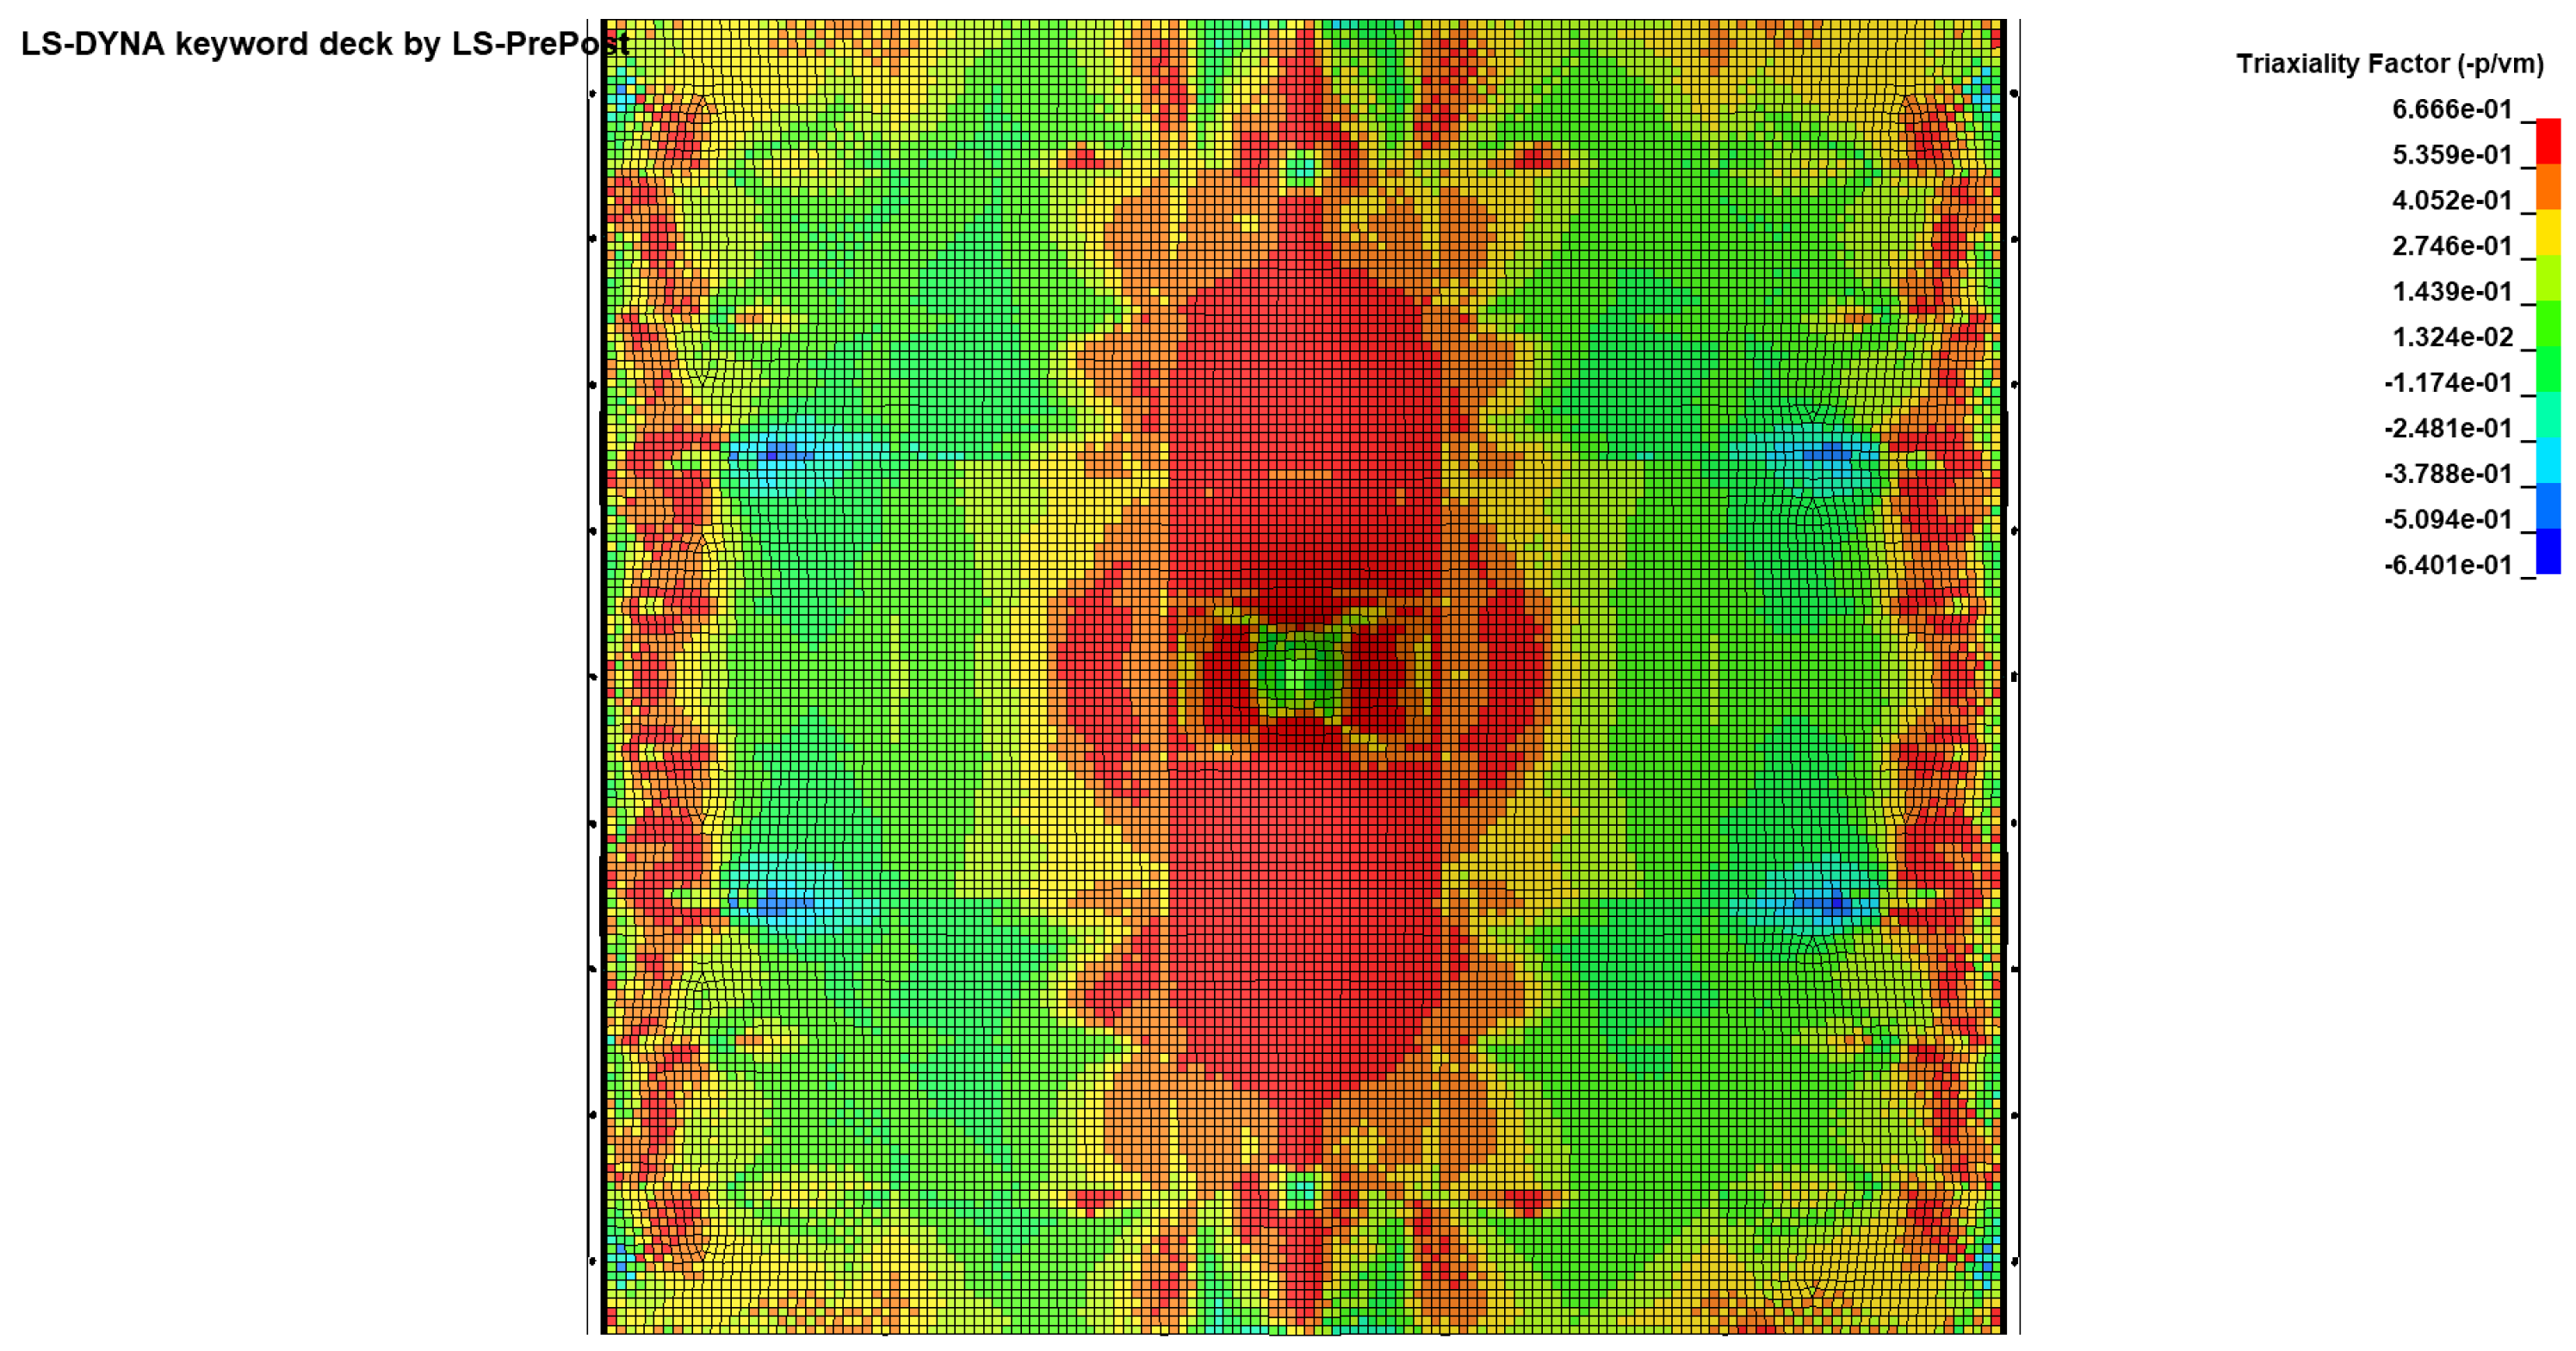
Figure 28.
Triaxiality distribution of specimen SP1.
Figure 28.
Triaxiality distribution of specimen SP1.
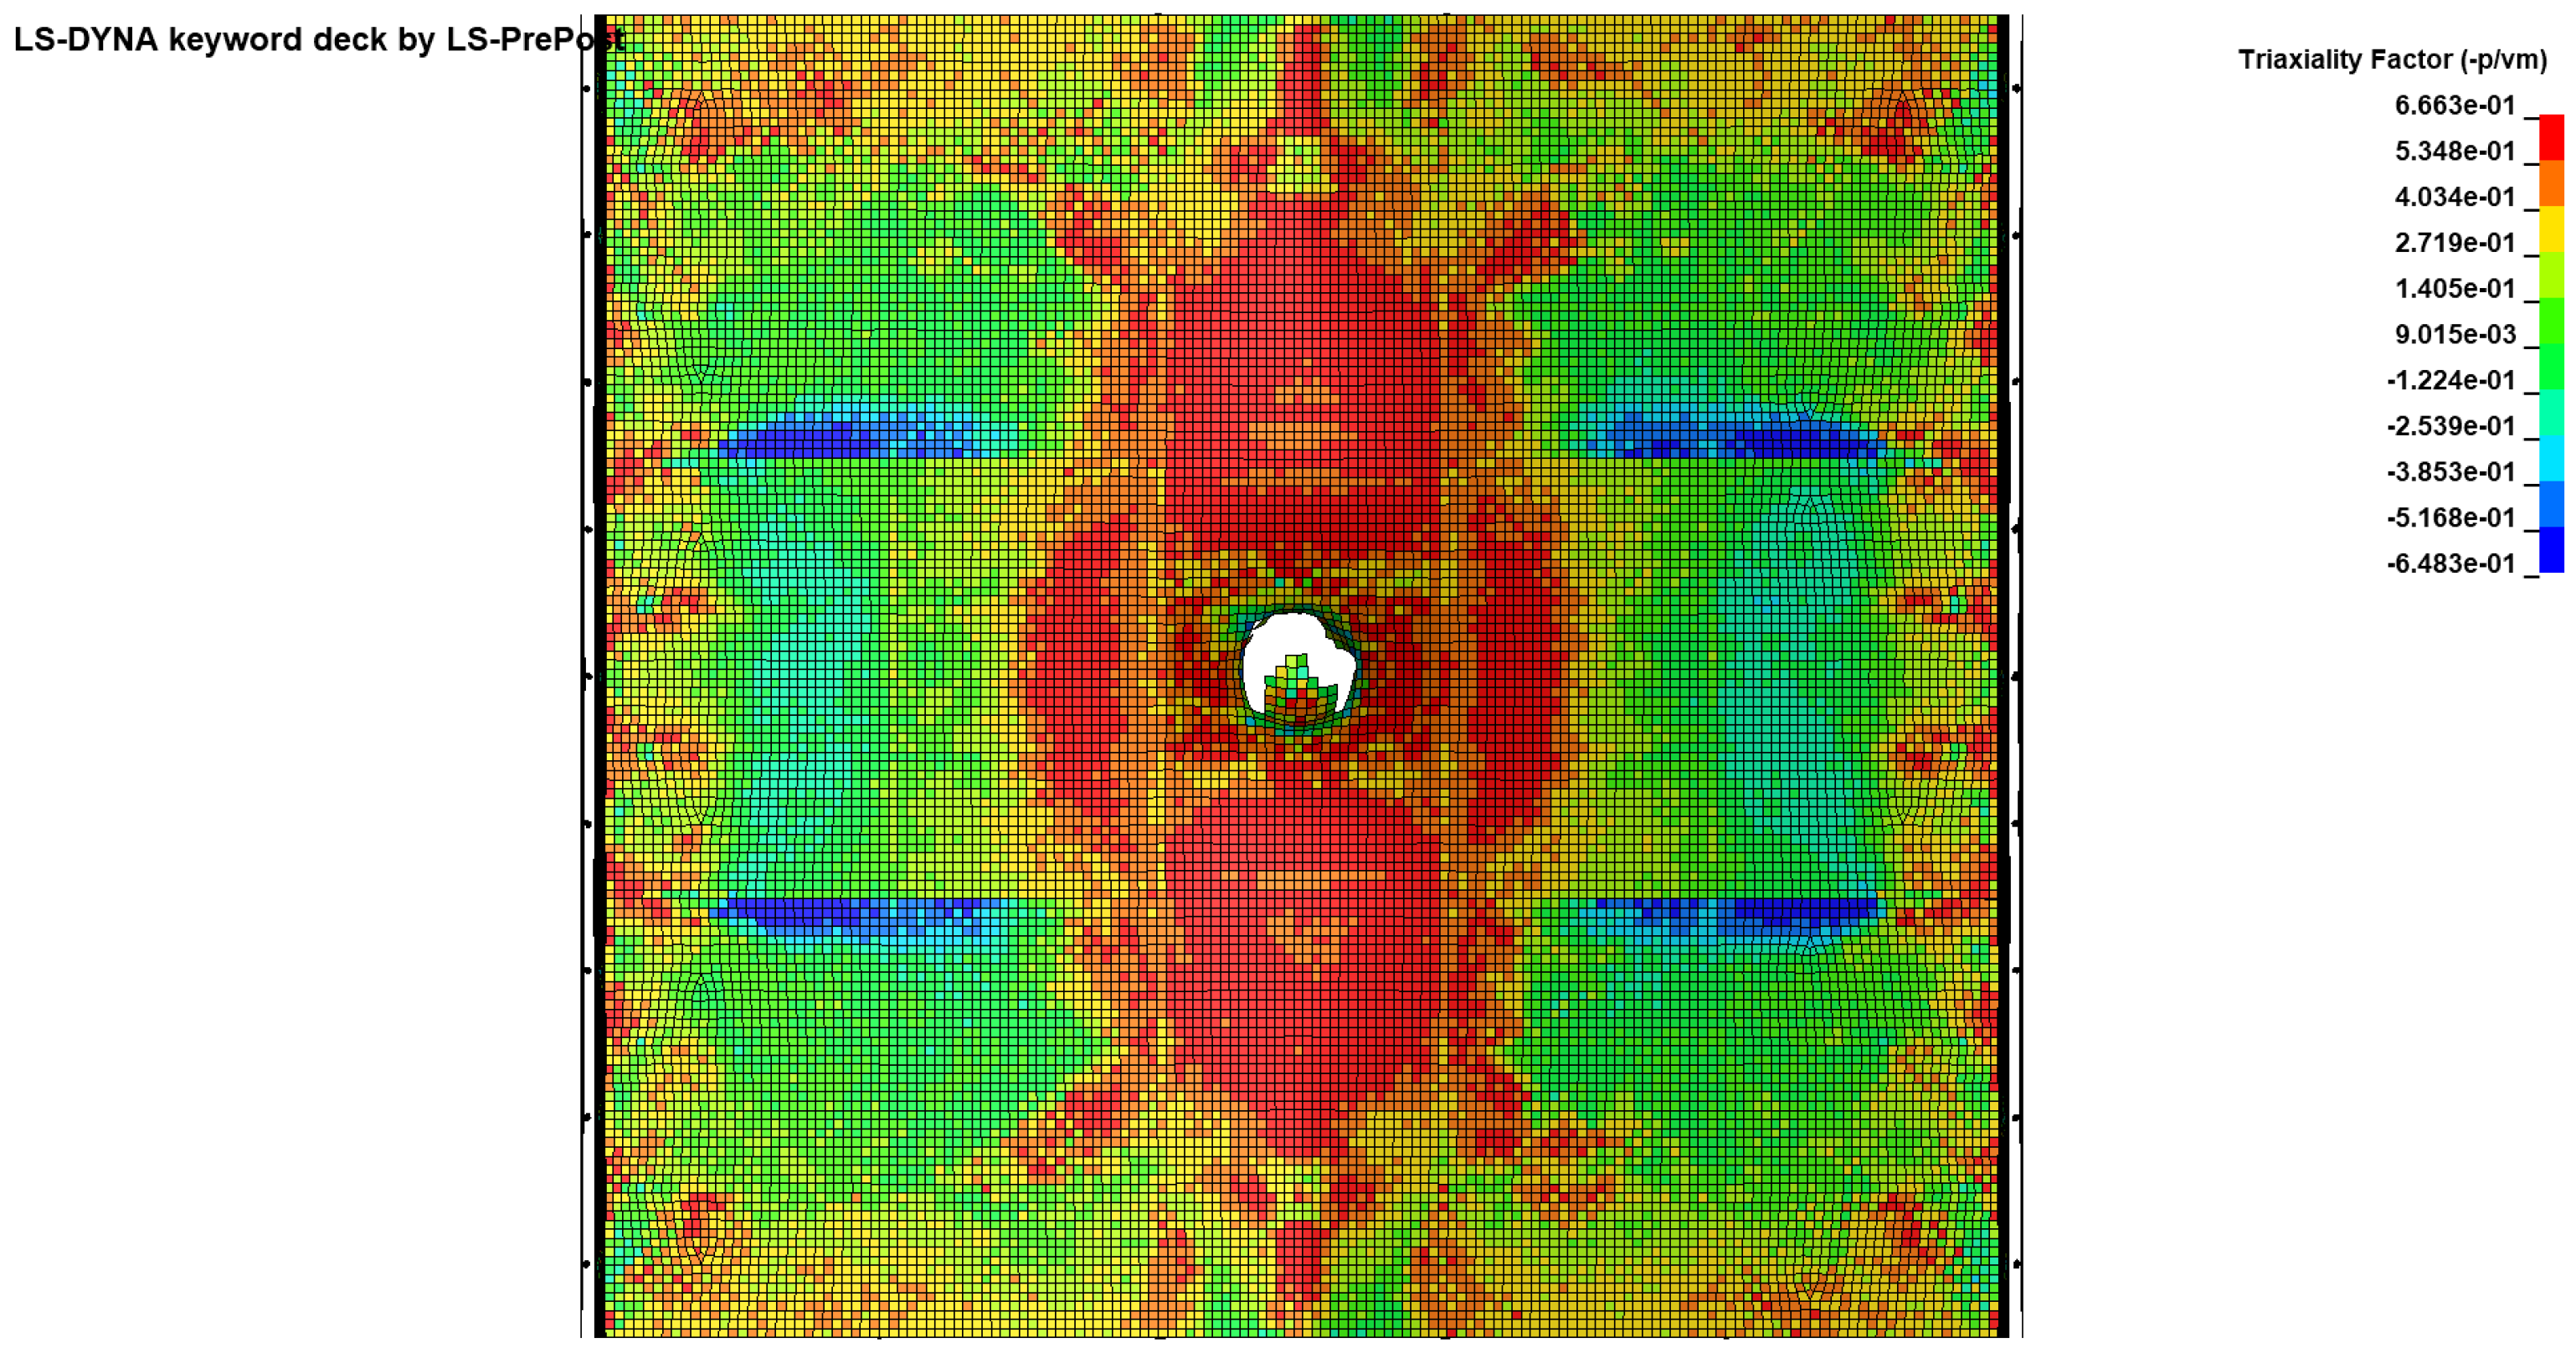
Figure 29.
Triaxiality distribution of specimen SP2.
Figure 29.
Triaxiality distribution of specimen SP2.
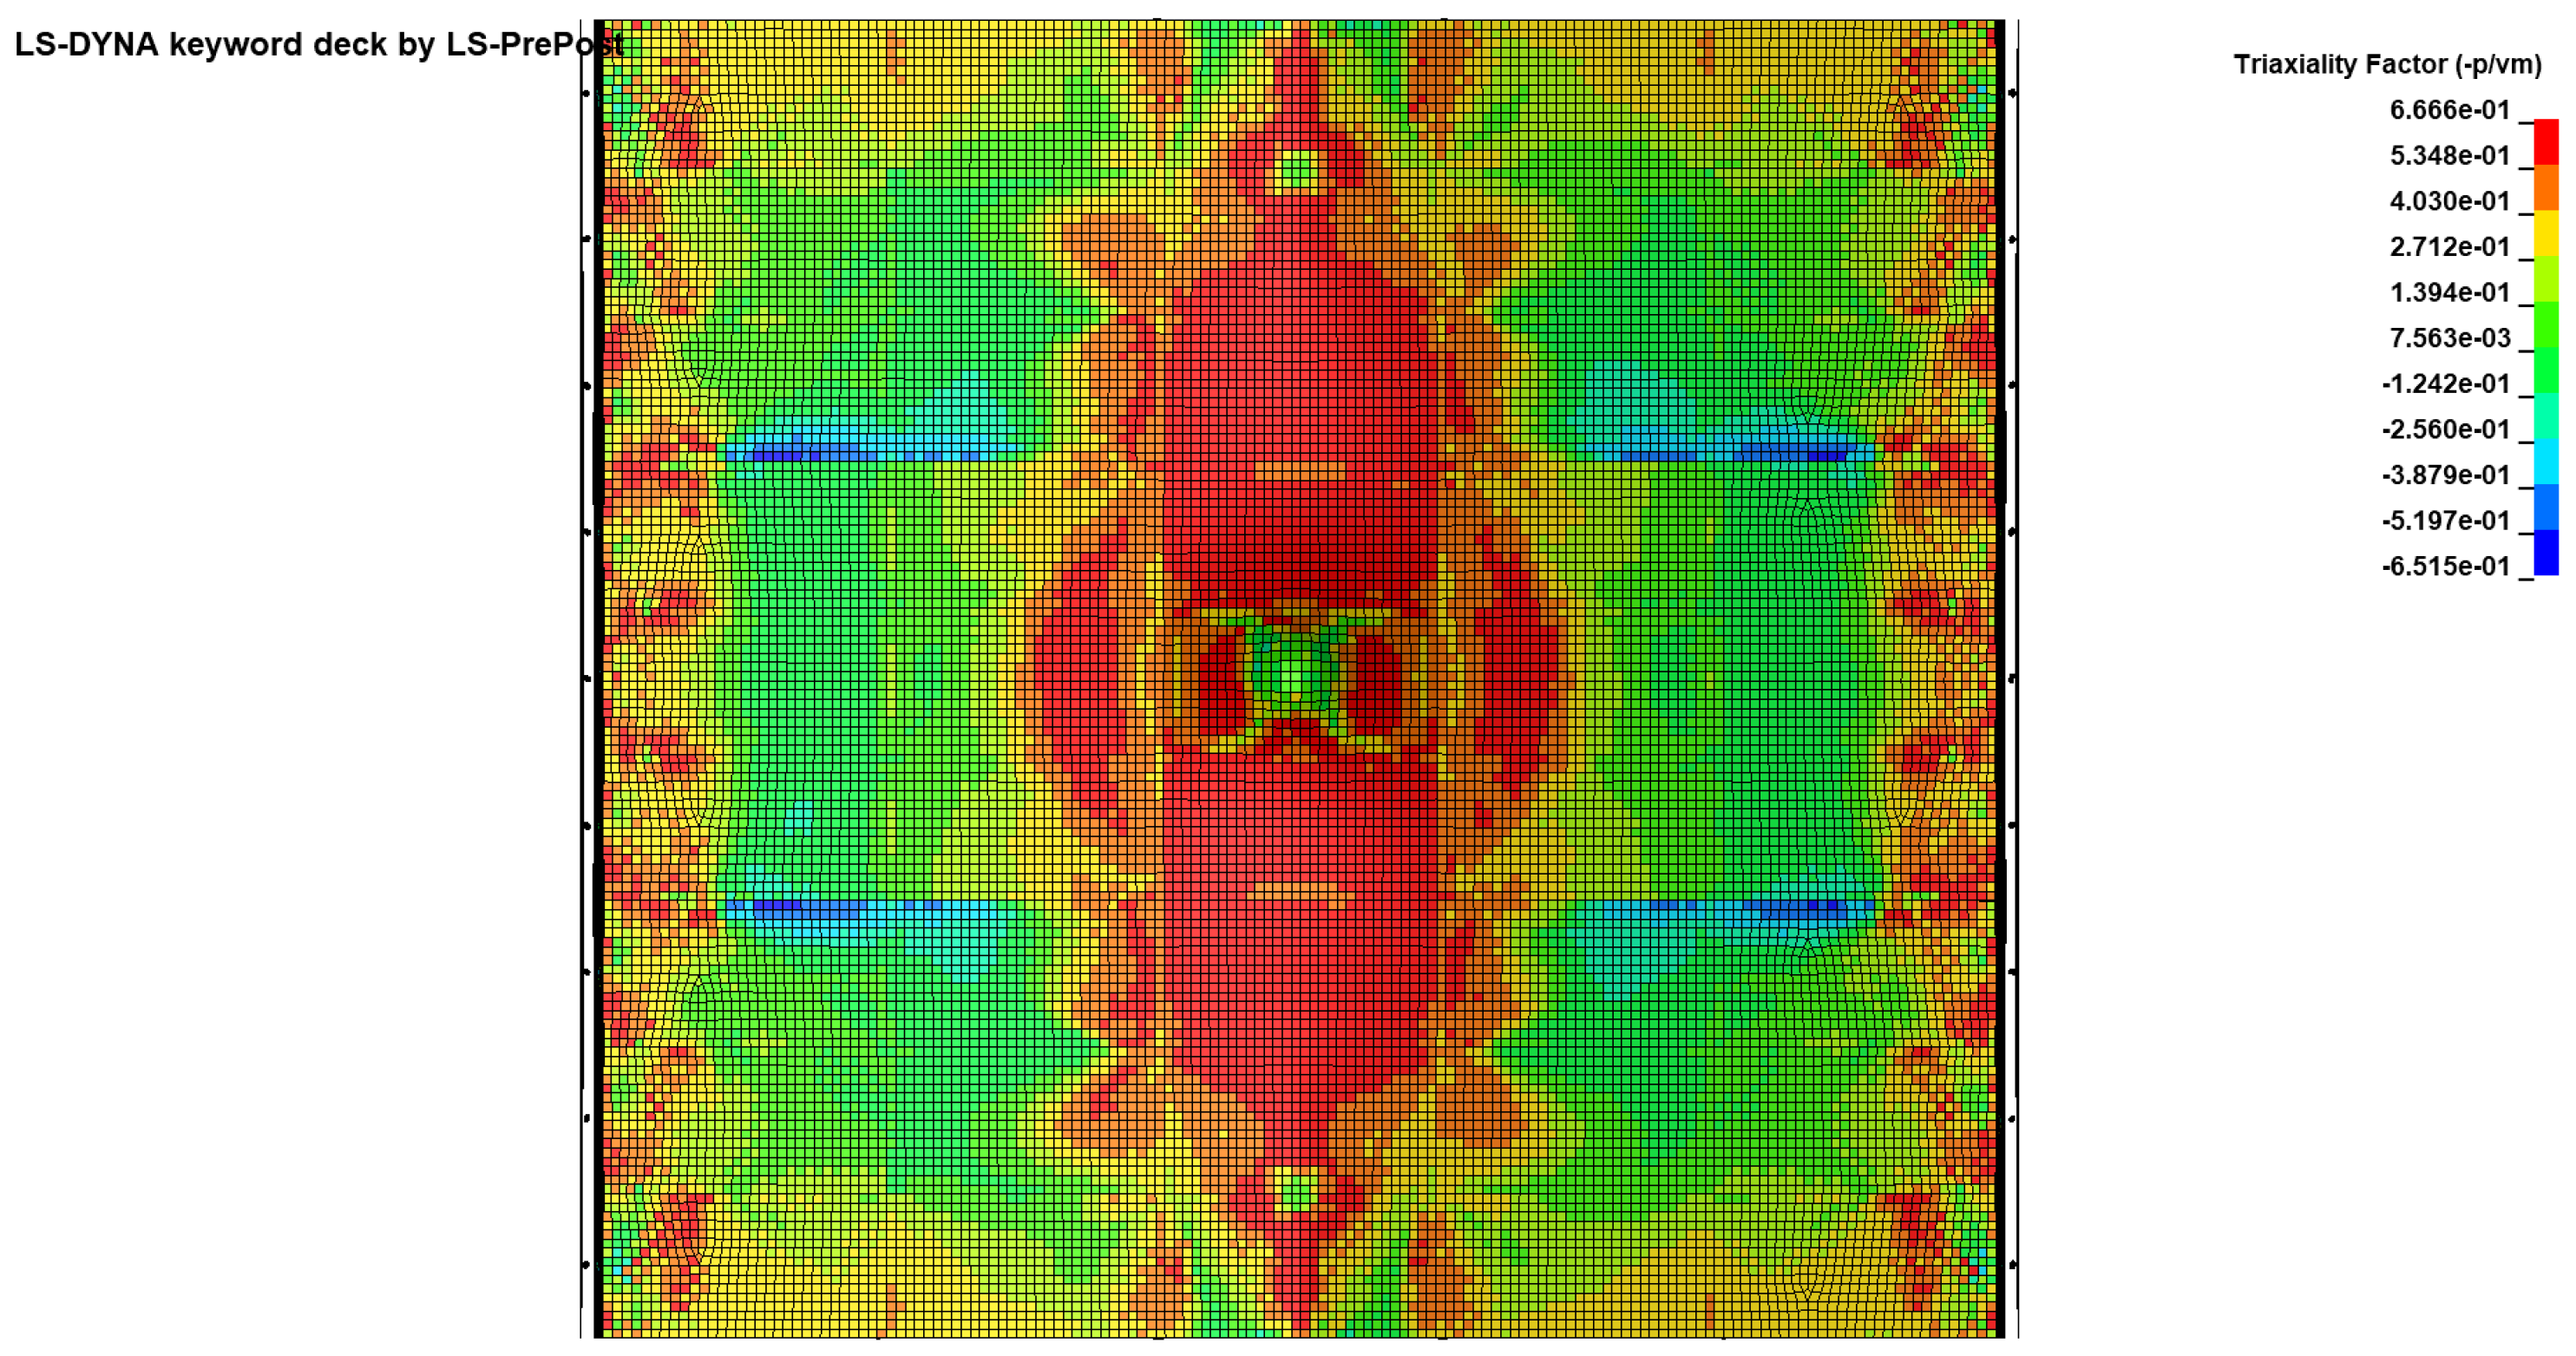
Figure 30.
Triaxiality distribution of specimen SP3.
Figure 30.
Triaxiality distribution of specimen SP3.
Figure 31.
Triaxiality distribution of specimen SP4.
Figure 31.
Triaxiality distribution of specimen SP4.
Table 1.
Model parameters of stiffened plate structure.
Table 1.
Model parameters of stiffened plate structure.
| Principal Dimensions | Bone Spacing | Truss Spacing | Rib Plate | Materials | Quantities |
|---|
| 1520 mm × 1520 mm × 6 mm | 151 mm | 463 mm | 292 mm | Q235 | 7 |
Table 2.
Specific parameters of conical hammer head.
Table 2.
Specific parameters of conical hammer head.
| Hammer Head Type | Base Diameter | Top Diameter | Altitude | Materials | Quantities |
|---|
| Conical hammer head | 400 mm | 50 mm | 311 mm | Q235 | 1 |
Table 3.
Test scheme and working conditions.
Table 3.
Test scheme and working conditions.
| Teat Conditions | Condition Name | Experimental Explanation |
|---|
| 1 | SP-1 | The impact mass is 1.35 t, and the initial falling height is 2.5 m |
| 2 | SP-2 | The impact mass is 1.35 t, and the initial falling height is 2.0 m |
| 3 | SP-3 | The impact mass is 1.35 t, and the initial falling height is 1.5 m |
| 4 | SP-4 | The impact mass is 1.35 t, and the initial falling height is 1.0 m |
Table 4.
Peak value of impact force, energy, and failure displacement under different working conditions.
Table 4.
Peak value of impact force, energy, and failure displacement under different working conditions.
| Teat Conditions | Peak Impact Force (KN) | Energy (KJ) | Failure Displacement (m) |
|---|
| SP-1 | 501.54 | 61.11 | 0.25 |
| SP-2 | 606.62 | 62.89 | 0.23 |
| SP-3 | 548.56 | 43.09 | 0.18 |
| SP-4 | 429.06 | 16.44 | 0.06 |
Table 5.
Dimensions of the damage shape under different working conditions.
Table 5.
Dimensions of the damage shape under different working conditions.
| Test Conditions | SP-1 | SP-2 | SP-3 | SP-4 |
|---|
| Dimensions of the damage shape (mm) | x | 225 | 198 | 153 | 141 |
| y | 152 | 151 | 148 | 102 |
Table 6.
The dimension parameters of drop-weight impact model.
Table 6.
The dimension parameters of drop-weight impact model.
| Reinforcement Plate/mm | Head-Banging |
|---|
| Plate Length | Plate Width | Plate Thickness | Tendon Length | Truss Size | Bone Size/mm | Top Diameter/mm | Mass/kg |
|---|
| 1500 | 1040 | 6 | 1500 | | 1500 × 45 × 5 | 100 | 1350 |
Table 7.
Summary of model nodes and degrees of freedom.
Table 7.
Summary of model nodes and degrees of freedom.
| Description | Value |
|---|
| Total number of nodes | 64,879 |
| Total number of elements | 63,942 |
| Degrees of freedom per node | 6 |
| Total degrees of freedom | 38,9274 |
| Global element size | 10 mm × 10 mm |
Table 8.
Comparison of damage shapes between test and simulation results.
Table 8.
Comparison of damage shapes between test and simulation results.
| Condition Number | The Size and Area of the Damage |
|---|
| Experiment | Simulation | Error of Break Area |
|---|
| x (mm) | y (mm) | A (mm2) | x (mm) | y (mm) | A (mm2) |
|---|
| SP-1 | 225 | 152 | 34,200 | 240 | 160 | 38,400 | −10.94% |
| SP-2 | 198 | 151 | 29,898 | 210 | 158 | 33,180 | −9.89% |
| SP-3 | 153 | 148 | 22,644 | 159 | 157 | 24,963 | −9.29% |
| SP-4 | 141 | 102 | 14,382 | 150 | 110 | 16,500 | −12.84% |
Table 9.
Comparison of peak impact force between test and simulation.
Table 9.
Comparison of peak impact force between test and simulation.
| Condition Number | Impact Force Peak/kN |
|---|
| Experiment | Simulation | Error |
|---|
| SP-1 | 501.54 | 534.98 | −6.25% |
| SP-2 | 606.62 | 593.01 | 2.30% |
| SP-3 | 548.56 | 525.32 | 4.42% |
| SP-4 | 429.06 | 389.58 | 10.13% |
Table 10.
Energy distribution and loss ratio under different impact conditions.
Table 10.
Energy distribution and loss ratio under different impact conditions.
| Condition Number | Energy/kJ |
|---|
| Total | Plate | Truss | Energy Loss Ratio |
|---|
| SP-1 | 77.06 | 31.05 | 22.33 | 30.73% |
| SP-2 | 61.65 | 24.71 | 17.73 | 31.16% |
| SP-3 | 46.23 | 17.47 | 17.25 | 24.89% |
| SP-4 | 30.82 | 11.37 | 13.64 | 18.58% |


