3.2.1. Numerical Model Flow Velocity
Using Delft3D, three MATLAB data files were created to represent the 96 h period from 00:00 on 23 July to 00:00 on 27 July. These files include flow velocity data for the entire domain under three conditions: flow velocity due to storm surge
, flow velocity due to astronomical tide
, and flow velocity resulting from the coupling of storm surge and astronomical tide
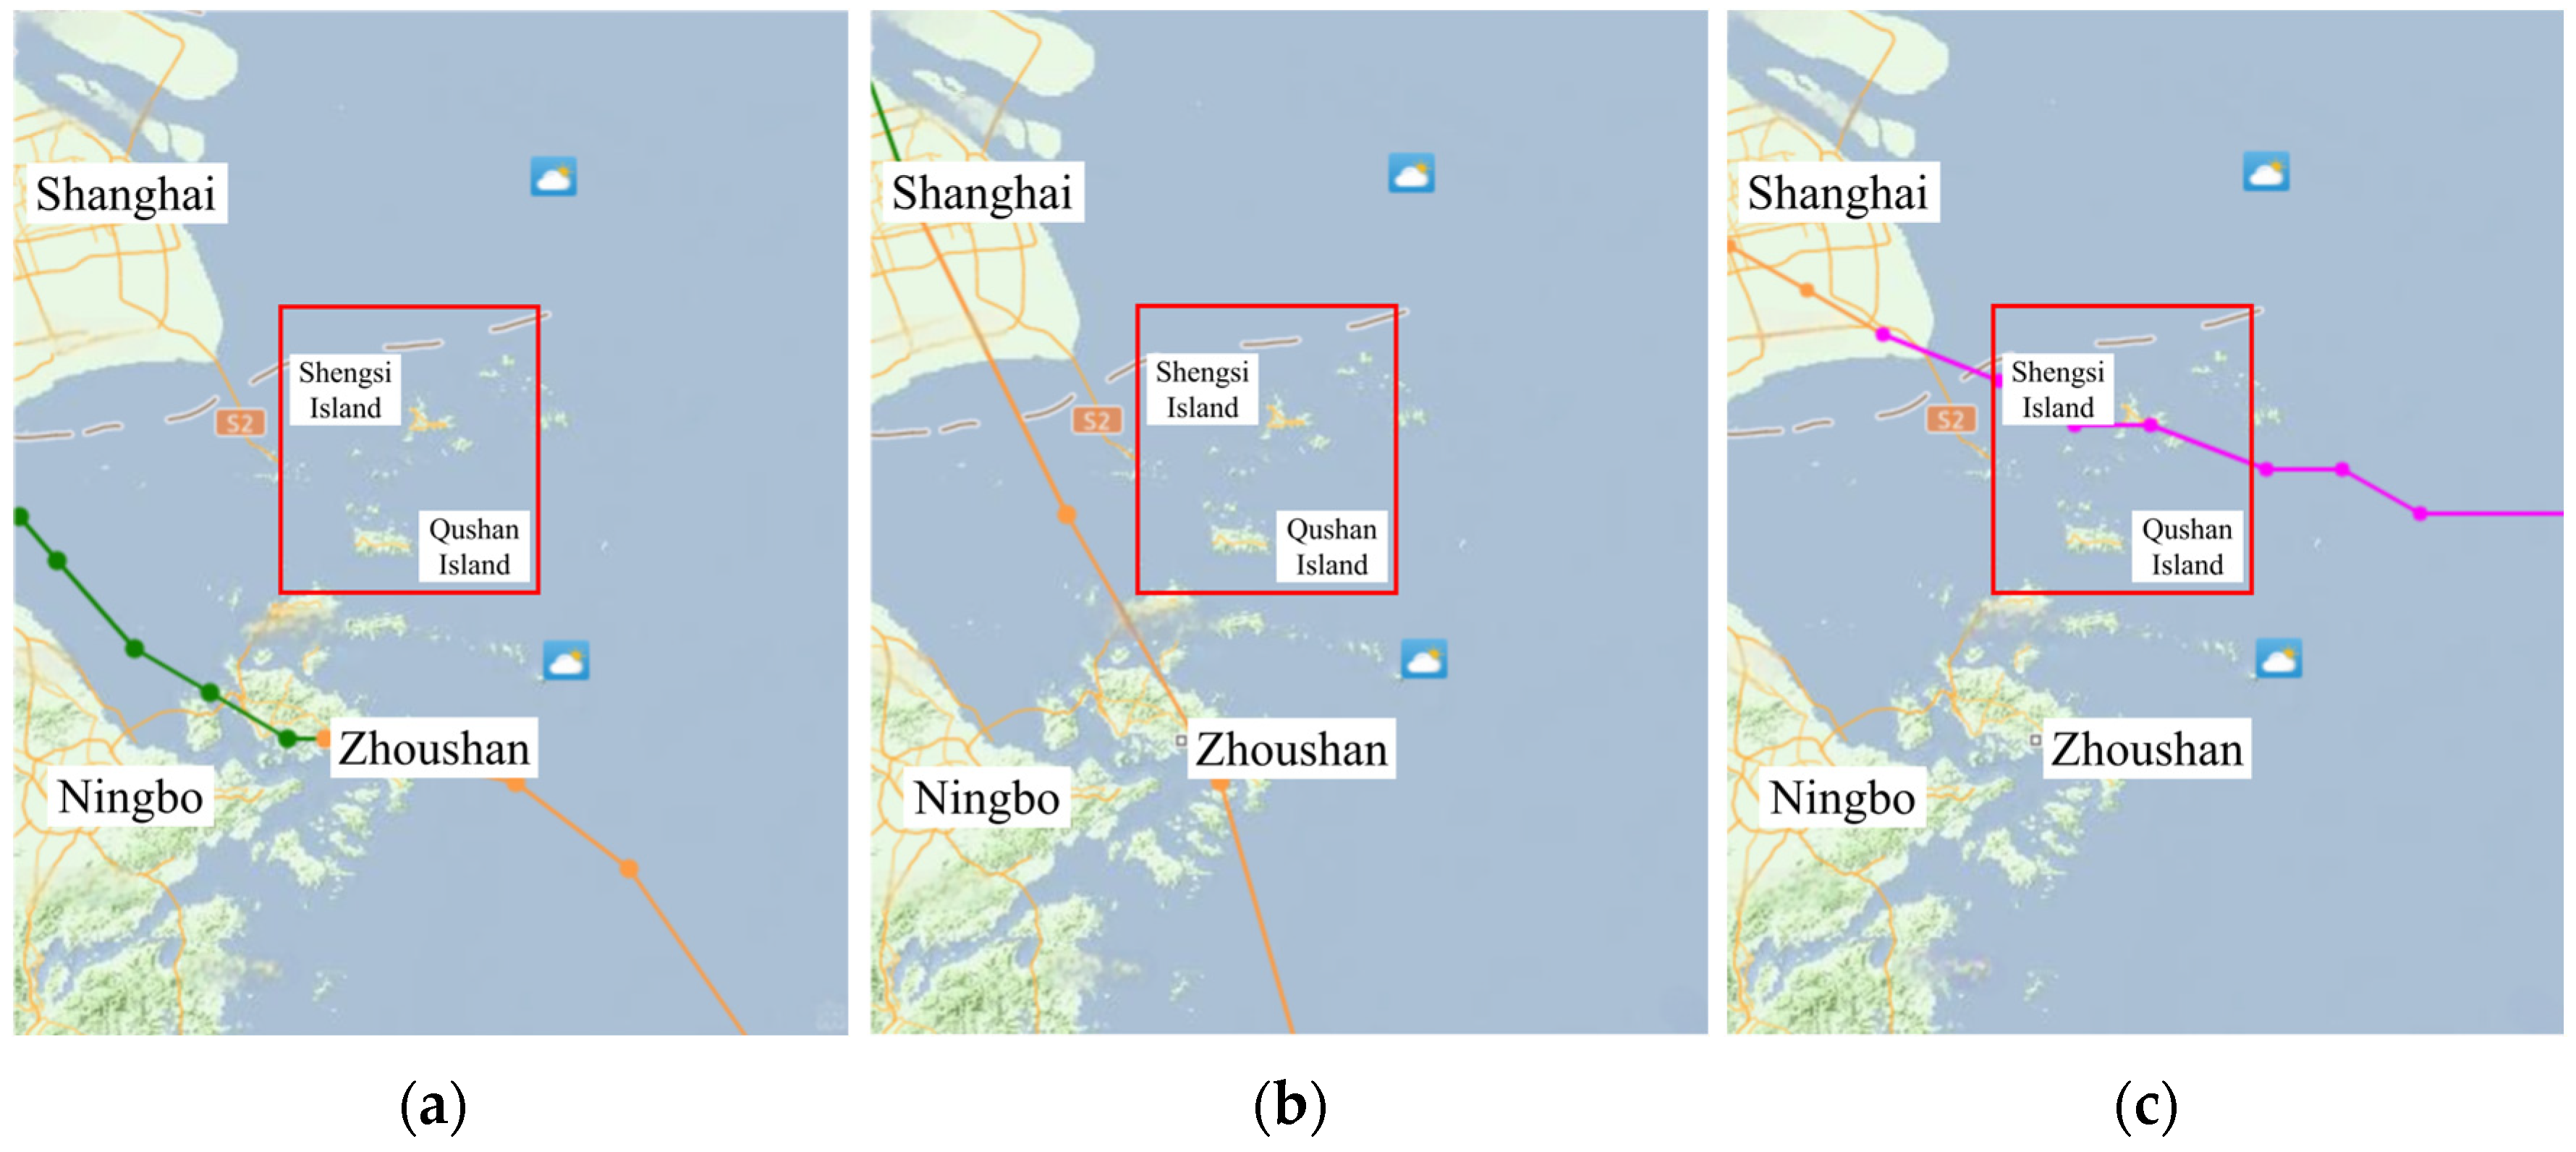
. At approximately 16:00 on 25 July, Typhoon In−fa reached the southeastern corner of the study area (
Figure 5) and officially arrived between Shengsi Island and Qushan Island at 20:00. For further clarity, Typhoon In−fa reached a maximum wind speed of approximately 38 m/s, which results in an estimated wind stress of about 3.5 Pa (calculated using typical values for air density and the wind stress coefficient as described in Equation (4)). Furthermore, based on the adopted turbulent viscosity value of 10
−2 m
2/s, the Ekman depth is computed using Equation (8) to be approximately 16.6 m. These parameters were used in our numerical simulation to accurately represent the typhoon’s impact on the hydrodynamic processes of the study area. This time point, 20:00, is designated as the boundary for analyzing flow velocity across the entire domain. A four−hour interval before and after the typhoon’s arrival is typically used to examine the temporal variations of typhoon−induced storm surges [
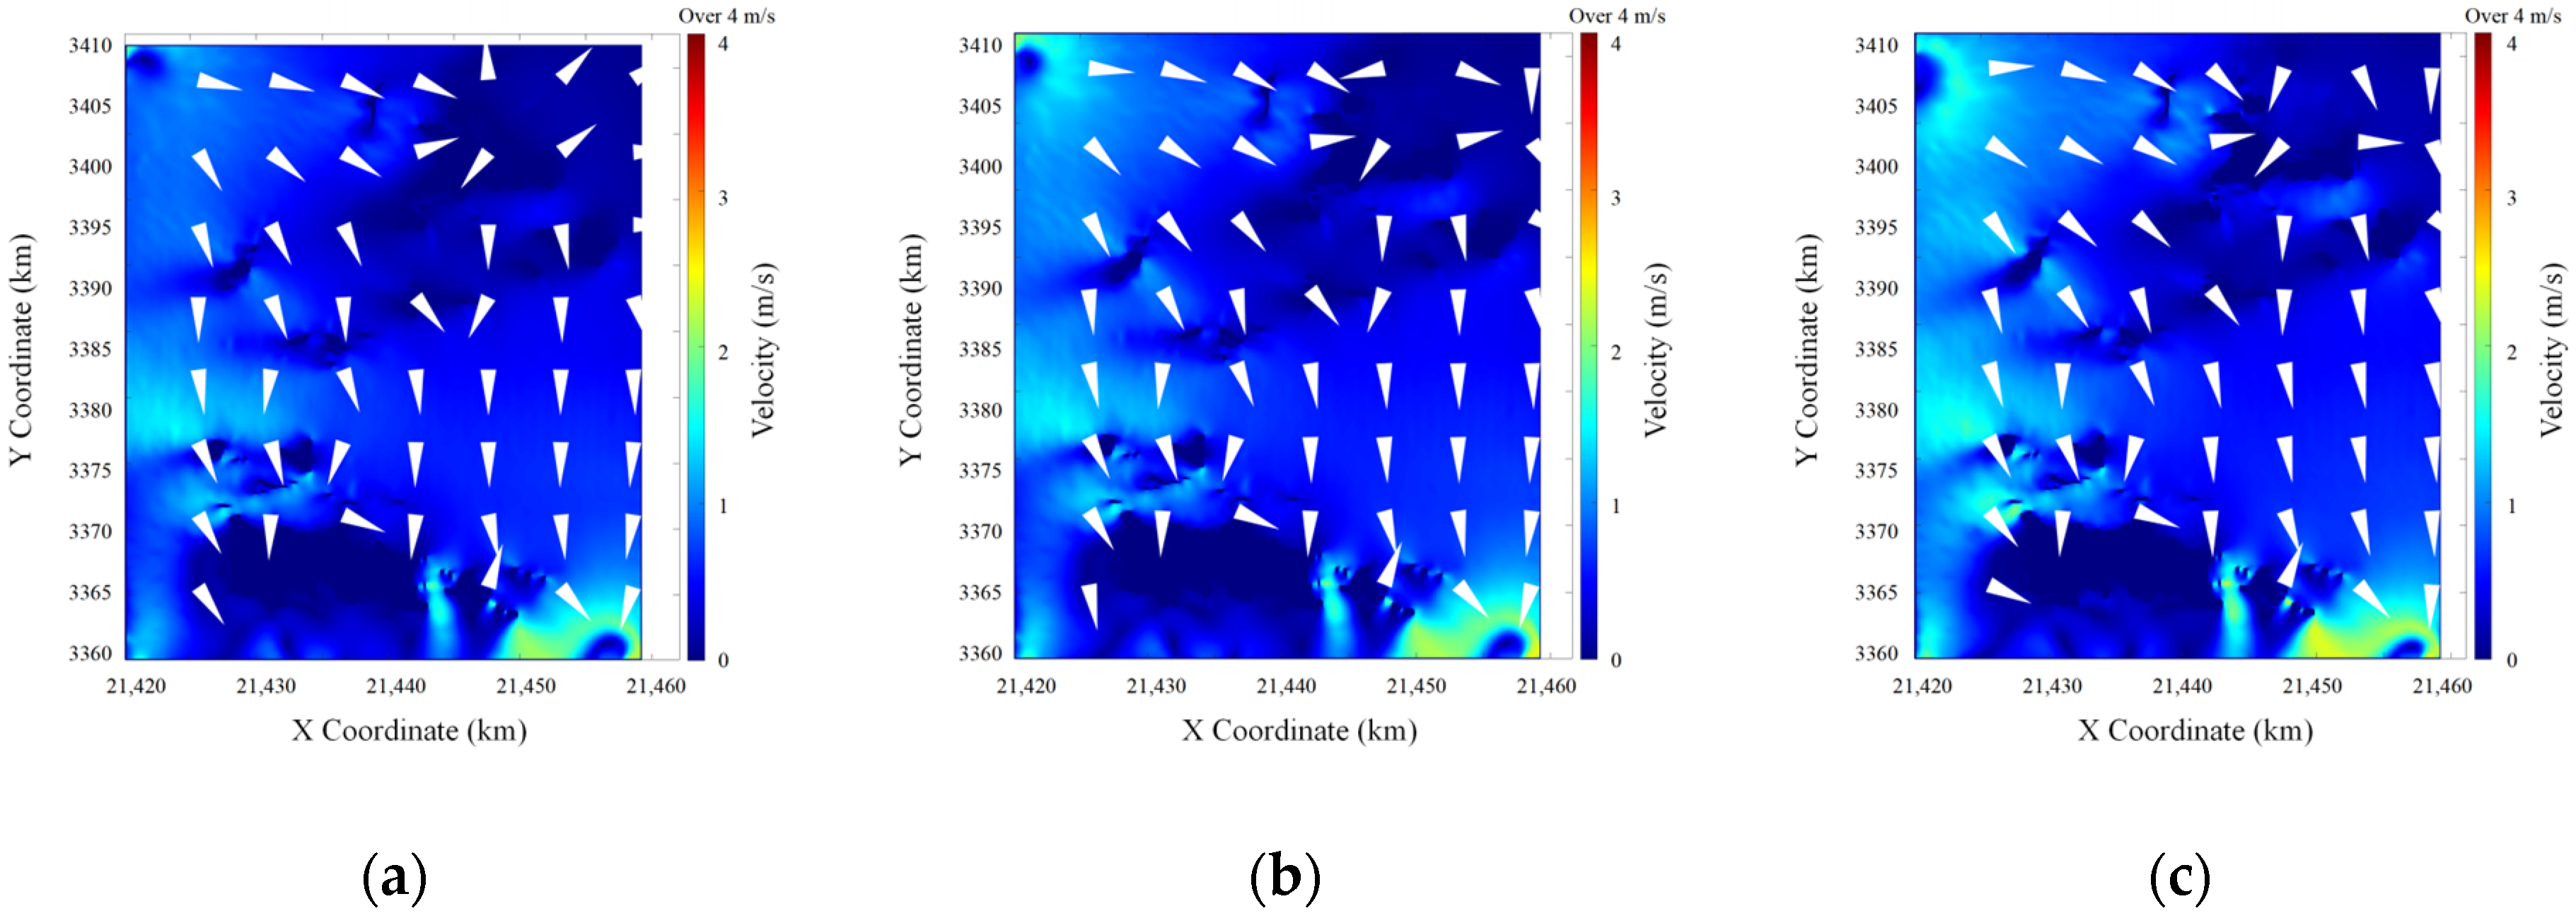
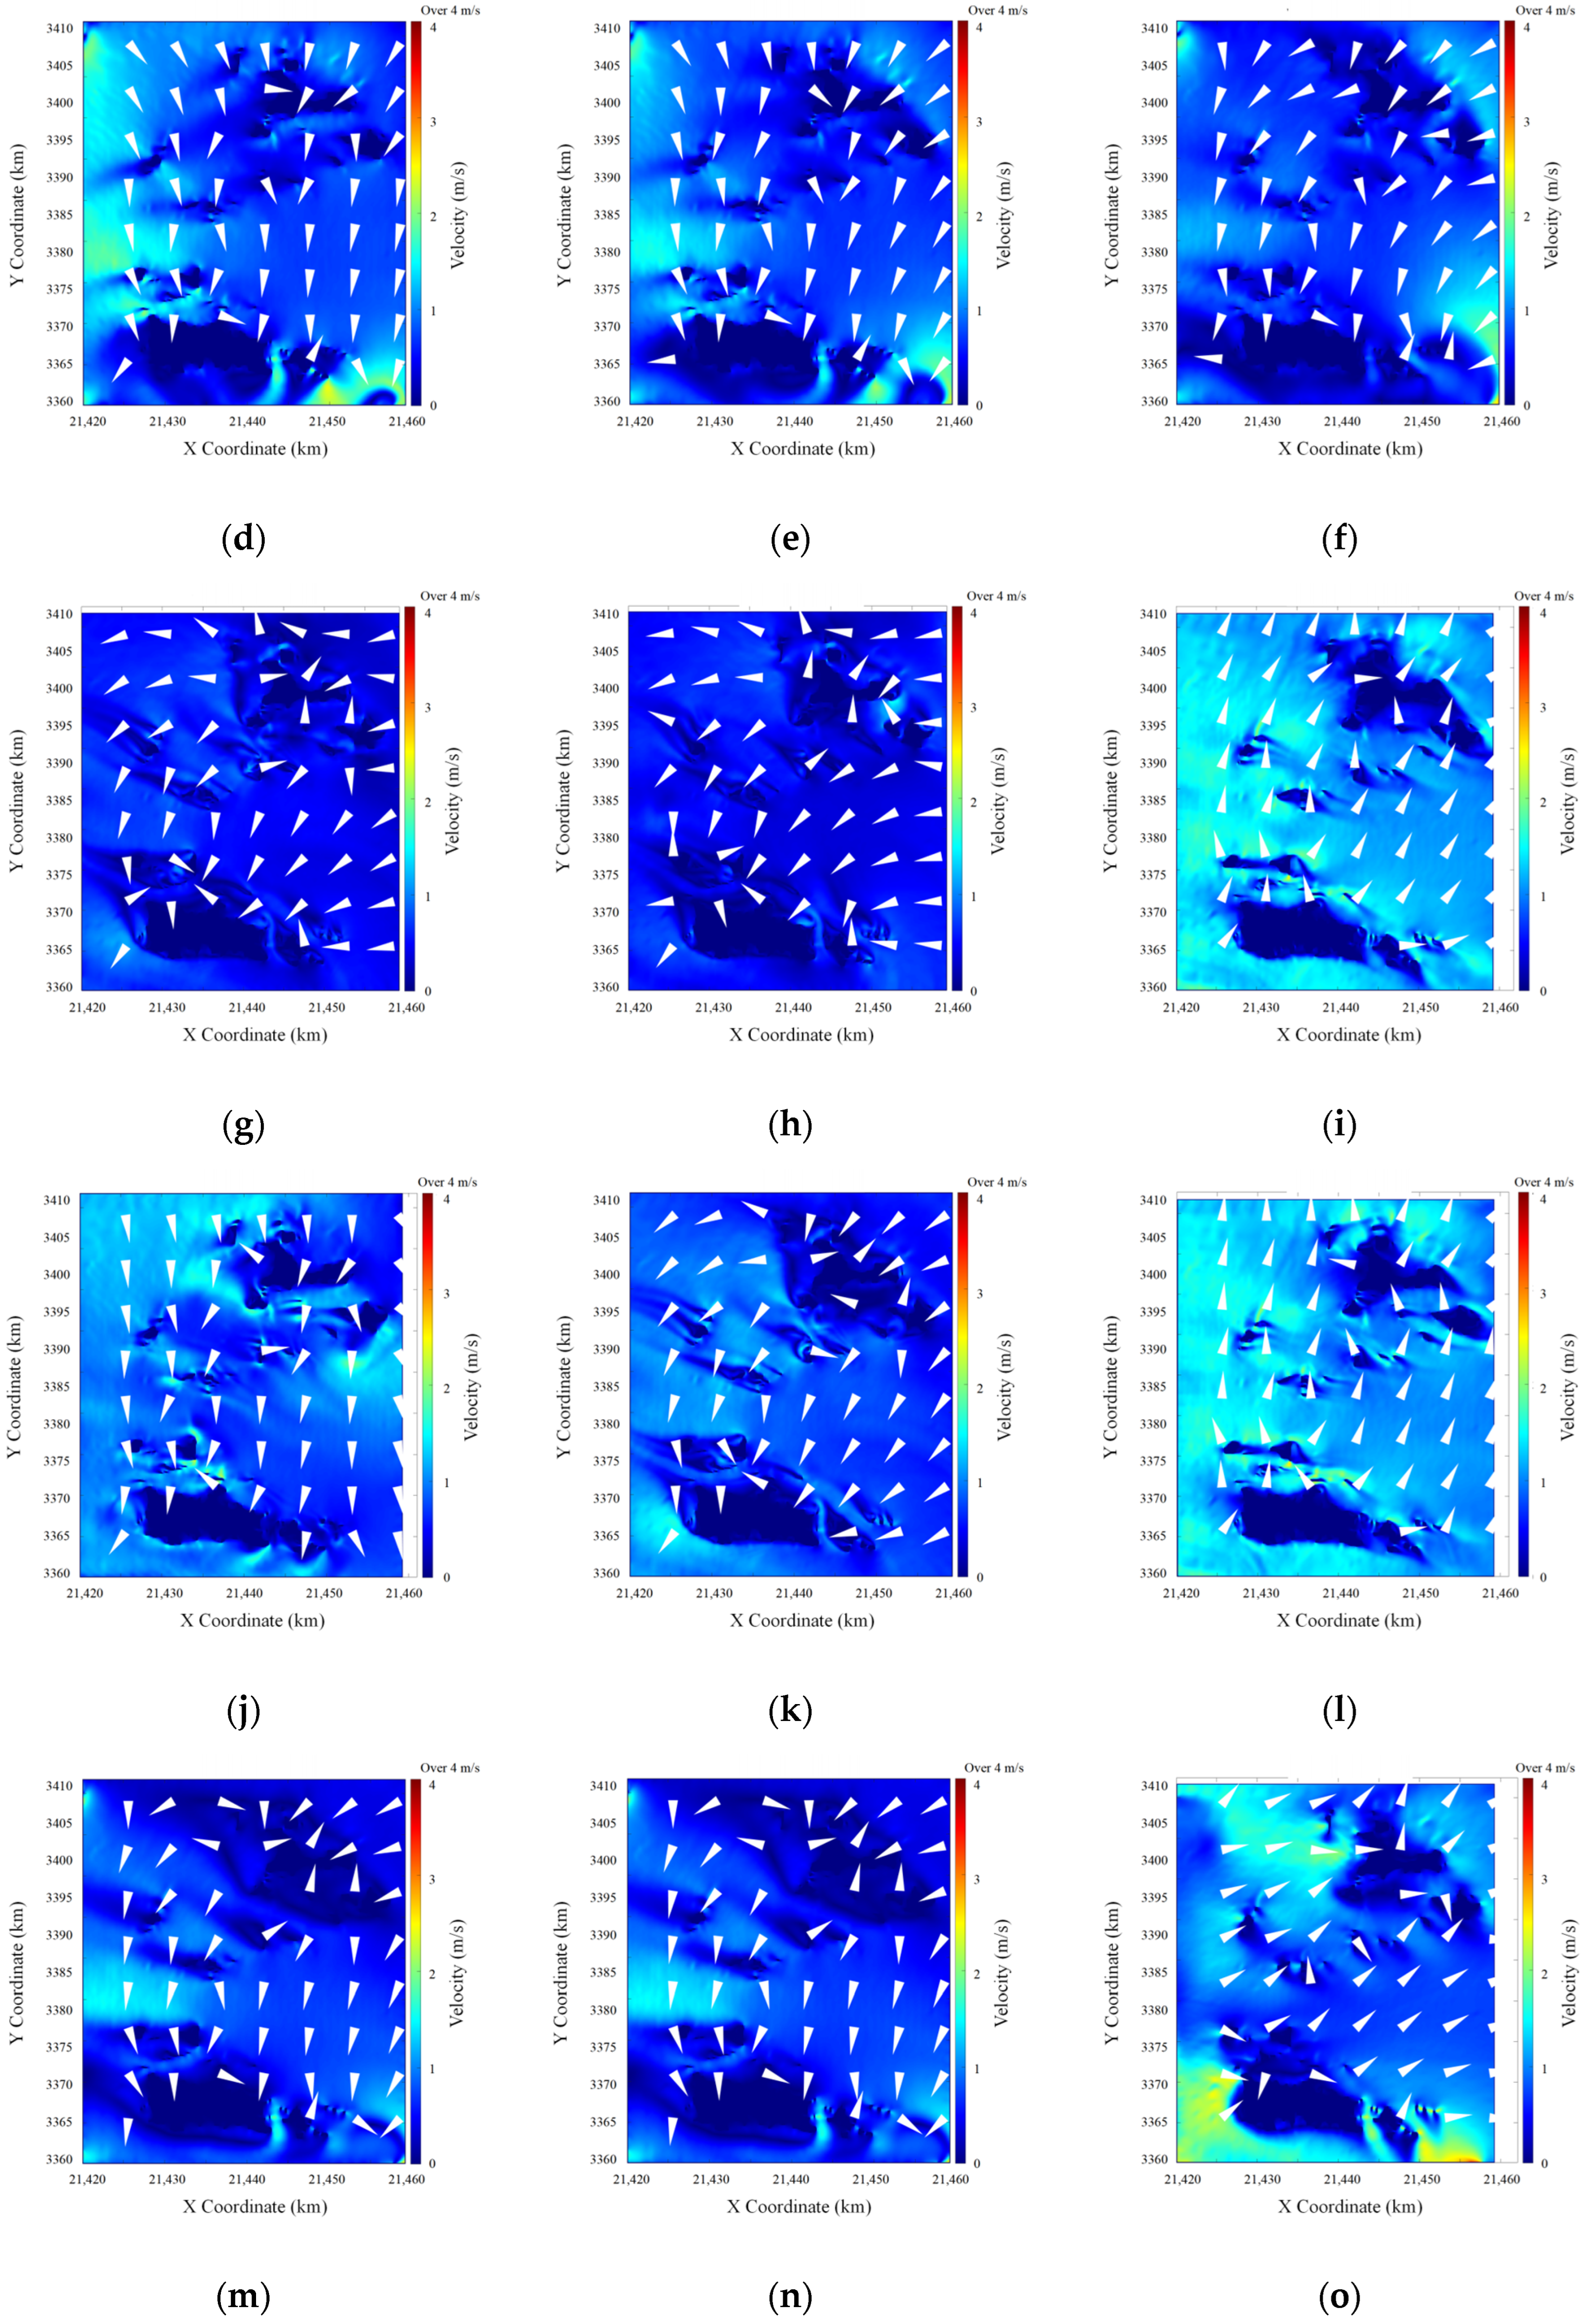
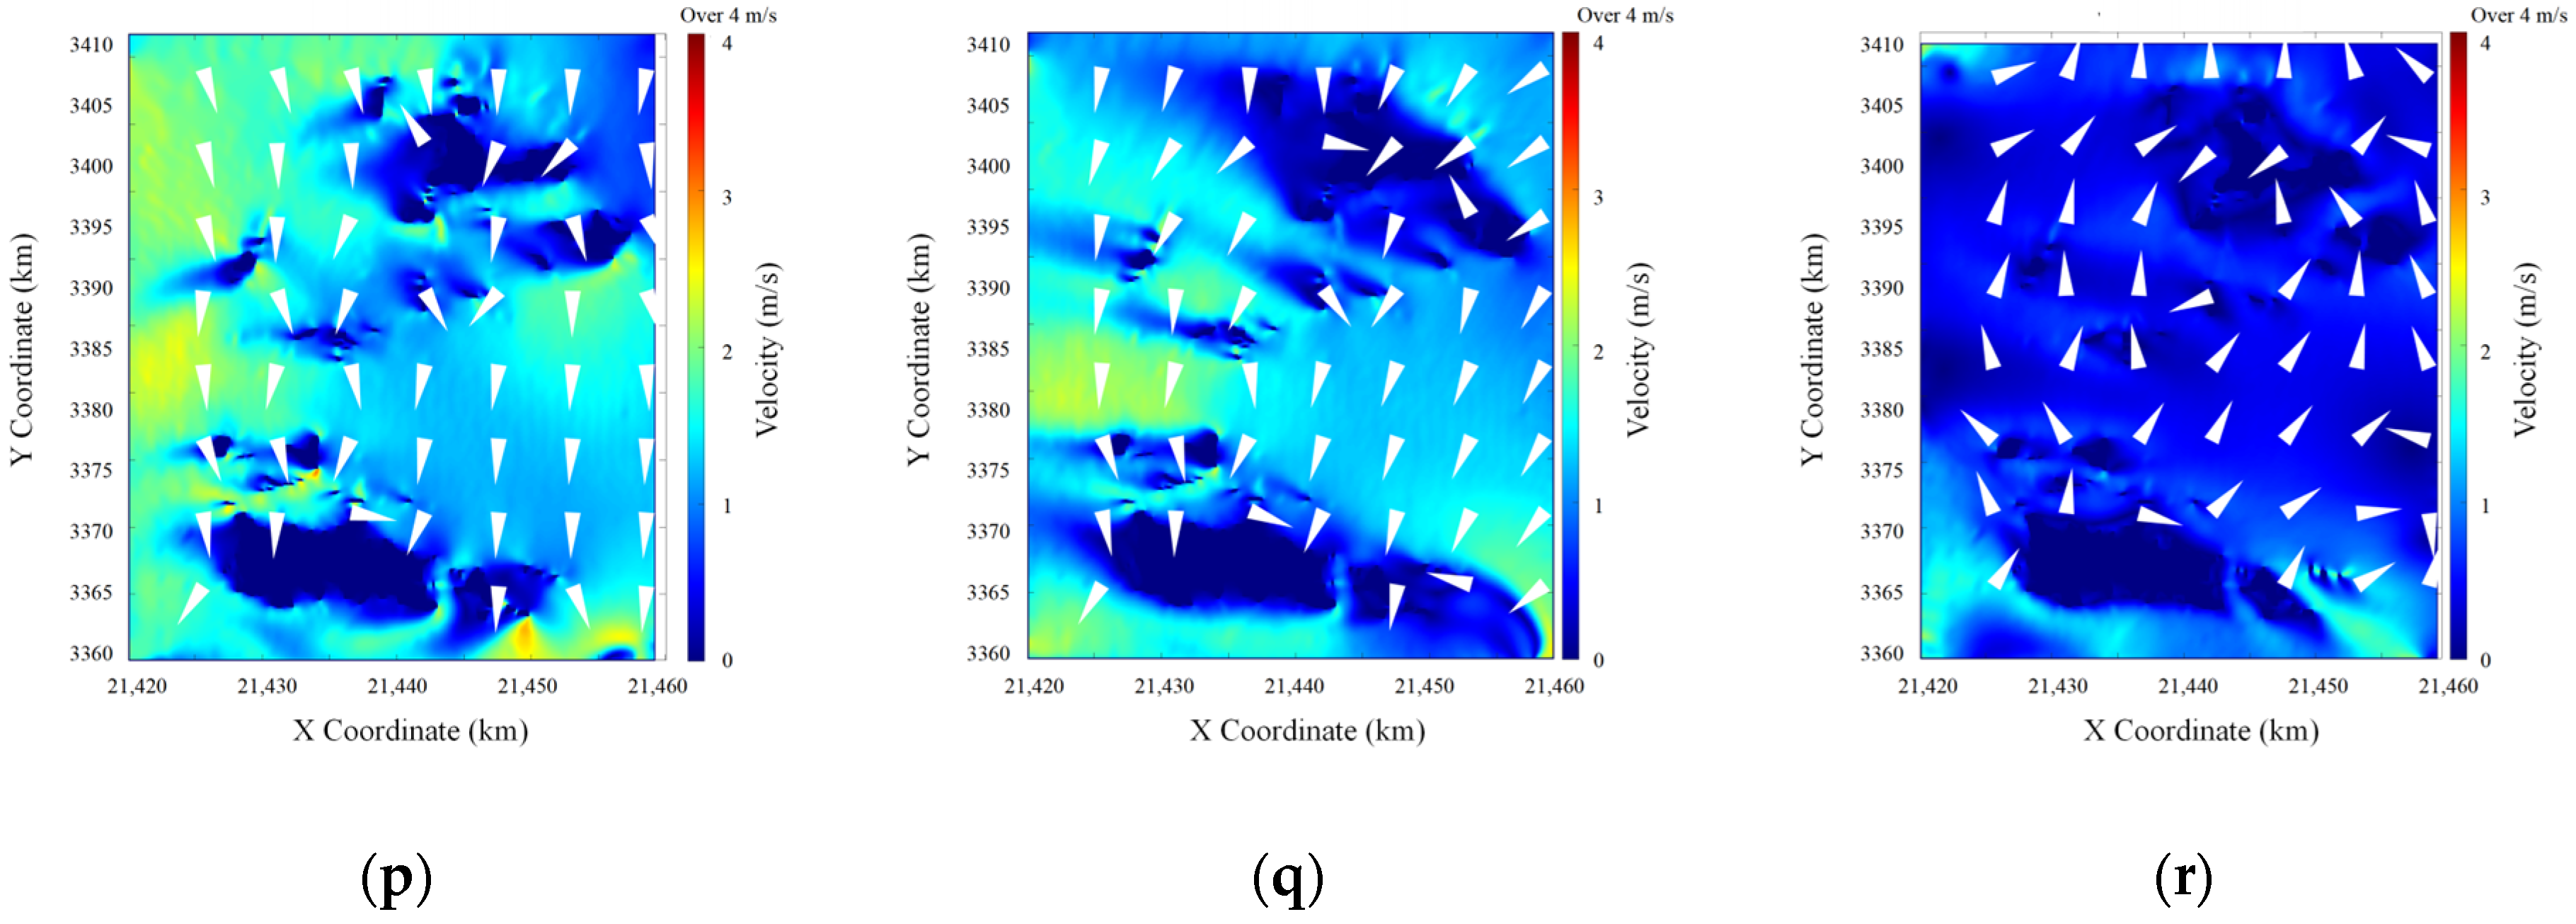
25]. Flow field maps at six selected time points—00:00, 12:00, 16:00, and 20:00 on 25 July, as well as 00:00 and 04:00 on 26 July—were extracted (
Figure 5). By comparing these maps under the three conditions, the trends in flow velocity and direction were analyzed.
Under storm surge conditions, flow velocity intensifies significantly, especially along waterways and near the edges of islands, where strong vortices and accelerated currents are observed. These regions generally exhibit higher flow velocities due to the interaction of typhoon−induced forces with seabed topography. The flow direction during this period is heavily influenced by the typhoon’s path and tends to shift westward after the typhoon’s landfall. By contrast, under astronomical tide conditions, flow velocity and direction are primarily driven by tidal forces, showing more regular patterns. During tidal peaks, flow velocity increases notably in shallow regions and along waterways, reflecting the typical effects of tidal dynamics.
When storm surges and astronomical tides are coupled, the combined effects result in a predominant westward flow direction at the time of the typhoon’s landfall. In these conditions, flow velocity significantly intensifies in leeward areas of islands and along waterways, often exceeding the values observed under either storm surge or astronomical tide conditions alone. This amplification highlights the nonlinear interaction between storm surges and tidal forces, particularly in areas with complex seabed topography.
3.2.2. Statistical Analysis of Numerical Model Flow Velocity
Flow velocity data under pure storm surge, pure astronomical tide, and typhoon storm surge coupling conditions were statistically analyzed.
Table 2 presents the seabed flow velocity characteristics for the entire 96 h time sequence from 00:00 on 23 July to 00:00 on 27 July, covering both the pre− and post−landfall periods of the typhoon.
Table 3 provides statistical flow velocity characteristics specifically for the 48 h period during the typhoon, from 00:00 on 25 July to 00:00 on 27 July, focusing on the flow velocity trends before and after the typhoon’s landfall.
The maximum flow velocity under storm surge conditions reached 2.9 m/s, illustrating the powerful flow dynamics induced by storm surges under extreme weather conditions. The relatively high RMSE and MAE values observed are attributed to the significant influence of wind stress, as storm surges exhibit higher flow velocities and greater fluctuations in areas with an extensive sea surface width.
Astronomical tides played a crucial role throughout the typhoon period, particularly before the typhoon’s landfall at 20:00 on 25 July. During this period, ebb tides combined with northerly winds to produce strong flow velocities along the Zhoushan seabed. During the ebb tide phase prior to the typhoon’s arrival, intensified tidal outflows enhanced water movement, particularly in narrow waterways and around island peripheries, further amplifying the flow velocity to a maximum of 4.2 m/s. The coupled flow velocity of typhoon storm surges showed significant fluctuations, reaching a maximum of 5.5 m/s, which highlights the intense coupling effects of typhoon storm surges. These effects were especially pronounced during tidal peaks and ebbs, where the interaction of storm surges and tides led to extreme flow velocities.
After the typhoon made landfall, weakening wind speeds and the tidal transition into the flood phase resulted in reduced flow velocities, driven by the combined effects of astronomical tides and storm surges. As shown in
Table 3, both the mean and maximum flow velocities after landfall decreased significantly compared to those before landfall. This aligns with the expected behavior during the passage of the typhoon’s eye: before landfall, the outer bands of the typhoon intensify wind speeds, while upon landfall, particularly in areas traversed by the eye, wind speeds drop sharply. Consequently, the maximum flow velocity recorded after landfall was 1.9 m/s.
During the typhoon, the mean and median flow velocities induced by astronomical tides were 1.12 m/s and 1.03 m/s, respectively, with relatively small fluctuations. This behavior is consistent with the tidal dynamics in the Zhoushan seabed area. After 20:00 on 25 July, as the tide transitioned into the early stage of flooding, the astronomical tide−induced flow velocities diminished, contributing to an overall reduction in tidal velocities.
Despite this, the coupling effect of the storm surge and astronomical tide partially mitigated the decrease in flow velocity after the typhoon’s landfall. As a result, the total flow velocity remained as high as 2.48 m/s. However, as the typhoon moved further away and the influence of the astronomical tide normalized, the flow velocity gradually stabilized.
3.2.3. Extreme Flow Velocity Statistics
The three data matrices generated by Typhoon In−fa—pure storm surge flow velocity, pure astronomical tide flow velocity, and typhoon storm surge coupled flow velocity (data structure: [392 × 467 × 96])—were organized and analyzed. The flow velocity data across the 96 h’ sequences were segmented to identify local extreme values within each time segment. These extreme values were then fitted using GEV theory, resulting in the shape (), location (), and scale () parameters that characterize the extreme value distributions.
To mitigate the influence of outliers on the distribution fitting, the top 2% of maximum values in each flow velocity dataset were removed. After filtering, the remaining 98% of the data were used for GEV distribution fitting.
Table 4 presents the GEV distribution parameters and model performance metrics for the different flow velocity types, capturing the extreme value behavior under astronomical tide, storm surge, and typhoon storm surge conditions.
In terms of model performance, the root mean square error (RMSE) and mean square error (MSE) were used to evaluate the goodness of fit. Due to the periodic fluctuations of astronomical tides and typhoon storm surges, the RMSE values are relatively low at 0.223 and 0.224, respectively, indicating a strong fit. In contrast, the RMSE for storm surges is higher at 0.450, reflecting slightly lower fitting accuracy, which is consistent with the inherent uncertainty in wind direction and wind speed during storm surge events. Similarly, mean absolute error (MAE) results confirm the suitability of the GEV model for analyzing astronomical tides (non−typhoon conditions) and typhoon storm surge coupling (typhoon conditions).
The location parameter (
) provides insight into the magnitude of extreme flow velocities. For typhoon storm surge flow velocities,
, highlighting significantly higher extreme flow velocities in the region during typhoon events. In comparison, astronomical tide flow velocities have a lower extreme value, with
. The scale parameter (
) represents the degree of dispersion in the flow velocity distribution. For astronomical tides,
, while for typhoon storm surges,
. This indicates that flow velocity distributions exhibit greater variability during typhoon events compared to non−typhoon conditions, underscoring the pronounced changes in flow velocities during typhoon periods. The shape parameter (
) for all three flow velocity types is negative, indicating that the flow velocity distributions exhibit a right−skewed heavy tail. This characteristic is particularly evident for astronomical tides and typhoon storm surges, suggesting that their extreme flow velocities follow certain frequency patterns. In contrast, storm surges exhibit less regular flow velocity distributions. Consequently, the GEV model is most effective for analyzing the extreme values of astronomical tides and typhoon storm surges, making it a valuable tool for probabilistic analysis of extreme flow velocity events, see
Table 5.
The probabilities of astronomical tide flow velocities and typhoon storm surge coupled flow velocities at different typical flow velocities reveal distinct distribution characteristics for these two flow types. For flow velocities exceeding 1.5 m/s, the probability is 3% for astronomical tides and 7% for typhoon storm surges. This aligns with the typical astronomical tidal dynamics observed in marine environments. Consequently, it is reasonable to calibrate the top 7% of coupled flow velocities as extreme flow velocities, with an extreme flow velocity threshold set at 1.5 m/s.
By focusing on flow velocities exceeding this defined threshold ( m/s), the probability of such events can be calculated using the extreme value distribution function (Equation (13)): . Using this method, the probability of astronomical tidal flow velocities exceeding 1.5 m/s is approximately 3%, while for typhoon storm surge coupled flow velocities, the probability is about 7%. For safety and protection purposes, the higher probability value of 7% is selected as the extreme flow velocity occurrence probability. This emphasizes the importance of implementing protective measures to mitigate the risks associated with extreme flow velocities.
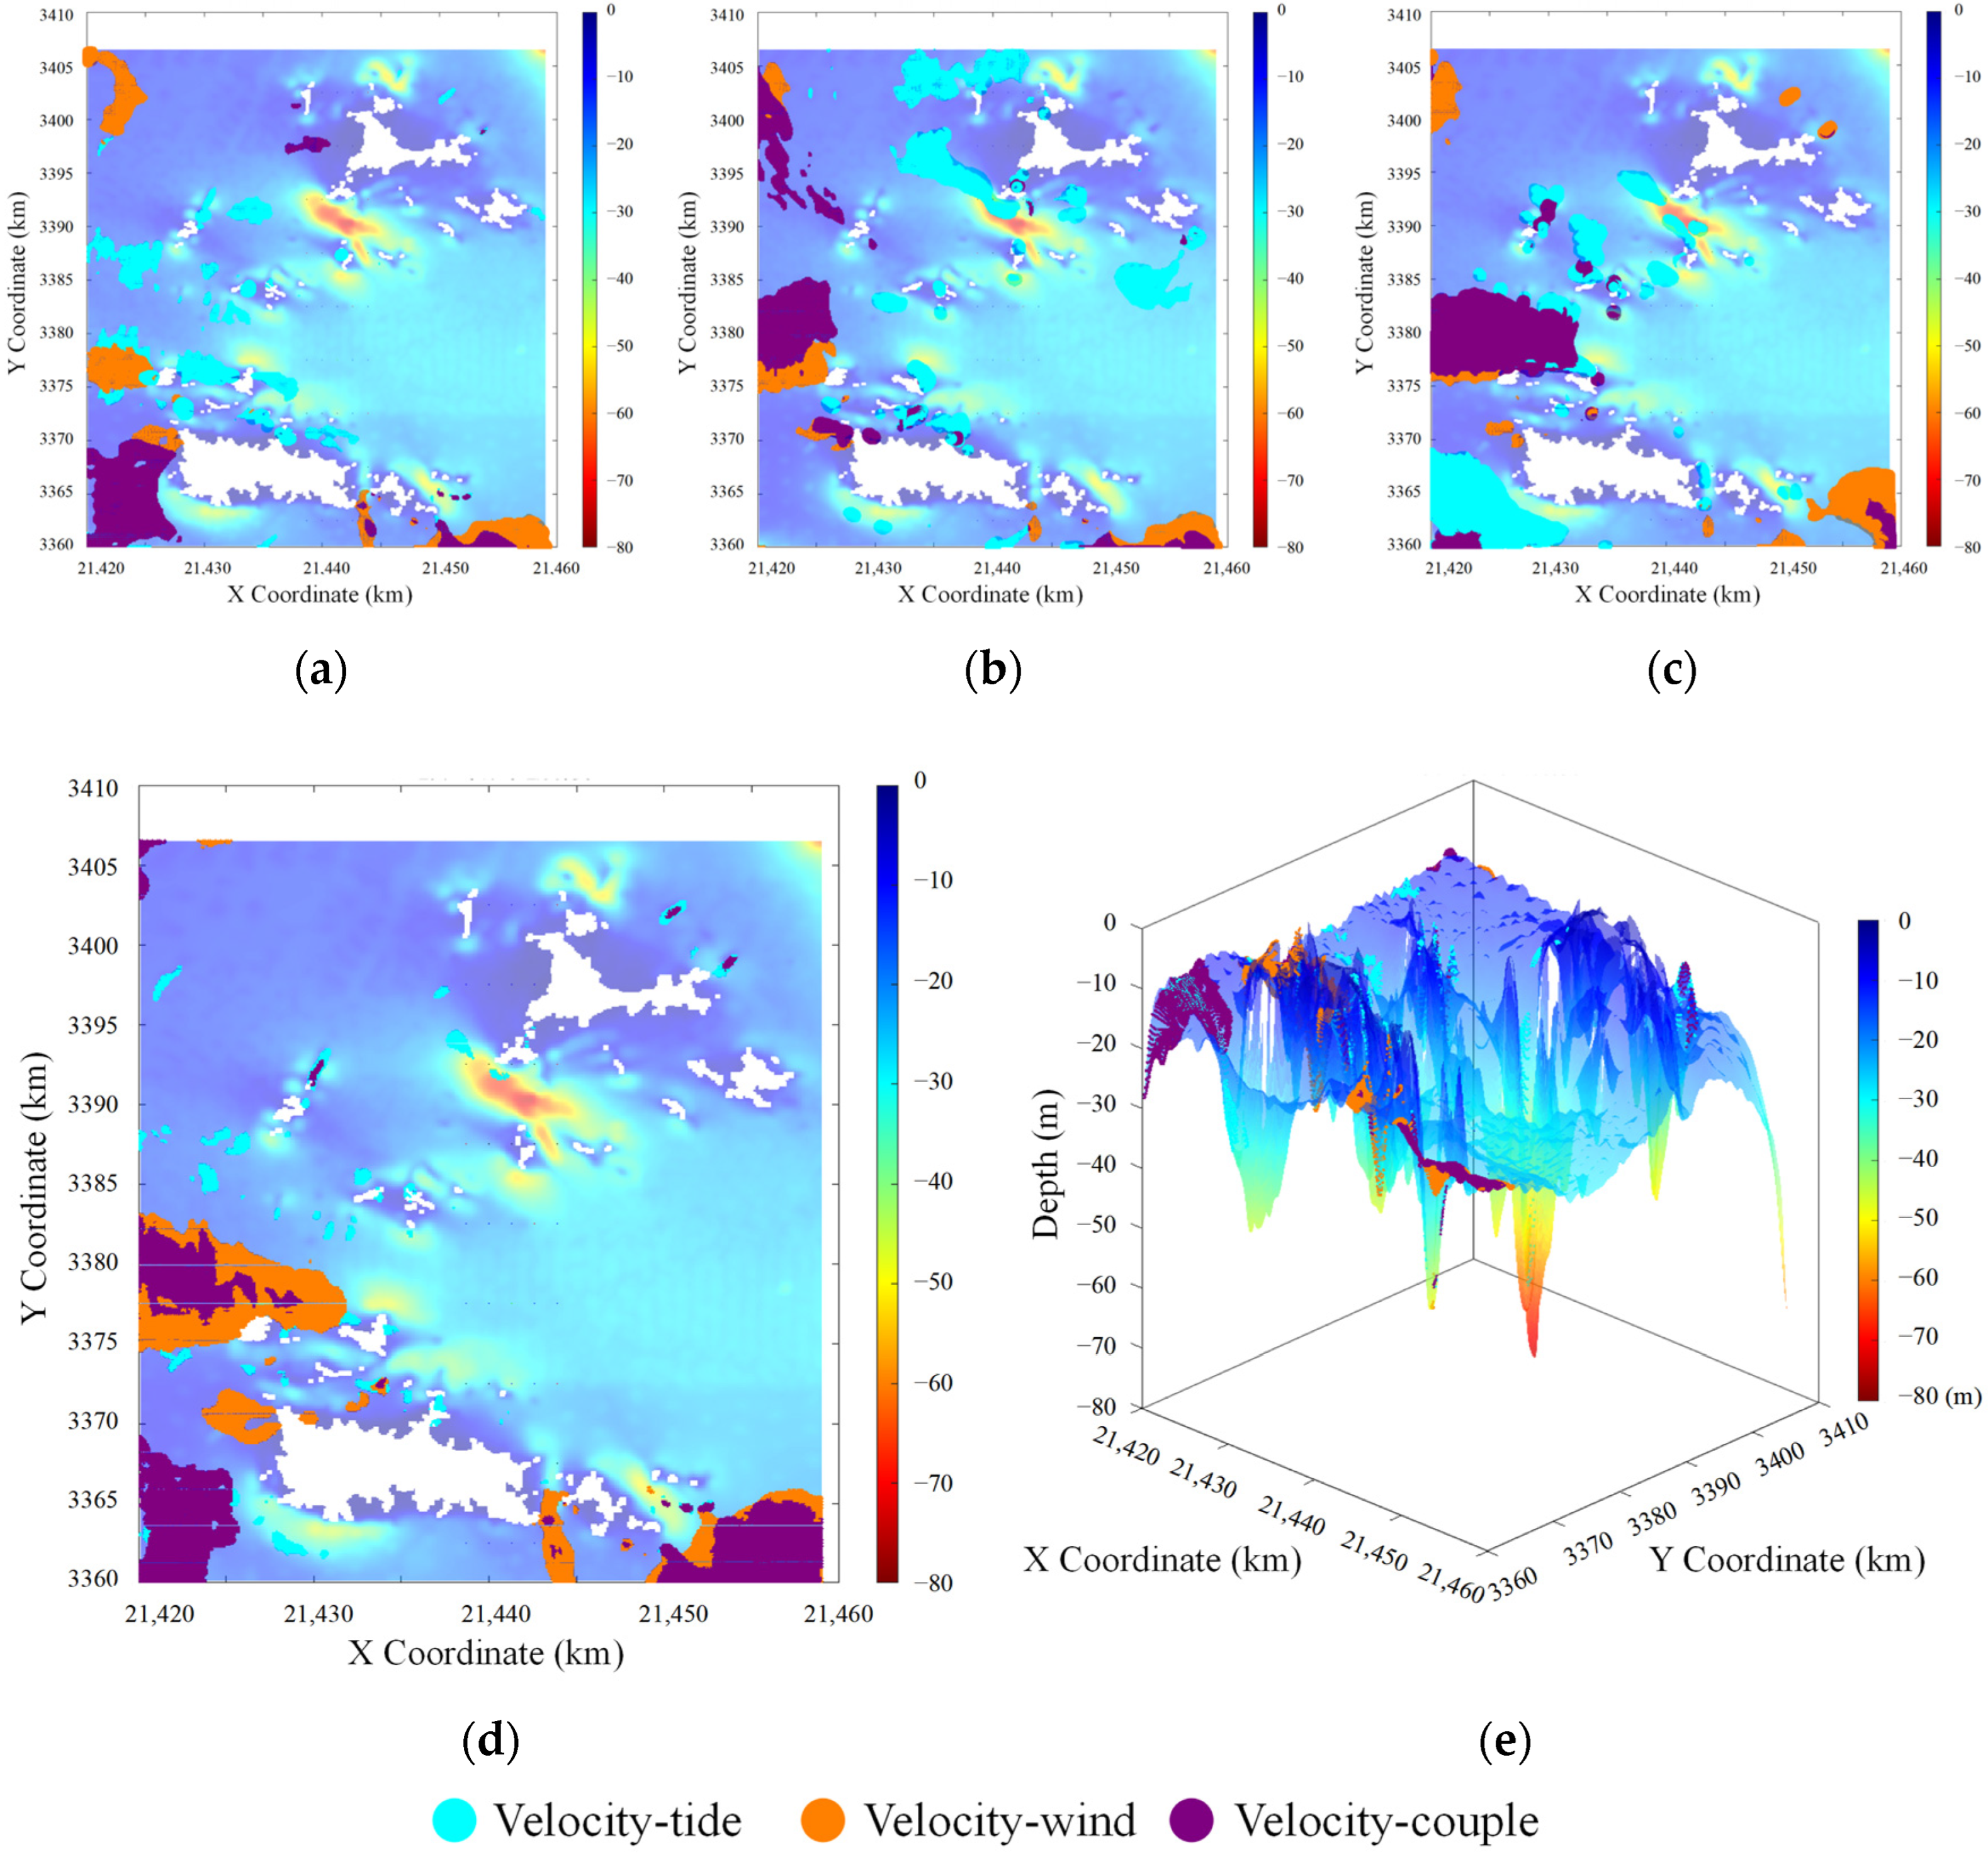
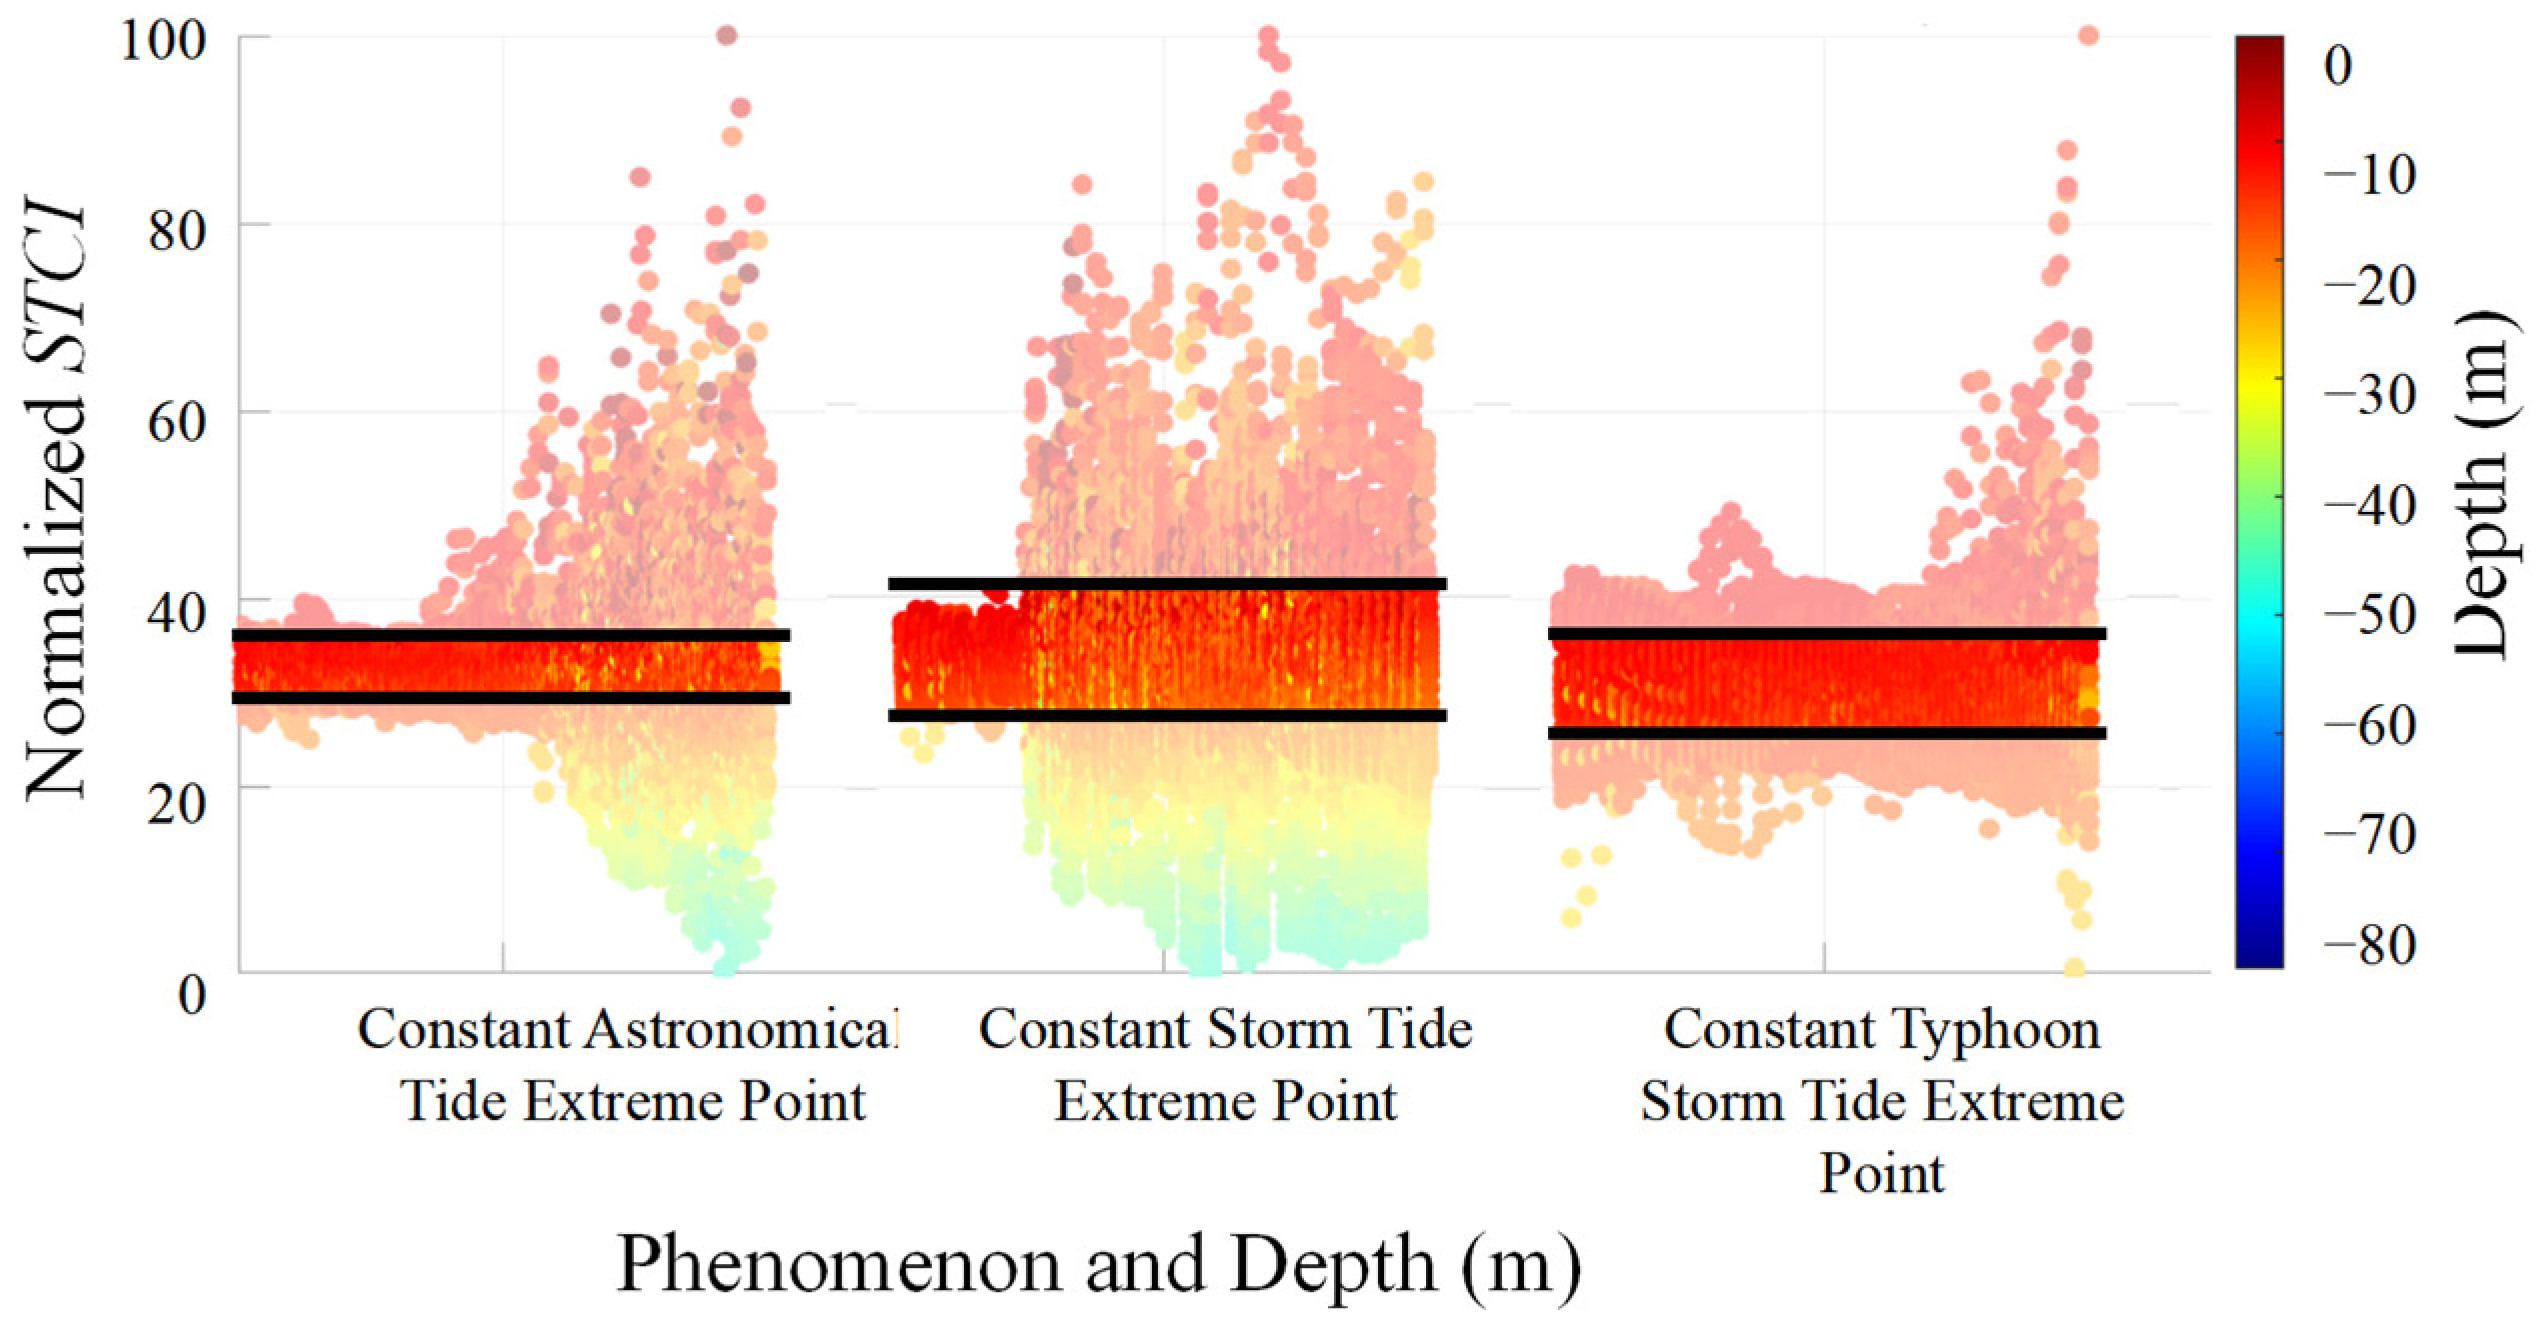
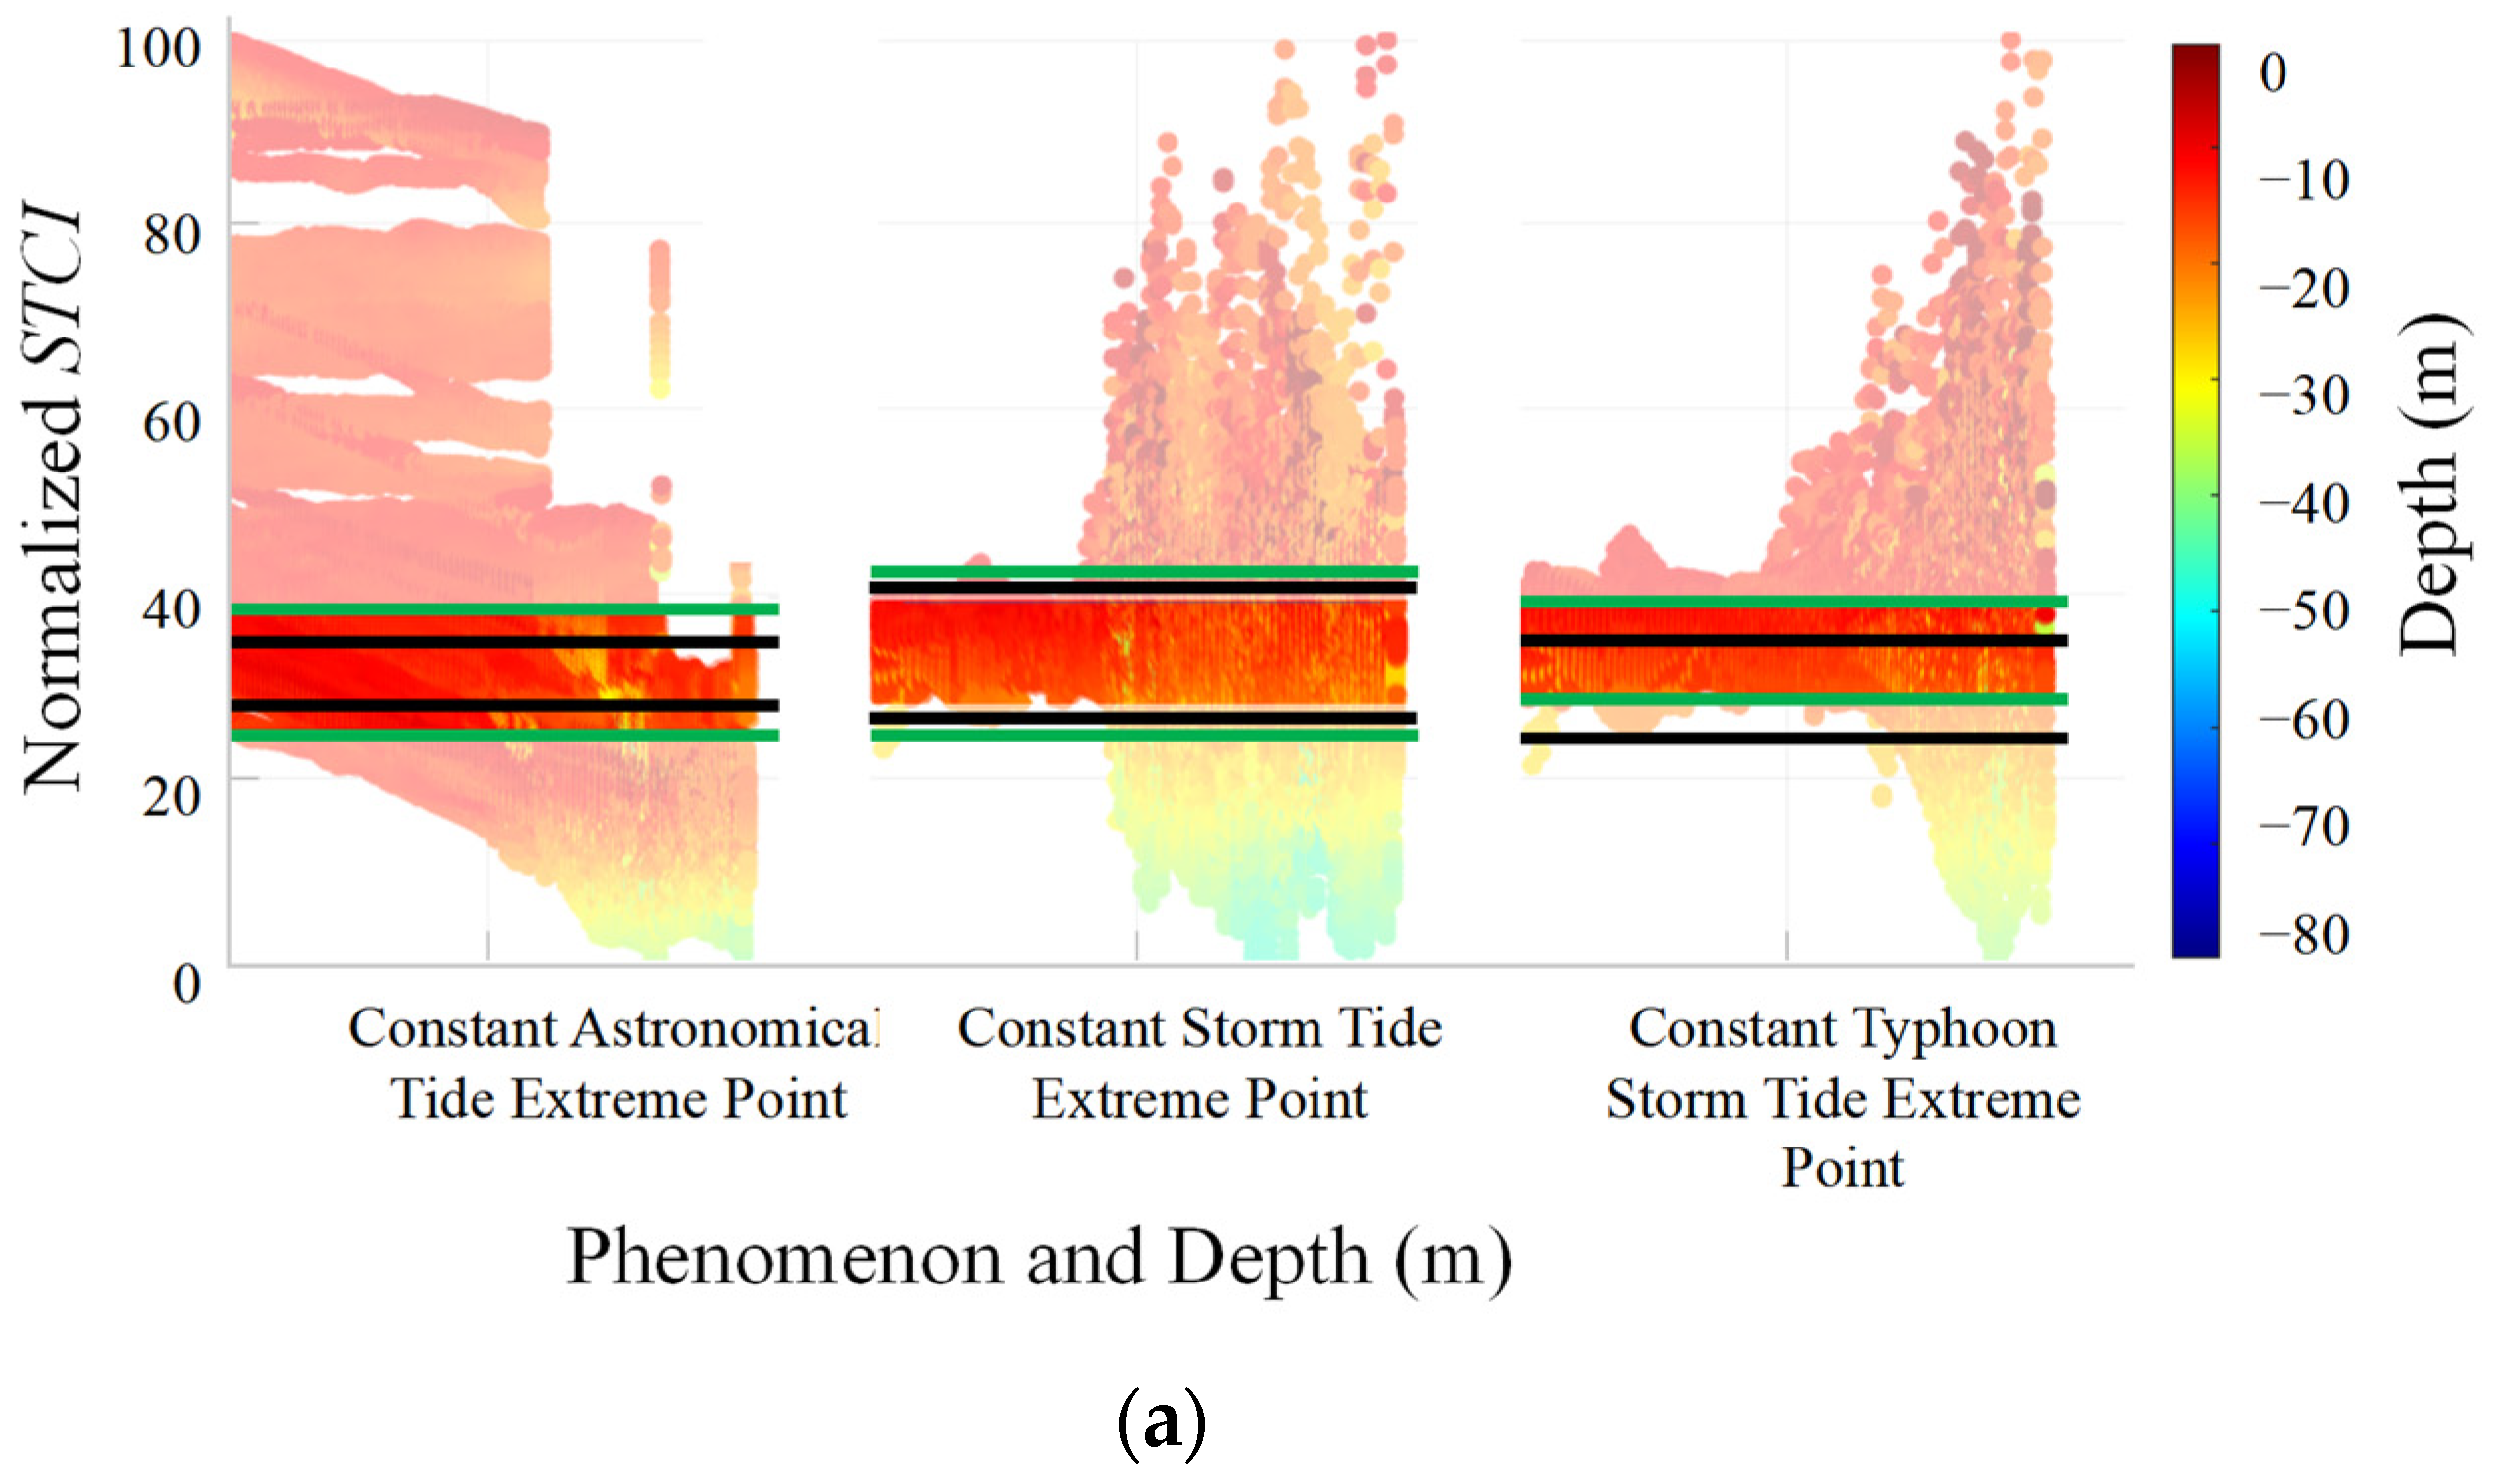
To better understand the distribution of extreme flow velocities, 3D visualization is used to display overlapping extreme values, representing all points with flow velocities exceeding or equal to 1.5 m/s for 82 h (85% of the typhoon period). Among the 392 × 467 coordinate points, those consistently exceeding the flow velocity threshold during these 82 h are marked on a unified 3D nautical chart and designated as “Typhoon In−fa Constant Extreme Flow Velocity Points”. A color−mapped visualization is employed to differentiate between the three flow velocity types, offering a clear and intuitive representation of the distribution of “constant extreme flow velocity points”.
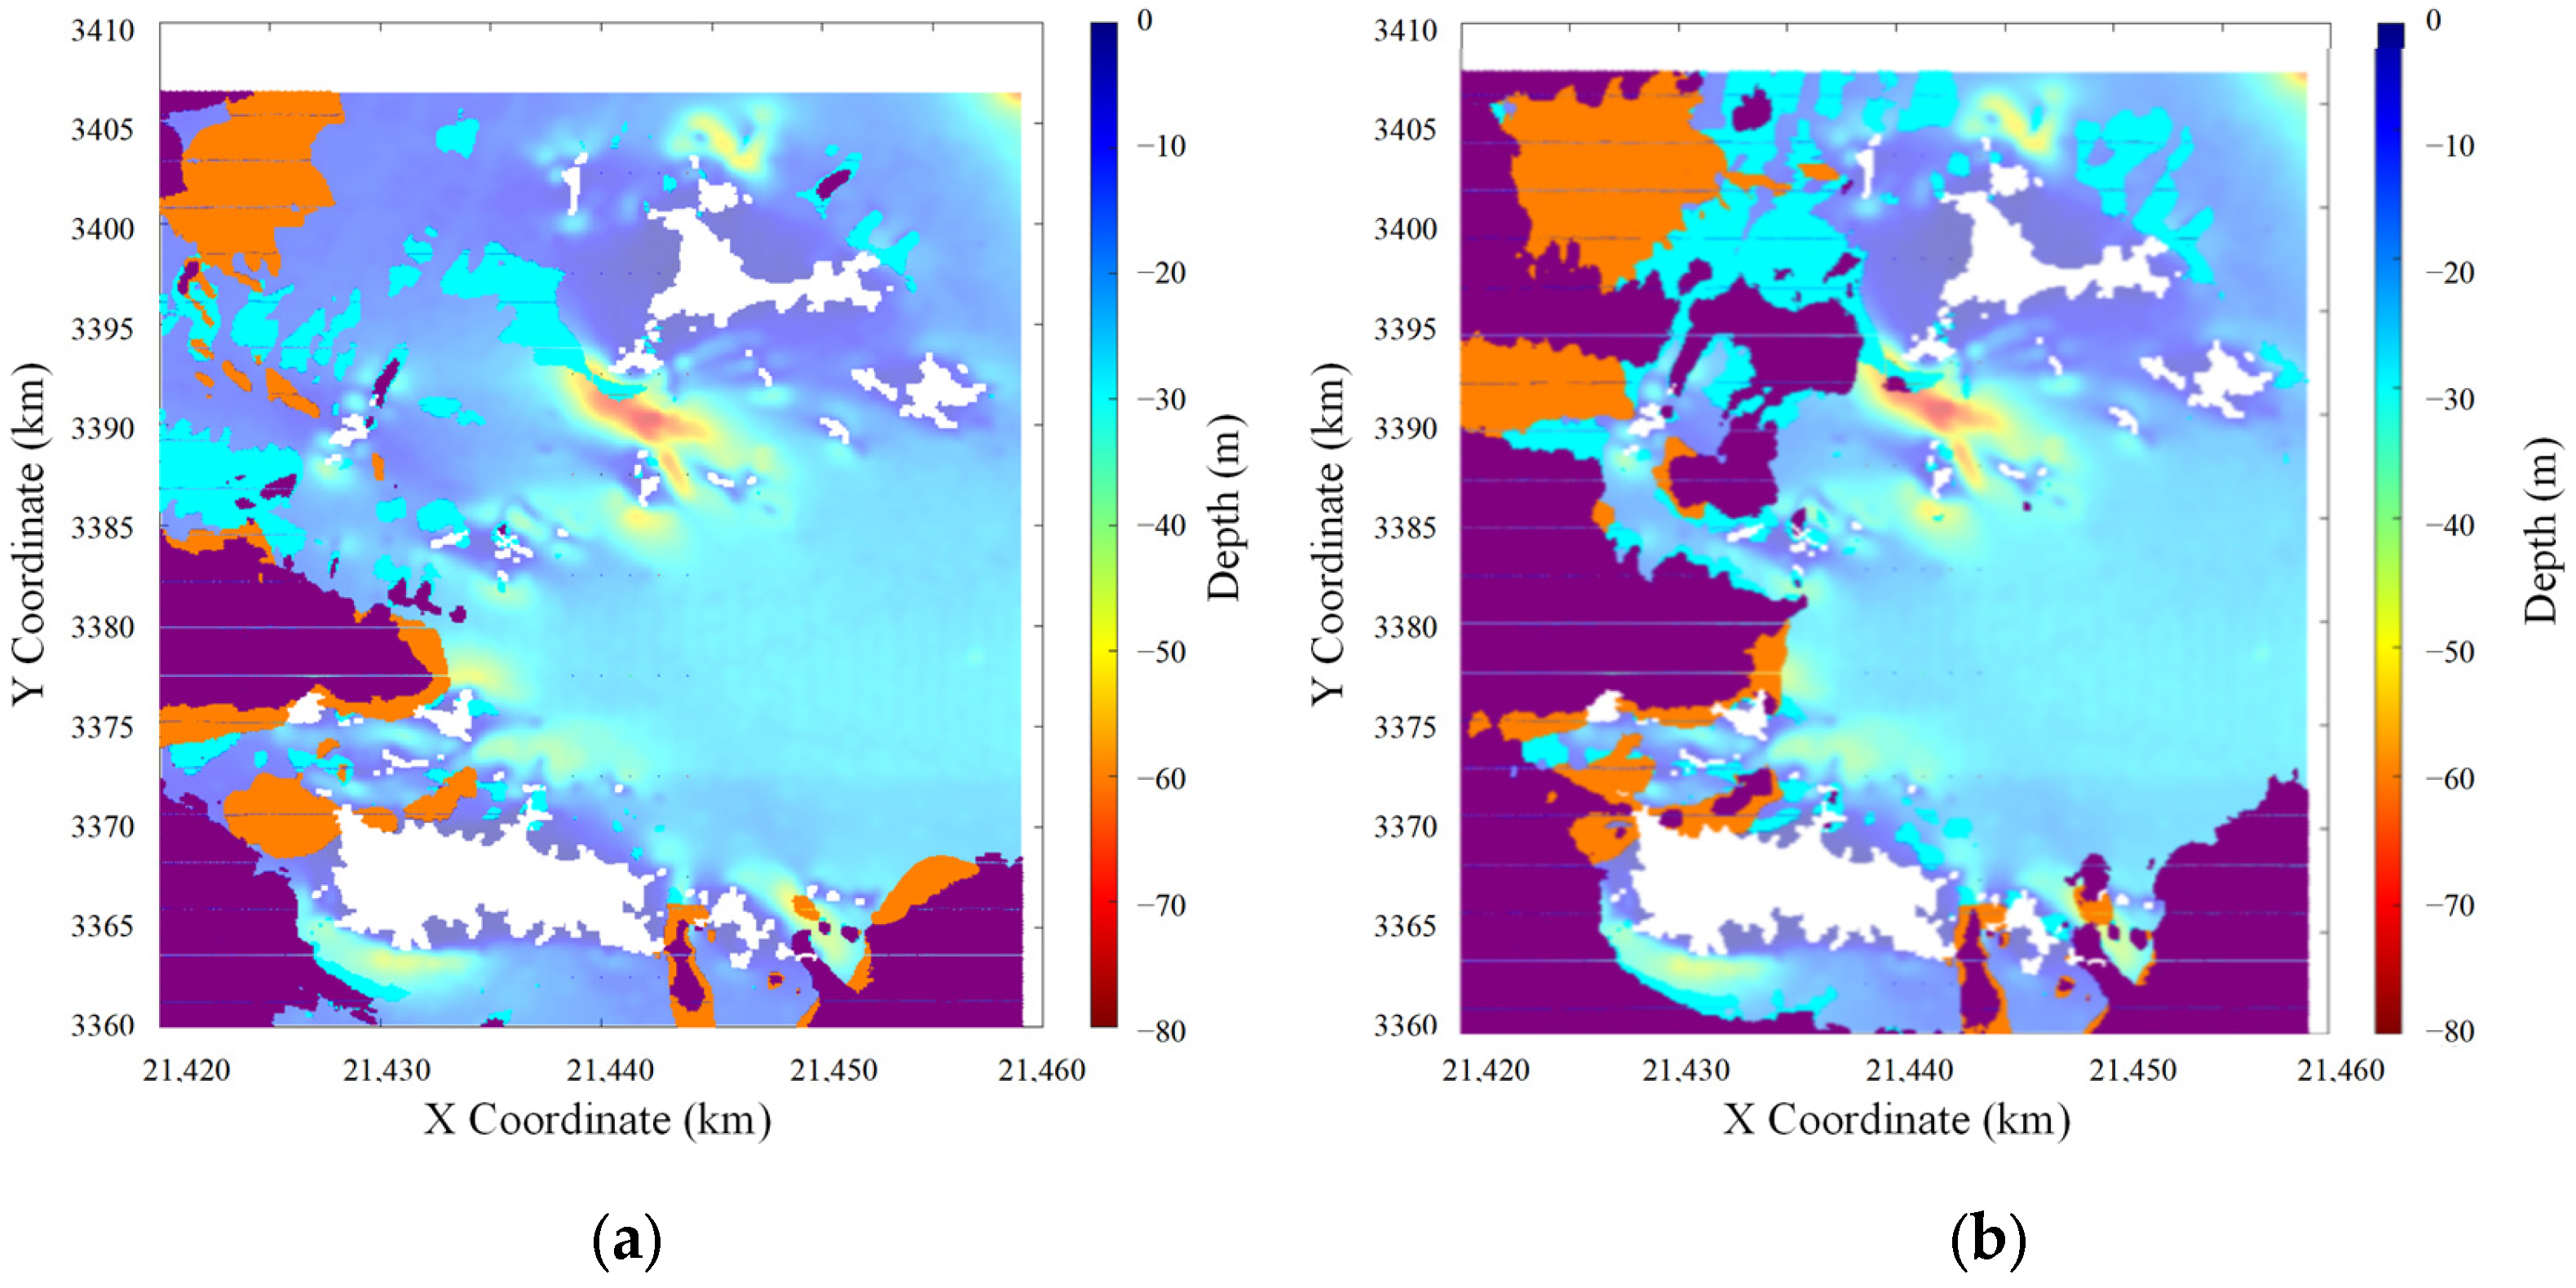
Figure 6a–c depict the distribution of extreme flow velocity points at three representative moments: 4 h before landfall, during landfall, and 4 h after landfall of Typhoon In−fa, respectively. These snapshots correspond to previously defined “Typhoon In−fa Constant Extreme Flow Velocity Points” and serve as case studies within the 85% typhoon period.
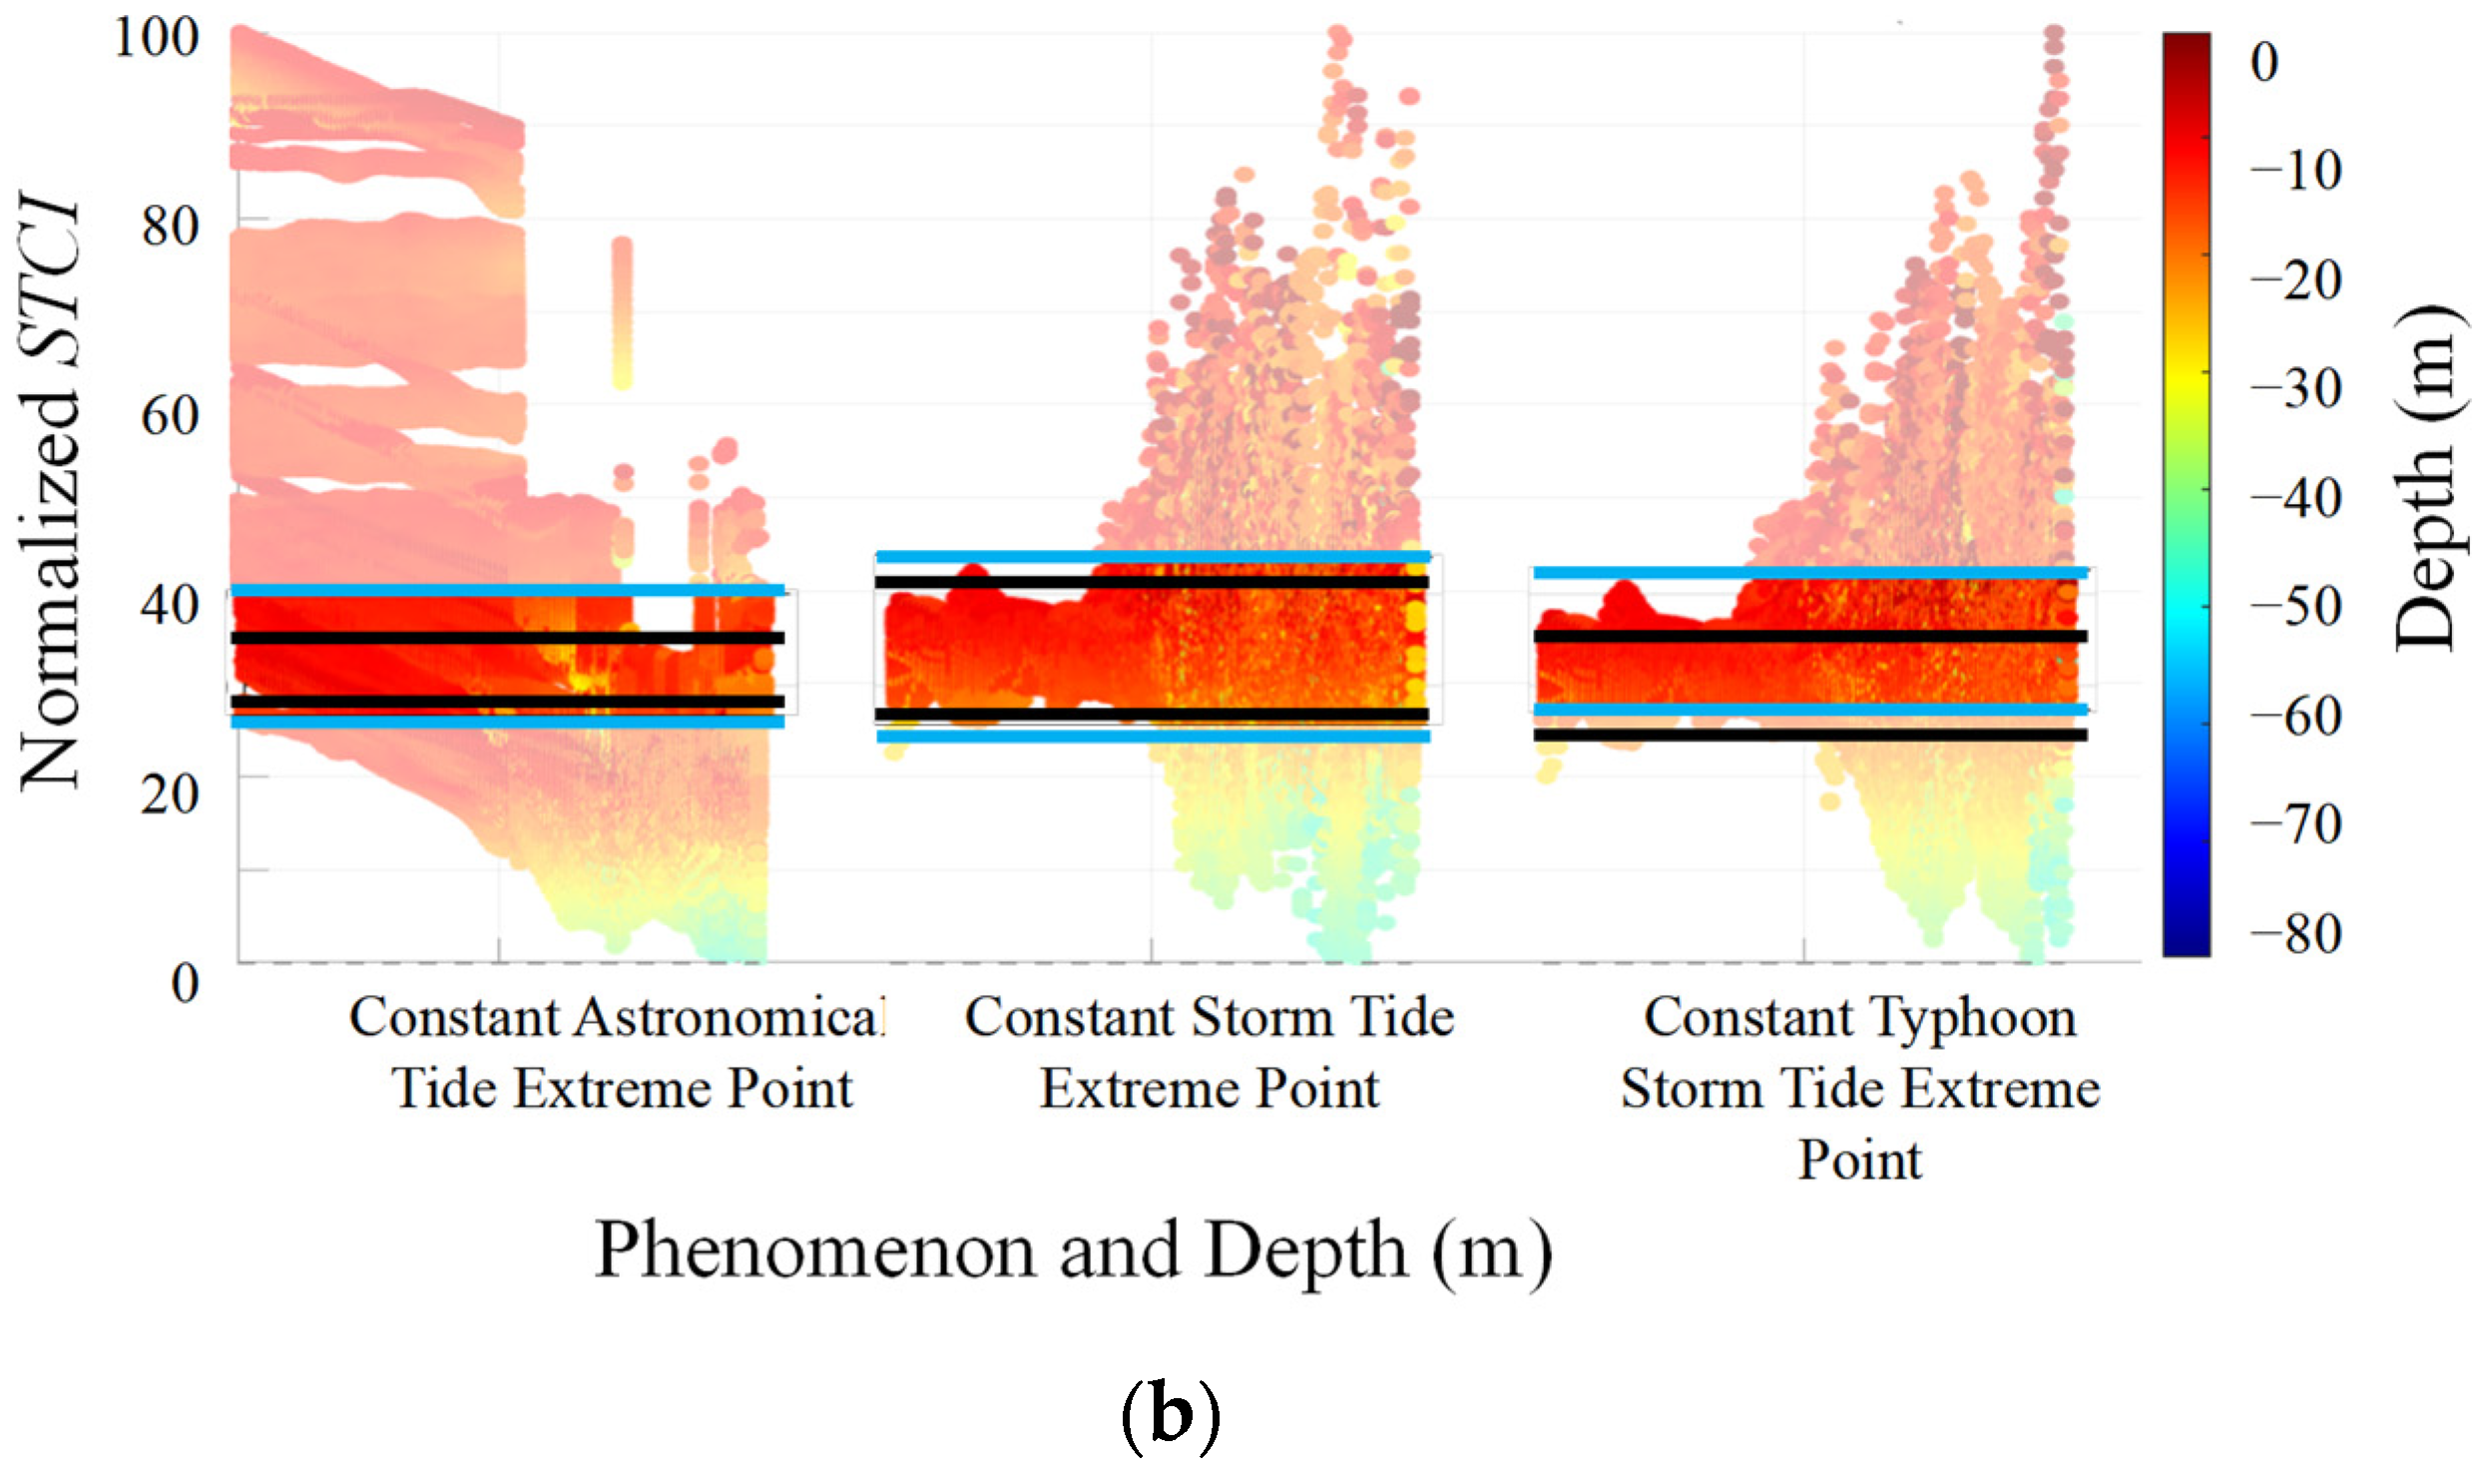
Figure 6d provides an overall view of the distribution characteristics of the “constant extreme flow velocity points” throughout 85% of the typhoon period, demonstrating that these extreme values are closely related to water depth, slope, and sea surface width.
The “constant storm surge extreme flow velocity points” of Typhoon In−fa (
Figure 6d) are primarily concentrated in nearshore areas, shallow water zones, and the leeward sides of islands, where wind stress exerts a significant influence. Extreme flow velocities are notably higher in island regions, especially in wake zones, where velocities can exceed 3 m/s. As water depth increases, extreme flow velocities gradually decrease due to the diminishing effects of wind stress, which is most pronounced in shallow water areas. Although wind−induced velocities typically decrease with depth due to the exponential attenuation of wind stress, local topographic effects and the constructive coupling between tidal currents and storm surge can lead to secondary enhancements of the flow. In some regions, this results in relatively higher velocities even at depths beyond 30 m, where interference and channeling effects become significant. These localized phenomena do not contradict the overall decay trend but rather highlight complex hydrodynamic interactions in the study area.
The distribution of astronomical tide extreme flow velocity points is relatively uniform but sparse, concentrated primarily in intermediate water zones. Here, extreme flow velocities are largely driven by periodic tidal flows, with weak bottom friction in intermediate zones allowing the tidal energy to disperse smoothly. In other depth regions, “constant astronomical tide extreme flow velocity points” are almost nonexistent. In deeper waters, astronomical tide−induced flow velocities tend to stabilize, with overall velocities remaining low and peak values typically below 2 m/s.
The “constant typhoon storm surge coupled extreme flow velocity points” exhibit more complex distribution characteristics. As indicated by the purple points, most extreme velocities occur in narrow waterways within shallow water zones, with some extending into intermediate water zones. In areas with relatively small sea surface widths, extreme velocity points are widely distributed. Near islands and in shallow waters, coupled extreme flow velocities can exceed 3 m/s, while in deep water zones, the extreme flow velocities stabilize as the influence of wind stress and topographic features diminishes.
Across all three flow velocity types, extreme values decrease and stabilize with increasing water depth. While astronomical tide velocities exhibit a more uniform distribution in deeper water zones, the extreme values of storm surges and typhoon storm surges are concentrated in shallow water areas. Extreme flow velocities from storm surges and typhoon storm surges are concentrated in regions with complex seabed topography and steeper slopes, particularly in narrow waterways, around islands, and on the leeward sides of islands. In these areas, localized seabed topography amplifies wind stress effects, leading to significantly higher extreme flow velocities. In areas with small sea surface widths (0–4 km), especially near islands and coastal zones, extreme flow velocities are markedly higher. Conversely, in areas with larger sea surface widths (6–10 km), wind energy dissipates more effectively, resulting in an almost complete absence of extreme flow velocity points.


