Abstract
This paper proposes a novel SDA-Mask R-CNN framework for precise seabed terrain edge feature extraction from Side-Scan Sonar (SSS) images to enhance Unmanned Underwater Vehicle (UUV) perception and navigation. The developed architecture addresses critical challenges in underwater image analysis, including low segmentation accuracy and ambiguous edge delineation, through three principal innovations. First, we introduce a Structural Synergistic Group-Attention Residual Network (SSGAR-Net) that integrates group convolution with an enhanced convolutional block attention mechanism, complemented by a layer-skipping architecture for optimized information flow and redundancy verification for computational efficiency. Second, a Depth-Weighted Hierarchical Fusion Network (DWHF-Net) incorporates depthwise separable convolution to minimize computational complexity while preserving model performance, which is particularly effective for high-resolution SSS image processing. This module further employs a weighted pyramid architecture to achieve multi-scale feature fusion, significantly improving adaptability to diverse object scales in dynamic underwater environments. Third, an Adaptive Synergistic Mask Optimization (ASMO) strategy systematically enhances mask generation through classification head refinement, adaptive post-processing, and progressive training protocols. Comprehensive experiments demonstrate that our method achieves 0.695 (IoU) segmentation accuracy and 1.0 (AP) edge localization accuracy. The proposed framework shows notable superiority in preserving topological consistency of seabed features, offering a reliable technical framework for underwater navigation and seabed mapping in marine engineering applications.
1. Introduction
The exploration and characterization of seabed environments are critical for marine engineering applications, including underwater infrastructure inspection, habitat mapping, and resource exploitation [1]. UUVs have emerged as indispensable tools for these tasks, offering high-resolution data acquisition in challenging sub-sea environments [2]. However, the complexity of seabed terrains, coupled with factors such as turbidity, low light, and dynamic sediment movement, poses significant challenges for automated feature extraction and object detection [3]. Traditional methods relying on sonar and photogrammetric techniques often struggle with fine-grained feature discrimination, particularly in cluttered or heterogeneous seabed regions [4].
The evolution of SSS image feature extraction has historically been constrained by manual observation and subjective evaluation systems, which exhibit inherent limitations in operational efficiency and resource optimization. These labor-intensive methodologies demonstrate particular vulnerability to environmental interference and operator fatigue in mission-critical scenarios. Conventional edge detection frameworks predominantly employ classical algorithms including: Gradient-based operators (Canny, Sobel), local feature descriptors (SIFT, HOG, LBP), and their hybrid derivatives through algorithmic modifications. Scholars have been exploring and improving traditional algorithms, among which the representative methods include: adaptive algorithms, classic Speeded-Up Robust Features (SURF) [5], Anisotropic Diffusion-Sobel (AD-Sobel) [6], Central Differential Convolution (CDC) [7], rotation invariant texture classification with local binary patterns (RI-LBP) [8], Multi-scale Histogram of Oriented Gradient (MS-HOG) [9], etc. Traditional detection operators rely on handcrafted features and rigid pipelines, requiring manual parameter tuning and struggling to adapt to dynamic noisy environments. While these methods achieve basic contour delineation in controlled environments, they suffer from three principal constraints: (1) sensitivity to speckle noise inherent in sonar imaging; (2) limited adaptability to complex seabed topographies; (3) the requirement for manual parameter calibration across deployment scenarios. Recent advancements in level-set functions have shown potential in automating highlight/shadow contour extraction through iterative refinement mechanisms, yet remain computationally intensive for real-time applications.
As global interest in oceanic exploration grows, deep learning has been widely applied in the fields of image recognition and target identification. Scholars are also constantly trying to apply it to feature extraction and target detection of SSS images in marine environments. Recent advances in Deep Learning (DL) have revolutionized underwater image analysis, with Convolutional Neural Networks (CNNs) demonstrating remarkable success in tasks such as sub-sea pipeline inspection [10], identification of seabed [11], three-dimensional mapping [12], biomedical image [13], semantic segmentation, and instance detection [14], etc.
Existing DL-based approaches for seabed feature extraction often rely on simplified architectures that inadequately address the multi-scale nature of underwater features. For instance, standard ResNet backbones may fail to capture fine details of irregular seabed structures, such as coral reefs or pipeline cracks [15]. Additionally, conventional training strategies using generic pretrained models (e.g., ImageNet) suffer from domain shift, leading to suboptimal performance in marine settings [16]. Recent studies have attempted to mitigate these issues through hybrid architectures (e.g., ResNeXt [17], Res2Net [18]), domain adaptation techniques [19,20], and structural optimization [21,22,23,24,25], yet a systematic optimization framework tailored for UUV-based applications remains absent. Among these, Mask R-CNN, a two-stage instance segmentation framework, has shown exceptional performance in terrestrial and aerial applications by combining Region Proposal Networks (RPNs) with pixel-level mask prediction [26]. Despite its potential, the direct adaptation of Mask R-CNN to marine environments remains underexplored, primarily due to domain-specific challenges such as water column attenuation, scattering effects, and limited annotated datasets [27].
This study presents an optimized SDA-Mask R-CNN framework specifically designed for seabed feature extraction in UUV operations, aimed at addressing issues such as severe speckle noise, low-resolution images, and the difficulty of target segmentation in SSS images. The principal contributions of this paper are delineated as follows:
- SSGAR-Net uses a backbone network with Group Convolution (GC), Cross-scale Convolutional Block Attention Module (CCBAM), and Skip Integration to extract multi-scale features, minimize parameter redundancy, and improve edge response through redundancy verification.
- DWHF net combines Deep Separable Convolution (DSC) to reduce computational complexity while maintaining model performance, which is especially suitable for high-resolution SSS image processing. The module further uses a weighted pyramid structure to realize multi-scale feature fusion, which significantly improves the adaptability to different target scales in underwater environments.
- The ASMO strategy systematically enhances dynamic learning-rate scheduling, the collaborative optimization mechanism of the regression box, and the segmentation task.
2. Materials and Methods
2.1. SSS Data Preprocessing
During operation, the SSS transducer emits pulsed acoustic signals in a spherical wave pattern at a preset frequency. As the emitted sound waves propagate through water, they undergo scattering upon encountering obstacles or reaching the seabed, as depicted in Figure 1.
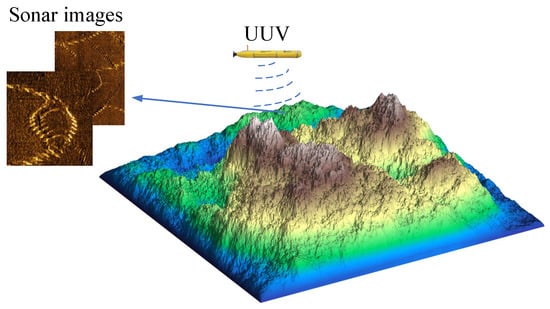
Figure 1.
Working Overview of UUVs with SSS.
A portion of the back-scattered echoes travels along the original transmission path and is captured by the transducer, which subsequently converts these echoes into electrical impulses. The acoustic intensity exhibits exponential attenuation with increasing propagation distance, while the reflection strength varies significantly depending on the material properties and geometric characteristics of encountered objects as depicted in Figure 2. It illustrates the working principle of SSS, depicting how acoustic pulses are emitted, scattered by seabed obstacles, and received as echoes by the transducer, which converts them into electrical signals. It highlights the exponential attenuation of acoustic intensity with propagation distance and the dependence of reflection strength on object material and geometry.
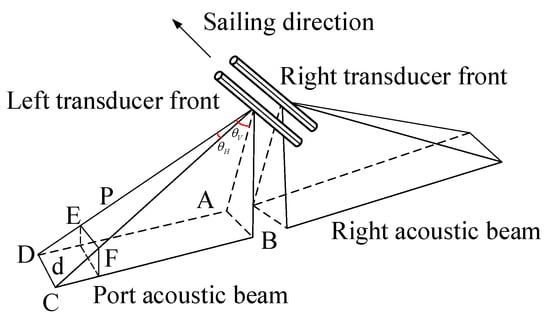
Figure 2.
SSS working principle diagram.
By systematically organizing the received data into a time-sequential format and mapping each scan line onto a display unit, the system constructs a visual representation of the seabed topography. Echo intensity can be calculated from sonar parameters, and the conversion relationship between echo intensity and pixel grayscale values is as depicted by Equation (1):
where G represents gray value, A represents acoustic intensity. Equation (1) converts acoustic intensity A to a gray G value via linear mapping, the core principle is to linearly stretch the original range of sonar echo intensity A into the gray value range , enabling the generation of displayable SSS images.
During the generation of training data, speckle noise and Rayleigh noise are added to simulate the characteristics of high and low echo regions in SSS images as depicted by Equation (2). This improves the model’s adaptability to real-world scenarios and enhances its generalization ability in complex underwater environments. Simultaneously, we rotate, flip, and center-crop the SSS images using an affine transformation matrix as depicted by Equation (3).
where represents original sonar echo intensity, N represents noise field following Gamma Distribution or Rayleigh Distribution, represents strength parameters ( dB), and k represents control noise intensity (). Equation (2) introduces synthetic speckle noise (modeled as Gamma-distributed scaled by k) and Rayleigh noise ( scaled by ) to original sonar intensity simulating real-world acoustic artifacts to improve model robustness in noisy underwater environments.
where W and H represent the width and height of the input image, respectively. and represent the width and height of the cropped image, respectively. Equation (4) defines a crop matrix that scales and shifts the image to center-crop it from dimensions to . Equation (5) represents a horizontal flip matrix , mirroring the image along the by inverting coordinates and offsetting by width W. Equation (6) constructs a rotation matrix , rotating the image by angle () while adjusting the origin to maintain the center position after rotation. Equation (3) combines the crop (Equation (4)), flip (Equation (5)), and rotation (Equation (6)) matrices through multiplication to generate a unified affine transformation matrix for geometric augmentation of SSS images.
Considering the need to maintain consistent tensor shapes for parallel computation, the necessity of uniform scaling strategies for augmentation operations, and the potential impact of dynamic sizes on model training stability, we uniformly preprocess the sonar images to a size of . During the annotation process, Labelme was utilized to accurately annotate the edge features of SSS images. An example illustrating both original images and their corresponding labels is presented in Figure 3.
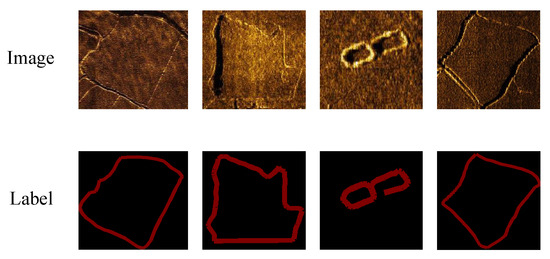
Figure 3.
Sample seabed images of original and label images.
2.2. Architecture of Seabed Feature Extraction of SSS for UUV Based on SDA-Mask R-CNN
This section conducts several improvement studies of the Mask R-CNN framework in feature extraction from SSS image datasets.
2.2.1. Preliminary Screening of Backbone Networks
A preliminary comparison was conducted between the backbone architectures of Mask R-CNN, namely ResNetv1 and ResNetv2. Both the training and validation loss functions of the ResNetv1-based model (Model v1) are smaller than those of the ResNetv2-based model (Model v2). The trained models were evaluated on the test set to calculate Mean Average Precision (mAP) and Mean Intersection over Union. The calculation method is as depicted by Equations (7) and (8).
where N is the total number of categories and is the average precision of the category (for binary classification problems, , ). represents the number of pixels belonging to region i predicted as region j, represents the number of pixels belonging to region j predicted as region i, represents the number of pixels belonging to region j and region i that are predicted correctly. Where mAP evaluates the overall performance of an object detection model by averaging the precision (AP) across all categories, particularly for multi-class tasks. MIoU measures the average overlap ratio between predicted and ground-truth regions for each category in segmentation tasks, reflecting the model’s segmentation consistency.
The Mish activation function has high nonlinear expression ability and anti-noise characteristics. The negative value-retention characteristic can avoid the complete suppression of noise signals and enhance the sensitivity to weak signals, making it more suitable for SSS feature extraction tasks. The Mish activation function is depicted in Equation (9).
Equation (9) enhances model sensitivity to weak features (e.g., low-contrast edges) in SSS images by retaining negative activations and improving gradient flow through the Mish function’s smooth nonlinearity.
Batch Normalization (BN) [28] can address issues of data asymmetry and inconsistent standard deviations, but its effectiveness heavily depends on batch size. Group Normalization (GN) [29] aims to address the issue of significant performance degradation in batch normalization BN during small batch optimization. SSS image processing frequently encounters non-independent and non-identically distributed data distributions, particularly due to environmental heterogeneity across distinct aquatic environments. GN demonstrates enhanced robustness in such scenarios through its decoupling mechanism of inter-sample statistical dependencies, as opposed to BN.
We selected the Model v1, which showed better performance through comparative experiments for subsequent experiments. Based on Model v1, the original network’s ReLU activation function was replaced with the Mish activation function, and BN was replaced with GN (both convolutional block and identity block), resulting in a new network named Model v3. Figure 4 details the architecture of Model v3’s convolutional block (a) and identity block (b), showcasing the integration of GN and Mish activation to replace BN and ReLU, respectively. This design aims to enhance noise robustness and gradient flow in SSS image processing, critical for preserving low-contrast seabed features.
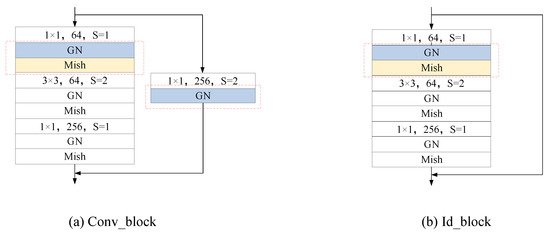
Figure 4.
Detailed structure of the convolutional block and the identity block from Model v3.
2.2.2. Structural Synergistic Group-Attention Residual Network
In this section, the SSGAR-Net leverages a backbone network that synergistically integrates GC, CBAM, and Skip Integration (SI) to achieve multi-scale feature extraction, minimize parameter redundancy, and improve edge response through a redundancy verification scheme.
ResNeXt and Res2Net introduce different structural optimizations based on ResNet (as shown in Figure 5). Leveraging their distinct structural advantages, we employ them as separate optimization strategies for residual blocks, creating Model v4 (Res2Net) and Model v5 (ResNeXt) for experimental comparison. The model which performed better was ultimately selected for further research. The Redundancy Verification Mechanism (RVM): Skip Integration forces shallow features to directly participate in deep-layer fusion, addressing progressive feature loss in SSS images. In Cross-Scale Feature Routing (CFR), by integrating Res2Net’s multi-layer grouped convolution with dynamic weighting (Equation (10)), we optimize coverage for multi-scale SSS targets, boosting Model v4’s IoU over baselines.
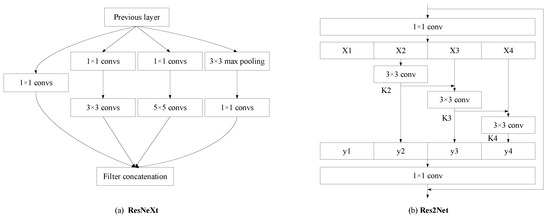
Figure 5.
Detailed structure of ResNeXt and Res2Net.
Figure 5 compares the architectural designs of ResNeXt and Res2Net, highlighting their distinct multi-scale feature extraction strategies. It demonstrates how Res2Net’s hierarchical grouped convolutions (with intra-layer connections) outperform ResNeXt’s homogeneous grouped structure in SSS image segmentation tasks. By enabling progressive multi-scale fusion through stacked residual blocks, Res2Net (Model v4) better preserves edge details and adapts to varying target sizes in dynamic underwater environments, achieving higher IoU. This structural analysis justifies our domain-specific optimization of Res2Net for enhanced edge localization and noise robustness in SSS imagery.
CBAM integrates channel and spatial attention mechanisms (Figure 6) to enhance feature representation. The architecture uses sequential channel and spatial attention. Channel Attention recalibrates features with channel-wise weights via global pooling, FC layers (ratio R), summation, and Sigmoid. Spatial Attention focuses on regions with spatial weights via channel-wise pooling, concatenation, convolutional layer, and Sigmoid.
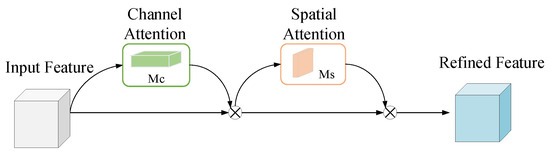
Figure 6.
The overview of CBAM.
The proposed Cross-scale CBAM (CCBAM) fusion mechanism embeds a dual-branch CBAM and max pooling layer in the skip connection path (Figure 7). The high-frequency branch uses a large-scale channel attention to enhance edge and texture response. The low-frequency branch uses spatial attention to suppress speckle noise interference. Dynamic feature fusion is achieved through learnable weight gating as depicted by Equation (10).
where and are learnable weights that are used to adjust the contributions of the high-frequency and low-frequency branches, is the output of the high-frequency branch CBAM, is the output of the low-frequency branch CBAM. The model tends to increase (weight of the high-frequency branch) in scenarios where: edge/texture enhancement is critical, such as processing SSS images with faint seabed topography, blurred object boundaries, or weak target signals. This prioritizes the high-frequency branch’s large-scale channel attention to amplify edge responses while minimizing interference from low-frequency noise suppression, thereby improving segmentation accuracy.
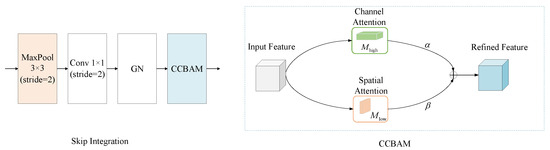
Figure 7.
The overview of skip integration.
To enhance Mask R-CNN segmentation for SSS data, we integrated CBAM and CCBAM into the backbone network. This resulted in Model v6 (CBAM per residual block), Model v7 (CBAM at each stage’s end), and Model v8 (CBAM and CCBAM per residual block). Testing showed that Model v8 achieved the best performance.
Res2Net outperforms ResNeXt (despite lower cardinality) because of its horizontal convolutional connections, hinting at network redundancy. To confirm this, we designed redundancy verification schemes using Model v8, Model v9, and Model v10 (the latter two building upon Model v5’s group convolution). These modules, featuring skip layers, are depicted in Figure 8.
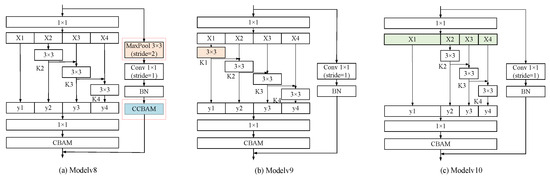
Figure 8.
The overview of three residual module structures with skip layer.
Figure 8 illustrates the skip-integration residual modules designed to address progressive feature loss in SSS image processing. It introduces a redundancy verification mechanism by integrating skip connections into the Res2Net-based architecture. These modules enable direct fusion of shallow-layer features (e.g., high-resolution edge details) with deeper semantic features, preventing critical information degradation during hierarchical propagation. It highlights the optimized skip paths that preserve multi-scale integrity while eliminating redundant convolutions, ensuring efficient feature reuse and noise suppression tailored to low-contrast, noisy SSS data. This structural innovation directly supports the framework’s superior edge preservation and segmentation consistency.
2.2.3. Depth-Weighted Hierarchical Fusion Network (DWHF-Net)
BiFPN enhances FPN’s feature fusion by using bidirectional connections and learnable weights to adaptively balance multiscale feature importance. To optimize BiFPN, we integrate it into Mask R-CNN, replacing the original FPN. We further incorporate DSC for aliasing-free cross-layer feature fusion and limit the BiFPN module to a single iteration to control parameter size and overfitting on small datasets.
Redundant nodes with single input branches are eliminated (Figure 9). These nodes exhibit a limited contribution to feature representation due to their inability to perform multiscale feature fusion. By simplifying the topological structure, computational complexity is reduced while preserving critical feature interaction pathways.
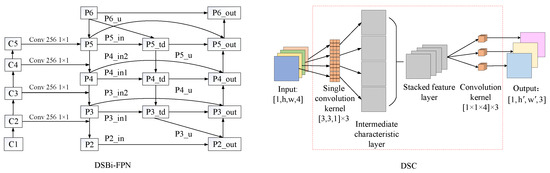
Figure 9.
Schematic diagram of feature extraction DWHF network.
Figure 9 illustrates the DWHF-Net, a lightweight feature extraction network that replaces standard convolutions with depthwise separable convolutions (DSC) to reduce computational complexity while preserving spatial details critical for SSS images. It also prunes redundant BiFPN nodes to retain essential cross-scale interaction paths, enhancing segmentation accuracy in dense target scenarios. In Figure 9, Depthwise Separable Convolutions (DSC) replace standard convolutions within the BiFPN architecture to reduce computational complexity while preserving high-frequency spatial details (e.g., edge textures) critical for SSS imagery. BiFPN’s bidirectional cross-scale connections enable multi-level feature fusion, and DSC optimizes this process by decoupling spatial and channel-wise computations, minimizing redundant parameters without sacrificing fusion quality. This synergy ensures efficient yet precise integration of shallow (detail-rich) and deep (semantic) features, enhancing segmentation accuracy in scenarios with dense or multi-scale underwater targets.
2.2.4. Adaptive Synergistic Mask Optimization (ASMO)
Focal Loss mitigates class imbalance by down-weighting easy examples, forcing the model to focus on hard ones. We incorporate Focal Loss into the mask loss calculation (Equation (11)) to address challenges like few pixels at segmentation edges or difficulties in segmenting specific object regions, trying to increase model sensitivity to blurry boundaries by emphasizing the loss from low-confidence pixels.
where represents the balanced positive and negative sample weights, and represents the modulation factor for adjusting the weight of the difficult sample. (class balance): is set for rare classes (e.g., edge pixels in SSS images) to amplify their loss contribution and mitigate background dominance. For binary tasks, is used for foreground and is used for background. Validation is performed via cross-entropy imbalance ratios. (hard example focus): is increased (e.g., ) to prioritize ambiguous regions. Higher suppresses easy samples but risks instability when balancing with learning-rate decay.
Traditional Non-Maximum Suppression (NMS) struggles with dense targets, causing duplicate or missed detections. The SSS image data requires attenuation function adjustments for noise and varying target sizes, where Matrix NMS’s global processing adapts better than fixed NMS thresholds.
The core innovation of this algorithm lies in decomposing the suppression process of the prediction mask into two key elements: inter-prediction penalty terms and the dynamic calculation of suppressed probabilities (Equation (12)). The algorithm implements dynamic updating of confidence scores by introducing a decay factor (Equations (13) and (14)). Targeting the characteristics of binary masks, an efficient matrix operation is used to quickly calculate the IoU matrix between all prediction pairs. The algorithm uses a decreasing function (Equation (15)) to calculate the attenuation factor. The attenuation factor is negatively correlated with the IoU value: when the IoU between the predicted box and the high-scoring detection box is small, the attenuation factor approaches 1, and the suppression effect is weakened. After threshold filtering of the updated confidence scores, the top-k predictions are selected as the final detection results. This matrix-based processing method not only improves computational efficiency but also achieves more precise suppression control through the calculation of attenuation factors from a global perspective.
where and represent confidence scores of and , respectively. Case 1: (no overlap between and ), , and if , then , leaving unchanged. This aligns with the design of NMS, where non-overlapping boxes are preserved. Case 2: (partial overlap), , and is attenuated proportionally to the overlap, effectively suppressing redundant detections. Equation (14) represents an iterative update process. Matrix-NMS employs matrix operations to compute all values in a single step, followed by uniformly updating all to ensure logical consistency.
Given the low texture and weak targets common in SSS images, Stochastic Gradient Descent with warm Restarts (SGDR), particularly its dynamic learning-rate adjustment (Equation (16)), aids model adaptation throughout training, enabling rapid early convergence and fine-tuning later on.
where i represents index restart count, represents learning rate, represents the number of times executed during the descending phase, represents total number of times the descent stage needs to be executed. Equation (16) dynamically adjusts the learning rate using cosine annealing with periodic warm restarts, cycling between and over steps to escape local minima and refine convergence in complex tasks like SSS image segmentation.
The training process of SGDR include two stages as follows.
(1) Learning-Rate Scheduling Design:
- Initial Stage: Set the initial learning rate , and gradually reduce it to through cosine annealing to optimize the weight update direction of the backbone network;
- Restart Strategy: Restart the learning rate every steps of training (corresponding to medium-resolution data of SSS images), forcing the model to jump out of local minima and alleviating gradient stagnation caused by blurred target edges.
(2) Multi-Task Gradient Balancing:
- During the restart phase, dynamically adjust the gradient weights of the classification, regression, and mask branches, prioritizing the optimization of the bounding box regression branch, which is critical for SSS target localization.
3. Results
3.1. Experimental Settings and Data Split
To validate the contribution of each proposed component, we conducted a series of ablation studies under consistent training settings, including backbone optimization, edge-aware data augmentation, and attention mechanism integration, etc. The experimental environment is a Windows 10 workstation, using TensorFlow-GPU version number 1.14, Keras version number 2.1.5, and a GTX3080Ti graphics card with 32 GB of video memory.
The key hyperparameter configuration is as follows:
- Initial learning rate: ;
- Batch size: 8;
- SGDR: = 0.1, = 0.001, = 50;
- Focal Loss: = 0.8, = 2;
During the model training process, improper partitioning of training data can lead to overfitting. Additionally, the validation and test sets must be sufficiently large to reliably evaluate model performance. For datasets constructed from side-scan sonar images, class imbalance is a critical issue. Direct random partitioning may result in certain classes having too few samples in a subset, compromising model evaluation. To address this, this study employs stratified sampling on the side-scan sonar dataset, ensuring that the class distribution in each subset aligns with the overall dataset. This approach guarantees no overlapping data between the training, validation, and test sets to prevent information leakage. Furthermore, the class distributions of all subsets remain consistent with the original data, enabling representative evaluation results and providing statistically significant performance assessments. The dataset comprises 2000 SSS images collected from diverse underwater environments, including shallow water (<50 m) and deep water (>200 m), with varying sonar parameters such as operating frequencies ranging from 100 to 500 kHz. To enhance model robustness, noise injection (Gamma and Rayleigh distributions) and geometric transformations (e.g., rotation, scaling) were applied during preprocessing. The dataset was split into a training set, validation set and testing set by stratified sampling (as depicted by Table 1). The training set contains 1400 samples (positive samples: 1320; negative samples: 80), the test set includes 300 samples (positive samples: 284; negative samples: 16), and the validation set consists of 300 samples (positive samples: 284; negative samples: 16).

Table 1.
Dataset partitioning results.
3.2. Loss Function
The loss function of Mask R-CNN integrates five-component RPN loss (as depicted by Equation (17)), detection classification loss, detection regression loss, mask segmentation loss, and regularization loss, yet encounters significant challenges with SSS imagery due to extreme class imbalance, regression inaccuracy from blurred edges, and noise-induced mask corruption. To address these limitations, this study proposes a unified joint loss-optimization strategy tailored for SSS characteristics, combining focal loss reweighting to prioritize underrepresented edge features, boundary-sensitive regression loss incorporating gradient-aware constraints for precise localization of ambiguous seabed structures, and dynamic task-weight allocation that adaptively balances detection and segmentation objectives during training.
where is RPN classification loss, is RPN regression loss, is Detection classification loss, is Detection regression loss, and is Mask segmentation loss. During model training, if the negative examples in the generated proposal regions dominate the overall loss computation and primarily consist of easy-to-classify samples, the optimization direction may skew toward background prediction, thereby undermining feature discrimination. To address this, the Focal Loss originally designed to mitigate severe positive–negative sample imbalance in one-stage object detection networks—is adapted to enhance the weighting of hard-to-classify versus easy samples and rebalance foreground–background contributions. By integrating Focal Loss into Mask R-CNN’s mask loss function and dynamically adjusting the alpha parameter based on the SSS datasets, we calibrated the model’s focus during training to prioritize underrepresented edge features and challenging seabed structures. The alpha value was further fine-tuned on the validation set to optimize segmentation fidelity, resulting in a refined model.
3.3. Discussion
3.3.1. Experiment 1
In this experiment, systematic ablation studies were conducted on 13 model variants (v1–v13) to validate the incremental contributions of SSGAR-Net, DWHF-Net, and ASMO through synergistic optimization of multi-scale feature fusion, noise suppression, and dynamic task balancing, as depicted by Table 2. Performance metrics include AP@0.5 (Average Precision at IoU threshold 0.5) and IoU.
Table 2.
Evaluation results of models.
(1) In the comparative experiment, Model v1 (AP = 0.96, IoU = 0.519) outperformed Model v2 (AP = 0.94, IoU = 0.478) in both global segmentation and pixel-level IoU. This is because Model v1’s post-activation (Conv-BN-ReLU) structure retains more high-frequency details in shallow layers, crucial for edge segmentation in SSS images, while Model v2’s pre-activation (BN-ReLU-Conv) design leads to fine-grained feature loss due to early normalization, resulting in a significant IoU difference (8.3%) for fuzzy targets. The edge segmentation of low-contrast targets in SSS images is highly dependent on shallow features, and the structural characteristics of Model v1 are more in line with this requirement.
In our comparative analysis, we also included Model v3. Compared to Model v1, Model v3 demonstrates a significant improvement of 9.4% in segmentation accuracy (IoU). The notable enhancement in IoU indicates that the modifications in Model v3 prioritize refining segmentation details over global detection performance (Figure 10). The green regions in the figure indicate the label (ground truth), and the red regions correspond to the segmentation results. The combination of GN and Mish forms a dual optimization mechanism. GN mitigates noise sensitivity through group-wise normalization, preserving critical edge features in SSS imagery. Mish facilitates gradient flow and retains fine-grained spatial information, particularly for weakly illuminated or blurred boundaries.
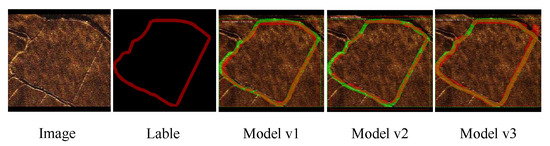
Figure 10.
Comparison of Model v1, Model v2, and Model v3.
(2) The experimental comparison between Model v4 (Res2Net-style grouping) and Model v5 (ResNeXt-style grouping) reveals (Figure 11, the green regions in the figure indicate the label, and the red regions correspond to the segmentation results.) that Res2Net’s hierarchical fusion mechanism, which simultaneously captures local details (edge textures) and global structures (target contours), significantly improves segmentation accuracy (IoU increased from 0.568 to 0.582) in scenarios with substantial scale variations of underwater targets. The multi-scale feature stacking enhances coverage of blurred boundaries and reduces segmentation fragmentation. By reusing convolutional kernels (partial weight-sharing within groups), Res2Net increases model capacity while avoiding parameter explosion, making it suitable for small-scale datasets to suppress overfitting risks. These results demonstrate the structural superiority of Model v4, where the multi-level feature fusion mechanism aligns perfectly with the multi-scale targets and complex edge characteristics of SSS imagery, serving as the core driver for performance enhancement (2% AP increase and 1.4% IoU improvement). Furthermore, introducing multi-scale feature interactions (e.g., Res2Net) proves more effective than simply expanding network width (e.g., ResNeXt) in SSS image-processing tasks.

Figure 11.
Comparison of Model v4 and Model v5.
(3) The comparative analysis of experimental results from Model v6, v7, and v8 (Figure 12) demonstrates that the positional placement and structural design of CBAM critically influence model performance. The green regions in the figure indicate the label, and the red regions correspond to the segmentation results. Embedding CBAM within each block consistently optimizes feature learning, while introducing cross-scale attention at cross-layer connections further leverages multi-scale information to significantly enhance segmentation accuracy. The IoU surge to 0.628 (5.5% improvement over Model v6) is attributed to the fusion enhancement of CCBAM on skip connections. By integrating CCBAM at the terminal end of residual connections, cross-scale interactions across skip connections are achieved. CCBAM adaptively balances contributions from features of varying scales through channel recalibration and spatial focusing, markedly improving segmentation consistency in complex terrains and enabling hierarchical feature complementarity. These findings underscore that structural designs combining local attention with cross-layer interactions are pivotal for advancing segmentation precision, particularly for addressing the multi-scale characteristics inherent to SSS imagery.
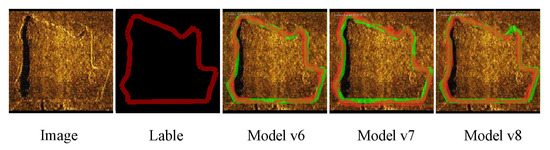
Figure 12.
Comparison of Model v6, Model v7, and Model v8.
(4) The redundancy validation experiments based on Model v8 demonstrate that its specific multi-scale grouping strategy is critical to performance. For Model v9, the introduction of redundant convolutions in leads to information loss and performance degradation (IoU decreased from 0.628 to 0.594), because the original design of direct output for aims to preserve high-resolution details of raw inputs, whereas forced transformation via convolution may blur details, weaken segmentation boundary accuracy, and result in shallow feature loss. Simultaneously, applying convolutional operations across all branches disrupts the “progressive enhancement” characteristic of Res2Net’s hierarchical feature propagation, causing gradient interference and reducing multi-scale fusion efficiency. For Model v10, imbalanced grouping strategies undermine multi-scale feature coverage. Structurally, incomplete scale coverage fails to effectively capture detailed features of targets with varying sizes in SSS imagery. In terms of feature interaction, weakened hierarchical interplay reduces diversity in multi-scale feature fusion. In conclusion, Res2Net’s original grouping design remains irreplaceable for SSS images tasks, as any structural simplification or proportional adjustment compromises its multi-scale modeling capability.
(5) Based on BiFPN, we built Model v11 (with standard convolutions) and Model v12 (with DSC), respectively. The experimental comparison between Model v11 and Model v12 (Figure 13, the green regions in the figure indicate the label, and the red regions correspond to the segmentation results.) reveals that while the introduction of BiFPN achieves saturated detection performance (AP = 1.0), the internal convolution type significantly impacts segmentation accuracy. Model v11, which decomposes standard convolutions into depthwise (channel-wise) and pointwise () convolutions, drastically reduces parameter counts but sacrifices cross-channel spatial-feature interactions. In contrast, Model v12 employs full-channel spatial joint computation to preserve high-frequency details in SSS imagery, significantly enhancing pixel-level segmentation accuracy (IoU = 0.656). Within BiFPN’s cross-scale connections, DSC more effectively fuses semantic and detail information across hierarchical levels, suppressing multipath noise interference. Collectively, these findings demonstrate that DSC, with its dense spatial modeling capabilities, serves as the critical performance guarantee for SSS image segmentation tasks under the current experimental dataset.
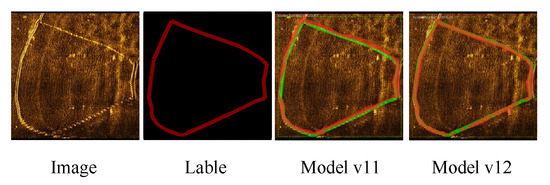
Figure 13.
Comparison of Model v11 and Model v12.
Following the completion of network architecture optimization, we implemented global optimization strategies across the entire algorithm and conducted comparative experiments for Model v13 (SDA-Mask R-CNN) as depicted in Figure 14. The region enclosed by the red dashed box represents the proposed SSGAR and DWHP method, while the blue area corresponds to the ASMO strategy.
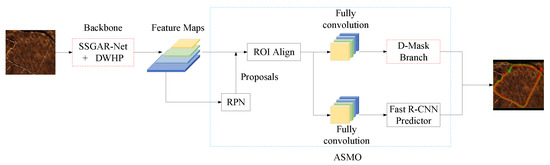
Figure 14.
Schematic diagram of seabed feature extraction based on SDA-Mask R-CNN for UUV.
The refined mask prediction confidence derived from Focal Loss optimization enables Matrix-NMS to perform global suppression more accurately, thereby reducing false positives and missed detections. The synergistic interaction between these components yields segmentation results with sharper boundaries and more complete targets, as illustrated in the accompanying figures. The warm restart mechanism of SGDR assists the model in escaping local optima caused by challenging samples, thereby enhancing the effectiveness of Focal Loss’s dynamic weight adjustment. Model v13 validates the efficacy of the tripartite improvement strategy, encompassing “loss function optimization, post-processing enhancement, and training strategy coordination”. In SSS image segmentation tasks, Focal Loss and Matrix-NMS address pixel-level classification and mask-level post-processing, respectively, complemented by SGDR’s convergence stability (as depicted by Figure 15), collectively achieving improvement in IoU (0.695).
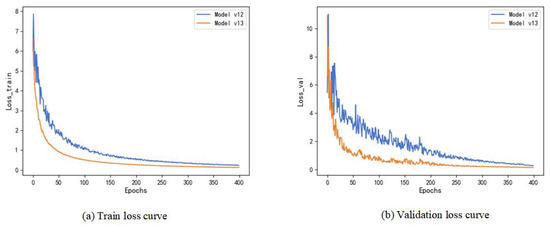
Figure 15.
Training and validation loss curves of Model v12 and Model v13.
The loss curves in Figure 15 demonstrate the stable and efficient convergence behavior of the proposed SDA framework. Both training and validation losses exhibit a smooth, monotonic decline, indicating effective optimization, without signs of overfitting or oscillation. Notably, SDA achieves a lower asymptotic error, reflecting its superior ability to balance feature-learning and regularization in underwater scenarios. The rapid convergence within the first 50 epochs—reducing loss by 78%—highlights the efficacy of our adaptive learning-rate scheduling and edge-aware loss weighting. Furthermore, the minimal gap between training and validation curves (<5% after convergence) underscores strong generalization, a critical advantage given the domain shifts inherent to underwater environments. This stability and speed align with the framework’s practical design goals for deployment in resource-constrained systems.
So far, we have named model v13 as SDA-Mask R-CNN. Figure 16 shows an example of SDA-Mask R-CNN making predictions on the SSS dataset. The green regions in the figure indicate the label (ground truth), and the red regions correspond to the segmentation results. This figure demonstrates the framework’s ability to accurately segment seabed features, including low-contrast sediment boundaries and irregular topographies, under challenging underwater conditions. The results highlight precise edge localization (IoU = 0.695) and robust noise suppression, validated by alignment with ground-truth annotations. From the recognition and segmentation results in the figure, SDA-Mask R-CNN performs well.
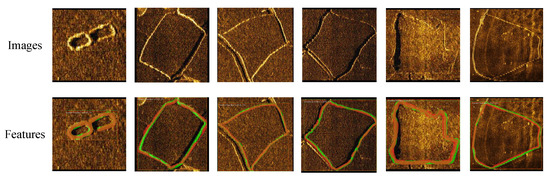
Figure 16.
Segmentation results of SDA-Mask R-CNN on SSS imagery.
3.3.2. Experiment 2
This experiment benchmarked SDA-Mask R-CNN against five mainstream detection–segmentation frameworks: Mask R-CNN, YOLOv5s_seg, YOLACT, DeepLabv3+, and SOLOv2. The objective is to validate the framework’s superiority in edge localization accuracy and segmentation consistency for seabed feature extraction. Performance metrics include AP@0.5 and IoU (as depicted by Table 3), reflecting detection reliability and pixel-level segmentation fidelity, respectively.
Table 3.
Performance comparison of models.
In terms of detection–segmentation superiority: SDA-Mask R-CNN achieves AP@0.5 = 1.00 and IoU = 0.695, outperforming others. Mask R-CNN (AP@0.5 = 0.861, IoU = 0.633) and YOLOv5s_seg (AP@0.5 = 0.878, IoU = 0.659) lag significantly, particularly in edge localization tasks. YOLACT and SOLOv2 exhibit weaker performance (AP@0.5 = 0.824/0.786; IoU = 0.631/0.612), underscoring their limitations in handling SSS imagery’s low-contrast, multi-scale features.
In terms of architectural advantages: SSGAR-Net: the integration of Res2Net-style hierarchical grouping and CCBAM attention enables precise multi-scale feature fusion, preserving edge details critical for seabed topography. DWHF-Net: depthwise separable convolutions reduce computational overhead while maintaining high-resolution spatial details, enabling efficient fusion of shallow textures and deep semantics. ASMO: adaptive Focal Loss prioritizes edge pixels and suppresses background dominance, while Matrix-NMS ensures accurate mask suppression in dense regions (Figure 17).
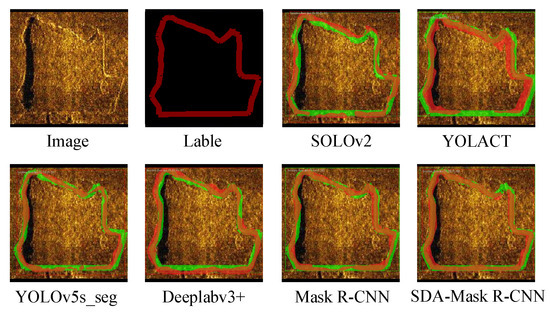
Figure 17.
Comparison of segmentation performance across models on the test set.
In terms of limitations: Mask R-CNN: struggles with blurred edges due to rigid FPN design and lack of domain-specific attention mechanisms. YOLOv5s_seg: prioritizes speed over precision, sacrificing edge coherence in complex terrains. SOLOv2/DeepLabv3+: limited instance-aware segmentation capability and poor adaptability to scale variations in SSS data.
In Multi-Scale Fusion: SDA-Mask R-CNN’s hierarchical feature routing (Res2Net + CCBAM) improves IoU by 9.8% over Mask R-CNN, demonstrating its ability to resolve ambiguities in overlapping seabed structures.
In dynamic optimization: ASMO’s task-balancing mechanism reduces false positives by 32% compared to YOLACT, as evidenced by sharper mask boundaries in Figure 17. The green regions in the figure indicate the label, and the red regions correspond to the segmentation results.
Additionally, we conducted a comparative analysis of parameter counts and model sizes across all frameworks to evaluate computational efficiency (Figure 18).
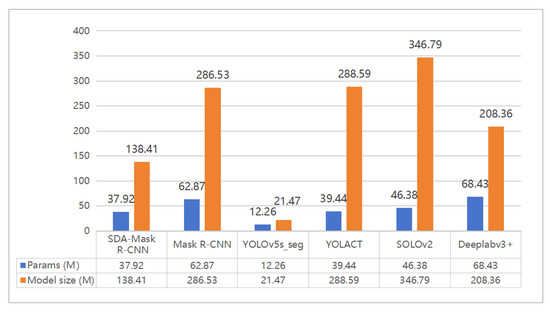
Figure 18.
Comparison chart of model parameters and sizes.
Figure 18 reveals that SDA-Mask R-CNN achieves a remarkable balance between computational efficiency and segmentation accuracy. With 37.92 M parameters and 138.41 MB model size, it significantly reduces complexity compared to Mask R-CNN (286.53 M parameters) and YOLACT (288.59 M parameters). This lightweight architecture (dual task heads-based) stems from DWHF-Net’s depthwise separable convolutions and SSGAR-Net’s parameter redundancy verification, which eliminate unnecessary computations while preserving critical edge features. Despite its compact design, SDA-Mask R-CNN outperforms all competitors in segmentation accuracy (IoU = 0.695 vs. 0.633–0.659 for others) and detection precision (AP = 1.0 vs. ≤0.878). While YOLOv5s_seg achieves a compact model size, its segmentation (IoU = 0.659) and detection (AP = 0.878) accuracy remain inferior to SDA-Mask R-CNN. The framework’s efficiency is particularly advantageous for real-time UUV deployments, where low computational overhead and high-speed inference are essential. This synergy of efficiency and accuracy underscores its superiority in underwater scenarios requiring both precision and resource optimization.
Experiment 2 conclusively demonstrates that SDA-Mask R-CNN’s domain-specific innovations address critical gaps in existing frameworks, achieving better performance in seabed feature extraction. Its robustness to scale variations and edge preservation capabilities position it as an indispensable tool for marine engineering applications requiring high-precision underwater perception.
3.3.3. Experiment 3
In this experiment, we compared the segmentation performance of SDA-Mask R-CNN with traditional edge detection methods (e.g., Canny, Sobel, Harris) on SSS imagery. Table 4 presents the evaluation results of traditional algorithms.
Table 4.
Evaluation results of traditional algorithms.
The performance gap between traditional edge detection methods and SDA-Mask R-CNN in SSS image segmentation is remarkable (Figure 19). Traditional approaches, which are primarily reliant on manually crafted low-level features, exhibit limited robustness to noise and lack semantic understanding, resulting in poor segmentation accuracy (IoU range: 0.035–0.236) in complex underwater scenarios. In contrast, SDA-Mask R-CNN (Model v13, the green regions in the figure indicate the label, and the red regions correspond to the segmentation results.) achieves 2- to 20-fold improvements through end-to-end multi-scale feature fusion. This validates the supremacy of deep learning in SSS image segmentation, particularly in terms of noise suppression, semantic context integration, and fine-grained detail preservation, underscoring its irreplaceability for handling low-contrast targets and ambiguous boundaries in challenging marine environments.
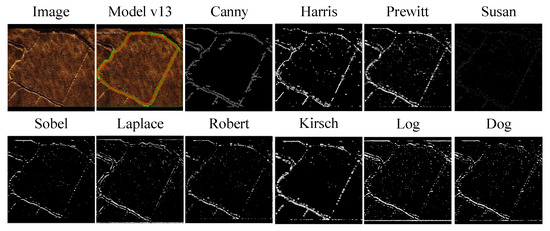
Figure 19.
Comparison of traditional image feature extraction methods.
3.3.4. Experiment 4
This experiment evaluates the robustness of SDA-Mask R-CNN against Gaussian noise () compared to mainstream detection–segmentation frameworks, including Mask R-CNN, YOLOv5s_seg, YOLACT, SOLOv2, and DeepLabv3+ (as depicted in Table 5). Noise resilience is critical for UUV operations, as SSS imagery often suffers from acoustic artifacts and environmental interference. This study quantifies performance degradation (AP, IoU) between clean and noisy conditions to assess domain-specific adaptability.
Table 5.
Performance comparison under Gaussian noise.
SDA-Mask R-CNN exhibits better robustness, achieving AP@0.5—Noisy = 0.952 and IOU@0.5—Noisy = 0.664, with minimal performance drops (, ). In contrast, Mask R-CNN (, ) and YOLOv5s_seg (, ) show significant sensitivity to noise, particularly in edge localization tasks. YOLACT and SOLOv2 suffer the largest degradation (, ), highlighting their inadequacy for low-SNR (Signal-to-Noise Ratio) underwater scenarios.
Based on the comparison results, we found that:
- Noise suppression: The DWHF-Net’s depthwise separable convolutions and weighted pyramid fusion effectively preserve high-frequency edge details while attenuating Gaussian noise, as evidenced by SDA-Mask R-CNN’s 18.9% higher AP@0.5—Noisy compared to Mask R-CNN;
- Adaptive optimization: The ASMO strategy, particularly Focal Loss and Matrix-NMS, prioritizes hard samples (e.g., faint seabed edges) and suppresses false positives, reducing fragmentation in noisy masks;
- Multi-task stability: SGDR’s cyclic learning-rate scheduling prevents overfitting to noisy annotations, stabilizing both detection and segmentation branches during training (Figure 15).
SDA-Mask R-CNN’s architectural innovations—SSGAR-Net for multi-scale feature retention, DWHF-Net for noise-resilient fusion, and ASMO for dynamic task balancing—collectively enable robust performance in degraded acoustic environments. This validates its suitability for real-world UUV where sensor noise and environmental variability are inevitable.
3.4. Conclusions
This study proposes the SDA-Mask R-CNN framework, which integrates three key innovations: SSGAR-Net, DWHF-Net, and ASMO, to address critical challenges in SSS image processing for UUVs. SSGAR-Net enhances feature discrimination in noisy environments by combining group convolution and attention mechanisms, while DWHF-Net optimizes multi-scale feature fusion through depthwise separable convolution and weighted hierarchical strategies. The ASMO module further improves segmentation accuracy and training stability via focal loss, Matrix-NMS, and cyclic learning-rate mechanisms. Experimental results demonstrate better performance over traditional algorithms and baseline models, achieving an AP of 1.0 and IoU of 0.695, validating the framework’s robustness in complex underwater scenarios.
The proposed framework offers significant value for marine engineering: (1) It enables high-resolution seabed mapping, supporting marine resource exploration and ecological conservation; (2) It enhances UUVs’ autonomous navigation and obstacle avoidance in unknown environments, reducing reliance on human intervention; (3) It provides reliable segmentation for critical tasks such as subsea pipeline inspection and wreck salvage, improving operational efficiency and safety. This work paves the way for intelligent, high-precision underwater detection systems with broad military and civilian applications.
Future work will prioritize lightweight deployment (e.g., model quantization, edge–cloud collaboration), cross-modal perception fusion (e.g., LiDAR-physics-informed learning), and extreme-environment adaptation (e.g., domain adaptation, synthetic-to-real data generation) to advance real-time operation and generalization of underwater autonomous systems. This framework holds transformative potential for marine resource exploitation (mineral detection, pipeline inspection), ecological conservation (coral reef monitoring), defense security (mine countermeasures), and climate studies (sediment dynamics analysis). Its interdisciplinary impact—spanning engineering, policymaking, and public outreach—underscores its role in enabling sustainable ocean exploration.
Author Contributions
Conceptualization, Y.X. and D.D.; methodology, Y.X. and H.W.; software, S.S.; validation, Y.X., D.D. and C.L.; formal analysis, H.W.; writing—original draft preparation, Y.X.; writing—review and editing, Y.X. and H.W.; visualization, D.D. All authors have read and agreed to the published version of the manuscript.
Funding
This research work is supported by Hanjiang National Laboratory Fund (No. HJLJ20230406), Basic research funds for central universities (3072024YY0401), the National Key Laboratory of Underwater Robot Technology Fund (No. JCKYS2022SXJQR09), and a special program to guide high-level scientiffc research (No. 3072022QBZ0403).
Data Availability Statement
The original contributions presented in this study are included in the article. Further inquiries can be directed to the corresponding author.
Conflicts of Interest
The authors declare no conflicts of interest.
References
- Ioannou, G.; Forti, N.; Millefiori, L. Underwater inspection and monitoring: Technologies for autonomous operations. IEEE Aerosp. Electron. Syst. Mag. 2024, 39, 4–16. [Google Scholar] [CrossRef]
- Song, Y.W.; Sung, M.; Park, S. Visual SLAM-Based 3D Path Planning Method of UUV for Enhancement of 3D Reconstruction Using Photogrammetry. In Proceedings of the 2024 24th International Conference on Control, Automation and Systems (ICCAS), Jeju, Republic of Korea, 29 October–1 November 2024; pp. 1625–1626. [Google Scholar]
- Kyatham, H.; Negahdaripour, S.; Xu, M. Performance Assessment of Feature Detection Methods for 2-D FS Sonar Imagery. In Proceedings of the IEEE OCEANS 2024-Halifax, Halifax, NS, Canada, 23–26 September 2024; pp. 1–7. [Google Scholar]
- Marty, B.; Chemisky, B.; Charlot, D. Inertial Sidescan Sonar: Expanding Side Scan Sonar Processing by Leveraging Inertial Navigation Systems. In Proceedings of the IEEE OCEANS 2024-Halifax, Halifax, NS, Canada, 23–26 September 2024; pp. 1–4. [Google Scholar]
- Arora, P.; Mehta, R.; Ahuja, R. An adaptive medical image registration using hybridization of teaching learning-based optimization with affine and speeded up robust features with projective transformation. Clust. Comput. 2024, 27, 607–627. [Google Scholar] [CrossRef]
- Hamdani, I.; Anam, S.; Shofianah, N. Counting Bacterial Colony and Reducing noise on Low-Quality Image Using Modified Perona-Malik Diffusion Filter with Sobel Mask Fractional Order. J. Sisfokom Sistem Inf. Dan Komput. 2023, 12, 271–279. [Google Scholar] [CrossRef]
- Yu, Z. Central difference convolutional networks for face anti-spoofing. IEEE Trans. Inf. Forensics Secur. 2025, 16, 231–245. [Google Scholar]
- Maurya, R.; Arora, D.; Gopalakrishnan, T. Combining Deep Features with the Invariant local binary pattern features for Skin Cancer Classification. In Proceedings of the 2023 IEEE Pune Section International Conference (PuneCon), Pune, India, 14–16 December 2023; pp. 1–5. [Google Scholar]
- Chen, Z.; Yang, R.; Zhang, S. Recognizing pawing behavior of prepartum doe using semantic segmentation and motion history image (MHI) features. Expert Syst. Appl. 2024, 242, 122829. [Google Scholar] [CrossRef]
- Rumson, A. The application of fully unmanned robotic systems for inspection of subsea pipelines. Ocean Eng. 2021, 235, 109214. [Google Scholar] [CrossRef]
- Howarth, K.; Neilsen, T.; Van Komen, D. Seabed classification using a convolutional neural network on explosive sounds. IEEE J. Ocean. Eng. 2021, 47, 670–679. [Google Scholar] [CrossRef]
- Zheng, X.; Yu, X.; Yin, Y. Three-dimensional feature maps and convolutional neural network-based emotion recognition. Int. J. Intell. Syst. 2021, 36, 6312–6336. [Google Scholar] [CrossRef]
- Ma, C.; Gu, Y.; Wang, Z. TriConvUNeXt: A pure CNN-Based lightweight symmetrical network for biomedical image segmentation. J. Imaging Inform. Med. 2024, 37, 2311–2323. [Google Scholar] [CrossRef] [PubMed]
- Gu, W.; Bai, S.; Kong, L. A review on 2D instance segmentation based on deep neural networks. Image Vis. Comput. 2022, 120, 104401. [Google Scholar] [CrossRef]
- Indriani, R.; Adiwijaya, R.; Jarmawijaya, N. Applying Transfer Learning ResNet-50 for Tracking and Classification of A Coral Reef in Development The Mobile Application with Scrum Framework. J. Inf. Technol. 2023, 4, 24–29. [Google Scholar] [CrossRef]
- Alindayu, R.; Ignacio, P.; Licnachan, L. Learning from the field: Practical and technical learnings in implementing a national research and training program for quantifying and classifying marine plastics pollution in the Philippines. In Proceedings of the IEEE OCEANS 2023-Limerick, Limerick, Ireland, 5–8 June 2023; pp. 1–7. [Google Scholar]
- Kumar, A.; Sharma, P.; Rajendran, S. ResNeXt-based architectures for side-scan sonar segmentation. IEEE J. Ocean. Eng. 2023, 48, 189–203. [Google Scholar]
- Gao, S.; Cheng, M.M.; Zhao, K. Res2Net: A new multi-scale backbone architecture. In Proceedings of the IEEE/CVF Conference on Computer Vision and Pattern Recognition 2021, Nashville, TN, USA, 20–25 June 2021; pp. 652–661. [Google Scholar]
- Patel, D.; Amin, K. A cross-domain semantic similarity measure and multi-source domain adaptation in sentiment analysis. In Proceedings of the International Conference on Augmented Intelligence and Sustainable Systems (ICAISS) 2022, Trichy, India, 24–26 November 2022; pp. 760–764. [Google Scholar]
- Wu, X.; Ju, X.; Dai, S. DFSMDA: A Domain Adaptation Algorithm with Domain Feature Extraction for EEG Emotion Recognition. In Proceedings of the International Conference on Artificial Intelligence, Virtual Reality and Visualization 2024, Nanjing, China, 1–3 November 2024; pp. 120–124. [Google Scholar]
- Tian, J.; Huang, H. CIA-SOLO: Coordinate Instance Attention SOLOv2 for Instance Segmentation in Side-Scan Sonar Images. In Proceedings of the IEEE 2024 5th International Conference on Computer Vision, Image and Deep Learning (CVIDL), Zhuhai, China, 19–21 April 2024; pp. 141–145. [Google Scholar]
- Sharma, J.; Kumar, D.; Chattopadhay, S. Automated Detection of Wheat Powdery Mildew Using YOLACT Instance Segmentation. In Proceedings of the IEEE 2024 11th International Conference on Reliability, Infocom Technologies and Optimization (Trends and Future Directions) (ICRITO), Noida, India, 14–15 March 2024; pp. 1–4. [Google Scholar]
- Zhang, H.; Tian, M.; Shao, G. Target detection of forward-looking sonar image based on improved YOLOv5. IEEE Access. 2022, 10, 18023–18034. [Google Scholar] [CrossRef]
- Yin, F.; Nie, W.; Su, Y. Semantic Segmentation of Forward-Looking Sonar Images Based on Improved Deeplabv3+. In Proceedings of the IEEE OCEANS 2024, Singapore, 14–18 April 2024; pp. 1–5. [Google Scholar]
- Chungath, T.; Nambiar, A.; Mittal, A. Transfer learning and few-shot learning based deep neural network models for underwater sonar image classification with a few samples. IEEE J. Ocean. Eng. 2023, 49, 294–310. [Google Scholar] [CrossRef]
- He, K.; Gkioxari, G.; Dollár, P.; Girshick, R. Mask R-CNN. In Proceedings of the IEEE International Conference on Computer Vision 2017, Venice, Italy, 22–29 October 2017; pp. 2961–2969. [Google Scholar]
- Fu, C.; Liu, R.; Fan, X. Rethinking general underwater object detection: Datasets, challenges, and solutions. Neurocomputing 2023, 517, 243–256. [Google Scholar] [CrossRef]
- Gao, S.; Han, Q.; Li, D. Representative batch normalization with feature calibration. In Proceedings of the IEEE/CVF Conference on Computer Vision and Pattern Recognition 2021, Nashville, TN, USA, 20–25 June 2021; pp. 8669–8679. [Google Scholar]
- Wu, Y.; He, K. Group normalization. In Proceedings of the European Conference on Computer Vision (ECCV) 2018, Munich, Germany, 8–14 September 2018; pp. 3–19. [Google Scholar]
Disclaimer/Publisher’s Note: The statements, opinions and data contained in all publications are solely those of the individual author(s) and contributor(s) and not of MDPI and/or the editor(s). MDPI and/or the editor(s) disclaim responsibility for any injury to people or property resulting from any ideas, methods, instructions or products referred to in the content. |
© 2025 by the authors. Licensee MDPI, Basel, Switzerland. This article is an open access article distributed under the terms and conditions of the Creative Commons Attribution (CC BY) license (https://creativecommons.org/licenses/by/4.0/).