Article

Surf and Swash Zone Dynamics from High-Frequency Observations at a Microtidal Low-Energy Dissipative Beach

by
Dimitris Chatzistratis
1,*,
Antonis E. Chatzipavlis
1,2,
Isavela N. Monioudi
1,
Adonis F. Velegrakis
1,
Olympos P. Andreadis
1,
Fotis Psarros
1 and
Ivan T. Petsimeris
1
1
Department of Marine Sciences, School of Environment, University of the Aegean, University Hill, GR 81100 Mytilene, Greece
2
Department of Physics and Earth Sciences, University of Ferrara, Via Saragat 1, 44122 Ferrara, Italy
*
Author to whom correspondence should be addressed.
J. Mar. Sci. Eng. 2025, 13(5), 861; https://doi.org/10.3390/jmse13050861
Submission received: 18 March 2025 / Revised: 16 April 2025 / Accepted: 17 April 2025 / Published: 25 April 2025
(This article belongs to the Section Coastal Engineering)

Abstract

:
This study examines the surf and swash zone dynamics of a microtidal, low-energy, dissipative beach in Kos Island, Greece, using high-frequency optical monitoring with a Beach Optical Monitoring System (BOMS) and in situ wave measurements during the winter period. Increased wave heights induced the offshore migration of the wave-breaking zone with significant alongshore variability; however, no triggering of NOM (Net Offshore Movement) behavior was verified, while occasional rhythmic patterns were observed in the breaking location under moderate wave conditions. Shoreline dynamics showed transient erosional episodes coupled with elevated run-up excursions, yet the shoreline showed signs of recovery, suggesting a quasi-equilibrium state. Run-up energy spectra were consistently dominated by lower frequencies than those of incoming waves under both low- and high-energy conditions. This behavior is attributed to the nearshore sandbars acting as low-pass filters, dissipating high-frequency wave energy and allowing for lower-frequency motions to dominate run-up processes. A widely used empirical wave run-up predictor corresponded well with the video observations, confirming its applicability to low-energy dissipative beaches. These results underscore the role of submerged sandbars in regulating wave energy dissipation and stabilizing beach morphology under low-to-moderate wave conditions.

1. Introduction

‘Sandy’ shorelines (beaches), which are a common feature of the global coastline [1], are important habitats [2] and protect backshore ecosystems, infrastructure, and assets from coastal erosion/flooding [3]. They also have high hedonic/recreational value, being the foundation of the dominant ‘Sun, Sea, and Sand -3S’ tourism model [4,5], and are major contributors to the economies of many coastal areas, particularly in island settings [6,7]. At the same time, many beaches are under erosion/retreat, a process exacerbated by anthropogenic changes and the changing climatic factors [8,9,10,11]. Their criticality in terms of the coastal socio-economics and their increased risk of erosion/flooding prescribe the study of their morphological changes (morphodynamics) and their controls.
Beach morphology is controlled by the complex, varying nearshore hydro- and sediment dynamics of the surf and swash zones [12]. In order to assess/resolve beach morphodynamics, the monitoring of particular morphological features/’metrics’ that can represent the scope of the surf and swash zones and integrate many coastal processes is required. These features include the shoreline, i.e., the land/sea boundary; the wave breaking zone, i.e., the offshore boundary of the surf zone; and the maximum excursion of the wave swashing up the beach (wave runup), i.e., the land boundary of the swash zone [13,14,15]. The shoreline position is a basic metric (and boundary condition) when examining beach erosion/flooding phenomena, whereas the maximum wave run-up can provide information for potential impacts on the backshore environments and assets. The position of the wave breaking is defined by the nearshore seabed morphology and the hydro- and sediment dynamics, and controls the dynamics of the shoreline and maximum wave run-up excursion [16]. The location and dynamics of these features should be also demarcated and resolved as they form important legal boundaries for the Maritime Public and the Terrestrial (public/or private) Domains and, thus, provide the scope for the coastal zone legal rights and obligations according to international, European and national laws. For example, the maximum wave run-up excursion defines the outer (seaward) boundary of coastal ‘set-back’ zones within which further development is not allowed according to the 2008 ICZM Protocol of the Barcelona Convention1, as well as by the national legislation of several coastal states [17].
Surf and swash zone dynamics are controlled by various geo-morphological and hydrodynamic factors [13,18]. The influence of seabed morphology is particularly evident in dissipative beaches, where subtidal morphological features, such as sandbars, can control the location of wave breaking, as well as of the shoreline and the wave run-up excursion [19,20]. Sandbars are ubiquitous, subaqueous morphological features that form and evolve at the nearshore sedimentary bed; their occurrence spacing, and morphology are considered to depend on the local surf zone slope, grain size, tidal range, wave energy/angle, sediment supply and inherited morphology [21]. They can modify beach responses to wave conditions by dissipating the incoming wave energy through the depth-limited breaking and modification of the nearshore hydrodynamics; for example, the characteristics of subtidal sandbars have been found to explain >40% of the wave run-up variability [20]. In general, larger waves and associated undertow currents are considered to drive offshore migration of the bar crest (and of the wave breaking zone), whereas calm periods with asymmetric waves and reduced currents can induce onshore bar (and wave breaking) migration [21,22]. There has been some evidence, however, to challenge this view. Recent research has shown that shoreward onshore migration of sandbar crests is associated not only with low energy waves [23]; sandbars of particular morphology may also exhibit onshore sediment transport and migration under high-energy waves and impact accordingly on the shoreline position [24]. Under low-energy waves, sandbars may reduce significantly the wave setup on the beach face, whereas under energetic wave conditions, the increase in the incident wave height leads to the offshore expansion and/or migration of the breaking zone; this may result in increases in the long-wave energy impinging on the beach and wave run-up excursion changes [25].
Relevant studies in microtidal sandy shorelines have mainly focused on sandbar dynamics. For example, a 4-year topo-bathymetric survey along a low-energy, micro-tidal coast in Florida showed greater ‘equilibrium’ sandbar heights in areas with higher waves and alongshore variations in bar dynamics during energetic conditions; both onshore and offshore bar migration occurred, controlled by the pre-event water depths over the sandbar crests [26]. A study, based on Argus video images, showed limited cross-shore bar migration, as well as bar rhythmicity changes under energetic events [27], whereas the video monitoring of three Italian beaches revealed particular patterns in the bar net offshore movement (NOM) which were driven primarily by the wave energy seasonality; however, no consistent trends were found in the associated shoreline dynamics [28]. Similar NOM patterns have been observed for a crescentic bar at a Cretan beach using drone imagery [29].
Dissipative beaches are, in many cases, characterized by the presence of sequences of sandbars, including shallow nearshore bars that show large spatio-temporal variability [12]. Therefore, the study of the dynamics of these bars (and the associated wave breaking) and their influence on the other defining features of the surf and swash zone (i.e., the shoreline and the wave run-up excursion) requires monitoring with an appropriate resolution [30]. While such interactions have been widely studied in macrotidal open ocean beaches [31], similar research in microtidal low-energy environments remains limited since previous studies have focused mostly on the behavior of sandbars [27,28,29].
The objective of the present work has been to investigate the dynamics of the shallow nearshore sandbars (using the locations of the associated wave breaking as a proxy), along with the dynamics of the shoreline and the wave run-up excursion in such beaches. It aims to contribute to the study of the influence of nearshore sandbars on the swash zone dynamics of low-energy microtidal environments of the Mediterranean region which has been rarely investigated.
Toward this objective, high-frequency video observations and concurrent wave information were obtained and analyzed during the energetic (winter) period from a microtidal, low-energy dissipative beach of the island of Kos (Greece).

2. Study Area and Methods
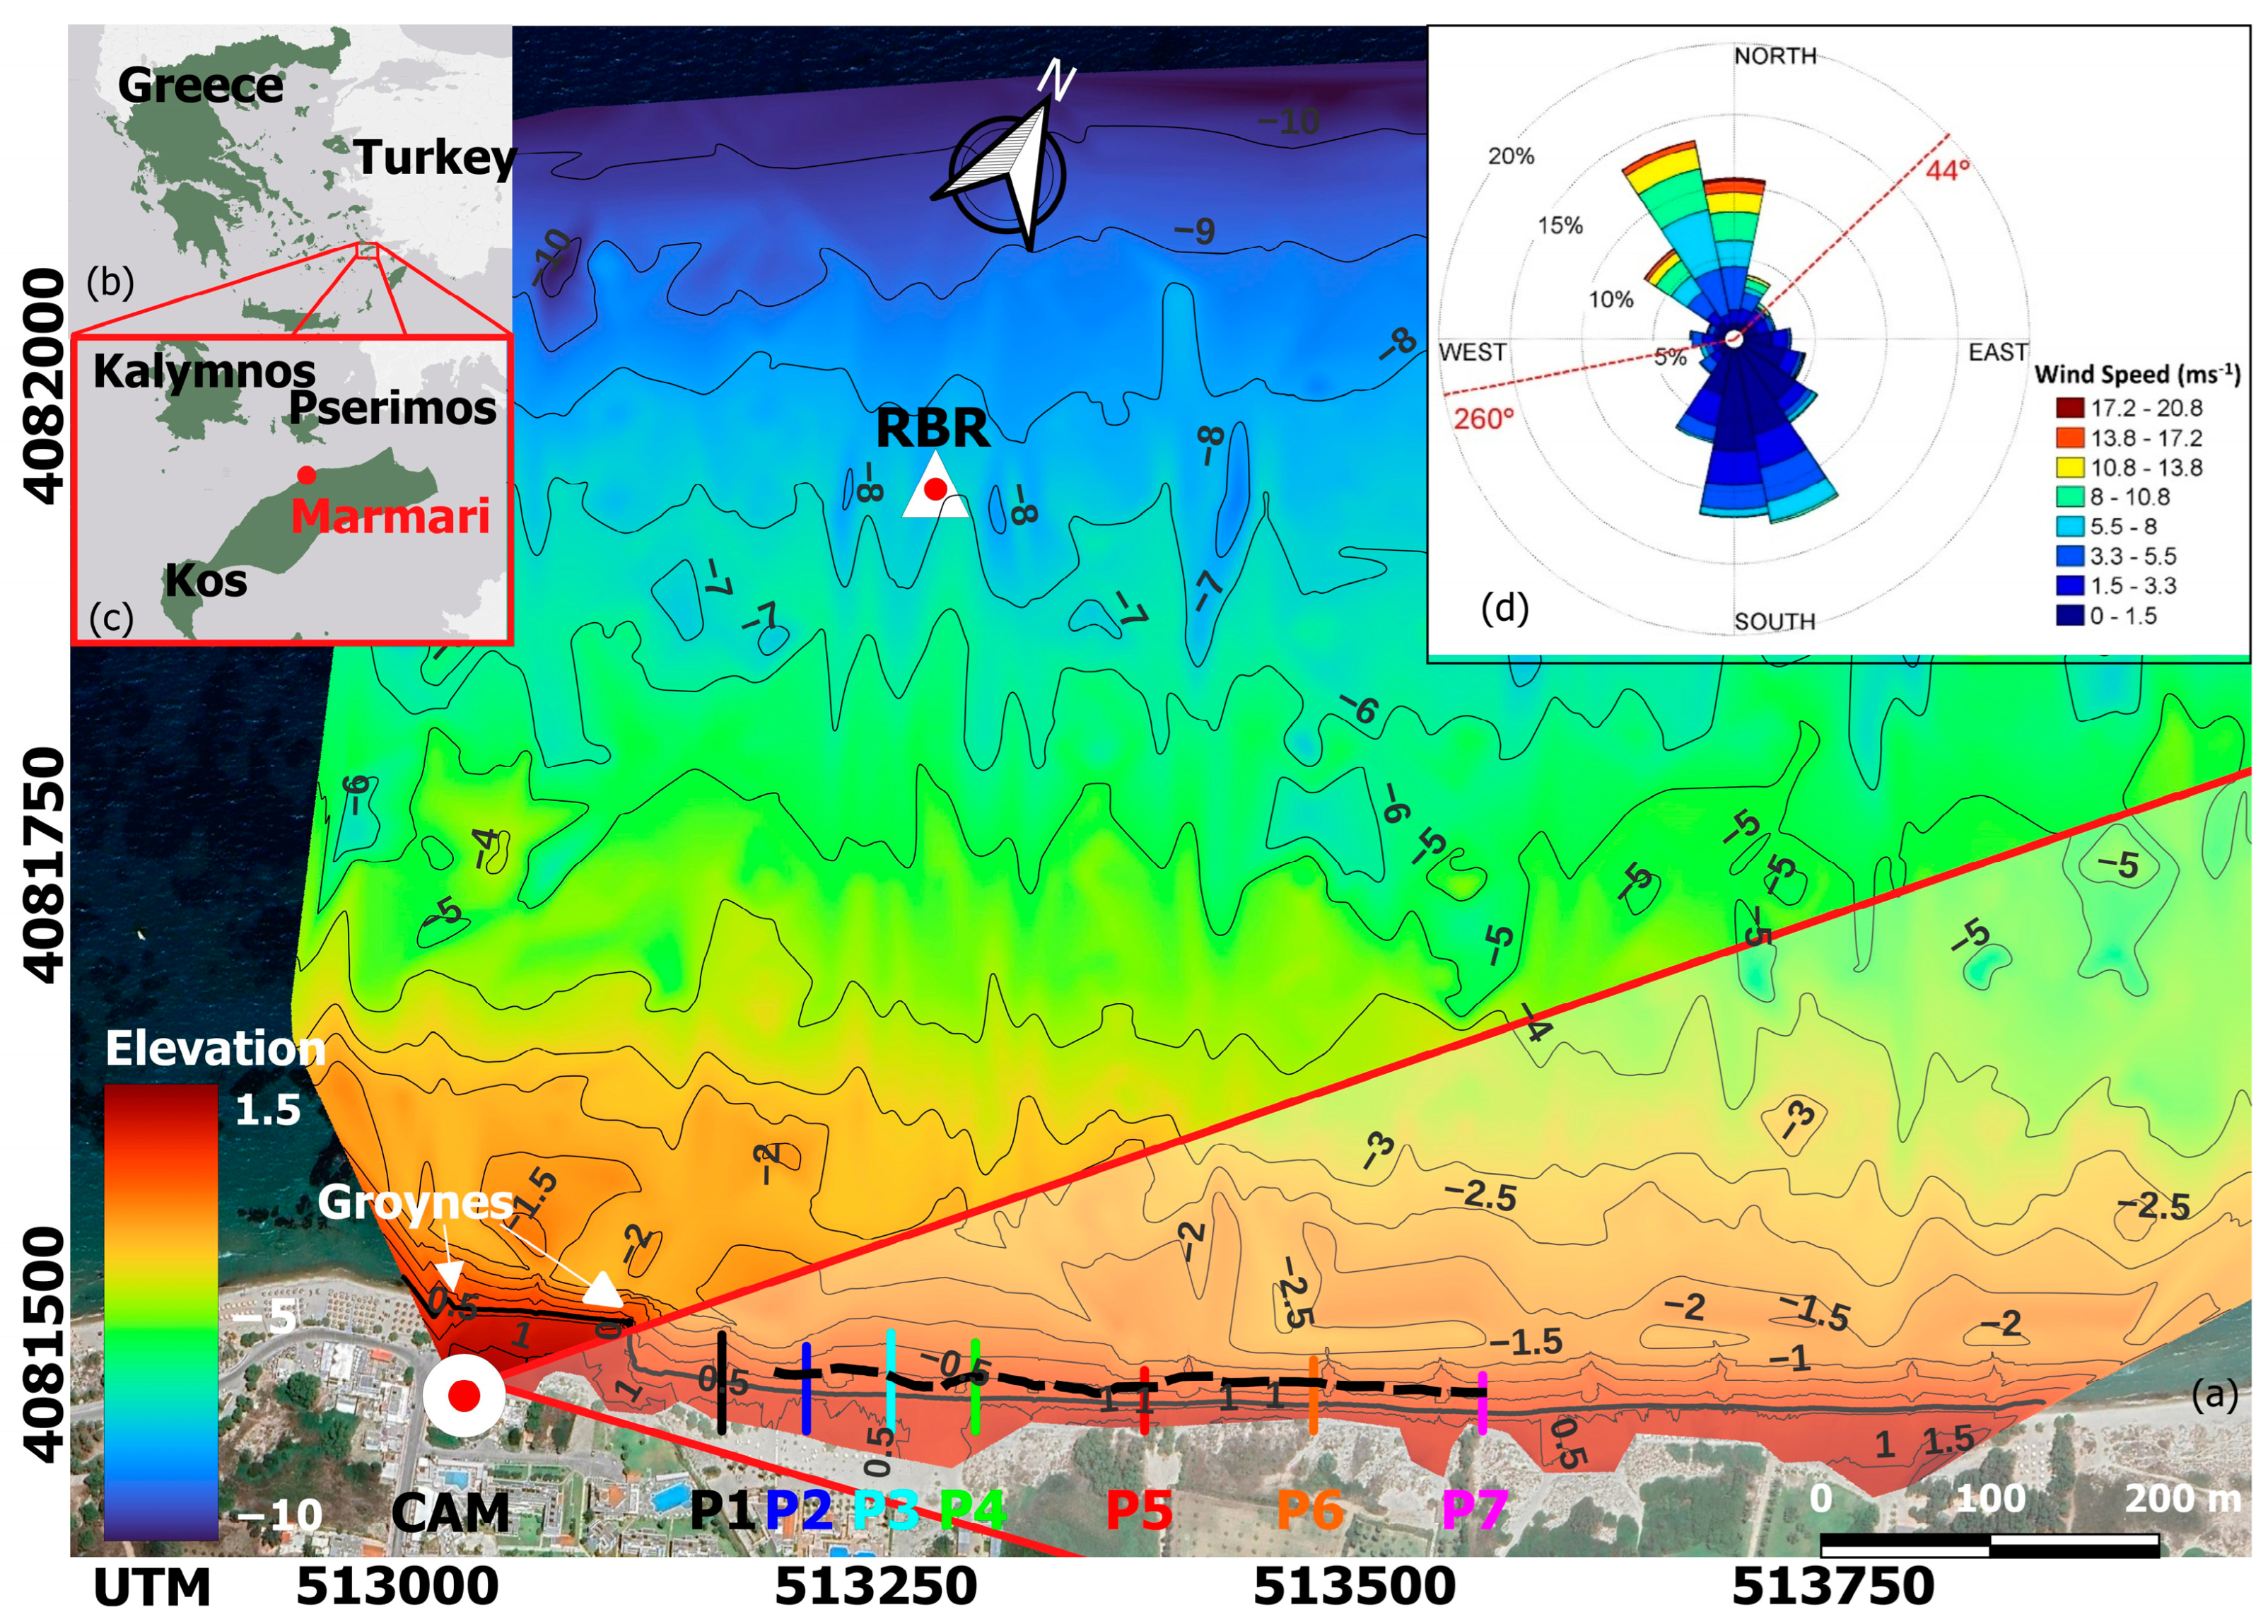
2.1. Study Area

Marmari (Figure 1b,c) is a highly touristic beach located at the northern coast of the island of Kos (Greece), a major 3S tourist destination [32]. Sand dunes are found along stretches of the almost 2 km long sandy beach, i.e., backshore, whereas close to the beach’s northeastern end, there is an important NATURA 2000 wetland (Alykes). Marmari is popular for surfing activities, with hotels and other recreational facilities found at its backshore. The wider area has a (generally) low relief, forming on Plio-Quaternary sediments [33]. The coastline has a NW–SE orientation, facing the neighboring islands of Kalymnos and Pserimos and, thus, the incoming waves from these directions have mostly short fetches. A 13-year wave dataset from the Copernicus Marine Services has shown that the dominant wave direction is NNW, with average offshore wave heights and periods of 0.9 m and 4.5 s [34]. Groynes as long as 15 m have been constructed at the southwestern edge of the beach in front of the installed video monitoring station (Figure 1a), that may have caused the downdrift beach erosion to their northeast observed in historical Google Earth images. The study focuses on the western Marmari beach, i.e., proximal 800 m to the installed camera monitoring station (see Section 2.3). On this part, the maximum width of the beach is 55 m on the western and central part, while on the eastern part, backed by the dunes, the max width does not exceed 13 m.

2.2. Field Data Acquisition

The study involved the field collection of various datasets during the winter energetic period (November 2022–April 2023). A detailed topo-bathymetric survey was conducted on 12 November 2022, at the beginning of the high-frequency monitoring period. Onshore and nearshore submarine morphological information was collected down to about 10 m water depth. The beach was mapped using a dense grid of cross-shore transects (from a backshore reference line to 1.2 m water depths), spaced at about 50 m with a Real Time Kinetic Differential Global Positioning system—RTK-DGPS (Topcon HiPer, Livermore, CA, USA). Further offshore, the bathymetry was recorded using a digital (Hi-Target HD 370, Hi-Target Surveying Instrument, Guangzhou, China) echosounder operating at 200 kHz and a TopCon DGPS, deployed from a 5.2 m rigid hull inflatable boat (RIB) along a grid of dense crossing transects, spaced approximately 40–50 m, crossed by lines almost parallel to the shoreline, spaced every 100 m. Although the recorded tidal range is small in this area (<0.08 m), the data were also tidally corrected using the RBR wave recorder recordings (see below). An additional topographic survey of the beach and shallow water depths (to 0.5 m) was conducted at the end of the monitoring period (6 April 2023). In addition, a Starfish 450F high-resolution side scan sonar (SSS) and the SonarWiz 6.2 software for post-processing, analysis and mosaicking of the collected sonographs were used to map the morphology, texture, and habitats of the seabed. This information was ‘ground-truthed’ by surficial sediment sampling and drop-camera images collected using a rigid frame-mounted GoPro Hero 3+ camera (720 p video resolution). Ten sediment samples along the beach were also collected.
In order to acquire concurrent information on the wind and wave forcing during the monitoring period, a meteorological station (Davis—Wireless Vantage Pro2 Plus, Hayward, CA, USA) was installed in the vicinity of the camera, whereas a wave logger (RBR Virtuoso, Ontario, Canada) was deployed at a water depth of 7.9 m to acquire high-frequency (8 Hz) information on the waves and the sea level.

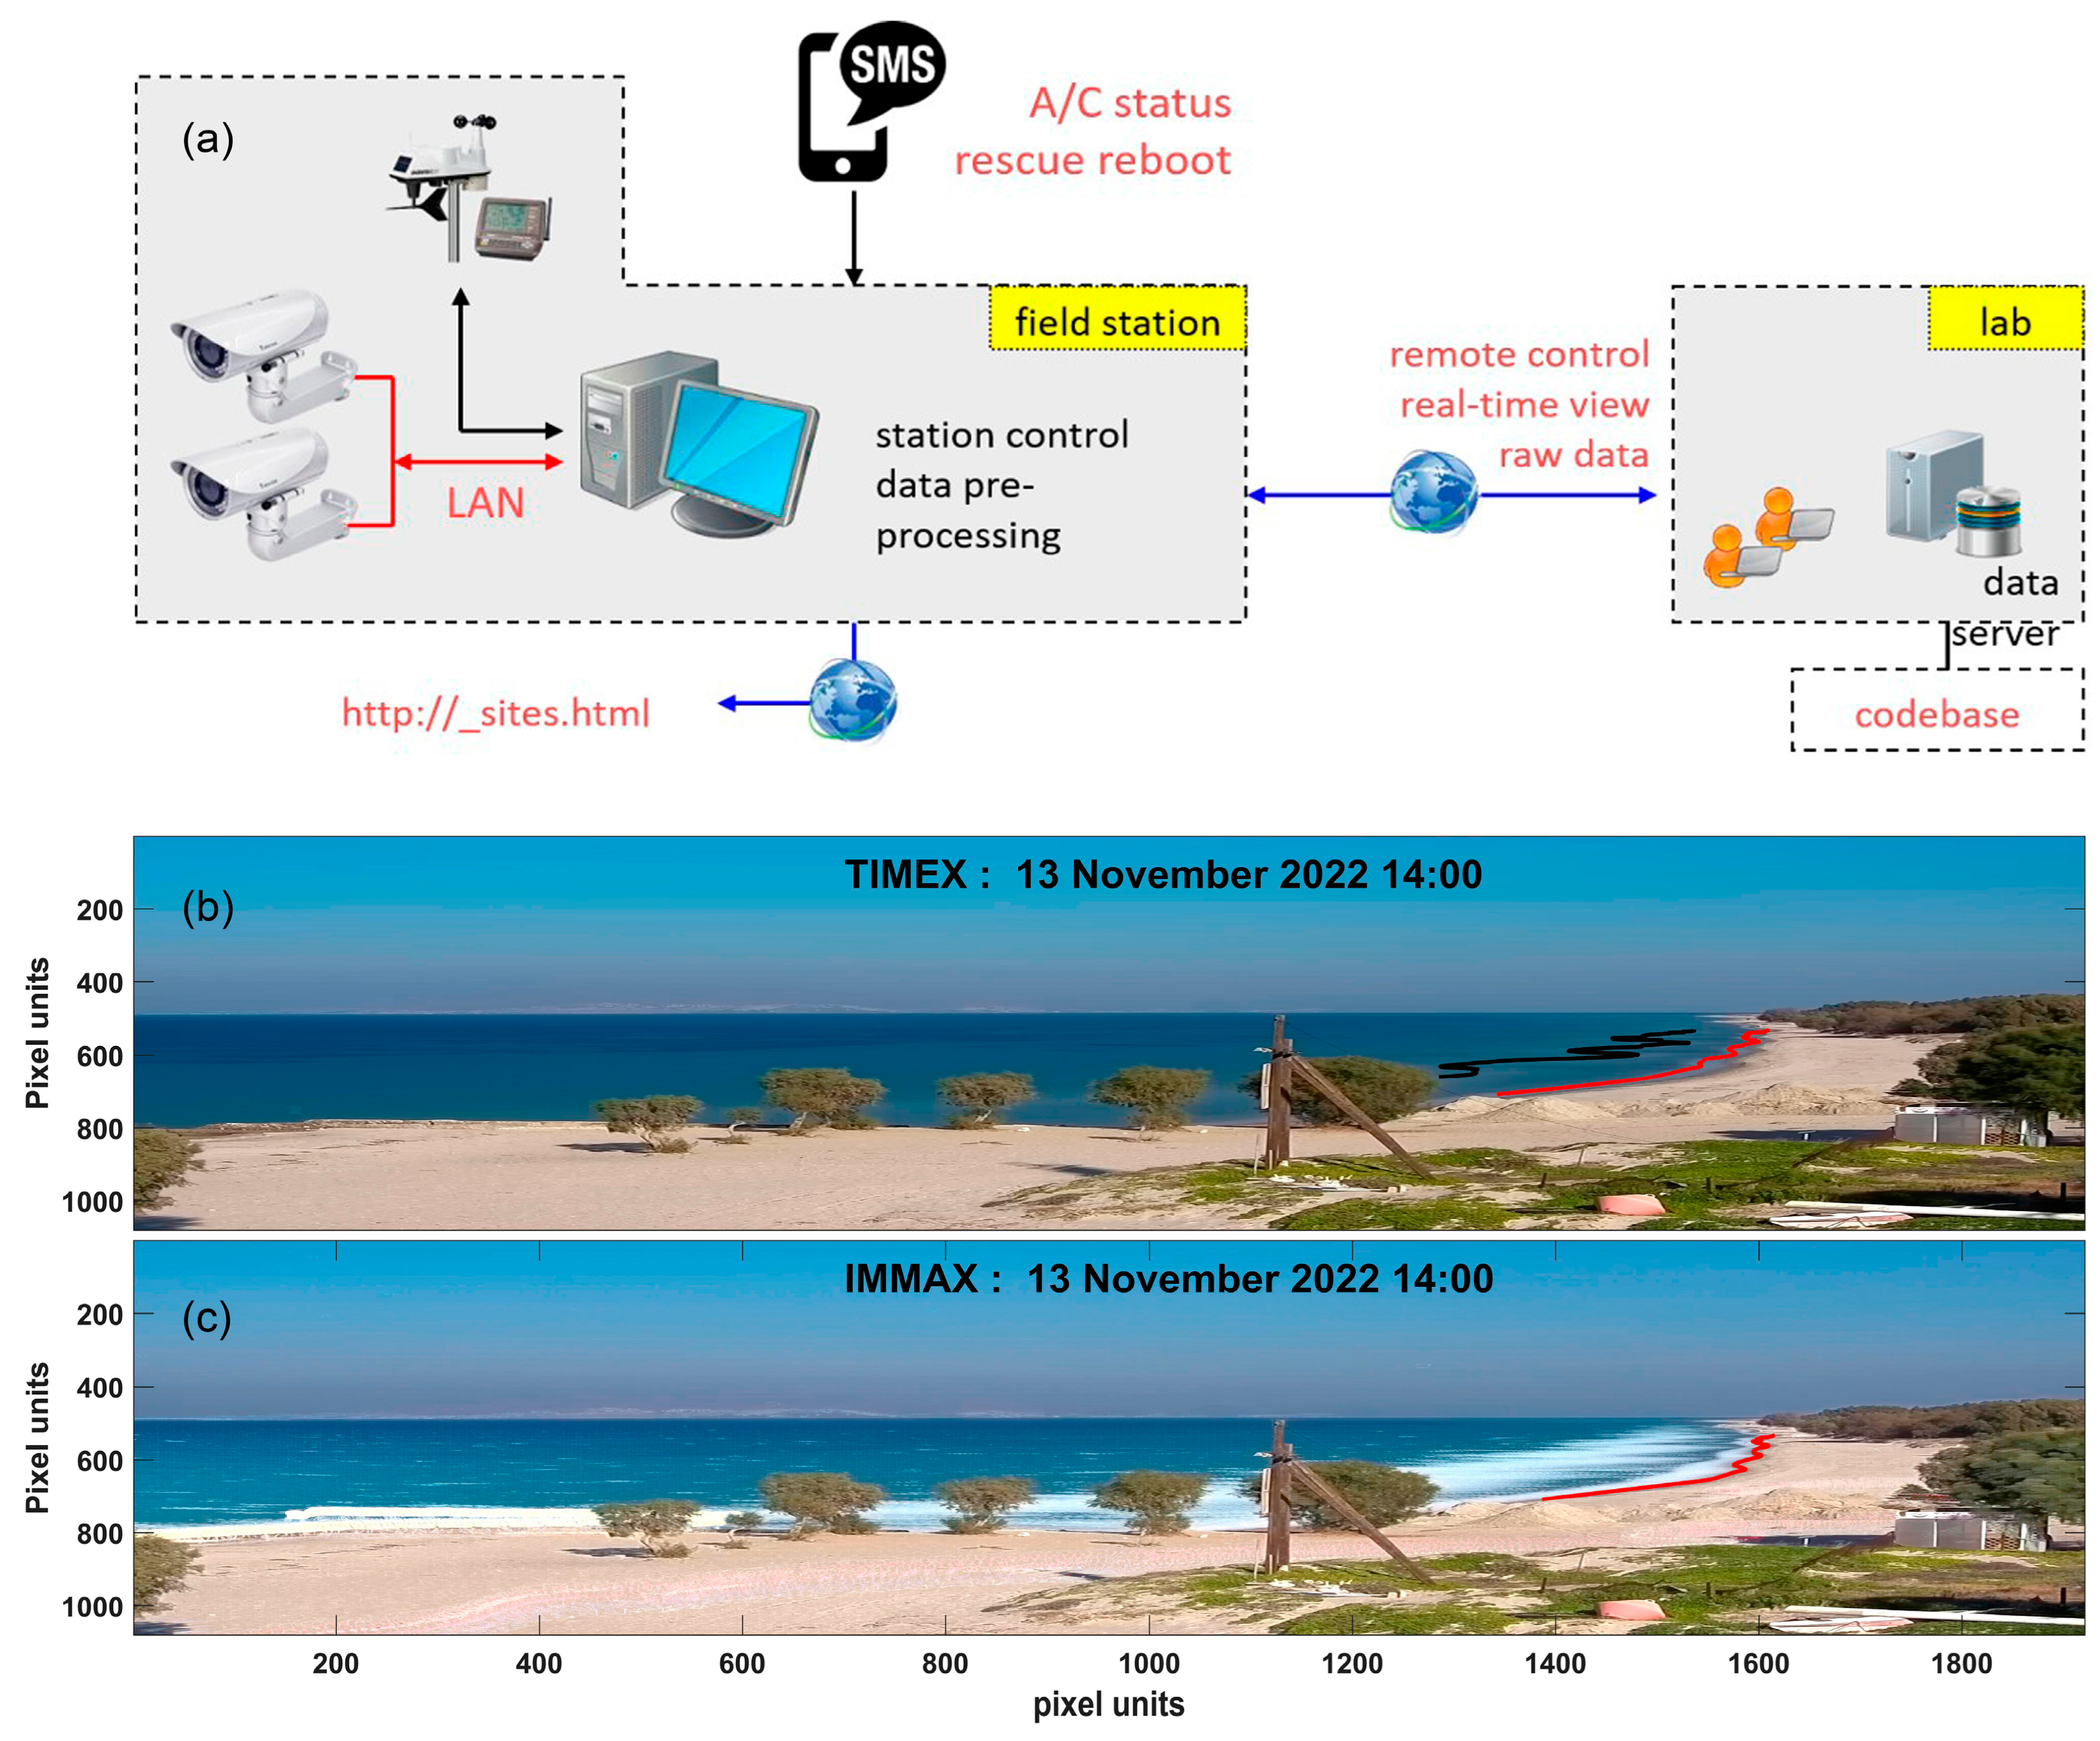
2.3. Beach Optical Monitoring System

Video monitoring approaches have been widely used to provide high resolution observations of the swash processes [14,16,35], the shoreline position [36,37,38], and the submarine bars’ morphology [39,40]. In this study, an autonomous Beach Optical Monitoring System (BOMS) was installed at the roof of a hotel (Stella Maris, Εastings: 512996.60 m UTM, Νorthings: 4,081,583.83 m) at an elevation of 10 m (Figure 1). BOMS was deployed during the energetic winter period (12 November 2022–6 April 2023) and consisted of a field PC and 1 IP Vivotek (China) video camera set to obtain high resolution hourly videos with a sampling rate of 5 Hz for 10 min during daylight (i.e., 3000 frames per hour) (Figure 2a). During the remaining 50 min, two main tasks were scheduled at the field PC utilizing the Orasis software, default version (https://www.vousdoukas.com/index_video.html#, access date 2 February 2025). First, all frames/images were corrected for lens distortion, calibrated by RTK-DGPS surveyed Ground Control Points (GCPs), and processed using standard photogrammetric approaches for their translation to real geographic coordinates [35]. Secondly, the recorded frames were processed to produce metadata (optical products), such as TIMEX images of the shoreline, and the wave breaking locations and IMMAX images of the wave run-up excursion for every sampling burst (10 min acquisition time every hour with daylight). TIMEX images are color images defined on the RGB color model, and constitute average shoreline and breaking zone images over the 3000 snapshots obtained in each sampling burst; image intensity patterns are associated with the time-averaged energy dissipation rates of the wave breaking at the shoreline and offshore (Figure 2b), with high values implying areas of high dissipation [36,38]. IMMAX images show the maximum (water) pixel position in the (3000) images collected during the hourly burst; thus, they define the highest swash (wave run-up) excursion up the beach [13] (Figure 2c). Unfortunately, there were two periods of BOMS downtime (15–18 December 2022 and 30 December 2022–8 January 2023), as well as a period during which images of less quality were collected due to the smearing of the camera lens with salt from sea spray (6 February 2023–5 March 2023); such data were not included in the analysis.
Previously developed automatic detectors (algorithms) were used to extract the longshore positions of the shoreline and the wave breaking zone on the TIMEX images, whereas the maximum wave run-up on the IMMAX images. These algorithms use a localized kernel that progressively grows along the digital images, following the high-intensity zones along the feature of interest [14,36]. Manual corrections were also performed to the automatically extracted positions with the use of a specifically developed MATLAB 2012b code and the detections were projected into a local coordinate system whose origin is the camera location and coordinates in the cross- and longshore increases seaward and eastward of the camera, respectively. It must be clarified that the term ‘breaking zone location’ instead of the ‘sandbar location’ is used here, as it refers to the white foam patterns detected on TIMEX images. While the offshore white foam patterns have been linked to bar crests [40], the shoaling waves might start breaking seaward of the bar crest depending on the characteristics of the incoming waves and the local depth.
Detections of the shoreline and the breaking zone were performed on the same TIMEX images, whereas wave run-up was detected on the corresponding IMMAX image for the same time. More specifically, one TIMEX/IMMAX image per day was selected for detailed analysis, which was retrieved during an early afternoon burst (14:00–14:10) when higher wave activity was commonly observed. In total, 104 TIMEX/IMMAX images were used to detect shoreline and wave run-up conditions. Due to the absence of wave breaking during low-wave conditions, 63 TIMEX images were used to identify the wave breaking location. It is noted that (a) there were view obstructions for the beach stretch closest to the camera, and (b) the accuracy of the detection (0.25 at the proximal beach section) decreases with the distance from the camera due to increasing pixel footprint. For this reason, detections from a proximal, 450 m long section of the beach (i.e., the beach stretch located between 150 and 600 m from the camera) were considered in our analysis. It is also noted that the presence of tamarisk trees, as well as of a light post at the western edge of the beach (Figure 2b,c) might hinder detections of offshore wave breaking, especially under energetic wave conditions, with this limitation applying throughout the monitoring period for the beach stretches with y = 150–190 m (for the entire period) and y = 190–250 m (for the most energetic events). Therefore, it was decided to exclude these areas from the analysis regarding the dynamics of the wave breaking zone. Analysis was performed at profiles spaced at 10 m to capture the longshore variability in the swash and breaking zones. The detections for each metric at the beginning of the monitoring period were set as temporal benchmarks, and subsequent detections were compared to them, with detailed examination involving the profiles P1–P7 (Figure 1).

2.4. Wave Modeling

The XBeach hydrodynamic/morphodynamic model [41] was employed (at its 1-D version) to investigate the evolution of the cross-shore wave characteristics and sea level under an identified energetic event on the 23rd of November, as well as the resulting changes in beach morphology along the representative Profile P-4; the analysis focused on the behavior of the nearshore sandbars and the shoreline.
The model was forced using the identified sediment mean size (D50 = 0.3 mm, see Results section) and a JONSWAP spectrum (instat = 1) using the short-wave-averaged wave module (surfbeat) that resolves long-wave (infragravity) motions while parameterizing short wave effects. Inverse shoaling [42] was applied on the wave parameters recorded at 7.9 m depth for the considered event (significant wave height Hs = 0.77 m, significant wave period Ts = 5.6 s) using linear theory and assuming a shore normal approach in order to acquire the deep water wave characteristics. Since inverse shoaling yielded an offshore wavelength Lo of about 44 m, wave forcing was based on simple wave parameters at a 20 m depth.
The model was run with a 2 m resolution in a non-stationary mode, simulating an event of 3 h (10,800 s). It is noted that the model was set up with the P4 profile topo-bathymetry identified in the beginning of the monitoring period (Figure 1), which might be different than that examined under the energetic event with the particular wave forcing; in addition, the 1-D model cannot account for the effects of longshore sediment transport. Therefore, the model results cannot be validated by the obtained video observations and are used only to investigate the potential nearshore processes and morphodynamics.

2.5. Wave Run-Up Prediction

The collected wave run-up information was also used to assess the most widely applied empirical relationship proposed by Stockdon et al., 2006 [13], which has integrated information from different field sites encompassing a broad range of wave conditions and beach slopes. Ref. [13] distinguished different swash behaviors between dissipative and steeper beaches, based on the Iribarren number, ξ which is defined as
ξ = β/(Ho/Lo)0.5
where β is the beach slope, and H0 and L0 are the offshore (deep water) wave height and wavelength, respectively.
For dissipative beaches (ξ < 0.3), they suggested that the 2% exceedance of the peak run-up height (R2%) is related to the offshore wave conditions through
R2% = 0.043 × (H0L0)0.5
As the nearshore topo-bathymetry was surveyed at the beginning and end of the monitoring period (12 November and 6 April), wave run-up detections of two hourly bursts from these two dates were used for testing together with the corresponding wave characteristics recorded at a 7.9 m water depth. Because the formula requires the deep water wave conditions, inverse shoaling using linear theory and assuming a shore normal approach was applied to the RBR recordings to estimate the equivalent H0 and L0. The β was estimated as the foreshore beach slope for the distance between the trough and the beach berm at all 7 representative profiles P1–P7 estimated from the field surveys and Iribarren number ξ was subsequently calculated using the beach slopes.

3. Results

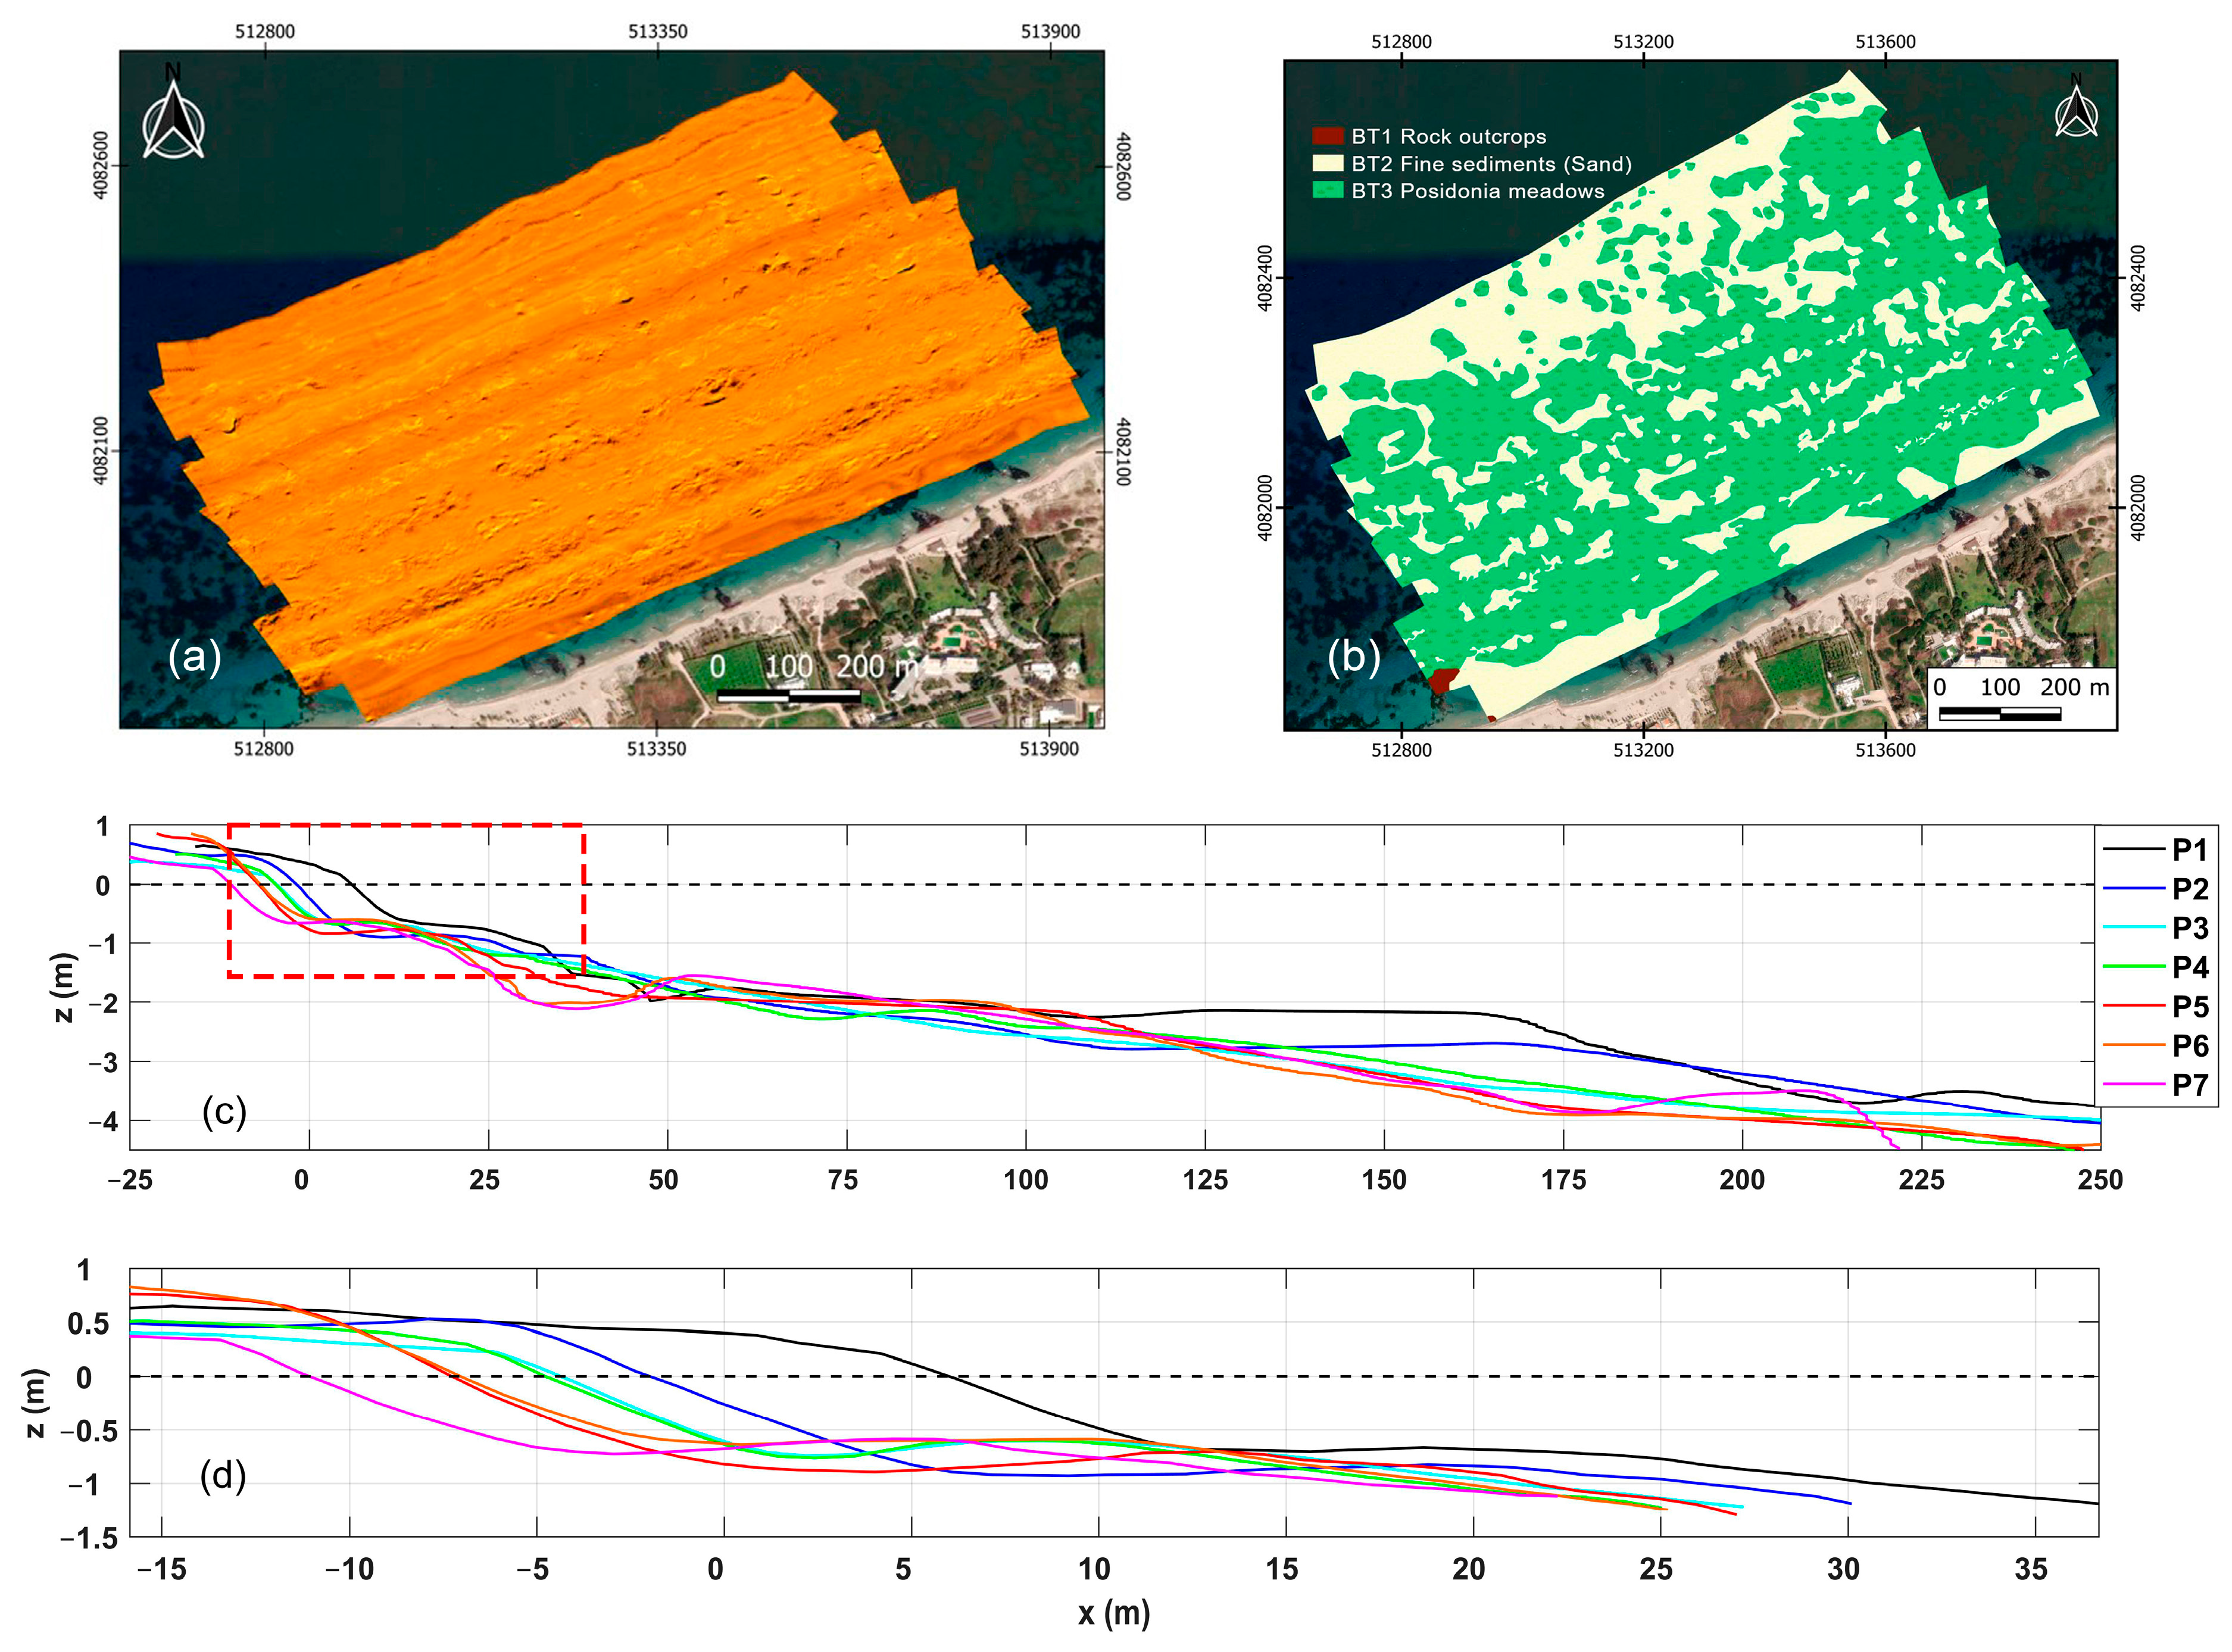
3.1. Beach Morphology, Wind and Wave Climate

The shallow bathymetric survey showed a generally smooth morphology down to the 10 m depth, albeit with the presence of seabed morphological perturbations, particularly close to the shoreline (Figure 1a). The most offshore perturbations were observed about 150–250 m offshore (Figure 3c) at water depths of 2.2 to 4 m, in some of the profiles, with more observed closer to the shoreline at around 1.6–2.2 m depth with alongshore varying distances from the shoreline (of between 50–130 m). The nearshore subaqueous morphology is characterized by the presence of a composite shallow longshore bar, of which the crests were detected at an approximately 0.6–0.8 m water depth (Figure 3d). At the westernmost monitored section of the beach (profiles P1, P2, Figure 1a), the bar is less defined and located further offshore (Figure 3d). The second topographic survey at the end of the monitoring period revealed flattening of the subaerial beach with erosion of the beach berm in the central part around profiles P3 and P4 (Figure 4). The shoreline retreated between 1 and 2 m in this part, as well as at the western edge (P1) while it was found to have advanced between 3 and 6 m in the eastern sector. Noteworthily, an increased accretion of almost 15 m was observed also in the part of the beach westward of P1, indicating sediment accumulation in the groyne. Regarding the beach sedimentology, the sieve analysis of sediment samples revealed a similar grain size both in the shoreline and subaqueous part, ranging from 0.15 to 0.3 mm, indicative of fine-to-medium sand.
The side-scan sonar (SSS) information revealed the presence of three main reflectivity/backscatter types (BTs) (Figure 3a,b). BT1, which was observed in small confined areas, shows high, variable reflectivity with many acoustic shadows; drop-camera observations verified it as being associated with rocky outcrops colonized by flora. BT2 exhibits a rather uniform reflectivity, without large variation in intensity variations and/or shadows; optical observations and sediment sampling showed that BT2 represents sandy beds (with or without ripples). BT3 shows small, frequent, irregular variations in reflectivity, and acoustic shadows (sometimes with abrupt transitions); optical observations showed that BT3 is associated with medium-dense Posidonia meadows. Regarding the sediment characteristics, analysis of the collected samples showed that the nearshore sediments including those within the sandy pockets of the Posidonia meadows consist of moderately well-sorted, fine-to-medium sand (mean grain size 0.140–0.280 mm), being very similar to the nearshore sediments (see above). Natural rocky outcrops were identified only at the southwestern edge of the study area, although some outcrops may be present beneath the Posidonia ‘mats’ covered by a thin veneer of seagrass and sediments. In terms of bed morphology, the sonographs confirmed the presence of morphological, discontinuous perturbations 50–150 m from the shoreline; these have been interpreted as a second series of nearshore sandbars, with their crests found at depths of 1.6–2.2 m. Other perturbations were shown on the sonographs further offshore (see above) covered by Posidonia meadows. However, although their location was within the camera’s field of view, no wave breaking was detected in the monitoring period, due probably to their greater water depth and the generally low waves (see Section 3.2).
Marmari beach is exposed to winds (and wave action) from the northern and western sectors (Figure 1), with the larger wave fetches being form N and NW. Wind records (10 November 2022–6 April 2023) from the meteorological station also showed moderate winds from the southern sector during the monitoring period, but the northern sector winds that can affect the beach were more energetic (>4 Beaufort for 25% of all observations), with the strongest winds (wind speed > 10.8 ms−1, 6 Beaufort) coming from the N and NW; energetic events with a significant duration (17–94) hours occurred, mostly in the period December–March 2022. The records from the deployed RBR wave logger (Figure 1) showed very small tidal ranges (<0.08 m on springs), and a mean significant wave height (Hs) and peak period (Tp) of 0.19 m and 5.3 s, respectively, for the monitoring period.

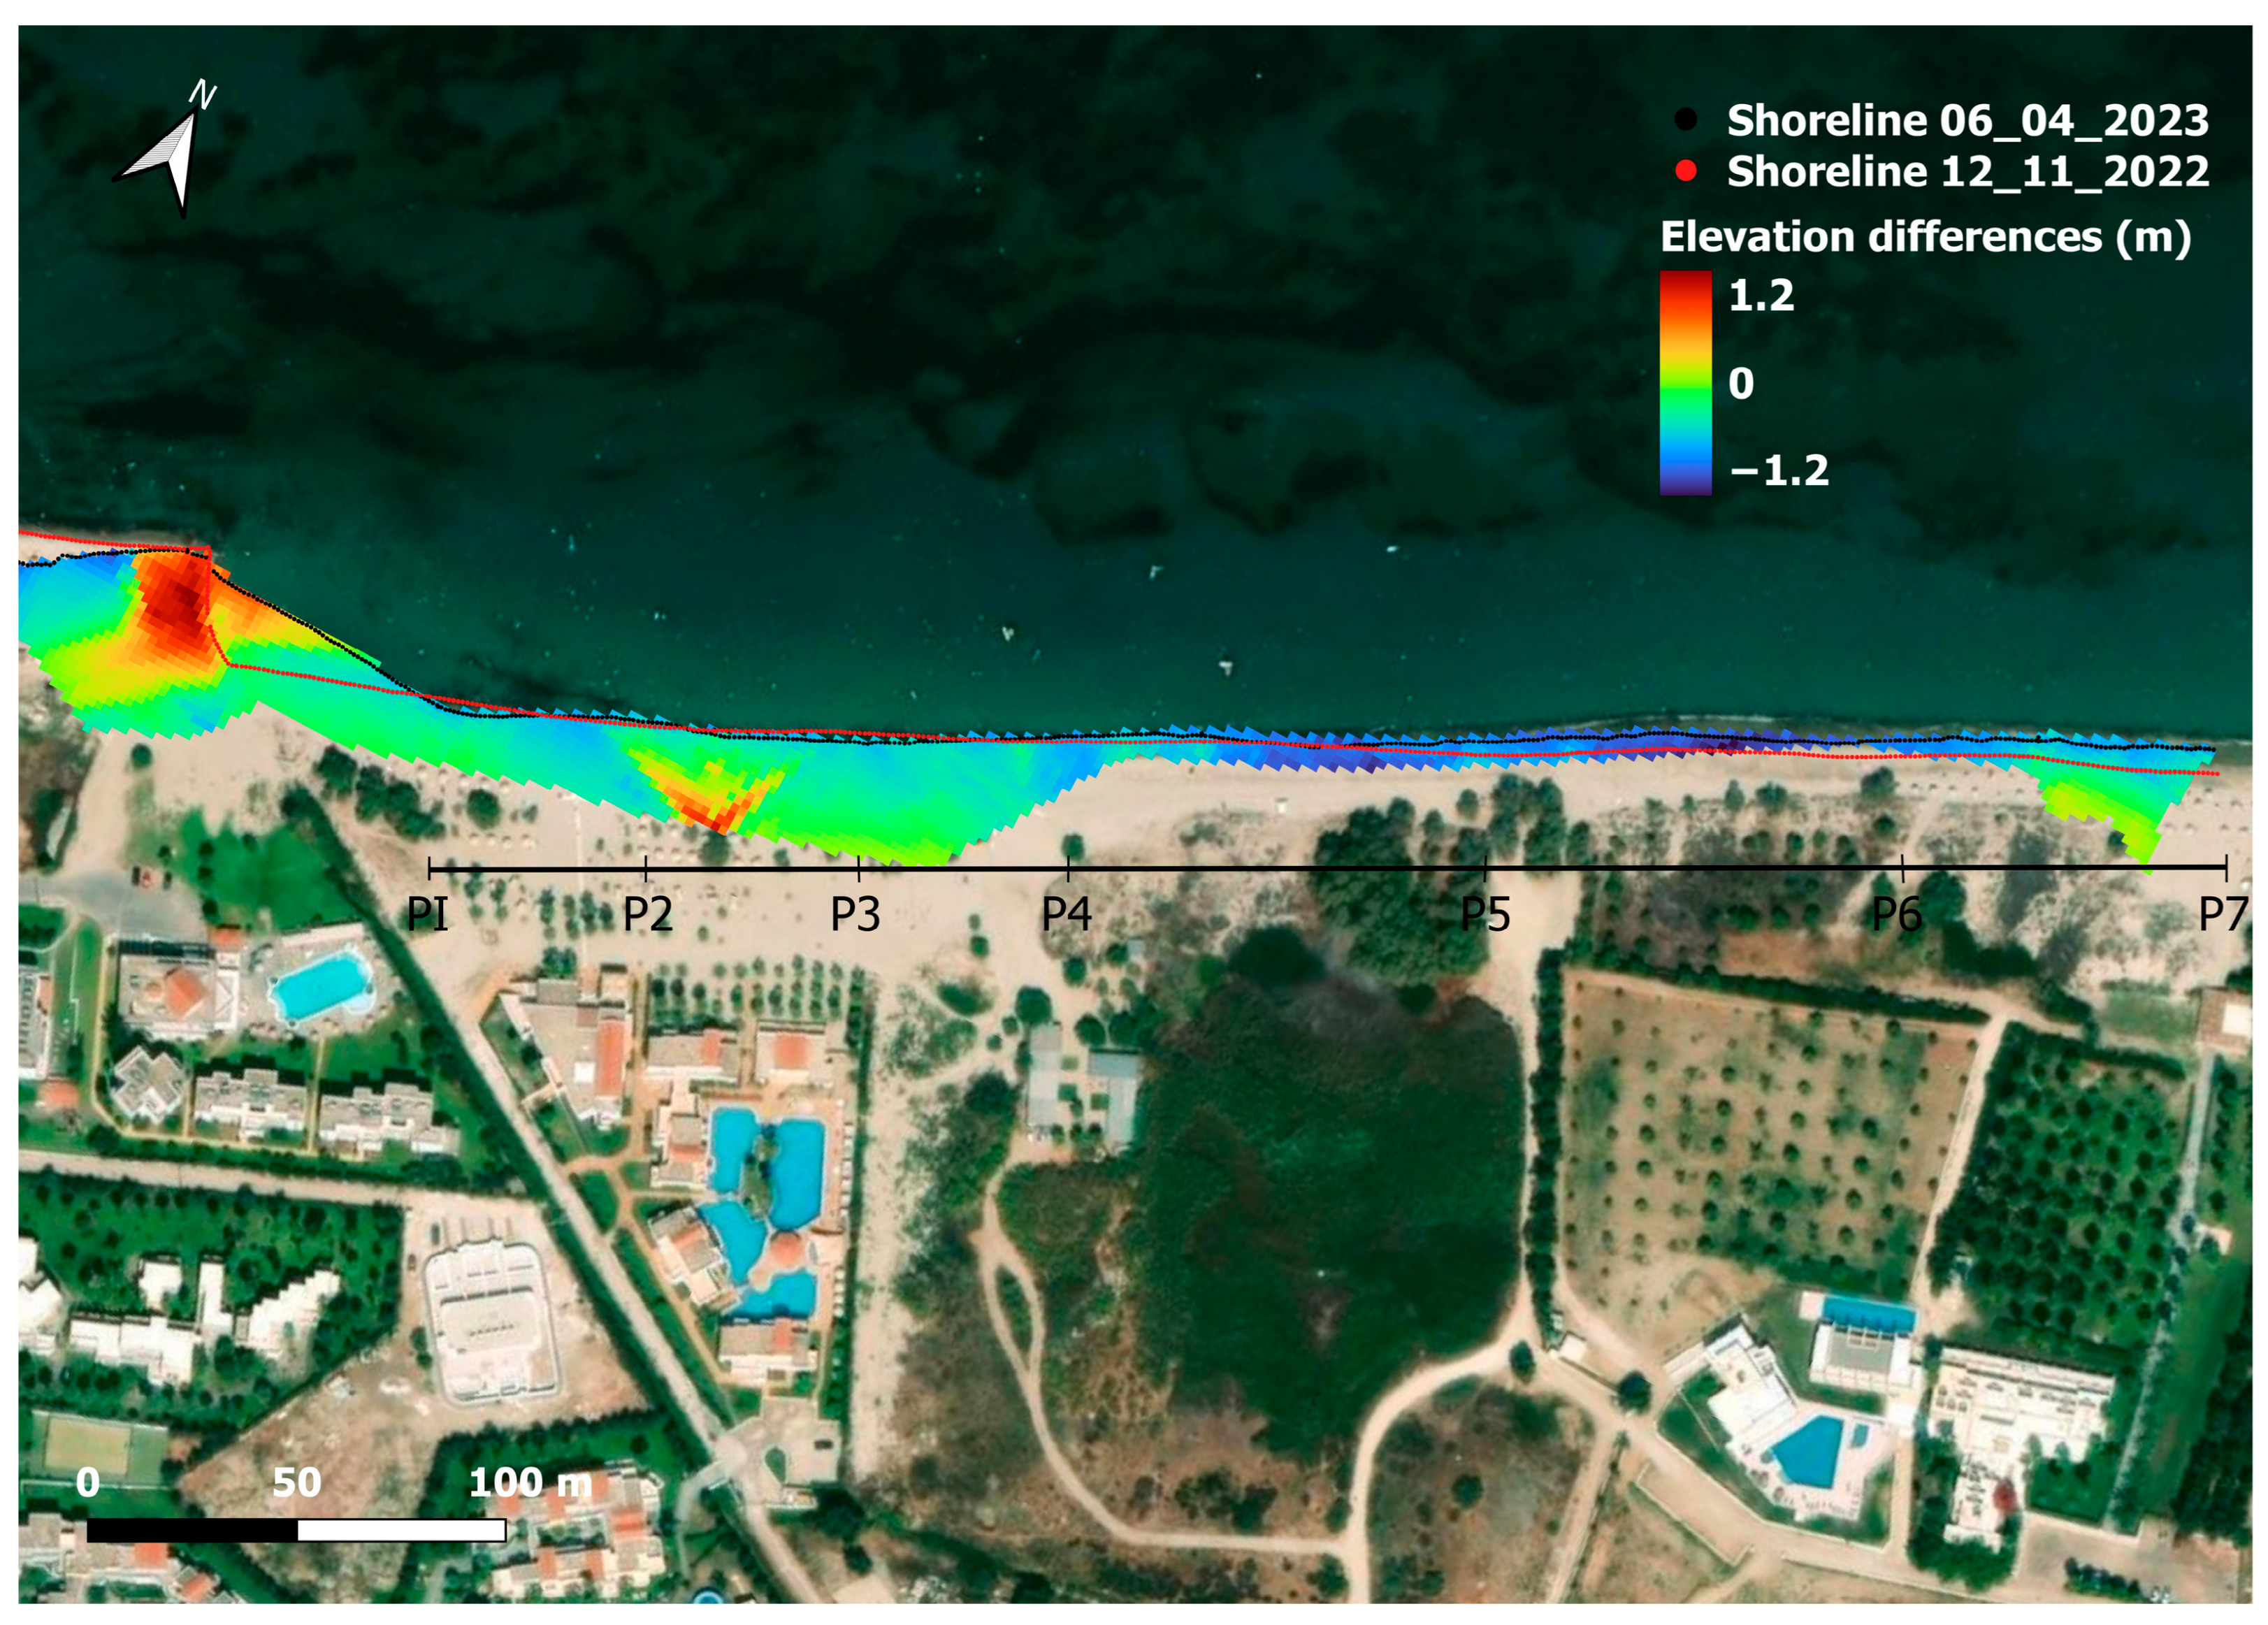
3.2. Shoreline, Wave Run-Up, and Wave Breaking Location

The positions of all three detected features/’metrics’ showed alongshore variability. The shoreline position shows minima and maxima ranges of 11.7 and 17.1 m, respectively (Figure 5b). The maximum variability appears at the western section of the domain (P3), as well toward the eastern part (near P5 and P7) where the differences between the landward and seaward shoreline shifts reach up to 16 m.
The wave run-up excursion shows higher variability, with the differences between the minimum and maximum recorded values ranging between 11.4 and 26.4 m along the coastline (Figure 5c). In particular, the excursion appears highly variable at the western and central parts, with differences between minimum and maximum detection ≥ 20 m. Variability diminishes markedly toward the east, contrasting to the behavior of the shoreline and especially beyond P5, where the range obtains its lowest values (<14 m). Locations of maximum range coincide with the locations of maximum run-up excursions during energetic events. For example, on the energetic event of 23 November 2022, maximum run-up excursion reached 15.7 m inshore of the temporal benchmark around P4, on 11th of December 8.6 m around P3 m and on 29th of March 8.1 m at P1. The maximum run-up excursion values for the same events in the eastern sector were two-to-three times lower, at 7.55 m, 4.7, and 2.3 m, respectively.
Similar to the shoreline, the variability in the breaking zone location appears spatially consistent, but with increased differences between most onshore and offshore positions (23.6–28.5 m), with maximum values appearing at the eastern edge of the domain (Figure 5d). Note that the breaking zone also shows comparable temporal variability in the different transects, ranging between 4.2 and 5.5 m, with maximum variability around P5. In addition, it is higher than that of the wave run-up excursion and the shoreline with differences greater than 2 m. It appears that the breaking zone (and, potentially, the sandbar crest) position has high (temporal) variability, but also more spatially uniform dynamics than the wave run-up excursion.
The behavior of the three morphodynamic ‘metrics in relation to nearshore hydrodynamics is examined on seven representative cross-shore profiles (P1–P7, P1 located at y =150 m, Figure 6a) by computing the differences between the hourly and the temporal benchmark detections (i.e., the detections at the beginning of the monitoring period). Overall, it appears (as expected) that the position of all three features is dependent on the hydrodynamic forcing. High changes (compared to the temporal benchmark) occurred during energetic events, but not uniformly along the beach. Concerning the run-up excursion, a clear peak is observed in the energetic event of the 23 November 2022, when the recorded Hs was 0.8 m (at 7.9 m water depth); however, there was large spatial variability, as manifested by the differences up to 12 m between the maximum values observed in the western and central monitored beach stretch (P2–P4 stations, blue, cyan and green lines in Figure 6c) and the rest of the domain. Energetic wave conditions between the bursts of 23–24 November 2022, when the recorded Hs remained higher than 0.5 m for almost 24 h resulted in a maximum total displacement of 5.3 m, highlighting the impact of sustained wave activity on wave run-up excursion. The coupling of the shoreline (onshore) retreat with wave run-up with one day latency is observed on 12 December 2022, with a shoreline retreat of up to 5.7 m compared to the benchmark. While during this period, the mean Hs is about 0.35 m, the high erosion is probably related to the increased waves (Hs = 0.4–0.6 m) sustained for a period of more than 12 consecutive hours preceding the examined bursts (during the time with no daylight), which resulted in an inland shoreline shift of 6.2 m at P1. On the most energetic event (28–29 March 2022), when the Hs remained higher than 0.5 m for 24 h with maximum values exceeding 1 m (Hs reaching only 0.5 m during the examined hourly bursts), the run-up excursion was maximum at P1, extending 6 m inshore compared to the benchmark and causing a net shoreline retreat of 5 m; however, the shoreline retreat was less pronounced at the remainder of the profiles (Figure 6b).
From the seven considered profiles, maximum values of run-up excursion and shoreline retreat are consistently observed along the profiles P3 and P4, except during January, when a relatively clear pattern emerges at the middle section of the domain. At this location, the formation of a beach cusp lasting for several days is observed on the oblique images following the events of 23 November 2022 and 13 March 2023. Minimum values during energetic conditions occur to its west, with the exception of the intense event of 28–29 March 2023, where maximum excursion is observed near the western edge of the domain (P1). In the profiles backed by the vegetated dune system ((P5–P7), the run-up excursion peaks observed during the most energetic events were up to 10 m more seaward than those of the western sector; the shoreline retreat is also smaller along these profiles. It is also noted that shoreline retreat peaks do not always necessarily coincide with the run-up peaks in space, although the profiles P3 and P4 show systematically the highest values.
During an extended period of calm wave conditions (1–10 December 2022), when the run-up was also small, a beach gain greater than 5 m was observed on the western edge of the beach. The shoreline was also found to consistently oscillate close or seaward of the benchmark during the end of January, even under moderate to high waves. A seaward shift > 8.5 m during a single day was recorded (21 January 2023), with larger beach gains at the eastern profiles; toward the end of January, the shoreline was displaced >12 m compared to the benchmark. This general seaward shift of the shoreline appears to be the result of an (up to) 0.3 m lowering of mean water level as recorded by the RBR, due to sustained high atmospheric pressure (Figure 6e). The maximum beach gains during this period were observed at P4 and P5.
At the end of the recording period, the middle and eastern beach sections appeared to have gained in width, as also shown by the topographic survey. The shoreline shifted seaward between 2.9 and 6.7 m from its initial position, with greater shifts occurring along the eastern section, particularly at its eastern edge. By comparison, the western beach (westwards of P4) showed alternating patterns of a small retreat and gain (ranging from −2.9 m to 0.7 m). The breaking location appeared to be consistently located more offshore compared to the temporal benchmark along P5 and P7 (Figure 6d, red and magenta lines, respectively), where the largest shoreline inshore shift was also observed at the end of the monitoring period.
The breaking zone position sustained a sinusoidal shape during most of the monitoring period, showing though high spatio-temporal variability. At the beginning of the monitoring period (temporal benchmark), crescentic patterns were observed, with wavelengths (defined as the distance between two consecutive horns or bays) between 70 and 120 m and amplitude (defined as half the distance between a horn and bay) between 3 and 5.5 m. Changes in the rhythmicity were evident under moderate wave conditions at multiple wind events (grey bars in Figure 6). For example, moderate wind waves (Hs = 0.3 m) between 25 and 26 December 2022 resulted in the splitting of bays (Figure 7b, around y = 250 and 400) with an increase in amplitude, while the more prolonged event between 18 March and 20 March 2023 (Hs > 0.4 m for 12 h) caused the offshore migration of the breaking zone along with a decrease in the amplitude of the breaking location (Figure 7c).
The most intense wave conditions induced the offshore migration of the breaking location as seen by comparing the detections on the bursts at the beginning and end of the events. More specifically, the cumulative impact of the consecutive energetic events (22–26 November 2022) was a net offshore movement of the breaking zone of up to 12 m at profile P4 and 10 m at P7 (Figure 6d), demarcating a surf zone up to 20 m wide under an Hs of 0.8 m. At the end of this energetic period, crescentic patterns appeared (Figure 7a), similar to those observed at the beginning of the monitoring period. Given that on the 10 m bursts in the beginning and end of the event similar wave conditions (Hs~0.2 m, T~5 s) were recorded, suggesting that this offshore shift may indicate the presence of a crescentic submarine bar at this location. Similarly, the energetic event of 28–29 March, when the Hs exceeded 0.4 m for 24 h and reached values of up to 1.15 m, widened the surf zone to more than 20 m (Figure 7d). Although during the two examined bursts at the beginning and end of the event the wave height and period were similar (Hs~0.5 m and T~5.5 s), the breaking zone location during the burst of 29/03 shifted considerably offshore (~14 m), with longshore uniformity manifesting morphological changes. It must be noted that after the event and following a two-day calm period, the breaking location appeared relatively straightened on 1 April 2023 suggesting substantial morphological change in the sandbar location due to the intense wave activity.
Prolonged low wave activity during which breaking patterns were only occasionally seen was found to promote significant onshore movements. This was especially evident during an 8-day period from the beginning of the monitoring till the 21 November 2022 with low-wave conditions (Hs < 0.2 m for most of the time) that caused the onshore migration of the breaking zone varying alongshore between 5 and 12 m, with higher values observed around P4 and P6. A similar behavior was observed also after the energetic events of November between 28 November and 11 December with Hs rarely exceeding 0.2 m that resulted in net onshore shifts between 6 and 10 m, with larger displacement in the eastern sector.
To illustrate the response of the surf and swash zones to particular energetic events, the P4 profile evolution was selected (Figure 8). Here, the differences in the position of the shoreline, maximum wave run-up excursion and wave breaking in consecutive days are shown, with light blue bars denoting offshore and orange bars onshore movements. Since each day is represented by a single hourly burst, comparison of detections in consecutive days’ bursts can capture the overall morphological response to wave forcing occurred each day (between the recordings). In the comparison, a 36 h window was used, i.e., the differences between detections with longer differences in acquisition time were not considered.
In general, the metrics showed a dynamic behavior under increased wave heights, with onshore shifts for the shoreline and the wave run-up excursion, and offshore movement for the wave breaking. However, the response of the latter appears more pronounced, as its offshore migration reached or exceeded 5 m between bursts acquired in consecutive days in five instances (22 November 2022, 20 December 2022, 1 February 2023, 18 March 2023 and 29 March 2023, grey areas in Figure 8c). Changes in shoreline and wave run-up excursion, however, were minimal in these dates; this was evident even for the most energetic wave conditions encountered (29 March 2023), when a 14 m offshore migration of the wave breaking compared to the previous day was unexpectedly coupled with 1 m offshore displacements of the shoreline and run-up. Also, the energetic event of 23 November 2022 caused the onshore migration of the shoreline, offshore migration of the breaking zone and a much longer wave run-up excursion, resulting in creating a distance of >25 m between them. However, although the run-up excursion decreased in the following days (27 November 2022), the breaking location was found to be moving offshore. Overall, the shorter shifts in the shoreline position and maximum run-up excursion under energetic conditions might suggest a higher dissipation of incoming waves at breaking.
The impact of the wave characteristics on the distance between the wave breaking location and the maximum run-up excursion was investigated using the data from six of the considered profiles (P2–P7, no wave breaking detections were available for P1) (Figure 9). A moderate positive correlation (R = 0.44, p value < 0.001) was found between this distance and the significant wave height Hs (at 7.9 m water depth). While this indicates that larger waves tend to increase the distance between breaking and run-up locations, the relationship is not strong. However, substantial scatter was observed in the data, which may be influenced by the relatively small sample size (n = 348). A larger dataset might provide more reliable results and reduce variability. To explore whether other wave parameters could improve the correlation, the deepwater wave steepness (Ho/Lo) was calculated using inverse shoaling. However, the correlation coefficient remained essentially unchanged, suggesting that other wave characteristics did not significantly influence the wave breaking, i.e., the run-up excursion distance within the range of conditions examined.
In order to investigate the contribution of the different wave bands to the wave run-up, swash motions were mapped along the P4 and P6 profiles using the method/toolbox described in [31] on timestacks for two bursts and spectral analysis for varying wave conditions [16]. The first case concerned a 10 min burst in the beginning of the monitoring period (13 November 2022, 14:00) characterized by low-energy waves (Hs~0.1 m, T = 5 s) and the second an energetic burst (23 November 2022, 15:00), when maximum run-up excursion was observed. The run-up excursions were then translated to run-up heights using the measured elevation profiles assuming no significant changes in the upper foreshore slope and beach topography in the intervening period. The equivalent run-up heights R2% were estimated as 0.04 and ~0.7 m, respectively.
In both cases, it appears that the run-up spectra were characterized by energy shifts to lower frequencies compared to incoming waves (Figure 10). Under low-wave-energy conditions (13 November 2022), the shift was smaller, and the wave run-up height did not show any significant control by the higher frequency waves (0.25–0.30 Hz) detected offshore. At the same time, there is evidence of generation of low-frequency (infragravity) swash motions at both profiles.
Under energetic wave conditions, the wave energy spectra showed two peaks: a higher peak at frequencies of 0.2–0.23 Hz and a lower peak at frequencies of 0.10–0.12 Hz. The latter correlates with the energy peak observed in the run-up height, while the effect of the higher frequency incident waves appears minimal. This clear shift of the run-up heights to lower frequencies than those of the incoming waves, may indicate inherent domination of the run-up heights by lower-frequency motions and/or attenuation of the short waves over the nearshore seabed [16]. It is also noteworthy that the run-up spectra are similar at both the profiles examined, suggesting alongshore consistency.
In order to test the parametric relationship of Stockdon et al., 2006 [13], the recorded run-up excursions were projected onto the measured profiles to approximate the run-up heights (R2%). A comparison for the seven profiles showed good overall agreement for both hourly bursts, although some variability was noted among the different cross-shore profiles. The predictor slightly overestimated the run-up heights, with mean absolute error values of 0.13 and 0.06 m for the two tested events. These differences may reflect local variations in nearshore hydrodynamics or the residual effects of morphological features not captured in the parameterization, such as bar-induced dissipation or bed roughness of the swash zone. It appears that this parametric relationship works well for the dissipative Marmari beach under the low-to-mild-wave conditions tested for which topo-bathymetric information was available.
Finally, the XBeach simulations (Section 2.3) showed the development of a wave envelope, arising from non-linear wave–wave interactions and the redistribution of JONSWAP spectrum as waves approach shallow waters. The nearshore sea level appeared to show significant changes at about 130 m from the shoreline, close to the location of the deeper bar, indicating its potential influence. By comparison, the wave envelope showed transformation due to the shoaling processes starting in deeper waters.
Examination of the Xbeach run video output (Figure 11) showed that the variability of the run-up excursion is controlled by the characteristics of the nearshore waves: larger grouped waves were shown to generate longer run-up excursions, with smaller waves resulting in lower uprush levels. The maximum excursion predicted by XBeach extends almost 10 m onshore of the initial position being close to the video detections that showed maximum run-up excursion of 14 m along P4. However, the shoreline retreat has been shown to be overestimated by the model (almost 10 m at the end of the simulated energetic event) compared to the video observations that showed erosion less than 2 m along this profile.
Concerning the sandbar morphodynamics, no significant morphological change or sediment mobilization was predicted at the location of the offshore sandbar at 2 m water depth. This comes in agreement with the video data, on which foam lines or wave breaking were not observed at this location even under the most intense wave conditions. Therefore, the XBeach simulation verified the visual interpretation that the outer bar lies outside the active surf zone. On the other hand, the model showed crest flattening of the shallower nearshore bar (Figure 11, red and black lines between x = 20 and 30 m); thus, the (1-D) offshore sediment transport in the shallow nearshore zone is not translated into ‘building’ up the shallow nearshore bar, or sandbar crest net offshore movement (NOM). Since wave breaking patterns are apparent on the video observations of the next days, this rapid morphological change predicted by XBeach is not verified by the observations.
The aforementioned discrepancies in the prediction of nearshore morphodynamics may be partially explained by the default configuration of the model under which tends to result in excessive erosion and straightening of the bed profile [43,44]. Moreover, inaccuracies may be introduced also by the fact that potential wave height attenuation inshore of the RBR site due to the shallow seagrasses [45] has not been considered, as well as that nearshore processes such as longshore transport and wave refraction are not taken into account in the 1-D simulation. Overall, while the fine tuning of the model is required for the prediction of shoreline dynamics, the 1-D XBeach simulation captured the nearshore hydrodynamics, including the swash zone, with reasonable accuracy, indicating its validity for interpreting and drawing conclusions about the wave transformation under energetic conditions.

4. Discussion

The present work concerns an investigation of the surf and swash zone dynamics in a microtidal, low-energy dissipative beach. The dynamics of the wave breaking zone, the shoreline, and the wave run-up excursion were examined using high-frequency observations collected during the energetic (winter) period, using a coastal video monitoring system (BOMS) and concurrent wave information. A high-resolution topo-bathymetric survey of the study area (Marmari) revealed the presence of a sequence of composite, longshore nearshore bars at different water depths and distances from the shoreline, with the shallowest bars being at water depths of 0.6–0.8 m. Therefore, the nearshore wave breaking position might be also used, albeit with limitations, as a proxy of sandbar location [27,38].
Over the winter, with mild wave conditions (max Hs ~1.2 m at 7.9 m depth), the TIMEX images recorded wave breaking only at the shallowest inner sandbars. Wave breaking showed recurrent crescentic patterns through most of the monitoring period, with the exception of the most energetic events when temporary ‘straightening’ of the breaking zone was observed. Wave breaking was observed to migrate offshore, as expected, by up to 14 m at representative transects during most recorded energetic events, with a significant spatial variability along the monitored beach stretch (450 m).
Concurrent observations of the shoreline position and the wave run-up excursion did not show a clear trend. The shoreline appeared relatively stable under the encountered wave conditions. Retreats of up to ~5 m were observed under the highest wave heights, but beach recovery occurred in the following low-energy period. Small beach gains were observed at the end of the monitoring period at the eastern sector of the monitored stretch, where the most offshore wave breaking was recorded. Episodic run-up excursions of 14 m inshore of the excursions of the beginning of the monitoring period were recorded. Generally, the run-up excursions were observed to extend onshore under increased wave heights, remaining, though relatively small (about 6 m compared to the start of the monitoring), including during energetic events that induced longer offshore migration of the wave breaking.
Longer run-up excursions and shoreline retreats were observed in the western and central sectors. These are the wider parts of the considered coastal stretch, with backshore infrastructure/assets located at more than 50 m from the shoreline (Figure 1). Therefore, the maximum observed shoreline retreats and run-up excursions (occurred during the most energetic events) do not appear to presently pose a significant erosion/flood risk for the backshore assets. However, a recent study has suggested that Marmari beach will be quite exposed to erosion under the mean and extreme sea levels projected under climate change; as the beach has also a high hedonic and socioeconomic value due to its high 3S tourism activities, it was ranked first in terms of its need for adaptation measures [34]. This might indicate that even beaches currently facing mild wave conditions and being relatively stable might be under increasing erosion risks under climate change, with negative consequences for backshore assets.
The distance between the wave breaking location and the run-up excursion showed a moderate correlation (R = 0.44) with the offshore waves. In general, the dynamics of the breaking zone showed stronger response to energetic wave conditions compared to the other two metrics. This implies that under moderate wave heights, the dissipation of the incoming waves induced by the seabed perturbations (sandbars) results in relatively small run-up excursions and shoreline retreats.
It has been suggested that the nearshore sandbars can act as a ‘low-pass filter’ to the incoming wave energy [24,46], with the contribution of lower frequency motions in the total run-up found to play a major role on the dynamics of open ocean beaches [13,47,48]. In this study, the spectral analysis of the waves and run-up heights (R2%) in 10 min bursts under different wave conditions showed a clearer shift of the run-up height to lower frequencies than that of the incoming waves. This may indicate the inherent domination of the run-up heights by lower-frequency motions and/or shortwave attenuation over the nearshore seabed. Under higher energetic conditions (Hs ~ 0.8 m), the run-up was clearly dominated by low frequencies, showing a substantial energy transfer from the higher frequencies, while there was also evidence of introduction of low-energy infragravity motions. Our results confirm previous observations in microtidal energy beaches that showed shifts from the higher to lower frequencies, as well as low infragravity contributions to the swash motions [16]. Generally, it appears that the Marmari nearshore seabed (nearshore sandbars) act as ‘low-pass’ filters to the incoming wave energy.
As mentioned earlier, the wave breaking zone could be used as a proxy for the nearshore sandbar location. However, the association of the wave breaking white foam recorded on the TIMEX images with sandbar crests is not a straightforward exercise [27], as waves may start breaking offshore of the bar crests. Nevertheless, the observed cross-shore differences of the breaking location by more than 5 m between bursts with similar wave characteristics may imply morphological changes in the period between the recorded bursts. The wave breaking patterns observed on TIMEX images revealed very little, if any, variability in (at least) two extended periods of low wave energy (13–21 November 2022, 1–10 December 2022), suggesting a rather stable seabed morphology under such conditions.
The most widely used concept for the behavior of sandbar is the net offshore migration (NOM). Previous works have suggested a ‘cyclical’ evolution process that spans years driven by the nearshore hydro- and sediment dynamics. The process starts with the formation of sandbars in the inner surf zone, which then grow and move offshore, eventually decaying at the outer boundary of the surf zone [49,50,51,52]. While in large bar systems the NOM dynamics may present clear patterns in interannual scales, on small bar systems, it might be episodically triggered during storm events [40]. In the current dataset, the most energetic events recorded single-day shifts of the bays of the sandbar exceeding 10 m; however, succeeding low wave action appeared to promote a bar shift toward its preceding position, suggesting an oscillation around an equilibrium position. Given the absence of extreme storms during the monitoring period, it must come as no surprise that there was no eventual decay of the sandbar. On a similar study in the Italian site of Lido di Dante (27), an episodic NOM pattern was not concluded even under a storm event, with peak waves exceeding 5 m and lasting for 22 h.
Regarding the sandbar evolution controls, these have been thought to be either the hydrodynamic conditions and/or the antecedent morphology [21,53]. The former implies the development of an equilibrium state: the sandbars move onshore under low-energy waves and offshore under high-energy waves [54]. The latter is based on the concept that sandbar evolution forms part of a beach morphological cycle [53,55] in which the antecedent morphology (i.e., the previous sandbar and beach morphology) is the primary control [56,57]. Our data, although limited in duration, appear to support this concept, as different nearshore morphological responses (shown by the (crescentic) wave breaking patterns) were observed under similar wave conditions.
Six morphodynamic states have been defined by the well-established beach classification of [53], with the two extreme states denoting the presence or not of a sandbar (Dissipative and Reflective beaches, respectively) with the transition to the intermediate states being determined primarily by the morphology of the sandbar. In Marmari, crescentic forms of moderate-to-high rhythmicity are present with wavelengths between 70 and 100 m and amplitudes between 2.5 and 6 m for most of the monitoring period. The persistent rhythmicity indicates that the beach is under either the Transverse Bar and Rip (TBR) or the Rhythmic Bar Beach (RBB) state [50]. Horns are occasionally found attached to the shoreline in the TIMEX images (e.g., Figure 7a between 450 and 500 m, 6b on multiple locations) indicating that the system is in transition between the two states under low-to-mild wave conditions. It has been found that the two states are observed under low wave conditions and the transition between them, especially when the TBR characterized as high rhythmicity shows no apparent correlation to incoming wave energy [58]. In barred beaches, increased wave energy during energetic events could cause sandbar ‘straightening’. In Marmari, the low energetic conditions encountered did not generally favor such a morphological evolution, with the exception of the most energetic event at the end of March (Figure 7d). Taking into account that during this intense event waves were higher than 0.4 m for more than 24 h, it may be assumed that such an event can cause substantial morphological change in Marmari.
The role of the Posidonia meadows and the outer subtidal bars detected during the hydrographic survey could not be assessed due to absence of wave breaking during the examined bursts. The depth of the outer bar crest (1.6–2.2 m) in conjunction with the relatively low waves most probably did not induce wave breaking while the presence of Posidonia over the area of the outer sandbar may result in constraining its morphological changes under normal wave conditions. Nevertheless, these features may still cause the dissipation of the incoming waves affecting nearshore hydrodynamics, as manifested by the XBeach simulation.
Similar to other video-based studies, a limitation of the current work is that in some cases, energetic wave conditions with a duration even longer than 12 h occurred during dark, not allowing for the nearshore dynamics to be captured by BOMS. For example, in the energetic event of 29/03, when maximum offshore migration of the wave breaking was observed, the Hs was 0.5 m during the considered burst; nevertheless, before this burst, higher offshore wave heights were recorded by the wave logger during the preceding ‘dark’ hours. As both sandbar and shoreline position may reflect the morphological response to previously exerted wave action, this limitation can hinder the correlation between the sandbar position (and its distance from the run-up excursion) and the incoming wave dynamics.
Another limitation arises from the absence of wave direction in the RBR records; wave direction information would have allowed for the assessment of the role that the angle of incidence has in the nearshore dynamics. The concurrent wind data showed NW directions during the most energetic events, suggesting small angles of the approaching waves in relation to the shoreline (Figure 1) and potential generation of longshore currents towards the northeast. Longshore currents induced by oblique waves can sustain or even ‘straighten’ the sandbar morphology, also causing downdrift sediment transport [58,59]. This may explain the more offshore location of wave breaking in the eastern stretch of the monitored beach.
In this context, information on the wave direction or/and current field would have also allowed for the assessment of the influence of the groyne constructed at the western edge of the beach (Figure 1). Substantial accretion was observed in the end of the monitoring period with the shoreline shifted almost 15 m in the distance between the groyne and P1. Nevertheless, the dominant wind directions, especially during the most energetic conditions, have not indicated a potential westward longshore transport. Moreover, due to the obstacles in the field of view of the camera, no information could be retrieved on the evolution of shoreline and sandbar in this area from BOMS. Therefore, there is no clear evidence of groynes’ impact on the local beach morphology. Nevertheless, the observed sediment accretion in the vicinity of the groynes (and between them) suggests that they have influenced the longshore sediment transport and budgets in this area. Therefore, it might be argued that the observed nearshore processes may also reflect the ‘isolation’ of the western Marmari beach regarding sediment exchanges with its adjacent coast.
As there is a lack in studies of nearshore dynamics on microtidal, dissipative beaches that could be highly exposed to beach erosion and flooding under climate change, further work is required involving longer observation to capture the interannual evolution of the surf and swash zones. Such work will be of high importance as, apart from getting insights of the processes and improving our diagnostic and prognostic ability, it also has important legal implications, particularly concerning the wave run-up role as the boundary of the Maritime and Terrestrial domains [60].
Finally, this study has shown that beach video monitoring, coupled with concurrent wave monitoring, can provide very useful insights regarding the surf and swash dynamics which should be also considered when studying the potential effects of climate change on beaches particularly in island settings [61,62]. In our case, previously developed algorithms [14,35] for the semiautomated detection of the shoreline and maximum run-up excursion were adjusted and applied for the concurrent detection of the wave breaking position. The algorithm was found capable of successfully detecting the wave breaking location resolving its patterns and evolution, which can be related to the evolution of the shallow nearshore sandbar.

5. Conclusions

The high-frequency optical monitoring of a microtidal, low energy, sandbar fronted beach carried out during the most energetic (winter period) to investigate its surf and swash zone dynamics combined with concurrent in situ wave measurements provided some interesting insights. Increased heights of the incoming waves induced offshore migration of the wave breaking zone, but with significant alongshore variability, with occasional rhythmic patterns under moderate wave conditions. However, no triggering of the sandbar NOM could be verified in response to the most energetic conditions. Transient shoreline erosional episodes, which were coupled with increased run-up excursions, were recorded, yet the shoreline showed signs of recovery, suggesting that the beach is in a ‘quasi-equilibrium’.
The run-up motion spectra appeared to be dominated by lower frequencies compared to those of the incoming waves under both the low and the high-energy events encountered. These shifts have been attributed to the effects of the nearshore sandbars that appear to act as ‘low-pass’ filters to the incoming waves. Our data, although limited in duration, also appear to support the concept that sandbar evolution forms part of a beach morphological cycle in which the antecedent morphology (i.e., the previous sandbar and beach morphology) exerts the primary control. Finally, the empirical wave run-up predictor of Stockdon et al., 2006 [13], compared well with our observations, confirming its applicability in low-energy dissipative beaches.

Author Contributions

Conceptualization, D.C., A.E.C., I.N.M. and A.F.V.; methodology, D.C., A.E.C. and A.F.V.; formal analysis, D.C. and A.E.C.; resources, I.N.M.; data curation, O.P.A., F.P., D.C., A.E.C., I.N.M. and I.T.P.; writing—original draft preparation, all authors; writing—review and editing, D.C. and A.F.V., A.E.C.; visualization, D.C. and A.E.C.; supervision, A.F.V. and I.N.M. All authors have read and agreed to the published version of the manuscript.

Funding

This research was supported by the Hellenic Foundation for Research and Innovation (H.F.R.I.) under the “2nd Call for H.F.RI. Research Projects to Support Post-Doctoral Researchers” (Project 211).

Data Availability Statement

Data will be made available upon request.

Acknowledgments

The authors would like to thank Anastasios Rigos and Vasilis Trygonis for their technical support in the deployment and maintenance of BOMS.

Conflicts of Interest

The authors declare no conflicts of interest.

Note

1

References

  1. Luijendijk, A.; Hagenaars, G.; Ranasinghe, R.; Baart, F.; Donchyts, G.; Aarninkhof, S. The State of the World’s Beaches. Sci. Rep. 2018, 8, 6641. [Google Scholar] [CrossRef] [PubMed]
  2. Roy, P.; Pal, S.C.; Chakrabortty, R.; Chowdhuri, I.; Saha, A.; Shit, M. Effects of Climate Change and Sea-Level Rise on Coastal Habitat: Vulnerability Assessment, Adaptation Strategies and Policy Recommendations. J. Environ. Manag. 2023, 330, 117187. [Google Scholar] [CrossRef]
  3. Toimil, A.; Losada, I.J.; Álvarez-Cuesta, M.; Le Cozannet, G. Demonstrating the Value of Beaches for Adaptation to Future Coastal Flood Risk. Nat. Commun. 2023, 14, 3474. [Google Scholar] [CrossRef] [PubMed]
  4. UNWTO. International Tourism Highlights, 2024 ed.; World Tourism Organization: Madrid, Spain, 2024; ISBN 978-92-844-2579-2. [Google Scholar]
  5. Monioudi, I.N.; Velegrakis, A.F. Beach Carrying Capacity at Touristic 3S Destinations: Its Significance, Projected Decreases and Adaptation Options under Climate Change. J. Tour. Hosp. 2022, 11, 500. [Google Scholar]
  6. Brett, M.R. How Important is Coastal Tourism for Island Nations? An Assessment of African and Indian Ocean Islands. J. Coast. Res. 2021, 37, 568–575. [Google Scholar] [CrossRef]
  7. Pons, G.X.; Martín-Prieto, J.Á.; Carreras-Martí, D. Tourist Visitation and Beach Erosion: Analysis of the Evolution of the Coastline, Frequentation and Beach Area on the Island of Menorca (2001–2015) (Balearic Islands, Spain). In Spanish Tourism Geographies: Territorial Diversity and Different Approaches; Blanco-Romero, A., Blázquez-Salom, M., Eds.; Springer International Publishing: Cham, Switzerland, 2023; pp. 227–243. ISBN 978-3-031-39780-6. [Google Scholar]
  8. Vousdoukas, M.I.; Ranasinghe, R.; Mentaschi, L.; Plomaritis, T.A.; Athanasiou, P.; Luijendijk, A.; Feyen, L. Sandy Coastlines under Threat of Erosion. Nat. Clim. Chang. 2020, 10, 260–263. [Google Scholar] [CrossRef]
  9. Bozzeda, F.; Ortega, L.; Costa, L.L.; Fanini, L.; Barboza, C.A.M.; McLachlan, A.; Defeo, O. Global Patterns in Sandy Beach Erosion: Unraveling the Roles of Anthropogenic, Climatic and Morphodynamic Factors. Front. Mar. Sci. 2023, 10, 1270490. [Google Scholar] [CrossRef]
  10. WMO. State of Global Climate 2023; WMO-No. 1347; World Meteorological Organization: Geneva, Switzerland, 2024; ISBN 978-92-63-11347-4. [Google Scholar]
  11. Monioudi, I.N.; Velegrakis, A.F.; Chatzistratis, D.; Vousdoukas, M.I.; Savva, C.; Wang, D.; Bove, G.; Mentaschi, L.; Paprotny, D.; Morales-Nápoles, O.; et al. Climate change—Induced hazards on touristic island beaches: Cyprus, Eastern Mediterranean. Front. Mar. Sci. 2023, 10, 1188896. [Google Scholar] [CrossRef]
  12. Komar, P.D. Beach Processes and Sedimentation; Prentice Hall: Upper Saddle River, NJ, USA, 1978; ISBN 0-13-754938-5. [Google Scholar]
  13. Stockdon, H.F.; Holman, R.A.; Howd, P.A.; Sallenger, A.H. Empirical Parameterization of Setup, Swash, and Runup. Coast. Eng. 2006, 53, 573–588. [Google Scholar] [CrossRef]
  14. Chatzipavlis, A.; Tsekouras, G.E.; Trygonis, V.; Velegrakis, A.F.; Tsimikas, J.; Rigos, A.; Hasiotis, T.; Salmas, C. Modeling Beach Realignment Using a Neuro-Fuzzy Network Optimized by a Novel Backtracking Search Algorithm. Neural Comput. Appl. 2019, 31, 1747–1763. [Google Scholar] [CrossRef]
  15. Pianca, C.; Holman, R.; Siegle, E. Shoreline Variability from Days to Decades: Results of Long-Term Video Imaging. J. Geophys. Res. Oceans 2015, 120, 2159–2178. [Google Scholar] [CrossRef]
  16. Vousdoukas, M.I.; Velegrakis, A.F.; Dimou, K.; Zervakis, V.; Conley, D.C. Wave Run-up Observations in Microtidal, Sediment-Starved Pocket Beaches of the Eastern Mediterranean. J. Mar. Syst. 2009, 78, S37–S47. [Google Scholar] [CrossRef]
  17. Velegrakis, A.; Papadatou, K.; Alves, B.; Hasiotis, T.; Armaroli, C. International and EU Policies and Legislation for Coastal Floods. In Proceedings of the Marine and Inland Waters Research Symposium, Port Heli, Greece, 16–19 September 2022; Tzovara, E., Ed.; Hellenic Centre for Marine Research: Anavyssos, Greece, 2022; pp. 91–95. [Google Scholar]
  18. Gomes da Silva, P.; Coco, G.; Garnier, R.; Klein, A.H.F. On the Prediction of Runup, Setup and Swash on Beaches. Earth Sci. Rev. 2020, 204, 103148. [Google Scholar] [CrossRef]
  19. Dubarbier, B.; Castelle, B.; Marieu, V.; Ruessink, G. Process-Based Modeling of Cross-Shore Sandbar Behavior. Coast. Eng. 2015, 95, 35–50. [Google Scholar] [CrossRef]
  20. Cohn, N.; Ruggiero, P. The Influence of Seasonal to Interannual Nearshore Profile Variability on Extreme Water Levels: Modeling Wave Runup on Dissipative Beaches. Coast. Eng. 2016, 115, 79–92. [Google Scholar] [CrossRef]
  21. Anderson, D.; Bak, A.S.; Cohn, N.; Brodie, K.L.; Johnson, B.; Dickhudt, P. The Impact of Inherited Morphology on Sandbar Migration During Mild Wave Seasons. Geophys. Res. Lett. 2023, 50, e2022GL101219. [Google Scholar] [CrossRef]
  22. Hoefel, F.; Elgar, S. Wave-Induced Sediment Transport and Sandbar Migration. Science 2003, 299, 1885–1887. [Google Scholar] [CrossRef]
  23. Pan, Y.; Yin, S.; Chen, Y.P.; Yang, Y.B.; Xu, C.Y.; Xu, Z.S. An Experimental Study on the Evolution of a Submerged Berm under the Effects of Regular Waves in Low-Energy Conditions. Coast. Eng. 2022, 176, 104169. [Google Scholar] [CrossRef]
  24. Li, Y.; Zhang, C.; Dai, W.; Chen, D.; Sui, T.; Xie, M.; Chen, S. Laboratory Investigation on Morphology Response of Submerged Artificial Sandbar and Its Impact on Beach Evolution under Storm Wave Condition. Mar. Geol. 2022, 443, 106668. [Google Scholar] [CrossRef]
  25. Kuang, C.; Chen, L.; Han, X.; Wang, D.; Cao, D.; Zou, Q. Impacts of an Artificial Sandbar on Wave Transformation and Runup over a Nourished Beach. Geosciences 2024, 14, 337. [Google Scholar] [CrossRef]
  26. Cheng, J.; Wang, P. Dynamic Equilibrium of Sandbar Position and Height along a Low Wave Energy Micro-Tidal Coast. Cont. Shelf Res. 2018, 165, 120–136. [Google Scholar] [CrossRef]
  27. Armaroli, C.; Ciavola, P. Dynamics of a Nearshore Bar System in the Northern Adriatic: A Video-Based Morphological Classification. Geomorphology 2011, 126, 201–216. [Google Scholar] [CrossRef]
  28. Melito, L.; Parlagreco, L.; Perugini, E.; Postacchini, M.; Devoti, S.; Soldini, L.; Zitti, G.; Liberti, L.; Brocchini, M. Sandbar Dynamics in Microtidal Environments: Migration Patterns in Unprotected and Bounded Beaches. Coast. Eng. 2020, 161, 103768. [Google Scholar] [CrossRef]
  29. Alevizos, E. Quantification of Nearshore Sandbar Seasonal Evolution Based on Drone Pseudo-Bathymetry Time-Lapse Data. Remote Sens. 2024, 16, 4551. [Google Scholar] [CrossRef]
  30. Boak, E.H.; Turner, I.L. Shoreline Definition and Detection: A Review. J. Coast. Res. 2005, 21, 688–703. [Google Scholar] [CrossRef]
  31. Vousdoukas, M.I.; Wziatek, D.; Almeida, L.P. Coastal Vulnerability Assessment Based on Video Wave Run-up Observations at a Mesotidal, Steep-Sloped Beach. Ocean Dyn. 2012, 62, 123–137. [Google Scholar] [CrossRef]
  32. SETE Annual Report of Competitiveness and Structural Adjustment in the Touristic Sector for the Year 2023: Administrative Region of South Aegean. Available online: https://insete.gr/wp-content/uploads/2024/12/24-12_South_Aegean-1.pdf (accessed on 30 November 2024). (In Greek).
  33. Piper, D.J.W.; Pe-Piper, G. A Reworked Isolated Deposit of the Kos Plateau Tuff and Its Significance for Dating Raised Marine Terraces, Kos, Greece. Geol. Mag. 2020, 157, 2021–2032. [Google Scholar] [CrossRef]
  34. Monioudi, I.N.; Chatzistratis, D.; Chalazas, T.; Chatzipavlis, A.E.; Velegrakis, A.F.; Andreadis, O.P.; Monioudis, E.N.; Nikolaou, A.; Hasiotis, T. A Prioritization Framework for Adaptation Responses for Climate Change-Induced Erosion in Island Beaches—Cases from the Aegean Islands, Greece. J. Mar. Sci. Eng. 2025, 13, 491. [Google Scholar] [CrossRef]
  35. Velegrakis, A.F.; Trygonis, V.; Chatzipavlis, A.E.; Karambas, T.; Vousdoukas, M.I.; Ghionis, G.; Monioudi, I.N.; Hasiotis, T.; Andreadis, O.; Psarros, F. Shoreline Variability of an Urban Beach Fronted by a Beachrock Reef from Video Imagery. Nat. Hazards 2016, 83, 201–222. [Google Scholar] [CrossRef]
  36. Senechal, N.; Coco, G.; Castelle, B.; Marieu, V. Storm Impact on the Seasonal Shoreline Dynamics of a Meso- to Macrotidal Open Sandy Beach (Biscarrosse, France). Geomorphology 2015, 228, 448–461. [Google Scholar] [CrossRef]
  37. Rigos, A.; Tsekouras, G.E.; Vousdoukas, M.I.; Chatzipavlis, A.; Velegrakis, A.F. A Chebyshev Polynomial Radial Basis Function Neural Network for Automated Shoreline Extraction from Coastal Imagery. Integr. Comput. Aided Eng. 2016, 23, 141–160. [Google Scholar] [CrossRef]
  38. Bouvier, C.; Balouin, Y.; Castelle, B. Video Monitoring of Sandbar-Shoreline Response to an Offshore Submerged Structure at a Microtidal Beach. Geomorphology 2017, 295, 297–305. [Google Scholar] [CrossRef]
  39. Splinter, K.D.; Gonzalez, M.V.G.; Oltman-Shay, J.; Rutten, J.; Holman, R. Observations and Modelling of Shoreline and Multiple Sandbar Behaviour on a High-Energy Meso-Tidal Beach. Cont. Shelf Res. 2018, 159, 33–45. [Google Scholar] [CrossRef]
  40. Ruessink, B.G.; Pape, L.; Turner, I.L. Daily to Interannual Cross-Shore Sandbar Migration: Observations from a Multiple Sandbar System. Cont. Shelf Res. 2009, 29, 1663–1677. [Google Scholar] [CrossRef]
  41. Roelvink, D.; Reniers, A.; van Dongeren, A.; van Thiel de Vries, J.; McCall, R.; Lescinski, J. Modelling Storm Impacts on Beaches, Dunes and Barrier Islands. Coast. Eng. 2009, 56, 1133–1152. [Google Scholar] [CrossRef]
  42. U.S. Army Corps of Engineers. Coastal Engineering Manual (CEM); Engineer Manual 1110-2-1100; U.S. Army Corps of Engineers: Washington, DC, USA, 2002.
  43. Monioudi, I.; Velegrakis, A.F.; Chatzipavlis, A.; Rigos, A.; Karambas, T.; Vousdoukas, M.I.; Hasiotis, T.; Koukourouvli, N.; Peduzzi, P.; Manoutsoglou, E.; et al. Assessment of island beach erosion due to sea level rise: The case of the Aegean Archipelago (Eastern Mediterranean). Nat. Hazards Earth Syst. Sci. 2017, 17, 449–466. [Google Scholar] [CrossRef]
  44. Biolchi, L.G.; Unguendoli, S.; Bressan, L.; Giambastiani, B.M.S.; Valentini, A. Ensemble technique application to an XBeach-based coastal Early Warning System for the Northwest Adriatic Sea (Emilia-Romagna region, Italy). Coast. Eng. 2022, 173, 104081. [Google Scholar] [CrossRef]
  45. Peduzzi, P.; Velegrakis, A.; Chatenoux, B.; Estrella, M.; Karambas, T. Assessment of the Role of Nearshore Marine Ecosystems to Mitigate Beach Erosion: The Case of Negril (Jamaica). Environments 2022, 9, 62. [Google Scholar] [CrossRef]
  46. Elgar, S.; Guza, R.T.; Raubenheimer, B.; Herbers, T.H.C.; Gallagher, E.L. Spectral Evolution of Shoaling and Breaking Waves on a Barred Beach. J. Geophys. Res. Oceans 1997, 102, 15797–15805. [Google Scholar] [CrossRef]
  47. Holman, R.A.; Guza, R.T. Measuring Run-up on a Natural Beach. Coast. Eng. 1984, 8, 129–140. [Google Scholar] [CrossRef]
  48. Ruessink, B.G.; Kleinhans, M.G.; van den Beukel, P.G.L. Observations of Swash under Highly Dissipative Conditions. J. Geophys. Res. Oceans 1998, 103, 3111–3118. [Google Scholar] [CrossRef]
  49. Wijnberg, K.M. On the Systematic Offshore Decay of Breaker Bars. In Proceedings of the 25th International Conference on Coastal Engineering, Orlando, FL, USA, 2–6 September 1996; ASCE: New York, NY, USA, 1997; pp. 3600–3613. [Google Scholar]
  50. Ruessink, B.G.; Wijnberg, K.M.; Holman, R.A.; Kuriyama, Y.; van Enckevort, I.M.J. Intersite Comparison of Interannual Nearshore Bar Behavior. J. Geophys. Res. Oceans 2003, 108, 3249. [Google Scholar] [CrossRef]
  51. Walstra, D.J.R.; Reniers, A.J.H.M.; Ranasinghe, R.; Roelvink, J.A.; Ruessink, B.G. On Bar Growth and Decay during Interannual Net Offshore Migration. Coast. Eng. 2012, 60, 190–200. [Google Scholar] [CrossRef]
  52. Walstra, D.-J.R.; Wesselman, D.A.; der Deijl, E.C.; Ruessink, G. On the Intersite Variability in Inter-Annual Nearshore Sandbar Cycles. J. Mar. Sci. Eng. 2016, 4, 15. [Google Scholar] [CrossRef]
  53. Wright, L.D.; Short, A.D. Morphodynamic Variability of Surf Zones and Beaches: A Synthesis. Mar. Geol. 1984, 56, 93–118. [Google Scholar] [CrossRef]
  54. Pape, L.; Plant, N.G.; Ruessink, B.G. On Cross-Shore Migration and Equilibrium States of Nearshore Sandbars. J. Geophys. Res. Earth Surf. 2010, 115, F03008. [Google Scholar] [CrossRef]
  55. Ellenson, A.N.; Simmons, J.A.; Wilson, G.W.; Hesser, T.J.; Splinter, K.D. Beach State Recognition Using Argus Imagery and Convolutional Neural Networks. Remote Sens. 2020, 12, 3953. [Google Scholar] [CrossRef]
  56. Castelle, B.; Ruessink, B.G.; Bonneton, P.; Marieu, V.; Bruneau, N.; Price, T.D. Coupling Mechanisms in Double Sandbar Systems. Part 1: Patterns and Physical Explanation. Earth Surf. Process. Landf. 2010, 35, 476–486. [Google Scholar] [CrossRef]
  57. Vidal-Ruiz, J.A.; Ruiz de Alegría-Arzaburu, A. Variability of Sandbar Morphometrics over Three Seasonal Cycles on a Single-Barred Beach. Geomorphology 2019, 333, 61–72. [Google Scholar] [CrossRef]
  58. van Enckevort, I.M.J.; Ruessink, B.G.; Coco, G.; Suzuki, K.; Turner, I.L.; Plant, N.G.; Holman, R.A. Observations of Nearshore Crescentic Sandbars. J. Geophys. Res. Oceans 2004, 109, C06028. [Google Scholar] [CrossRef]
  59. Price, T.D.; Ruessink, B.G.; Castelle, B. Morphological Coupling in Multiple Sandbar Systems—A Review. Earth Surf. Dyn. 2014, 2, 309–321. [Google Scholar] [CrossRef]
  60. Velegrakis, A.F.; Hasiotis, T.; Papadatou, K. Coastal Climate Resilience: Review of Policies and Regulations. Deliverable 2.2—ECFAS Project (GA 101004211). 2021. Available online: www.ecfas.eu (accessed on 25 February 2025).
  61. Chalazas, T.; Bove, G.; Chatzistratis, D.; Monioudi, I.; Velegrakis, A.F. A system for the management of sandy shorelines under climate change: United States Virgin Islands (USVI). Ambio 2024, 53, 406–420. [Google Scholar] [CrossRef] [PubMed]
  62. Karditsa, A.; Niavis, S.; Paramana, T.; Monioudi, I.; Poulos, S.; Hatzaki, M. Is the insular coastal tourism of western Greece at risk due to climate induced sea level rise? Ocean. Coast. Manag. 2024, 251, 107088. [Google Scholar] [CrossRef]
Figure 1. Study area. (a) Beach topo-bathymetry of Marmari (12 November 2022) showing also the positions of the camera station and the RBR wave logger, and the camera field of view: FoV (bounded by red lines). The location of the seven representative nearshore cross-shore profiles (P1–P7) discussed in the Results is also shown, together with the location of the shallowest nearshore sandbar (black dotted line). (b,c) Location of Marmari beach, Kos, Greece. (d) Rose diagram for the recorded winds during the monitoring period winter (2022–2023).
Jmse 13 00861 g001
Figure 2. (a) Flow chart of the procedure of the collection and processing of optical data. (b) Oblique TIMEX and (c) IMMAX images of the study area. Detections of shoreline position (red line) and wave breaking location (black line) are shown in the TIMEX image, and detection of the maximum run-up excursion position (red line) is shown in the IMMAX image. In both images, the detections have been translated to image (pixel) coordinates.
Jmse 13 00861 g002
Figure 3. Results of the field survey in the beginning of the monitoring period. (a) Side scan sonar (SSS) mosaic and (b) its interpretation. (c) Topo-bathymetry along the seven profiles P1–P7 to about 250 offshore. The dashed red box encloses the shallow part with the inner bar shown in panel (d). (d) Shallow topo-bathymetry along P1–P7 (magnified) for the part enclosed in the red box on panel (c). Cross-shore distance is measured with reference to the camera location. Key: BT1, rock outcrops; BT2, Fine-medium sand sediments; BT3, Posidonia meadows.
Jmse 13 00861 g003
Figure 4. Comparison of the RTK beach topography and shoreline position surveyed in the beginning and end of the monitoring period. Positive differences (red colors) show accretion and negative differences (blue colors) show erosion/flattening of the subaerial beach. Red and black lines represent the surveyed shoreline position at the beginning and end of the monitoring period. The positions of profiles P1–P7 are shown along the black line.
Jmse 13 00861 g004
Figure 5. (a) Example of IMMAX image and the locations of the seven profiles P1–P7. (b) Range (the difference between the minimum and maximum detection) of the (b) shoreline position, (c) wave run-up excursion, and (d) breaking zone location for profiles spaced every 10 m along the shore (the representative profiles discussed (P1–P7) are highlighted). Note that no information is shown for the breaking zone offshore of the beach section x = 150–250 m, due to field of view obstructions (see Section 2.2).
Jmse 13 00861 g005
Figure 6. (a) Analysis domain with the alongshore location of the examined profiles on a TIMEX image. Time series of the (b) shoreline position; (c) wave run-up excursion; (d) breaking zone position for the seven longshore locations compared to the temporal benchmark detections; (e) significant wave height (Hs) and mean sea level (SL); and (f) peak wave period (Tp). Wave and sea level information represents conditions at a 7.9 m water depth. Positive numbers stand for offshore and negative for onshore migration compared to the temporal benchmark. Grey areas represent the duration of energetic wind events (wind speed > 8.3 m/s) from the northern sector (45–260 °N), with the average wind speed for each individual event marked.
Jmse 13 00861 g006
Figure 7. Examples of the breaking zone detection in four energetic events. Detections of bursts on (a) 21/11/2022 (Hs = 0.3 m, Ts = 5.1 s) and 26/11/2022 (Hs = 0.22 m, Ts = 5 s), (b) 25/12/2022 (Hs = 0.23 m, Ts = 4.2 s) and 26/12/2022 (Hs = 0.2 m, Ts = 4.6 s), (c) 17/03/2023 (Hs = 0.23 m, Ts = 5.6 s) 20/03/2023 (Hs = 0.23 m, Ts = 5.1 s), (d) 28/03/2023 (Hs = 0.5 m, Ts = 5.5 s) and 29/03/2023 (Hs = 0.51 m, Ts = 5.8 s). Blue and red lines represent the breaking zone position at the event’s beginning and end, while the cyan and purple lines show the shoreline position. Background images correspond to the TIMEX of the final day of the event. Panels (a,d) represent the two most extreme events during which Hs reached 0.8 and 1.2 m, respectively, whereas the evolution of the crescentic breaking zones is shown in panels (b,c). Key: BL, breaking zone location; SL, shoreline location.
Jmse 13 00861 g007
Figure 8. Differences in the locations of the (a) shoreline; (b) run-up excursion; and (c) wave breaking between consecutive days for profile P4. The significant wave height is shown in blue. Orange bars denote onshore movement (shoreline retreat), whereas light blue bars denote offshore movement (shoreline accretion, offshore migration of the wave breaking) in relation to the detections of the preceding day. Numbers on top of bars indicate the rounded difference (in m) between two consecutive days. (d) Mean wave period.
Jmse 13 00861 g008
Figure 9. Distance between the wave breaking location and the run-up excursion vs. (a) the significant wave height recorded during the bursts, and (b) the H0/L0 ratio for profiles P2–P7. Red line indicates the best fit for both datasets.
Jmse 13 00861 g009
Figure 10. Energy spectra of the run-up height for two 10 min bursts and corresponding wave energy spectra at a 7.9 m water depth. (a) Energy spectra of the run-up height time series, 13 November 2022, (b) Energy spectra of the sea level time series 13 November 2022, (c) Energy spectra of the run-up height time series, 23 November 2022, (d) Energy spectra of the sea level time series 13 November 2022. Black and red lines on (a,c) stand for P4 and P6 profiles.
Jmse 13 00861 g010
Figure 11. An example of the XBeach output for the nearshore waters (<3.4 m water depth) showing the wave envelope, the sea level (including wave set-up and run-up), and the morphological evolution of the profile P4 (H0 = 0.9 m, T0 = 8.9 s, output for the 1402th second of the 3 h simulation).
Jmse 13 00861 g011
Disclaimer/Publisher’s Note: The statements, opinions and data contained in all publications are solely those of the individual author(s) and contributor(s) and not of MDPI and/or the editor(s). MDPI and/or the editor(s) disclaim responsibility for any injury to people or property resulting from any ideas, methods, instructions or products referred to in the content.

