Article

Experimental Study of the Hydrodynamic Forces of Pontoon Raft Aquaculture Facilities Around a Wind Farm Monopile Under Wave Conditions

1
Department of Marine Fisheries, Fisheries College, Ocean University of China, Qingdao 266003, China
2
Institute of Industrial Science, The University of Tokyo, 5-1-5 Kashiwanoha, Chiba 277-8574, Japan
3
Faculty of Engineering, Yokohama National University, Yokohama 240-8501, Japan
*
Author to whom correspondence should be addressed.
J. Mar. Sci. Eng. 2025, 13(4), 809; https://doi.org/10.3390/jmse13040809
Submission received: 23 March 2025 / Revised: 12 April 2025 / Accepted: 16 April 2025 / Published: 18 April 2025

Abstract

:
The integrated development of offshore wind power and marine aquaculture represents a promising approach to the sustainable utilization of ocean resources. The present study investigated the hydrodynamic response of an innovative combination of a wind farm monopile and pontoon raft aquaculture facilities (PRAFs). Physical water tank experiments were conducted on PRAFs deployed around a wind farm monopile using the following configurations: single- and three-row arrangements of PRAFs with and without a monopile. The interaction between the aquaculture structure and the wind farm monopile was examined, with a particular focus on the mooring line tensions and bridle line tensions under different wave conditions. Utilizing the wind farm monopile foundation as an anchor, the mooring line tension was reduced significantly by 16–66% in the single-row PRAF. The multi-row PRAF arrangement experienced lower mooring line tension in comparison with the single-row PRAF arrangement, with the highest reduction of 73%. However, for the bridle line tension, the upstream component was enhanced, while the downstream one was weakened with a monopile, and they both decreased in the multi-row arrangement. Finally, we developed numerical models based on flume tank tests that examined the interactions between the monopile and PRAFs, including configurations of a single monopile, along with single- and three-row arrangements of PRAFs. The numerical simulation results confirmed that the monopile had a dampening effect on the wave propagation of 5% to 20%, and the impact of the pontoons on the monopile was negligible, implying that the integration of aquaculture facilities around wind farm infrastructure may not significantly alter the hydrodynamic loads experienced by the monopile.

1. Introduction

Mussels represent an affordable and environmentally sustainable source of protein, with minimal greenhouse gas emissions [1]. It is estimated that approximately 94% of global mussel production is currently derived from aquaculture, with raft culture representing one of the most efficient techniques, enabling consistent year-round production [2]. However, the expansion of raft culture is constrained by spatial limitations [3]. Concurrently, the accelerated growth of renewable energy sources has established offshore wind farms as a crucial element in the global drive toward a clean energy future. However, as offshore wind installations expand, they increasingly occupy limited coastal waters, which may result in potential conflicts with existing aquaculture activities. To address these spatial challenges, integrating wind energy infrastructure with raft aquaculture facilities represents a promising solution [4]. By deploying aquaculture structures within the confines of a wind farm, the utilization of ocean space can be optimized. Meanwhile, turbine foundations can serve as dual-purpose anchoring points for aquaculture, potentially functioning as artificial reefs that support marine biodiversity [5]. This integrated approach represents a compelling opportunity for economic synergy. Despite the existence of numerous conceptual designs for integrated systems of this nature, only a small number have progressed to the stage of commercial operation. The majority of countries remain at the pilot development stage [6,7,8].
The combination of offshore wind farms with aquaculture systems has the potential to offer several benefits, including the optimization of marine space usage and advancement of sustainable development. Specifically, integrating mussel raft culture with wind farms could facilitate efficient, year-round production by leveraging shared infrastructure. However, a notable gap exists in the literature regarding the effective layouts and structural interactions between mussel raft systems and offshore wind turbines. Despite the proposal by Buck et al. (2004) that combines bivalve raft culture with offshore wind turbines [7], detailed research on the structural interactions between wind turbine foundations and aquaculture facilities remains scarce. The potential for wind turbine monopiles to be effectively utilized as anchor points for mussel raft structures has yet to be investigated, and the optimal structural arrangements for aquaculture within offshore wind farms have not been thoroughly explored.
The majority of studies have concentrated on the integration of offshore wind farms with aquaculture cages rather than raft systems. Since cage aquaculture requires extensive marine areas, it is typically combined with floating wind turbines. Floating platforms for floating wind turbines can be categorized into the following three types [9]: (1) spar buoy platform, (2) tension leg platform, and (3) semi-submersible platform. A semi-submersible platform is the most suitable type of floating platforms to be integrated with aquaculture structures due to its high stability and ample space. For example, Zheng et al. (2018) evaluated the dynamic response of an innovative floating offshore wind turbine integrated with a steel fish-farming cage (FOWT-SFFC) under diverse environmental conditions, confirming its exceptionally dynamic performance [10]. Similarly, Zhao et al. (2023) employed OpenFOAM software to simulate the structural load interactions between the combined wind turbine and fish cage systems, with a particular focus on the effects of the wave height and water depth on the load amplitude [11]. Further investigation of the dynamic behavior of wind–cage structures was conducted by Zhang et al. (2022) and Cao et al. (2022), who observed the damping effects of cage nets on platform dynamics [12,13]. Yi et al. (2024) demonstrated that the aquaculture cage serves to reduce the oscillation amplitude and acts as a damper in an integrated offshore wind–wave–aquaculture (WWA) system [14]. Overall, the hydrodynamic interactions and coupling effects between wind turbines and aquaculture cage systems under wind and wave conditions have been adequately studied [15,16,17]. These findings underscore the focus on fish cage systems and highlight the lack of equivalent research on raft culture within offshore wind farms.
In the past, studies tended to focus on the hydrodynamic characteristics of wind turbines and raft aquaculture structures as separate entities. In recent years, an increasing number of studies underscore the value of numerical simulations based on computational fluid dynamics (CFD) for evaluating the performance of floating wind turbines and aquaculture structures. CFD-based numerical models have been widely applied in the study of wave–structure interactions. For example, by solving the Navier–Stokes equations (i.e., viscous flow solver), it is possible to effectively investigate the gap resonance problems between two boxes [18,19,20], a stationary box and a vertical wall [21], and two side-by-side barges [22]. By solving the Reynolds-averaged Navier–Stokes (RANS) equations coupled with advanced turbulence models, CFD can account for highly nonlinear effects, such as wave breaking, vortex shedding, and transient loads, which become particularly significant under extreme environmental conditions (e.g., large wave heights and strong currents). For example, Zhong et al. (2023) analyzed the dynamics of a semi-submersible platform designed for a 15 MW wind turbine in the context of freak wave conditions, with a particular focus on the platform’s motion responses and mooring line tension [23]. Tang et al. (2021) employed CFD to examine the nonlinear wave load impacts on a 10 MW scale monopile offshore wind turbine by investigating the variations in wave pressure and horizontal forces under diverse sea conditions [24]. Investigations into raft aquaculture structures have concentrated on the hydrodynamic behavior of isolated structures. In a recent study, Wang et al. (2023) employed numerical simulations to investigate the hydrodynamic characteristics of an attenuator-type wave energy converter with varying raft shapes, with a particular focus on parameters such as the wave period and structural design [25]. Wang et al. (2022) proposed that the scale and spatial layout of the floating raft aquaculture structures should be considered when assessing the impact of aquaculture activities on the hydrodynamic environment [26]. The aforementioned studies provide valuable insights into the hydrodynamic characteristics of monopile foundations or raft facilities, addressing various factors such as the wave loads, structural integration, and dynamic responses under different environmental conditions. The wind monopiles in offshore wind farms significantly affect the forces on raft aquaculture structures by altering the flow field, wave field, and their coupling with environmental factors. This impact is multifaceted, including the drag force, wave force, dynamic loads, resonance effects, and foundation stability. To accurately assess the force conditions of raft aquaculture facilities, it is necessary to conduct an in-depth study on the coupling effects between monopiles, waves, and currents. However, current research on the hydrodynamic characteristics of raft aquaculture facilities within offshore wind farms is notably insufficient, particularly in revealing the interaction mechanisms of the current–wave structure in complex wind farm environments. This highlights the necessity for further systematic research in this field.
Mooring line tension directly affects the stability of offshore structures in the marine environment. The potential consequences of high mooring line tension are multifaceted. Increased tension may lead to a higher risk of mooring line failure and shorten the service life of the mooring system. Additionally, the structural integrity of the mooring system itself may be compromised, impacting the overall stability and safety of the structure. Tomasicchio et al. (2018) conducted experimental research on a spar-type floating offshore wind turbine under different wave–wind conditions, and the results indicate that waves have a more significant impact on structural dynamics compared with wind [27]. Lauria et al. (2024) proposed that the peak frequency of mooring line tension is primarily influenced by the wave frequency [28]. Therefore, fully understanding and accurately assessing the impact of wave action on the mooring line tension of aquaculture facilities within offshore wind farms is crucial for ensuring their long-term structural reliability and safety.
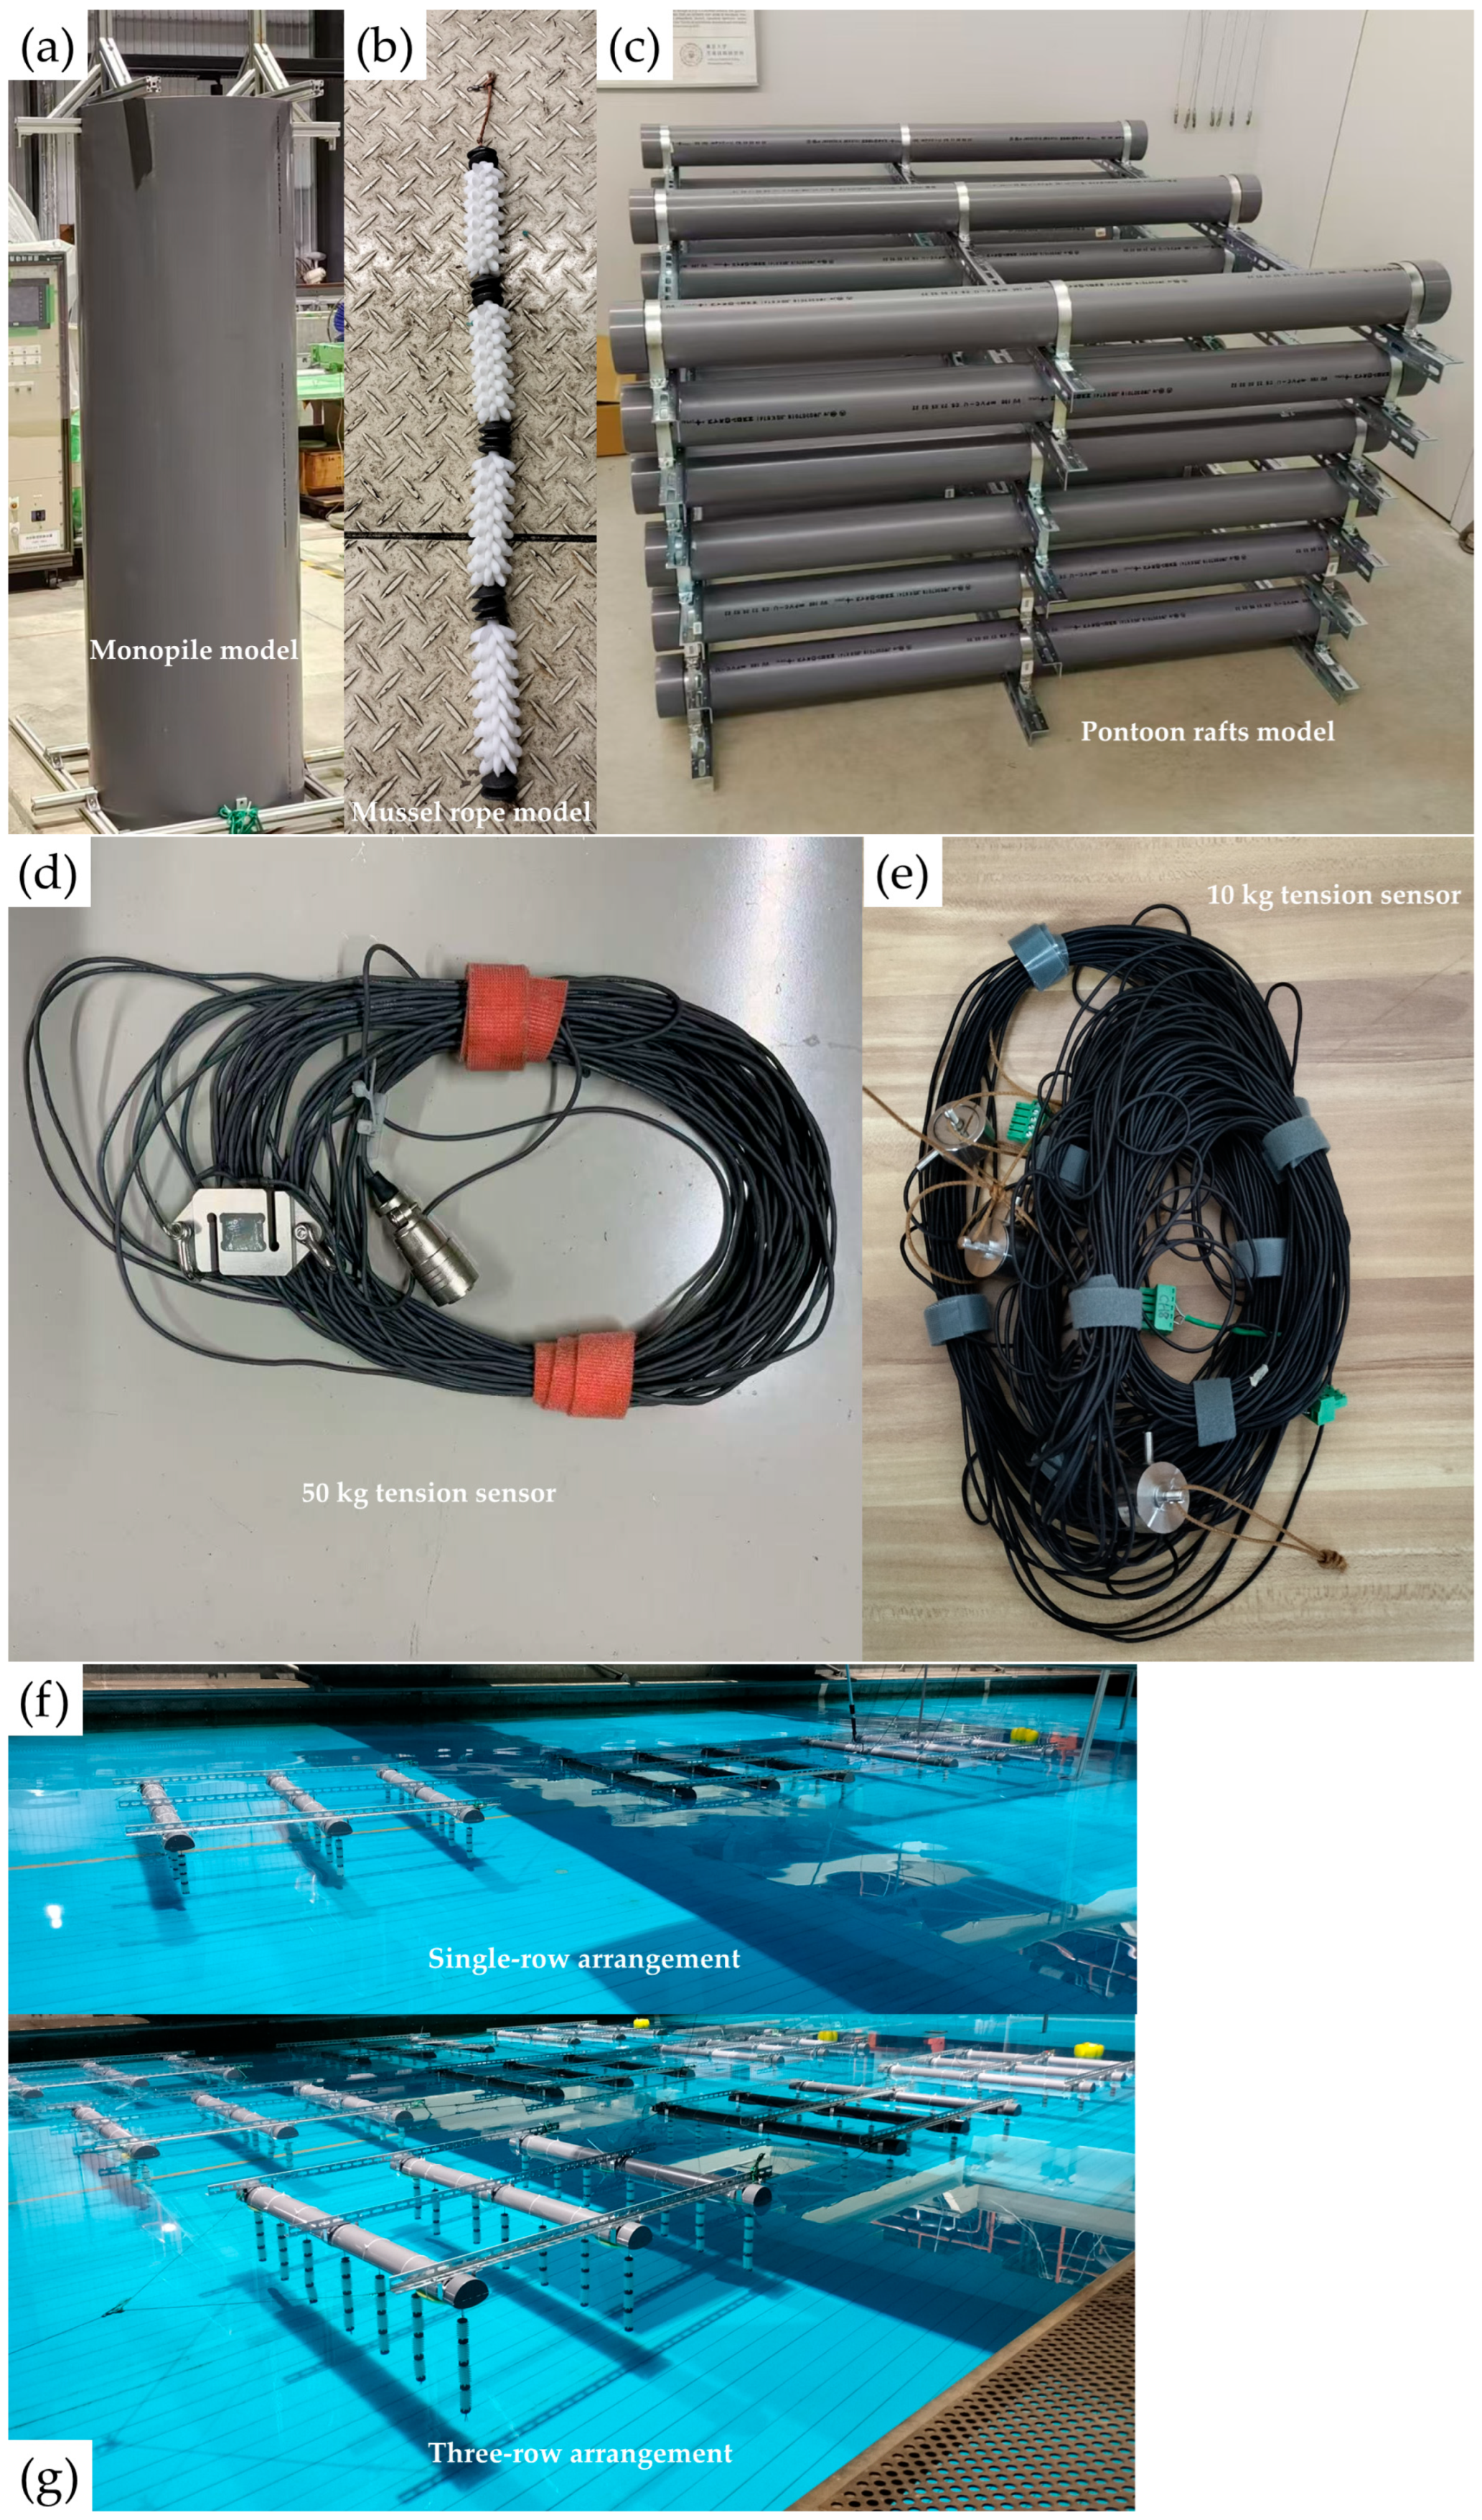
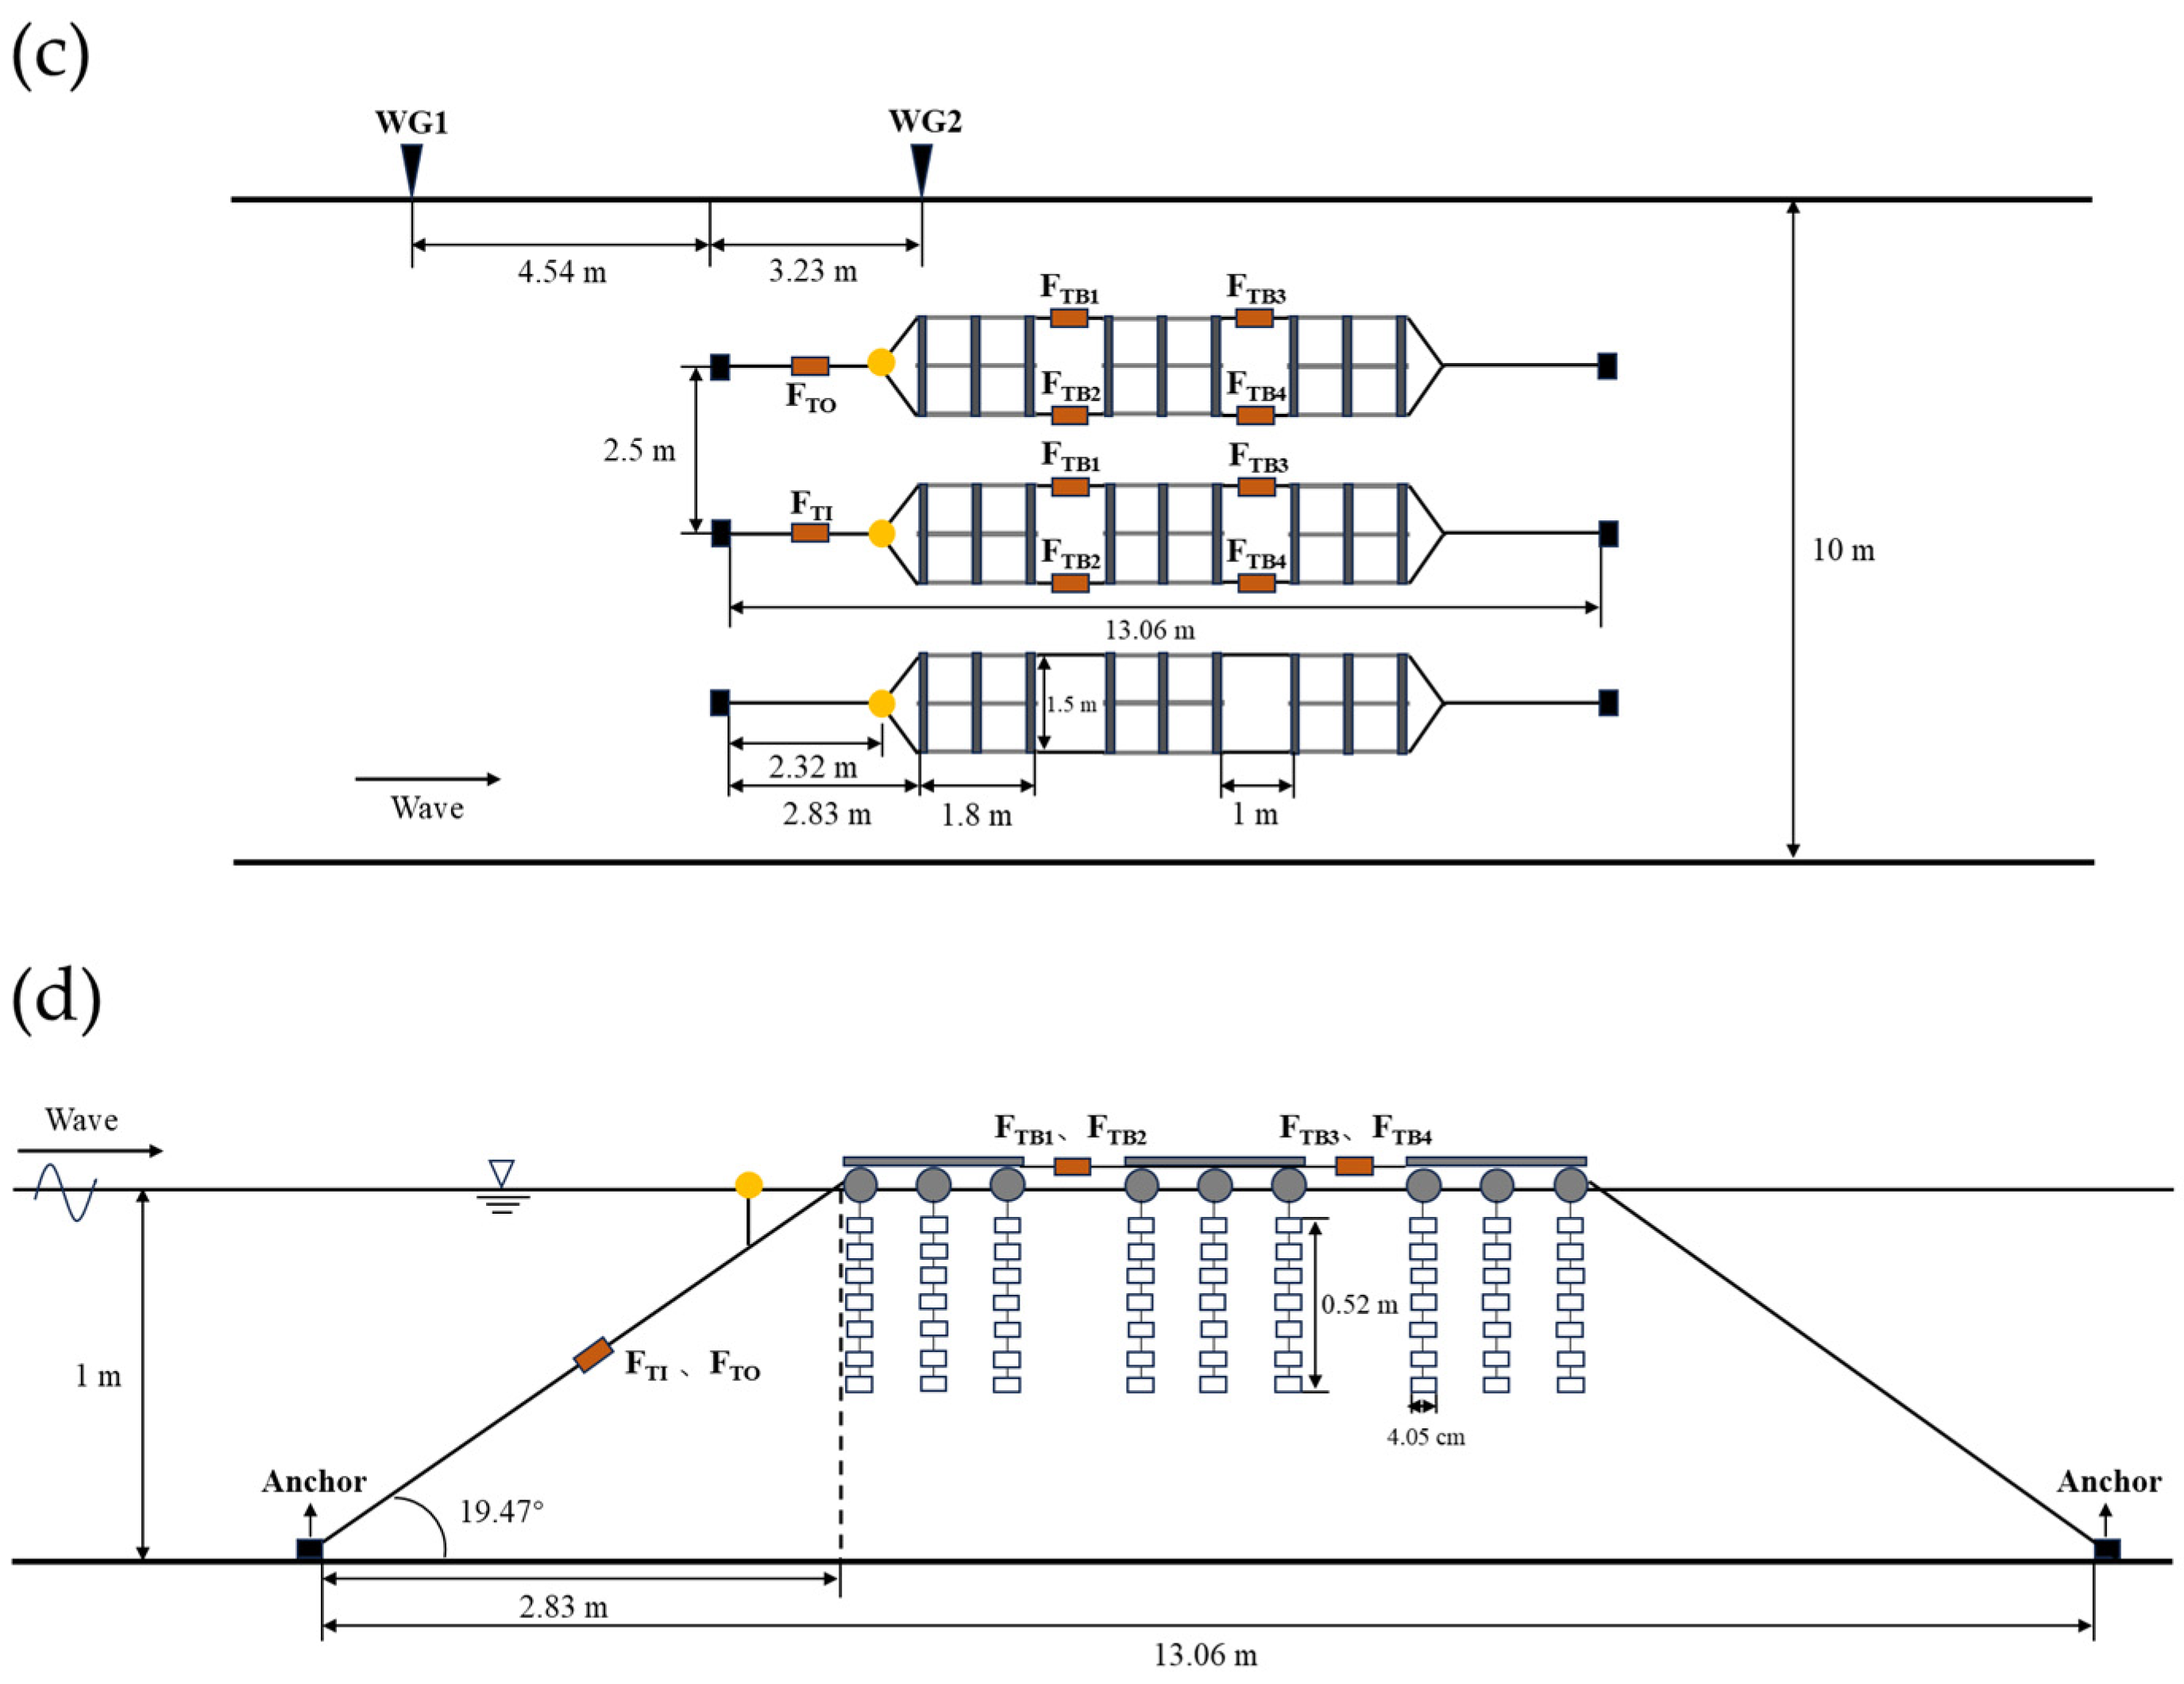
At present, the applied research on the combination of a wind monopile and aquaculture structures is still in the preliminary stage, although some studies have been conducted on the integration of floating wind turbines with fish cages. There is a lack of practical technical guidance on how to arrange raft facilities around the wind monopile. Therefore, this study investigated the hydrodynamic forces of pontoon raft aquaculture facilities (PRAFs) that used the wind farm monopile foundation as an anchor. Our previous paper (Ai et al., 2024) considered the mooring line tension [
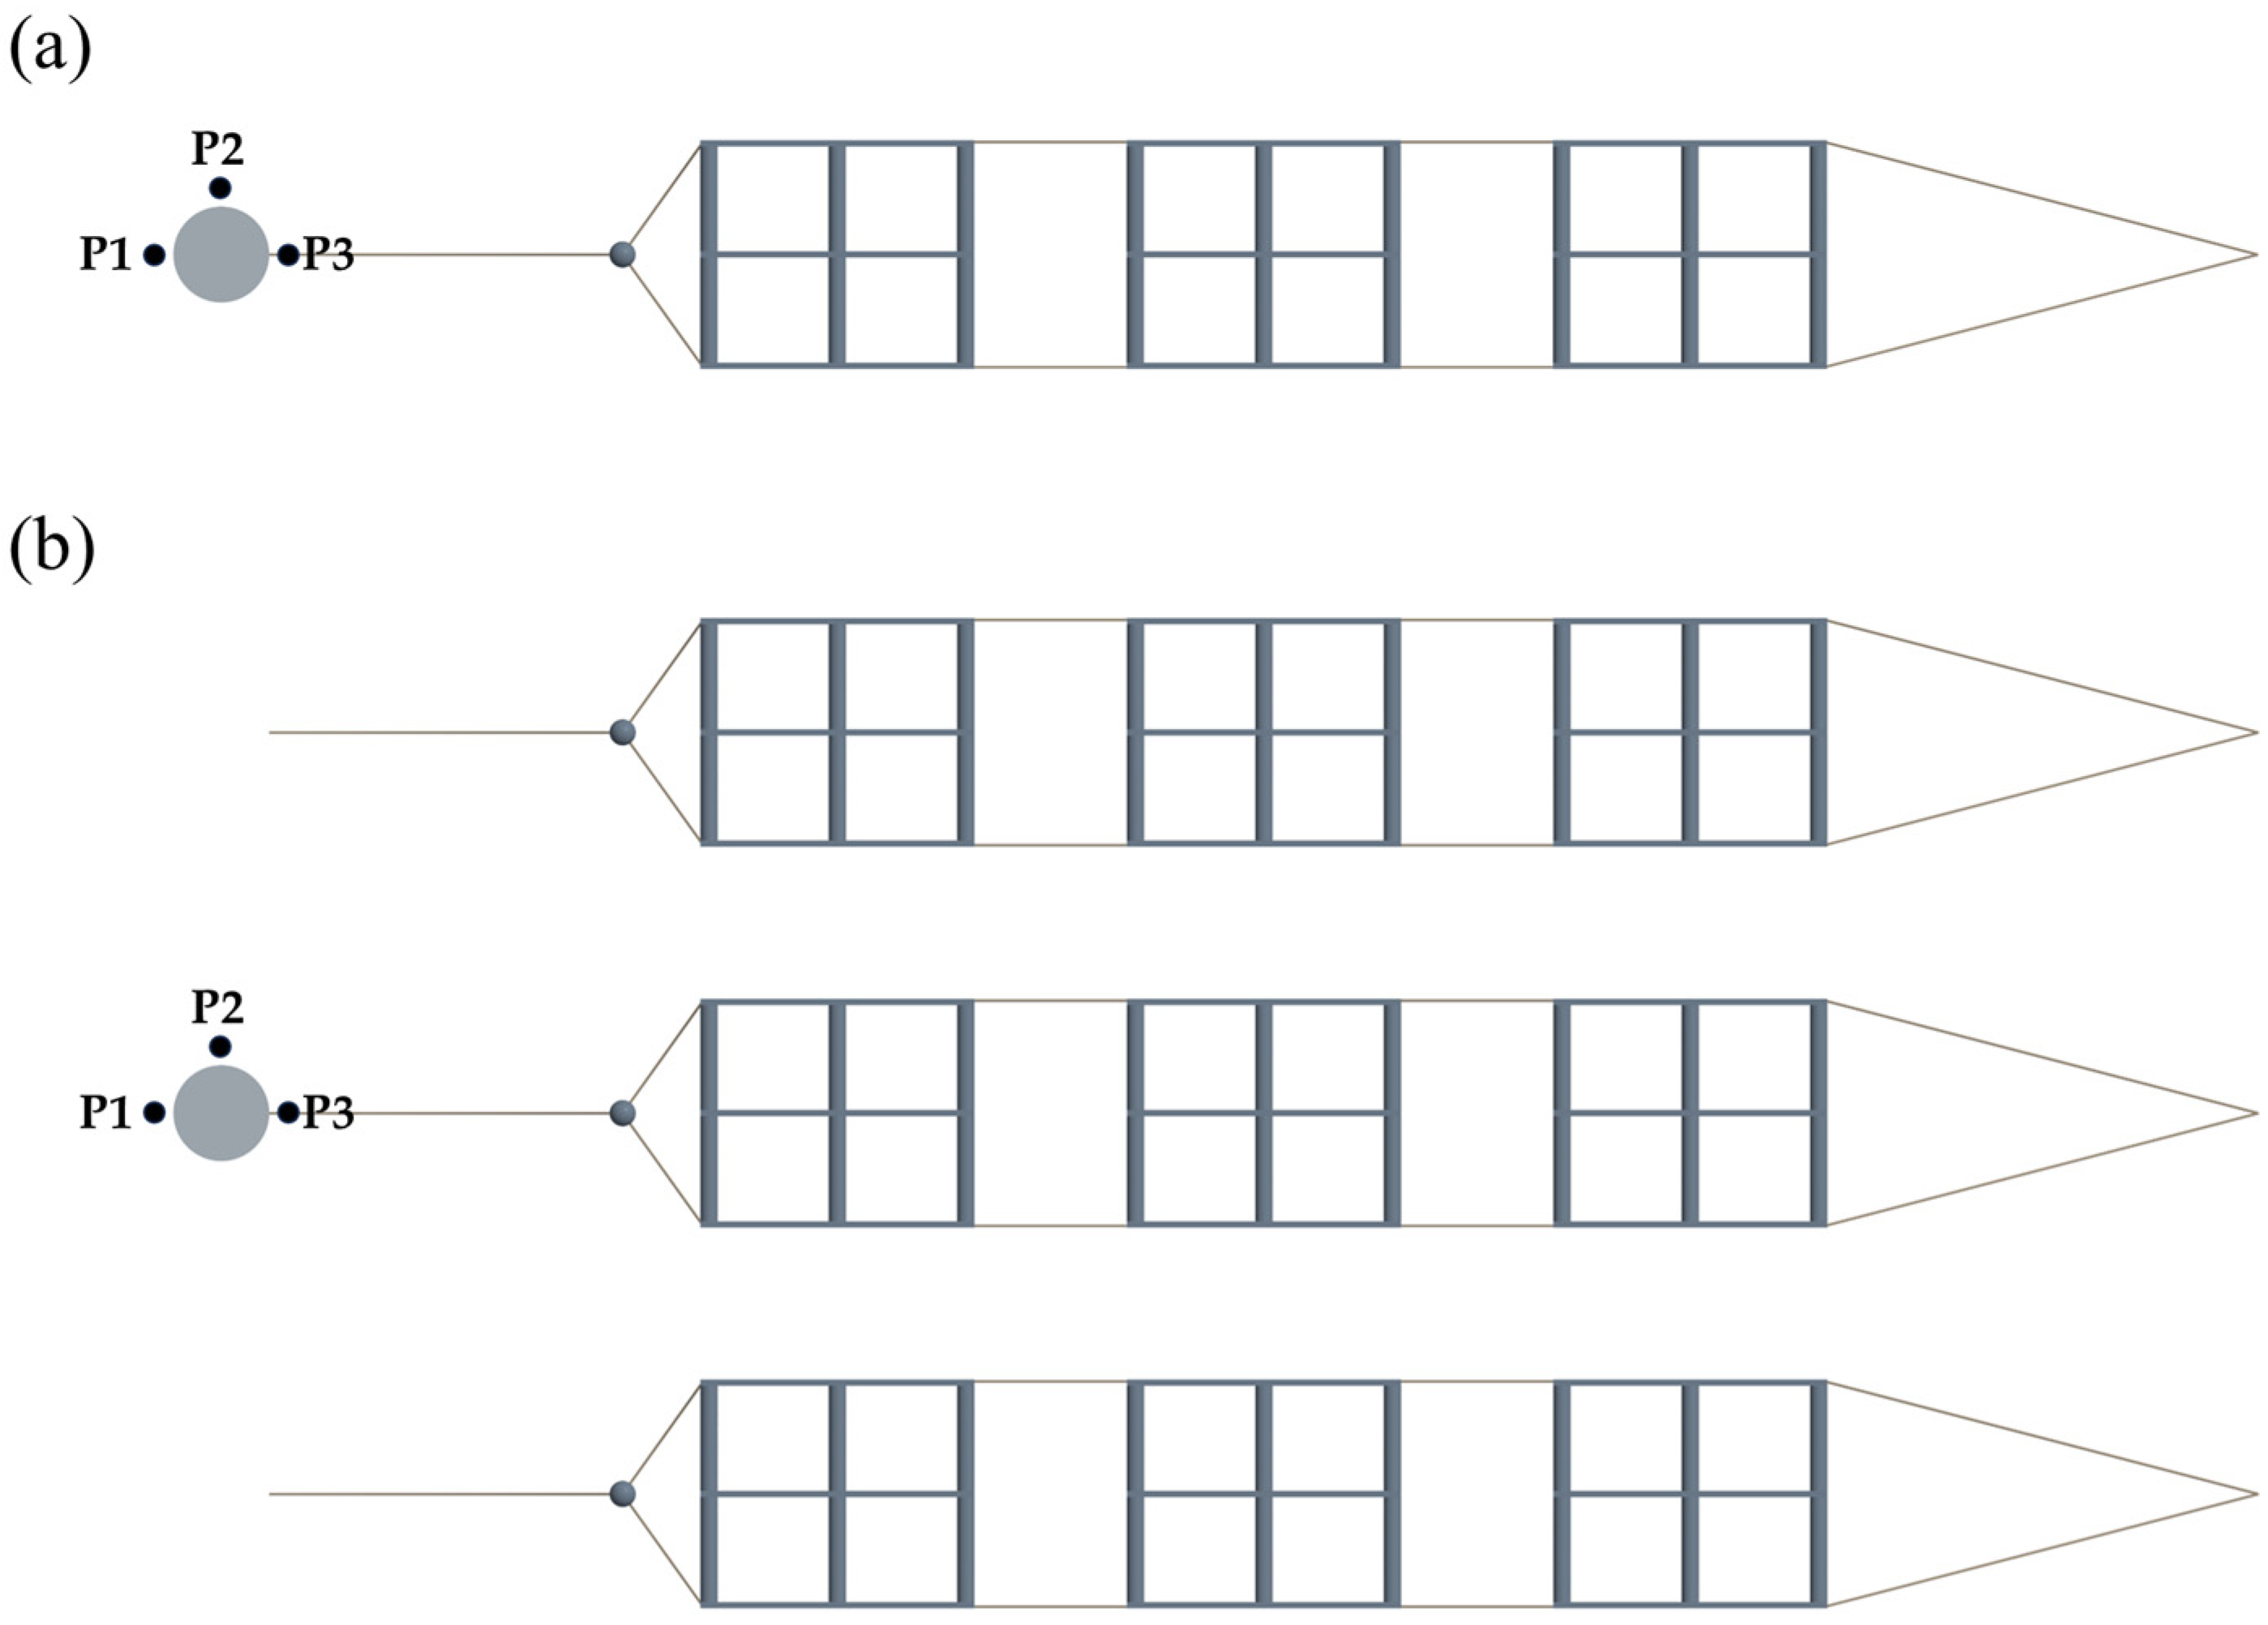
29]. In this study, we extend our previous work by incorporating both the mooring line tension and bridle line tension to achieve a more comprehensive understanding of the hydrodynamic loads acting on the PRAFs. This dual focus represents a novel perspective, as prior research has rarely examined the internal connection forces (bridle lines) alongside mooring forces. Moreover, the hydrodynamic performance of the single-row PRAF arrangement and multi-row PRAF arrangement were compared. The effects of the wind monopile on wave propagation were assessed through numerical simulations. By integrating water tank experiments and numerical simulations, this work clarified wave–structure interaction mechanisms in the presence of a monopile—an area that has not been extensively addressed in the literature. Ultimately, this study advanced the understanding of co-locating wind and aquaculture structures, laying the groundwork for safer and more efficient offshore operations. The findings can provide valuable insights into the design and optimization of integrated wind–aquaculture areas.

2. Physical Experiment Methods

2.1. Study Area

The wind farm studied in this paper was located in the southern area of Laizhou Bay of Changyi City, Shandong Province, China (Figure 1), which was 15.5 km from the coastline. Local water depths of 6.7 m to 9.2 m are suitable for the installation of wind power. Waves in this area have significant wave heights varying from 0.5 m to 2.0 m and average periods varying from 2.3 s to 7.1 s [29]. Moreover, the wind farm was oriented toward the integration of offshore aquaculture, with the aspiration of establishing a model for the development of multifunctional areas. The foresight of the installation of mariculture facilities within an offshore wind farm is depicted in Figure 2.

2.2. Wave Tank

Experimental studies were carried out at the Ocean Engineering Basin, Institute of Industrial Science, University of Tokyo. The wave tank was 50 m in length, 10 m in width and 5 m in depth, as shown in Figure 3. The experimental water depth can be adjusted using a platform. The facility is equipped with a piston-type wavemaker, which can generate regular incident waves with periods of 0.5–5.0 s and wave heights of 0.02–0.30 m. An absorbing metallic ramp opposite to the wavemaker can dissipate the incident waves and avoid the reflected waves.

2.3. Monopile and PRAF Model

A Froude principle scale of 1:8 was adopted in this experiment according to the dimensions of the water tank and PRAFs. As shown in Figure 4a, the monopile was 2 m in height and 0.63 m in diameter, and was composed of Polyvinyl Chloride (PVC) to ensure stability in the waves. The PRAF is referenced from our previous studies in Wang et al. (2015) and Ai et al. (2024) [29,30]. A PRAF is a structure composed of three rafts (Figure 4f) combined together, with adjacent rafts connected by two bridle lines. Each raft system primarily consists of three PVC pontoons and three steel angles (Figure 4c) fixedly connected. Mussel rope models (Figure 4b) are suspended beneath the pontoons. The depth of the PRAF immersed in the water was 3.8 cm (1/3 times the height of the PRAF), as shown in Figure 4f,g. The 3D-printed mussel ropes were weighted to equal the mass of the actual mussel ropes in the water. More detailed parameters of the PRAF model are provided in Table 1.

2.4. Experimental Setup

As illustrated in Figure 5, this is a configuration of the single-row PRAF with a monopile in the experiments [29]. The monopile was secured to the middle line of the bottom of the water tank at 16.63 m from the upstream wavemaker to act as an anchoring element for the upstream mooring line of the single-row PRAF. The PRAF was installed directly behind the monopile with a mooring line length-to-water-depth ratio of 3 (water depth was 1 m).
In this study, three configurations of PRAFs were designed and analyzed [29]:
(1)
Single-row PRAF with a monopile: The water depth was 1 m. The PRAF was located 2.83 m directly behind the monopile and was aligned along the middle line of the wave tank, with the monopile serving as an anchor for the upstream mooring line of the PRAF (Figure 6a,b). The purpose of this arrangement was to study the effect of the monopile on the mooring line tension and bridle line tension of the PRAF under different wave conditions.
(2)
Single-row PRAF without a monopile: Similar to configuration (1), but an iron block replaced the monopile as the anchor. The tests of this arrangement were designed as control experiments.
(3)
Three-row PRAFs without a monopile: Three PRAFs were installed in parallel with each other with a spacing of 2.5 m (the inner facility was arranged along the middle line of the wave tank), and their anchors were all iron blocks (Figure 6c,d). This experimental setup aimed to compare the hydrodynamic forces of three-row and single-row PRAF configurations.
Representative layouts in the experiments are shown in Figure 6. A 50 kg tension sensor (TLP-10KS, full capacity of ± 50 kgf, Tokyo Measuring Instruments Co., Ltd., Tokyo, Japan) (Figure 4d) was affixed to the middle of the upstream mooring line to measure the mooring line tension under wave conditions. Four 10 kg tension sensors (DYMH-107, full capacity of ± 10 kgf, DAYSENSOR Engineering Co., Ltd., Bengbu, China) (Figure 4e) were affixed to the middle of the bridle lines to obtain the internal forces between the rafts. Two wave gauges (CH-601, Linearity error ±0.5% of full scale, KENEK Co., Ltd., Tokyo, Japan) were placed. WG1 was positioned 4.54 m upstream of the monopile to collect incident wave data and WG2 was positioned 3.23 m downstream of the monopile to monitor transmitted wave data [29]. In summary, all the instruments were equipped with corresponding signal amplifiers to stabilize and enhance the voltage signals, and the data were collected by the same data acquisition unit. The sampling time was set to 70 s, with a sampling frequency of 1000 Hz.
Based on the Froude similarity, the wave conditions for the experiments were designed accordingly. Tests were conducted at a water depth of 1 m, where the wave heights ranged from 0.063 to 0.188 m and the periods from 1.0 to 1.4 s. The experimental wave conditions are listed in Table 2. When scaled to actual sea conditions at a depth of 8 m, these ranges corresponded to wave heights of 0.504 to 1.504 m and wave periods of 2.8 to 4.0 s, which closely matched the marine environment at the Changyi City wind farm [29].

3. Numerical Simulation Methods

This study employed numerical simulations to investigate how monopile foundations influence wave transmission, which offered valuable insights for optimizing the layout of raft aquaculture facilities. STAR-CCM+ (19.02.012-R8), which is commercial computational fluid dynamics software, is well-suited for multidisciplinary problems involving fluid and solid continuum mechanics. It serves as a powerful tool for analyzing complex fluid dynamics. In this study, the Reynolds-averaged Navier–Stokes (RANS) equations were solved using the finite volume method based on the SST k-ω turbulence model in STAR-CCM+ to determine the wave attenuation after interacting with a wind turbine monopile foundation [31]. The free surface was modeled using the Volume of Fluid (VOF) method.

3.1. Governing Equation

Fluid motion must adhere to three fundamental laws: the law of conservation of mass, the law of conservation of momentum, and the law of conservation of energy. For incompressible fluid flow, the energy conservation equation can be neglected due to negligible heat transfer. In this numerical simulation, wave motion is governed by the continuity equation and the momentum equation, Equation (1) is expressed through the mass balance of the control volume, and Equation (2) shows that the time rate of change of linear momentum is equal to the resultant force of the continuous forces, as follows:
ρ t + · ρ v ¯ = 0
ρ v ¯ t + · ρ v ¯ v ¯ = · p ¯ m o d I + · T ¯ + T R A N S + f b
where ρ is the fluid density; v ¯ is the mean velocity; p ¯ m o d = p ¯ + 2 3 ρ k is the corrected mean pressure, where p ¯ is the mean pressure and k is the turbulent kinetic energy; I is the unit tensor; T ¯ is the mean viscous stress tensor; f b is the combined volume force (e.g., gravity and centrifugal force); and T R A N S is the stress tensor extra term, which can be obtained from Equation (3):
T R A N S = μ t v ¯ + v ¯ T 2 3 μ t · v ¯ I
where μ t is the turbulent eddy viscosity, obtained through the solution of the turbulence model. In numerical simulations, turbulence is a complex phenomenon typically modeled using various turbulence models. To accurately simulate this phenomenon, this study employed the SST k-ω turbulence model [32]. Compared with the standard k-ω model, the SST k-ω model effectively combines the k-ε model in the far field with the k-ω model near the wall by introducing a blending function. This allows the SST k-ω model to retain the high accuracy of the standard k-ω model near the wall while addressing its sensitivity to inlet boundary condition settings.

3.2. Free Surface Tracking

This study employed the VOF method to determine the interface between the air and water. A second-order upwind scheme was utilized for the discretization of the volume-fraction transport equation and momentum equations, which helped to minimize the numerical diffusion across the interface. To maintain a sharp interface, the High-Resolution Interface Capturing (HRIC) method of STAR-CCM+ was employed to ensure that the free surface profile remained well-defined, even under nonlinear wave conditions. The VOF modeling approach assumes that the grid resolution is sufficient to meet the solution requirements, and tracks the motion of the fluid interface by defining a function of volume fraction to characterize the volume share of a phase of fluid in the grid cell and solving the transport equation for the volume fraction [33]. This phase volume fraction α i is defined as shown in Equation (4):
α i = V i V
where V i represents the volume of phase i in the grid cell; V is the grid cell volume.
The sum of the volume fractions of all Euler phases within a grid is 1. Based on the value of the Euler phase volume fraction α i , the distribution of Euler phases in each grid can be determined:
(1)
α i = 0 , indicating that there is no Euler phase   i in the grid cell;
(2)
α i = 1 , indicating that the grid cell is filled with Euler phase i;
(3)
0 < α i < 1 , indicating that there is an interface within the grid cell.
In grid cells containing interfaces, the material properties depend on the properties of each component and their respective proportions. The fluid within the cell is treated as a mixture. The density and dynamic viscosity of the mixture are as follows:
ρ = i ρ i α i
μ = i μ i α i
where ρ i is the density; μ i is the dynamic viscosity. The distribution of phase i is obtained from the phase mass conservation equation, as shown in Equation (7):
t V α i d V + A α i v · d a = V S α i α i ρ i D ρ i D t d V V 1 ρ i · α i ρ i v d , i d V
where v is the average mixing velocity; a is the surface area vector; S α i is the customized source term; D ρ i D t is the Lagrange derivative of the phase density ρ i ; and v d , i is the diffusion velocity. By solving Equation (7), the volume fraction of each phase is obtained, thereby identifying the grid cells containing interfaces. These interfaces are connected to form the free surface. Additionally, the HRIC scheme is employed in the simulation to enhance the accuracy of the free surface prediction. When two phases are present, the volume fraction transport is solved for the first phase only, and the volume fraction of the second phase is then adjusted in each grid cell so that the sum of the volume fractions of the two phases is 1.

3.3. Boundary Conditions

The wave flume utilized in the physical experiment was similarly employed in the numerical simulations, with appropriate simplifications to reduce the computational demand. Figure 7 presents the established numerical wave flume, which has dimensions of 22.6 m in length, 10 m in width, and 1.7 m in height. A wind turbine monopile foundation, with a diameter of 0.63 m and a height of 1.4 m, was 4.6 m from the wave inlet. The water depth in the flume was set at 1 m. Fifth-order waves were generated at the flume inlet using Stokes’ fifth-order wave theory [34], and the inlet boundary conditions were specified as a velocity inlet.
To further optimize the computational efficiency, a symmetry plane was defined along the centerline of the flume. While the primary wave inlet was at one end of the flume, the outlet and opposite side were also set as velocity inlets with wave-attenuation zones to reduce any potential wave reflection returning into the domain, as confirmed by Zhang et al. [35]. Practically, this approach enabled the outgoing waves to exit the numerical flume without spuriously reflecting and ensured the stability of the air–water interface during the simulations. As a result, the air phase was not assigned a separate inlet velocity since it mainly followed the free-surface motion generated by the imposed wave field. We used a wave-forcing method based on the Euler Overlay Method (EOM) proposed by Kim et al. [36] to reduce the wave reflection from the boundary. According to Kim et al.’s method, the discrete Navier–Stokes equations can be forced to converge to a theoretical solution in the setting region, thus preventing wave reflection from the far-field by using a smaller computational domain. The wave-forcing zones were activated at both the inlet and outlet, extending the wave-absorbing region by 1.5 times the wavelength (Figure 7). Moreover, a source term, as expressed in Equation (8), was introduced into the momentum equation within the wave-absorbing region to simulate wave forces [36]:
S ϕ * = γ ρ ϕ ϕ E
where γ is the force coefficient, ϕ is the solution to the transport equation, and ϕ E is the value approximated by the tension solution. The solution of the Navier–Stokes equations was made to converge to the set numerical solution within the specified wave dissipation region.

3.4. Grid Settings

Mesh sensitivity analysis is an indispensable part of numerical simulation, which not only verifies the accuracy of the simulation results but also optimizes the computational resources and reduces error [37,38]. The mesh sensitivity analysis is provided in Appendix B. During the grid-setting process, the cut volume mesh was selected as the mesh model. The refined region was created within one wave height above and below the free surface. To ensure the mesh was sufficiently fine to capture wave variations, based on the mesh sensitivity analysis results (Appendix B), 24 grids were divided along the wave height direction, and 100 grids were divided along the wavelength direction. The base size of the background mesh was set to 0.8 times the wave height, and the mesh growth rate was set to be gradual to ensure smooth transitions between the grids. The time step was set to 0.002 s, and the Courant number was maintained below 0.3 to avoid phase differences. Additionally, an overlapping mesh zone was established around the monopile model, with the background mesh size in this zone set to 0.01 m to further refine the computational domain surrounding the monopile model. A prism mesh was applied to the model walls to accurately resolve the near-wall fluid behavior, which is crucial for capturing fluid separation characteristics. The actual grid division is illustrated in Figure 8.

3.5. Wave Height Monitoring-Points Setup

The validation of the numerical flume is provided in Appendix A. This section investigated the wave propagation characteristics in the wake region behind the monopile foundation subjected to regular waves. Figure 9 shows four monitoring points established in the numerical flume to calculate the wave heights at specific locations. R1 was located 4.6 m in front of the wind turbine monopile foundation to verify the incident wave conditions, while the remaining points (R2, R3, and R4) were distributed 2.8 m behind the monopile, located slightly ahead of the PRAFs in the experiments. The wave height values at the representative points (R2, R3, and R4) were used to evaluate the effect of the wind monopile foundation on the surrounding wave field. The wave height at R1 was defined as H i , and the average of the wave heights at points (R2, R3, and R4) was defined as H t .
Detailed numerical simulations were conducted for all the experimental scenarios to examine its influence on the wave propagation. The numerical results provide insights into why the presence of a wind turbine monopile foundation reduced the mooring line tension of the raft aquaculture facility. This reduction in mooring line tension can be attributed to the attenuation and redistribution of the wave energy as the waves interacted with the monopile, thereby altering the hydrodynamic loads acting on the aquaculture system.
To further investigate the impact of the PRAF on the monopile, as well as the changes in the surrounding wave fields, we established three wave height monitoring points (P1, P2, and P3) positioned 10 cm from the monopile foundations. Numerical simulations were conducted under three wave conditions (Case 6, Case 8, and Case 10) to assess both wave heights at the monitoring points and the wave forces acting on the monopile foundation. Following this, we arranged single-row and three-row PRAFs in the lee zone of the monopile foundation to ensure that the mooring lines were not connected to the monopile itself (Figure 10). The primary objective of this work was to indicate how different PRAF configurations influenced the wave forces exerted on the monopile foundation and to analyze the alterations in wave propagation patterns around these structures.

4. Results and Discussion

In this study, multiple wave parameters (e.g., wave height, wave period, and raft layouts) were considered to evaluate their respective impacts on the hydrodynamic forces (mooring line tension and bridle line tension) on the PRAFs. Moreover, to better visualize the actual hydrodynamic performance of the aquaculture facilities at sea, the model test results were converted to full-scale results according to the model criterion. The following subsections present the results of this study and summarize our expanded discussion regarding the physical mechanisms at play.

4.1. Mooring Line Tensions of PRAF

The structural integrity of aquaculture facilities relies heavily on the mooring system. Mooring line failure is an important factor in exposing the structure to risks. This study analyzed the effect of different arrangements on the mooring system of the PRAF, which can provide an important reference for the design and construction of raft aquaculture facilities, as well as the decision-making of wind turbine foundations as anchorage points.

4.1.1. The Maximum Mooring Line Tensions of the Single-Row PRAF Under Wave Conditions

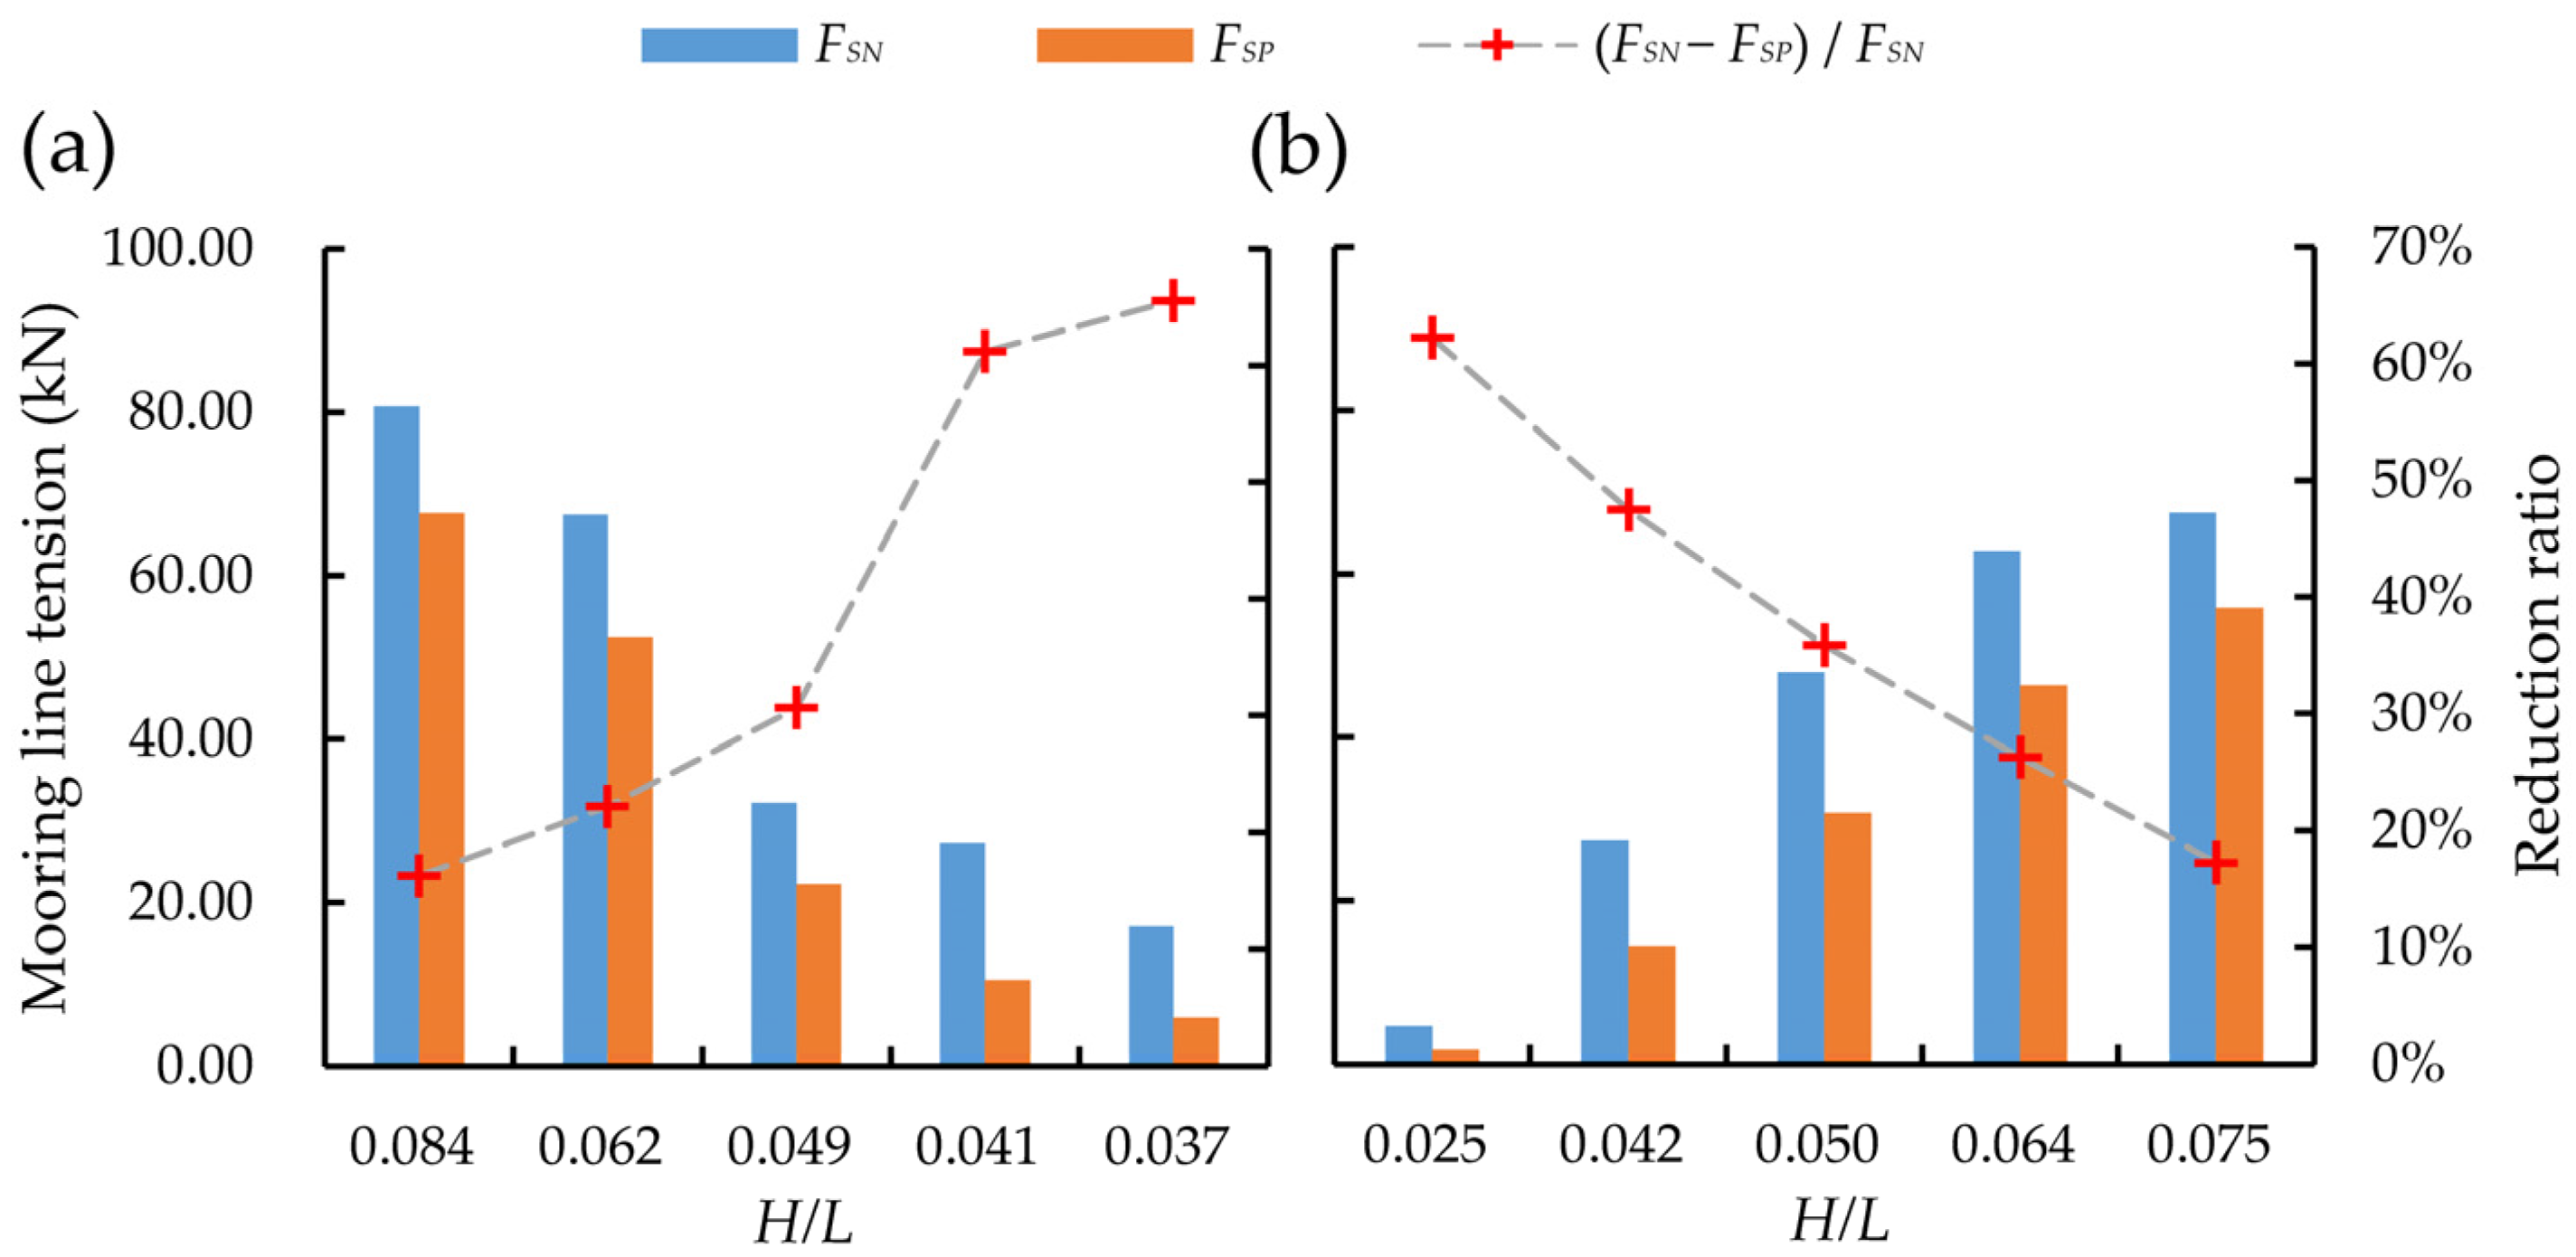
Figure 11 shows the maximum tensions of the upstream mooring line for a single-row PRAF under different wave periods and heights. Here, F S N and F S P represent the maximum mooring line tension without and with a monopile, respectively. The results indicate that regardless of the presence of the wind turbine monopile in the wave tank, the maximum mooring line tension decreased in the wave periods from 1.0 s to 1.4 s when the wave height was 0.1125 m (Figure 11a). Under longer wave periods, the incident wave energy was distributed over a slower timescale, meaning that each crest exerted a force over a longer duration but generally had a lower peak value. As a result, both the mooring cables and the raft had more time to adjust to the motion of the waves, which could reduce the maximum tension in the cables. Meanwhile, shorter wave periods increased the frequency of the crest impacts within the same timeframe, which led to higher acceleration and velocity variations for the structure. This could result in amplified instantaneous forces, which caused increases in the mooring line tensions and more pronounced high-frequency oscillation. When the wave period was 1.0 s and the wave height was 0.1125 m (Case 1), the wave steepness was at its maximum ( H / L   = 0.084), which corresponded to the highest recorded mooring line tension F S N of 80.73 kN.
The wave height determines the overall magnitude of the wave energy, while the wave steepness reflects its nonlinearity. Higher waves carry more energy; consequently, the inertia and viscous drag forces on the PRAF system and mooring lines are elevated. When the wave period was 1.237 s, the maximum mooring line tension increased as the wave height rose from 0.063 m to 0.188 m (Figure 11b). This trend is consistent with previous research findings [30,39]. Our results indicate that as the wave height increased, the maximum tension in the mooring lines also grew. This enhanced motion contributed further to the increased dynamic loads on the mooring lines. These observations follow a well-established pattern in marine engineering: as the wave steepness increases, the structural stability decreases and the wave-induced force on the structure grows, thereby leading to higher tension levels in the mooring system [40,41].
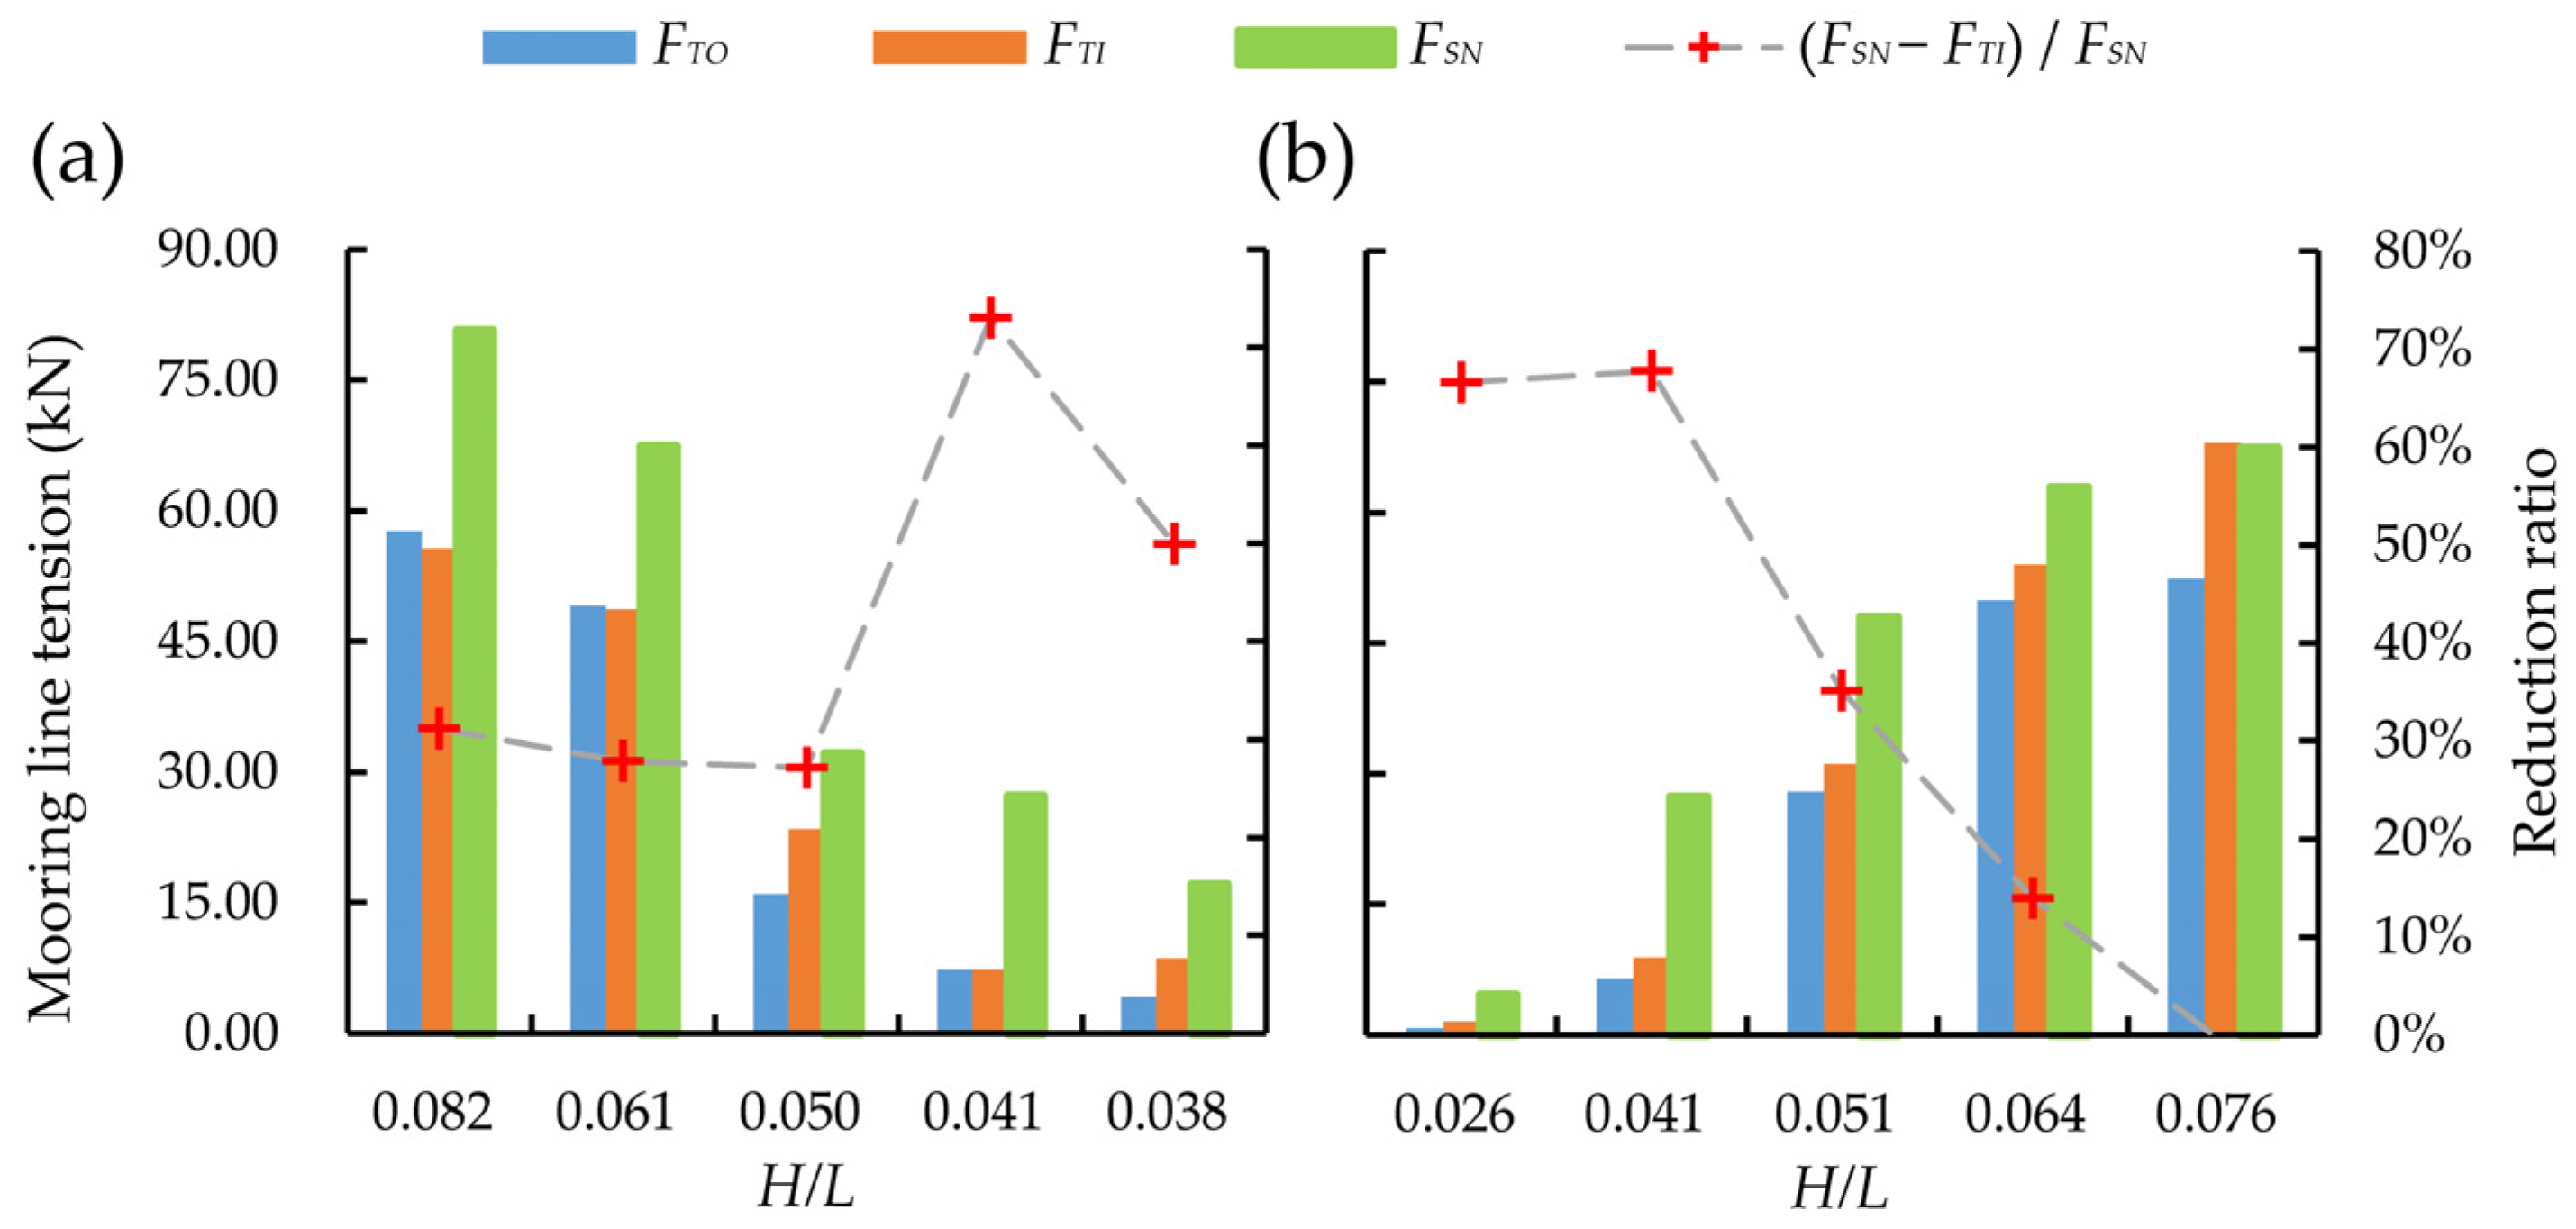
By comparing and analyzing the effects of the wind monopile on the PRAF, ( F S N F S P ) / F S N represents the reduction ratio of the maximum mooring line tension in the presence of the wind monopile relative to the condition without it. The results show that when the monopile was present, the maximum mooring line tension was decreased by 16% to 66%, and the reduction ratio increased as the wave steepness decreased. This effect was the most pronounced when the wave steepness was 0.037. As a type of marine structure, a wind turbine monopile disrupts wave propagation, with wave diffraction and reflection being the main mechanisms of wave energy loss when waves encounter an obstacle. The likelihood and intensity of diffraction effects are closely related to the length scale ratio between the monopile diameter ( D ) and the wavelength ( L ): at small D / L ratios, the flow separation is important while diffraction is minimal, whereas at large D / L   ratios, diffraction becomes dominant and the flow separation is less significant. de Leon et al. (2011) [42] noted that the monopile creates a shadow zone downstream with a lower significant wave height ( H s ) . Meanwhile, the interaction between waves and the monopile leads to a weakened and more confined oscillating flow in the vicinity of the monopile [43]. These wave–structure interaction effects contribute to a reduction in mooring line tension compared with conditions without a monopile.
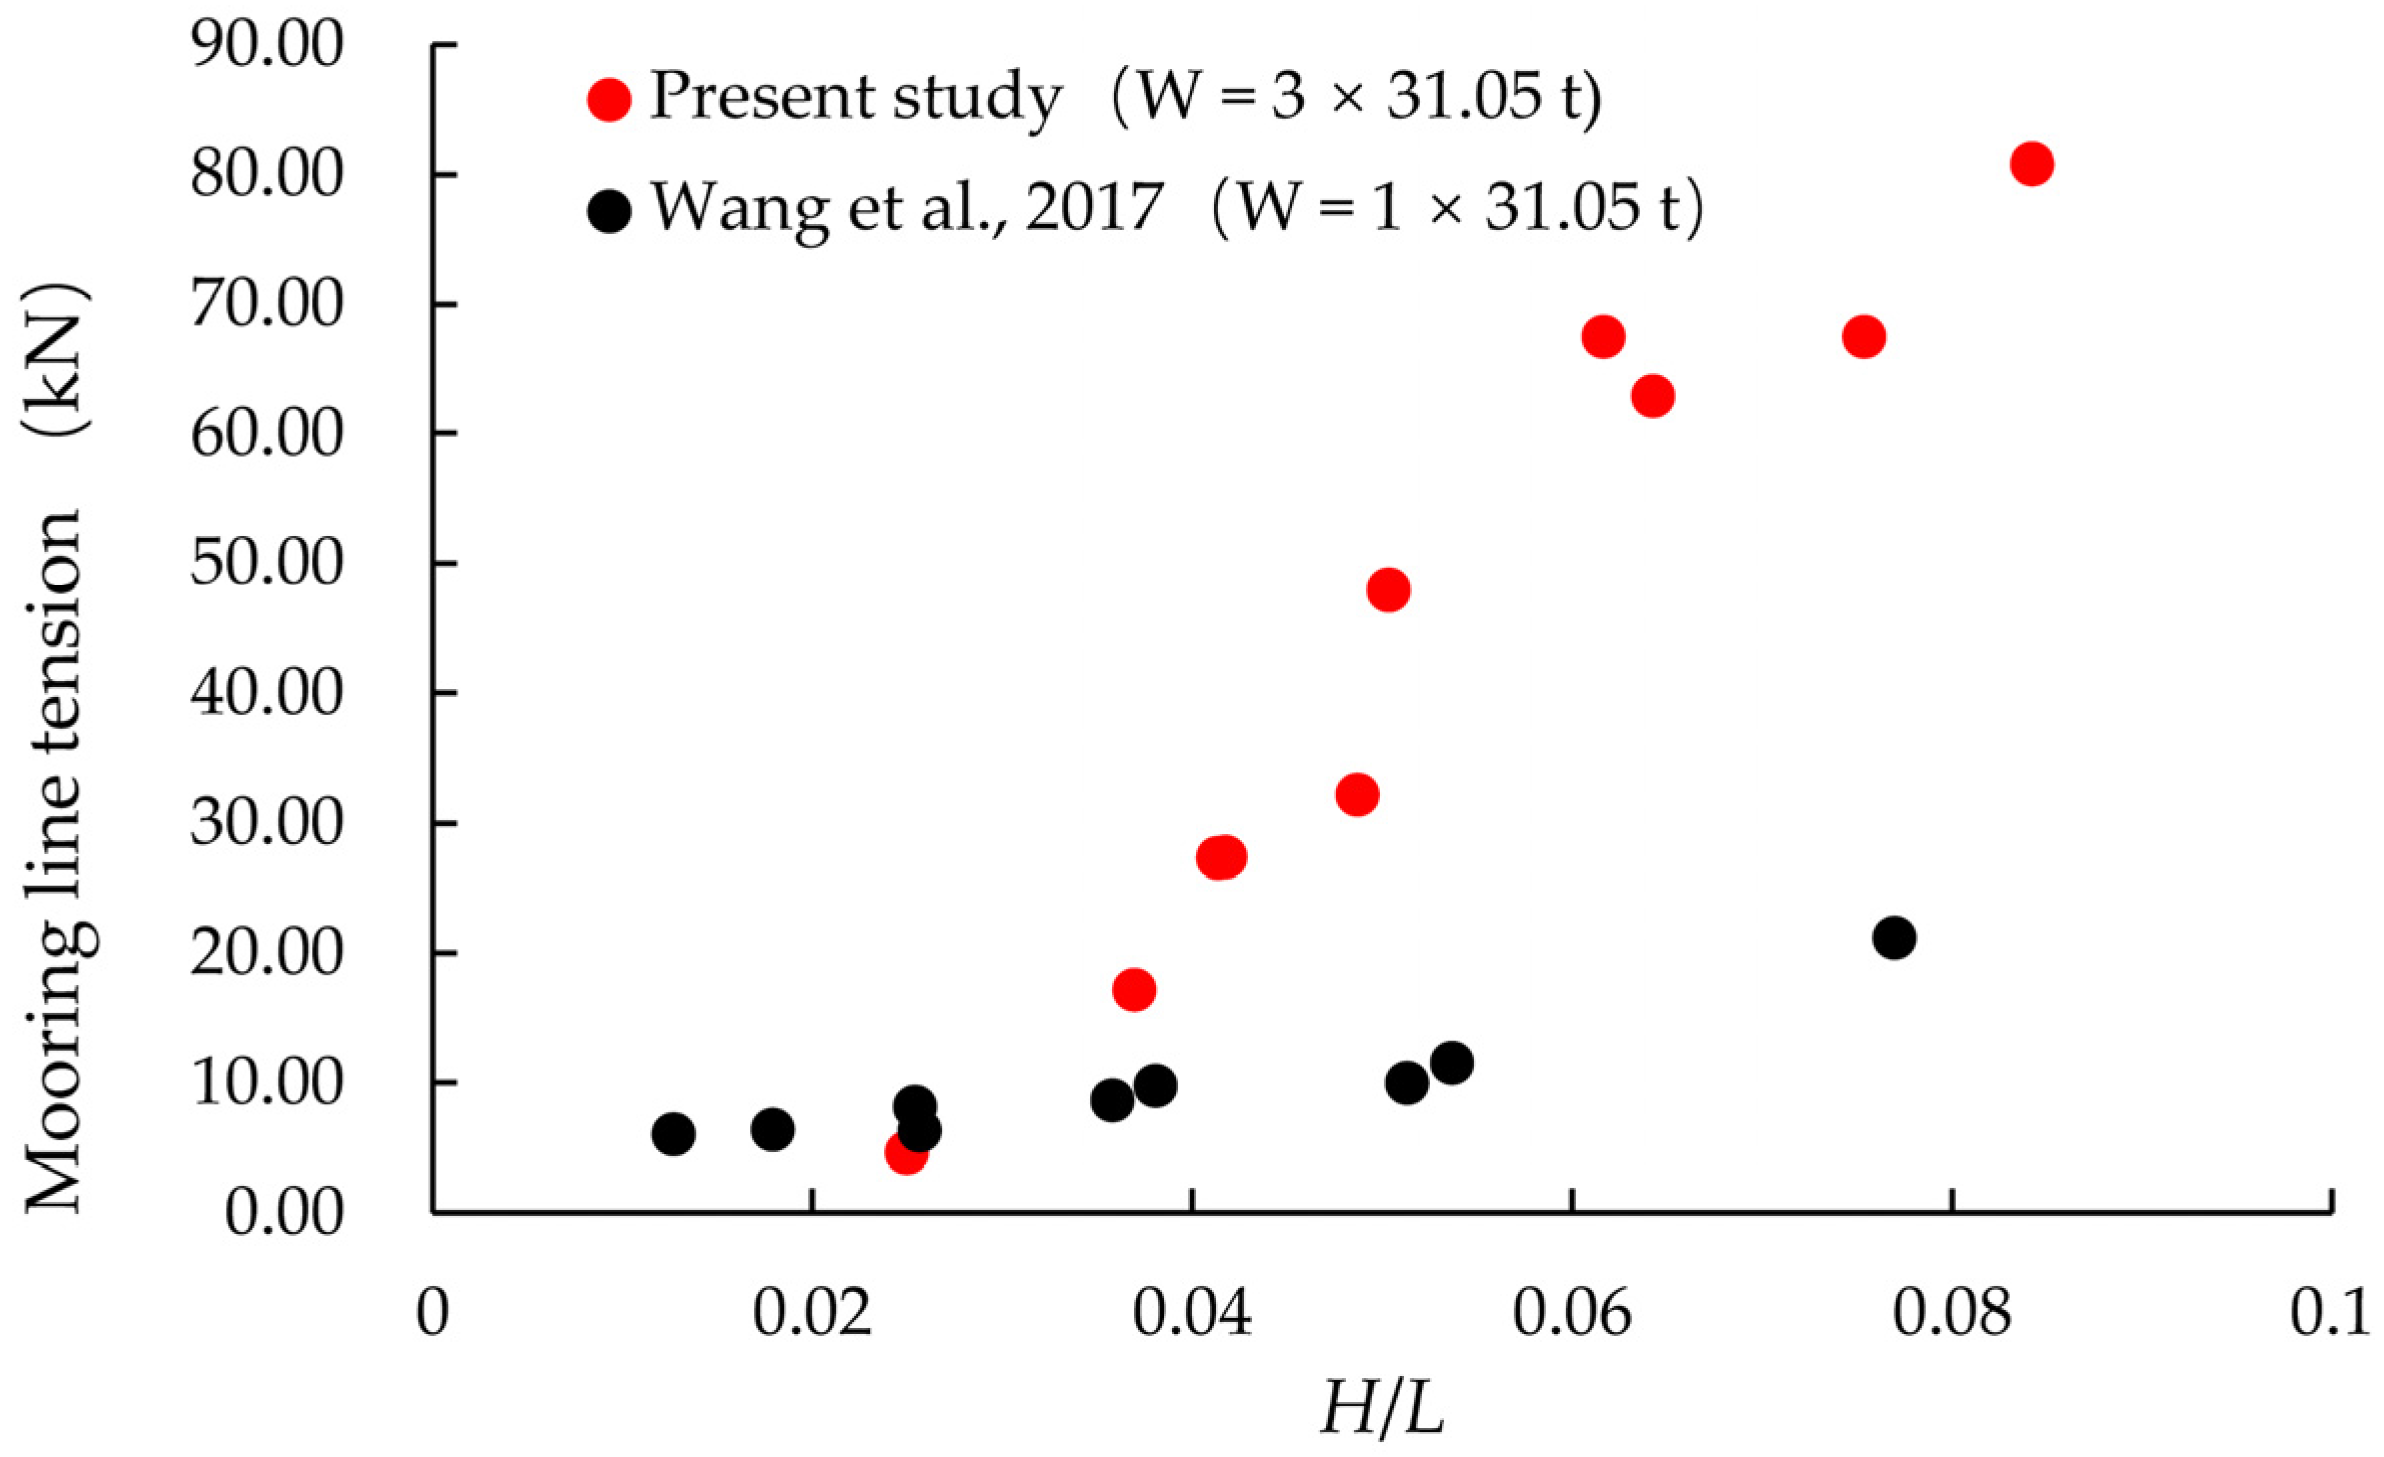
Figure 12 compares the F S N at full scale for a single-row PRAF with three rafts (each raft supported 31.05 t of mussel weight) with a raft facility described in [39]. As the wave steepness increased from 0.025 to 0.084, the maximum mooring line tension rose from 4.60 kN to 80.73 kN. This trend aligns with the numerical simulation results of a raft facility reported by Wang et al. (2017), where the maximum mooring line tension increased from 5.96 kN to 21.13 kN at wave steepnesses that ranged from 0.013 to 0.077 [39]. The consistency suggests that the relationship between the wave steepness and the mooring line tension is robust for different configurations, supporting both the validity of the present experimental setup and the importance of wave steepness as a key parameter in pontoon raft aquaculture systems [41]. The comparison also indicates that the mooring line tension increases with the addition of each pontoon raft, yet not in a manner strictly proportional to the number of rafts. The increased tension suggests complex hydrodynamic interactions between the additional pontoons, which could amplify the structural loads beyond a simple summation effect. Moreover, Masoudi et al. (2024) showed that the number of pontoons significantly affects diffraction wave amplitudes, with multi-pontoon structures improving the breakwater efficiency by up to 45% within the same cross-sectional area [44]. These findings highlight the importance of considering such interactions when designing multi-pontoon raft aquaculture systems.

4.1.2. The Maximum Mooring Line Tensions of the Three-Row PRAFs Under Wave Conditions

Figure 13 compares the maximum tensions of the upstream mooring line for the outer ( F T O ) and the inner ( F T I ) raft facility in the three-row PRAFs. Similar to the single-row PRAF, when the wave height was 0.1125 m, the maximum mooring line tension decreased as the wave period increased from 1.0 s to 1.4 s. However, at the wave period of 1.237 s, the maximum mooring line tension increased in response to wave heights that ranged from 0.063 m to 0.188 m. The comparison showed no significant difference between F T O and F T I , indicating that under these test conditions, whether the raft facility was located in the outer or inner position did not notably affect the mooring line tension. This finding suggests that the PRAFs in the multi-row configuration may be equally exposed to wave impact under different wave conditions.
Moreover, it can be observed in Figure 13 that the maximum tensions of the upstream mooring line in the three-row configuration were generally smaller than those in the single-row configuration under the same wave conditions. When the wave steepness was 0.041, the maximum mooring line tension had a maximum reduction ratio of 73%. This finding suggests that the multi-row PRAFs could effectively reduce the impact of the wave forces by altering the wave propagation and promoting energy dissipation around these structures. The reduction in the maximum mooring line tension for the three-row configuration can be attributed to the intensified energy dissipation that resulted from the interference between multiple rows of pontoons, which collectively scattered and dampened the wave energy more effectively than a single-row arrangement. These results align with the work of Masoudi et al. (2024) and Li et al. (2022), who showed that the multi-row arrangement significantly reduces both the wave energy and mooring loads compared with the single-row system [44,45]. Furthermore, the presence of multiple rows of pontoons may create constructive and destructive interference patterns within the wave field, thereby reducing the overall force acting on individual mooring lines.
Compared with the single-row setup, the multi-row configuration distributed the hydrodynamic loads more evenly, which reduced the concentration of forces on the individual mooring lines and enhanced the overall system stability. By lowering the mooring line tension, the multi-row arrangement underscored the importance of optimizing pontoon raft layouts to improve the wave attenuation performance. Moreover, the multi-row configuration provided greater stability across a range of wave conditions and mitigated the wave-induced loads effectively, which contributed to the long-term sustainability and safety of offshore aquaculture facilities. In future work, we will continue to conduct both experimental and numerical studies to explore how different spacing arrangements affect multi-row setups. These findings will ultimately provide practical guidance for the spatial layout of multi-row raft aquaculture in offshore wind farms.

4.2. Bridle Line Tensions of PRAFs

The combination of raft aquaculture facilities offers several advantages, including enhanced comprehensive utilization of aquaculture waters, reduced equipment investment costs, and improved feasibility for large-scale management. In addition to the mooring lines, the connecting lines between individual rafts within the PRAFs are also subjected to hydrodynamic loads. This section presents the variation in bridle line tensions for both the single-row PRAF (e.g., F S B 1 ,   F S B 2 ,   F S B 3 ,   F S B 4 ) and three-row PRAFs (e.g., F T B 1 ,   F T B 2 ,   F T B 3 ,   F T B 4 ).

4.2.1. The Maximum Bridle Line Tensions of the Single-Row PRAF Under Wave Conditions

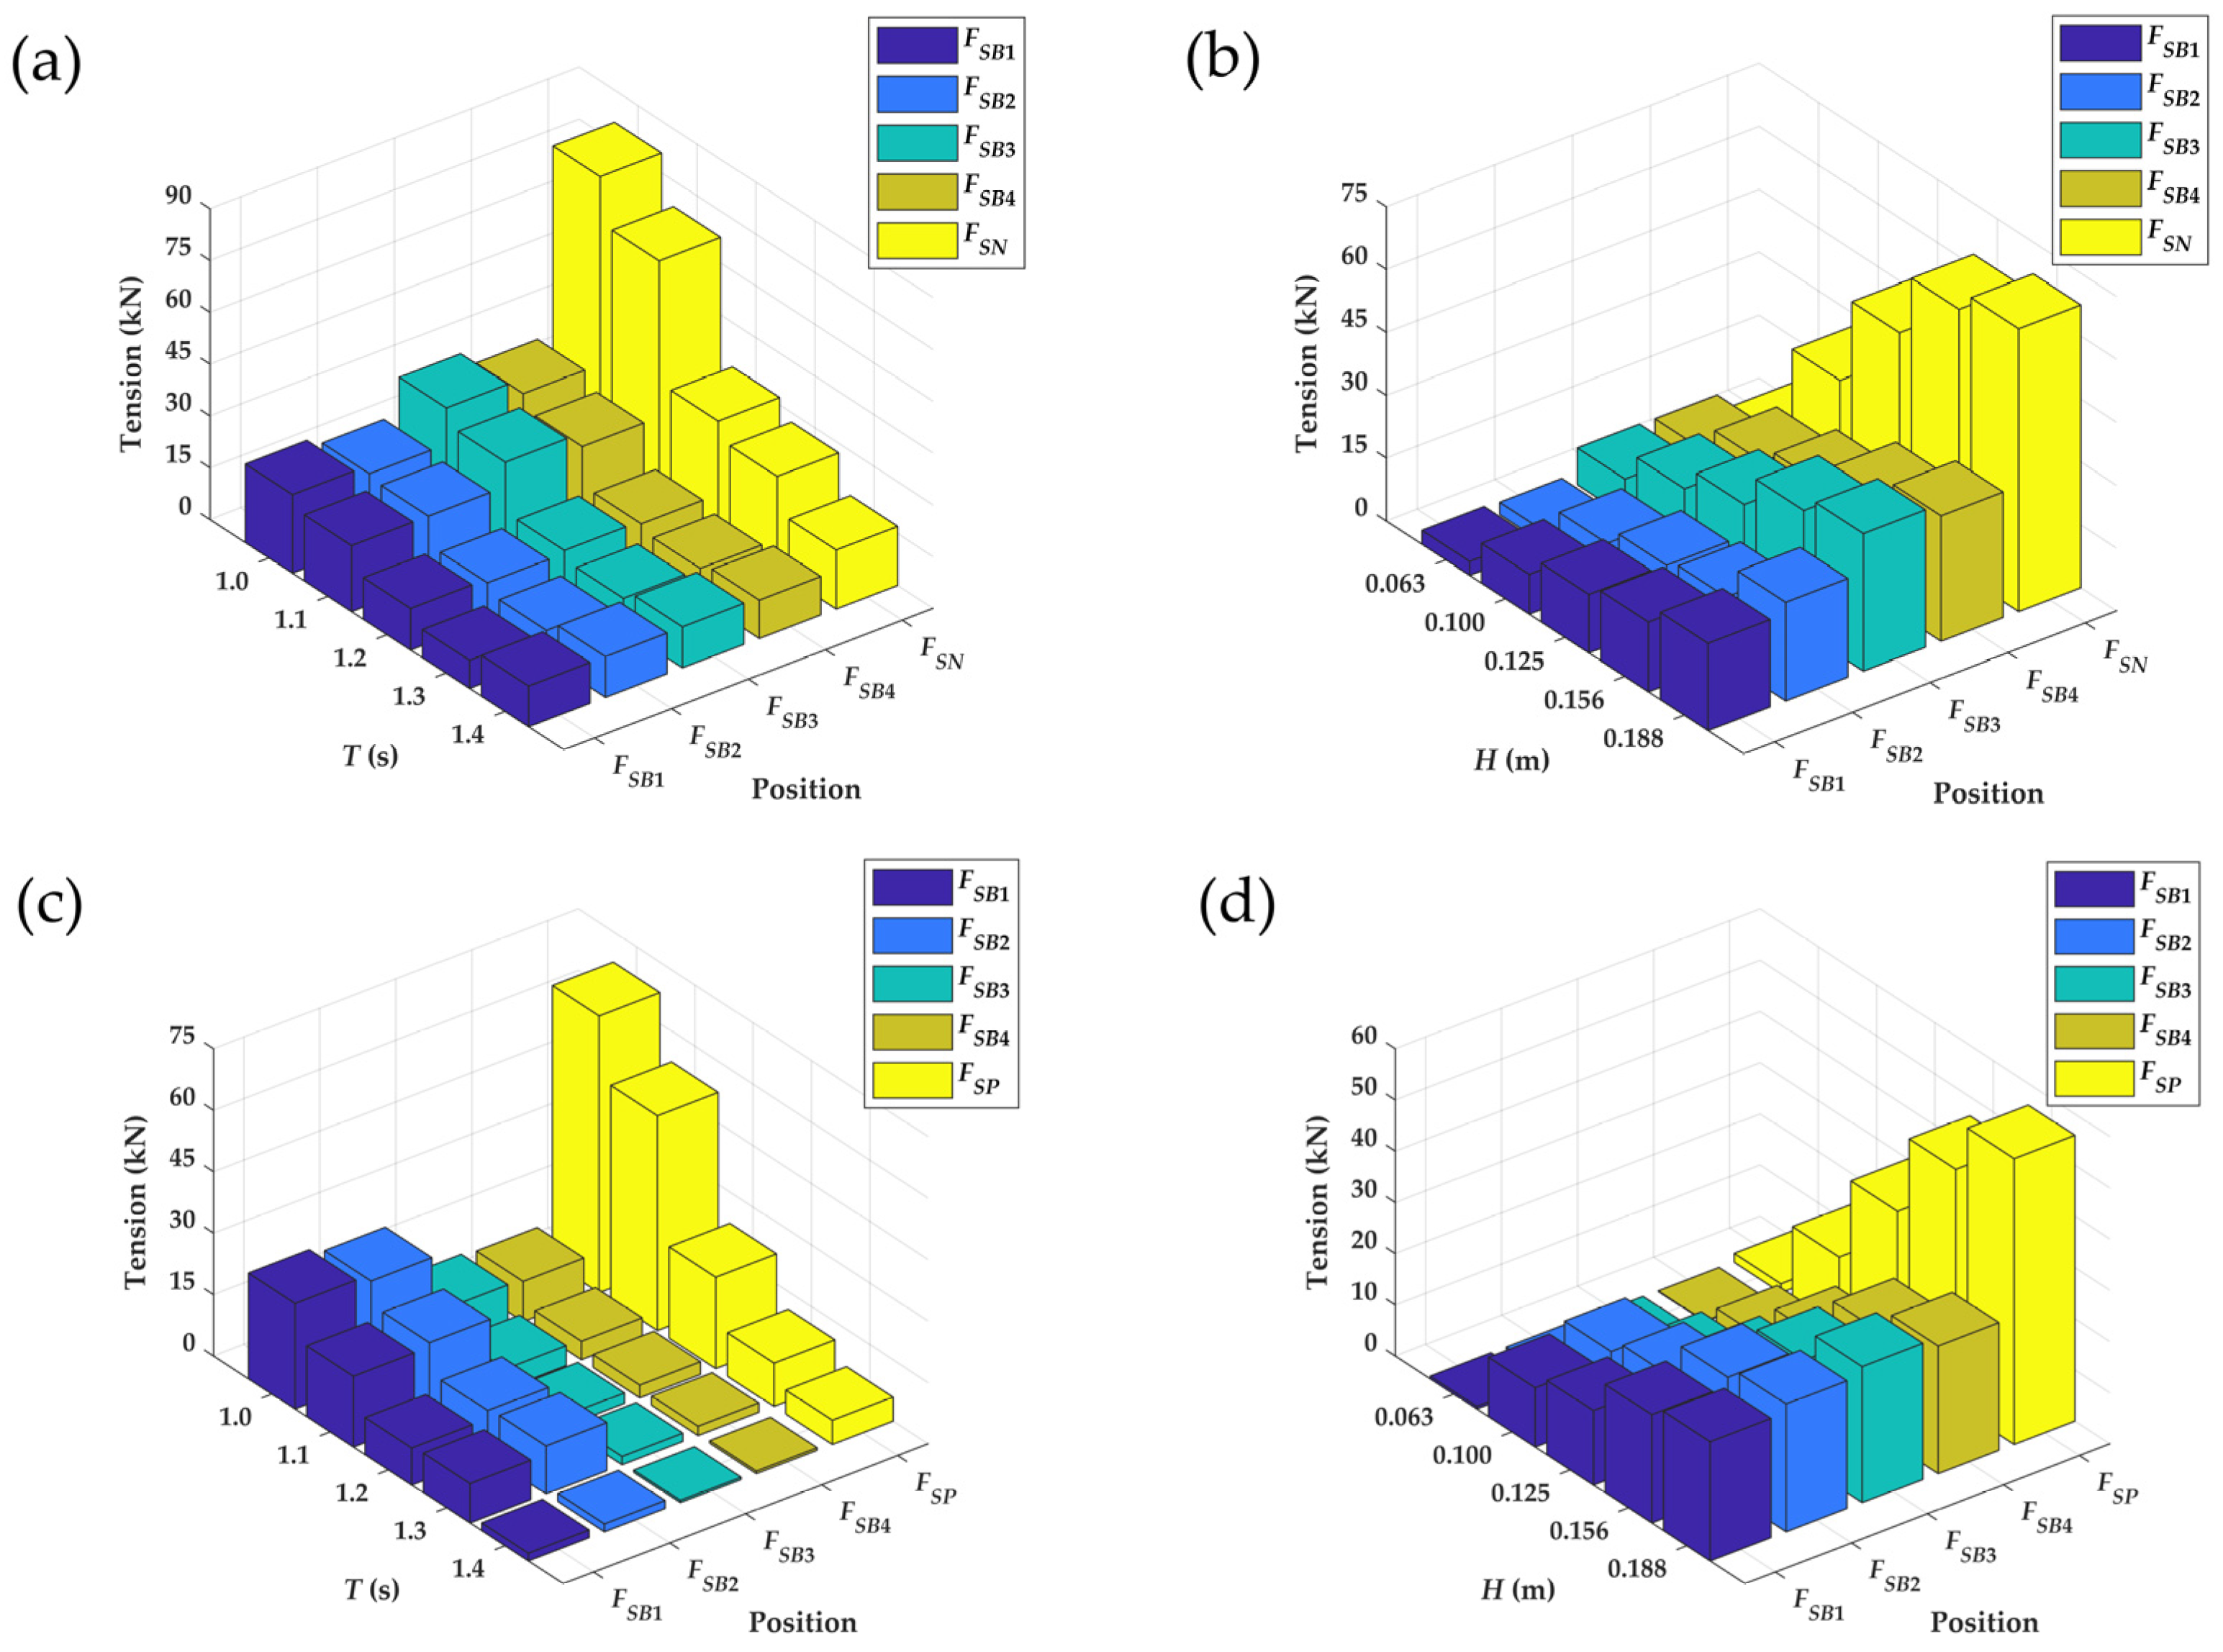
Figure 14 shows the relationship between the bridle line tensions F S B 1 F S B 4 and the wave steepness under different wave conditions, with and without the presence of a wind monopile. Similar to the mooring line tension, the bridle line tension increased as the wave steepness increased. The bridle line tensions had maximums when the wave steepness approached values near 0.08. The maximum values of F S B 1 F S B 4 were 25.82 kN, 24.96 kN, 32.80 kN, and 29.94 kN, respectively. It should be noted that the maximum values of F S B 1   and   F S B 2 occurred with the monopile, while the maximum values of F S B 3   and   F S B 4 occur without the monopile.
Figure 14a,b show that the presence of the monopile increased the bridle line tensions F S B 1   and   F S B 2 with rising wave steepness, which exhibited similar sensitivities to both the wave height and wave period. In contrast, Figure 14c,d show the presence of the monopile weakened the tensions F S B 3   and   F S B 4 , and that these tensions were more responsive to changes in the wave height than to the wave period. This outcome aligns with the understanding that the wave height primarily affects the maximum force amplitude, whereas the wave period plays a larger role in determining the force distribution. Consequently, the increase in the wave height led to a noticeable rise in the maximum bridle line tension. Furthermore, Figure 15a,c also demonstrate that in the presence of the monopile, F S B 1   and   F S B 2 exceeded F S B 3   and   F S B 4 across Cases 1–5. This was precisely the opposite of the situation without the monopile. The difference between F S B 1 F S B 2   and F S B 3 F S B 4 can be attributed to the distinct positions of the connecting lines within the raft system. The monopile altered the surrounding wave field, particularly the upstream region of the raft facilities, which intensified the hydrodynamic loads on the upstream bridle lines closest to it. Miles et al. (2017) found that oscillatory velocities decreased immediately behind the pile but recovered and even exceeded the background levels rapidly within a distance of approximately 1.65 to 3.5 times the pile diameter [46]. Consequently, the first raft in the wave propagation direction (located 3.15 m from the monopile center, i.e., beyond 3.5 times the diameter of the pile) experienced greater wave forces than in the no-monopile scenario while consuming more wave energy, and thus, exposing subsequent rafts to lower significant wave heights ( H s ). This phenomenon underlay the marked differences in F S B 1 F S B 2   and F S B 3 F S B 4 between the monopile and no-monopile configurations. In the future, further research is required to investigate the effects of the geometric parameters of the monopile, wave characteristics, and other factors on the hydrodynamic performance. This will facilitate a more comprehensive understanding and enable improved prediction of the hydrodynamic responses of raft aquaculture facilities in offshore wind farms.
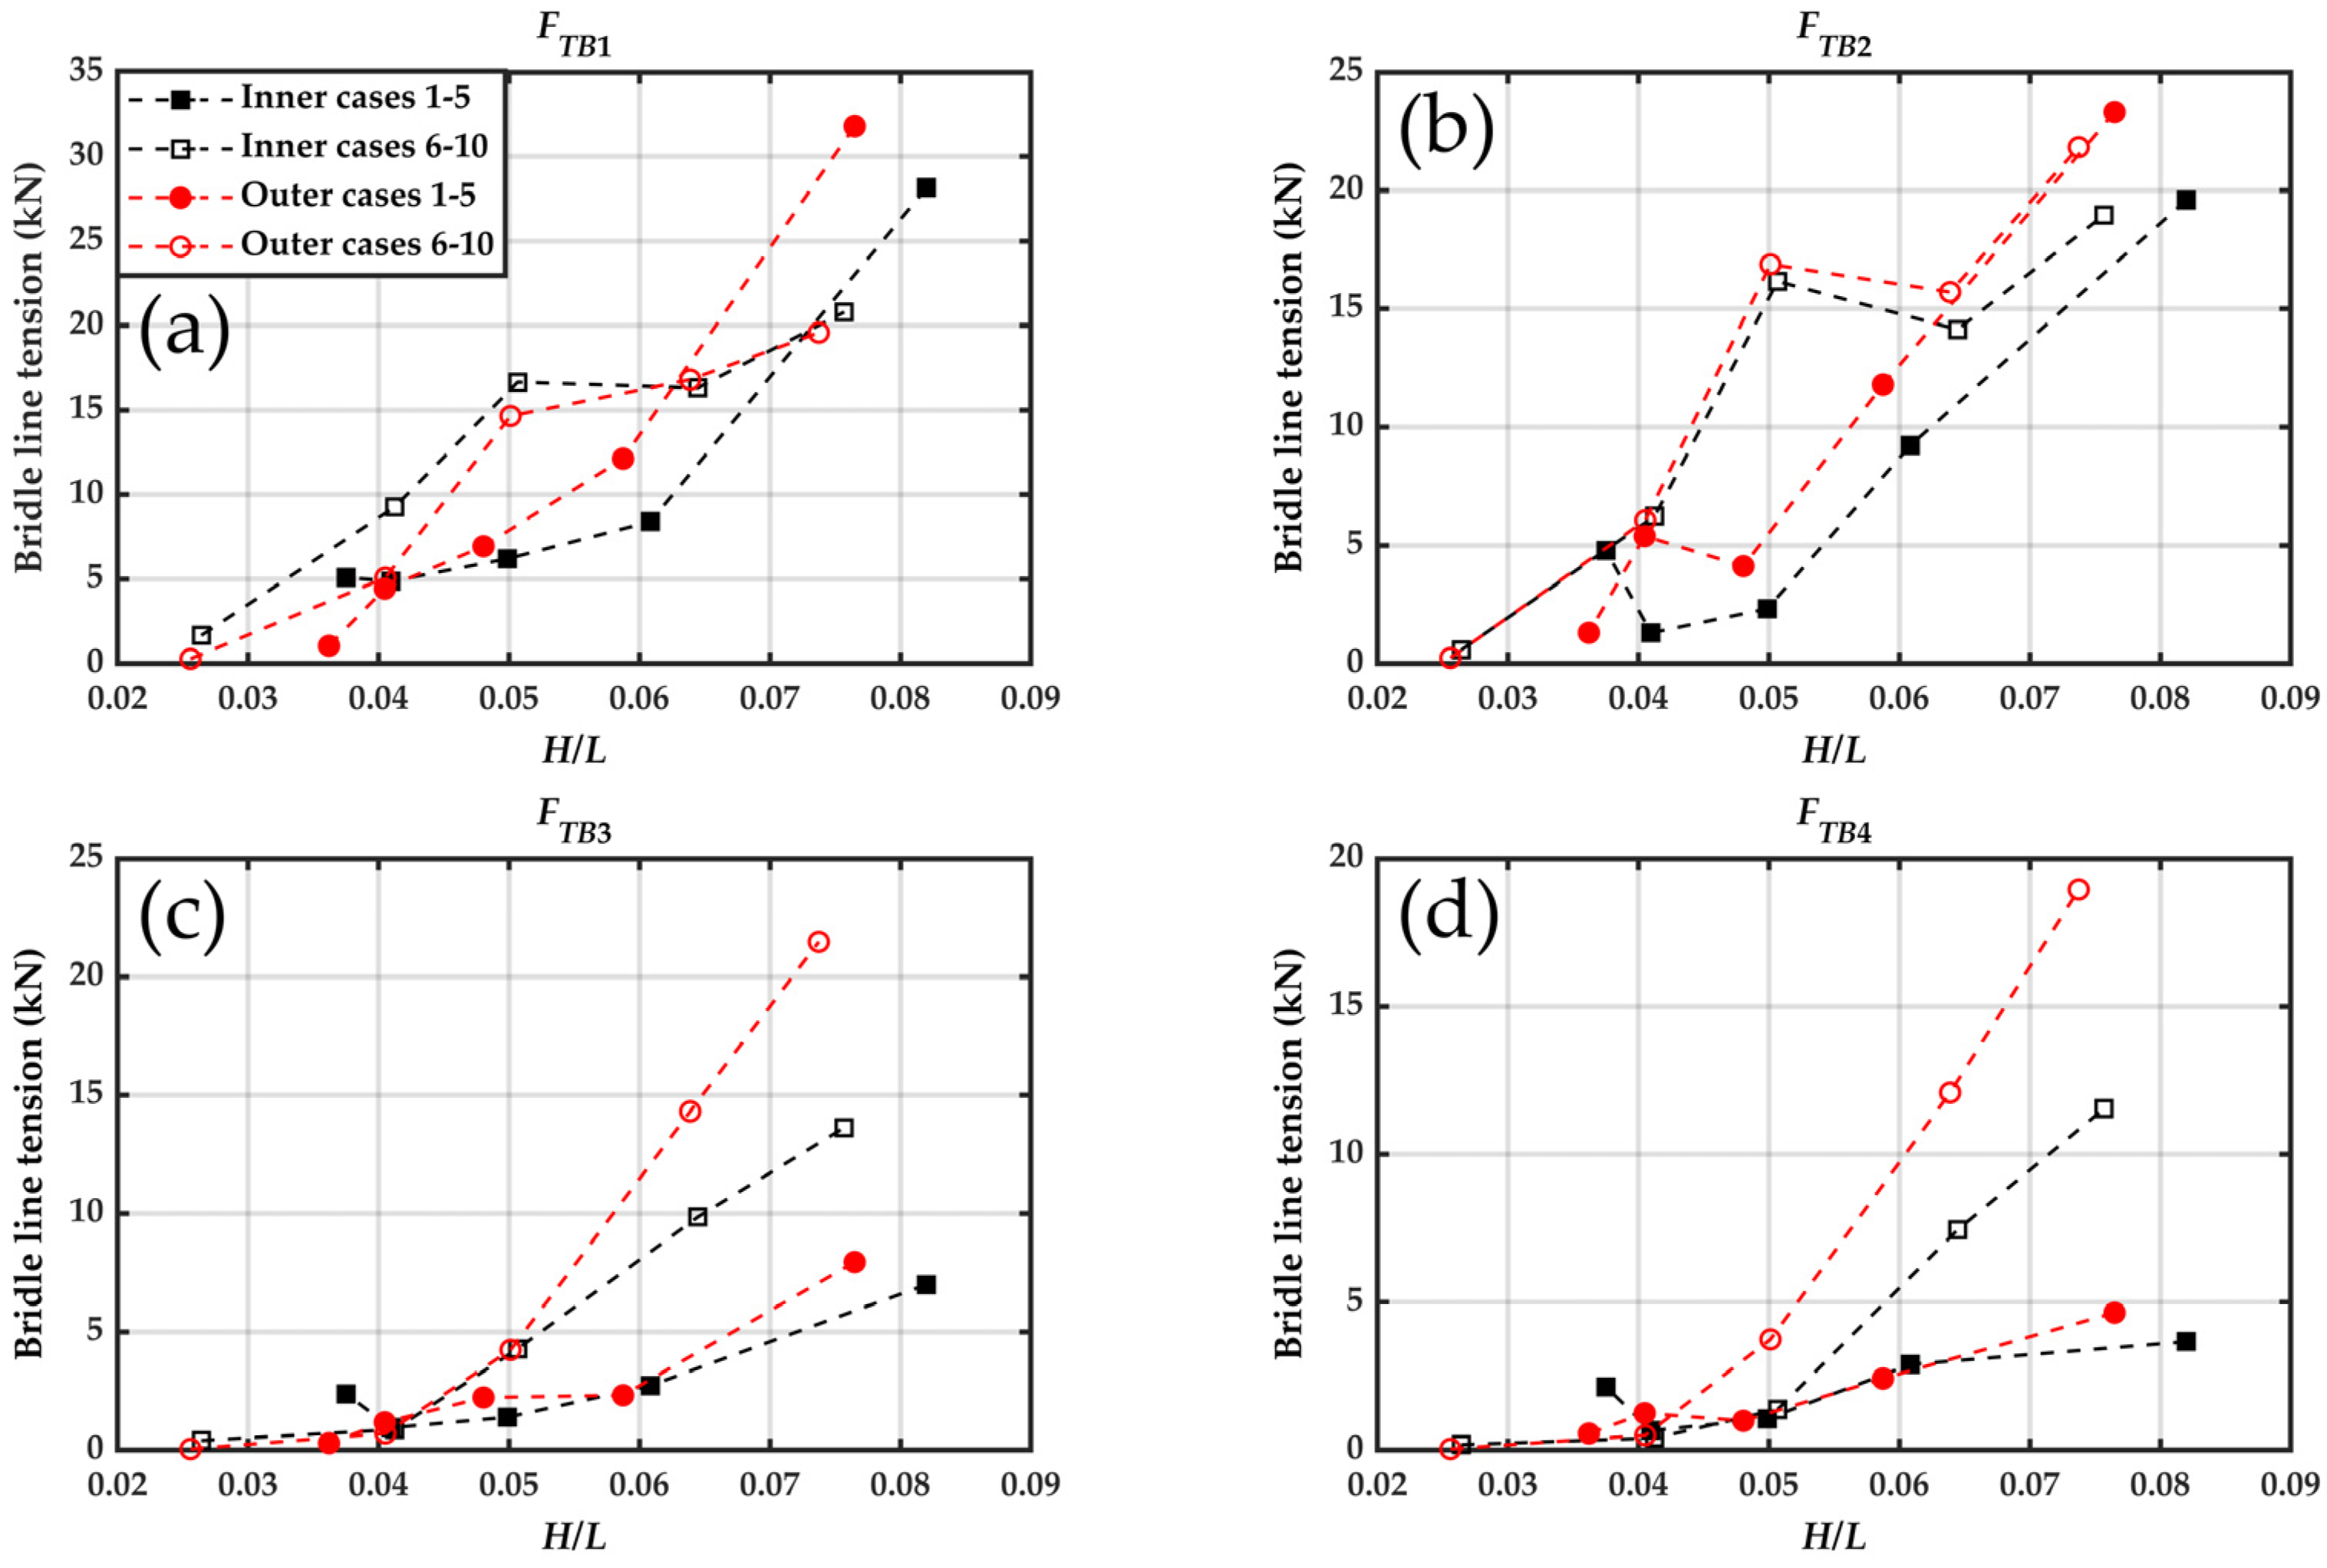
Figure 15 also shows the mooring and bridle line tensions for a single-row PRAF under different wave conditions with and without the monopile. The tensions F S B 1 F S B 4 remained lower than F S N   or F S P , and the mooring line tensions rose more sharply than the bridle line tensions as the wave period decreased or the wave height increased. These observations differed from the findings of Martinelli et al. (2008) on the floating breakwaters [47]. This was because in this study, both the mooring line and bridle line were in a slack state initially, and the mooring line was exposed to the incident wave earlier. Their peak values did not coincide due to phase differences between the rafts. In contrast to the mooring lines, which largely responded to the incident wave, the bridle line tensions arose from interactions between the adjacent rafts. F S B 1 F S B 2 and F S B 3 F S B 4 measured the connecting forces between pairs of rafts, where each raft experienced distinct motion states. Furthermore, the wave energy was dissipated through impacts and reflections on the mussel ropes and pontoons, which led to varying hydrodynamic loads on each raft. According to Liao et al. (2017), combined raft structures under regular wave conditions can substantially reduce mooring forces, suggesting that combined raft structures may outperform single raft structures in terms of wave-induced loads if the ropes of the system are strong enough [48].

4.2.2. The Maximum Bridle Line Tensions of the Three-Row PRAFs Under Wave Conditions

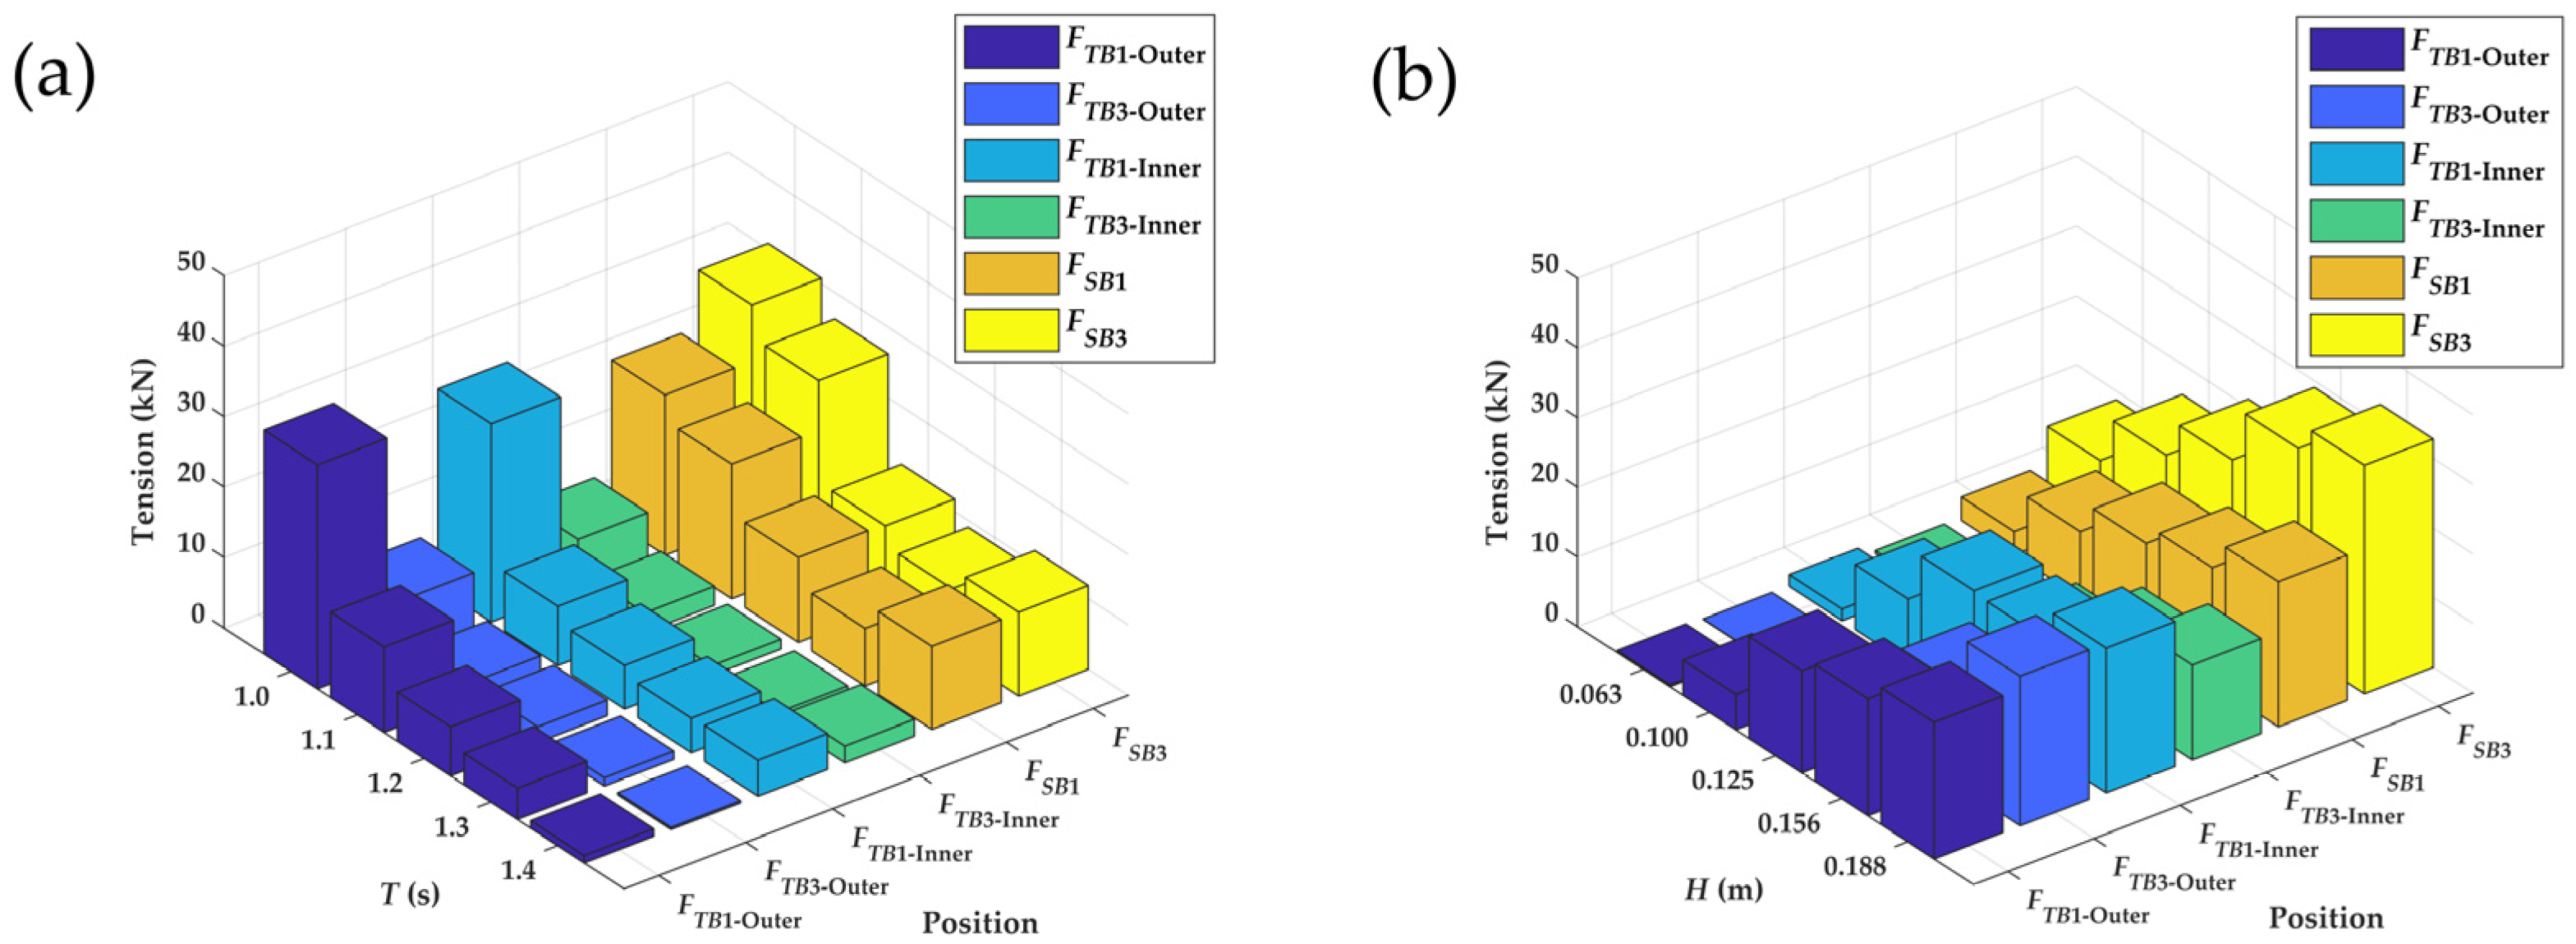
Figure 16 shows the effects of different wave periods and wave heights on the bridle line tensions F T B 1 F T B 4 , including the outer structure and inner structure of the three-row PRAFs. F T B 1 F T B 4 tended to increase with increasing wave steepness. As the wave steepness approached 0.08, F T B 1 F T B 4 had maximum values of 31.79 kN, 23.30 kN, 21.47 kN, and 18.95 kN, respectively. Figure 16a,b indicate that F T B 1 and F T B 2 of the outer structure were slightly higher than those of the inner structure with rising wave steepness. The sensitivities of F T B 1 and F T B 2 to the wave height and wave period were not obvious. Figure 16c,d indicate that F T B 3 and F T B 4 of the outer structure were notably greater than F T B 3 and F T B 4   of the inner structure with increasing wave steepness, and the sensitivities of F T B 3 F T B 4 to changes in the wave height were stronger than in the wave period.
In the three-row PRAFs, significant interactions between the structures were observed. The bridle line tension results suggest that the inner structure exhibited greater stability under varying wave conditions. This can likely be attributed to the redistribution of the wave field after the waves encountered the raft system. In the three-row configuration, the outer structures diffracted the incoming waves around both sides, which caused these wave components to converge upon the inner structure. Because the converging waves often arrived with varying phases, partial destructive interference occurred, which effectively reduced the local wave energy around the inner structure and led to lower hydrodynamic loads, especially under stronger wave conditions (e.g., high wave height or greater wave steepness). These findings highlight the importance of wave interference and energy reduction for multi-row configurations, which inspires the spatial deployment of offshore aquaculture.
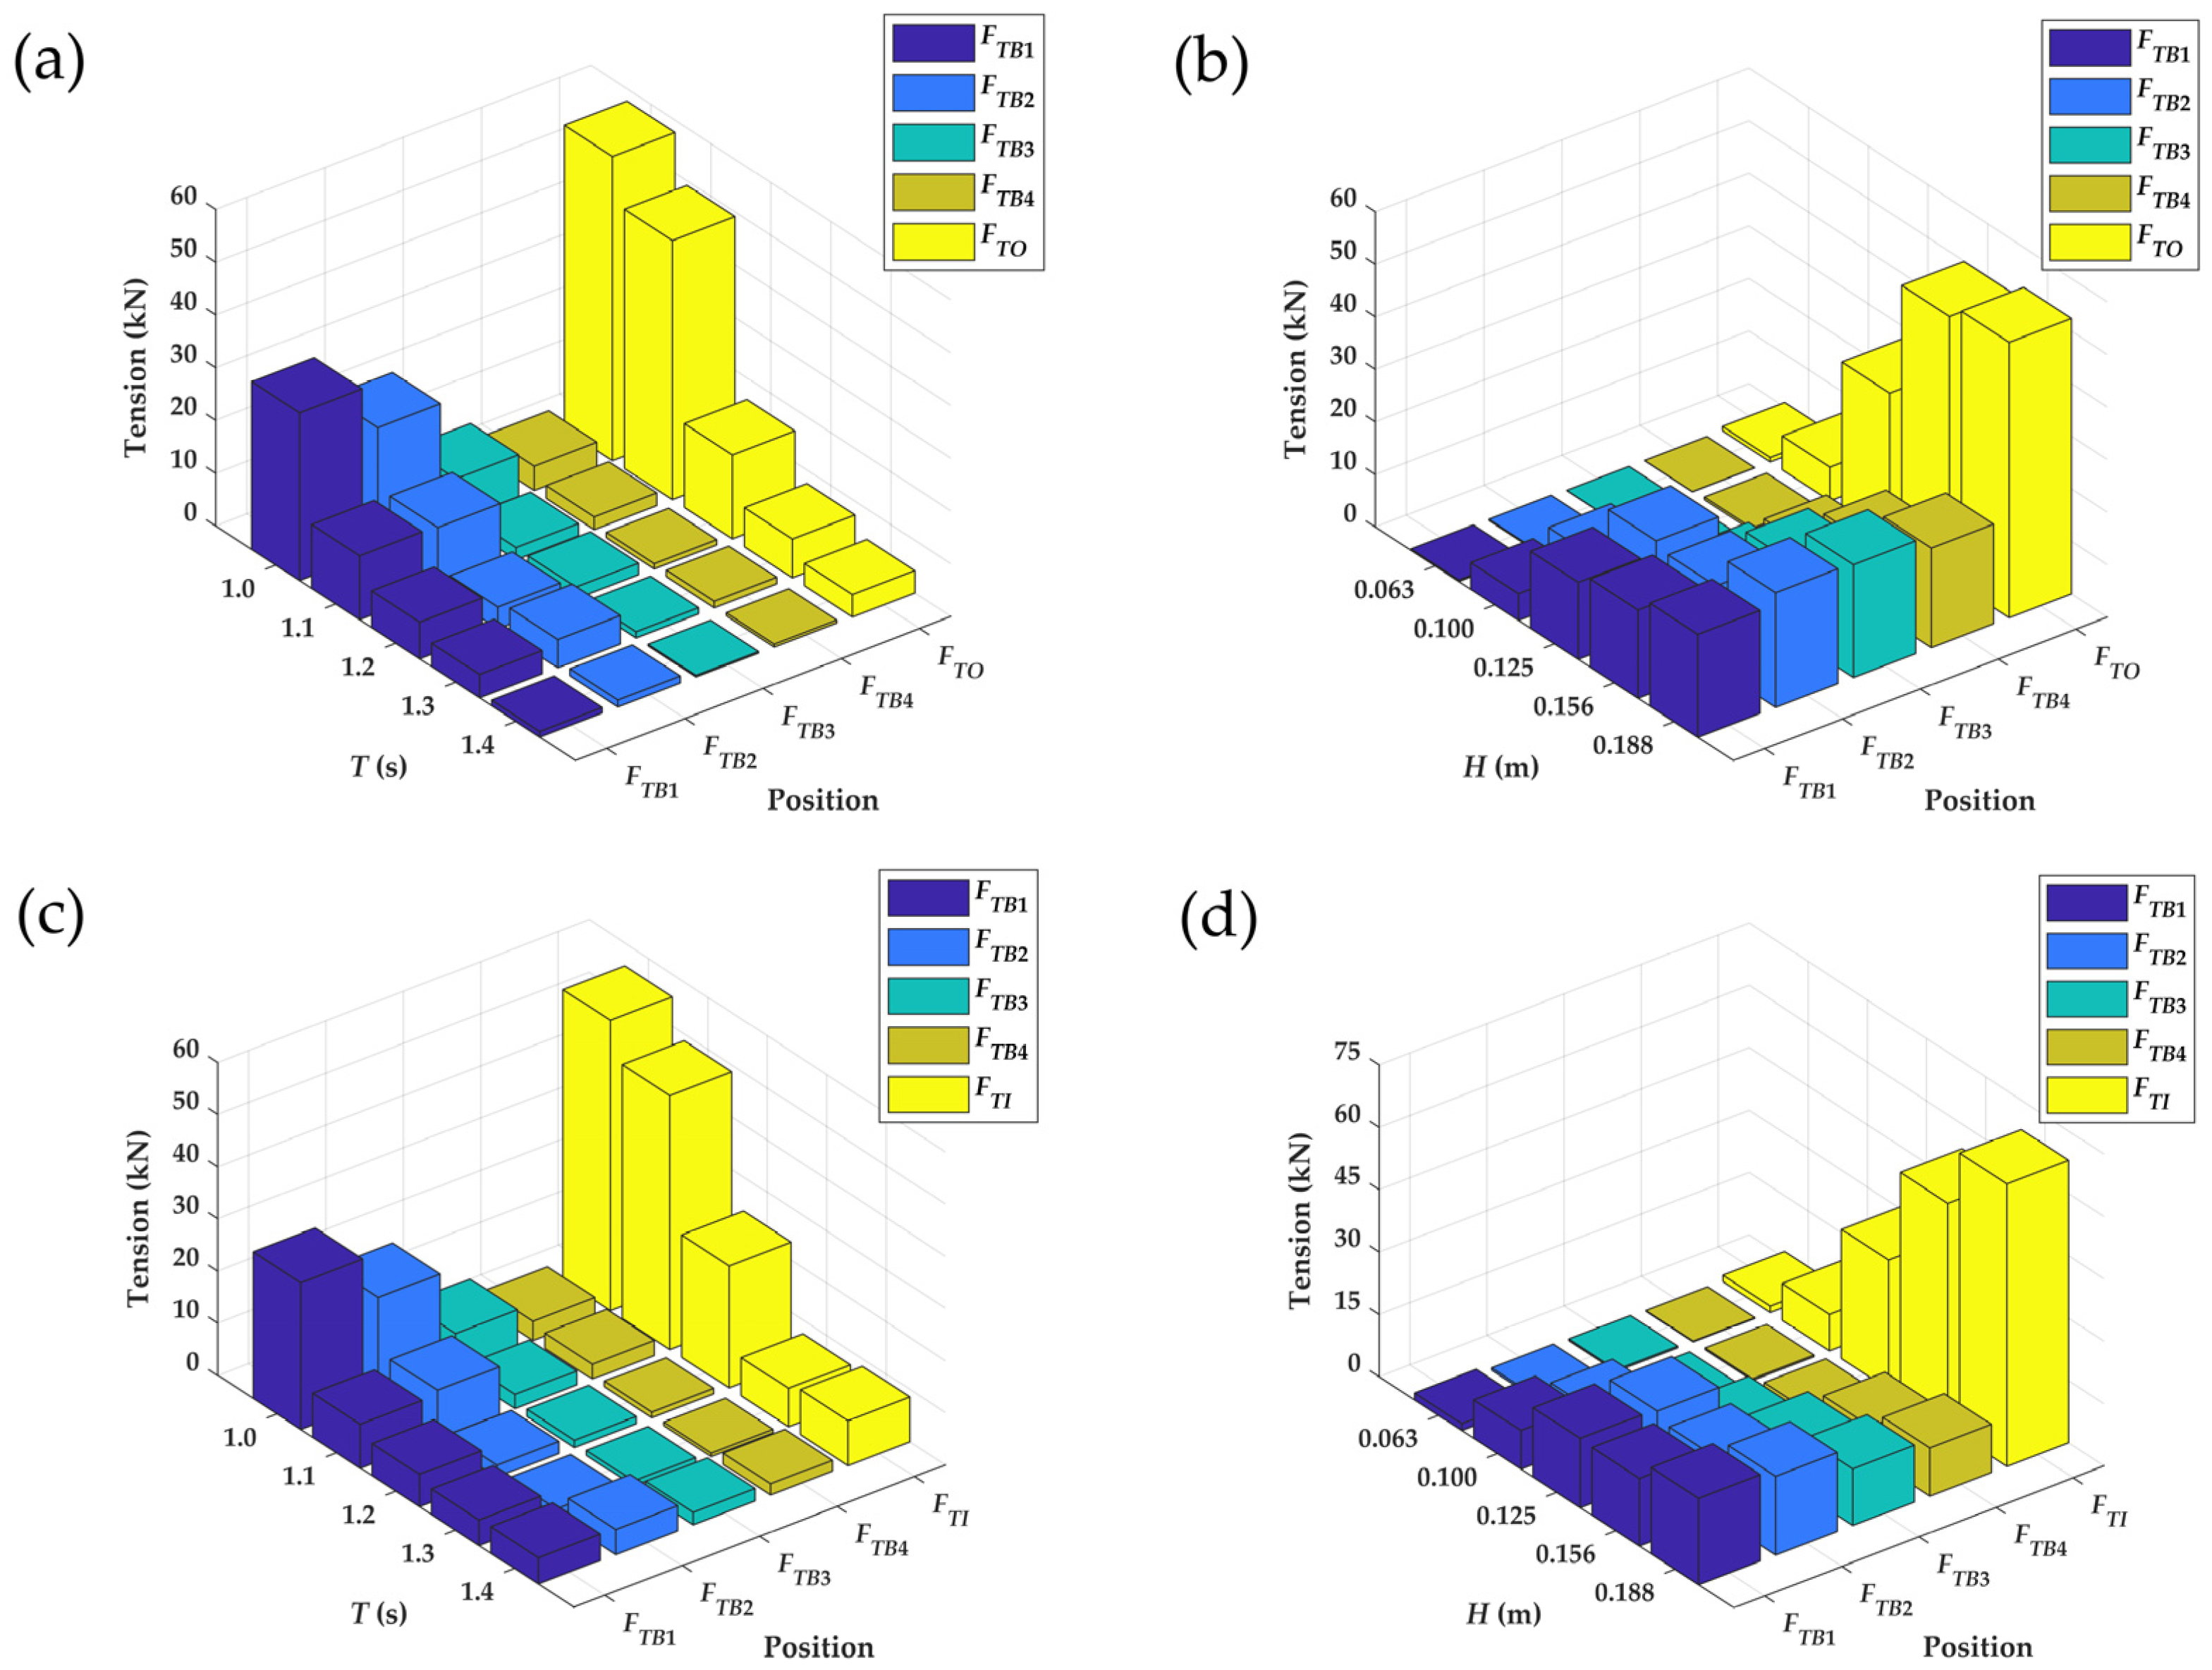
Figure 17 compares the mooring line tensions ( F T O , F T I ) and bridle line tensions ( F T B 1 F T B 4 ) for the three-row PRAFs under different wave conditions. Overall, these tensions ( F T B 1 F T B 4 ) tended to remain lower than the upstream mooring line tensions F T O   or F T I . However, under more energetic wave conditions (e.g., larger wave heights or steeper waves), especially at shorter wave periods, the tensions in F T B 1 and F T B 2 became significantly higher than F T B 3 and F T B 4 . This phenomenon indicates that shorter-period, high-steepness waves imparted greater localized loads on the forward bridle lines than on those positioned further inward.
The primary reason for the observed tension difference was the attenuation and the redistribution of wave energy caused by the multi-row configuration. In the single-row configuration, the rear rafts were directly exposed to waves that had undergone minimal dissipation, which led to cumulative wave impacts on the trailing rafts. By contrast, in the three-row configuration, the upstream raft directly encountered the undisturbed incident waves and experienced higher hydrodynamic loads on the front bridle lines. Acting much like a small breakwater, these upstream rafts dissipated a portion of the wave energy through diffraction, viscous effects, and local turbulence, and thus, reduced the wave forces transmitted to the subsequent rafts.
Furthermore, the constructive and destructive interference patterns that arose from the wave diffraction at the edges of the upstream rafts redistributed the hydrodynamic loads between the inner and rear rows. In particular, the destructive interference could diminish the wave amplitudes in the lee of the front row, which lowered the bridle line tensions downstream. Additionally, the shadowing effect of the front-row rafts provided further protection for the interior and rear rows from the full incident wave energy.
In summary, the difference in tension distribution between the single- and three-row raft systems can be attributed to the combined mechanisms of the wave energy dissipation, interference, and shadowing effects. As illustrated in Figure 13, the three-row configuration effectively decreased the wave forces on the downstream rafts, which resulted in lower overall mooring line tensions. In contrast, a single-row arrangement exposed the raft directly to the undistributed wave field, which led to higher cumulative forces on its mooring line.
Figure 18 shows the comparison of the bridle line tensions of the single-row PRAF ( F S B 1   and F S B 3 ) and those of the three-row raft facilities ( F T B 1   and F T B 3 ). The results indicate that the three-row configuration generally reduced the bridle line tensions compared with the single-row configuration, except under the condition of T   = 1.0 s and H   = 0.1125 m, where F T B 1 exceeded F S B 1 . As shown in Figure 17a, F T B 1 under this specific condition appeared to be an abnormal value. One possible explanation was that certain components of the three-row PRAFs may have a natural vibration period similar to the incident wave period ( T   = 1.0 s), which led to localized resonance and generating the higher-than-expected bridle line tensions. This phenomenon suggests that resonance effects in a multi-row configuration can significantly impact structure loads under specific wave conditions. Martinelli et al. (2008) also observed that under perpendicular wave conditions, mooring and intermodal connector forces can vary significantly with increasing layout complexity [47]. Therefore, the findings highlight the importance of optimizing the spatial layout of aquaculture facilities to enhance their hydrodynamic performance and reduce structural loads, particularly in multi-row configurations.

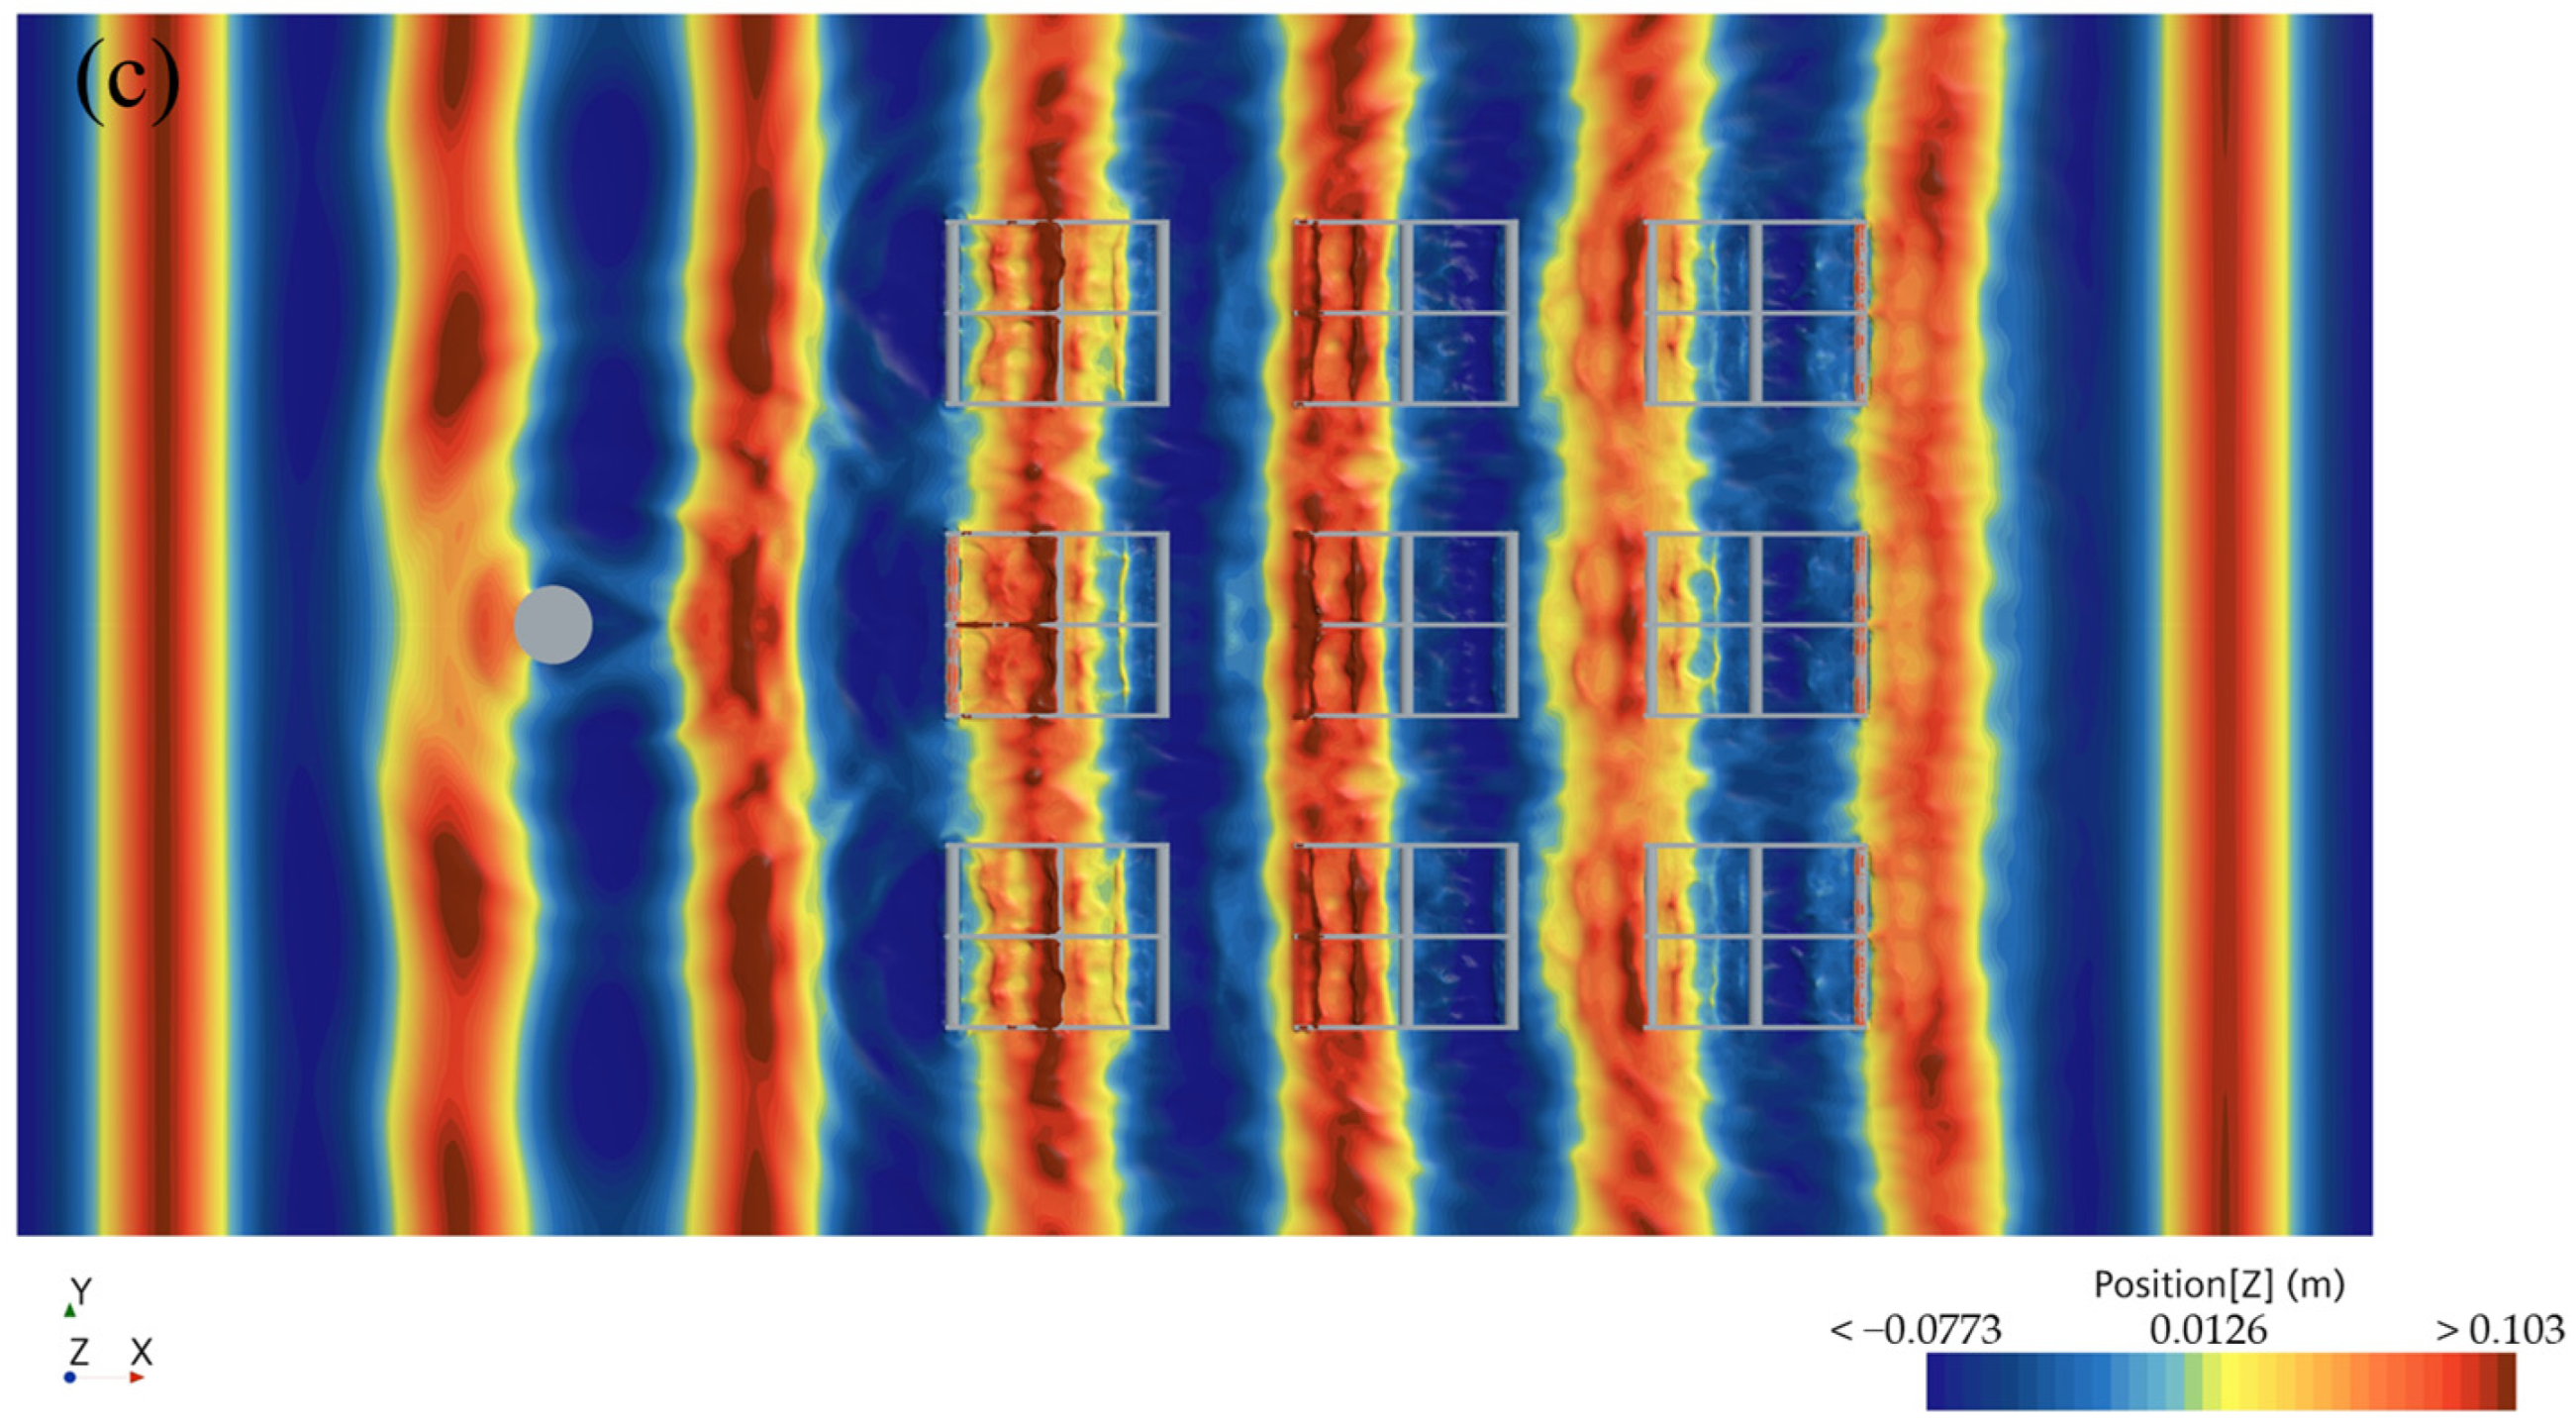
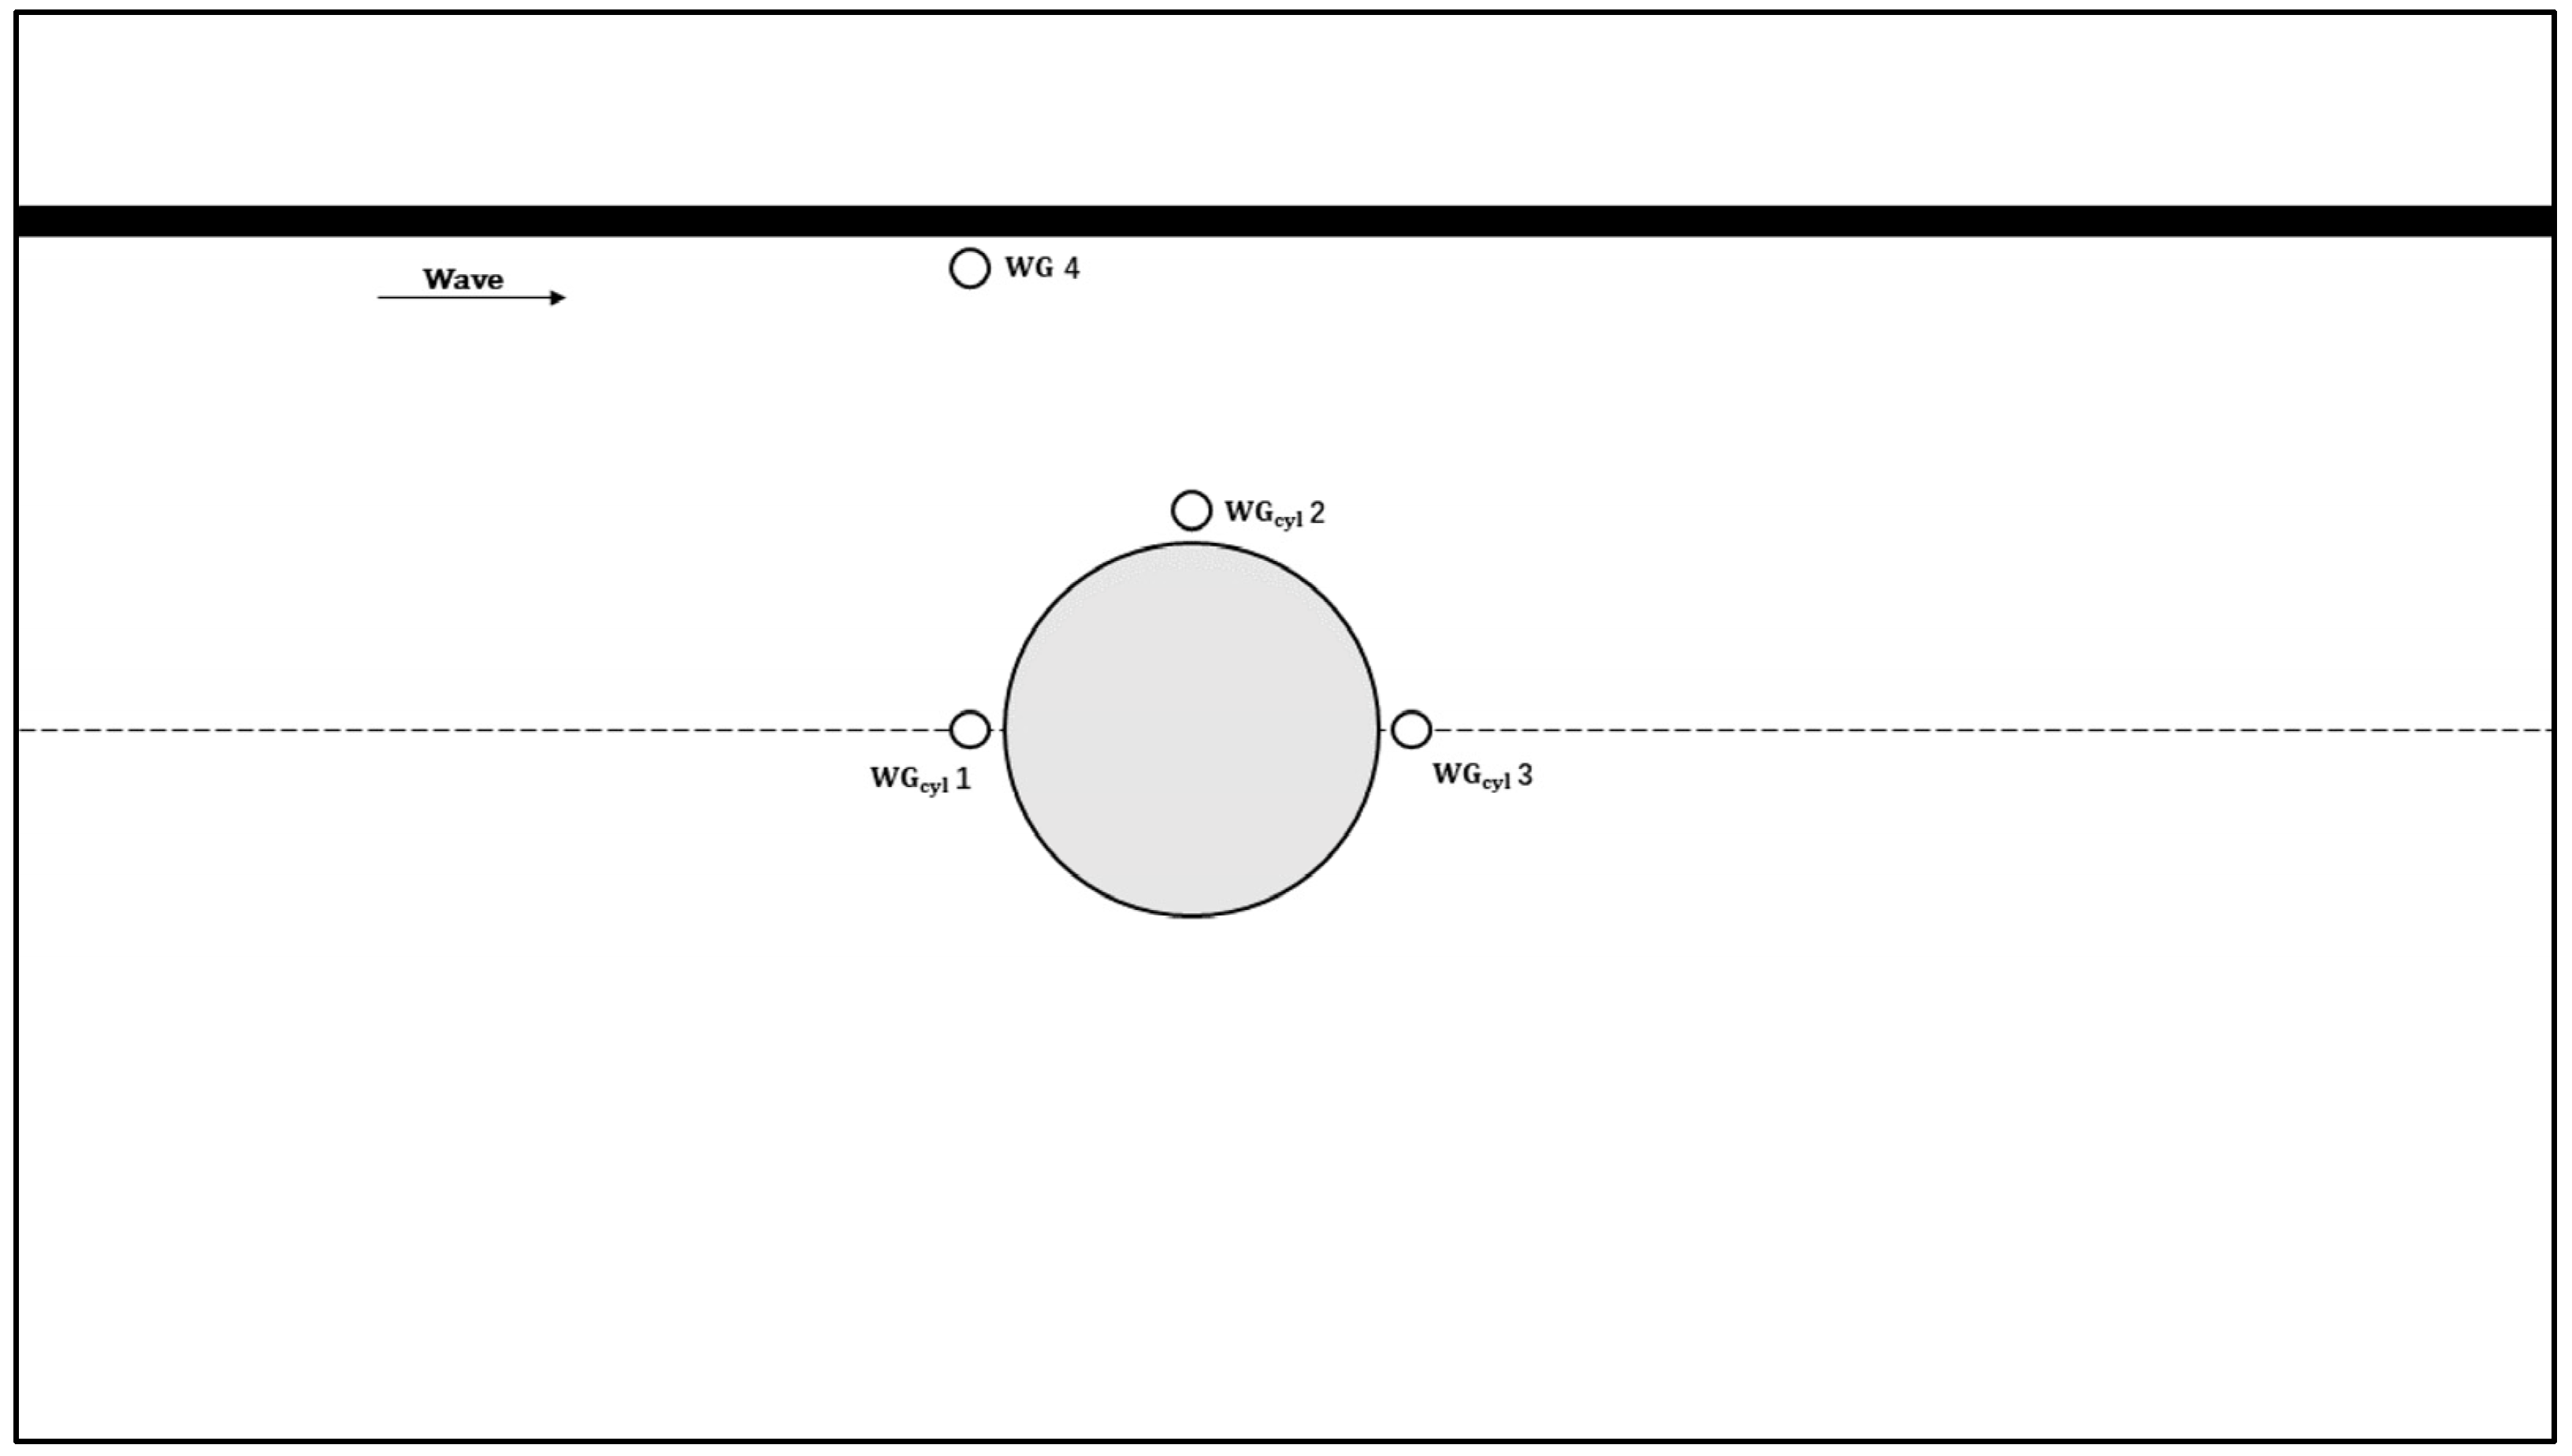
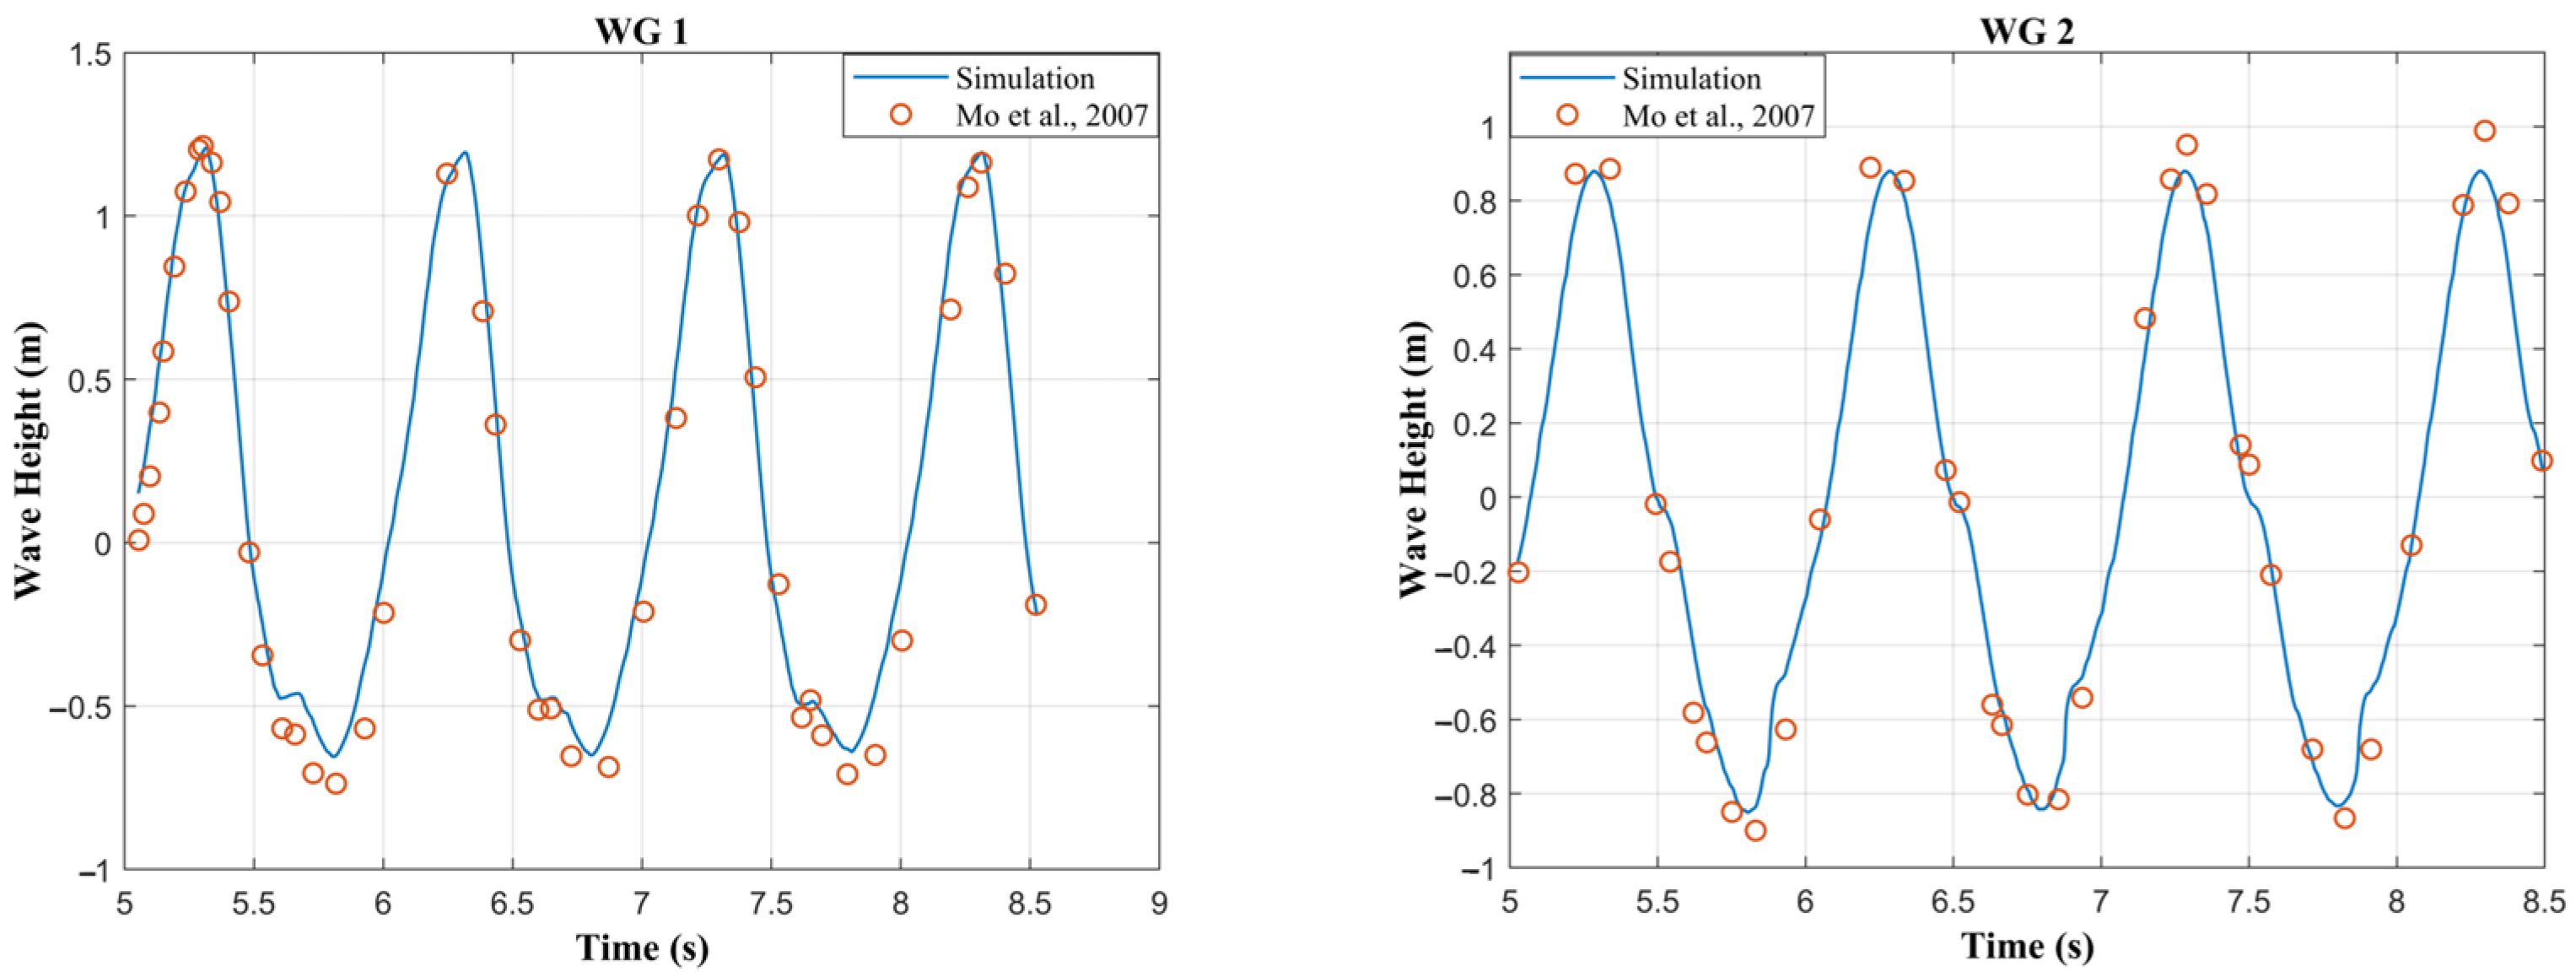
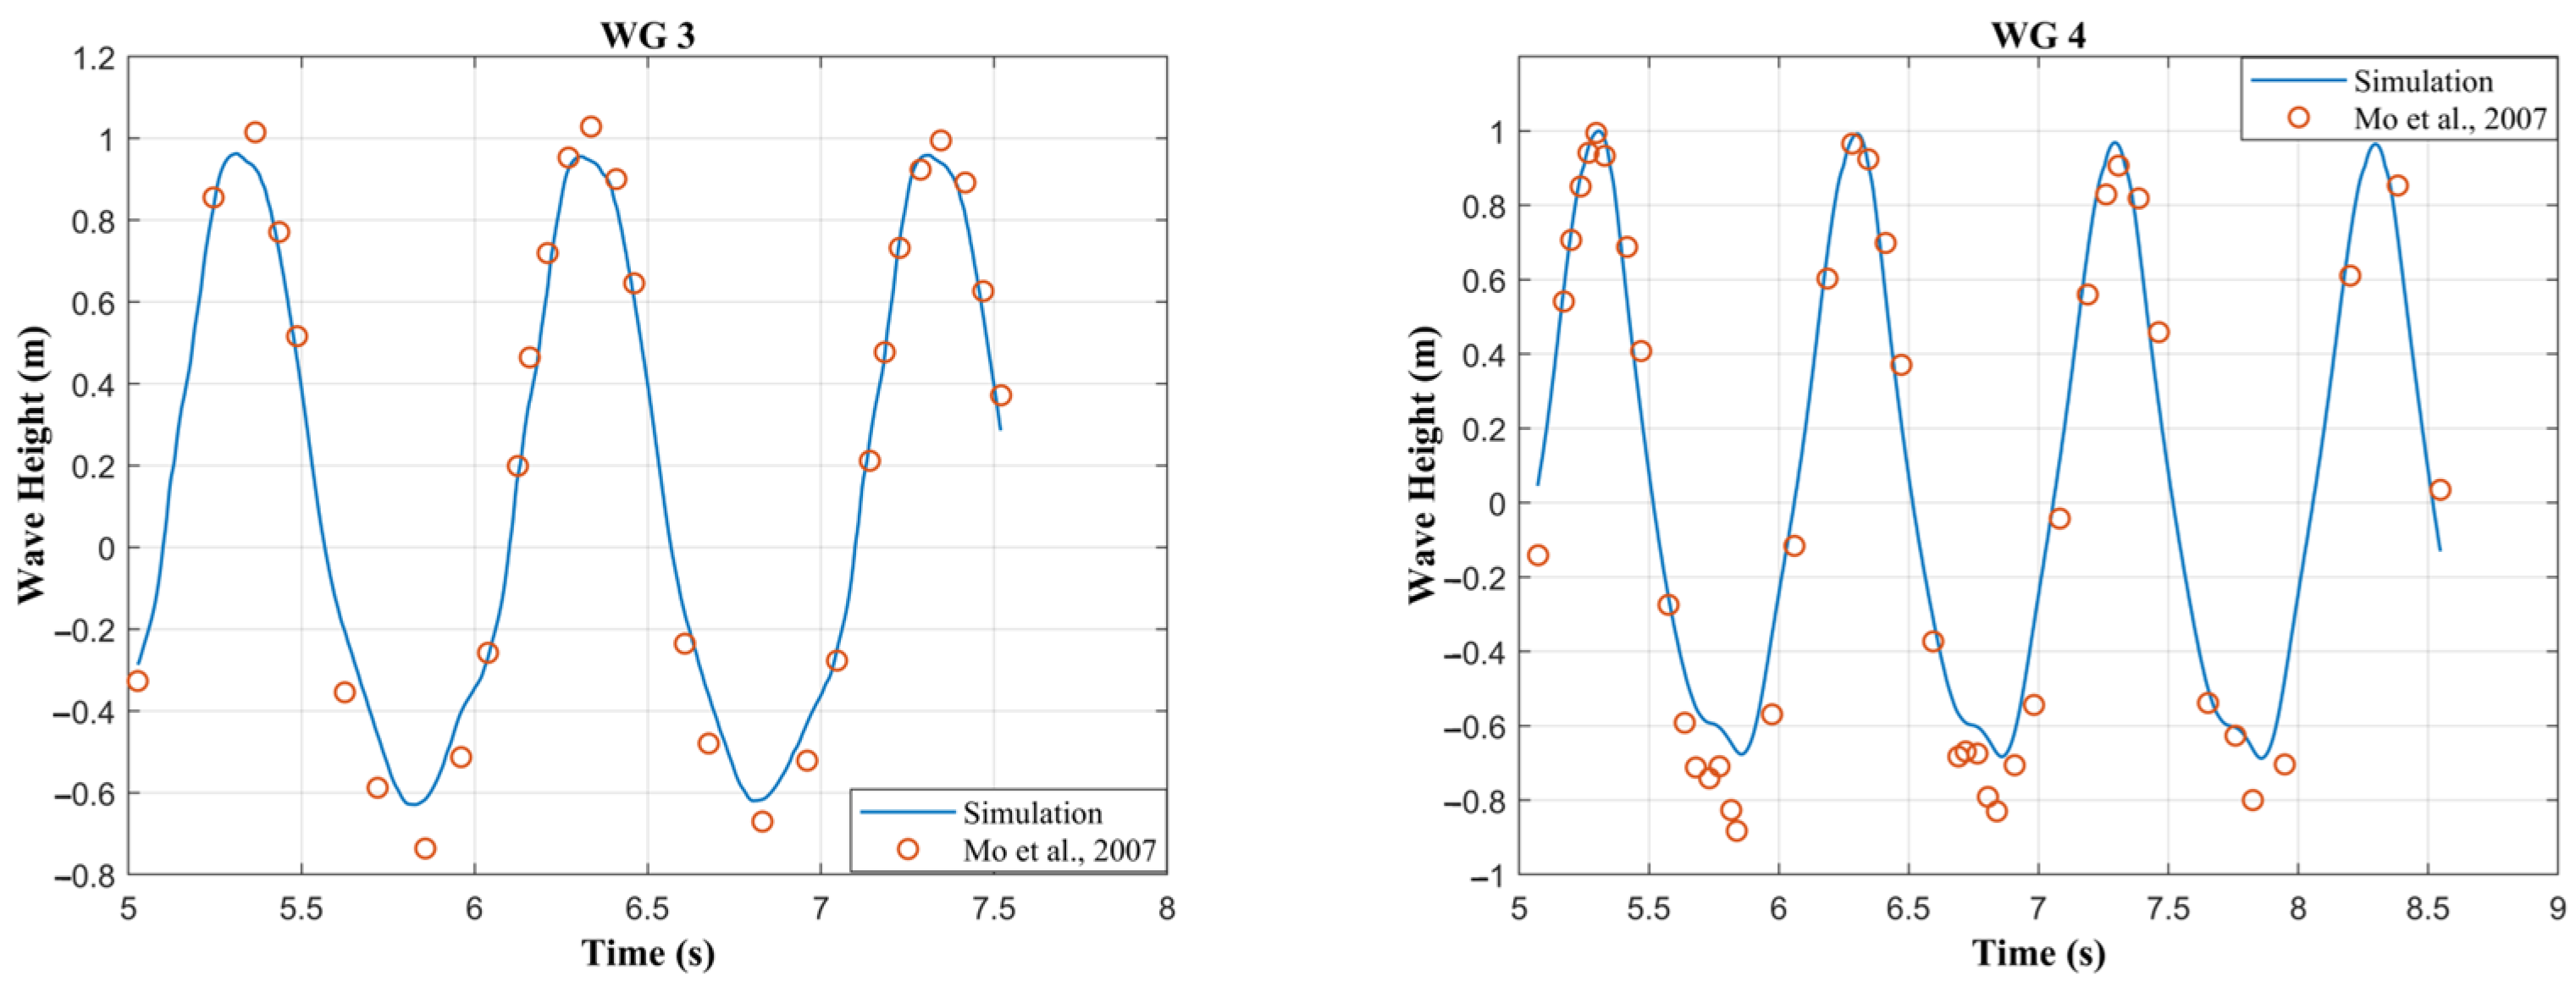
4.3. The Impact of the Monopile Foundation on the Wave Propagation

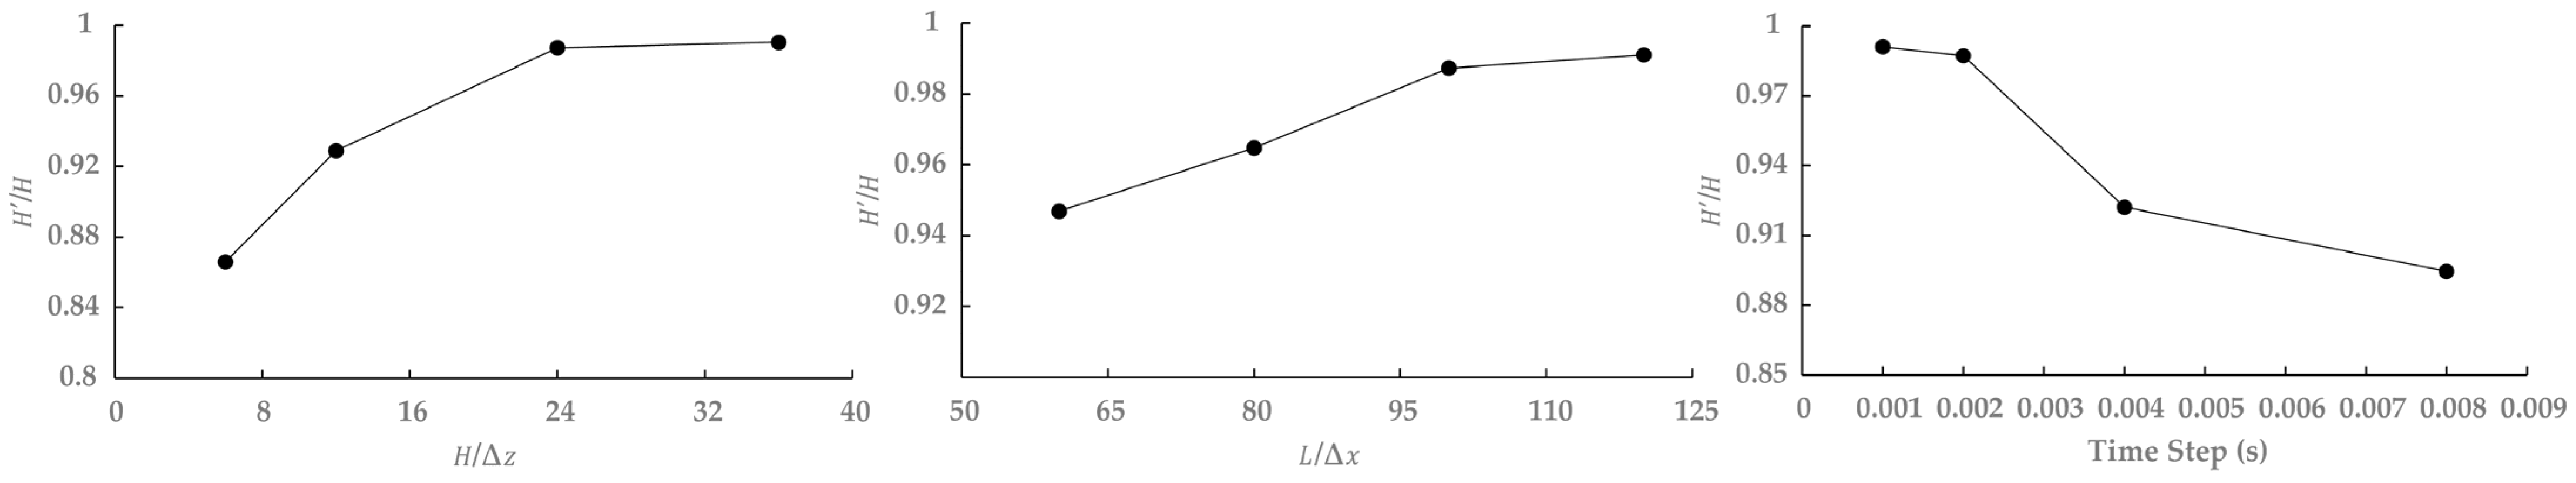
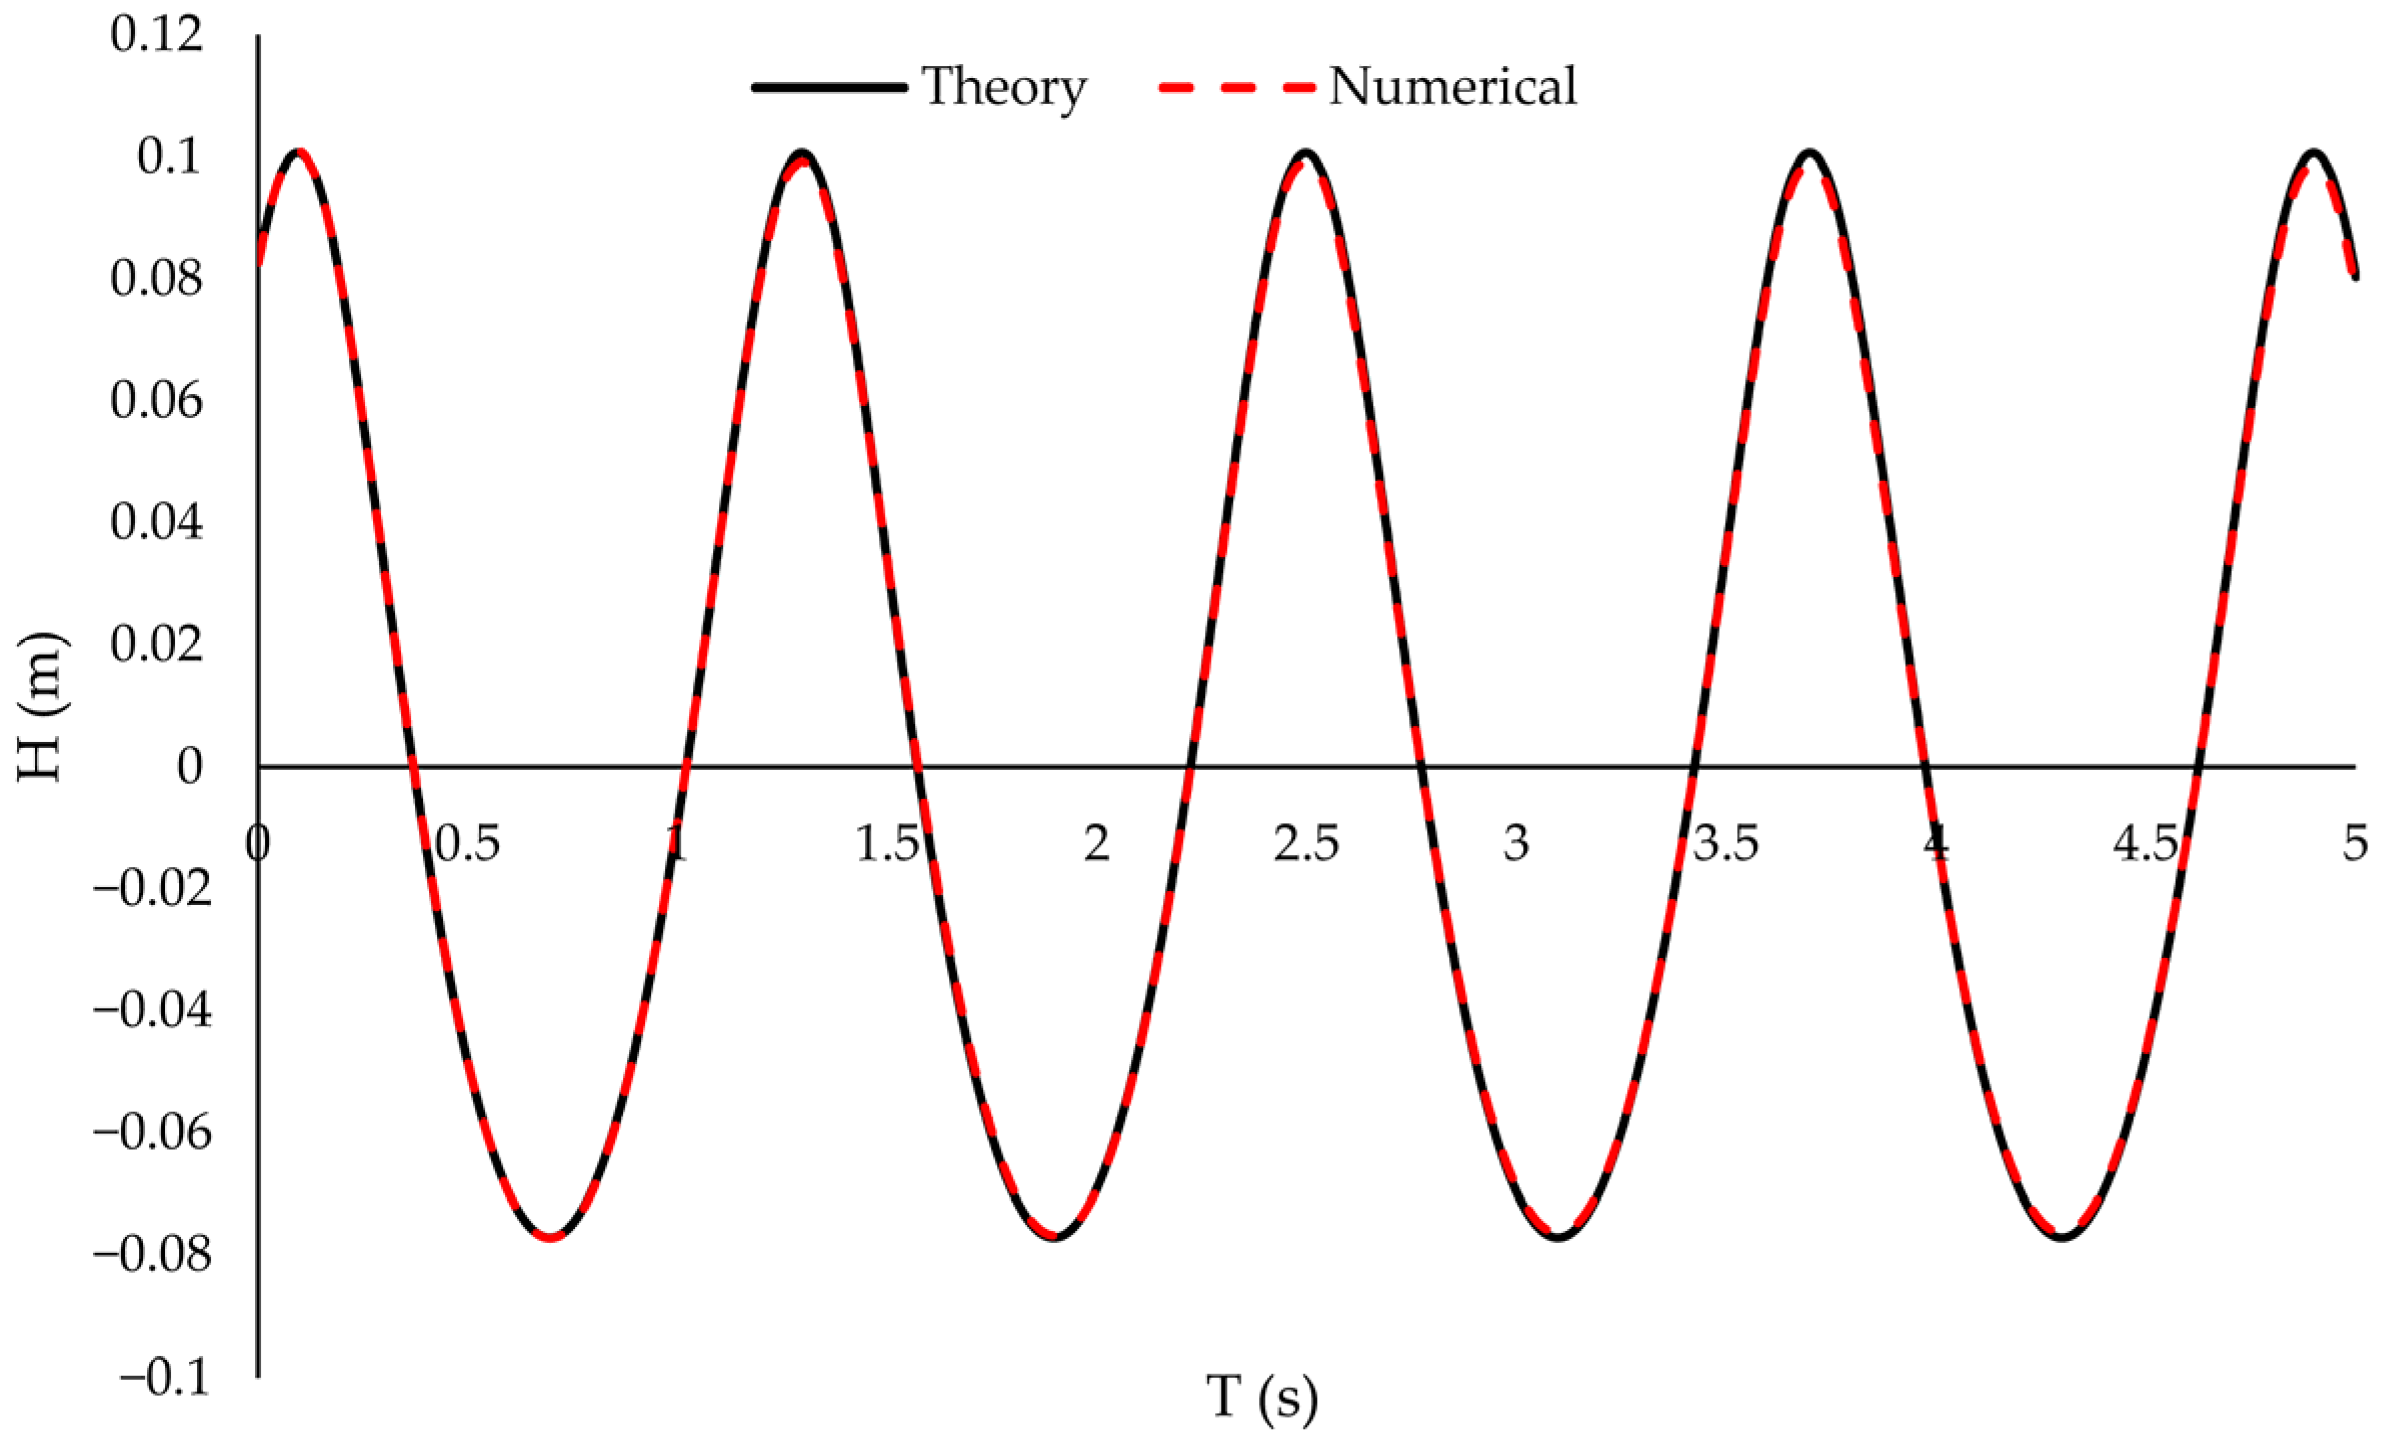
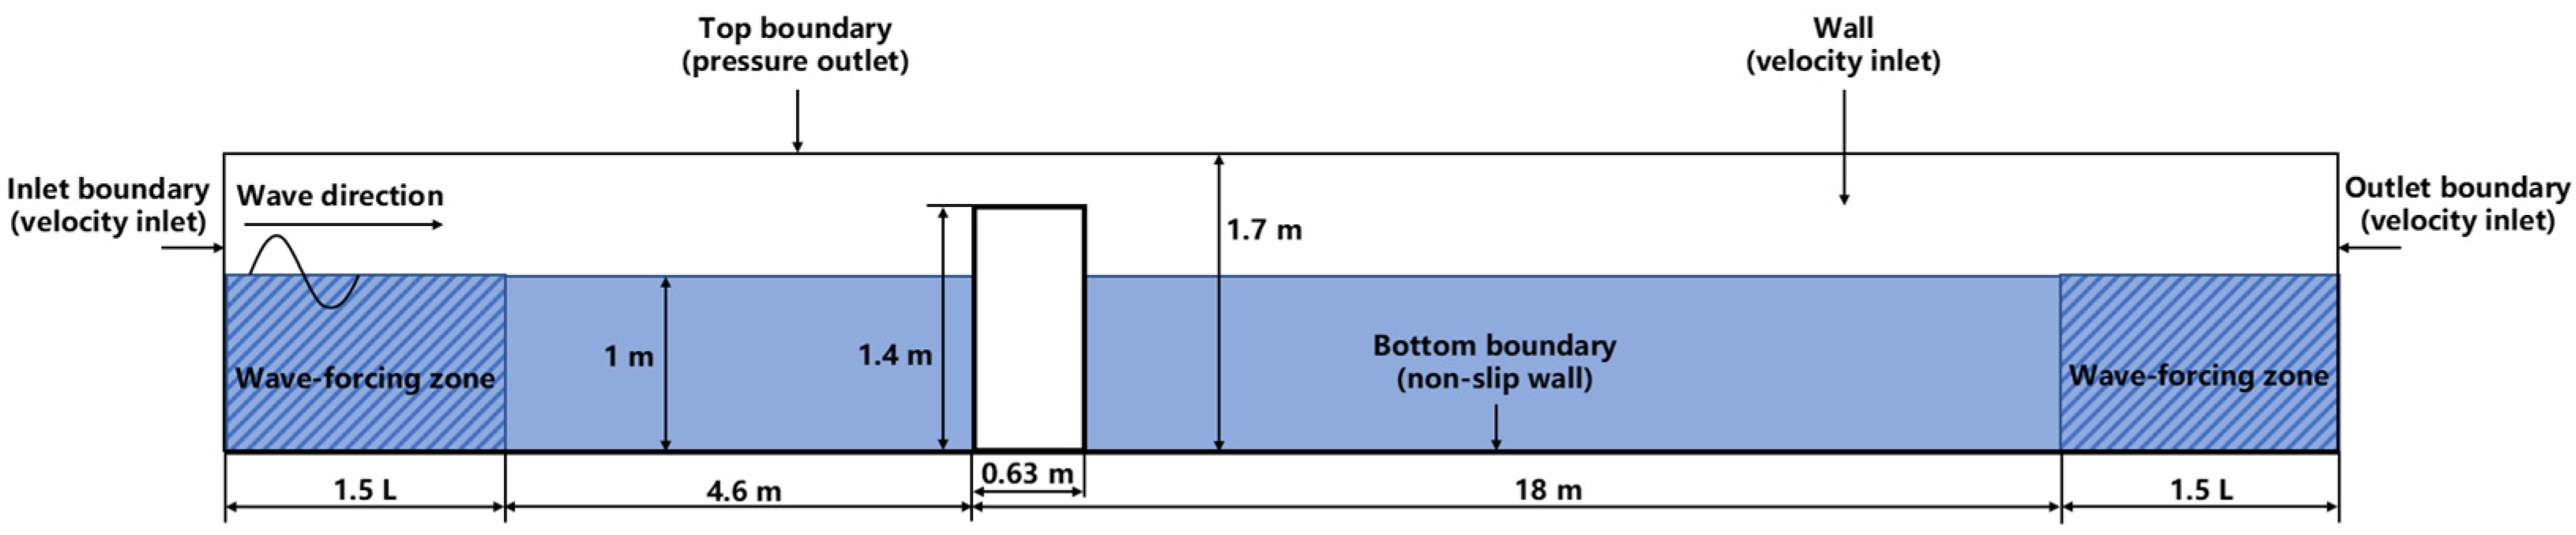
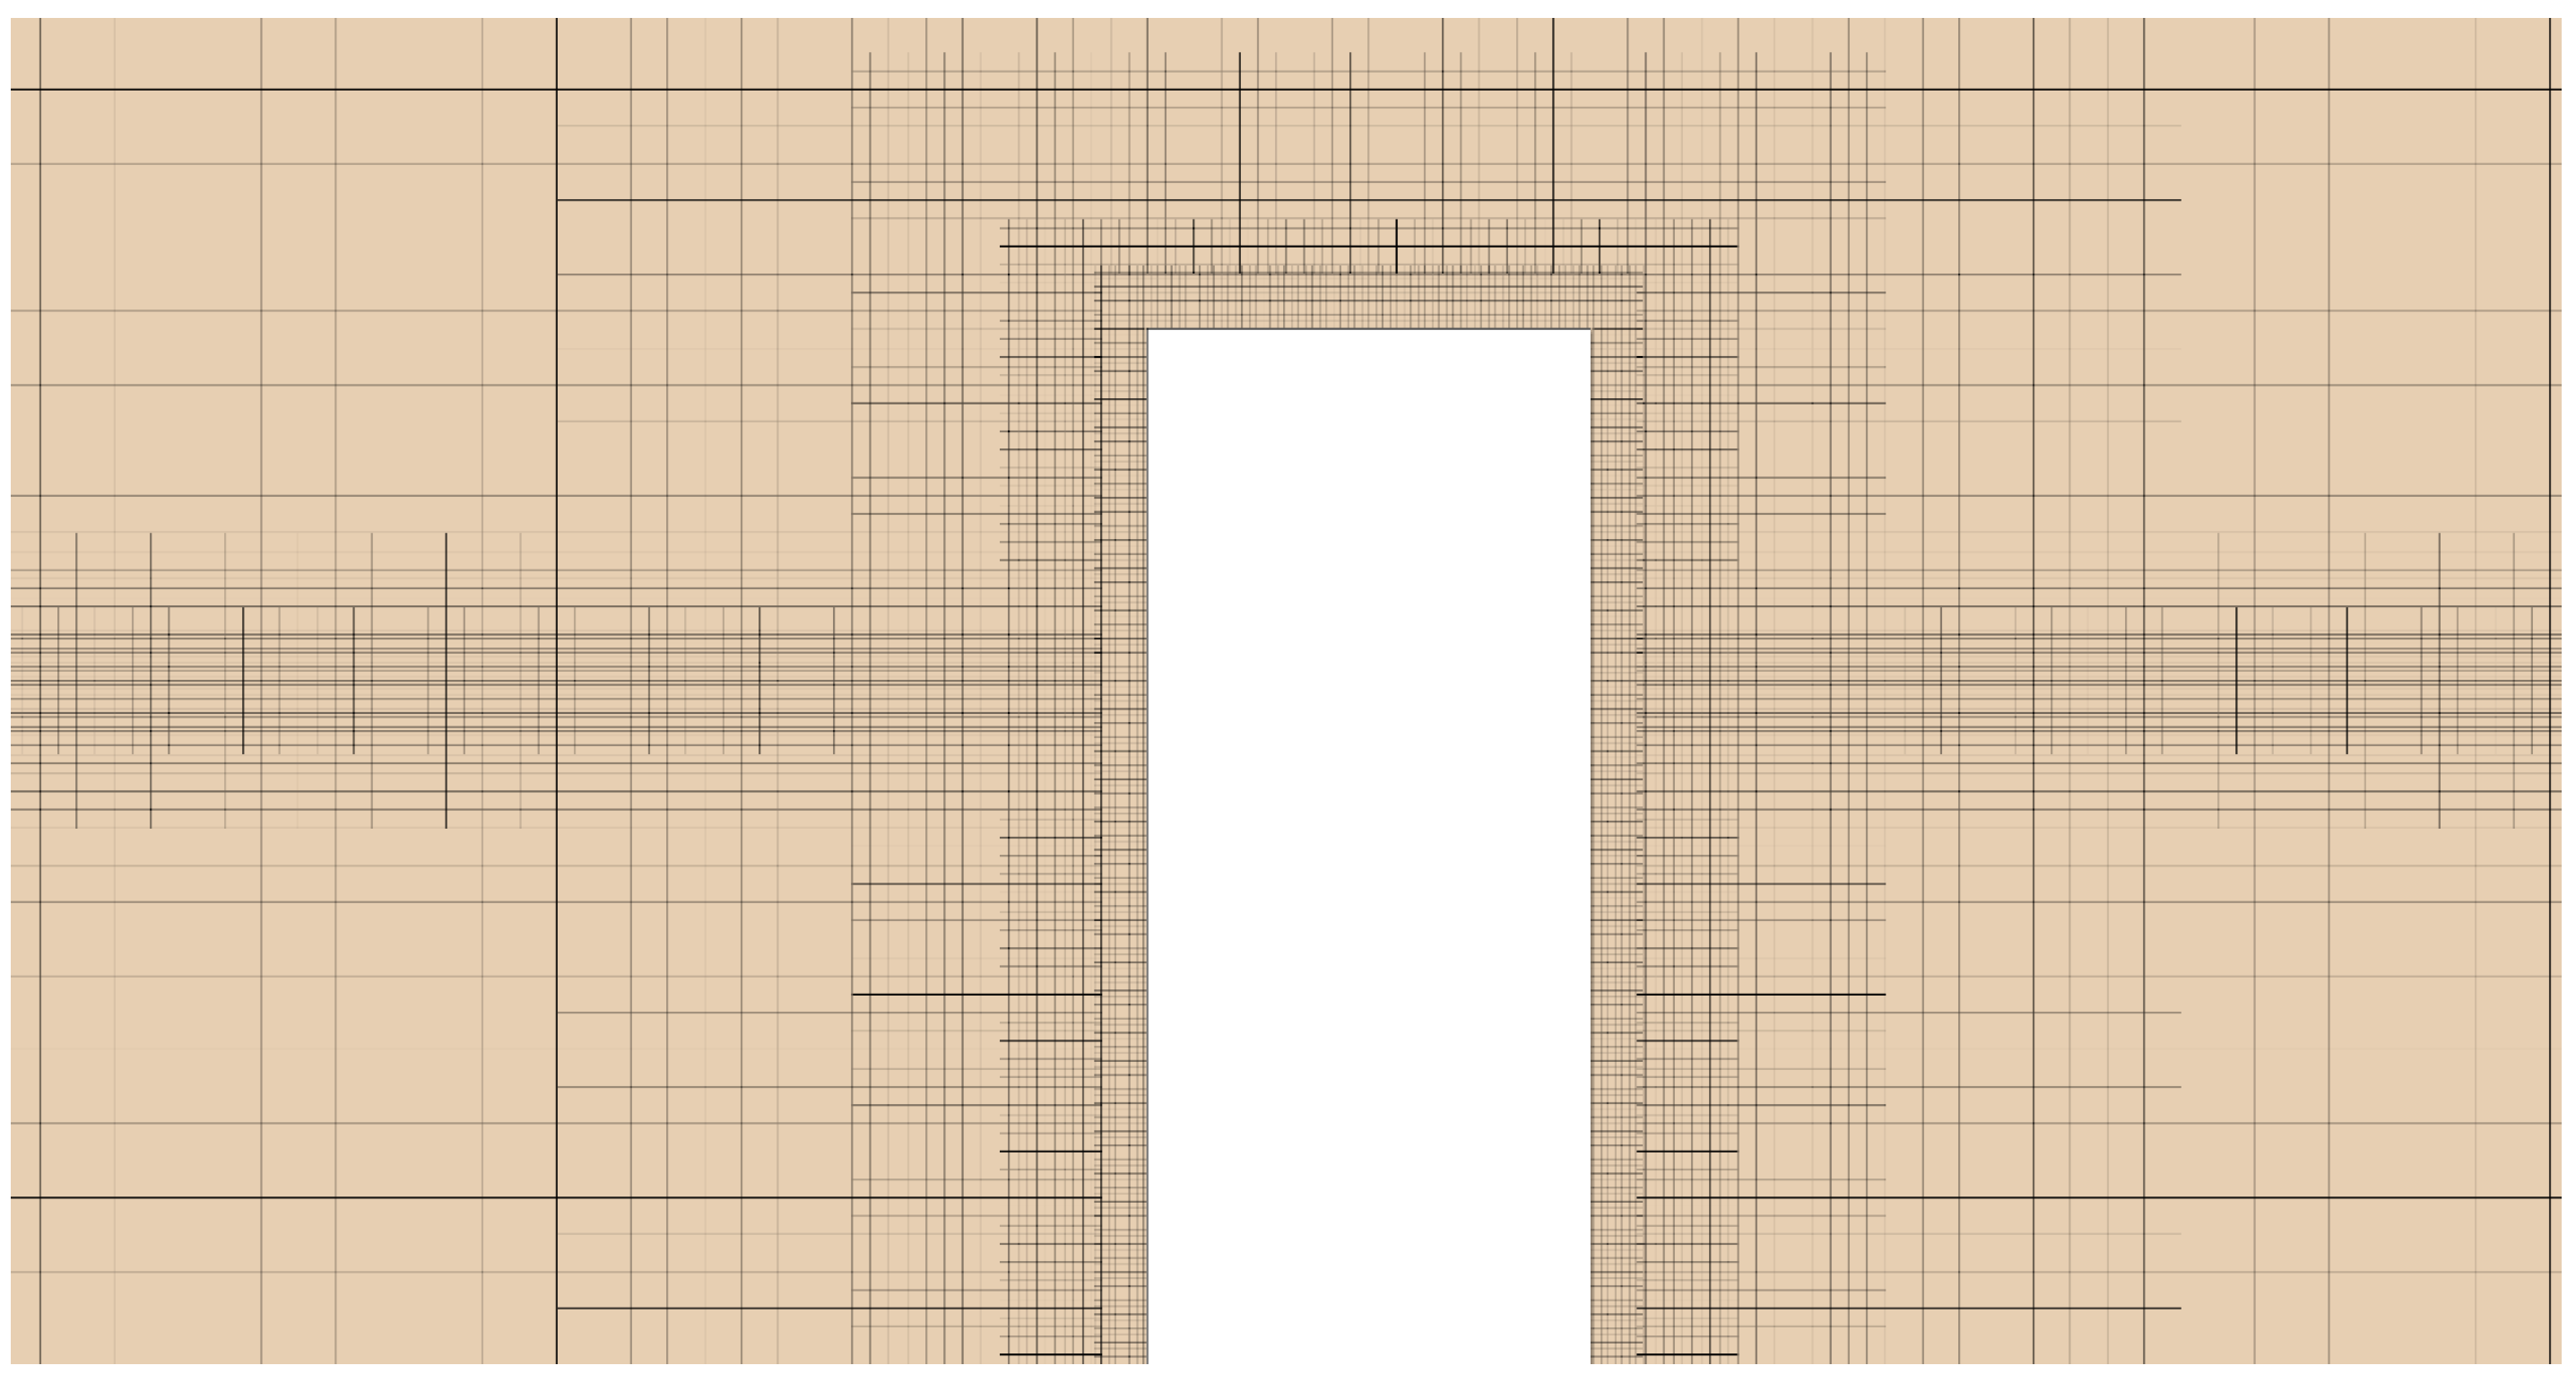
In this section, we examined how the presence of the wind turbine monopile foundation influenced the wave propagation and, consequently, the mooring line tensions of the raft aquaculture system. Detailed validation of the numerical flume model against the experiment by Mo et al. [49] is provided in Appendix A, which confirmed that our simulation setup reliably captured key wave–structure interactions.
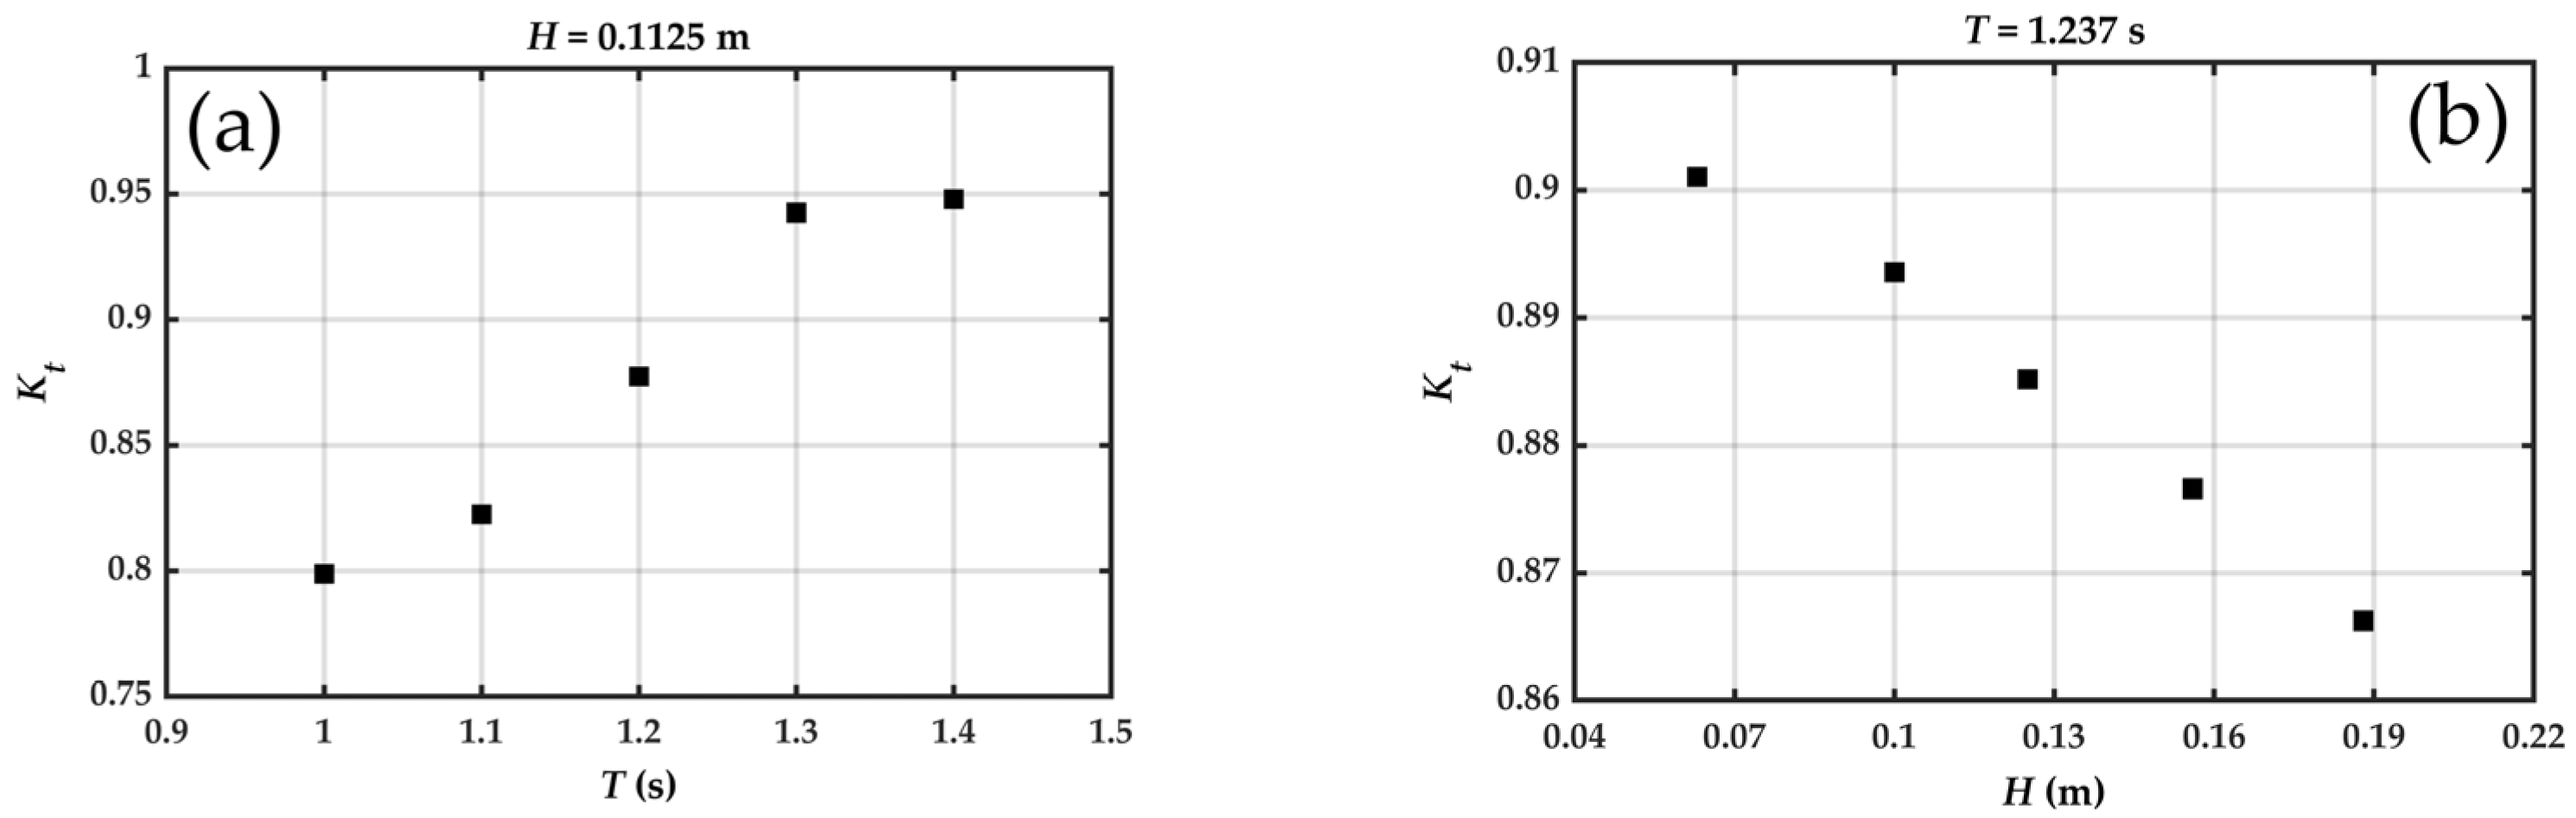
The numerical results are shown in Table 3. The transmission coefficient ( K t = H t / H i ) is an important coefficient used to reflect the wave attenuation performance of the monopile. In Cases 1–5, K t decreased with the increase in D / L and K t was greater than 0.799. When D / L   > 0.2, the diffraction effects of waves start to become significant [50]. In the design of a breakwater, D / L   > 0.25 is considered as a reference to be able to effectively resist waves [44]. This rule coincides with our results. The presence of the monopile helped to reduce the wave height in the transmitted region. This study concentrates on the K t . As shown in Figure 19, it can be seen that K t increased with increasing wave period and decreased with increasing wave height.
Figure 20 shows the relationship between the reduction in the mooring line tension Δ F ( Δ F = F S N F S P ) and the attenuation coefficient K a   ( K a = 1 K t ). For Cases 1–5, when K a   < 0.07 ( D / L   < 0.25), Δ F could not be used as a reference for the change in the mooring line tension because the monopile was not a means of wave attenuation in this condition. Δ F increased initially from 0.12 to 0.18 of K a and decreased from 0.18 to 0.2 of K a . For Cases 6–10, Δ F increased initially from 0.1 to 0.11 of K a and decreased from 0.11 to 0.13 of K a . Consequently, the response of Δ F to K a was more sensitive to the wave height compared with the wave period, which suggests that when the wave period was constant, the wave height condition was more restrictive to maintain a high Δ F . As shown in Figure 20, when K a ranged from 0.11 to 0.20, the monopile could effectively reduce the mooring line tension of the PRAF.
Therefore, the numerical results corroborate the experimental finding that the mooring line tensions were reduced in the presence of the wind turbine monopile. For instance, under moderate wave steepness (H/L = 0.03), we observed an up to 40–50% tension reduction on the mooring lines behind the monopile compared with no monopile. This reduction can be explained by Figure 21: (i) wave diffraction around the monopile edges, where we can see a downstream “shadow zone” with lower wave amplitude, and (ii) partial reflection and turbulence-induced dissipation near the monopile surface, where high waves were formed in front of the monopile due to the superposition of reflected and incident waves. As the wave steepness increased, the local flow separation and vortex shedding enhanced these dissipation effects, which further decreased the transmitted wave energy. This wave energy reduction was particularly beneficial for the multi-row raft arrangements. The rafts located behind the monopile were subjected to smaller wave heights, which experienced reduced hydrodynamic loading and lower peak tensions in the mooring system. Combined with the physical experiments on the single-row and three-row raft systems, the numerical analysis confirmed that strategically placing a monopile upstream could serve as a mini-breakwater, which shielded the aquaculture rafts from fully developed waves. As the wave energy was partially blocked or scattered, the inner and rear rows experienced reduced the hydrodynamic loads and consequently lowered the mooring line tensions. Thus, if multiple rows of PRAFs are placed behind a monopile, the wave field will first undergo diffraction at the pile, then interact with the leading PRAF row, further attenuating the wave energy for the subsequent rows. The second or third rafts will experience a significantly reduced disturbance, lowering both the motion amplitude of the rafts and the peak loads on the mooring line. These mechanisms are crucial for optimizing large-scale aquaculture system configurations in wind farm areas, contributing to both the economic efficiency and structural safety considerations.

4.4. The Impact of the PRAF on the Wave Force Acting on the Monopile Foundation and the Surrounding Wave Field

In actual offshore wind farms, a monopile is subjected to multiple simultaneous loads, including those from wind, waves, and currents. However, this study specifically focused on the interaction between the monopile and the PRAF within the integrated structure. When the monopile foundation was used as the anchorage point for the PRAF, the influence of the PRAF on the monopile force was mainly reflected in two aspects: one was the mooring line tension, as the PRAF exerted a direct tension on the monopile foundation, and the magnitude of this part of the force had already been measured by the model flume test; the second was the additional hydrodynamic loading on the monopile foundation from reflected waves generated by the PRAF. To study the mechanism underlying these interactions, we conducted a comparative analysis of the forces that acted on the monopile foundation in two scenarios: “with PRAF” and “without PRAF”. This approach enabled us to quantify the extent to which the PRAF influenced the wave loads on the monopile foundation. Through this comparative study, we aimed to provide a comprehensive assessment of the additional effects associated with the deployment of the PRAF around the monopile foundation.
As shown in Table 4, the deployment of the single-row PRAF behind the monopile foundation resulted in a reduction in the wave forces that acted on the monopile. Specifically, the forces decreased by 8.75%, 1.59%, and 1.35% for the incident wave period of 1.237 s and wave heights of 0.063 m, 0.125 m, and 0.188 m, respectively. However, when the three-row PRAFs were deployed, an increase in the wave forces on the monopile foundation was observed, with increases of 3.77%, 1.00%, and 2.46% corresponding to the same wave conditions. These findings indicate that the influence of the PRAF on the wave force experienced by the monopile foundation was relatively minimal.
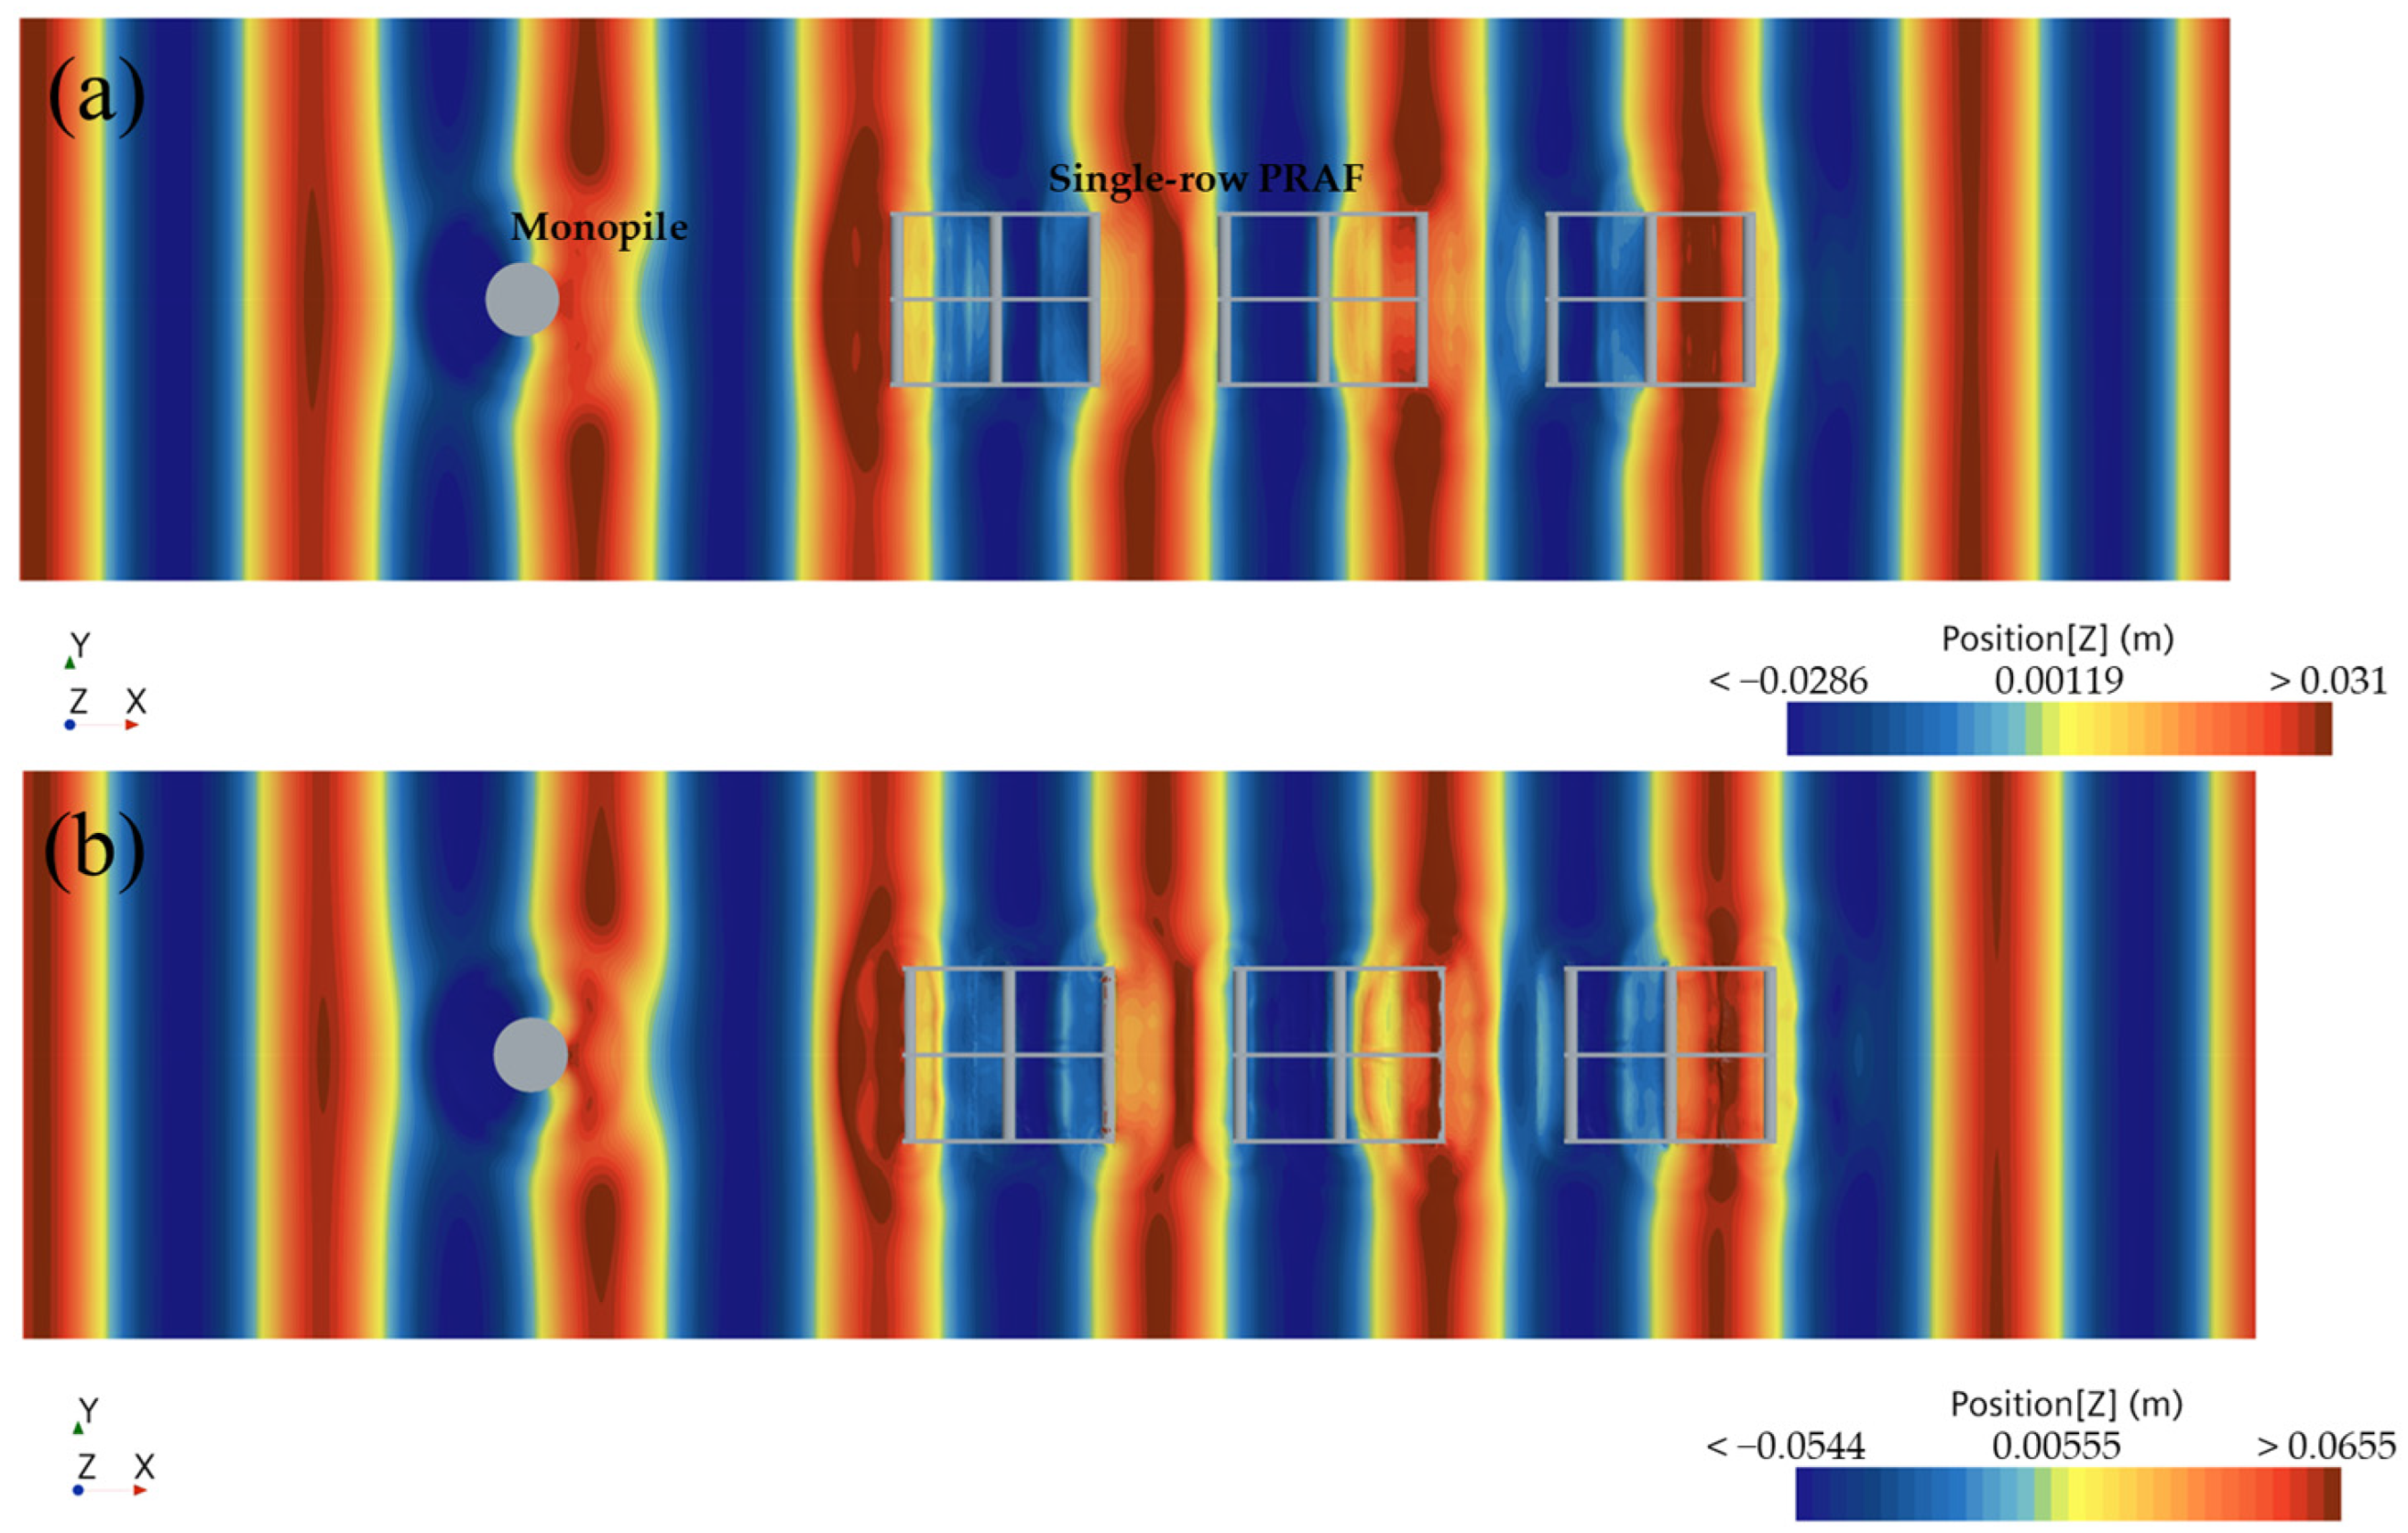
Figure 22 shows the effects of the monopile foundation and single-row PRAF on the wave dynamics. As the waves propagated, there were obvious diffraction and reflection phenomena that occurred around the monopile foundation and the PRAF, which resulted in corresponding changes in the distribution of wave heights in both the upwind and downwind areas that surrounded these structures. It can be observed that the wave height behind the monopile foundation was weakened, which formed a localized wave shadow area, which showed a typical diffraction phenomenon. The PRAF that was positioned downstream of the monopile foundation exhibited a significant distortion in the wave color bands in its vicinity. This indicates that the reflected waves from the PRAF were superimposed with the waves diffracted by the monopile foundation, which led to a wave interference phenomenon. Additionally, as the wave height increased, the expansion of the wave color band areas that surrounded both the monopile foundation and the PRAF became increasingly pronounced, which signified an enhancement in the disturbance intensity of the wave field caused by these structures. As presented in Table 4, the wave height H P 1 in front of the pile was significantly larger than the incident wave height, and the wave run-up increased as the incident wave height rose. Due to wave diffraction, the wave height H P 2 along the side of the monopile experienced only slight variations, whereas the wave height H P 3 behind the pile decreased. These numerical results support the observations made in Figure 21. When comparing the scenario in which only the monopile was present to the case that included the PRAF, it is evident that the presence of the PRAF slightly reduced H P 1 while it increased both H P 2 and H P 3 . And the PRAF further changed the wave propagation characteristics behind the pile, which made the distribution of the wave field around the pile more complicated. Therefore, the PRAF had a certain weakening or redistribution effect on the local wave field, although this effect caused only a slight change in the wave height.
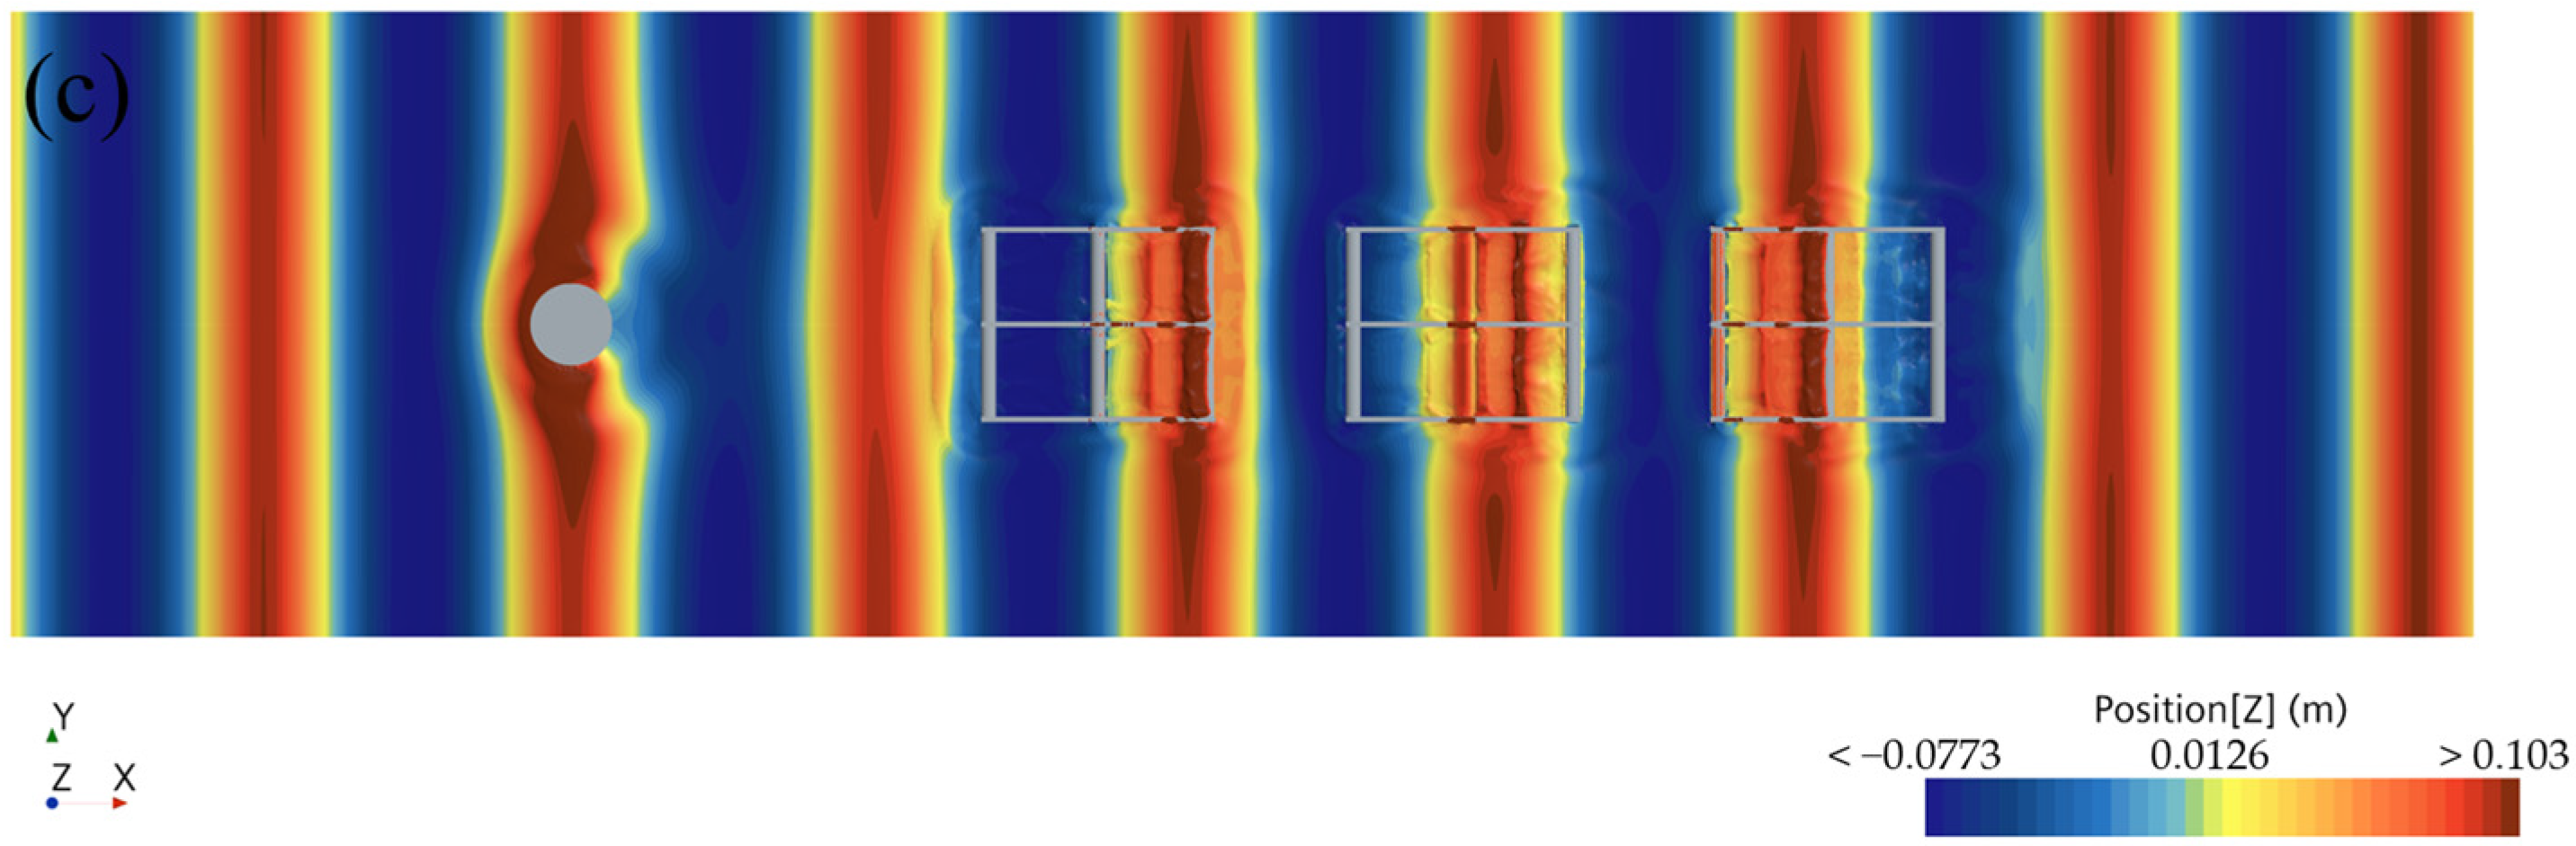
Figure 23 illustrates the impacts of the monopile foundation and the three-row pontoon raft aquaculture facilities (PRAFs) on the wave dynamics. The variations in wave heights depicted in this figure reveal that both the monopile foundation and the three-row PRAFs created distinct sheltered areas within the overall wave field. Compared with the single-row PRAF, the three-row configuration exhibited more pronounced reflection and diffraction phenomena, which affected a larger area of the wave field. Notably, the wave heights in the regions between the rafts showed a regular ripple-like distribution. As the wave height increased, the fluid–structure coupling effects became more pronounced, which led to an increase in local wave heights due to enhanced reflection and diffraction. However, the presence of the three-row PRAFs exerted only a minimal effect on the wave heights around the monopile foundation itself.

5. Conclusions

In this study, we investigated the hydrodynamic performance of a PRAF placed around a wind farm monopile under different wave conditions. Our experimental and numerical analyses focused on the mooring line and bridle line tensions, with an additional emphasis on how wave height attenuation impacts these forces. The results yield several key insights that have broader significance for designing and deploying integrated offshore wind–aquaculture systems:
(1)
Influence of wave parameters
The mooring line and bridle line tension of the PRAF consistently decreased with the increasing wave period and increased with increasing wave height. This finding underscores the critical role of wave steepness (H/L) in determining the magnitude of the hydrodynamic forces. By highlighting specific wave conditions, particularly within the range of 0.02 to 0.09 of H/L, this study helps designers anticipate and manage peak loads more effectively.
(2)
Effects of the wind farm monopile
Both the experimental and computational results demonstrate a significant sheltering effect behind the monopile. Part of the incoming wave energy was reflected or dissipated at the front side of the monopile, which decreased the wave energy available in the downstream region. The presence of a wind monopile significantly impacted both the mooring line tension and the bridle line tension for the PRAF. The mooring line tension was reduced, and the reduction ratio decreased when the wave steepness increased, where it ranged from 16% to 66%. Furthermore, there was an increase in the bridle line tension on the upstream component, with a decrease in the bridle line tension on the downstream component.
(3)
Significance for multi-row PRAF configurations
The results from the single-row and multi-row PRAF arrangements highlight a clear attenuation effect and a more even distribution of hydrodynamic loading in multi-row configurations. This is particularly relevant for large-scale offshore aquaculture operations, where a multi-row layout can enhance the resilience to extreme waves and reduce the peak stresses on individual lines to improve both the safety and long-term durability. Thus, in the future, we have an opportunity to achieve robust structural performance by optimizing the raft layouts, a crucial step for large-scale applications in offshore wind farms.
(4)
Wave height loss of waves passing around the monopile
Wave height attenuation occurred as the waves propagated around the monopile, where the wave height loss ( K a ) ranged from 5% to 20%. It was observed that the monopile’s influence on the wave height diminishes with an increasing wave period. Additionally, a greater wave height corresponded to an increased K a . When K a ranged from 0.11 to 0.20, the presence of the monopile could effectively reduce the mooring line tension of the PRAF. Meanwhile, our results show that using the monopile itself as a mooring point may induce a high-level mooring load, potentially affecting the monopile’s stability and safety. We therefore advise caution and do not recommend directly attaching the PRAF mooring lines to the monopile in practical applications.
(5)
Influence of the PRAF on the force on the monopile foundation
The numerical simulation results show that a single-row PRAF deployed behind the monopile could reduce the wave forces on the foundation by up to 8.75% for certain conditions, while the three-row PRAF setups produced minor increases in forces (up to 4%). Overall, the impact on the monopile wave forces remained minimal, indicating the viability of rationally deploying PRAFs in offshore wind farms.
In conclusion, these research findings provide valuable insights into the co-location of offshore wind and aquaculture systems. By placing PRAFs near a wind monopile, existing infrastructure can be effectively utilized, thus conserving marine space and mitigating hydrodynamic loads. Nevertheless, due to the inherent complexity of marine environments, this study primarily examined wave-induced responses. A more comprehensive investigation of wind, combined wave–current, and combined wind–wave effects remains an important avenue for future work. Moreover, the geometric dimensions of the monopile and the configuration of aquaculture facilities have a significant influence on the force distribution and motion behavior. Consequently, subsequent investigations should extend to multiple environmental loading scenarios and conduct deeper analyses of monopile geometry and aquaculture layout. From a modeling perspective, developing refined hydrodynamic and structural coupling models for PRAFs in offshore wind farms will optimize the facility design under a wider range of sea states, ensuring both structural stability and operational efficiency. Advancing these research directions will further support the sustainable development of offshore wind–aquaculture integration.

Author Contributions

Conceptualization, X.W. and Y.T.; methodology, D.C. and X.W.; software, M.L. and D.C.; validation, X.W. and D.C.; formal analysis, D.C.; investigation, D.C., J.Z., F.Z., X.W. and Q.L.; resources, Y.T.; data curation, D.C. and X.W.; writing—original draft preparation, D.C.; writing—review and editing, X.W.; visualization, F.Z. and X.W.; supervision, X.W. and M.Y.; project administration, Y.T.; funding acquisition, Y.T. and D.K. All authors have read and agreed to the published version of the manuscript.

Funding

This research was mainly funded by the China Three Gorges Renewable (Group) Co., Ltd., No. 37022078, and partially supported by the JSPS Grants-in-Aid for Scientific Research No. 23H01619.

Data Availability Statement

The code for the data analysis is available upon request from the authors.

Acknowledgments

The authors would like to express gratitude to J. Han from the Yokohama National University for the water tank experiment assistance.

Conflicts of Interest

The authors declare that this study received funding from China Three Gorges Renewable (Group) Co., Ltd. The funder was not involved in the study design, collection, analysis, interpretation of data, the writing of this article or the decision to submit it for publication.

Abbreviation

Nomenclature
AbbreviationDefinition
PRAFPontoon raft aquaculture facilityPVCPolyvinyl Chloride
CFDComputational fluid dynamicsWGWave gauge
Flume tank tests
TWave period, sDMonopile diameter, m
HWave height, m H s Significant wave height, m
LWave length, m
Wave loads on single-row PRAF
FTension, kN F S B 1 Maximum bridle line tension for the position 1 in a single-row PRAF, kN
Δ F The reduction in tension, kN
( Δ F = F S N F S P )
F S B 2 Maximum bridle line tension for the position 2 in a single-row PRAF, kN
F S N Maximum mooring line tension without a monopile, kN F S B 3 Maximum bridle line tension for the position 3 in a single-row PRAF, kN
F S P Maximum mooring line tension with a monopile, kN F S B 4 Maximum bridle line tension for the position 4 in a single-row PRAF, kN
Wave loads on multi-row PRAFs
F T O Maximum mooring line tension for the outer raft facility in three-row PRAFs, kN F T B 2 Maximum bridle line tension for the position 2 in three-row PRAFs, kN
F T I Maximum mooring line tension for the inner raft facility in three-row PRAFs, kN F T B 3 Maximum bridle line tension for the position 3 in three-row PRAF, kN
F T B 1 Maximum bridle line tension for the position 1 in three-row PRAF, kN F T B 4 Maximum bridle line tension for the position 4 in three-row PRAF, kN
Wave attenuation
H i The incident wave height, m K t Transmission coefficient ( K t   =   H t / H i )
H t The transmitted wave height, m K a Attenuation coefficient ( K a = 1 − K t )

Appendix A. Validation of the Numerical Flume Model

Appendix A.1. Experimental Setup

To verify the accuracy of the numerical flume model with a wind monopile foundation, we compared the numerical results with the experimental data reported by Mo et al. [49] due to the lack of corresponding experimental data for direct validation. The experimental flume used in Mo’s study had a length of 60 m, a width of 5 m, and a depth of 7 m. A steel circular cylinder with a diameter of 0.7 m was placed in the flume to simulate the monopile structure. The experimental conditions selected for the comparison were a depth h = 4.76   m , a wave period T = 4.0   s , and a wave height H = 1.2   m . These conditions were applied to the numerical model to ensure a consistent basis for comparison.

Appendix A.2. Numerical Model Setup

As shown in Figure A1, the numerical flume model was configured to replicate the experimental setup as described in Mo et al. [49]. The model included the same geometric parameters for the flume and monopile structure. The boundary conditions were set to replicate the experimental wave conditions, and the same wave generation and absorption techniques were applied. The numerical simulation was conducted using a fully coupled wave–structure interaction approach, with the governing equations solved using the Reynolds-averaged Navier–Stokes (RANS) method and the SST k-ω turbulence model. Mesh refinement was applied near the monopile to improve the accuracy of the wave elevation results.
Figure A1. Schematic diagram of four wave-gauge locations around a cylinder in the experiment by Mo et al. (2007) [49].
Jmse 13 00809 g0a1

Appendix A.3. Validation Results

The comparison between the numerical simulation results and the experimental data is presented in Figure A2. The results indicate that the error ranges of the simulation wave heights for WG1 to WG4 were 3.66%, 5.44%, 6.72%, and 8.93%, respectively. The numerical model accurately captured the key hydrodynamic features observed in the experimental study. The wave trough elevations predicted by the numerical model aligned closely with those recorded in the experimental results, indicating that the model successfully reproduced the wave profile around the monopile structure. The successful validation against experimental data from Mo et al. [49] demonstrates that the numerical flume model is applicable for further simulations involving wind farm monopile foundation. The results provide confidence in the accuracy of the numerical predictions presented in the main text.
Figure A2. Comparison of numerical results with experimental results by Mo et al. (2007) [49].
Jmse 13 00809 g0a2aJmse 13 00809 g0a2b

Appendix B. The Mesh Sensitivity Analysis

Appendix B.1. Test Setup

A grid sensitivity analysis of the numerical flume was carried out by varying the grid parameters and time step at the encryption of the free surface to determine the optimal grid settings. Case 10 (H = 0.1781 m) was chosen as the incident wave parameter for the grid sensitivity analysis test, and the ratio of the actual wave height (H’) to the theoretical wave height (H) was used as a measure of the grid sensitivity in the test. The grid parameters used for the sensitivity analysis are shown in Table A1, with the number of grids in each wave height range (H/∆z) versus the number of grids in each wavelength range (L/∆x) and time step as the variables, where ∆z denotes the minimum grid size in the vertical direction and ∆x denotes the minimum grid size in the horizontal direction.
Table A1. The grid parameters used for the sensitivity analysis.
MeshH/∆zL/∆xTime Step (s)
161000.002
212
324
436
52460
680
7100
8120
9241000.001
100.002
110.004
120.008

Appendix B.2. Test Results

The analysis results are shown in Figure A3 and Figure A4. It can be seen that with the increase in H/∆z, the numerical wave height became closer to the theoretical wave height. When H/∆z > 24, the numerical wave height became stable. Similarly, L/∆x and the time step reached stability when reaching 100 and 0.002 s, respectively. Therefore, H/∆z = 24 and L/∆x = 100 were chosen as the mesh parameters, along with the time step of 0.002 s for subsequent calculations. As shown in Figure A4, compared with the theoretical values, the wave elevation of the numerical simulation was less than 1.1%. The chosen numerical model, mesh size, and time step were very accurate. Therefore, the numerical model could be used to simulate the wave elevation around the monopile.
Figure A3. Mesh sensitivity analysis test: mesh number per wavelength L/Δx, mesh number per wave height H/Δz, and time step.
Jmse 13 00809 g0a3
Figure A4. Comparison of the wave elevation obtained by the numerical simulation with the theoretical values.
Jmse 13 00809 g0a4

References

  1. Yaghubi, E.; Carboni, S.; Snipe, R.M.J.; Shaw, C.S.; Fyfe, J.J.; Smith, C.M.; Kaur, G.; Tan, S.Y.; Hamilton, D.L. Farmed mussels: A nutritive protein source, rich in omega-3 fatty acids, with a low environmental footprint. Nutrients 2021, 13, 1124. [Google Scholar] [CrossRef] [PubMed]
  2. Avdelas, L.; Avdic-Mravlje, E.; Marques, A.C.B.; Cano, S.; Capelle, J.J.; Cozzolino, M.; Dennis, J.; Ellis, T.; Polanco, J.M.F.; Guillen, J.; et al. The decline of mussel aquaculture in the European Union: Causes, economic impacts and opportunities. Rev. Aquac. 2021, 13, 91–118. [Google Scholar] [CrossRef]
  3. Karayücel, S.; Celik, M.Y.; Karayücel, I.; Erik, G. Growth and Production of Raft Cultivated Mediterranean Mussel (Mytilus galloprovincialis Lamarck, 1819) in Sinop, Black Sea. Turk. J. Fish. Aquat. Sci. 2010, 10, 9–17. [Google Scholar] [CrossRef]
  4. Langan, R. Mussel Culture, Open Ocean Innovations. In Sustainable Food Production; Christou, P., Savin, R., Costa-Pierce, B.A., Misztal, I., Whitelaw, C.B.A., Eds.; Springer: New York, NY, USA, 2013. [Google Scholar] [CrossRef]
  5. Maar, M.; Holbach, A.; Boderskov, T.; Thomsen, M.; Buck, B.H.; Kotta, J.; Bruhn, A. Multi-use of offshore wind farms with low-trophic aquaculture can help achieve global sustainability goals. Commun. Earth Environ. 2023, 4, 447. [Google Scholar] [CrossRef]
  6. Buck, B.H. Open Ocean Aquaculture und OffshoreWindparks: Eine Machbarkeitsstudie uber Die multifunktionale Nutzung von Offshore-Windparks und Offshore-Marikultur im Raum Nordsee; Alfred Wegener Institute for Polar and Marine Research: Bremerhaven, Germany, 2002; pp. 136–144. [Google Scholar]
  7. Buck, B.H.; Krause, G.; Rosenthal, H. Extensive open ocean aquaculture development within wind farms in Germany: The prospect of offshore co-management and legal constraints. Ocean Coast. Manag. 2004, 47, 95–122. [Google Scholar] [CrossRef]
  8. Buck, B.H.; Langan, R. Aquaculture Perspective of Multi-Use Sites in the Open Ocean: The Untapped Potential for Marine Resources in the Anthropocene; Springer Nature: Berlin, Germany, 2017. [Google Scholar] [CrossRef]
  9. Alkhabbaz, A.; Hamza, H.; Daabo, A.M.; Yang, H.S.; Yoon, M.; Koprulu, A.; Lee, Y.H. The aero-hydrodynamic interference impact on the NREL 5-MW floating wind turbine experiencing surge motion. Ocean Eng. 2024, 295, 116970. [Google Scholar] [CrossRef]
  10. Zheng, X.Y.; Lei, Y. Stochastic response analysis for a floating offshore wind turbine integrated with a steel fish farming cage. Appl. Sci. 2018, 8, 1229. [Google Scholar] [CrossRef]
  11. Zhao, Z.L.; Yu, W.Z.; Xu, T.J. Study of the Interaction between Regular Waves and a Wind-Fish Combined Structure. Appl. Sci. 2023, 13, 3103. [Google Scholar] [CrossRef]
  12. Zhang, C.L.; Wang, S.M.; Cui, M.C.; Liu, H.; Liu, A.D.; Xu, J.C.; Xie, S.Y. Modeling and dynamic response analysis of a submersible floating offshore wind turbine integrated with an aquaculture cage. Ocean Eng. 2022, 263, 112338. [Google Scholar] [CrossRef]
  13. Cao, S.G.; Cheng, Y.L.; Duan, J.L.; Fan, X.X. Experimental investigation on the dynamic response of an innovative semi-submersible floating wind turbine with aquaculture cages. Renew. Energy 2022, 200, 1393–1415. [Google Scholar] [CrossRef]
  14. Yi, Y.; Sun, K.; Liu, Y.Q.; Zhang, J.H.; Jiang, J.; Liu, M.Y.; Ji, R.W. Experimental investigation into the dynamics and power coupling effects of floating semi-submersible wind turbine combined with point-absorber array and aquaculture cage. Energy 2024, 296, 131220. [Google Scholar] [CrossRef]
  15. Zhai, Y.T.; Zhao, H.S.; Li, X.; Shi, W. Hydrodynamic responses of a barge-type floating offshore wind turbine integrated with an aquaculture cage. J. Mar. Sci. Eng. 2022, 10, 854. [Google Scholar] [CrossRef]
  16. Li, N.; Zhao, H.S.; Shi, W.; Wang, W.H.; Li, X. Dynamic Analysis of an Integrated Structure Consists of Jacket Offshore Wind Turbine and Aquaculture Cage. In Proceedings of the ASME 2024 43rd International Conference on Offshore Mechanics and Arctic Engineering, Hamburg, Germany, 5–1 June 2022. [Google Scholar] [CrossRef]
  17. Chu, Y.I.; Wang, C.M.; Zhang, H. A frequency domain approach for analyzing motion responses of integrated offshore fish cage and wind turbine under wind and wave actions. Aquac. Eng. 2022, 97, 102241. [Google Scholar] [CrossRef]
  18. Gong, S.K.; Gao, J.L.; Yan, M.Y.; Song, Z.W.; Shi, H.B. Effects of floater motion on wave loads during steady-state gap resonance occurring between two non-identical boxes. Ocean Eng. 2025, 323, 120649. [Google Scholar] [CrossRef]
  19. Gong, S.K.; Gao, J.L.; Song, Z.W.; Shi, H.B.; Liu, Y.Y. Hydrodynamics of fluid resonance in a narrow gap between two boxes with different breadths. Ocean Eng. 2024, 311, 118986. [Google Scholar] [CrossRef]
  20. Gao, J.L.; Mi, C.L.; Song, Z.W.; Liu, Y.Y. Transient gap resonance between two closely-spaced boxes triggered by nonlinear focused wave groups. Ocean Eng. 2024, 305, 117938. [Google Scholar] [CrossRef]
  21. Mi, C.L.; Gao, J.L.; Song, Z.W.; Yan, M.Y. Gap resonance between a stationary box and a vertical wall induced by transient focused wave groups. China Ocean Eng. 2025, 1–14. [Google Scholar] [CrossRef]
  22. Mi, C.L.; Gao, J.L.; Song, Z.W.; Liu, Y.Y. Hydrodynamic wave forces on two side-by-side barges subjected to nonlinear focused wave groups. Ocean Eng. 2025, 317, 120056. [Google Scholar] [CrossRef]
  23. Zhong, W.J.; Zhang, X.M.; Wan, D.C. Hydrodynamic characteristics of a 15 MW semi-submersible floating offshore wind turbine in freak waves. Ocean Eng. 2023, 283, 11594. [Google Scholar] [CrossRef]
  24. Tang, Y.; Shi, W.; You, J.K.; Michailides, C. Effects of nonlinear wave loads on large monopile offshore wind turbines with and without ice-breaking cone configuration. J. Mar. Sci. Technol. 2021, 26, 37–53. [Google Scholar] [CrossRef]
  25. Wang, J.; Wang, S.Q.; Jiang, Q.D.; Xu, Y.X.; Shi, W.C. Effect of different raft shapes on hydrodynamic characteristics of the attenuator-type wave energy converter. China Ocean Eng. 2023, 37, 645–659. [Google Scholar] [CrossRef]
  26. Wang, K.; Li, N.; Wang, Z.H.; Song, G.J.; Du, J.; Song, L.; Jiang, H.Z.; Wu, J.H. The impact of floating raft aquaculture on the hydrodynamic environment of an open sea area in Liaoning Province, China. Water 2022, 14, 3125. [Google Scholar] [CrossRef]
  27. Tomasicchio, G.R.; D’Alessandro, F.; Avossa, A.M.; Riefolo, L.; Musci, E.; Ricciardelli, F.; Vicinanza, D. Experimental modelling of the dynamic behaviour of a spar buoy wind turbine. Renew. Energy 2018, 127, 412–432. [Google Scholar] [CrossRef]
  28. Lauria, A.; Loprieno, P.; Rizzo, F.; Severini, A.; Foti, D.; Leone, E.; Francone, A.; Tomasicchio, G. On the effects of wind and operating conditions on mooring line tensions for floating offshore wind turbine. Appl. Ocean Res. 2024, 152, 104197. [Google Scholar] [CrossRef]
  29. Ai, Q.; Cao, J.C.; Jin, L.; Chen, D.M.; Tang, Y.L.; Zhao, F.F.; Sheng, H.X.; Wang, X.X. Experimental Study of the Hydrodynamic Characteristics of the Raft Aquaculture Facilities Around a Windfarm Monopile. In Proceedings of the ASME 2024 43rd International Conference on Offshore Mechanics and Arctic Engineering, Singapore, Singapore, 9–14 June 2024. [Google Scholar] [CrossRef]
  30. Wang, X.X.; Swift, M.R.; Dewhurst, T.; Tsukrov, I.; Celikkol, B.; Newell, C. Dynamics of submersible mussel rafts in waves and current. China Ocean Eng. 2015, 29, 431–444. [Google Scholar] [CrossRef]
  31. STAR-CCM+. User Manual. Version 19.02.012-R8, Siemens Industry Software Inc. 2024. Available online: https://www.plm.automation.siemens.com/global/zh/products/simulation-test/cae-simulation.html (accessed on 1 June 2024).
  32. Menter, F.R. Two-equation eddy-viscosity turbulence modeling for engineering applications. AIAA J. 1994, 32, 1598–1605. [Google Scholar] [CrossRef]
  33. Hirt, C.W.; Nichols, B.D. Volume of fluid (VOF) method for the dynamics of free boundaries. J. Comput. Phys. 1981, 39, 201–225. [Google Scholar] [CrossRef]
  34. Fenton, J.D. A fifth-order Stokes theory for steady waves. J. Waterw. Port Coast. Ocean Eng. 1985, 111, 216–234. [Google Scholar] [CrossRef]
  35. Zhang, T.Z.; Zhao, W.H.; Zhou, C.; Zhao, F.F.; Wan, R. Design and modeling of an eco-friendly anchored fish aggregating device with artificial reef subjected to wave and current. Ocean Eng. 2024, 313, 3. [Google Scholar] [CrossRef]
  36. Kim, J.; O’Sullivan, J.; Read, A. Ringing analysis of a vertical cylinder by Euler overlay method. In Proceedings of the ASME 2012 31st International Conference on Offshore Mechanics and Arctic Engineering, Rio de Janeiro, Brazil, 1–6 July 2012. [Google Scholar] [CrossRef]
  37. Yang, H.S.; Alkhabbaz, A.; Tongphong, W.; Lee, Y.H. Cross-comparison analysis of environmental load components in extreme conditions for pontoon-connected semi-submersible FOWT using CFD and potential-based tools. Ocean Eng. 2024, 304, 117248. [Google Scholar] [CrossRef]
  38. Daabo, A.M.; Alkhabbaz, A.; Ibrahim, S.S.; Hamzah, H.; Hassan, A.; Basem, A.; Easa, H.; Pavlovic, S. Thirteen vital factors for micro-scale radial turbine vane’s design of geo-solar-powered Brayton cycle applications. Energy Convers. Manag. 2024, 315, 118774. [Google Scholar] [CrossRef]
  39. Wang, X.X.; Zhao, F.F.; Tang, Y.L.; Huang, L.Y.; Wan, R.; Cheng, H. Numerical Analysis of Submersible Mussel Raft for Exposed Marine Environment. In Proceedings of the ASME 2017 36th International Conference on Offshore Mechanics and Arctic Engineering, 25–30 June 2017. [Google Scholar] [CrossRef]
  40. Wang, X.X.; Xie, J.Y.; Luo, Y.; Wang, X.; Guo, G.B.; You, X.X. Experimental Investigation of the Hydrodynamic Characteristics of Longline Aquaculture Facilities under Current and Wave Conditions. Fishes 2023, 8, 204. [Google Scholar] [CrossRef]
  41. Liu, H.F.; Bi, C.W.; Zhao, Y.P. Experimental and numerical study of the hydrodynamic characteristics of a semisubmersible aquaculture facility in waves. Ocean Eng. 2020, 214, 107714. [Google Scholar] [CrossRef]
  42. de Leon, S.P.; Bettencourt, J.H.; Kjerstad, N. Simulation of irregular waves in an offshore wind farm with a spectral wave model. Cont. Shelf Res. 2011, 31, 1541–1557. [Google Scholar] [CrossRef]
  43. Corvaro, S.; Crivellini, A.; Marini, F.; Cimarelli, A.; Capitanelli, L.; Mancinelli, A. Experimental and numerical analysis of the hydrodynamics around a vertical cylinder in waves. J. Mar. Sci. Eng. 2019, 7, 453. [Google Scholar] [CrossRef]
  44. Masoudi, E.; Marshall, A. Diffraction of waves by multi-pontoon rectangular floating breakwaters. Ocean Eng. 2024, 310, 118789. [Google Scholar] [CrossRef]
  45. Li, C.; Zhang, H.J.; Zhang, H.; Sun, B.; Yang, S.L. Wave-attenuation and hydrodynamic properties of twin pontoon floating breakwater with kelp. Appl. Ocean Res. 2022, 124, 103213. [Google Scholar] [CrossRef]
  46. Miles, J.; Martin, T.; Goddard, L. Current and wave effects around windfarm monopile foundations. Coast. Eng. 2017, 121, 167–178. [Google Scholar] [CrossRef]
  47. Martinelli, L.; Ruol, P.; Zanuttigh, B. Wave basin experiments on floating breakwaters with different layouts. Appl. Ocean Res. 2008, 30, 199–207. [Google Scholar] [CrossRef]
  48. Liao, P. Study on Hydrodynamic Behaviors of “Tian” shaped Shellfish Raft Cultivate Facilities. Master’s Thesis, Dalian University of Technology, Dalian, China, 2017. [Google Scholar]
  49. Mo, W.H.; Irschik, K.; Oumeraci, H.; Liu, P.L.F. A 3D numerical model for computing non-breaking wave forces on slender piles. J. Eng. Math. 2007, 58, 19–30. [Google Scholar] [CrossRef]
  50. Wynants, M.; Schendel, A.; Welzel, M.; Kerpen, N.B.; Schlurmann, T. Current-distorted wave diffraction patterns in the near-field of a monopile in coastal seas. Ocean Eng. 2024, 302, 117432. [Google Scholar] [CrossRef]
Figure 1. Location of the offshore wind farm in Laizhou Bay of Changyi City, Shandong Province, China.
Jmse 13 00809 g001
Figure 2. Schematic diagram of ‘Offshore Wind-Raft Aquaculture Integration’.
Jmse 13 00809 g002
Figure 3. Experimental wave tank.
Jmse 13 00809 g003
Figure 4. Experimental models and arrangement: (a) wind turbine monopile model; (b) mussel rope model; (c) pontoon rafts model; (d) 50 kg tension sensor; (e) 10 kg tension sensor; (f) picture of single-row PRAF model arrangement; (g) picture of three-row PRAF model arrangement.
Jmse 13 00809 g004
Figure 5. The installed monopile model and single-row PRAF model.
Jmse 13 00809 g005
Figure 6. The layouts of PRAFs in the wave tank: (a) the single-row arrangement with a monopile in bird’s-eye view; (b) the single-row arrangement with a monopile in side view; (c) the three-row arrangement in bird’s-eye view; (d) the three-row arrangement in side view.
Jmse 13 00809 g006aJmse 13 00809 g006b
Figure 7. Boundary conditions of the numerical flume.
Jmse 13 00809 g007
Figure 8. The scheme of grid settings around the wind monopile model.
Jmse 13 00809 g008
Figure 9. The locations of four set points to monitor the wave heights in a numerical flume with the monopile.
Jmse 13 00809 g009
Figure 10. The locations of three set points to monitor the wave heights around the monopile: (a) single-row PRAF; (b) three-row PRAFs.
Jmse 13 00809 g010
Figure 11. The maximum tensions of the upstream mooring line of the single-row PRAF under different wave periods and wave heights in the presence ( F S P ) and absence ( F S N ) of the monopile: (a) H = 0.1125 m, and T varies from 1.0 s to 1.4 s; (b) T = 1.237 s, and H varies from 0.063 m to 0.188 m.
Jmse 13 00809 g011
Figure 12. Comparison of the F S N at prototype scale between a single-row PRAF with three rafts in H / L from 0.025 to 0.084 and a raft facility in H / L from 0.013 to 0.077 [39].
Jmse 13 00809 g012
Figure 13. The maximum tensions of the upstream mooring line of single-row ( F S N ) and three-row ( F T O and F T I ) PRAFs without a monopile under different wave periods and wave heights: (a) H = 0.1125 m, and T varies from 1.0 s to 1.4 s; (b) T = 1.237 s, and H varies from 0.063 m to 0.188 m.
Jmse 13 00809 g013
Figure 14. The maximum tensions of the bridle line F S B 1 F S B 4 for different wave periods and wave heights in the presence and absence of a monopile: (a) the maximum tension of bridle line 1; (b) the maximum tension of bridle line 2; (c) the maximum tension of bridle line 3; (d) the maximum tension of bridle line 4.
Jmse 13 00809 g014
Figure 15. Comparison of the mooring line tensions and bridle line tensions for the single-row PRAF under different wave conditions with and without the monopile: (a) without monopile, H = 0.1125 m; (b) without monopile, T = 1.237 s; (c) with monopile, H = 0.1125 m; (d) with monopile, T = 1.237 s.
Jmse 13 00809 g015
Figure 16. The maximum tensions of the bridle line F T B 1 F T B 4 for different wave periods and wave heights: (a) the maximum tension of bridle line 1; (b) the maximum tension of bridle line 2; (c) the maximum tension of bridle line 3; (d) the maximum tension of bridle line 4.
Jmse 13 00809 g016
Figure 17. Comparison of the mooring line tensions and bridle line tensions for the three-row PRAFs under different wave conditions: (a) outer structure, H = 0.1125 m; (b) outer structure, T = 1.237 s; (c) inner structure, H = 0.1125 m; (d) inner structure, T = 1.237 s.
Jmse 13 00809 g017
Figure 18. Comparison of the bridle line tensions for the single-row and three-row PRAFs under different wave conditions: (a) H = 0.1125 m; (b) T = 1.237 s.
Jmse 13 00809 g018
Figure 19. K t of the monopile under different wave conditions: (a) K t varied with the wave period increasing from 1.0 s to 1.4 s (H = 0.1125 m); (b) K t varied with the wave height increasing from 0.063 m to 0.188 m (T = 1.237 s).
Jmse 13 00809 g019
Figure 20. The relationship between Δ F and Ka.
Jmse 13 00809 g020
Figure 21. Distribution of the ratio of the measured wave height H’ to the incident wave height H around the monopile: (a) when T = 1.4 s and H = 0.1125 m; (b) when T = 1.237 s and H = 0.188 m.
Jmse 13 00809 g021
Figure 22. The wave fields around the monopile foundation and single-row PRAF: (a) T = 1.237 s, H = 0.063 m; (b) T = 1.237 s, H = 0.125 m; (c) T = 1.237 s, H = 0.188 m.
Jmse 13 00809 g022aJmse 13 00809 g022b
Figure 23. The wave fields around the monopile foundation and three-row PRAFs: (a) T = 1.237 s, H = 0.063 m; (b) T = 1.237 s, H = 0.125 m; (c) T = 1.237 s, H = 0.188 m.
Jmse 13 00809 g023aJmse 13 00809 g023b
Table 1. Model structural parameters of PRAF [29].
Components (Number)Description
Pontoons (9)1.5 m long, 11.4 cm diameter, buoyancy 12.9 kgf
Steel angle (9)1.8 m long, 4.1 cm wide, 2.1 cm high, 1.0 mm thick, 2.38 kg weight
Pipe strap (27)12.4 cm diameter, 2.0 mm thick, 0.15 kg weight
Screw and nut (54)24.0 g total weight
Mussel ropes (63)0.52 m long, 4.05 cm diameter, 0.50 kg weight (in water)
Buoy (18)2.0–9.5 cm diameter (half of an ellipsoid), buoyancy 325 gf
Buoy tether line (1)0.18 m long, 0.30 cm diameter
Bridle lines (4)0.92 m long, 0.30 cm diameter
Mooring lines (2)2.46 m long, 0.30 cm diameter
Table 2. Experimental wave conditions set up.
Case12345678910
Wave Periods
T (s)
1.01.11.21.31.41.2371.2371.2371.2371.237
Wave Heights H (m)0.11250.11250.11250.11250.11250.0630.1000.1250.1560.188
Wave Length
L (m)
1.561.882.232.592.972.362.362.362.362.36
Table 3. Numerical simulation results of H i and H t .
Case H i (m) H t (m) D / L K t K a
10.13130.10490.4040.7990.201
20.11610.9550.3350.8230.177
30.10860.9530.2830.8780.122
40.10730.10120.2430.9430.057
50.10970.1040.2120.9480.052
60.590.5320.2670.9020.098
70.9870.8820.2670.8940.106
80.11890.10530.2670.8860.114
90.15180.13310.2670.8770.123
100.17810.15430.2670.8660.134
Table 4. Effects of single-row and three-row PRAFs on monopile forces and nearby wave heights.
LayoutCase H P 1 (m) H P 2 (m) H P 3 (m) F P (N)
Monopile foundationT = 1.237 s, H = 0.063 m0.0980.0590.05465.57
T = 1.237 s, H = 0.125 m0.2090.1210.111117.14
T = 1.237 s, H = 0.188 m0.3200.1970.160183.06
Monopile foundation + single-row PRAFT = 1.237 s, H = 0.063 m0.0950.0650.05759.83
T = 1.237 s, H = 0.125 m0.1890.1340.101115.28
T = 1.237 s, H = 0.188 m0.2950.2040.168180.59
Monopile foundation + three-row PRAFsT = 1.237 s, H = 0.063 m0.1000.0640.05768.14
T = 1.237 s, H = 0.125 m0.2010.1320.109118.32
T = 1.237 s, H = 0.188 m0.2920.2110.176187.68
Disclaimer/Publisher’s Note: The statements, opinions and data contained in all publications are solely those of the individual author(s) and contributor(s) and not of MDPI and/or the editor(s). MDPI and/or the editor(s) disclaim responsibility for any injury to people or property resulting from any ideas, methods, instructions or products referred to in the content.

