Article

The Influence of Structural Design on the Hydrodynamics of Floating Offshore Wind Turbine Platforms

1
Energy and Environment Institute, University of Hull, Hull HU6 7RX, UK
2
Offshore Renewable Energy Catapult, Inovo, 121 George St, Glasgow G1 1RD, UK
3
School of Architecture, Building and Civil Engineering, Loughborough University, Loughborough LE11 3TU, UK
*
Author to whom correspondence should be addressed.
J. Mar. Sci. Eng. 2025, 13(2), 248; https://doi.org/10.3390/jmse13020248
Submission received: 19 November 2024 / Revised: 17 January 2025 / Accepted: 22 January 2025 / Published: 28 January 2025

Abstract

:
Floating offshore wind turbine (FOWT) platforms are subject to a wide range of hydrodynamic loading and dynamic movement, making hydrodynamic force evaluation difficult. Amongst various floating platforms, submersible platforms are structurally complex, with multiple members held together by cross-braces. The influence of these members on hydrodynamic loading is poorly understood. An investigation of the effect of these members on loads is essential to optimise the design of FOWT platforms, mooring systems, and protective coatings, leading to a reduction in construction and maintenance costs. This paper numerically investigates the effect of structural members on the forces acting on a static semi-submersible platform in a unidirectional current flow of Reynolds number ( R e ) ranging from 2000 to 200,000, based on structural diameter and tidal velocity. The OC4 semi-submersible is chosen as the baseline platform. For each R e , this study is divided into three stages, such that in each stage, the number of members increased. These stages are as follows: (1) a finite cylinder (FC), (2) a finite cylinder with a heave plate (FCHP), (3) three cylinders with heave plates (TCHP) in an equilateral triangle arrangement, and (4) the OC4 semi-sub. The drag coefficient ( C ¯ d ) increases with increasing structural members and weakly varies with increasing R e . However, the viscous drag coefficient ( C ¯ f ) decreases with increasing R e , and a reverse trend is seen in the case of the pressure drag coefficient ( C ¯ p ), with pressure drag dominating over friction drag. Further, the contribution of individual members is observed to vary with R e . The contribution of cylinders towards C ¯ d is higher than heave plates, showing that contributions directly depend on the aspect ratio of members. In the case of TCHP and OC4, the contribution of the rear members is higher than that of the leading members due to the strong wake effect of the former. Also, the braces and pontoons of OC4 have contributed substantially towards total C ¯ d , unlike the central cylinder, which has experienced low drag due to the wake effect of the front cylinder and heave plate. Also, flow visualisation has shown vortex cores, and recirculating flows in the near wake of the cylinders and under the heave plates. Recirculation zones under the heave plates lead to vertical pressure on the structures. This vertical pressure increases with the number of structural members and the vertical pressure coefficient ( C ¯ v ), varying with R e due to three-dimensionality in the wake. Further, this pressure varies across the bottom surfaces of structures. Analyses of the streamwise pressure coefficient have shown it is highest on the front surfaces of cylinders. The highest friction is on the top and sides of the heave plates, and there is considerable friction on the sides of the cylinder.

1. Introduction

Renewable energy sources, including offshore wind energy, are essential for reducing fossil fuel consumption and achieving decarbonisation. To this end, many countries across the world have set targets to achieve NetZero. Globally, offshore wind capacity is forecast to nearly double over the next five years, from 72.5 GW in 2023 to 138 GW in 2028 [1]. So far, offshore wind farm developers have preferred installing wind turbines at near-shore sites due to easy access and associated reduced construction, operation, and maintenance costs [2,3]. However, this also means that suitable near-shore sites available for development are limited. Therefore, new wind farms are expected to be developed at far-offshore, deep water locations (≥60 m) where wind resources are stronger and more consistent. This move towards deeper waters requires the deployment of floating offshore wind turbines (FOWT), as opposed to the current fixed-bottom technology. Floating platforms are extensively used in the oil and gas (O and G) industry for fuel extraction from deep-sea sites [4]. In fact, the initial conceptualisation of FOWT platforms is based on those employed in the O and G industry [5]. However, the scale of FOWT foundations, location, and loading on them are vastly different than O and G floating platforms. This necessitates the design and structural optimisation of the FOWT foundations to meet the requirements of the sector. As a result, different types of FOWT platforms have been developed. Amongst them, the most widely adopted are the spar-buoy [6], semi-submersible [7], and tension-leg platforms [8] (Figure 1). Spar-buoys are cylindrical structures with a heave ballast attached at the lower end to stabilise the platform. Semi-submersible platforms have multiple short columns held together by cross-braces/struts and are water-plane stabilised. Both these platforms are held at the station using mooring systems. The tension-leg platform resembles a truncated cylinder with horizontal members extending outwards from the lower end. The foundation is stabilised by tendons connecting the horizontal arms to the sea bed. Further, the draft of the platform should be such that the buoyancy force acting on the structure keeps the mooring system tensioned [9]. Hywind Scotland is the world’s first floating wind farm where a spar-buoy type foundation has been used, whereas, in the Kincardine offshore wind farm, the wind turbines are supported by semi-submersible platforms [6,10]. Compared to onshore wind turbines, offshore wind turbines are subjected to additional hydrodynamic loading due to waves and currents, including loading due to wave-induced diffraction and platform-induced radiation [11]. Therefore, accounting for this wide range of loads, especially under extreme weather conditions, is essential for the design optimisation of the entire FOWT system and cost reduction [12]. However, the baseline understanding of loading on floating structures is poor. Therefore, at the onset, load evaluation on FOWT platforms under simplified conditions is essential.
Unlike spar-buoy and TLP, which structurally resemble a single cylinder supporting the wind turbine with smaller plan areas, semi-submersible platforms usually have three cylinders with heave plates spread apart in a triangular arrangement. Heave plates are usually thinner but wider than cylinders and help to reduce the heave motion of structures [13]. The wind turbine is held on the top of one of the cylinders or on a third cylinder at the centre (Figure 1). All these members are held together by multiple braces/struts and pontoons. These additional members make semi-submersible platforms much more structurally complex than other FOWT platforms. Further, these members are bound to affect the flow field around the floating foundation, the loading, and its distribution on platforms. However, the influence of these members on hydrodynamic forces is poorly understood. Also, the forces are expected to vary with increasing Reynolds number, which needs to be considered.
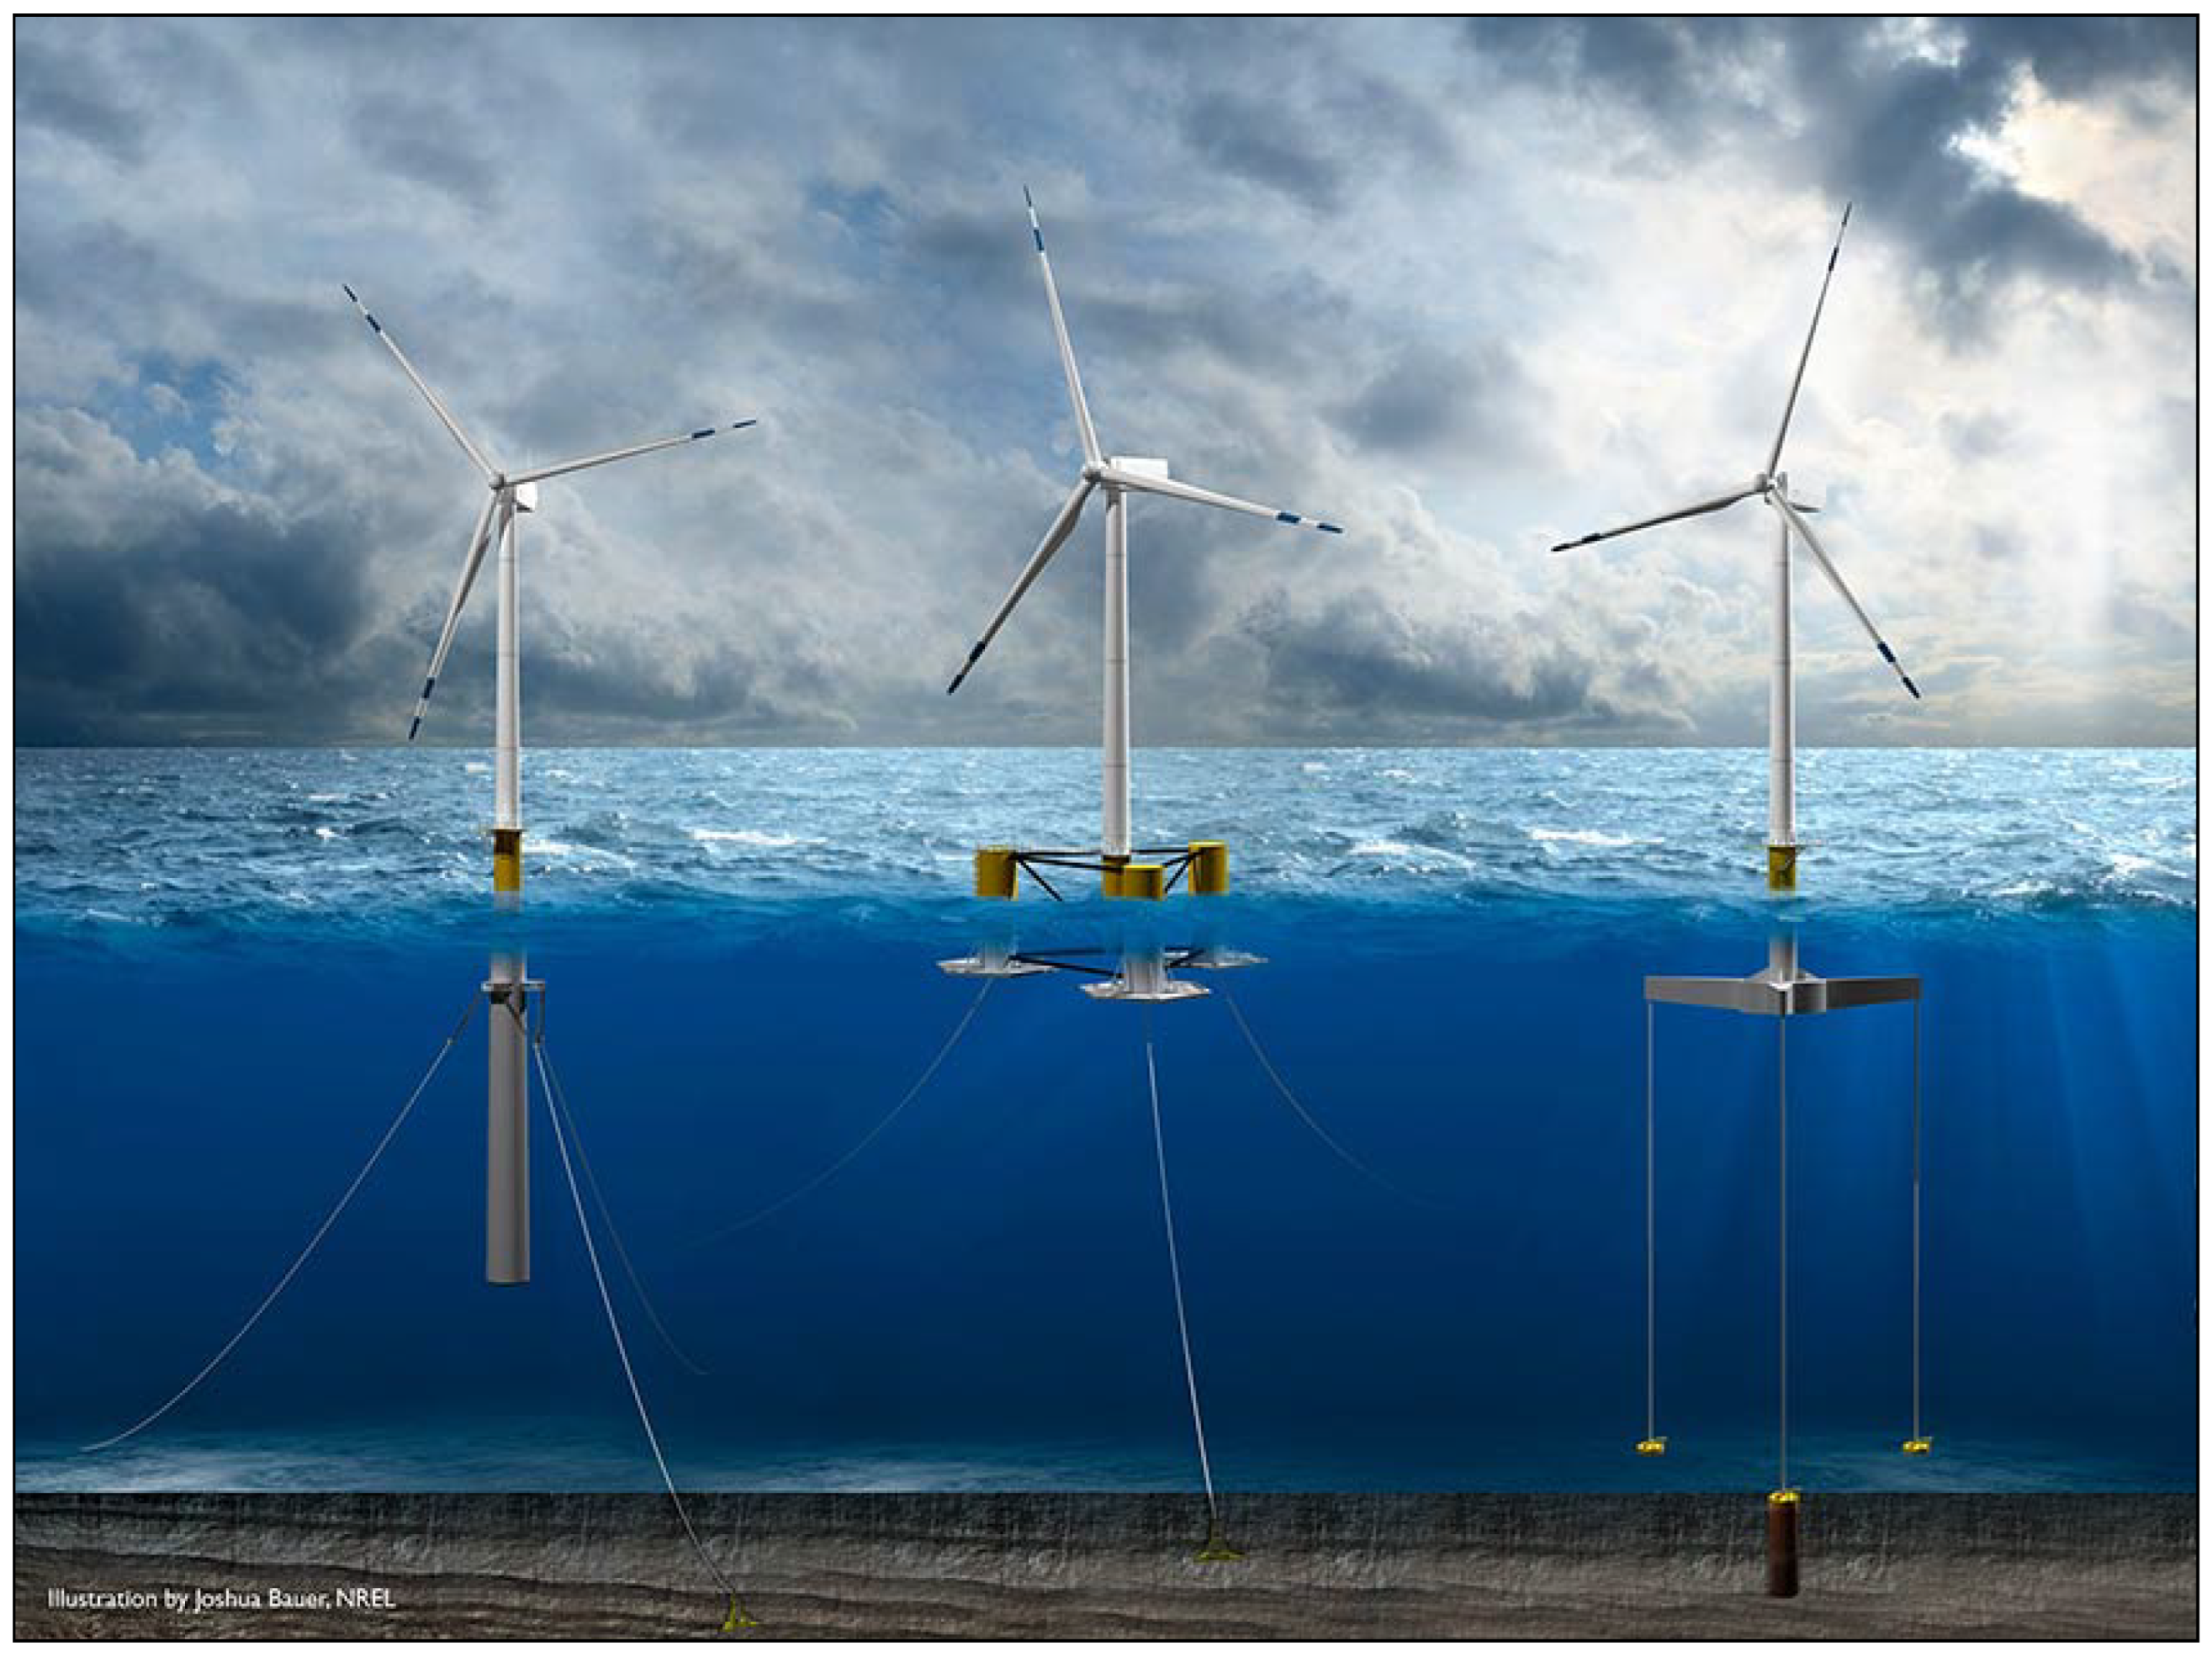
Figure 1. The three different floating platforms for offshore wind turbines. From left to right, spar-buoy, semi-submersible, and tension-leg platforms. All three foundations are tethered to the sea bed through an anchoring–mooring system. Image by Joshua Bauer, NREL [14].
Jmse 13 00248 g001
Tran and Kim [15] successfully studied the free-decay and regular wave motions of the OC4 semi-submersible platform through two different CFD methods. The results obtained with the shear stress model and Spalart–Almaras model agreed well with experiments compared with the k ϵ model. A second CFD study by Tran and Kim [16] investigating the motion response amplitude operators (RAOs) in regular waves showed good agreement with experiments and OpenFast. However, there was a large difference in tension acting on mooring systems compared to experimental results [17,18]. Wang et al. [19] numerically studied the pitch decay of the OC4 semi-submersible platform and compared the numerical solution to the experimental study. Although very small discretisation errors were observed in platform maxima motion and period, large differences in linear and quadratic damping coefficients were also observed. A complex catenary morning line, drag of the mooring system, power cables, aerodynamic damping due to wind turbine and tower, and three-degrees-of-freedom adopted in simulations were some aspects that influenced the results [20].
Further, in a separate study, Wang et al. [21] showed that the incorporation of dynamic modelling of the catenary system significantly improved CFD predictions of pitch period and linear pitch damping coefficient. However, the quadratic pitch damping coefficient was still underpredicted. Li and Bachynski-Polic [22] simulated the low-frequency radiation characteristics of OC4 under free-decay motions and forced oscillations in heave, surge, and pitch and compared them with experiments [23,24]. Although pitch and heave decay numerical predictions matched with experimental results, there was a substantial difference in surge decay. This excessive damping was attributed to the mechanical mooring system in the experimental setup, which was not considered in simulations. Burmester et al. [25] studied surge decay motions through CFD simulations and formally quantified discretisation errors through time-step and grid convergence studies. The influence of discretisation schemes, free-surface, scaling, domain size, catenary mooring models, wave-absorption, turbulence models, etc., was also studied [26]. The addition of a wave-absorption zone was found to have a limited influence on hydrodynamic damping. Also, parameters, such as line weight and drag coefficient, associated with catenary modelling strongly influenced the structure’s motion. Wang et al. [27] simulated platform motion in regular waves and found good agreement of surge RAO with experiments. However, heave and pitch RAOs were underpredicted due to unsatisfactory non-linear modelling of the catenary system.
Liu et al. [28] investigated the vortex-induced motion (VIM) of the OC4 submersible platform due to unidirectional current. Three different incidence angles ( α ) and a range of flow velocities were considered. The flow velocities were non-dimensionalised by the natural frequency of the platform and the diameter of the cylinder, which are called reduced velocities ( V r ). Although the streamwise motion for all α was limited, large amplitude transverse motions were observed from V r = 6 to 30 for α = 0 and 90 . However, the transverse motion at α = 180 was comparatively low due to upstream vortices interacting with downstream cylinders. In a separate CFD study, Liu et al. [29] compared the VIM of cylinders with and without a heave plate. The heave plate was found to expand the V r range over which VIM takes place. Further, the large surface area of the heave plate increased viscous damping, reducing the VIM response. Benitz et al. [30] compared the hydrodynamic coefficient on a stationary semi-submersible platform obtained from CFD solver, OpenFOAM, against results from Fast HydroDyn. They showed that the presence of a free surface, free ends, and multiple members reduced drag. However, these factors were not considered in HydroDyn. Ma et al. [31] studied the influence of drag on low-frequency surge motion of the semi-submersible platforms and concluded that under moderate sea conditions, drift motion was directly related to the drag coefficient and could significantly affect motion under extreme sea conditions. Also, the choice of the drag coefficient, depending on the sea state, was essential to simulate the drift and damping forces [32]. Existing state-of-the-art engineering tools were found to underpredict hydrodynamic loading and corresponding motions, especially at low frequencies, which could lead to resonance and extreme loading [17]. The drag forces on heave plates and cylinders were crucial to understanding low-frequency motions. In addition, the heave and pitch motion of the platform increased with increasing the drag coefficient of the heave plates [20]. Biofouling, which is the settlement and growth of marine organisms on offshore structures, could lead to significant changes in the drag coefficient and force response of floating platforms [33,34] and fatigue failure [35]. Also, this could also make maintenance of the structures difficult and expensive [36].
So far, these studies have included aero-hydrodynamic forcing on semi-submersible platforms under dynamic conditions, motions, and decay of the platforms. The presence of multiple members in a semi-submersible platform is bound to influence the hydrodynamic loading on the entire structure. However, the contribution of different components, such as cross-braces and pontoons, towards the drag coefficient is not yet understood. Further, very little attention has been paid towards the scaling of hydrodynamic forces with Reynolds number ( R e ). Therefore, understanding the contribution of structural components towards drag and scaling of drag with respect to R e can help understand the influence of the drag coefficient towards the dynamic motion of the platform. Also, this can be fed into high-fidelity numerical tools for evaluating FOWT systems and optimising the design of floating platforms and mooring systems. This can also inform decision-making processes for construction material selection, operation, and maintenance and cost reduction. This paper numerically investigates the influence of structural components of a static semi-submersible platform on hydrodynamic loading under unidirectional current flow. This study has been carried out without considering the influence of waves. Drag coefficients ( C ¯ d ) acting on the four structures and contributions of structural components of the structures towards C ¯ d are presented for R e = 2000 to 200,000. Further, flow visualisation, pressure, friction coefficient, etc.; results are presented for R e = 2900, 43,000, and 200,000. The NREL OC4 semi-submersible platform developed as part of the DeepCWind project is used as the baseline semi-submersible platform for this study [37]. The investigation is divided into three stages for each R e . In the first stage, a finite cylinder (FC) is considered. In the second stage, a finite cylinder with a heave plate (FCHP) is investigated. In the next stage, three cylinders with heave plates (TCHP) in an equilateral arrangement are considered, and a central column and braces are added to the TCHP to form a 1:50 model of the OC4 semi-sub. The paper is organised as follows: in Section 2, we introduce the CFD methodology, numerical set-up, and validation of flow past a finite cylinder. This is followed by the results in Section 3, where C ¯ d for R e = 2000 to 200,000 for all structures and contributions of their components, flow visualisation, pressure, and friction coefficient results are presented. Finally, the discussion is presented in Section 4, and our findings are summarised in Section 5.

2. Methodology

The Reynolds averaged Navier–Stokes (RANS) method, which is based on the incompressible Navier–Stokes equation, is adopted. Here, the variables are decomposed into an ensemble-averaged mean component and a fluctuating component:
ϕ = ϕ ¯ + ϕ ,
where ϕ is an instantaneous field, ϕ ¯ is the ensemble averaged field, and ϕ is the fluctuating field. The Reynolds averaged Navier–Stokes equations are given as follows:
D U ¯ j D t = P ¯ x j + ν 2 U ¯ j u i u j ¯ x i ,
and
U ¯ i x i = 0 ,
where U i ¯ is the ensemble averaged velocity, P ¯ is the ensemble averaged kinematic pressure, and ν is the kinematic molecular velocity of the fluid. The instantaneous velocity fluctuations are given as u i = u i U i ¯ , the flow is assumed to be incompressible, and density, ρ , is accounted through ν and P ¯ . Using the Boussinesq approximation, the Reynolds stresses, u i u j ¯ , are closed by
u i u j ¯ = 2 ν t S i j 2 3 k δ i j ,
and
S i j = 1 2 U ¯ i x j + U ¯ j x i ,
where S i j is the symmetric velocity gradient tensor, k = 1 2 u i u i ¯ is the turbulent kinetic energy, and ν t is the kinematic turbulent viscosity, the calculation of which depends on the turbulence closure model adopted. In this work, the model adopted is Menter k ω SST, which has shown excellent performance in external fluid dynamics problems [38]. This model solves transport equations for turbulent kinetic energy, k, and specific dissipation rate, ω . These equations are as follows:
D k D t = P ˜ β * ω k + x j ν + ν t σ k k x j ,
and
D ω D t = γ P β ω 2 + x j [ ν + ν t σ ω k x j ] + ( 1 F 1 ) 2 σ ω 2 1 ω k x j ω x j ,
with
P ˜ = m i n ( P ; c l ϵ ) .
The model coefficients are functions of F 1 : ϕ = F 1 ϕ 1 + ( 1 F 1 ) ϕ 2 , where ϕ 1 , ϕ 2 are the coefficients of k ω and k ϵ models, respectively. The blending function F 1 is calculated as follows:
F 1 = t a n h ( a r g 1 4 ) a r g 1 = m i n m a x k β * ω y ; 500 ν y 2 ω 4 ρ σ w 2 k C D k ω y 2 ,
C D k ω = m a x 2 ρ σ ω 2 1 ω k x j ω x j ; 1.0 e 10 .
The model coefficients are σ k 1 = 0.85 , σ k 2 = 1.0 , σ ω 1 = 0.5 , σ ω 2 = 0.856 , β 1 = 0.075 , β 2 = 0.0828 , β * = 0.09 , α 1 = 5 / 9 , α 2 = 0.44 , α 1 = 0.31 , and c l = 10.0 . The validation of the adopted eddy viscosity model is presented in Appendix A.1.

2.1. Numerical Set-Up

The OC4 semi-submersible platform was developed to support the NREL offshore 5 MW wind turbine to build aero-hydro-servo-elastic models as part of the DeepCwind project by NREL (Figure 2). The platform consists of three circular columns with a diameter of 12 m and a height of 26 m , arranged in an equilateral triangle. Heave plates of diameter of 24 m and a thickness of 6 m are attached at the bottom of each cylinder. The wind turbine is fixed on the top of a fourth cylinder of diameter 6.5 m and a height of 30 m . This cylinder is connected to three outer cylinders and heave plates by a number of cross-braces and pontoons. The length of these members ranges from 38 to 13.62 m with a diameter of 0.0175 m . A detailed description of the OC4 semi-submersible platform and its structural details can be found in [37].
This study is divided into four stages for each R e . At Stage 1, a finite cylinder (FC) with a diameter of 0.24 m and a draft of 0.48 m is considered. Stage 2 considers a finite cylinder with a heave plate (FCHP) with a diameter of 0.48 m and a thickness of 0.12 m . In Stage 3, there are three cylinders with heave plates (TCHP) in an equilateral arrangement, and in Stage 4, the OC4 semi-submersible platform (OC4) is considered (Figure 3). The diameter and draft of cylinders of TCHP and OC4 are kept at 0.24 m and 0.48 m , respectively. This ensures that the aspect ratio ( A R = draft of cylinder (L)/diameter of cylinder (D)) is fixed at 2 throughout the study for all structures, and the OC4 is scaled as 1:50 of the original model, as in the case of Goupee et al. [39]. Computer-aided drawing (CAD) models of FC, FCHP, TCHP, and OC4 are prepared using SALOME, an open-source software for CAD, meshing, visualisation, etc. These CAD drawings are then imported to OpenFOAM V10 for simulation [40]. The domain size in streamwise, cross-stream, and vertical directions for all structures is summarised in Table 1. To ensure that side wall effects are minimal, the length of the domain is kept slightly larger than the one used by Alkishriwi et al. [41]. A larger domain in the streamwise direction is used for TCHP and OC4 as these structures have multiple members spread apart, covering a larger plan area. The meshes for the simulations are generated using OpenFOAM’s blockMesh, refineMesh, and snappyHexMesh facilities. To capture the flow separation in the wake of the structures, the mesh is refined locally, and the aspect ratio is kept close to 1. Figure 4, Figure 5, Figure 6 and Figure 7 show the plan views from the top profile view at y / D = 0 of the computational meshes for the four structures. A refined area has been added around the structure to capture the wake.
For boundary conditions, a uniform streamwise velocity is defined at the inlet, and a no-slip boundary condition is defined at the surfaces of structures. Pressure is defined as a zero gradient at the inlet, whereas at the outlet, a fixed value of zero is specified. In addition, the boundary conditions for k and ω are specified based on the following equations:
k = 3 2 ( I U ) 2 , ω = ρ k μ μ t μ 1 ,
where I is the turbulent intensity, U is the free-stream velocity, ρ is the density of the fluid, and μ t / μ is the ratio between the turbulent and molecular viscosities. To specify the initial conditions of k and ω , I of 1.0 % and μ t / μ of 10 3 are adopted. A symmetry boundary condition is defined at all remaining boundaries (Table 2). This gives a zero gradient to the scalar and tangential components of vector variables and a zero fixed value of the normal component to the plane [42]. The air–water interface is approximated with a shear-free (symmetry) boundary condition. The influence of a free surface on hydrodynamics is reserved for future work. The simulations are run in OpenFOAM [40]. A second-order bounded scheme is adopted for time-step discretisation. The advective terms and transport equations for k and ω are discretised by first/second-order accurate total variation diminishing (TVD) schemes, whereas a second-order linear scheme is defined for the diffusion terms. For pressure–velocity coupling, the PISO algorithm (pressure-implicit with splitting of operators) is used [43]. The Generalized Geometric–Algebraic MultiGrid (GAMG) solver with a GaussSeidel smoother is used to solve the pressure equation. For velocity and turbulence quantities, smoothSolver with a symGaussSeidel smoother is adopted. For all the variables, a tolerance of 10 8 is specified throughout the simulation. The simulations are run at a non-dimensional time step ( Δ T * = Δ T U / D ) = 0.00417 up to a duration of Δ T * = 420. The simulations are run from uniform initial conditions until a statistically steady state is reached before data collection is commenced. The C ¯ d is monitored throughout the simulations to ensure a steady state is reached.

2.2. Validation of Flow Past a Finite Cylinder

The flow past a surface-piercing finite cylinder with a submerged free end has received far less attention than the flow past an infinite or finite cylinder resting on the bed. There are only a few works which have investigated the flow past a finite cylinder with a free end [44]. Benitz et al. [44] studied the flow past finite cylinders of A R ranging from 1 to 19 at R e = 2900 to understand the effect of A R change on force coefficients and vortex shedding. Similarly, Rosetti et al. [45] and He et al. [46] investigated the flow past a finite cylinder of A R = 2 at R e = 43,000. The former validated the numerical simulations against experiments, whereas the latter investigated the vortex-induced vibration of a finite cylinder. So far, there are no studies investigating the flow past a finite cylinder at high R e . However, inferences can be made from flow past a bed-resting finite cylinder of A R = 2 . Frederich et al. [47] compared two different numerical methodologies for flow past a finite cylinder of A R = 2 resting on the bed at R e = 200,000. Therefore, these works are chosen to validate flow past FC of A R = 2 at R e = 2900, 43,000, and 200,000. In this work, the coefficient of drag ( C ¯ d ) of the simulations is compared to C ¯ d reported in the literature. The C ¯ d is given as follows:
C ¯ d = F ¯ d 1 2 ρ U 2 A r e f ,
where F ¯ d is the ensemble-averaged drag force, ρ is the fluid density, U is the free-stream velocity, and A r e f is the projected area of the structure. A mesh independence study is carried out for flow past an FC at each R e , and C ¯ d is reported in Table 3, along with C ¯ d reported in the literature. Although the C ¯ d of the simulations at R e = 2900 and 43,000 agree well with those reported in the literature, there is a difference at R e = 200,000. This is attributed to differences in boundary conditions. In the literature, a bed-resting finite cylinder is considered, whereas here, a surface piercing cylinder is adopted.

3. Results

In this section, results of numerical simulations of flow past FC, FCHP, TCHP, and OC4 at R e = 2900, 43,000, and 200,000 are presented. At the onset, the C ¯ d of all four structures for R e = 2000 to 200,000 is presented in Figure 8 to understand the variation in C ¯ d with respect to R e . It is clear from the plots that adding structural members increases the C ¯ d of the structures; however, there is no significant change with increasing R e . Gonçalves et al. [49] showed that for a finite cylinder of given A R , C ¯ d is independent of R e , except for A R = 0.2 . The projected area of TCHP is thrice that of FCHP. Therefore, it is expected that it will experience a drag force thrice that of FCHP. In other words, the C ¯ d of TCHP and FCHP should be the same. However, the differences in C ¯ d of TCHP and FCHP at some R e can be attributed to the flow interference of upstream structures on downstream members. Figure 9 shows the viscous ( C ¯ f ) and pressure drag ( C ¯ p ) coefficients acting on all the structures for R e = 2000 to 200,000. Although the variation of total C ¯ d with R e is insignificant, the C ¯ f decreases with increasing R e and a reverse trend for C ¯ p . This shows that pressure drag dominates over friction drag as R e increases. The heave plate of FCHP significantly increases C ¯ f compared to FC. This is attributed to higher friction on the heave plate, as presented in the streamwise friction results later in this section. However, adding more cylinders with plates, as in the case of TCHP, did not increase C ¯ f compared with FCHP. This is attributed to the rear members experiencing lower friction due to the wake effect of the leading member. Also, adding pontoons and braces increases viscous drag acting on the OC4. Interestingly, the variation of C ¯ f with R e for FC resembles the variation in C ¯ d with R e for an infinite cylinder, as can be seen in [50]. Apart from the total C ¯ d and C ¯ f , an investigation on comparison of individual contributions of each member of the structures is also necessary. Also, in cases of TCHP and OC4, where the flow is symmetrical around the structure, the difference between C ¯ d acting on the two rear members is of the order ≤10−7. Figure 10 shows the drag coefficient ( C ¯ d m ) contributions of individual structural members of structures normalised by the total C ¯ d of the structure. Across all three different structures, the contribution of the individual members varies with R e . The contribution of the cylinders is higher than that of heave plates across all structures. Gonçalves et al. [49] observed that C ¯ d is directly related to A R . This explains the higher C ¯ d m / C ¯ d of finite cylinders compared to heave plates, which are shorter and thicker. Further, variations in C ¯ d m / C ¯ d with respect to R e of cylinders are similar to the variation of C ¯ d with R e for an infinite cylinder, suggesting that the flow regime is similar for finite and infinite cylinders [50]. The C ¯ d m / C ¯ d of heave plates increases until R e 30,000, after which the variation is insignificant. A similar variation of C ¯ d is observed for finite cylinders of A R = 0.2 [49]. This variation is attributed to three-dimensionality in the wake due to the formation of recirculating flow under the heave plates ( A R = 0.35 ), as has been presented in the flow visualisation results later in this section. Although the contributions of central cylinders and braces and pontoons vary from a low R e until R e 10,000, these are mostly independent of R e as R e increased (Figure 10c). This is due to a reduction in the wake effect from upstream members. In the case of TCHP and OC4, the contribution of leading members is lower than that of rear members (Figure 10b,c). This is also observed in the flow past infinite circular cylinders in an equilateral triangle arrangement with various spacing to diameter ( δ = d / D ) ratios. When the cylinders are closely placed ( δ 1.5 ), the C ¯ d acting on the rear cylinders is lower than on an infinite cylinder due to the wake effect of the front cylinder. However, as the spacing ratio between cylinders increases ( δ 2.5 ), this wake effect decreases, and the vortex shed by each cylinder is independent of each other, thereby increasing drag on rear members. Also, wake suppression by rear cylinders reduces drag on the front cylinder [51,52,53,54]. It should be noted that δ of TCHP and OC4 are ∼4.1; this explains the higher contribution of rear members than leading members towards total drag. The contribution of the central cylinder is the lowest, whereas the contribution of braces and pontoons is substantially high, showing that the central cylinder experiences low drag due to the wake effect of the front cylinder.
Further, adding more structural members is expected to influence the flow behaviour in the vicinity of the structures. Streamlines of time-averaged streamwise velocity are presented to understand the flow physics around floating structures. Figure 11 shows the mean velocity streamlines in the wake of FC at R e = 2900 . Figure 11a shows two symmetric vortex cores formed in the near wake of the FC, whereas Figure 11b shows a recirculating flow in the near wake. Also, a recirculation zone is formed behind the cylinders due to upward flow. The fluid flows down along the sides of the cylinder and then under the free end in the upstream direction. Similarly, Figure 12 shows velocity streamlines in the wake of FCHP. Although symmetric vortex cores are formed in the near wake (Figure 12a), these are not as distinct as in the case of FC. However, the recirculation zones in the near wake and under the heave plate are much more distinct compared with FC (Figure 12b). The effect of multiple heave plates of TCHP and central cylinder and braces of OC4 on the flow behaviour is presented in Figure 13 and Figure 14, respectively, for R e = 2900 . Similar to the FCHP, the vortex cores formed behind the front cylinder of the FCHP are not as distinct as in the case of FC, showing the effect of the heave plate (Figure 13a). Further, vortex cores behind the two back cylinders are not symmetric due to the influence on the flow field from the upstream structure. Similar to the FCHP, two distinct recirculation zones are formed behind the front cylinder and under the heave plate (Figure 13b). In the case of OC4, the central cylinder slightly inhibits the formation of vortex cores behind the front cylinder. Also, similar to TCHP, the effect of the upstream members on the vortex cores behind the two back cylinders can be observed (Figure 14a). However, the inclined cross-brace between the front and the central cylinder restricts the recirculation region behind the front cylinder. Also, recirculating flows can be observed under the heave plate (Figure 14b). Similar recirculating flow and vortices are also seen at R e = 43,000 and 200,000, and flow visualisation plots are presented in Appendix A.1.
The vortices and recirculating flow around the structures influence the distribution of pressure and friction acting on the structures. Therefore, analyses of pressure and friction coefficients on structures are essential. The recirculating flows under the heave plates are the negative pressure pockets that exert considerable pressure on the structures in a downward direction. FOWT platforms are subjected to dynamic movement in response to hydrodynamic loading. Therefore, investigation of downward force is essential. Figure 15 shows the vertical force coefficient ( C ¯ V ) normalised by the density ( ρ ), free-stream velocity ( U ), and projected area of structures in the vertical direction ( A b ) and vertical force ( F ¯ V ), respectively. Adding the heave plate and braces significantly increases the downward vertical force. This is further evident from the C ¯ V plot. Although the FC experiences significantly less F ¯ V than other structures, a lower A b leads to a higher C ¯ V . Further, the C ¯ V increases with R e for R e 40,000. This increase in C ¯ V acting on FC can be attributed to the change in the recirculating flow under the free end of the FC, as can be seen in Figure 16. Here, the recirculation zone under the free end of the FC can be observed at R e = 2900, 10,000, 100,000, and 200,000. The zone is largest at R e = 200,000 and lowest at R e = 2900 , and the size increases with increasing R e . This increase in size is due to the increase in flow going downwards along the back of FC and then under the free end.
Further, it is expected that the vertical pressure on the bottom surfaces of structures will vary due to recirculating flow. Therefore, an investigation of the vertical pressure variation is necessary as it will lead to differential forcing on the bottom surfaces of the structures. Figure 17 shows the vertical pressure coefficient on the surfaces of free ends of FC, FCHP, TCHP, and OC4 at R e = 2900 and 200,000, respectively. Across all the structures, the negative coefficient shows that the pressure is in the downward direction. The highest pressure is experienced at R e = 200,000, and pressure varies across the surface in the streamwise direction, with the highest force acting near the leading edge and gradually decreasing with the lowest pressure near the rear edge. In the cases of TCHP and OC4, the bottom surfaces of upstream members experience lower negative pressure than the members at the rear, with some parts of the cross-braces of OC4 experiencing very high pressure. The gradient increases across the surfaces as the R e increases. This pressure variation on surfaces depends on the area covered by the recirculation zone over the bottom surfaces. Similarly, vertical pressure variation is also observed at R e = 43,000 for all structures and is included in Appendix A.3. For FOWT platforms, quantifying this differential forcing on the members is essential for accounting for the stress acting on the mooring system, designing individual members, and choosing construction materials.
In addition to pressure in the vertical direction, FOWT foundations are also subjected to streamwise pressure and friction, and both are expected to vary on the surfaces of the structures. Figure 18 shows the streamwise pressure coefficient acting on FC, FCHP, TCHP, and OC4 at R e = 200,000. The pressure coefficient acting on the surface of cylinders can be divided into three zones: the green zone where the pressure is highest, the red zone on the side where pressure is lowest, and the yellow zone in between where the pressure transitions. At the front surface, where the streamwise flow impinges orthogonally, the velocity is minimum; therefore, pressure is maximum. As the fluid flows on either side of the cylinders, it accelerates, decreasing the pressure (red zone). The thin vertical zone between these two zones is where the pressure transitions. Similar to cylinders, the front surfaces of heave plates of FCHP, TCHP, and OC4 experience considerable pressure. However, the width of the high-pressure zone on the front surfaces of heave plates is not uniform. This is attributed to the incoming flow separating with a portion moving downward towards the lower edge and the rest towards the upper edge of the plate. In the case of OC4, the pressure on the central cylinder is negative, indicating that the cylinder is within the wake of the front cylinder. The pressure on braces varies; for example, the pressure on the upper half of the inclined brace connecting the central cylinder to the outer cylinder is higher than the lower half. The sections of horizontal braces which are within the wakes of the front cylinder or central cylinder experience negative pressure compared with the rest of the members.
An investigation of friction acting on the surfaces of structures is also important. It has implications on the type of corrosion and bio-fouling preventive coating to be selected, as well as general maintenance of the floating structures. Figure 19 shows the friction coefficient acting on the front and bottom surfaces of FC, FCHP, TCHP, and OC4 at R e = 200,000. The streamwise friction on the cylinder surfaces can be distinguished into two sections: the section in the middle where the friction is least due to velocity being lowest and the two zones on either side where friction is maximum. These are the two sections where the flow accelerates along the surface, increasing friction. Similarly, the sides of heave plates of FCHP, TCHP, and OC4 experience higher friction than the front surfaces. In the case of FCHP, TCHP, and OC4, the highest friction is experienced on the top and sides of heave plates. The negative friction on top of heave plates is due to a small upstream flow from recirculating flows formed at the junction of the heave plate and cylinder (Figure 13b). Only the lower half of the central cylinder of OC4 experiences significant friction. This is due to the rest of the cylinder being within the wake of the front cylinder. Clearly, the friction on the surfaces of the cross-braces varies; for example, the rear half of the horizontal braces connecting the front and back heave plates is where friction is highest. Meanwhile, the friction on the leading half is very low due to the wake influence of the front cylinder. This is also the case for the horizontal brace between the front heave plate and the central cylinder. The friction on the brace connecting the central cylinder to the back heave plates and the brace between the two back heave plates is substantially high. This is because these members are outside the wake effect of upstream members. Also, on their surfaces, small sections of negative friction can be observed; this is due to small pockets of recirculating flow being formed. The negative friction on the front and back surfaces of the inclined brace connecting the front and central cylinder shows the influence of recirculating flow in the wake of the front cylinder. Also, similar to the central cylinder, high friction is restricted to the sides of its lower half. For the inclined braces at the rear, the highest friction is on the sides compared with the front surface facing the flow orthogonally.
The friction on the free end is due to flow along the surface moving upstream in the recirculation zone (Figure 19b), hence negative friction. In the case of FC, the friction on the free surface can be divided into two symmetric sections. This is due to fluid in the vortex cores behind the cylinder flowing down along the two sides and then under the free surface. The central ridge is where fluid from either side meets, increasing the friction. For TCHP and OC4, friction on the bottom surfaces of heave plates can be divided into red and green zones. The recirculating flow under the heave plates is responsible for high friction (red zone), with the flow being upstream along the surface. The friction is positive near the rear edge because the flow is downstream and attaches behind the recirculation region, as seen in Figure 13b. Also, the friction varies from the middle section moving towards the leading edge. This is because the flow velocity of the recirculation flow is higher near the middle section, and the flow decelerates moving upstream. The pressure and friction coefficient variation of all three structures at R e = 2900 and 43,000 are presented in Appendix A.3.

4. Discussion

In this study, the OC4 semi-submersible platform developed by NREL for the DeepCWind project is chosen as a baseline FOWT foundation to numerically study the influence of structural members on hydrodynamic loading due to uni-directional current flow on a static structure. The investigation has been divided into four stages: in the first stage, a simple truncated/finite cylinder (FC) and in the second stage, a finite cylinder with a heave plate (FCHP) are considered. In the third stage, three cylinders with heave plates (TCHP) arranged in an equilateral triangular arrangement are considered. During the final stage, a central cylinder and braces are added to the TCHP to obtain the OC4 semi-submersible platform. Force analyses are carried out for each structure for three different Reynolds numbers ( R e = u D / ν , where u is the velocity, D is the diameter, and ν is the kinematic viscosity of the fluid), R e = 2900, 43,000, and 200,000.
The addition of members at each stage increases the drag coefficient ( C ¯ d ) acting on the structure for each R e . Although C ¯ d has remained relatively constant with increasing R e , analyses of viscous drag coefficient ( C ¯ f ) and pressure drag coefficient ( C ¯ p ) have shown that C ¯ f decreases with increasing R e , whereas C ¯ p increases with R e . This indicates the dominance of pressure drag over friction drag at higher R e . The FCHP experiences significantly high C ¯ f compared to FC, comparable with that of OC4. TCHP experiences lower C ¯ f than FCHP because of low viscous drag on rear members due to the wake effect. An investigation of individual contributions of members of FCHP, TCHP, and OC4 show that the contributions vary with R e . The cylinders’ contribution is higher than that of the heave plates, showing that the contribution is directly dependent on A R . In the case of TCHP and OC4, the contribution of the rear members is higher than the leading members due to wake suppression of rear members. The contribution of heave plates increases until R e 30,000 due to three-dimensionality in the wake of the structures. In the case of OC4, the contribution of the central cylinder is the least among all members due to the wake effect of the front cylinder, whereas the contribution of braces and pontoons is similar to that of the back cylinders. Further, as observed in the works of Kawamura et al. [55], Okamoto et al. [56], and Benitz et al. [44], in this work, no vortex shedding is observed for finite structures with an A R = 2 . Benitz et al. [44] observed vortex shedding increases with increasing A R of the finite cylinder, with vortex shedding completely suppressed for cylinders with A R 3 . Flow visualisation in the vicinity of the structures showed two symmetric vortex cores and recirculating flow in the wake of FC. Similar vortices are formed behind each of the cylinders of FCHP, TCHP, and OC4, with recirculation zones formed under the heave plates. The recirculating flow under the structures exerts vertical force in a downward direction, and the addition of heave plates substantially increases this vertical force. Further, this vertical force is observed to vary across the bottom surfaces of structures. On the bottom surfaces of the free end of FC and heave plates, the highest vertical force is near the leading edge of the surface and gradually decreases in a downstream direction such that the lowest force is observed close to the rear end. Also, in the case of TCHP and OC4, leading members are subject to higher vertical force than rear members.
The streamwise pressure coefficient on the surface of the FC can be distinguished into three different sections: a green zone on the front where the force is highest, a red zone on the sides of the FC where the pressure is negative, and a transition zone in between. Three similar zones are also observed on the cylinder surfaces of FCHP, TCHP, and OC4. However, the pressure on most of the central cylinders is negative because of the wake effect of the front cylinder. The pressure coefficient on the braces varies from negative to positive depending on whether the member is within the wake of an upstream member or in the free stream. Similar to the streamwise pressure coefficient, analyses of the streamwise friction coefficient are also presented. In the case of FC, the friction is highest on the sides of the front surface where the streamwise flow accelerates. The friction on the surface of the free end is negative due to the flow along the surface being upstream. Similarly, friction on the sides of the cylinders of FCHP, TCHP, and OC4 is substantial; however, the highest friction is on the top surfaces and sides of heave plates. The friction on the bottom surfaces of heave plates varies in the streamwise direction, with friction being negative on the leading and middle sections where friction is positive on the rear edge. The negative friction is due to recirculating flow along the bottom surfaces of heave plates upstream. Near the rear edge, streamwise flow is attached to the surfaces behind the recirculation zone. Only the sides of the lower half of the central cylinder experience high friction compared with the rest of the cylinder. The friction on the braces varies depending on their location in the OC4, with parts of the braces experiencing higher friction than the rest.

5. Conclusions

In this work, the flow past floating offshore wind turbine platforms is detailed. Numerical studies are used to quantify the change in hydrodynamic loading with increasing structural complexity. It is shown that subject to uni-directional flow, increasing geometric complexity leads to an increase in drag coefficient ( C ¯ d ). Compared to FC, the addition of cylinders, heave plates, braces, and pontoons increased C ¯ d by ∼23.6%, averaging R e = 2000 to 200,000. However, there is no significant change in the drag coefficient with increasing R e for any of the structures. However, analyses of viscous ( C ¯ f ) and pressure drag ( C ¯ p ) coefficients show that where the former decreases with increasing R e , where the latter shows a reverse trend. Also, C ¯ p increases with increasing complexity. Although C ¯ f increases significantly with the addition of a heave plate to the finite cylinder, there is no further increase with increasing structural complexity, and C ¯ f of FCHP is comparable with that of OC4. An investigation into individual contributions of members towards total drag shows that contributions vary with R e . The contributions of cylinders are higher than those of heave plates, showing that contributions are directly related to A R . The contributions of heave plates vary until R e 30,000 due to three-dimensionality in the wake. In the case of TCHP and OC4, the contribution of rear members toward C ¯ d is higher than that of leading members. The combined contribution of one rear cylinder and heave plate of TCHP towards C ¯ d is ∼8.5% higher than the combined contribution of the leading cylinder and heave plate, and the same for OC4 is ∼16.84%. This indicates that the wake effect of rear members is stronger than that of leading members. The low contribution of the central cylinder is attributed to the wake effect of the front cylinder, whereas the contribution of braces and pontoons is ∼14.86% of total C ¯ d . Further, for a typical minimum shelf sea tidal velocity of 0.02 m / s [57], OC4 cylinder diameter of 12 m , and C ¯ d = 0.884 at R e = 200,000, the drag force acting on the OC4 is ∼202 N . Flow visualisation in the vicinity of the structures showed unique flow behaviour, such as upwash, recirculating flow, and vortices in the wake of the structures. The additional structural members significantly increase vertical force acting on the structures, with the vertical force coefficient varying strongly with R e due to changes in recirculating flow in the wake of the structure. Variation of vertical pressure on the free end along the streamwise direction is observed across all structures, with downward pressure on the leading edge and upward near the rear. Streamwise pressure is highest on the front surfaces of members facing orthogonally to the flow. The highest friction is on the sides of the cylinder and the top surfaces of heave plates. Also, friction varies on the bottom surfaces of heave plates due to recirculation flow. The friction is negative in the leading and central regions due to the flow being upstream, whereas near the rear end, where the flow is reattached and is in the downstream direction, experiences positive friction. These findings are important for designing improvements not only of individual components and whole FOWT platforms but also of their mooring and anchoring systems. Furthermore, this can feed into the choice of structural material and designing of corrosion and biofouling-resistant paints for offshore structures. This, in turn, can help in decision-making for the construction and maintenance of FOWT platforms, leading towards the development of cost-effective FOWT platforms.

Author Contributions

N.D. wrote and coordinated contributions to the paper. C.J.L. contributed to the Abstract, Introduction, and Methodology. R.M.D. and J.W. provided suitable corrections, comments, and suggestions. All authors have read and agreed to the published version of the manuscript.

Funding

R.M.D. acknowledges the support of NERC, grant number NE/S014535/1. C.J.L. was supported by an Early Career Fellowship funded by the Leverhulme Trust. N.D. acknowledges the support of Offshore Renewable Energy Catapult and EPSRC, grant number EP/S023763/1 and project reference 2852987. We acknowledge the Viper High Performance Computing facility of the University of Hull and its support team.

Institutional Review Board Statement

The study is conducted as part of PhD research at the Energy and Environment Institute, University of Hull. This research does not involve humans and/or animals.

Data Availability Statement

Conflicts of Interest

The authors declare no conflicts of interest.

Abbreviations

The following abbreviations are used in this manuscript:
MDPIMultidisciplinary Digital Publishing Institute
DOAJDirectory of Open Access Journals
FOWTFloating Offshore Wind Turbine
FCFinite Cylinder
FCHPFinite Cylinder with Heave Plate
TCHPThree Cylinders with Heave Plates
OC4OC4 Semi-submersible Platform
R e Reynolds Number
NRELNational Renewable Energy Laboratory
TLPTension-Leg Platform
C ¯ d Time-averaged Drag Coefficient
C ¯ f Time-averaged Viscous Drag Coefficient
C ¯ p Time-averaged Pressure Drag Coefficient
C ¯ v Time-averaged Vertical Force Coefficient

Appendix A

Appendix A.1. Numerical Validation of the Eddy Viscosity Model

The flow past an infinite cylinder at R e = 3900 has been extensively studied experimentally and numerically, providing a wide range of datasets. Therefore, the accuracy of the k ω SST model is numerically verified for unidirectional flow past an infinite cylinder at R e = 3900 against the works of [58,59]. The size of the computational domain is 10 x / D 40 in streamwise, 12 x / D 12 in cross-stream, and 0 x / D 3 in vertical directions, where D is the diameter of the cylinder. The simulations are carried out with five hexahedral meshes of increasing resolution from 500 k to 3012 k cells. The turbulent quantities k and ω are initialised based on turbulence intensity ( I ) of 0.2% and a ratio of turbulent to molecular kinematic viscosity ( ν t / ν ) of 10 3 . A uniform streamwise velocity is specified at the inlet and Dirichlet boundary conditions at the cylinder wall. For pressure, a Neumann boundary condition is adopted at the inlet and outlet, whereas it is set to zero at the cylinder wall. The initial conditions for turbulent kinetic energy k and ω are calculated based on Equation (A1).
k = 3 2 ( I U ) 2 , ω = ρ k μ μ t μ 1 ,
where I is the turbulent intensity, U is the free-stream velocity, ρ is the density of the fluid, and μ t / μ is the ratio between the turbulent and molecular velocity. Near the wall, the k is expected to be very low, whereas ω increases; therefore, a low value for k and a high value for ω is specified at the wall. At the top, bottom, and side boundaries, a symmetry boundary condition is specified. The simulations were run on OpenFOAM, which is a leading open-source computational fluid dynamics software developed by OpenFOAM Foundation [40]. A second-order, implicit scheme is used for time discretisation. The gradient terms are discretised using the Gauss linear scheme, whereas a total variation diminishing (TVD) scheme, which is first/second-order accurate, is specified for the convective terms. A second-order Gauss linear scheme is specified for Laplacian terms.
The time-averaged drag coefficient ( C ¯ d ) acting on the cylinder is calculated as follows:
C ¯ d = F ¯ d 1 2 ρ U 2 A r e f ,
where F ¯ d is the ensemble-averaged drag force, ρ is the dynamic density of the fluid, U is the free stream velocity of the fluid, and A r e f is the projected area of the cylinder. The C ¯ d acting on the cylinder ranged between 1.00 and 0.998 across all the simulations, where the C ¯ d in [58,59] are 1.245 and 0.98, respectively. Karman vortex street, a feature observed in the wake of infinite cylinders, is vortices shed alternatively from either side of the cylinder. The non-dimensionalised frequency Strouhal number ( S t ) associated with this periodic vortex shedding is given as follows:
S t = f D U ,
where f is the vortex shedding frequency, D is cylinder diameter, and U is free stream velocity. S t for the simulations is ∼0.19, whereas S t reported by [58,59] are 0.211 and 0.208 ± 0.002 , respectively. Further, velocity deficit profiles in the wake of the cylinder at x / D = 1.06 and 1.54 are compared against those reported in [59]. Figure A1 shows the velocity profiles for all five simulation runs in [59]. Clearly, at x / D = 1.06 , the simulation results agree very well with the literature; however, at x / D = 1.54 , although the simulation results converge, the velocity profiles are under-predicted compared with [59]. This is also observed in the numerical work of [58]. Nevertheless, URANS with the k ω SST model can resolve past cylinders and, therefore, have been adopted in further numerical study.
Figure A1. Time-averaged streamwise velocity profiles in the cross-stream direction normalised by free-stream velocity ( U ¯ / U ) at x / D = 1.06 (a) and 1.54 (b) for each simulation run and the results reported in [59]. The velocity profiles at x / D = 1.06 agree very well with the results in literature. However, at x / D = 1.54 , although simulation results converge, simulations underestimate velocity deficit compared with [59]. This difference is also reported in [58].
Jmse 13 00248 g0a1

Appendix A.2. Flow Visualisation at Re = 43,000

This section presents flow visualisation in the wake of FC, FCHP, TCHP, and OC4 at R e = 43,000 and 200,000. Similar to the R e = 2900 case, vortices and recirculation zones are formed in the near wake of the structures. The influence of upstream members can be seen on the vortices behind the back cylinders of TCHP and OC4. In the case of OC4, only one vortex core is formed behind each back cylinder.
Figure A2. Flow visualisation in the wake of FC at R e = 43,000 showing the formation of two vortex cores (left) and recirculating flow (right).
Jmse 13 00248 g0a2
Figure A3. Flow visualisation in the wake of FCHP at R e = 43,000 showing symmetric vortices in the near wake (left) and recirculation zones behind the cylinder and under the heave plate (right).
Jmse 13 00248 g0a3
Figure A4. Flow visualisation wake of TCHP at R e = 43,000 showing symmetric vortex cores behind each cylinder (left), though the influence of upstream member on vortices behind back cylinders can be seen. The effect of the heave plate reduces the size of the recirculation zone behind the cylinder (right).
Jmse 13 00248 g0a4
Figure A5. Flow visualisation in wake of OC4 at R e = 43,000. Only one vortex core is formed behind each back cylinder (left). Recirculation flow behind the front cylinder is restricted by the inclined cross-brace (right).
Jmse 13 00248 g0a5
Figure A6. Time-averaged streamwise velocity streamlines around the FC at R e = 200,000: plan view of the FC from top (left) and profile view on a vertical plane (right).
Jmse 13 00248 g0a6
Figure A7. Flow visualisation in the wake of FCHP at R e = 200,000. Unlike R e = 2900 and 43,000, vortices in the wake are less distinct (left). However, similar to the other two cases, recirculation regions are formed under the heave plate and behind the cylinder (right).
Jmse 13 00248 g0a7
Figure A8. Flow visualisation in the wake of TCHP at R e = 200,000 showing the symmetric vortices behind cylinders (left) and recirculating flows (right).
Jmse 13 00248 g0a8
Figure A9. Mean streamwise velocity streamlines in the wake of OC4 at R e = 200,000. A single vortex core is formed behind each of the back cylinders of OC4 (left). Similar to TCHP, recirculating flow can be observed behind the front cylinder and the heave plate (right).
Jmse 13 00248 g0a9

Appendix A.3. Pressure and Friction Coefficient Results

In this section, vertical pressure coefficients for all structures are presented at R e = 43,000. Similar to the other two R e cases, vertical pressure varies in a streamwise direction on the free end of FC and bottom surfaces of TCHP and OC4.
Figure A10. Vertical pressure coefficient acting on FC (top left), (top right), TCHP (bottom left), and OC4 (bottom right) at R e = 43 , 000 . The pressure varies across the surfaces of the free end of FC and heave plates of FCHP, TCHP, and OC4. This is attributed to recirculating flows under the heave plates.
Jmse 13 00248 g0a10
Also, the streamwise pressure coefficient for all structures is presented in Figure A11 at R e = 2900 and in Figure A12 at R e = 43,000. Similar to the R e = 200,000 cases, the highest pressure is on the front surfaces of FC and cylinders of TCHP and OC4. Also, the two red zones on either side are where the pressure is minimal as the flow accelerates.
Figure A11. Streamwise pressure coefficient at R e = 2900 on FC (top left), FCHP (top right), TCHP (bottom left), and OC4 (bottom right). The front surfaces of FC and cylinders of FCHP, TCHP, and OC4 are where pressure is at its maximum.
Jmse 13 00248 g0a11
Figure A12. Streamwise pressure coefficient at R e = 43,000 on FC (top left), FCHP (top right), TCHP (bottom left), and OC4 (bottom right). Similar to R e = 2900 cases, the front surfaces of FC and cylinders of FCHP, TCHP, and OC4 are where pressure is at its maximum.
Jmse 13 00248 g0a12
Figure A13 and Figure A14 show the streamwise friction coefficients on FC at R e = 2900 and 43,000, respectively. Negative friction on free surfaces of free ends is due to flow being upstream. At R e = 2900 , the highest friction is at the leading edge; however, at R e = 43,000, friction is high on the rear half of the free end. The friction is least on the front surface where pressure is maximum, and friction is maximum on either side due to flow acceleration. The streamwise friction coefficient for TCHP for R e = 2900 and 43,000 are presented in Figure A17 and Figure A18, respectively. Similar to the R e = 200,000 case, the friction varies on the free ends on heave plates due to recirculation zones. There is considerable friction on the top surfaces of heave plates and sides of cylinders. A similar trend can be seen in the case of OC4 at R e = 2900 (Figure A19) and at R e = 43,000 (Figure A20). Similar to R e = 200,000, the friction on braces varies depending on whether sections of braces are within the wake of the upstream member.
Figure A13. Streamwise friction coefficient on the free end (left) and front surface of FC (right) at R e = 2900 . The highest friction is at the leading edge of the free end whereas on front surface friction is highest where the flow accelerates.
Jmse 13 00248 g0a13
Figure A14. Streamwise friction coefficient on the free end (left) and front surface of FC (right) at R e = 43,000. Friction increases on the surface of the free end in a streamwise direction.
Jmse 13 00248 g0a14
Figure A15. Streamwise friction coefficient on the bottom surface of the heave plate (left) and cylinder and the top surface of the heave plate (right) at R e = 2900 .
Jmse 13 00248 g0a15
Figure A16. Streamwise friction coefficient on the bottom surface of the heave plate (left) and cylinder and the top surface of the heave plate (right) at R e = 43,000.
Jmse 13 00248 g0a16
Figure A17. Streamwise friction coefficient at R e = 2900 on bottom surfaces of TCHP (left) and the rest of TCHP (right).
Jmse 13 00248 g0a17
Figure A18. Streamwise friction coefficient at R e = 43,000 on bottom surfaces of TCHP (left) and the rest of TCHP (right).
Jmse 13 00248 g0a18
Figure A19. Streamwise friction coefficient at R e = 2900 on bottom surfaces of OC4 (left) and the rest of OC4 (right).
Jmse 13 00248 g0a19
Figure A20. Streamwise friction coefficient at R e = 43,000 on bottom surfaces of OC4 (left) and the rest of OC4 (right).
Jmse 13 00248 g0a20

References

  1. Global Wind Energy Council. Global Offshore Wind Report 2024. 2024. Available online: https://gwec.net/wp-content/uploads/2024/04/GWR-2024_digital-version_final-1.pdf (accessed on 29 July 2024).
  2. Sun, X.; Huang, D.; Wu, G. The current state of offshore wind energy technology development. Energy 2012, 41, 298–312. [Google Scholar] [CrossRef]
  3. Jacobsen, H.K.; Hevia-Koch, P.; Wolter, C. Nearshore and offshore wind development: Costs and competitive advantage exemplified by nearshore wind in Denmark. Energy Sustain. Dev. 2019, 50, 91–100. [Google Scholar] [CrossRef]
  4. Edwards, E.C.; Holcombe, A.; Brown, S.; Ransley, E.; Hann, M.; Greaves, D. Evolution of floating offshore wind platforms: A review of at-sea devices. Renew. Sustain. Energy Rev. 2023, 183, 113416. [Google Scholar] [CrossRef]
  5. Schneider, J.A.; Senders, M. Foundation design: A comparison of oil and gas platforms with offshore wind turbines. Mar. Technol. Soc. J. 2010, 44, 32–51. [Google Scholar] [CrossRef]
  6. Jacobsen, A.; Godvik, M. Influence of wakes and atmospheric stability on the floater responses of the Hywind Scotland wind turbines. Wind Energy 2021, 24, 149–161. [Google Scholar] [CrossRef]
  7. Castro-Santos, L.; Silva, D.; Bento, A.R.; Salvação, N.; Soares, C.G. Economic feasibility of floating offshore wind farms in Portugal. Ocean Eng. 2020, 207, 107393. [Google Scholar] [CrossRef]
  8. Uzunoglu, E.; Soares, C.G. Hydrodynamic design of a free-float capable tension leg platform for a 10 MW wind turbine. Ocean Eng. 2020, 197, 106888. [Google Scholar] [CrossRef]
  9. Leimeister, M.; Kolios, A.; Collu, M. Critical review of floating support structures for offshore wind farm deployment. J. Phys. Conf. Ser. 2018, 1104, 012007. [Google Scholar] [CrossRef]
  10. Risch, D.; Favill, G.; Marmo, B.; van Geel, N.; Benjamins, S.; Thompson, P.; Wittich, A.; Wilson, B. Characterisation of Underwater Operational Noise of Two Types of Floating Offshore Wind Turbines; Scottish Association for Marine Science (SAMS): Oban, UK, 2008. [Google Scholar]
  11. Jonkman, J.M. Dynamics Modeling and Loads Analysis of an Offshore Floating Wind Turbine; University of Colorado at Boulder: Denver, CO, USA, 2007. [Google Scholar]
  12. Wei, K.; Arwade, S.R.; Myers, A.T. Incremental wind-wave analysis of the structural capacity of offshore wind turbine support structures under extreme loading. Eng. Struct. 2014, 79, 58–69. [Google Scholar] [CrossRef]
  13. Cui, W.; Fu, S.; Hu, Z. Encyclopedia of Ocean Engineering; Springer: Berlin/Heidelberg, Germany, 2022. [Google Scholar]
  14. Bauer, J. NREL Floats New Offshore Wind Cost Optimization Vision. 2020. Available online: https://www.nrel.gov/news/program/2020/nrel-floats-new-offshore-wind-cost-optimization-tool.html (accessed on 1 August 2024).
  15. Tran, T.T.; Kim, D.H. The coupled dynamic response computation for a semi-submersible platform of floating offshore wind turbine. J. Wind Eng. Ind. Aerodyn. 2015, 147, 104–119. [Google Scholar] [CrossRef]
  16. Tran, T.T.; Kim, D.H. Fully coupled aero-hydrodynamic analysis of a semi-submersible FOWT using a dynamic fluid body interaction approach. Renew. Energy 2016, 92, 244–261. [Google Scholar] [CrossRef]
  17. Robertson, A.N.; Wendt, F.; Jonkman, J.M.; Popko, W.; Dagher, H.; Gueydon, S.; Qvist, J.; Vittori, F.; Azcona, J.; Uzunoglu, E.; et al. OC5 project phase II: Validation of global loads of the DeepCwind floating semisubmersible wind turbine. Energy Procedia 2017, 137, 38–57. [Google Scholar] [CrossRef]
  18. Coulling, A.J.; Goupee, A.J.; Robertson, A.N.; Jonkman, J.M.; Dagher, H.J. Validation of a FAST semi-submersible floating wind turbine numerical model with DeepCwind test data. J. Renew. Sustain. Energy 2013, 5, 023116. [Google Scholar] [CrossRef]
  19. Wang, Y.; Chen, H.C.; Vaz, G.; Burmester, S. CFD simulation of semi-submersible floating offshore wind turbine under pitch decay motion. In Proceedings of the International Conference on Offshore Mechanics and Arctic Engineering, Scotland, UK, 9–14 June 2019; American Society of Mechanical Engineers: New York, NY, USA, 2019; Volume 59353, p. V001T01A002. [Google Scholar]
  20. Wang, L.; Robertson, A.; Jonkman, J.; Yu, Y.H. OC6 phase I: Improvements to the OpenFAST predictions of nonlinear, low-frequency responses of a floating offshore wind turbine platform. Renew. Energy 2022, 187, 282–301. [Google Scholar] [CrossRef]
  21. Wang, Y.; Chen, H.C.; Koop, A.; Vaz, G. Verification and validation of CFD simulations for semi-submersible floating offshore wind turbine under pitch free-decay motion. Ocean Eng. 2021, 242, 109993. [Google Scholar] [CrossRef]
  22. Li, H.; Bachynski-Polić, E.E. Experimental and numerically obtained low-frequency radiation characteristics of the OC5-DeepCwind semisubmersible. Ocean Eng. 2021, 232, 109130. [Google Scholar] [CrossRef]
  23. Robertson, A.N.; Gueydon, S.; Bachynski, E.; Wang, L.; Jonkman, J.; Alarcon, D.; Amet, E.; Beardsell, A.; Bonnet, P.; Boudet, B.; et al. OC6 Phase I: Investigating the underprediction of low-frequency hydrodynamic loads and responses of a floating wind turbine. J. Phys. Conf. Ser. 2020, 1618, 032033. [Google Scholar] [CrossRef]
  24. Robertson, A.; Bachynski, E.E.; Gueydon, S.; Wendt, F.; Schünemann, P. Total experimental uncertainty in hydrodynamic testing of a semisubmersible wind turbine, considering numerical propagation of systematic uncertainty. Ocean Eng. 2020, 195, 106605. [Google Scholar] [CrossRef]
  25. Burmester, S.; Vaz, G.; Gueydon, S.; el Moctar, O. Investigation of a semi-submersible floating wind turbine in surge decay using CFD. Ship Technol. Res. 2020, 67, 2–14. [Google Scholar] [CrossRef]
  26. Burmester, S.; Vaz, G.; el Moctar, O.; Gueydon, S.; Koop, A.; Wang, Y.; Chen, H. High-fidelity modelling of floating offshore wind turbine platforms. In Proceedings of the International Conference on Offshore Mechanics and Arctic Engineering, Virtual, 3–7 August 2020; American Society of Mechanical Engineers: New York, NY, USA, 2020; Volume 84416, p. V009T09A068. [Google Scholar]
  27. Wang, Y.; Chen, H.C.; Vaz, G.; Burmester, S. CFD simulation of semi-submersible floating offshore wind turbine under regular waves. In Proceedings of the ISOPE International Ocean and Polar Engineering Conference (ISOPE), Shanghai, China, 11–16 October 2020; p. ISOPE–I. [Google Scholar]
  28. Liu, Y.; Ge, D.; Bai, X.; Li, L. A CFD study of vortex-induced motions of a semi-submersible floating offshore wind turbine. Energies 2023, 16, 698. [Google Scholar] [CrossRef]
  29. Liu, Y.; Liu, F.; Wang, E.; Xiao, Q.; Li, L. The effect of base column on vortex-induced vibration of a circular cylinder with low aspect ratio. Ocean Eng. 2020, 196, 106822. [Google Scholar] [CrossRef]
  30. Benitz, M.A.; Schmidt, D.P.; Lackner, M.A.; Stewart, G.M.; Jonkman, J.; Robertson, A. Validation of hydrodynamic load models using CFD for the OC4-DeepCwind semisubmersible. In Proceedings of the International Conference on Offshore Mechanics and Arctic Engineering, St John’s, NF, Canada, 31 May–5 June 2015; American Society of Mechanical Engineers: New York, NY, USA, 2015; Volume 56574, p. V009T09A037. [Google Scholar]
  31. Ma, S.; Xu, D.k.; Duan, W.y.; Chen, J.k.; Liao, K.p.; Wang, H. The numerical study of viscous drag force influence on low-frequency surge motion of a semi-submersible in storm sea states. Ocean Eng. 2020, 213, 107511. [Google Scholar] [CrossRef]
  32. Berthelsen, P.A.; Baarholm, R.; Pa kozdi, C.; Stansberg, C.T.; Hassan, A.; Downie, M.; Incecik, A. Viscous drift forces and responses on a semisubmersible platform in high waves. In Proceedings of the International Conference on Offshore Mechanics and Arctic Engineering, Honolulu, HI, USA, 31 May–6 June 2009; Volume 43413, pp. 469–478. [Google Scholar]
  33. Apolinario, M.; Coutinho, R. Understanding the biofouling of offshore and deep-sea structures. In Advances in Marine Antifouling Coatings and Technologies; Elsevier: Amsterdam, The Netherlands, 2009; pp. 132–147. [Google Scholar]
  34. Maduka, M.; Schoefs, F.; Thiagarajan, K.; Bates, A. Hydrodynamic effects of biofouling-induced surface roughness—Review and research gaps for shallow water offshore wind energy structures. Ocean Eng. 2023, 272, 113798. [Google Scholar] [CrossRef]
  35. Edyvean, R. Biodeterioration problems of North Sea Oil and gas production—A review. Int. Biodeterior. 1987, 23, 199–231. [Google Scholar] [CrossRef]
  36. Polman, H.; Verhaart, F.; Bruijs, M. Impact of biofouling in intake pipes on the hydraulics and efficiency of pumping capacity. Desalin. Water Treat. 2013, 51, 997–1003. [Google Scholar] [CrossRef]
  37. Robertson, A.; Jonkman, J.; Masciola, M.; Song, H.; Goupee, A.; Coulling, A.; Luan, C. Definition of the Semisubmersible Floating System for Phase II of OC4; Technical Report; National Renewable Energy Lab. (NREL): Golden, CO, USA, 2014. [Google Scholar]
  38. Menter, F.R.; Kuntz, M.; Langtry, R. Ten years of industrial experience with the SST turbulence model. Turbul. Heat Mass Transf. 2003, 4, 625–632. [Google Scholar]
  39. Goupee, A.J.; Koo, B.; Lambrakos, K.; Kimball, R. Model tests for three floating wind turbine concepts. In Proceedings of the Offshore Technology Conference (OTC), Houston, TX, USA, 30 April–3 May 2012; p. OTC–23470. [Google Scholar]
  40. Greenshields, C. OpenFOAM v10 User Guide; The OpenFOAM Foundation: London, UK, 2022. [Google Scholar]
  41. Alkishriwi, N.; Meinke, M.; Schröder, W. A large-eddy simulation method for low Mach number flows using preconditioning and multigrid. Comput. Fluids 2006, 35, 1126–1136. [Google Scholar] [CrossRef]
  42. Greenshields, C.; Weller, H. Notes on Computational Fluid Dynamics: General Principles; CFD Direct Ltd.: Reading, UK, 2022. [Google Scholar]
  43. Issa, R.I. Solution of the implicitly discretised fluid flow equations by operator-splitting. J. Comput. Phys. 1986, 62, 40–65. [Google Scholar]
  44. Benitz, M.A.; Carlson, D.; Seyed-Aghazadeh, B.; Modarres-Sadeghi, Y.; Lackner, M.; Schmidt, D. CFD simulations and experimental measurements of flow past free-surface piercing, finite length cylinders with varying aspect ratios. Comput. Fluids 2016, 136, 247–259. [Google Scholar] [CrossRef]
  45. Rosetti, G.F.; Vaz, G.; Hoekstra, M.; Gonçalves, R.T.; Fujarra, A.L. CFD calculations for free-surface-piercing low aspect ratio circular cylinder with solution verification and comparison with experiments. In Proceedings of the International Conference on Offshore Mechanics and Arctic Engineering, Nantes, France, 9–14 June 2013; American Society of Mechanical Engineers: New York, NY, USA, 2013; Volume 55416, p. V007T08A056. [Google Scholar]
  46. He, J.w.; Zhao, W.w.; Wan, D.c.; Wang, Y.q. Numerical study of free end effect of cylinder with low aspect ratios on vortex induced motion. J. Hydrodyn. 2022, 34, 106–115. [Google Scholar] [CrossRef]
  47. Frederich, O.; Wassen, E.; Thiele, F. Prediction of the flow around a short wall-mounted finite cylinder using LES and DES1. JNAIAM 2008, 3, 231–247. [Google Scholar]
  48. Frederich, O.; Wassen, E.; Thiele, F.; Jensch, M.; Brede, M.; Hüttmann, F.; Leder, A. Numerical simulation of the flow around a finite cylinder with ground plate in comparison to experimental measurements. In New Results in Numerical and Experimental Fluid Mechanics VI: Contributions to the 15th STAB/DGLR Symposium, Darmstadt, Germany, 2006; Springer: Berlin/Heidelberg, Germany, 2006; pp. 348–355. [Google Scholar]
  49. Gonçalves, R.T.; Franzini, G.R.; Rosetti, G.F.; Meneghini, J.R.; Fujarra, A.L.C. Flow around circular cylinders with very low aspect ratio. J. Fluids Struct. 2015, 54, 122–141. [Google Scholar] [CrossRef]
  50. Schlichting, H.; Gersten, K. Boundary-Layer Theory; Springer: Berlin/Heidelberg, Germany, 2016. [Google Scholar]
  51. Gu, Z.; Sun, T. Classifications of flow pattern on three circular cylinders in equilateral-triangular arrangements. J. Wind Eng. Ind. Aerodyn. 2001, 89, 553–568. [Google Scholar] [CrossRef]
  52. Bao, Y.; Zhou, D.; Huang, C. Numerical simulation of flow over three circular cylinders in equilateral arrangements at low Reynolds number by a second-order characteristic-based split finite element method. Comput. Fluids 2010, 39, 882–899. [Google Scholar] [CrossRef]
  53. Zheng, S.; Zhang, W.; Lv, X. Numerical simulation of cross-flow around three equal diameter cylinders in an equilateral-triangular configuration at low Reynolds numbers. Comput. Fluids 2016, 130, 94–108. [Google Scholar] [CrossRef]
  54. Wang, R.; He, Y.; Chen, L.; Zhu, Y.; Wei, Y. Numerical simulations of flow around three cylinders using momentum exchange-based immersed boundary-lattice Boltzmann method. Ocean Eng. 2022, 247, 110706. [Google Scholar] [CrossRef]
  55. Kawamura, T.; Hiwada, M.; Hibino, T.; Mabuchi, I.; Kumada, M. Flow around a finite circular cylinder on a flat plate: Cylinder height greater than turbulent boundary layer thickness. Bull. JSME 1984, 27, 2142–2151. [Google Scholar] [CrossRef]
  56. Okamoto, S.; Sunabashiri, Y. Vortex shedding from a circular cylinder of finite length placed on a ground plane. J. Fluids Eng. 1992, 11, 512–521. [Google Scholar] [CrossRef]
  57. Vindenes, H.; Orvik, K.A.; Søiland, H.; Wehde, H. Analysis of tidal currents in the North Sea from shipboard acoustic Doppler current profiler data. Cont. Shelf Res. 2018, 162, 1–12. [Google Scholar] [CrossRef]
  58. Pereira, F.S.; Vaz, G.; Eça, L. Evaluation of RANS and SRS methods for simulation of the flow around a circular cylinder in the sub-critical regime. Ocean Eng. 2019, 186, 106067. [Google Scholar] [CrossRef]
  59. Parnaudeau, P.; Carlier, J.; Heitz, D.; Lamballais, E. Experimental and numerical studies of the flow over a circular cylinder at Reynolds number 3900. Phys. Fluids 2008, 20, 085101. [Google Scholar] [CrossRef]
Figure 2. The OC4 semi-submersible platform with the 5 MW baseline wind turbine, as conceptualised by NREL for developing numerical models [37].
Jmse 13 00248 g002
Figure 3. The study is carried out in four stages for each R e . These stages are stage 1: finite cylinder (FC), stage 2: finite cylinder with heave plate (FCHP), stage 3: three cylinders with heave plates (TCHP), and stage 4: OC4 semi-submersible platform (OC4). The diameter (D) and drafts (L) of cylinders are 0.24 m and 0.48 m , respectively.
Jmse 13 00248 g003
Figure 4. Computation mesh adopted for simulation past FC: (a) plan view of the mesh from the top showing the refined area; (b) profile view of the mesh through an xz plane at y / D = 0 .
Jmse 13 00248 g004aJmse 13 00248 g004b
Figure 5. Computation mesh similar to that of FC is adopted for FCHP: (a) plan view of the mesh from the top; (b) profile view through a slice in the streamwise direction.
Jmse 13 00248 g005
Figure 6. A typical computational mesh used for simulations past TCHP: (a) plan view of the mesh showing the refined zone in the mesh; (b) profile view of a slice through the domain in the streamwise direction.
Jmse 13 00248 g006
Figure 7. A mesh similar to that of TCHP is used for simulations past OC4: (a) plan view of the mesh from top with the refined region; (b) profile view of the mesh in the streamwise direction.
Jmse 13 00248 g007
Figure 8. Plot of time-averaged drag coefficient ( C ¯ d ) for all structures at R e = 2000 to 200,000. Adding more structural members increases the C ¯ d across all R e . However, no significant change with respect to R e is observed.
Jmse 13 00248 g008
Figure 9. (a) Plot of time-averaged viscous drag coefficient ( C ¯ f ) for all structures at R e = 2000 to 200,000. C ¯ f decreases with increasing R e . The addition of heave plates significantly increases friction drag compared to a finite cylinder. (b) Plot of time-averaged pressure drag coefficient ( C ¯ p ) for all structures at R e = 2000 to 200,000. Clearly, pressure drag dominates over friction drag as R e increases. Also, C ¯ p increases with increasing structural members.
Jmse 13 00248 g009
Figure 10. Time-averaged drag coefficient ( C ¯ d m / C ¯ d ) contributions of individual structural members normalised by the C ¯ d of the entire structure for R e = 2000 to 200,000: FCHP (a), TCHP (b), and OC4 (c).
Jmse 13 00248 g010
Figure 11. Streamlines of time-averaged streamwise velocity: plan view of the FC from top (a) and profile of streamlines on a vertical plane through the centre of FC (b) at R e = 2900 .
Jmse 13 00248 g011
Figure 12. Time-averaged streamwise velocity streamlines around the FCHP at R e = 2900 : plan view of the FCHP from top (a) and profile view on a vertical plane (b).
Jmse 13 00248 g012
Figure 13. Similar to FC, symmetric vortices are formed behind each of the cylinders of TCHP. However, the effect of the upstream cylinder can be seen on the vortices behind back cylinders (a). Recirculation regions are formed behind the cylinder and under the heave plate of the front cylinder (b).
Jmse 13 00248 g013
Figure 14. Mean streamwise velocity streamlines in the wake of OC4 at R e = 2900 . Two vortex cores are formed behind each of the back cylinders of OC4 (a). The recirculation region behind the front cylinder is restricted between the cylinder and cross-brace (b).
Jmse 13 00248 g014
Figure 15. Plots of time-averaged vertical force coefficient ( C ¯ V ) normalised by the density, free stream velocity, diameter, and projected area of structures in the vertical direction (a) and vertical force ( F ¯ V ) (b) for all R e cases ranging from 2000 to 200,000. The addition of more structural members substantially increases the vertical force.
Jmse 13 00248 g015
Figure 16. Time-averaged velocity streamlines in the wake of FC at R e = 2900 (a), R e = 10,000 (b), R e = 100,000 (c), and R e = 200,000 (d).
Jmse 13 00248 g016
Figure 17. Vertical pressure coefficient acting on the bottom surface of FC at R e = 2900 (a) and at R e = 200,000 (b). Similarly, (c,d) show the vertical pressure coefficient on the bottom surface of the heave plate of FCHP at R e = 2900 and 200,000, respectively. In both cases, the pressure varies on the surface in the streamwise direction, with lower pressure near the leading edge and higher near the rear edge. Vertical pressure coefficients at R e = 2900 and 200,000 for TCHP are shown in (e) and (f), respectively, and for OC4 in (g) and (h), respectively. The vertical pressure varies across the bottom surfaces of each heave plate, with higher negative pressure on the rear heave plates than on the leading one for both R e . In the case of OC4, the leading braces experience lower pressure than the rear one.
Jmse 13 00248 g017aJmse 13 00248 g017b
Figure 18. Streamwise pressure coefficient acting on FC (a), FCHP (b), TCHP (c), and OC4 (d) at R e = 200,000. The front surface of cylinders and heave plates can be divided into three zones: the green zone in the middle where the pressure is maximum; the red zones on either side where the pressure is minimum; the transition zone in between. The variation of pressure on the surface of the heave plate is due to separation of incoming flow.
Jmse 13 00248 g018
Figure 19. Streamwise friction coefficient acting on front and bottom surfaces of FC (a,b), FCHP (c,d), TCHP (e,f), and OC4 (g,h) at R e = 200,000. Friction is maximum on the two regions adjacent to the front section of the cylinder and heave plates where the flow is orthogonal. In cases of TCHP and OC4, friction is highest on the top surfaces of heave plates.
Jmse 13 00248 g019
Table 1. Dimensions of the domains in streamwise, cross-stream, and vertical directions used for simulations past FC, FCHP, TCHP, and OC4. Here, D refers to the diameter of the cylinder, which is 0.24 m .
StructureStreamwise DirectionCross-Stream DirectionVertical Direction
FC, FCHP 10 x / D 14 8 x / D 8 3 x / D 1.2
TCHP, OC4 14 x / D 26 12 x / D 12 3 x / D 1.2
Table 2. Summary of the boundary conditions specified at various sections of the domain and wall of the structures across all the three structures and R e cases. The initial condition for k and ω at the inlet is based on Equation (11).
Boundary U ( m / s ) p ( m 2 / s 2 ) k ( m 2 / s 2 ) ω ( s 1 )
Inlet(1, 0, 0)zeroGradient 1.5 × 10 4 150
OutletzeroGradient0zeroGradientzeroGradient
WallnoSlipzeroGradient 1 × 10 9 1 × 10 10
Top and BottomSymmterySymmetrySymmetrySymmetry
SidesSymmterySymmetrySymmetrySymmetry
Table 3. Mesh independence study: meshes with their cell count, C ¯ d for each mesh at R e = 2900, 43,000, and 200,000, and results from the literature for each R e .
MeshCells ( × 10 6 ) C ¯ d Re = 2900 C ¯ d Re = 43,000 C ¯ d Re = 200,000
M11.80.7160.6440.693
M24.60.7180.6800.695
M310.00.7200.7100.699
M416.20.7240.7150.703
M516.30.7240.7150.703
Benitz et al. [44]-0.725--
He et al. [46]--0.71-
Frederich el al. [48]---0.8
Disclaimer/Publisher’s Note: The statements, opinions and data contained in all publications are solely those of the individual author(s) and contributor(s) and not of MDPI and/or the editor(s). MDPI and/or the editor(s) disclaim responsibility for any injury to people or property resulting from any ideas, methods, instructions or products referred to in the content.

