Article

Numerical Investigation of the Applicability of Low-Pressure Exhaust Gas Recirculation Combined with Variable Compression Ratio in a Marine Two-Stroke Dual-Fuel Engine and Performance Optimization Based on RSM-PSO

Marine Engineering College, Dalian Maritime University, Dalian 116026, China
*
Author to whom correspondence should be addressed.
J. Mar. Sci. Eng. 2025, 13(4), 765; https://doi.org/10.3390/jmse13040765
Submission received: 16 March 2025 / Revised: 7 April 2025 / Accepted: 9 April 2025 / Published: 11 April 2025
(This article belongs to the Special Issue Advances in Recent Marine Engineering Technology)

Abstract

:
In this paper, a novel technical route, namely combining the low-pressure exhaust gas recirculation (LP-EGR) and variable compression ratio (VCR), is proposed to address the inferior fuel economy for marine dual-fuel engines of low-pressure gas injection in diesel mode. To validate the applicability of the proposed technical route, firstly, a zero-dimensional/one-dimensional (0-D/1-D) engine simulation model with a predictive combustion model DI-Pulse is established using GT-Power. Then, parametric investigations on two LP-EGR schemes, which is implemented with either a back-pressure valve (LP-EGR-BV) or a blower (LP-EGR-BL), are performed to qualitatively identify the combined impacts of exhaust gas recirculation (EGR) and compression ratio (CR) on the combustion process, turbocharging system, and nitrogen oxides (NOx)-brake specific fuel consumption (BSFC) trade-offs. Finally, an optimization strategy is formulated, and an optimization program based on response surface methodology (RSM)–particle swarm optimization (PSO) is designed with the aim of improving fuel economy while meeting Tier III and various constraint conditions. The results of the parametric investigations reveal that the two LP-EGR schemes exhibit opposite impacts on the turbocharging system. Compared with the LP-EGR-BV, the LP-EGR-BL can achieve a higher in-cylinder pressure level. NOx-BSFC trade-offs are observed for both LP-EGR schemes, and the VCR is confirmed to be a viable approach for mitigating the penalty on BSFC caused by EGR. The optimization results reveal that for LP-EGR-BV, compared with the baseline engine, the optimized BSFC decreases by 10.16%, 11.95%, 10.32%, and 9.68% at 25%, 50%, 75%, and 100% maximum continuous rating (MCR), respectively, whereas, for the LP-EGR-BL scheme, the optimized BSFC decreases by 10.11%, 11.93%, 9.93%, and 9.58%, respectively. Furthermore, the corresponding NOx emissions level improves from meeting Tier II regulations (14.4 g/kW·h) to meeting Tier III regulations (3.4 g/kW·h). It is roughly estimated that compared to the original engine, both LP-EGR schemes achieve an approximate reduction of 240 tons in annual fuel consumption and save annual fuel costs by over USD 100,000. Although similar fuel economy is obtained for both LP-EGR schemes, LP-EGR-BV is superior to LP-EGR-BL in terms of structure complexity, initial cost, maintenance cost, installation space requirement, and power consumption. The findings of this study provide meaningful theoretical supports for the implementation of the proposed technical route in real-world engines.

1. Introduction

The shipping industry plays an extremely vital role in promoting global economic and trade development due to its merits of high loading capacity, superior safety, and cost-effectiveness [1]. Nevertheless, the impacts of various gaseous emissions from engines on the ecological environment cannot be ignored. These pollutant emissions mainly include NOx, sulfur oxides (SOx), hydrocarbon (HC), particulate matter (PM), carbon monoxide (CO), and methane (CH4). In order to alleviate the adverse effects of shipping activities on the environment, corresponding global and regional environmental protection regulations have become stricter. The revised International Convention for the Prevention of Pollution from Ships Annex VI, which was approved at the 58th session of the Marine Environment Protection Committee and came into force on 1 July 2010, establishes International Maritime Organization (IMO) Tier I, Tier II, and Tier III regulations on NOx emissions from marine engines [2]. For marine engines with a rated speed of less than 130 RPM, the maximum permissible NOx emissions limited by Tier I, Tier II, and Tier III are 17 g/kW·h, 14.4 g/kW·h, and 3.4 g/kW·h, respectively [3]. Tier I and Tier II are global requirements, which are applied to ships constructed on or after 1 January 2000 and 1 January 2011, respectively. Tier III is applied to ships constructed on or after 1 January 2016, which necessitates a substantial reduction in NOx by around 76% relative to Tier II for ships sailing in the Emission Control Areas (ECAs) [4]. On 1 January 2020, a newly introduced limit on the sulfur content of the fuel on-board the ships entered into force, namely “IMO 2020” [5]. The sulfur content is restricted to below 0.50% m/m (mass by mass) for ships sailing outside the ECAs, while the limit is 0.10% within the ECAs. With the global community paying increasing attention to environmental protection, it is reasonable to believe that in the near future, the regulations on pollutant emissions from shipping activities will be even stricter, and more areas will be designated as ECAs.
For compliance with existing mandatory environmental regulations, marine engine manufacturers and researchers have developed various emission-reduction technologies. The regulations on SOx can be simply met by burning either low-sulfur fuel oil or clean fuels. As for the NOx, several feasible technologies have been developed, mainly including EGR, selective catalytic reduction (SCR), Miller cycle, water addition, and fuel injection strategy [1,6]. Among these technologies, EGR is widely used by marine engines for meeting Tier III regulations [7]. Extensive studies have been carried out focusing on the application of EGR in marine diesel engines, which always face the problem of a high level of NOx emissions. These studies cover both LP-EGR and high-pressure EGR (HP-EGR). Extensive experimental investigations of EGR in marine diesel engines have been carried out by marine engine manufacturers, including both shop tests and on-board verification [8,9,10]. It is confirmed by the experimental results that EGR is capable of enabling marine engines to meet Tier III regulations while maintaining the associated fuel penalty within an acceptable range. In addition, many researchers have also carried out relevant studies by using numerical simulation techniques. These studies not only involve using 0-D or 0-D/1-D models to investigate the impacts of EGR on the overall performance of engines, but also include computational fluid dynamics (CFD) models to analyze the effects of EGR on the in-cylinder combustion process and the formation process of various pollutant emissions [11,12,13,14,15]. To facilitate the development of the EGR control system, Alegret et al. developed a mean value model of a marine large-scale two-stroke diesel engine equipped with EGR and cylinder bypass valve [11]. This model demonstrates a fast simulation speed and satisfactory predictive accuracy. Most importantly, it can well capture the main dynamics of the engine. Using a validated 0-D/1-D model, Lu et al. conducted a parametric study on a marine two-stroke diesel engine fitted with EGR and turbocharger cut-out system [12]. It is found that when the capacity ratio of the large and small turbochargers is set to 70:30, the engine can achieve the lowest weighted BSFC. However, in order to comply with the Tier III regulation, the operation of EGR results in a 2.6% penalty on the weighted BSFC. Also based on a 0-D/1-D model, Wang et al. compared the performances of LP-EGR and HP-EGR in a marine low-speed diesel engine [13]. With the same in-cylinder peak pressure and the same level of NOx emissions, the power consumptions of both the EGR blower and the engine BSFC with the LP-EGR are lower than that with the HP-EGR. However, it is pointed out that the compactness and cost of the LP-EGR are inferior to those of the HP-EGR. In [14], a numerical study on the combined application of EGR and Miller cycle was carried out in a marine two-stage turbocharged diesel engine. The results reveal that, compared with using only EGR, combining the two technologies can reduce the NOx emissions and BSFC by 0.87 g/kW·h and 17.19 g/kW·h, respectively. In [15], based on the CFD model of a marine two-stroke diesel engine, the impacts of EGR, boost pressure, and fuel injection timing were studied. The results reveal that coupling EGR with advanced fuel injection timing can improve the trade-off relationship between NOx emissions and indicated specific fuel consumption. The findings of these previous studies fully demonstrate that EGR is a viable technology that enables marine diesel engines to meet Tier III regulations. However, due to the NOx-BSFC trade-off, the operation of EGR inevitably leads to a deterioration in the engine fuel economy. Although the increase in BSFC is not very significant, considering the characteristics of extremely high power (ranging from several thousand kilowatts to as high as tens of thousands of kilowatts) of marine large-scale diesel engines, the resulting increase in fuel costs cannot be overlooked. This is the reason why, in some studies, EGR is applied in combination with other energy-saving and emission-reduction technologies, such as Miller cycle, fuel injection strategy, and water addition [14,15,16]. The main purpose is to improve the NOx-BSFC trade-off. To fully leverage the potential of EGR in reducing NOx emissions while minimizing the fuel penalty necessitates a collaborative optimization of the EGR rate and other engine setting parameters. For example, a collaborative optimization of EGR and Miller cycle based on PSO was carried out in [14]; an optimization method combining RSM, Bayesian neural network, and non-dominated sequence genetic algorithm (NSGA) was proposed in [
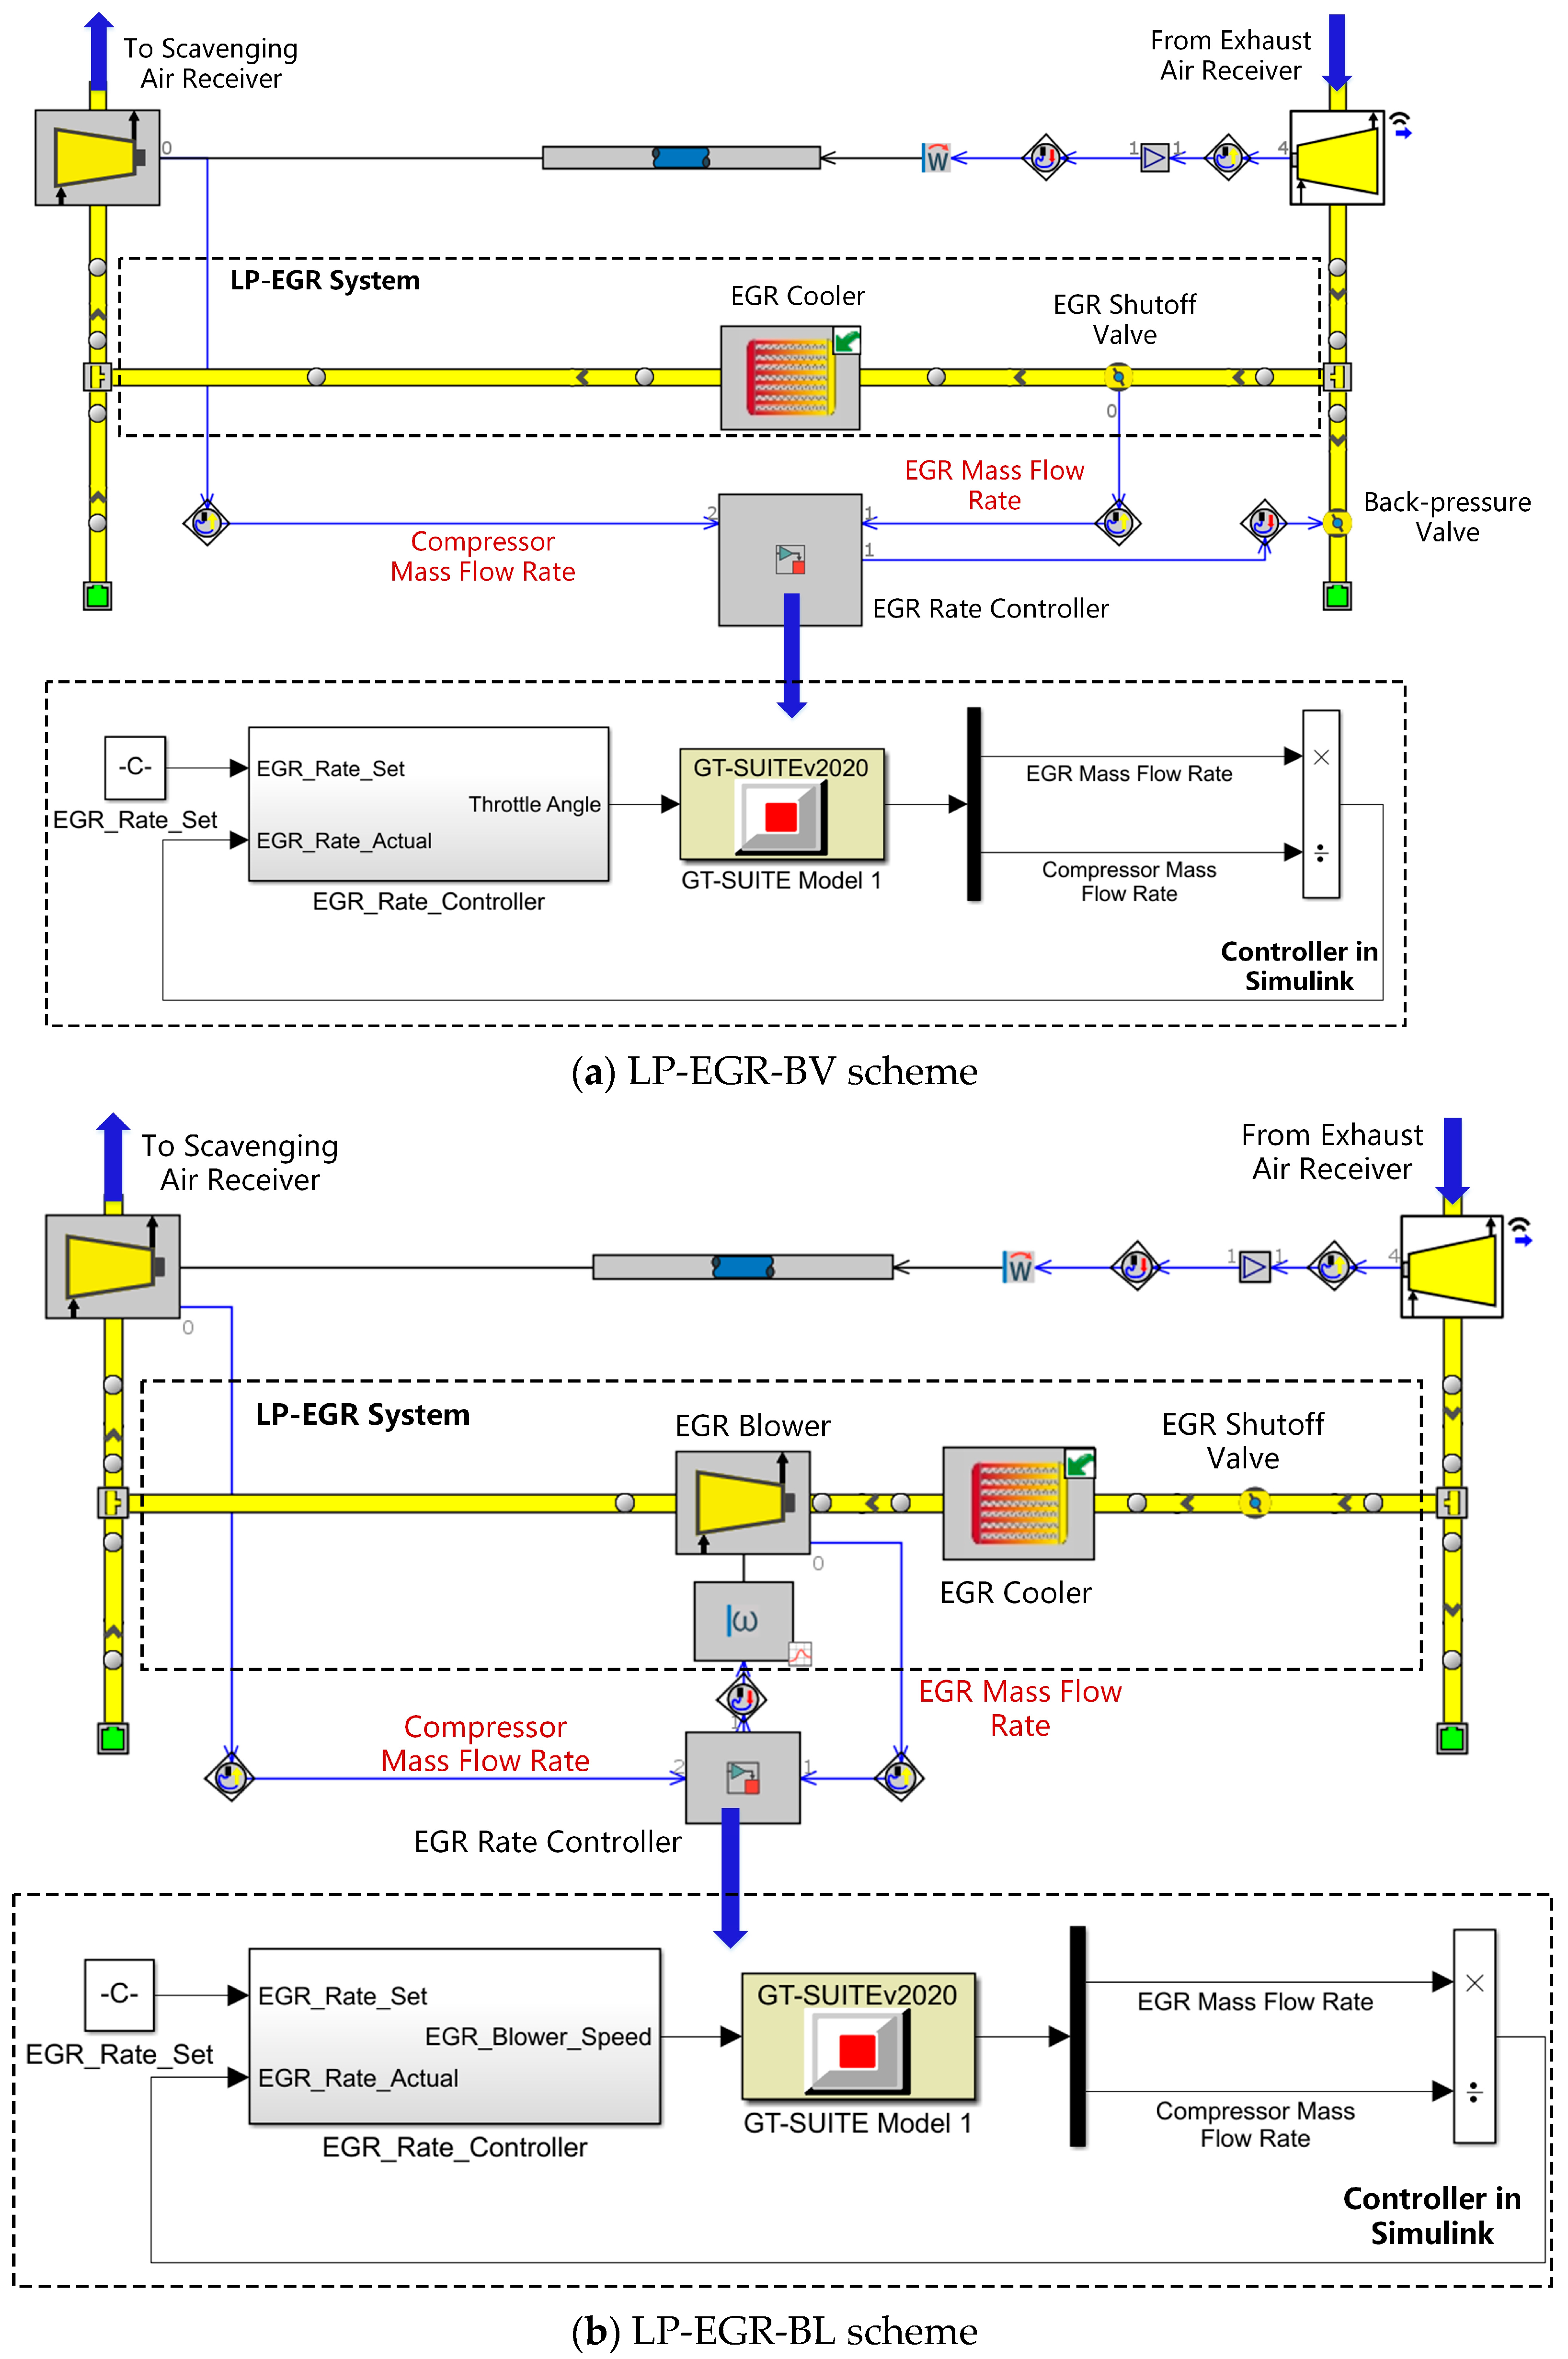
17]. It should be noted that most of the current research on LP-EGR focuses on the scheme implemented by using the EGR blower (LP-EGR-BL), while there is little research on the scheme implemented by using the back-pressure valve (LP-EGR-BV). The LP-EGR-BV scheme adjusts the engine back-pressure to establish a pressure difference between the turbine outlet and the compressor inlet, thus achieving the recirculation of exhaust gas without consuming any additional power. It is very clear that LP-EGR-BV is superior to LP-EGR-BL in terms of structural complexity, installation space requirement, and cost. Therefore, carrying out relevant research on it holds certain practical significance.
In recent years, marine dual-fuel engines have increasingly gained the favor of shipowners. This type of engine can burn diesel oil in diesel mode and natural gas in gas mode. The carbon content of natural gas is significantly lower than that of diesel oil, and it contains almost no sulfur content, making it an environmentally friendly fuel. Specifically, for marine dual-fuel engines of low-pressure gas injection, the combustion proceeds following the Otto cycle in gas mode. Owing to the lean premixed combustion, an extremely low level of NOx emissions can be achieved, fully meeting Tier III regulations. In contrast, in diesel mode, since the combustion is still the Diesel cycle, only Tier II regulations can be met. For compliance with Tier III regulations in diesel mode, NOx reduction technologies are required. As discussed in [7], considering that marine dual-fuel engines typically operate in diesel mode only for a limited time, EGR is regarded as a cost-effective technology for the diesel operation to meet Tier III regulations. For marine dual-fuel engines of low-pressure gas injection, in order to avoid knocking in gas mode, a CR much lower than typical marine diesel engines has to be adopted. However, this will greatly sacrifice the engine fuel economy in diesel mode, making BSFC significantly higher than typical marine diesel engines. It can be speculated that the application of EGR will exacerbate this situation. Hence, combining EGR with other technologies is necessary for improving the NOx-BSFC trade-off.
In the field of automotive engines, VCR technology has been proven as a viable solution to improve fuel economy for both compression-ignition diesel engines and spark-ignition gasoline engines. The VCR mechanism of the VC-Turbo engine developed by NISSAN can continuously adjust the CR from 8 to 14 [18]. When it is installed in the INFINITI QX50 (front-wheel drive specification), compared with the V6 gasoline engine equipped in the former QX50, the fuel efficiency improves by 35%. The findings of the study carried out by Rufino and Ferreira reveal that with variable compression ratio and displacement, an efficiency improvement of around 15% is achieved at part loads for spark-ignition engines [19]. Similar findings on fuel economy improvement with VCR are also reported in other studies [20,21,22]. Drawing on valuable experience from the existing studies on the application of VCR in automotive engines, VCR is expected to be a promising solution to improve the fuel economy of marine dual-fuel engines of low-pressure gas injection. In diesel mode, the CR can be substantially increased to improve fuel economy, while in gas mode, an appropriate lower CR can be set to avoid knocking. Moreover, in either the diesel or gas mode, a higher CR can be adopted at low loads, while at high loads, a lower CR can be used to avoid exceeding the permissible maximum in-cylinder peak pressure or knocking. In this way, the optimization of engine fuel economy across the entire load range can be achieved. Despite the potential of VCR in improving fuel economy, there are few studies focusing on applying VCR to marine engines. Existing studies mainly focus on investigating how the CR influences the operation of marine engines [23,24,25]. This research gap may be due to the fact that diesel engines still dominate in the field of marine engines and inherently operate without risk of knocking, thus allowing for employing high CR to achieve high engine efficiency. In 2023, WinGD, a world-renowned manufacturer of marine two-stroke engines, introduced VCR technology for marine two-stroke dual-fuel engines of low-pressure gas injection [26]. However, more detailed specifics and performance characteristics of this technology have not been found in the literature or news reports.
Based on the introduction and discussion of existing research presented above, the combination of EGR and VCR appears to be a highly effective solution for enabling marine dual-fuel engines of low-pressure gas injection to comply with Tier III while achieving satisfactory fuel economy in diesel mode. This constitutes the primary topic of this study.
Through the above analysis, corresponding research gaps can be identified. Although extensive studies, both experimental and simulation ones, have been conducted to analyze and investigate the effects of EGR or VCR on engine performance and emission characteristics, little research has been carried out on the combined application of EGR and VCR in internal combustion engines, especially marine large-scale engines. In some existing studies [13,27,28], while the performances of different EGR configurations have been compared, generally speaking, they are only limited to the comparison between LP-EGR and HP-EGR. There is a lack of studies comprehensively comparing LP-EGR schemes implemented with either a back-pressure valve or EGR blower, respectively (for the sake of brevity, these two types of LP-EGR are designated as LP-EGR-BV and LP-EGR-BL in this paper). To better inform the real-world design choices of both ship owners and engine manufacturers, it is necessary to conduct targeted studies to fill the abovementioned research gaps.
The novelty of this study includes the following: (a) A technical route, namely LP-EGR combined with VCR, is proposed to address the inferior fuel economy of marine dual-fuel engines of low-pressure gas injection in diesel mode. (b) A meticulous engine performance optimization strategy based on RSM-PSO is designed to fully exploit the potential of combining LP-EGR and VCR in terms of energy conservation and emission reduction. (c) A systematic comparison is made between the LP-EGR-BV and LP-EGR-BL schemes, including a quantitative comparison of their impacts on the engine performance, as well as a qualitative comparison in terms of structural complexity, initial costs, maintenance costs, etc.
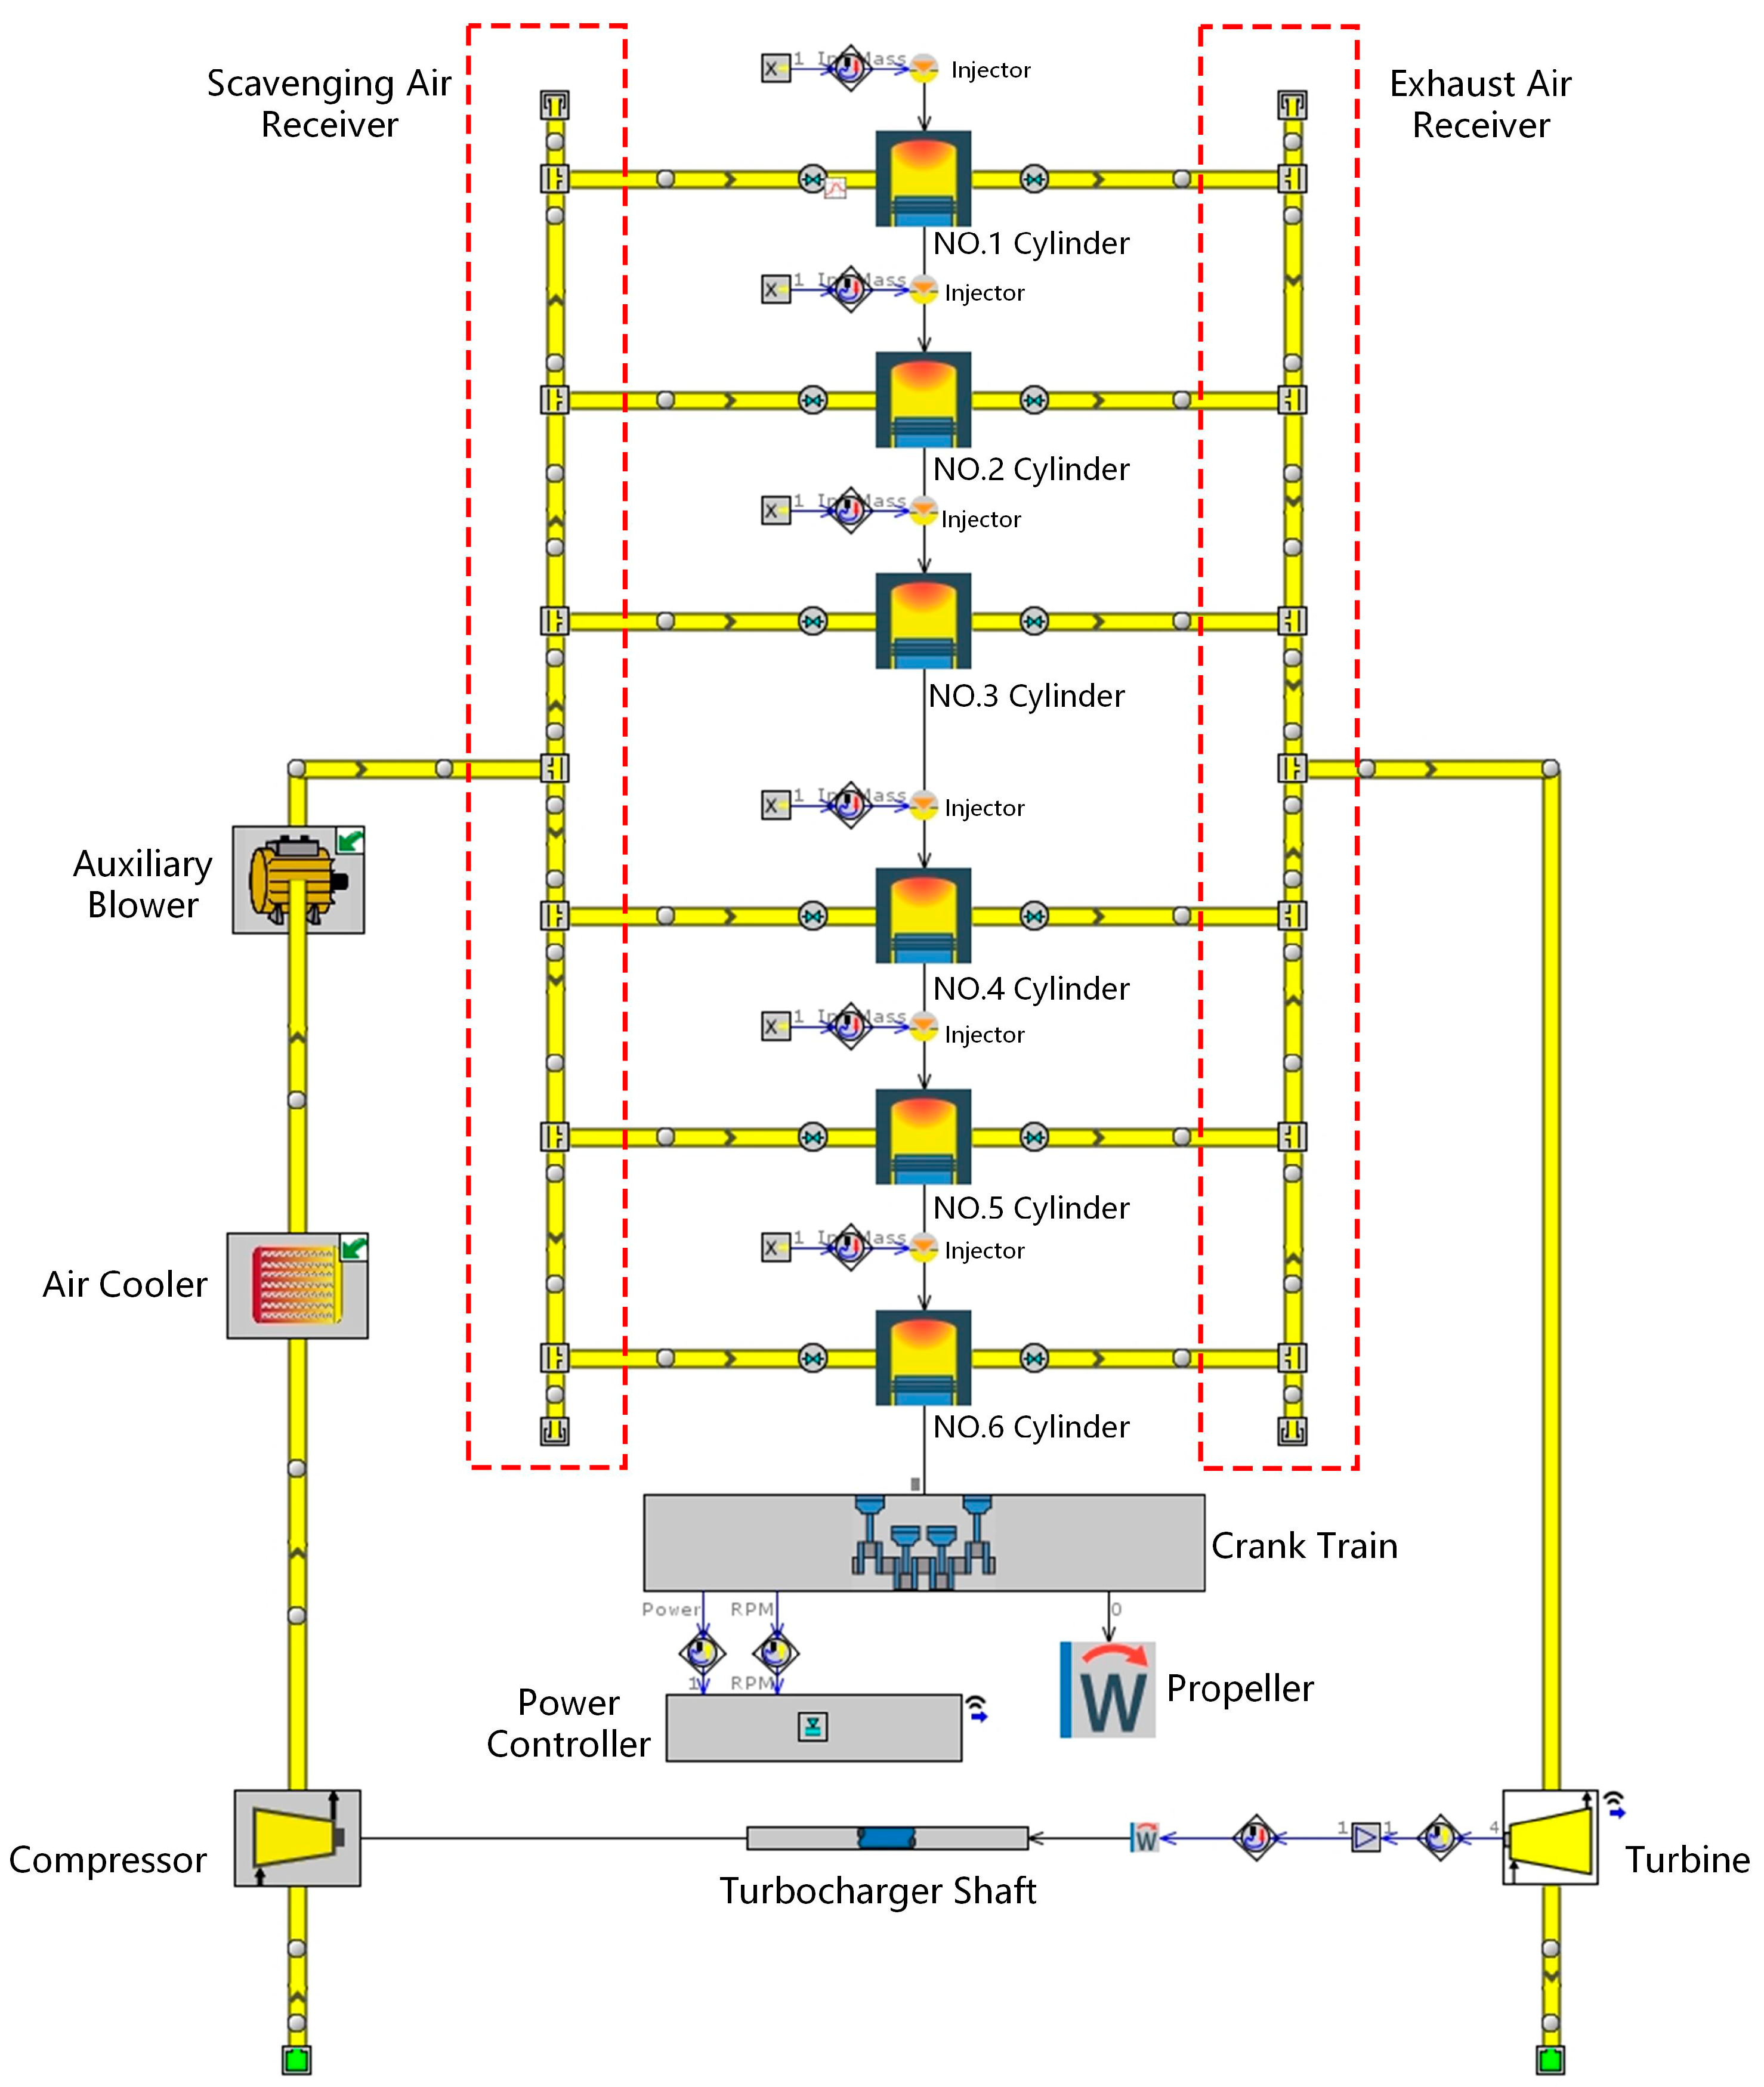
The main purpose of this study is to validate the applicability of combining LP-EGR and VCR in a marine two-stroke dual-fuel engine through numerical simulations, aiming to minimize the BSFC while complying with the Tier III regulations on NOx emissions. Firstly, a 0-D/1-D simulation model of the target engine is developed using commercial engine simulation software GT-Power (Version 2020). After carefully calibrating the model parameters, this type of model is capable of providing accurate prediction results without requiring extensive computational efforts [29,30]. This feature is very suitable for investigating the whole-engine performance. Furthermore, aiming at the purpose of this study, the predictive combustion model DI-Pulse is selected to simulate the in-cylinder combustion process due to its capability of capturing the impacts of the variations in EGR rate and CR on the combustion characteristics. Secondly, parametric investigations are performed to identify the combined impacts of EGR rate and CR on the combustion process, turbocharging system, and NOx-BSFC trade-off. This step is crucial for formulating a reasonable optimization strategy, including the selection of optimization variables and determination of constraint conditions. Then, based on a comprehensive consideration of the study’s purpose and various factors influencing the safe, stable, and continuous operation of the engine, the optimization strategy is formulated, which is defined as a constrained single-objective optimization problem. Finally, an optimization program based on RSM-PSO is developed. Similar methodologies have been adopted in many studies on engine optimization [31,32,33]. Optimization results are derived to evaluate and compare the performances of the two LP-EGR schemes in terms of improving the fuel economy. In addition, a short discussion is presented on how the findings of this study inform real-world design decisions from the perspectives of commercialization potential, cost-effectiveness, and reliability.

2. Investigated Engine

2.1. Baseline Engine

A marine two-stroke dual-fuel engine of low-pressure gas injection is selected as the baseline engine with its main specifications at MCR presented in Table 1. As discussed in Section 1, this type of engine can operate in two modes, namely the diesel and gas modes. Given the purpose of this study, only the diesel mode will be focused on in this study. Unless otherwise specifically stated, all the results presented in this paper refer to the diesel mode.

2.2. LP-EGR Schemes

There are two implementation schemes available for LP-EGR. One is based on the back-pressure valve, whereas the other is based on the EGR blower. They are termed as LP-EGR-BV and LP-EGR-BL in this study, respectively, and their layouts are illustrated in Figure 1. For the LP-EGR-BV scheme, its principle is to adjust the engine back-pressure by adjusting the opening degree or the cracking pressure of the back-pressure valve, thereby achieving the recirculation of the exhaust gas from the downstream of the turbine to the upstream of the compressor under the created pressure difference between them. For the LP-EGR-BL scheme, it achieves the forced recirculation of exhaust gas through the operation of the EGR blower, but this comes at the cost of additional electrical power consumption.

3. Engine Model Description and Validation

3.1. Baseline Engine Model Description

The baseline engine model was developed with the 0-D/1-D approach by using the commercial simulation software GT-Power. The model layout is presented in Figure 2.
The flow in the engine pipelines was modeled by the 1-D approach, which solves the conservation of continuity, momentum, and energy equations in one dimension [34]. The 1-D approach discretizes every single pipe in the engine into one or more volumes, which are connected by boundaries. It was assumed that the scalar variables (pressure, temperature, density, etc.) are uniform within each volume, whereas the vector variables (mass flux, velocity, mass fraction fluxes, etc.) are calculated for each boundary.
As for the working process within the cylinder, the 0-D approach was employed. Among all the cylinder sub-models, the combustion model is of utmost importance due to its significant influence on the prediction accuracy and predictive ability of the engine model. In order to capture the impacts of the CR and EGR on the combustion, the predictive combustion model DI-Pulse provided by GT-Power was used in this study [35]. According to the modeling concept of DI-Pulse, the cylinder contents are divided into three zones including the main unburned zone, the spray unburned zone, and the spray burned zone. In order to endow the model with predictability, the DI-Pulse applies some empirical or semi-empirical sub-models to simulate the relevant processes during fuel injection and combustion (injection, entrainment, evaporation, etc.). The basic governing equations of the DI-Pulse are briefly introduced below [35].
The fuel is added to the spray unburned zone once it is injected into the cylinder. The fuel spray tip length S is calculated with the following equation:
S = u inj t 1 1 16 t t b 8 t t b 1 u inj t b 15 16 t t b 0.5 t t b 1
where uinj is the velocity at injector nozzle; t and tb are the time and breakup time, respectively.
As the fuel spray penetrates, the surrounding gases of both unburned and burned are entrained with the entrainment rate calculated as given in the following equation:
d m ent d t = C ent m inj u inj u 2 d u d t
where ment and minj are the entrained and injected fuel mass, respectively; Cent is the entrainment rate multiplier; u is the velocity at spray tip.
The ignition delay τign of the evaporated fuel–air mixture in the pulse is modeled with the well-known Arrhenius expression as shown in Equation (3) and the ignition occurs when the equal sign in Equation (4) holds:
τ ign = C ign ρ 1.5 exp ( 3500 T ) O 2 0.5
1 τ ign d t = 1
where Cign is the ignition delay multiplier; ρ and T are the pulse density and temperature, respectively; [O2] is the oxygen concentration.
After the ignition occurs, the combustion proceeds first in the form of premixed combustion and then in the form of diffusion combustion. The corresponding combustion rates are calculated according to Equations (5) and (6), respectively:
Premixed   combustion :   d m pm d t = C pm m pm k ( t t ign ) 2 f ( [ O 2 ] )
where mpm is the premixed mass; Cpm is the premixed combustion rate multiplier; k is the turbulent kinetic energy; tign is the ignition time.
Diffusion   combustion :   d m df d t = C df m df k V cyl 3 f ( [ O 2 ] )
where mdf is the air–fuel mixture mass available during this combustion stage; Cdf is the diffusion combustion rate multiplier; Vcyl is the cylinder volume.
In addition to the combustion model, it is also necessary to select and set up several other cylinder sub-models. These sub-models are introduced briefly herein. The “S-shaped” scavenging function, which defines the function relationship between cylinder residual ratio and exhaust residual ratio, was used to describe the in-cylinder mixing of incoming fresh air with in-cylinder burned gases during the scavenging process. The classical Woschni correlation was used to calculate the heat transfer between the in-cylinder hot gas and the cylinder head, cylinder wall, and piston. As for the engine friction mean effective pressure, it was modeled with the Chen–Flynn engine friction model, which takes into consideration the influences of both the in-cylinder peak pressure and piston speed. The extended Zeldovich mechanism was used to predict the NOx emissions.
For the compressor and turbine in the turbocharging system, the look-up table method was employed with the corresponding data derived from their performance maps. The inputs of the compressor model include the turbocharger speed and the pressure ratio across the compressor. The efficiency of the compressor and its flow rate are calculated as outputs by interpolating the established look-up table. Consequently, the temperature at the outlet of the compressor and its power can be calculated. As for the turbine model, its input only includes the expansion ratio. The efficiency of the turbine and its flow coefficient are also calculated through interpolation. In this study, the turbine was simplified into a nozzle. Based on this simplification, the flow rate of exhaust gas flowing through the turbine can be calculated according to the steady 1-D isentropic flow theory, and then, the turbine outlet temperature and power can be determined. Since both the changes in EGR rate and CR affect the operation of the turbocharging system, the compressor may surge in certain situations. Surge margin is used to evaluate the risk of surge, which is calculated according to Equation (7):
S M = m ˙ c m ˙ c , sg m ˙ c
where m ˙ c is the mass flow rate of the compressor; m ˙ c , s g is the mass flow rate of the compressor at the surge line.
The boosted air from the compressor is cooled by the air cooler before entering into the cylinders. The air cooler was modeled by simplifying it into a series of pipes connected in parallel. The pipe wall temperature is imposed as the desired air outlet temperature of the air cooler, which is calculated according to the cooling efficiency and cooling water temperature. It should be noted that a high heat transfer multiplier is set for the cooler pipes, which allows sufficient heat transfer between the boosted air and cooler pipes. Therefore, the cooler air outlet temperature can achieve the same value as that of the cooler wall pipes.
The model-based controller “ControllerDInject” in GT-Power was employed to realize the power controller. It achieves the targeted brake power by adjusting the quantity of cycle injected fuel.
In this study, different boundary conditions were selected and set for different research objectives:
  • When validating the engine simulation model (Section 3.2), the measured engine brake power was set as the target value of the power controller. The engine cycle injected fuel quantity will be regulated by the power controller, thus enabling a fair comparison between the prediction and measurement results of the engine power, speed, and other performance parameters.
  • When carrying out the parametric investigations in Section 4, for the purpose of eliminating the impacts of the cycle injected fuel quantity, the power controller was removed. Therefore, the engine cycle injected fuel quantity was constant for each simulation run at the same load point.
  • In Section 5, when performing the optimization program, the power controller was re-integrated into the engine simulation model. This is mainly because it is considered that the optimization of engine performance should not influence the engine power and speed. Therefore, the engine should maintain the same brake power and speed at the same load point, which will make the optimization results more meaningful.

3.2. Baseline Engine Model Validation

As presented in Figure 3 and Figure 4, the engine model was validated by comparing the simulation and measurement results of the engine performance parameters under various steady-state conditions and evaluating corresponding prediction errors. Measurement data were derived from the engine shop trial report provided by the engine manufacturer. The engine shop trial report was approved by both the China Classification Society and Lloyd’s Register, which, to some degree, substantiates its trustworthiness.
As can be found from Figure 3, the variation trend of the simulation results of all the examined engine performance parameters with the engine load is highly consistent with that of the measurement results. It can be observed from Figure 4 that the relative errors of most of the examined engine performance parameters are actually within ±3%. Only the relative errors of the in-cylinder compression pressure at 25% MCR and the exhaust pressure at 75% MCR exceed the range of ±3%, which are −3.10% and 3.66%, respectively. Compared with the other engine operating parameters, the relative errors of the engine speed and brake power are extremely small (not exceeding ±0.13%), which is mainly attributed to the power controller integrated in the model. This power controller takes the measured brake power as its target value, thus enabling the predicted brake power to gradually approach the target value by adjusting the engine cycle injected fuel quantity. For marine engines directly connected to the propeller, since they operate according to the propeller law, the engine brake power has a one-to-one correspondence with its rotational speed. Therefore, extremely small relative error is also obtained for engine speed. In addition, it can also be found from Figure 4 that the relative errors of various engine operating parameters are randomly distributed, and there is no phenomenon that certain parameters are more sensitive than others.
By referring to the existing literature, no explicit and commonly acknowledged standard for evaluating the prediction accuracy of the engine simulation model has been found. Nevertheless, the international standard ISO 15550:2016 (International combustion engines—Determination and method for the measurement of engine power—General requirements) has brought inspiration for the evaluation of the prediction accuracy of the engine simulation model [36]. In this standard, the permissible measurement deviations of various engine performance parameters are provided. Among them, the permissible deviation is ±2% for engine speed, ±3% for brake power, ±3% for BSFC, ±5% for in-cylinder peak pressure, ±5% for in-cylinder compression pressure, ±2% for turbocharger speed, ±2% for scavenging pressure, ±5% for exhaust pressure, and ±4 K for scavenging temperature. By comparing the results presented in Figure 4, it can be found that the prediction errors are within the permissible deviation ranges specified in ISO 15550:2016. In addition, by referring to the existing studies related to numerical investigations on marine engines, it is found that the prediction accuracy of the engine simulation model established in this study is consistent with theirs [12,30,33,37].
Validating the accuracy of the predicted in-cylinder pressure curves constitutes a crucial step during validating the engine simulation model. In addition to the intuitive in-cylinder pressure information, the pressure curves also implicitly contain important information about the combustion process. However, the shop trial report from the engine manufacturer does not provide the measurement results of in-cylinder pressure curves under various load points. Therefore, it is impossible to carry out such validation, which is undoubtedly a non-negligible limiting factor in this study. In fact, such a limiting factor also exists in many simulation studies on marine large-scale two-stroke engines, mainly because the experimental costs of such engines are extremely high. Instead, the accuracy of the engine simulation model is validated by comparing the measurement results and the prediction results of the engine performance parameters under various steady-state operating conditions, which is also the validation method adopted in this study [12,30,33,37]. Nevertheless, to demonstrate the prediction capability of the developed engine simulation model, the corresponding simulated in-cylinder pressure curves are calculated and presented in Figure 5. As can be observed from it, the shapes of the pressure curves are consistent with the measurement results of marine large-scale two-stroke engines as presented in existing studies [2,13]. Furthermore, given that the engine simulation model demonstrates satisfied prediction accuracy for scavenging and exhaust pressures and in-cylinder compression and peak pressures, which collectively shape the characteristics of the pressure curve, the reliability of the results presented in Figure 5 can be verified to a certain extent.
Based on the above discussion, it can be considered that the established engine simulation model exhibits acceptable prediction accuracy, which can be used with fidelity for subsequent investigations.

3.3. Engine Model Extension

After validating the baseline engine model, it was extended by integrating the two LP-EGR systems as well as the EGR controller (for regulating the EGR rate), and their layouts are presented in Figure 6.
For the LP-EGR-BL scheme, a centrifugal compressor was selected as the EGR blower, which was modeled with the same method as the compressor in the turbocharging system. For the LP-EGR-BV scheme, the back-pressure valve was modeled using the template “ThrottleConn” provided by GT-Power. By adjusting the throttle angle of the “ThrottleConn”, the engine back-pressure can be adjusted, thereby achieving the targeted EGR rate. For eliminating the adverse influences of high-temperature exhaust gas on engine performance, the EGR gas is cooled by using the EGR cooler in both schemes [38]. In this study, the EGR cooler was modeled with the same method as that of the air cooler as introduced in Section 3.1.
Since the exhaust gas is recirculated from the downstream of the turbine to the upstream of the compressor for both LP-EGR schemes, the EGR rate (mass fraction) is defined according to the following equation:
ϕ EGR = m ˙ EGR m ˙ c
where m ˙ E G R is the mass flow rate of EGR gas.
For the LP-EGR-BL scheme, additional electrical power, which is typically provided by the diesel generator set on-board the ship, is consumed by the EGR blower to forcefully drive the recirculation of the exhaust gas. In this study, this part of power consumption is also taken into consideration when calculating the BSFC. Therefore, the engine BSFC with the LP-EGR-BL scheme is calculated with the following equation:
B S F C LP _ EGR _ BL = g eng + g gen P eng = P eng B S F C eng + P bl B S F C gen η bl η gen P eng
where geng and ggen are the instantaneous fueling rates of the engine and the diesel generator set (for driving the EGR blower), respectively; Peng and Pbl are the power of the engine and the EGR blower, respectively; BSFCeng and BSFCgen are the BSFC of the engine and the diesel generator set, respectively; ηbl is the EGR blower efficiency; ηgen is used to account for the efficiency losses during the power generation and distribution processes.
As for the EGR rate controller, it is of a proportional–integral (PI) type and is implemented in Simulink (Version R2018b). The PI controller in Simulink receives signals from GT-Power, including mass flow rates of both the EGR and compressor, to calculate the actual EGR rate. By comparing the actual value of the EGR rate with the set value, the deviation between them is calculated. Then, based on the PI algorithm, the control signal is calculated and outputted to the GT-Power to target the desired EGR rate. For the LP-EGR-BL scheme, the control signal is used to adjust the rotational speed of the EGR blower, whereas for the LP-EGR-BV scheme, it is used to adjust the opening of the back-pressure valve.

4. Parametric Investigations

In this section, parametric investigations are carried out with the aim of analyzing and comparing the impacts of two LP-EGR schemes on the combustion process, turbocharging system, as well as NOx-BSFC trade-off.

4.1. Effects of the Combined Application of LP-EGR-BV and VCR

4.1.1. Effects on Combustion Process

EGR influences the combustion process by altering the composition and thermodynamic properties of the cylinder charge, while the CR exerts its effect by changing the compression intensity of the cylinder charge. The impacts on the combustion process will directly affect the engine performance and the formation of various types of emissions. Figure 7 shows their combined effects on in-cylinder pressure and heat release rate (HRR) at 75% MCR as a representative case.
As presented in Figure 7a, with a CR of 12.1, as the EGR rate increases from 10% to 30%, the in-cylinder pressure only decreases slightly during the compression stage. Similar trends are also observed in [38]. On the one hand, this is because the operation of EGR leads to a decreased scavenging pressure. On the other hand, it is due to the thermal effect of EGR, that is, the mixing of fresh scavenging air with exhaust gas results in a higher specific heat capacity of the cylinder charge [39]. However, during the combustion stage, a more obvious distinction can be observed. This is mainly caused by the dilution effect of EGR [39]. The reduction in the quantity of oxygen within the cylinder hinders the mixing of fuel and oxygen and slows down the burning speed as shown in Figure 7b, finally causing the in-cylinder pressure to drop. Specifically, the peak pressure drops from 100.8 bar to 90.9 bar. However, the position of the peak pressure does not change significantly, remaining approximately at 14° crank angle (CA) after top dead center (ATDC). With an 30% EGR rate, an increase in the CR can significantly elevate the pressure level, not only during the compression stage but also during the combustion stage as shown in Figure 7a. During the compression stage, it is mainly due to the cylinder charge being subjected to more intense compression. As the CR gradually increases, the compression pressure even exceeds the pressure rise caused by combustion, meaning that the peak pressure is equal to compression pressure. On this basis, because of the promoting effect of increased CR on the burning speed as presented in Figure 7b, the pressure level during the combustion stage is significantly elevated. With a 30% EGR rate, as the CR elevates from 12.1 to 25, the peak pressure changes from 90.9 bar to 202.1 bar. Even when increasing the CR from 12.1 to 17, the pressure level increases significantly, fully compensating for the decline in the pressure level caused by EGR.
In fact, the in-cylinder pressure level of an engine reflects, to a certain extent, its ability to convert the thermal energy released by fuel combustion into mechanical energy. That is, the higher the pressure level, the stronger the work capacity. This is also the main reason why, in some studies, the engine fuel economy deteriorates due to the operation of EGR [2,39]. Therefore, although EGR can effectively reduce the NOx emissions, the BSFC increases inevitably, which is the well-known NOx-BSFC trade-off. From the above results, it is expected that the VCR (by increasing the CR) can compensate for the deterioration of in-cylinder pressure level caused by EGR, thereby improving the fuel economy. However, there are still two points that need to be noted. Firstly, as shown in Figure 7a, the peak pressure increases significantly with the rise in CR, which may go beyond the maximum value specified by the engine manufacturer. This, in turn, will have an adverse impact on the safety, reliability, and stability of the engine. However, from another perspective, if the mechanical strength of the engine can be enhanced, the potential of VCR in improving fuel economy can be better exploited. But this also requires that the adopted VCR mechanism is capable of providing the required CR adjustment range. Secondly, an increase in the CR is often accompanied by a rise in the temperature of the cylinder charge. Since the formation of NOx is highly sensitive to the temperature rise, increased NOx emissions are usually observed [40]. From this perspective, the application of VCR will partially offset the effectiveness of EGR in reducing NOx. Based on above discussions, it can be concluded that in order to make full use of the capabilities of EGR in reducing NOx and VCR in improving fuel economy, a corresponding optimization program needs to be carried out to seek the optimal settings of the EGR and VCR systems. This is also one of the main topics in this study.

4.1.2. Effects on Turbocharging System

Figure 8 presents the turbine performance map used to describe its working characteristics (the data in this figure are normalized due to commercial confidentiality). The turbine flow coefficient and efficiency are solely determined by the turbine expansion ratio. The flow coefficient initially increases rapidly with the increase in expansion ratio, but the increasing rate begins to decelerate when the expansion ratio increases to approximately 2.5. The turbine efficiency shows a pattern where it initially increases and then decreases with the highest efficiency obtained when the expansion ratio is approximately 2.5. For the LP-EGR-BV scheme, since the targeted EGR rate is achieved by adjusting the engine back-pressure, the operation of the turbine will inevitably be affected. This will further influence the operation of the whole turbocharging system as well as the engine performance.
Based on the ideal gas equation of state, the turbine inlet pressure is mainly determined by the quantity and temperature of exhaust gas accumulated in the exhaust manifold. As the engine back-pressure increases for achieving a higher EGR rate, the engine’s exhausting process encounters greater resistance, which generally results in decreased quantities of both intake air and exhaust gas. Meanwhile, for the investigated case, an increased EGR rate results in a deterioration of engine thermal efficiency, thereby causing a rising potential in the exhaust gas temperature. As shown in Figure 9, the turbine inlet pressure decreases with increased EGR rate likely due to a reduced exhaust gas flow rate, which offsets the rising potential in the temperature. Since the turbine expansion ratio is defined as the ratio of the pressure at the turbine inlet (i.e., exhaust manifold pressure) to the pressure at the turbine outlet (i.e., engine back-pressure), with the increase in EGR rate, the turbine expansion ratio decreases due to the reduction in turbine inlet pressure and the increase in outlet pressure as presented in Figure 10a. As the turbine is simplified into a nozzle in this study, the turbine flow rate can be calculated according to the steady 1-D isentropic flow theory, which mainly depends on the expansion ratio, flow coefficient, and flow area. Because the flow area is a fixed value and both the turbine expansion ratio and flow coefficient decrease with the increase in EGR rate, the turbine flow rate decreases accordingly as presented in Figure 10b. As for the temperature drop across the turbine, it mainly depends on the turbine expansion ratio and efficiency. The temperature drop generally increases with the increase in turbine efficiency and expansion ratio. For the turbine under investigation, within the variation range of expansion ratio, although the turbine efficiency increases as the expansion ratio decreases, the variation magnitude is minimal, not exceeding 1%. Therefore, its impact on the temperature drop is not significant. The reason why the temperature drop decreases with the increase in EGR rate as presented in Figure 10c mainly stems from the reduction in turbine expansion ratio. Ultimately, as both the turbine flow rate and temperature drop decrease with the increase in EGR rate, the turbine power exhibits a decreasing trend as shown in Figure 10d. When the EGR rate increases from 10% to 50%, the turbine power decreases by 15.02%, 12.64%, 10.67%, and 9.71% with a CR of 12.1, 17, 21, and 25, respectively. The results presented herein are consistent with the findings of the study conducted by Sapra et al., who investigated the influences of the back pressure on the performance of a marine medium-speed diesel engine [41]. In addition, in terms of the impacts on the operation of the turbine, the LP-EGR-BV and HP-EGR schemes are consistent. The results carried out by Wang et al. reveal that as the EGR rate increases, both the turbine flow rate and power decrease at various load points [13]. The primary reason lies in the fact that both EGR schemes cause the turbine expansion ratio to decrease. For HP-EGR, the back-pressure hardly changes. Since the exhaust gas is extracted upstream of the turbine, it causes the inlet pressure of the turbine to drop, which ultimately leads to a decreased turbine expansion ratio.
It can be found from Figure 9 and Figure 10 that the variations in CR also have a significant impact on the operation of the turbine. With the same EGR rate, an increase in the CR generally leads to an improved engine thermal efficiency. As a result, both the exhaust gas temperature and the total exhaust gas energy available for the turbine decrease. Consequently, turbocharger speed decreases, leading to a reduction in the quantities of both intake air and exhaust gas. Since both the exhaust gas temperature and the quantity of exhaust gas accumulated in the exhaust manifold decrease, the turbine inlet pressure decreases as the CR increases, which consequently leads to a reduction in the turbine expansion ratio. Consequently, the turbine flow rate, temperature drop across the turbine, and power decrease as the turbine expansion ratio decreases. The underlying mechanisms of these effects have been explained in the preceding paragraph. As the CR elevates from 12.1 to 25, the turbine power decreases by 15.48%, 13.59%, and 10.20% with a EGR rate of 10%, 30%, and 50%, respectively.
The above results demonstrate that both the EGR and CR have significant influences on the operation of the turbine. The direct cause of these influences can be attributed to the changes in the turbine expansion ratio. As for the impact of EGR on the turbine expansion ratio, it stems from its simultaneous influence on both the turbine inlet and outlet pressures, whereas only the turbine inlet pressure is affected by the variation in CR. In addition, it should be noted that the increase in CR will further exacerbate the decline in turbine power caused by the operation of EGR. It is possible that when the EGR rate and CR increase to a certain extent, the turbine fails to reach the required power, resulting in an insufficient amount of scavenging air and leading to incomplete combustion. In this situation, it is necessary to rematch the turbocharger to meet the engine’s requirement of the amount of scavenging air.
The changes in turbine power caused by the variations in the EGR rate and CR will consequently lead to changes in turbocharger speed and further have an impact on the operation of the compressor as presented in Figure 11. It can be found that as the EGR rate and CR increase, the operating points of the compressor move towards the regions of lower pressure ratio and flow rate. With a CR of 12.1, when the EGR rate increases from 10% to 50%, reductions of 0.029, 0.12, 0.21, and 0.23 in the pressure ratio are observed at 25%, 50%, 75%, and 100% MCR, respectively; meanwhile, the flow rates decrease by 0.65 kg/s, 1.61 kg/s, 2.46 kg/s, and 2.56 kg/s, respectively. With a 30% EGR rate, as CR increases from 12.1 to 25, the pressure ratio decreases by 0.12, 0.27, 0.28, and 0.26 at 25%, 50%, 75%, and 100% MCR, respectively; meanwhile, the flow rate decreases by 1.19 kg/s, 1.91 kg/s, 1.74 kg/s, and 1.46 kg/s, respectively. The variations in the pressure ratio and flow rate directly influence the engine scavenging pressure, thereby resulting in changes in the quantity of cylinder charge, which, in turn, affect the combustion process and NOx formation process. Throughout the whole variation range of EGR rate and CR, compressor efficiency does not exhibit significant deterioration at each load point. At 25% MCR, the compressor efficiency remains around 80%, while at 50%, 75%, and 100% MCR, it stays approximately 84%. At 25%, 50%, and 75% MCR, although the changes in the EGR rate and CR lead to variations in the compressor surge margin as shown in Figure 11, the operating points of the compressor still remain sufficiently far from the surge line, ensuring stable operation of the compressor. At 100% MCR, despite the fact that increasing the CR can slightly increase the surge margin, it significantly decreases as the EGR rate increases. Since the surge margin of the baseline engine is inherently small at 100% MCR, as the EGR rate gradually increases, it is likely to fall below 15%. This is highly detrimental to the safety and stability of the compressor. Hence, in practical applications, the applied EGR rate needs to be limited at high loads for preventing compressor surge.
In general, for the engine under investigation, within the entire variation range of CR and EGR rate, the performance of the compressor is acceptable. The air mass flow rate does not decrease significantly, the efficiency still remains at a relatively high level, and the surge margin is still within a relatively safe range. Therefore, there is no need to rematch the turbocharger. Considering the high cost of the marine large-scale turbocharger, this is of great importance for the upgrading and renovation of existing engines.

4.1.3. Effects on NOx-BSFC Trade-Off

The NOx-BSFC trade-off can be clearly identified from Figure 12, which presents their variations with the EGR rate and CR.
The influences of the EGR and CR on NOx emissions mainly stem from their impacts on the air–fuel equivalence ratio and maximum burned zone temperature. As presented in Figure 13, the maximum burned zone temperature significantly decreases as the EGR rate increases because of the thermal and dilution effects of EGR, whereas it increases as the CR increases mainly because of the faster burning speed and the cylinder charge being subjected to more intense compression. Since both the increases in the CR and EGR rate decrease the quantity of cylinder charge, the air–fuel equivalence ratio decreases correspondingly as shown in Figure 14. The effects of EGR on the maximum burned zone temperature and the air–fuel equivalence ratio are consistent with the results observed in [42]. In addition, it should be noted that, as shown in Figure 14, even in the most extreme case, where the compression is equal to 25 and the EGR rate is equal to 50%, an air–fuel equivalence ratio of approximately 1.4 can still be achieved. This ensures, to a certain extent, that the fuel can be fully burned.
In Figure 12, the gray dash–dotted line represents the Tier III regulations on NOx (3.4 g/kWh), thus allowing for determining the EGR rate required for meeting the Tier III regulations with different CRs under various load conditions. As shown in Figure 12, the EGR rate required for meeting Tier III increases as the CR increases, whereas the corresponding engine BSFC decreases. As shown in Figure 15, as the CR increases from 12.1 to 25, an additional 5.51%, 2.01%, 4.73%, and 4.03% of EGR rate is required at 25%, 50%, 75%, and 100% MCR, respectively. However, as shown in Figure 16, the corresponding BSFC decreases by 11.73%, 12.96%, 11.81%, and 11.82%, respectively, recovering to the level of typical marine large-scale two-stroke diesel engines [43,44]. Therefore, for the investigated engine, the integration of VCR appears to be a viable approach to improve the NOx-BSFC trade-off when employing EGR for meeting the Tier III regulations. It should be noted that increasing the CR significantly elevates the in-cylinder pressure level, especially the peak pressure, which may exceed the permissible maximum value regulated by the engine manufacturer. However, for ensuring safe engine operation, lowering the CR will lower the in-cylinder pressure level and impair the fuel economy. Therefore, in order to fully exploit the capabilities of the EGR in reducing NOx and the VCR in improving fuel economy, it is necessary to further formulate a reasonable optimization strategy by a thorough consideration of optimization objectives and various constraint conditions. Conducting such optimization work can help determine the optimal setting parameters of the engine, which is a crucial step in engine calibration [45].

4.2. Effects of the Combined Application of LP-EGR-BL and VCR

4.2.1. Effects on Combustion Process

Figure 17 presents the in-cylinder pressure and HRR for two LP-EGR schemes with different CRs and EGR rates. As observed from Figure 17a, except for the case with a CR of 12.1 and 10% EGR rate, the in-cylinder pressure level with LP-EGR-BL is greater than LP-EGR-BV, primarily due to two reasons. Firstly, as the EGR rate increases, the scavenging pressure increases for LP-EGR-BL, whereas it decreases for LP-EGR-BV. Therefore, with the same CR and EGR rate, the in-cylinder pressure with LP-EGR-BL will be higher than that with LP-EGR-BV at the start of compression, which further propagates into the subsequent compression, combustion, and expansion stages. Secondly, also due to the higher scavenging pressure, a higher quantity of cylinder charge can be obtained with LP-EGR-BL, thereby leading to a higher quantity of oxygen within the cylinder. This helps to accelerate the burning speed (as indicated by Figure 17b), further elevating the pressure level during the combustion stage. With a CR of 12.1 and 10% EGR rate, no significant differences in the curves of in-cylinder pressure and HRR between two LP-EGR schemes can be detected from Figure 17b. This is mainly because the low EGR rate does not significantly influence the scavenging pressure and the quantity of oxygen within the cylinder. As for the influences of CR on the combustion process, the LP-EGR-BL scheme is consistent with the LP-EGR-BV scheme.
As discussed in Section 4.1.1, the in-cylinder pressure level, to a great extent, determines the engine’s capability to convert the fuel energy into mechanical work. The engine efficiency generally improves with a higher pressure level. Therefore, it is expected that LP-EGR-BL will exhibit higher efficiency than LP-EGR-BV. However, it should be noted that the improvement in engine efficiency comes at the cost of additional electrical power consumed by the EGR blower. Electrical power is generally supplied by the diesel generator set on-board the ship. To make a fair comparison of fuel economy between the two LP-EGR schemes, the fuel consumed to generate the electrical power required for the operation of the EGR blower should also be taken into account [12]. Emphasis should be placed on whether the operation of the EGR blower will cause a significant deterioration in engine fuel economy.

4.2.2. Effects on Turbocharging System

In contrast to the LP-EGR-BV scheme, it can be found from Figure 18 that for the LP-EGR-BL scheme, as the EGR rate increases, the compressor operating point shifts in the direction of higher flow rate and pressure ratio. Taking 75% MCR as an example, as the EGR rate increases from 10% to 50%, the compressor flow rate increases by 0.82 kg/s, 1.09 kg/s, 1.33 kg/s, and 1.52 kg/s with CRs of 12.1, 17, 21, and 25, respectively. Meanwhile, the pressure ratio increases by 0.12, 0.17, 0.19, and 0.21, respectively. This will contribute to higher scavenging pressure and quantity of cylinder charge, thereby partially compensating for the reduction in compressor flow rate caused by the increase in CR. As shown in Figure 18, limited by the maximum rotational speed of the selected EGR blower, when the CRs are 12.1 and 25 at 100% MCR, the maximum achievable EGR rates are 43.9% and 45.6%, respectively. Although a further higher EGR rate cannot be achieved, the findings of existing studies reveal that for typical large marine two-stroke diesel engines, an EGR rate of around 30% is sufficient for complying with Tier III [8,12,13]. Within the entire variation range of CR and EGR rate, there is no obvious deterioration in the compressor efficiency with the compressor operating points still remaining in the high-efficiency region. At 25% MCR, the compressor efficiency remains around 81%, while at 50%, 75%, and 100% MCR, it ranges between 83% and 85%. In addition, as can be observed from Figure 18, at various load points, the operating points of the compressor move approximately along a straight line. Therefore, the surge margin basically remains at the original level, which ensures that the compressor is capable of operating safely and stably.
For the LP-EGR-BL scheme, the EGR blower can be considered as playing a role in promoting the engine’s intaking and exhausting processes. Therefore, with the increase in EGR rate through elevating the EGR blower speed, both the quantities of the intake air and exhaust gas increase, thus causing more exhaust gas accumulated in the exhaust manifold. Although the engine thermal efficiency generally decreases as the EGR rate increases, consequently leading to a rising potential in the exhaust gas temperature (i.e., the turbine inlet temperature), the results presented in Figure 19a indicate that the turbine inlet temperature does not exhibit significant changes with the variations in EGR rate. The maximum change is less than 3K at various conditions of CRs. This is because the increased quantity of exhaust gas “dilutes” the temperature rise potential. Therefore, based on the ideal gas equation of state, if the quantity of exhaust gas in the exhaust manifold increases and its temperature remains essentially unchanged, the exhaust gas pressure, i.e., turbine inlet pressure, increases with the increase in the EGR rate as presented in Figure 19b. Since the engine back-pressure remains almost unchanged for the LP-EGR-BL scheme, the turbine expansion ratio also increases as the EGR rate increases. Because the turbine flow area is fixed and the flow coefficient increases with the expansion ratio, the turbine flow rate increases as the EGR rate increases as presented in Figure 19c. Because both the turbine inlet temperature and turbine efficiency do not significantly change with the variation in EGR rate, the temperature drop across the turbine also remains relatively unchanged. As a result, the turbine power increases as the EGR rate increases as shown in Figure 19d. Taking 75% MCR as an example, as the EGR rate increases from 10% to 50%, the turbine power increases by 5.21%, 7.72%, 9.54%, and 11.6% with a CR of 12.1, 17, 21, and 25, respectively.
The influences of the EGR on both the operation of the turbine and compressor presented in this section are consistent with those observed in the existing literature [13]. In addition, the influences of the CR are consistent with that of the LP-EGR-BV. For the LP-EGR-BL scheme, the operation of EGR can compensate for the decline in turbine power caused by the increased CR. However, this also comes at the cost of additional electrical power consumed by the EGR blower.

4.2.3. Effects on NOx-BSFC Trade-Off

For the LP-EGR-BL scheme, the NOx-BSFC trade-off can also be identified from Figure 20, where the engine BSFC both with and without considering the power consumed by the EGR blower are presented. Undoubtedly, taking into account the power consumed by the EGR blower leads to a penalty on BSFC according to Equation (9). It can be found that the BSFC penalty is subjected to the EGR rate, CR, and engine load. The difference in BSFC with and without considering the EGR blower power becomes larger as the EGR rate increases. This is mainly because a higher EGR rate requires more quantity of exhaust gas to be recirculated, which, in turn, leads to more electrical power consumed by the EGR blower. It can also be observed from Figure 20 that, with the increase in engine load, the difference in BSFC gradually becomes larger. With the increase in engine load, the quantity of engine intake air increases. For achieving the same EGR rate, the required quantity of exhaust gas increases accordingly, thus leading to higher EGR blower power. In addition, the variation in the CR also has an impact on the EGR blower power. As the CR increases, the quantity of intake air decreases due to the reduction in scavenging pressure. Therefore, the required quantity of exhaust gas for achieving the same EGR rate decreases accordingly, which, in turn, leads to a reduction in the EGR blower power.
Figure 21 presents the EGR rate required for meeting Tier III regulations for the LP-EGR-BL scheme. By comparing Figure 15 and Figure 21, it is observed that with the same engine load and CR, the EGR rate required for meeting Tier III regulations is very close with the difference not exceeding 1%. This indicates that for the two LP-EGR schemes under investigation, their effectiveness in controlling the NOx emissions are almost the same. As can be found from Figure 21, for complying with Tier III regulations, the required EGR rate does not exceed 30% at 25% MCR, whereas it is only around 20% at other load points. Combining the results shown in Figure 20, it is inferred that with these EGR rates, there will not be a significant penalty on BSFC. Figure 22 presents the corresponding BSFC when complying with Tier III regulations. As can be found from this figure, taking into account the electrical power consumed by the EGR blower does not cause a significant penalty on BSFC, not exceeding 1 g/kW·h.
For the LP-EGR-BL scheme, since the corresponding EGR system is located on the low-pressure side of the engine and the exhaust gas pressure is low, the power consumed by the EGR blower is not high. The EGR blower power corresponding to the EGR rate shown in Figure 21 is generally no more than 40 kW. It is expected that higher EGR blower power will be required in the case of a HP-EGR scheme. Nevertheless, the research by Lu et al. reveals that for the HP-EGR scheme, even when the EGR blower power is taken into account, the resulting BSFC penalty is only around 1.5 g/kW·h [12]. This means that whether it is LP-EGR or HP-EGR, the operation of the EGR blower will not have a significant impact on the engine fuel economy. This is mainly because, for large marine two-stroke engines, their power at MCR can usually reach over ten thousand kilowatts. In comparison, the EGR blower power is much smaller.

5. Engine Performance Optimization

5.1. Formation of Optimization Strategy

To make full use of the capabilities of EGR in reducing the NOx emissions and VCR in enhancing the engine efficiency, a meticulously designed optimization study is necessary. To this end, the optimization objective, optimization variables, and constraint conditions need to be determined.
In this study, the optimization objective is to minimize the engine fuel consumption while ensuring the engine to meet the Tier III regulations in diesel mode. Similarly to other studies, BSFC is used for evaluating the fuel consumption performance in this study.
Besides the EGR rate and CR, for achieving a satisfactory optimization result, the fuel injection timing (FIT) and exhaust valve closing (EVC) timing are additionally chosen as the optimization variables. This is because, according to the findings of existing studies, they have significant impacts on both the pressure level and charge quantity within the cylinder, respectively, which consequently influence both the BSFC and the formation of NOx emissions [15,46].
To ensure that the engine is able to operate safely and stably, formulating reasonable constraint conditions is necessary. In this study, a total of three constraint conditions were set. Firstly, the Tier III regulations on NOx emissions should be fully complied with, i.e., the brake specific NOx emissions (bsNOx) should not exceed 3.4 g/kW·h. Then, in-cylinder peak pressure should not exceed the allowable maximum value, which is set at 180 bar in this study. The purpose is to prevent the engine from experiencing excessive mechanical loads, which could damage the engine’s structure. Finally, to ensure the stable operation of the compressor, a constraint on the minimum surge margin is specified, which is set to 15% in this study [13]. However, it should be noted that the constraint on the surge margin is only applied at 100% MCR. This is because at 100% MCR, the original surge margin (before optimization) is already close to 15%. On the contrary, at 25%, 50% and 75% MCR, the original surge margins are much greater than 15%. Therefore, the possibility of surge is relatively low. Besides the NOx emissions, peak pressure, and surge margin, constraint conditions are set for other engine operating parameters in some similar studies. For example, upper limits are specified for the exhaust gas temperature at the turbine inlet, whereas lower limits are specified for the air–fuel equivalence ratio [42]. It must be noted that the improved engine fuel economy stems from the improvement in engine efficiency. A higher engine efficiency implies that a higher proportion of fuel energy is converted into mechanical work, resulting in lower energy remaining in the exhaust gas. As a result, the exhaust gas temperature at the turbine inlet and the turbocharger rotational speed will still be lower than the specified upper limits since they are already within the allowable limits before optimization. In addition, the findings of the parametric investigations reveal that within the variation ranges of the selected optimization variables, the air–fuel equivalence ratio is capable of ensuring the injected fuel burns completely. Therefore, in this study, there is no need to set the minimum air–fuel equivalence ratio as a constraint condition.
Based on the above discussions, the optimization strategy is formulated, which is defined as a constrained single-objective optimization problem as follows:
Optimization   objective :   min   B S F C = f ( x )
Optimization   variables :   x = ( γ , ϕ EGR , α inj , α EVC , )
Constraint   conditions :   p peak = g 1 ( x ) 180   bar b s N O x = g 2 ( x ) 3.4   g / kW h S M = g 3 ( x ) 15 %
where ppeak denotes the in-cylinder peak pressure; SM denotes the surge margin; x denotes the vector of optimization variables; γ denotes the compression ratio; ϕEGR denotes the EGR rate; αinj and αEVC denote the fuel injection and EVC timing, respectively; f in Equation (10) denotes the function of BSFC in relation to the optimization variables; g1, g2, and g3 in Equation (12) denote the functions of ppeak, bsNOx, and SM in relation to the optimization variables.
As for the constraint conditions specified in the optimization strategy, they are implemented in the form of the penalty function during the optimization process. The constrained optimization problem is transformed into an unconstrained optimization problem through the penalty function. For the feasible solution (satisfying constraints), the fitness value is directly set to the objective function value. However, for the infeasible solution (violating constraints), the penalty function is used to significantly increase the fitness value of the infeasible solution, so that it will be eliminated in subsequent iterations.
Based on the formulated optimization strategy, it becomes possible not only to find the optimal engine settings that achieves satisfied engine fuel economy while complying with Tier III, but also to achieve a fair and objective comparison between the two LP-EGR schemes since the same optimization objective, optimization variables, and constraint conditions are employed.

5.2. Optimization Program

The procedure of the optimization program is shown in Figure 23, and a brief introduction is provided herein:
  • The RSM is applied to establish the functional relationships between the engine response variables and decision variables with the required data generated by the engine simulation model. The Box–Behnken Design (BBD), one of the most commonly used methods for the design of experiments, is employed to create the response surfaces. With BBD, 3 levels are specified for each factor, and 29 simulation runs are carried out for every case. Three evaluation indicators, including R2 (coefficient of determination), adj-R2 (adjusted R2), and pred-R2 (predicted R2), are used to assess the precision of the derived RSM-based regression models [47]. In addition, an analysis of variance (ANOVA) is performed to evaluate the significance of the derived regression models. Table 2 and Table 3 provide the corresponding analysis results for LP-EGR-BV and LP-EGR-BL, respectively. As can be observed from the two tables, all the values of R2 and adj-R2 are greater than 0.95, most of which are close to 1, implying that the derived regression models can fit the existing data well and there is no over-fitting problem. In addition, the adj-R2 is also in reasonable agreement with the corresponding pred-R2 with the difference less than 0.2, indicating the satisfactory prediction ability of the regression models for new data [48]. It can also be confirmed that all the derived regression models are statistically significant since their corresponding p-values are less than 0.0001. As a result, the obtained RSM-based regression models can be used with fidelity for the subsequent optimization procedures.
  • Based on the formulated optimization strategy and the RSM-based regression models, the PSO algorithm is applied to find the optimal engine settings that achieve the best fuel economy under the premise of meeting Tier III and the specified constraint conditions.
  • The simulation results of selected engine response variables are calculated by applying the engine settings derived from the PSO to the engine model. Then, the accuracy of the optimization results is validated through comparing them with the simulation results. Table 4 presents the corresponding relative errors. In this table, a relative error with a negative sign indicates that the optimization result is less than the simulation result, whereas a positive sign means the optimization result is greater than the simulation result. As can be found from Table 4, the accuracy of the optimization results is acceptable with most of the relative errors falling in the range of ±4%. Compared with other engine performance parameters, the relative errors of bsNOx are relatively larger. This is mainly because, due to the small absolute value of bsNOx, a small absolute error can lead to a large relative error. Taking the LP-EGR-BL scheme at 75% MCR as a example, although the relative error of bsNOx is extremely large (−12.97%), the absolute error is only −0.51 g/kW·h. It should be noted that the deviations between the optimization and simulation results are inevitable, which is mainly attributed to two reasons. Firstly, when deriving the regression models based on RSM, it is impossible to take into account all the factors influencing the engine performance. Secondly, when developing the engine simulation model, assumptions and simplifications are always made to reduce the model complexity.
  • Although the optimization results derived from the PSO algorithm can strictly meet the specified constraint conditions, due to the existence of prediction deviations, the simulation results obtained by the engine simulation model may not satisfy the constraint conditions, that is, the bsNOx exceeds 3.4 g/kW·h and the in-cylinder peak pressure exceeds 180 bar. To address this issue, the optimization results of engine settings derived from the PSO algorithm are manually adjusted so that the simulation results are capable of complying with the specified constraint conditions. Since the deviations between the optimization and simulation results are not significant, the magnitude of manual adjustment is also minimal with the impact on BSFC of no more than 0.3 g/kW·h.

5.3. LP-EGR-BV Versus LP-EGR-BL

Based on the formulated optimization strategy and optimization program, a fair comparison between the two investigated LP-EGR schemes becomes possible. Figure 24 presents the optimization results of the engine settings, whereas the resulting BSFC and brake efficiency are provided in Figure 25.
Because of the significant impact of CR on the BSFC, for the two LP-EGR schemes, the CR is significantly increased at each load point as shown in Figure 24a. At 25% and 50% MCR, CR is elevated to the permissible maximum value of the specified adjustable range of the VCR mechanism. This indicates that at the two load points, it is possible to further improve the engine fuel economy by elevating the CR, but this is restricted by the adjustable range of the VCR mechanism. At 75% and 100% MCR, although the optimized CR also increases significantly, it does not reach the permissible maximum value of the specified adjustable range of the VCR mechanism. This is mainly because further increasing the CR could cause the peak pressure to exceed the permissible maximum value specified in this study. As observed from Figure 24b, for the two LP-EGR schemes, the optimized FIT is advanced to varying degrees at each load point. Advancing the FIT generally leads to the advancement of combustion. As a result, the in-cylinder pressure level elevates, thereby improving the engine fuel economy. It should be noted that both increased CR and advanced FIT generally result in increased NOx. Therefore, as shown in Figure 24c, the NOx emissions are required to be lowered by EGR for meeting the Tier III regulations. For marine two-stroke engines, appropriately advancing the EVC timing can increase the effective CR, whereas retarding the EVC timing can be used to implement the Miller cycle to reduce the NOx. As observed from Figure 24d, at 25%, 75%, and 100% MCR, the optimized EVC timings are delayed to varying degrees, whereas at 50% MCR, it is advanced.
As shown in Figure 25a, through performing the optimization program, the engine fuel economy is significantly improved, recovering to the level of typical marine diesel engines [43,44]. For the LP-EGR-BV scheme, compared with the baseline engine, the optimized BSFC decreases by 10.16%, 11.95%, 10.32%, and 9.68% at 25%, 50%, 75%, and 100% MCR, respectively, whereas, for the LP-EGR-BL scheme, the optimized BSFC (taking into account the electrical power consumed by the EGR blower) decreases by 10.11%, 11.93%, 9.93%, and 9.58%, respectively. These results indicate that if only the fuel economy is taken into consideration, the two LP-EGR schemes when used in combination with VCR are equivalent. Consistent to the decrease in BSFC, the optimized engine brake efficiency improves significantly as shown in Figure 25b, reaching the level of typical marine large-scale two-stroke diesel engines, around 50%.
Table 5 presents the optimization results of the NOx emissions and some other parameters related to the safety and stability of the engine. After optimization, the NOx emissions level of the investigated engine improves from meeting Tier II (≤14.4 g/kW·h) to Tier III regulations (≤3.4 g/kW·h). As for the peak pressure, compressor surge margin, turbocharger speed, and turbine inlet temperature, all of them are lower than the specified maximum limits or within a reasonable range. In addition, the air–fuel equivalence ratio after optimization can also ensure the complete combustion of the fuel within the cylinder.
For the LP-EGR-BL scheme, the impacts of the power consumed by the EGR blower on BSFC are also presented in Figure 25a. The results indicate that the power consumption of the EGR blower does not contribute to obvious penalty on BSFC, generally not exceeding 0.5 g/kW·h, which is mainly due to the low power level of the EGR blower. Figure 26 presents the operating parameters of the EGR blower at each load point. At 25%, 50%, 75%, and 100% MCR, the pressure ratio is 1.0085, 1.0075, 1.0193, and 1.0376, respectively, whereas the corresponding power is 3.18 kW, 2.91 kW, 8.64 kW, and 22.69 kW, respectively.
For the two LP-EGR schemes, although they are very close in terms of fuel economy, the differences in their implementation schemes lead to obvious disparities in initial cost, maintenance cost, structural complexity, etc. Table 6 compares the two LP-EGR schemes from multiple aspects. In terms of structural complexity, the LP-EGR-BV scheme is superior to the LP-EGR-BL scheme. The structure of the LP-EGR-BV is simple, only requiring a back-pressure valve and associated control mechanisms. In contrast, the LP-EGR-BL scheme requires a complex and precise blower, motor, and their control system. This inherently leads to higher initial costs for the LP-EGR-BL compared to the LP-EGR-BV. Furthermore, given that the EGR blades are exposed to a harsh high-temperature environment over long-term operation and must counteract corrosion and abrasion caused by sulfides and particulates in the exhaust gas, the blades require specialized coatings and advanced surface treatment processes [12,13]. This significantly exacerbates the already high initial costs of the LP-EGR-BL scheme. To ensure the reliable operation of the EGR blower, it necessitates regular cleaning of the blower blades and replacement of bearings and seals. In contrast, the LP-EGR-BV only requires periodic cleaning of the valve body and seal integrity inspections. Consequently, the maintenance cost of the LP-EGR-BL is higher than that of the LP-EGR-BV. The LP-EGR-BL scheme has a significantly larger volume compared to the LP-EGR-BV, resulting in a higher installation space requirement. This becomes critical for small ships with limited engine room space, which cannot be overlooked. Consequently, for retrofitting existing marine engines, the LP-EGR-BV is a more practical solution due to its smaller demand for installation space. Another obvious difference between the two LP-EGR schemes is that the LP-EGR-BL requires additional consumption of electrical energy to drive the EGR blower. Although the findings of this study demonstrate that both LP-EGR schemes can achieve comparable fuel economy, this is the result of meticulous optimization of engine setting parameters.
Through the above analysis, it can be preliminarily inferred that the LP-EGR-BV scheme is a more economical and practical solution, but this still requires on-board ship verification under real operating conditions. As for the superiority of the two schemes in terms of control precision and response speed, dedicated and comprehensive research needs to be carried out.

6. Informing on Real-World Design Decisions

In this section, how the findings of this study inform real-world design decisions is explored mainly from three perspectives, namely commercialization potential, cost-effectiveness, and reliability, which are of significant concern to both ship owners and engine manufacturers.
The results presented in Section 5 demonstrate that the combination of LP-EGR and VCR can effectively improve the fuel economy of the marine dual-fuel engines of low-pressure gas injection in diesel mode; meanwhile, Tier III regulations can be fully met. It is also expected that satisfactory energy-saving and emission-reduction effects can be achieved when operating in gas mode. This is highly attractive to shipowners. Furthermore, considering that the EGR technology is already highly mature in the marine engine sector and WinGD’s VCR technology has gradually entered commercialization, the technical route proposed in this study, namely LP-EGR combined with VCR, is technically feasible and holds significant commercial potential.
To evaluate the cost-effectiveness of the proposed technical route, consider the following scenario: a ship with the engine investigated in this study as its propulsion plant operates a total 7000 h annually. The navigation durations at 25%, 50%, 75%, and 100% MCR are 1050 h, 1050 h, 3500 h, and 1400 h, respectively. The fuel used is marine diesel oil priced at USD 430 per ton [37]. Table 7 provides the estimated annual fuel consumption and fuel cost for the original engine and the two LP-EGR schemes. As shown in this table, compared to the original engine, both LP-EGR schemes achieve an approximate reduction of 1200 tons in annual fuel consumption and save annual fuel costs by over USD 500,000. Even if it is assumed that the engine operates in diesel mode for only one-fifth of its lifetime, the corresponding annual fuel consumption and fuel costs can be saved by approximately 240 tons and USD 100,000, respectively. Assuming a ship’s lifecycle of 20 years, the total fuel cost savings would exceed USD 2 million. Taking into account that the gas mode will also benefit from the application of the proposed technical route, the corresponding savings in fuel costs will be more substantial. Compared to the initial and maintenance costs of the LP-EGR and VCR mechanisms, the reduction in fuel costs is substantial, thus confirming that the technical route proposed in this study offers highly attractive cost-effectiveness.
EGR technology has been utilized in marine engine applications for over ten years, and its reliability has been thoroughly demonstrated through extensive real-world operational experience [8,9,10]. However, VCR technology has only recently begun to be commercialized in the field of marine engines. Considering that the VCR mechanism is continuously subjected to high pressure arising from the in-cylinder combustion, this poses substantial challenges to the mechanical strength, operational stability, and sealing integrity of the hydraulic driving system. Therefore, the reliability of VCR technology still requires further on-board tests.

7. Conclusions

In this paper, a numerical study was carried out to investigate the applicability of LP-EGR combined with VCR in improving the fuel economy of marine two-stroke dual-fuel engines of low-pressure gas injection in diesel mode. The main findings are summarized as follows:
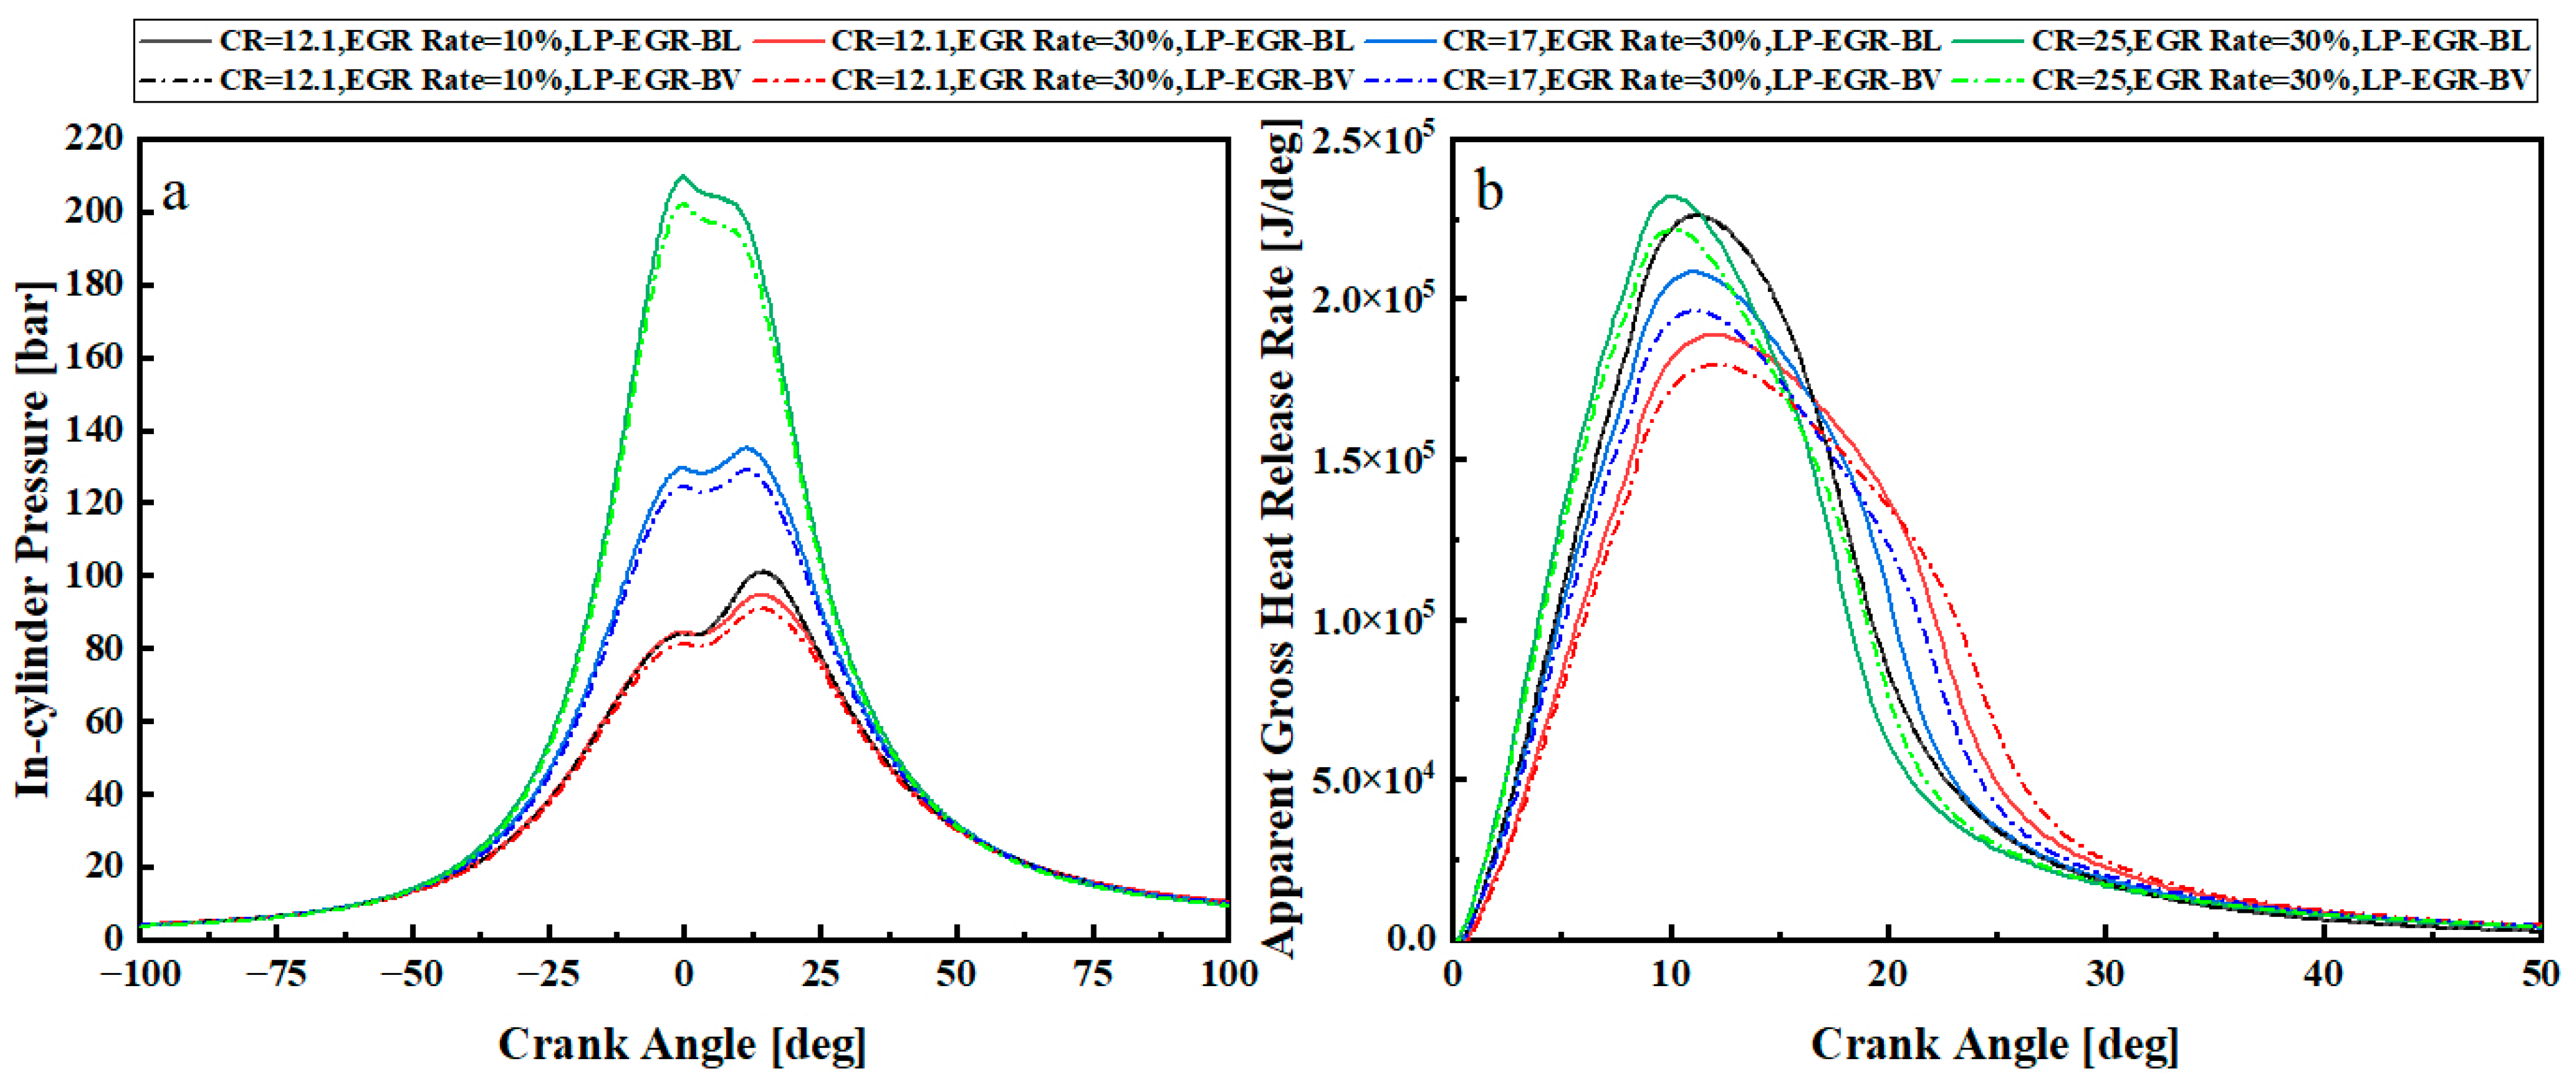
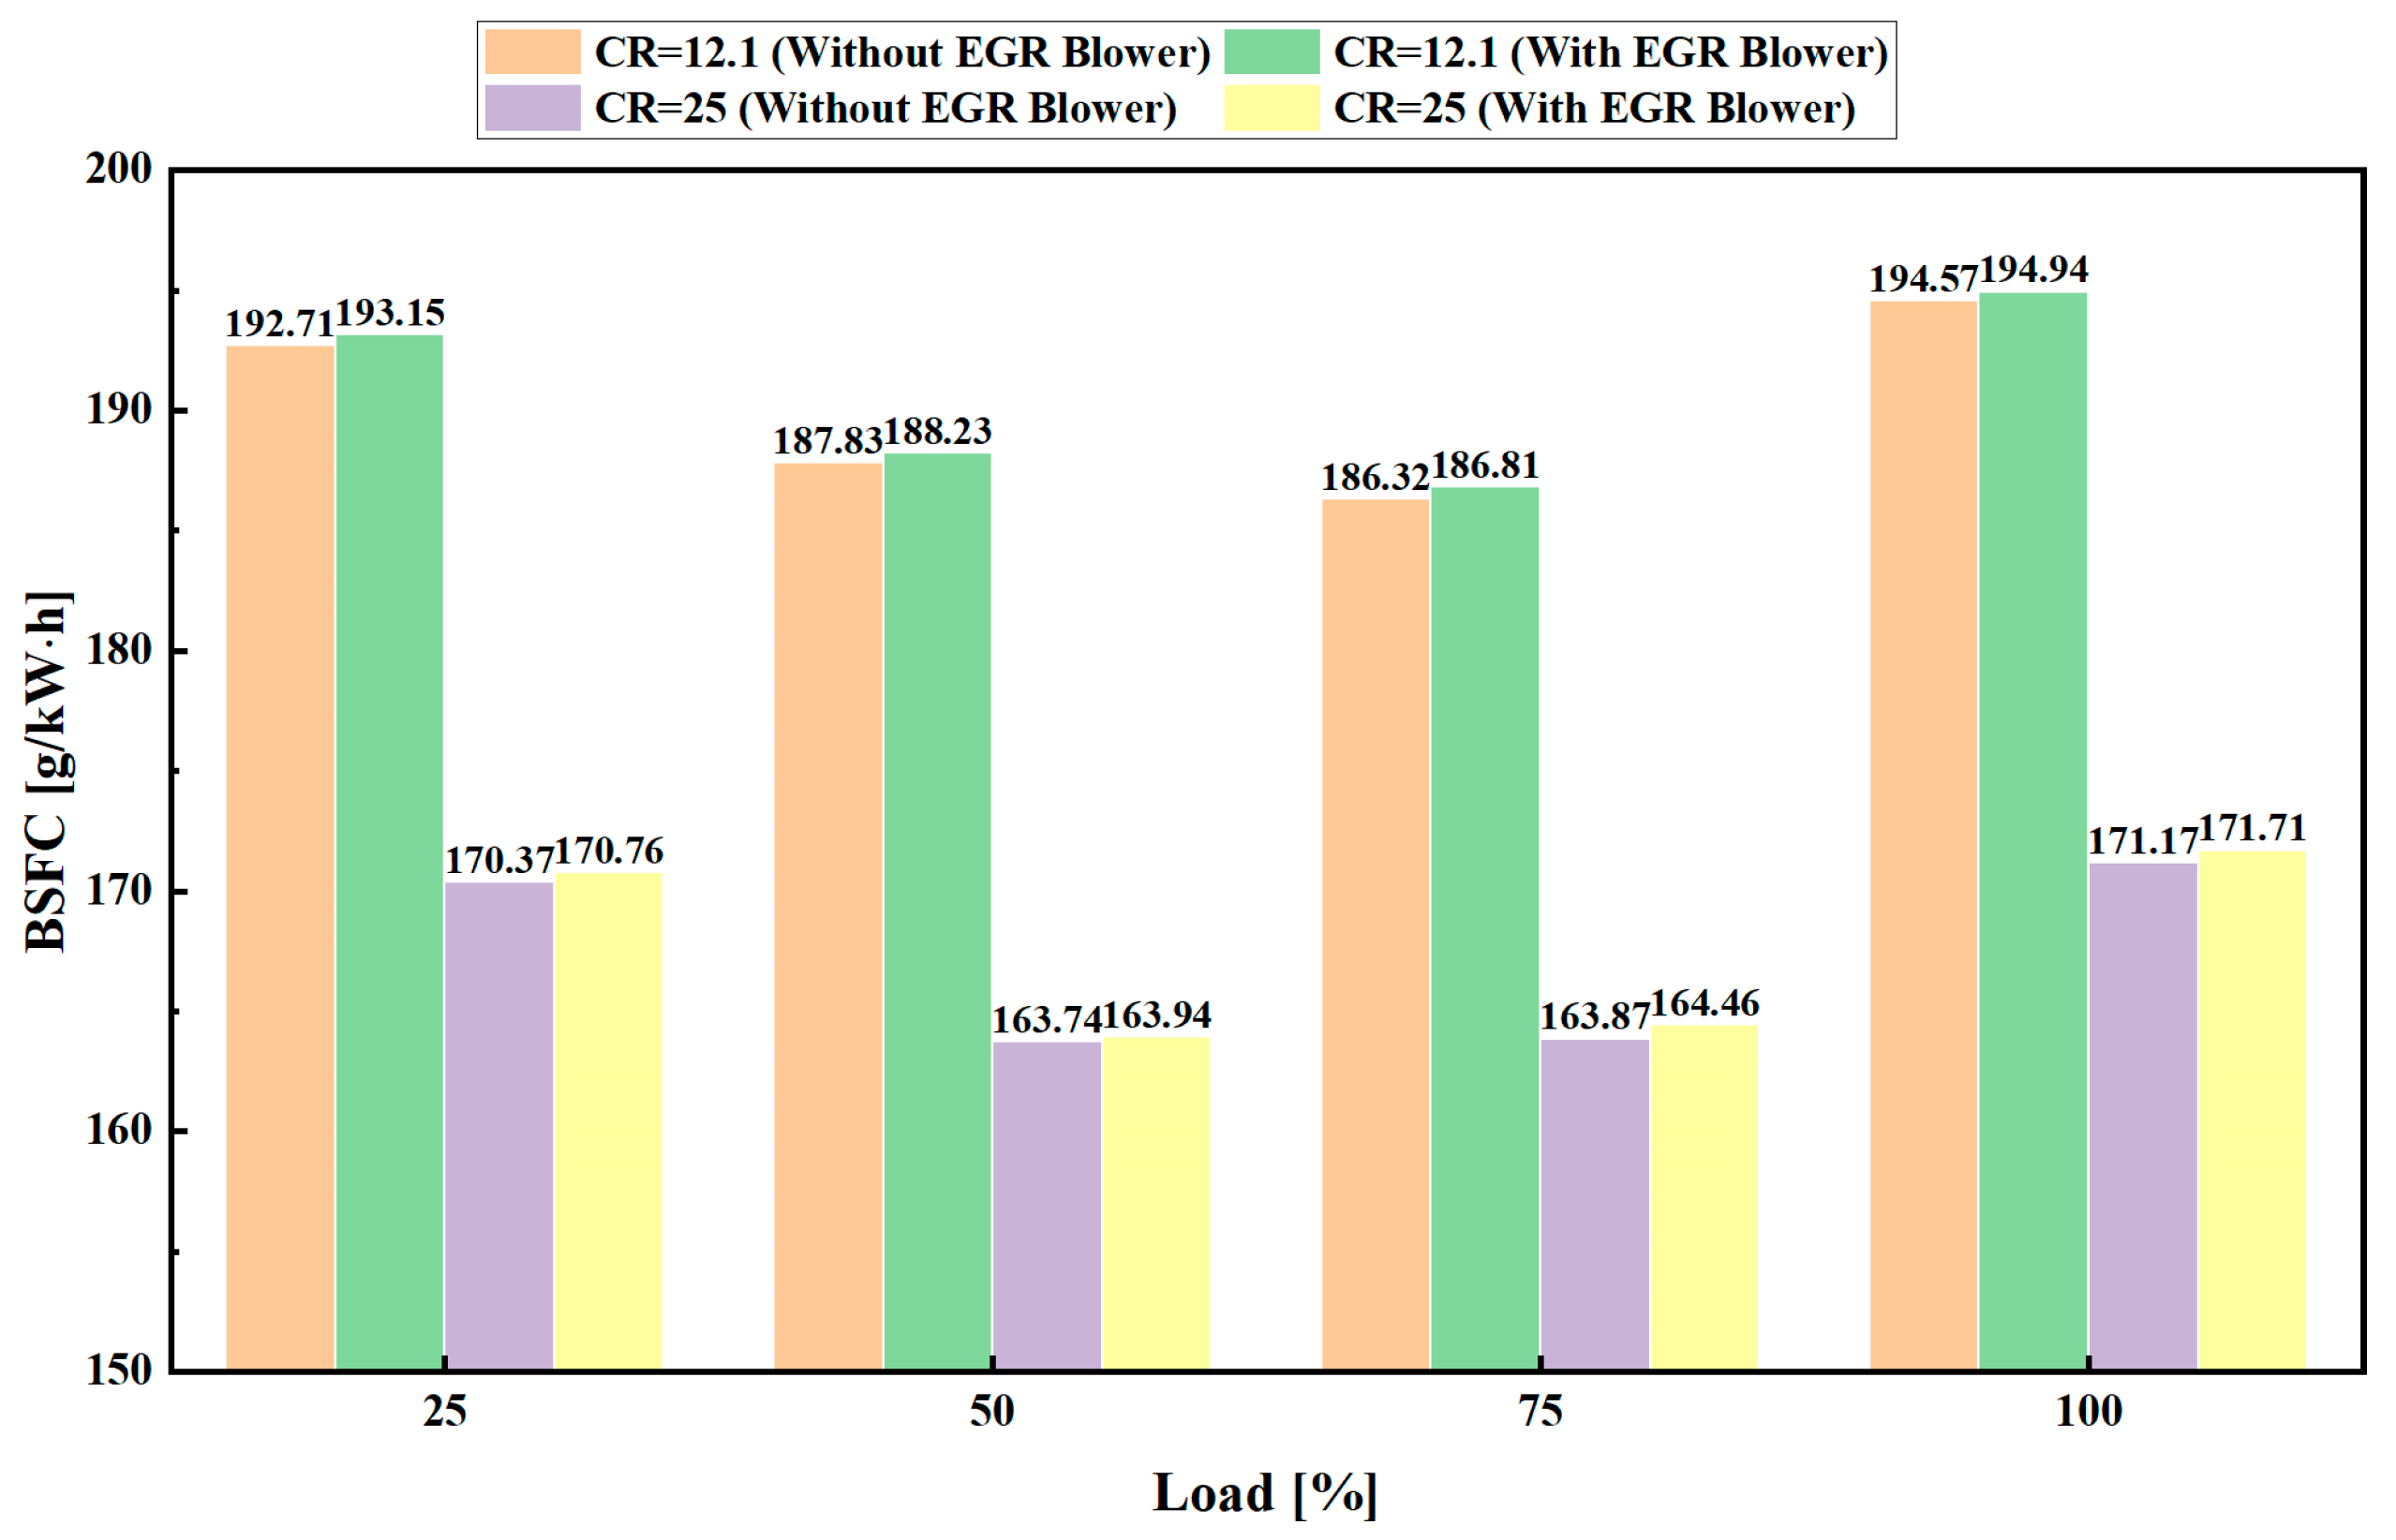
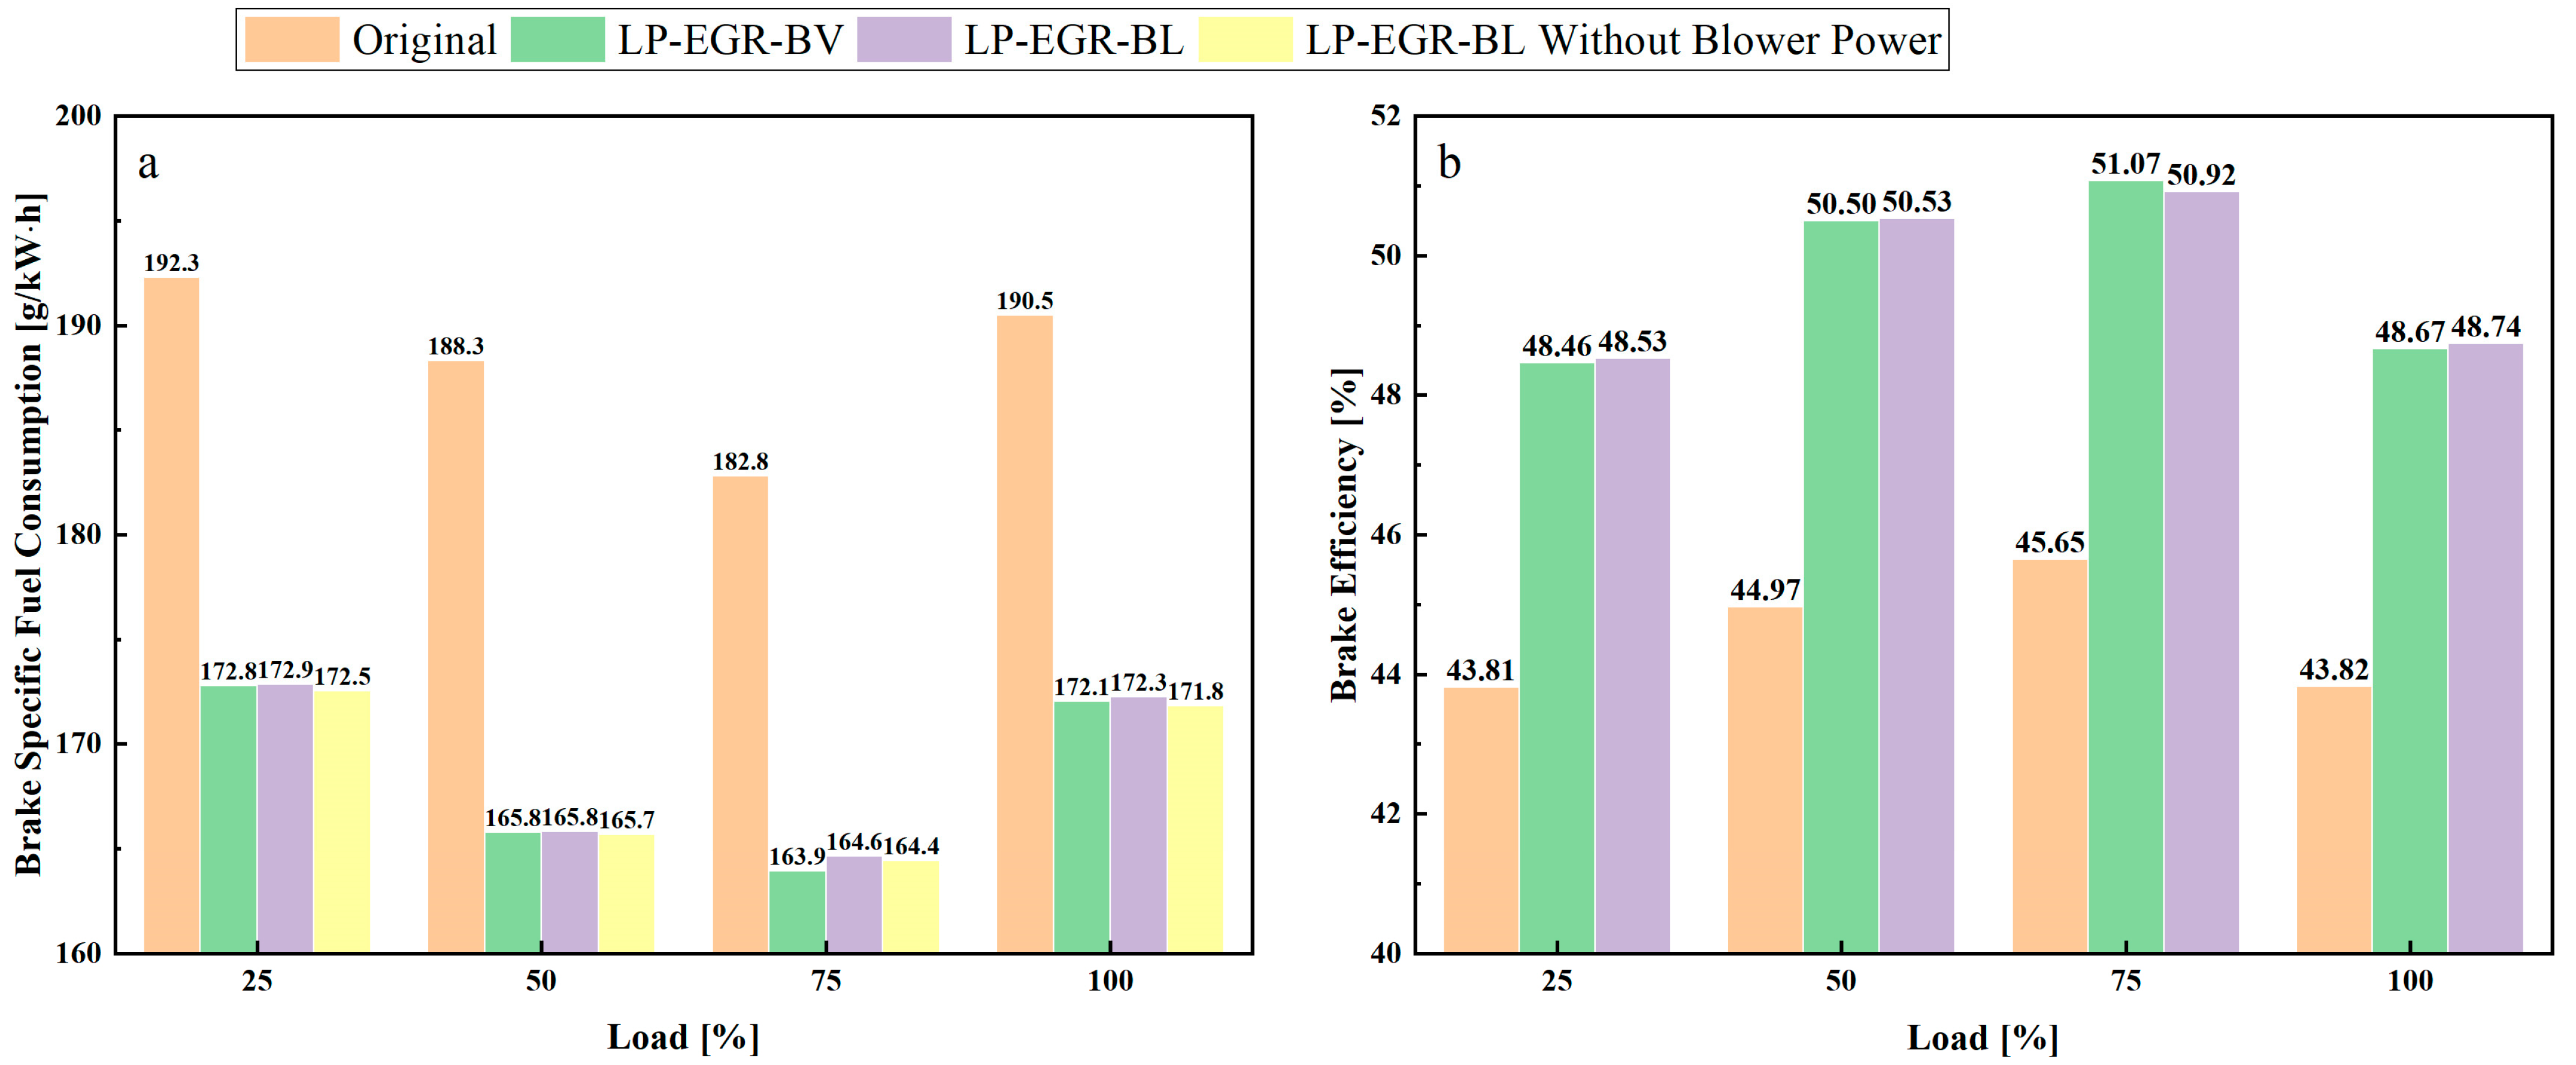
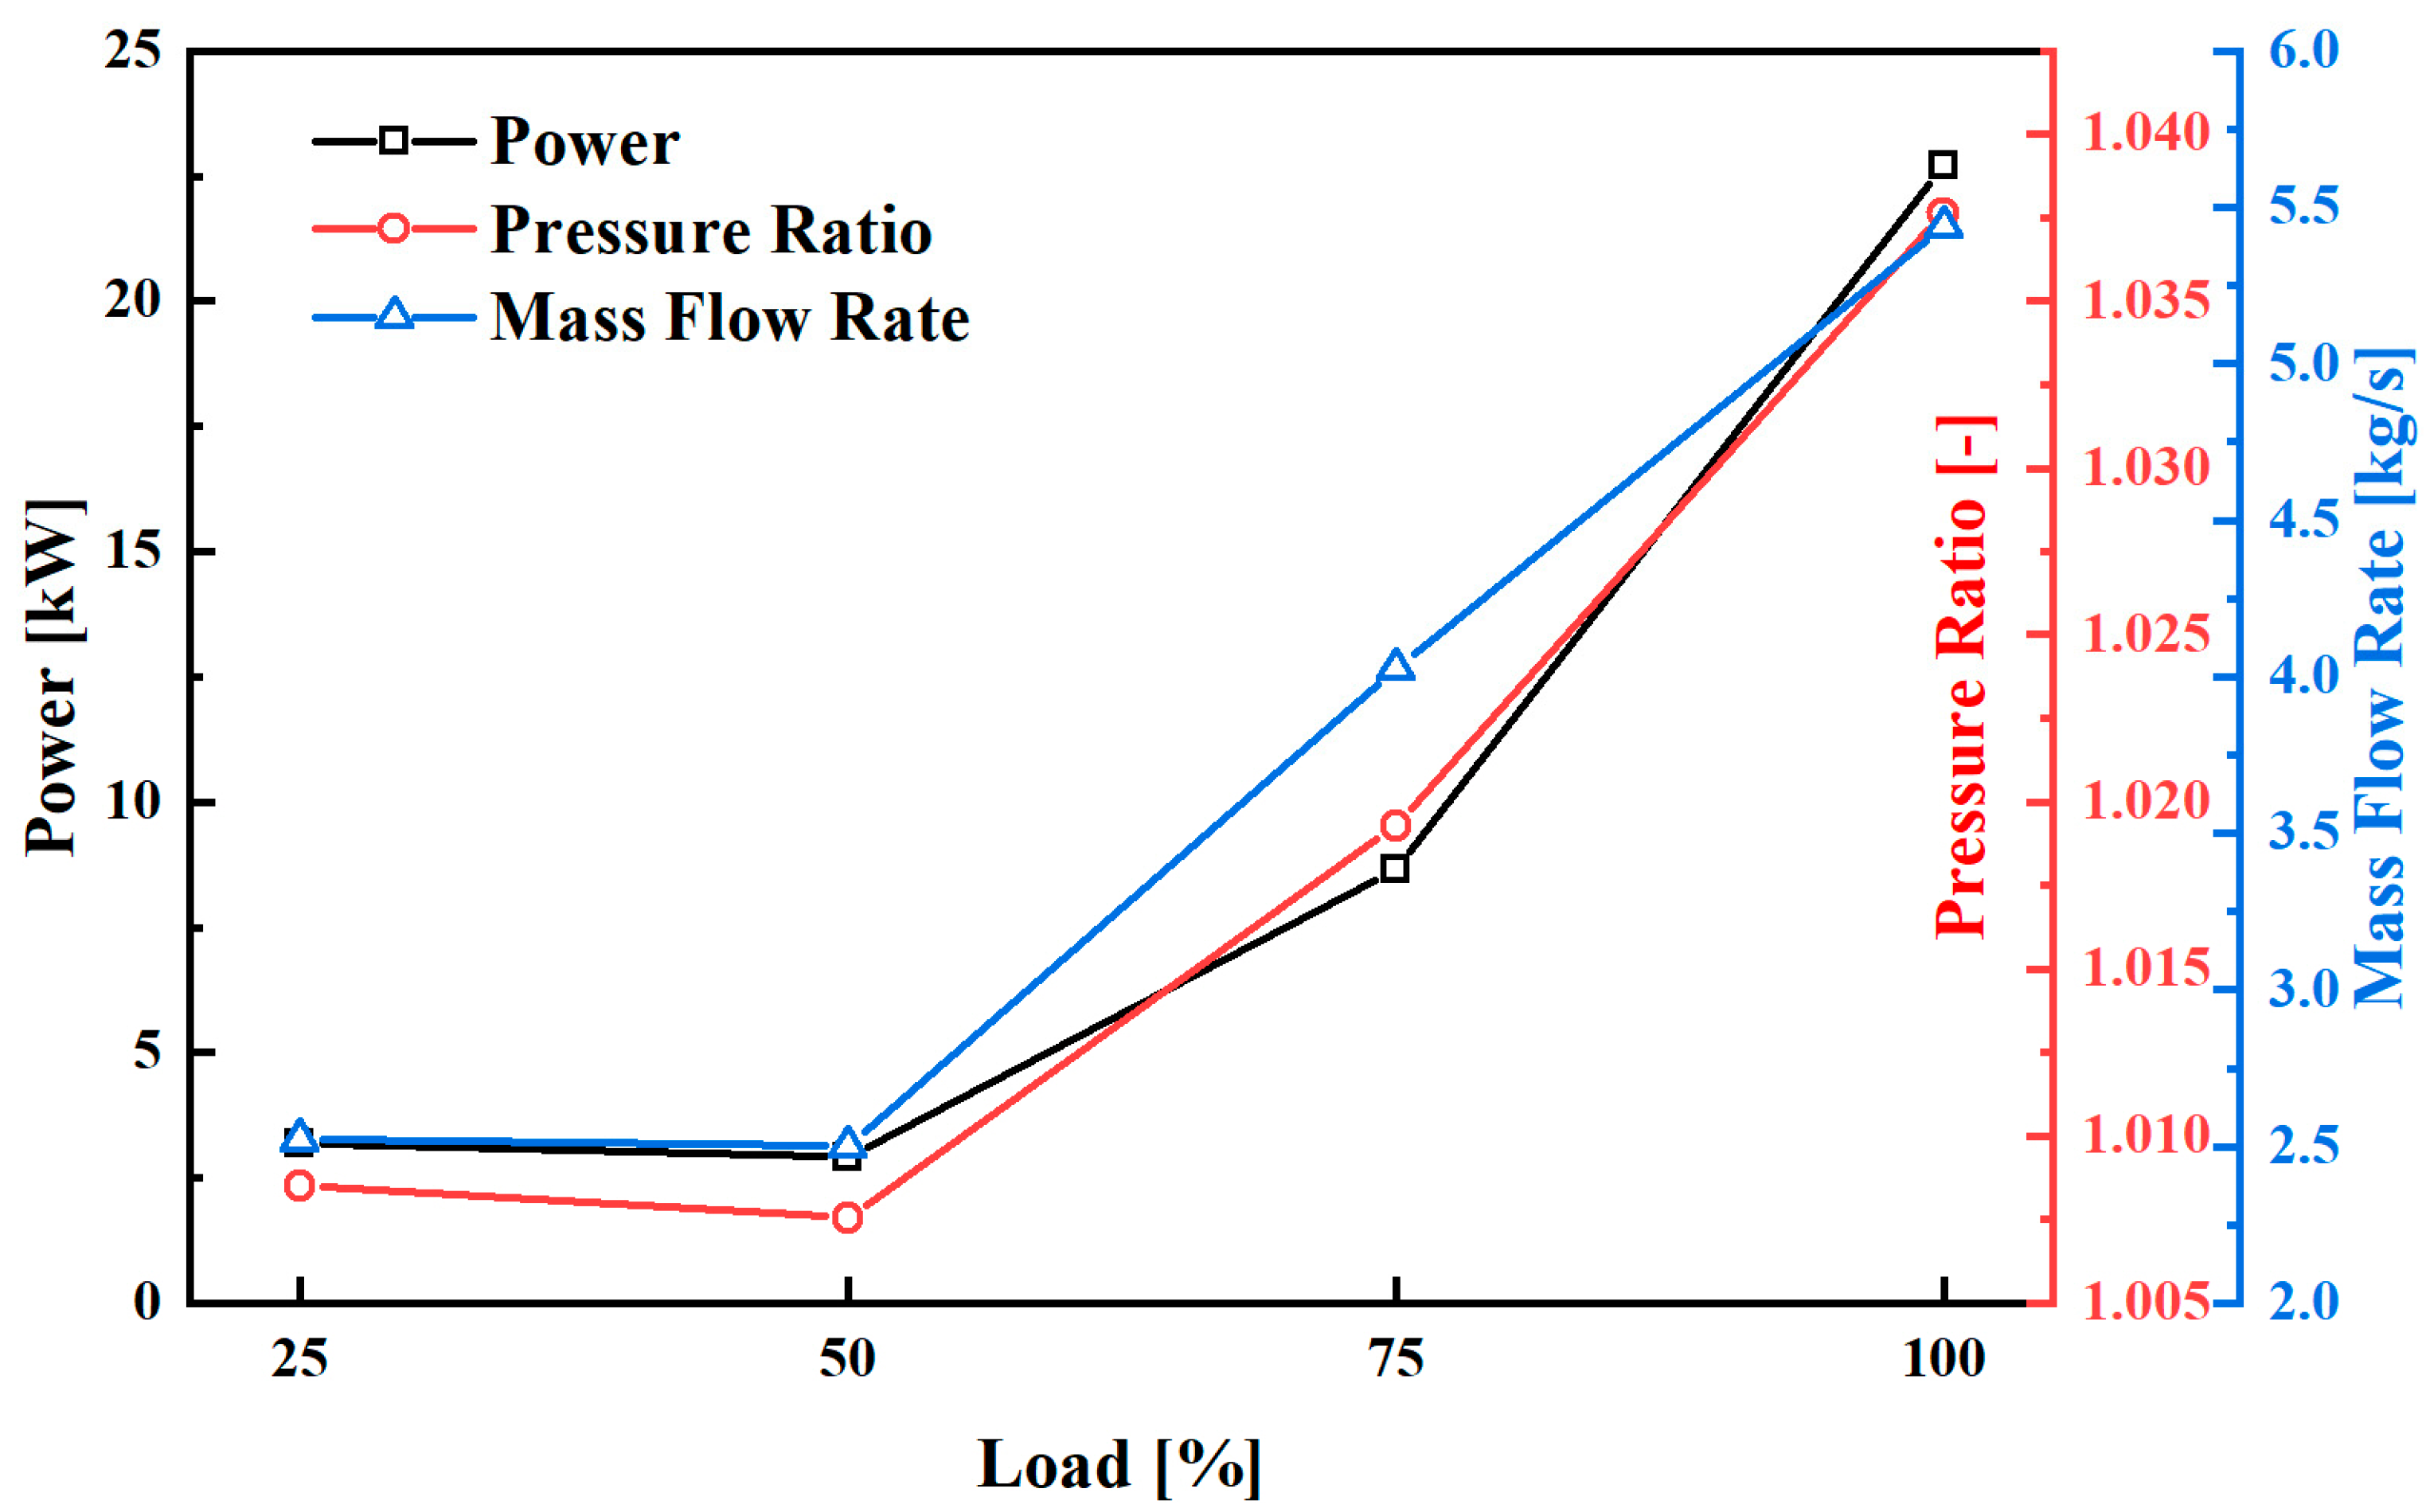
  • Compared with the LP-EGR-BV scheme, a higher in-cylinder pressure level can be obtained with the LP-EGR-BL scheme but at the cost of additional power consumed by the EGR blower. Nevertheless, due to the low exhaust gas pressure in the LP-EGR system, the increase in BSFC caused by the operation of EGR blower does not exceed 1 g/kW·h.
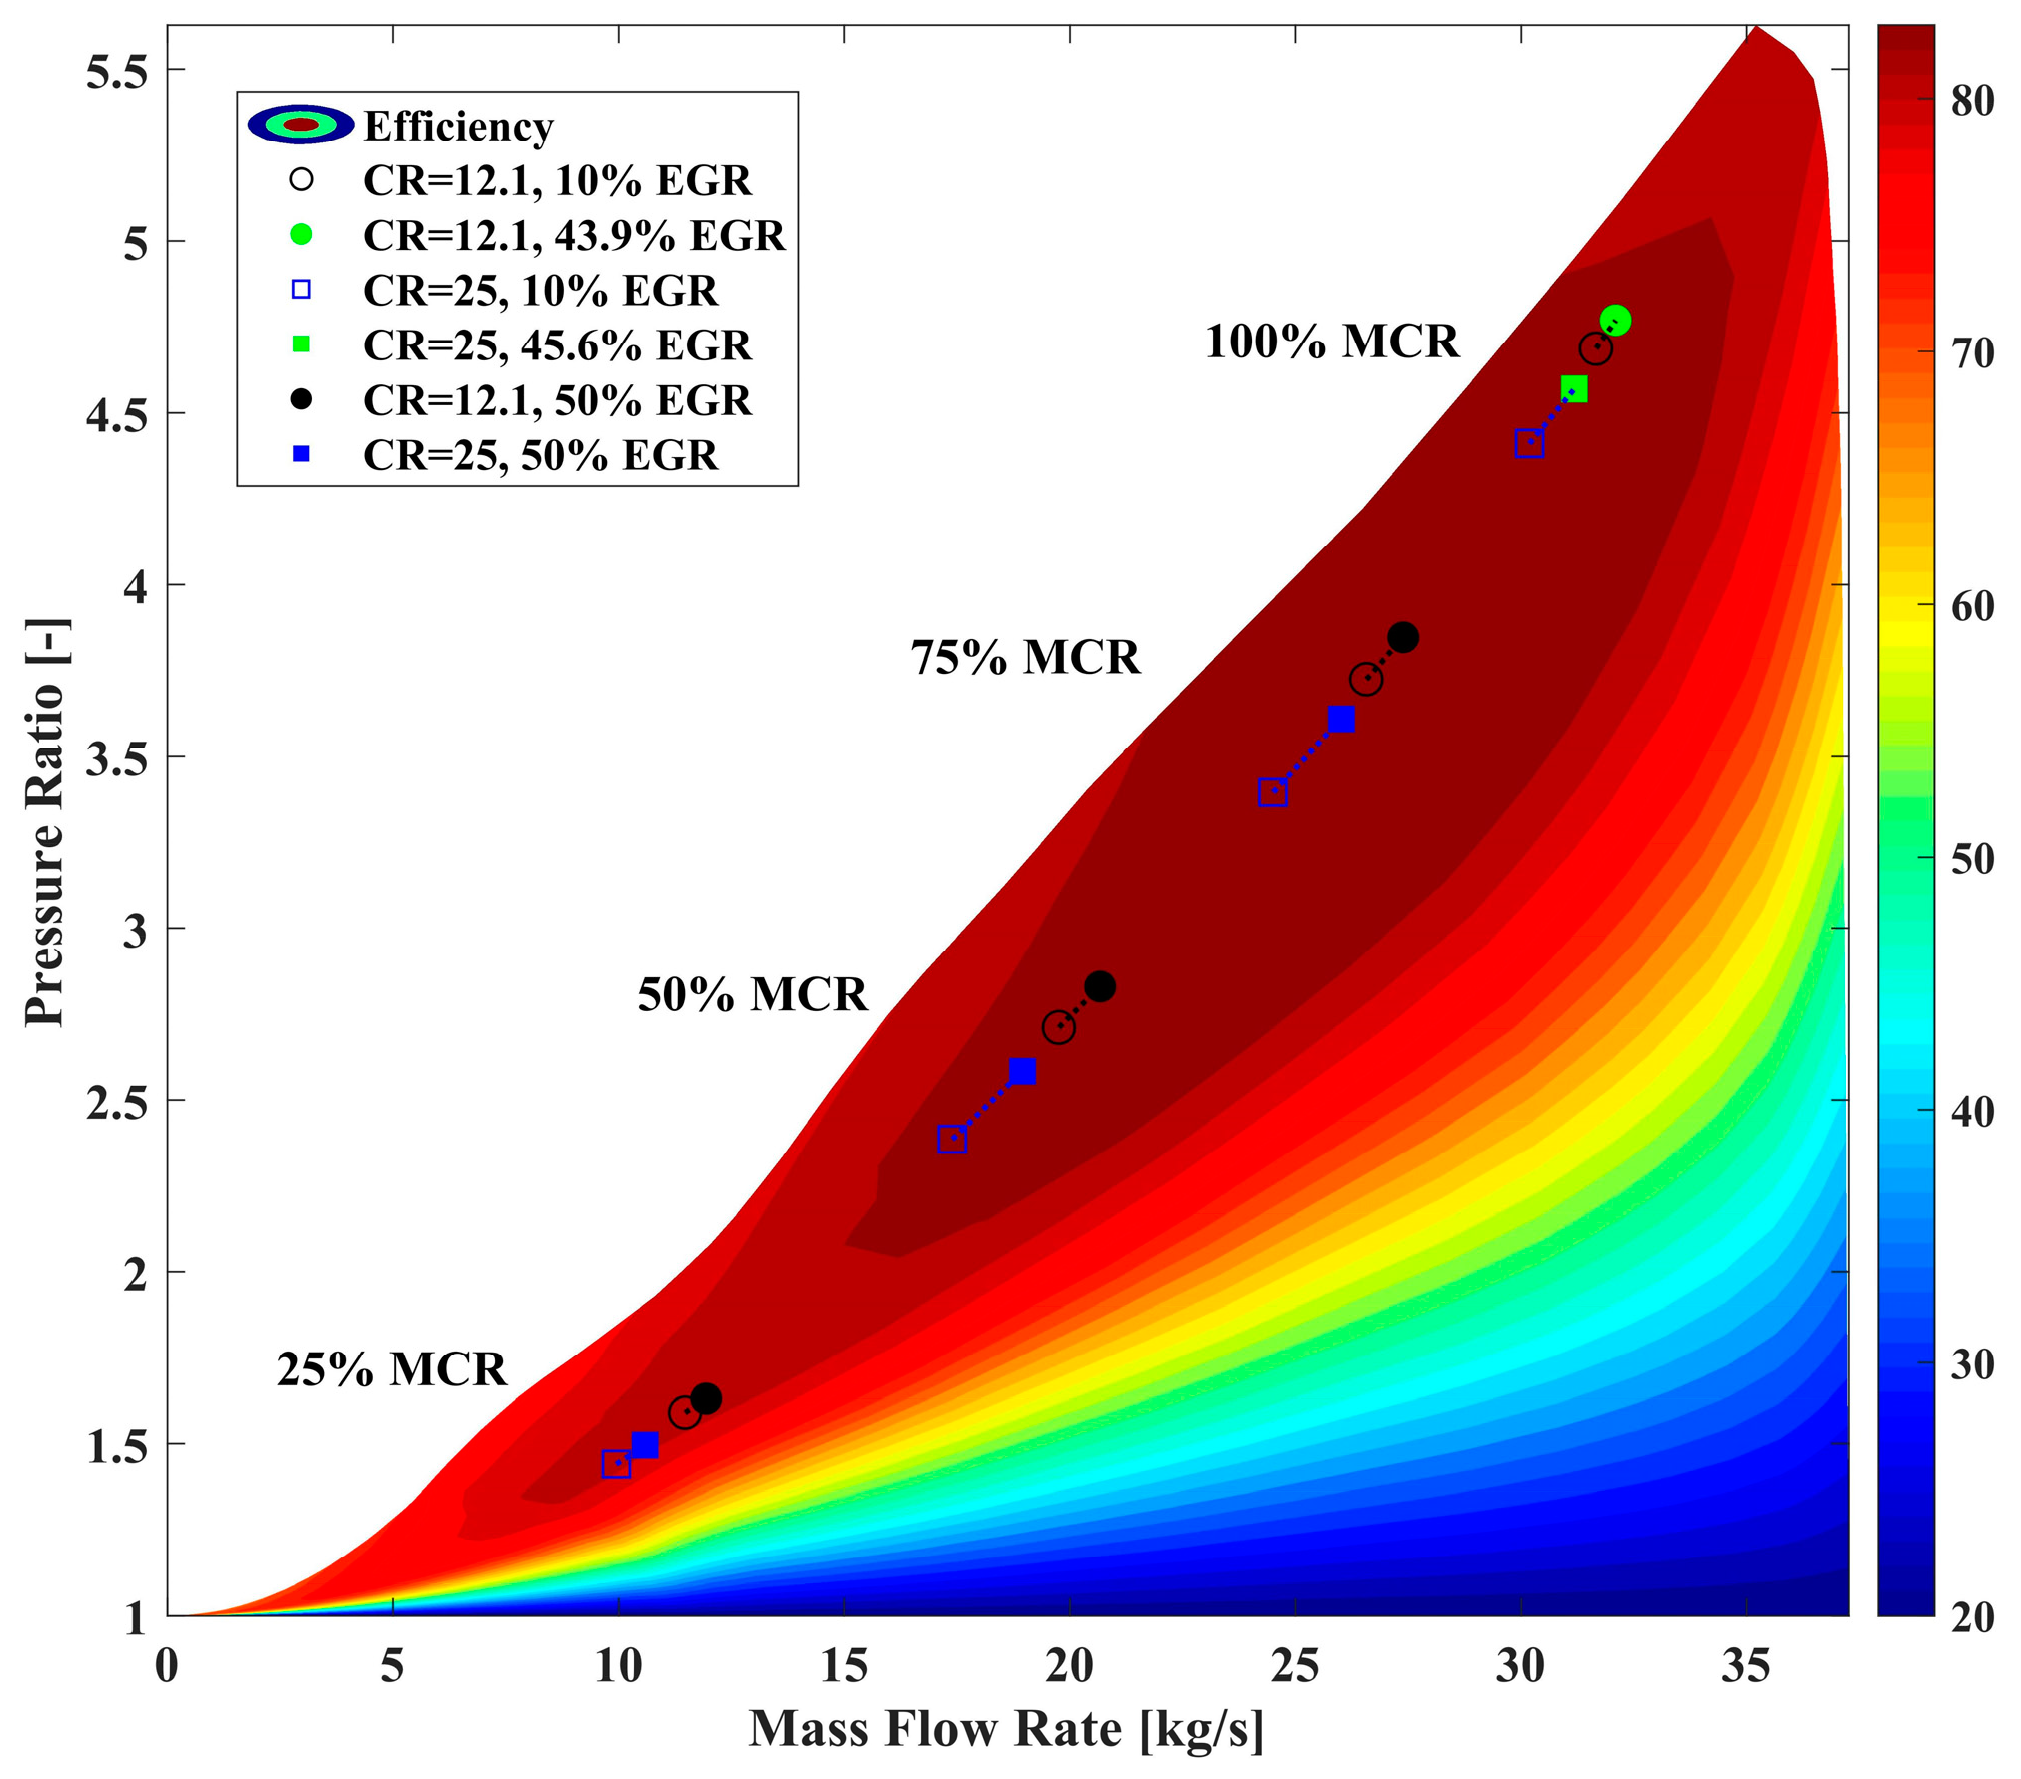
  • Although the two LP-EGR schemes exhibit completely opposite impacts on the turbocharging system, the compressor can achieve a satisfactory efficiency. At 25% MCR, the compressor efficiency remains around 80% and 81% for LP-EGR-BV and LP-EGR-BL schemes, respectively. At 50%, 75%, and 100% MCR, it stays approximately 84% for LP-EGR-BV, while it ranges between 83% and 85% for LP-EGR-BL. The surge margin is also maintained within the reasonable range. Furthermore, an adequate quantity of scavenging air can be provided to ensure that the injected fuel burns completely. This fully demonstrates that the existing turbocharging system can be well matched with LP-EGR and VCR, and there is no need for re-matching. This is crucial for the renovation and upgrading of existing engines.
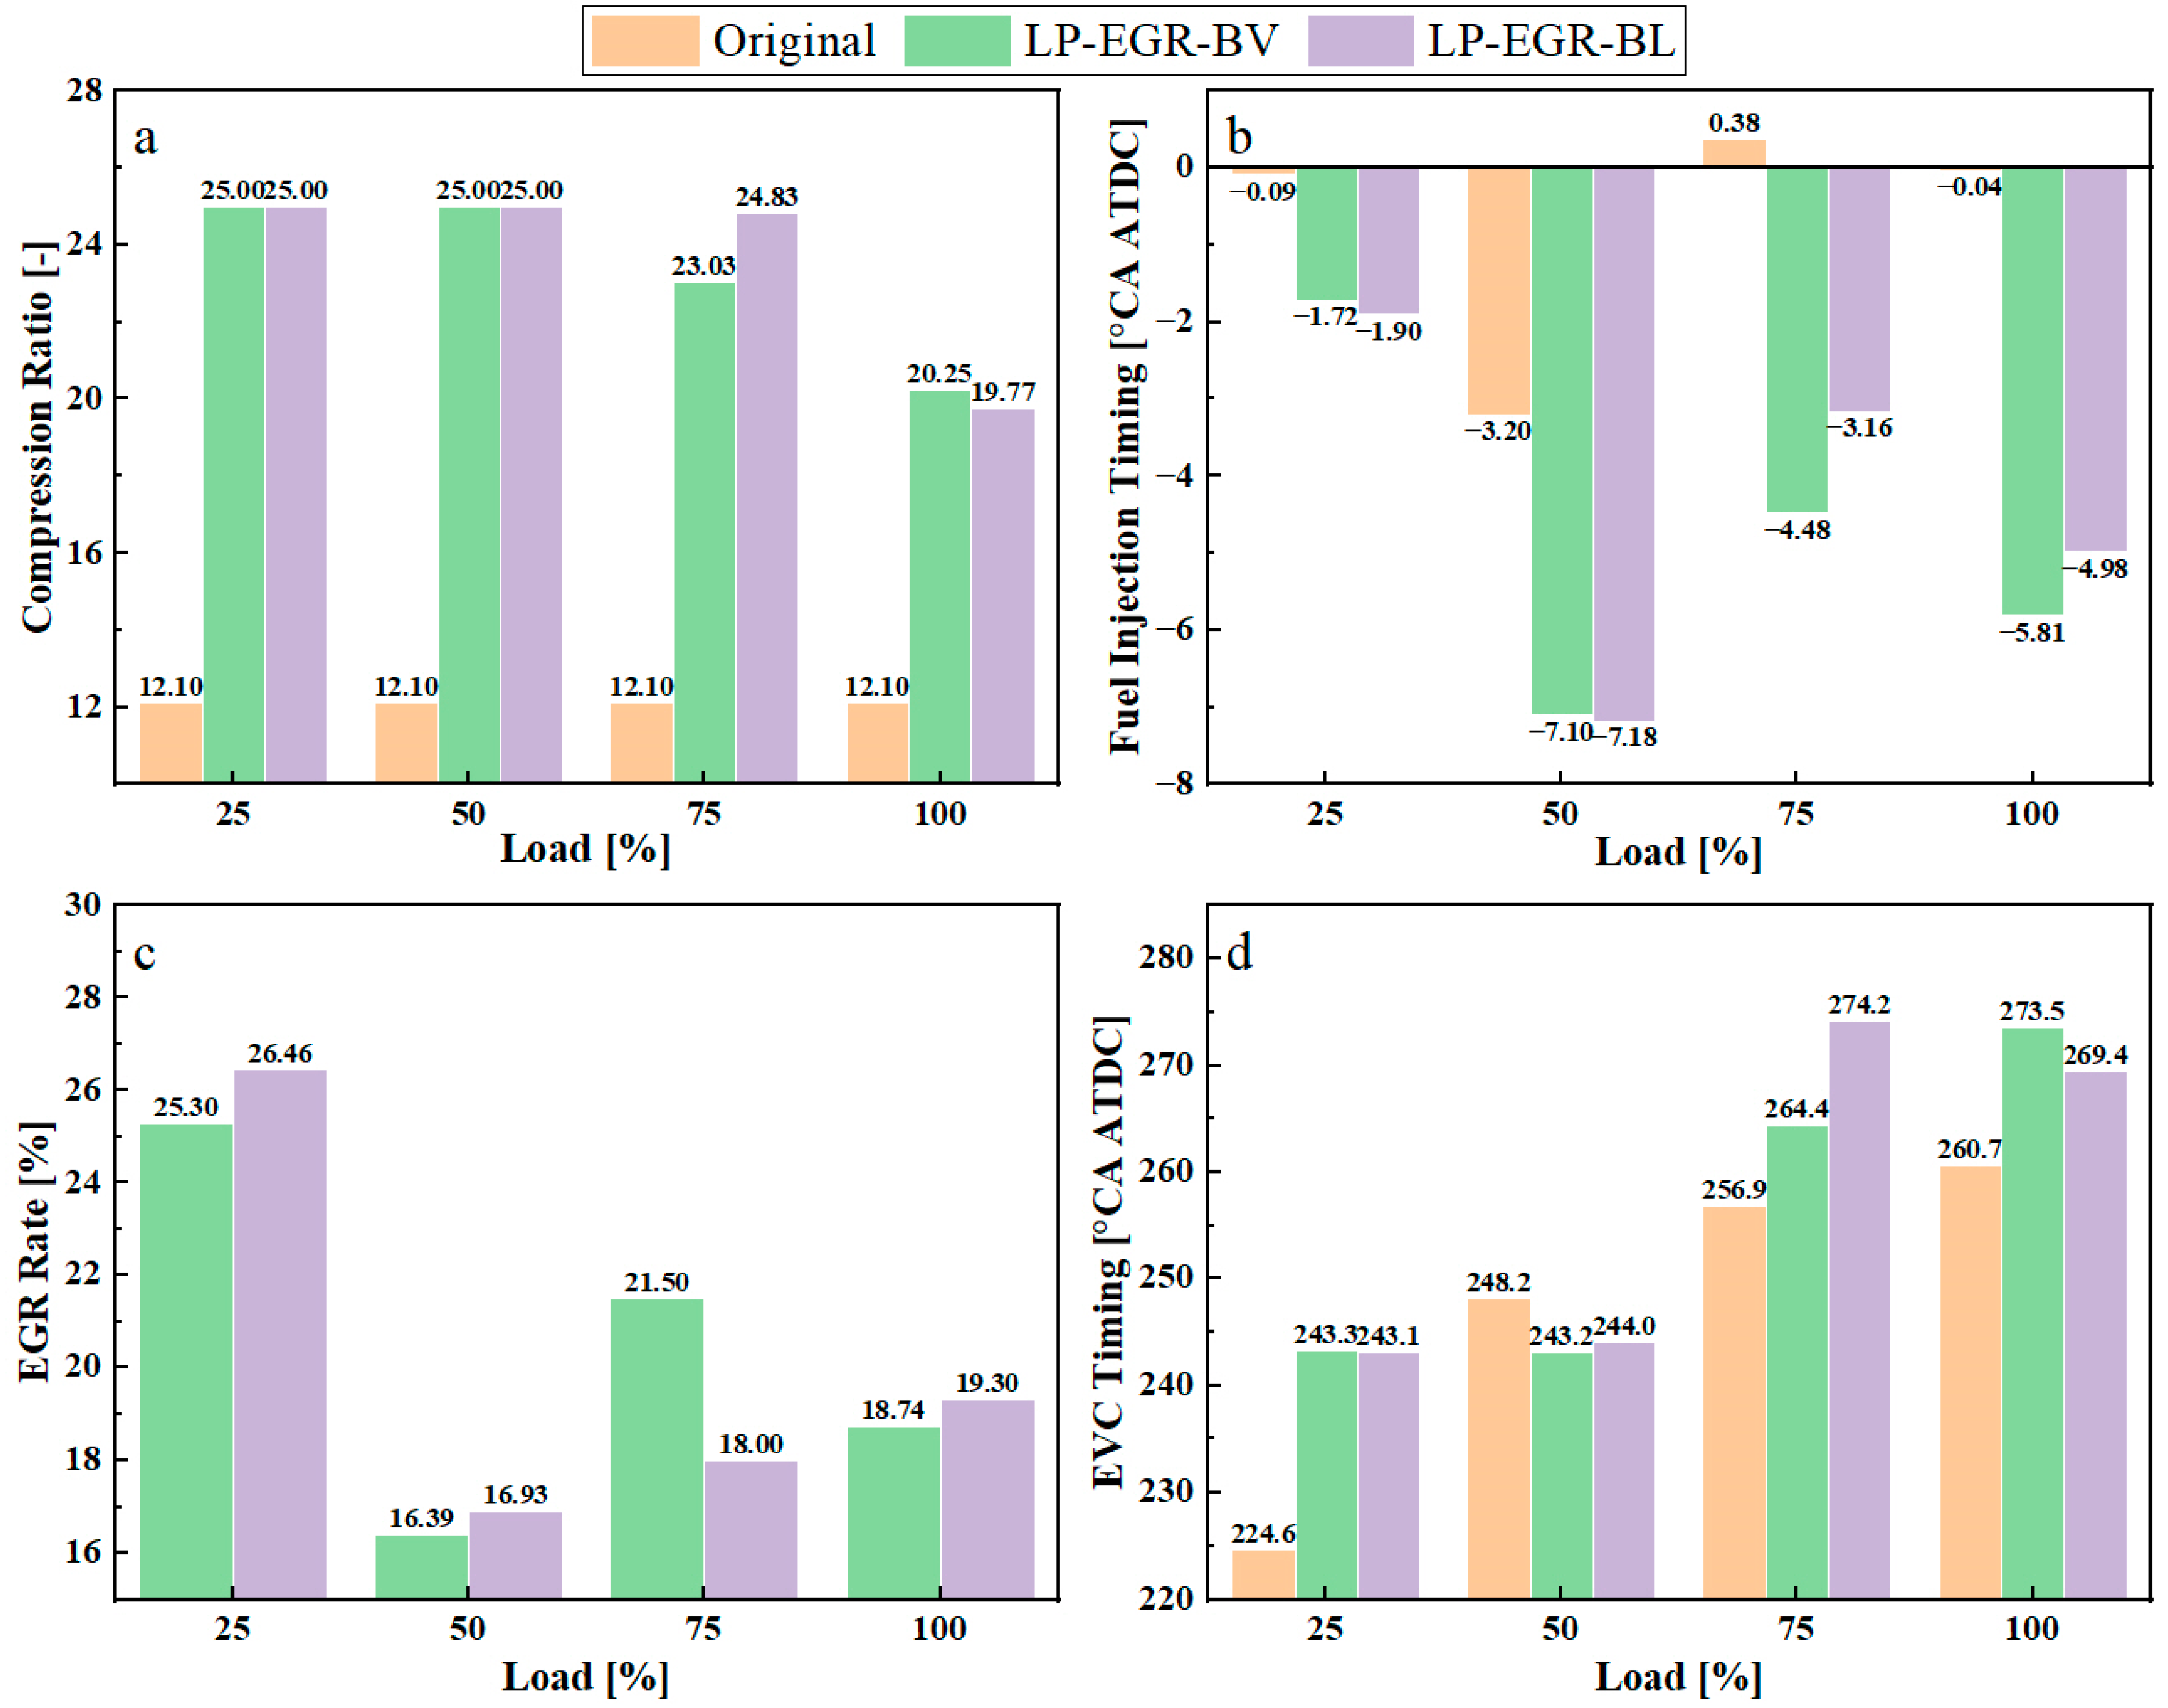
  • The optimization results reveal that the two LP-EGR schemes are capable of achieving a similar improvement in fuel economy. For the LP-EGR-BV scheme, compared with the baseline engine, the optimized BSFC decreases by 10.16%, 11.95%, 10.32%, and 9.68% at 25%, 50%, 75%, and 100% MCR, respectively, whereas, for the LP-EGR-BL scheme, the optimized BSFC decreases by 10.11%, 11.93%, 9.93%, and 9.58%, respectively. Furthermore, after optimization, the level of NOx emissions improves from only meeting the Tier II regulations (14.4 g/kW·h) to being able to meet the Tier III regulations (3.4 g/kW·h).
  • The results of the qualitative analysis indicate that the LP-EGR-BV scheme is superior to the LP-EGR-BL scheme in terms of structural complexity, initial cost, maintenance cost, installation space requirement, and power consumption. Only considering the above aspects, LP-EGR-BV is a more promising solution. However, a further in-depth study is needed to compare the two LP-EGR schemes in terms of dynamic performance, response speed, control accuracy, and reliability.
  • The technical route proposed in this study demonstrates considerable economic benefits. Even if it is assumed that the investigated dual-fuel engine operates in diesel mode for only one-fifth of its lifetime, the corresponding annual fuel consumption and fuel cost will be saved by approximately 240 tons and USD 100,000, respectively. This is very attractive to shipowners.
The findings of this research confirm that the combination of LP-EGR and VCR can effectively enhance the fuel economy of marine dual-fuel engines of low-pressure gas injection in diesel mode while complying with the Tier III regulations on NOx emissions. In addition, it is also expected that the technical route presented in this study provides valuable insights for optimizing the performance and emissions of automotive and large-scale power generation engines.
Although encouraging results were obtained in this study by numerical simulation, the adopted 0-D/1-D modeling approach still has limitations that cannot be ignored. First of all, it is difficult for the 0-D/1-D approach to accurately predict the combined impacts of EGR and VCR on the engine pollutant emissions including HC, CO, and PM, which, like NOx, are also important for evaluating the performance of the engine emission characteristics. In addition, limited by the predictive ability of the 0-D/1-D approach, it is impossible to comprehensively analyze the dynamic characteristics of the in-cylinder flow field. Secondly, when establishing the 0-D/1-D engine simulation model in GT-Power, in order to reduce the model complexity, necessary simplifications and assumptions are made. This is highly likely to result in deviations between the final optimization results and actual results, which cannot be overlooked.
After fully recognizing the limitations of the 0-D/1-D modeling approach adopted in this study, the direction of future research can also be preliminarily determined. Combined with the 0-D/1-D simulation results, CFD simulation research should be conducted to comprehensively evaluate the impacts of the combination of EGR and VCR on engine power, economic, and emission characteristics. At the same time, the relevant underlying mechanisms must be understood to fully exploit the potential of the combination of EGR and VCR in terms of energy conservation and emission reduction. If the experimental conditions permit, statistical analysis will be conducted to validate the significance of the improvements observed in this study. In addition, this study only focuses on the diesel mode of the investigated marine dual-fuel engine. In future research, the applicability of EGR combined with VCR in gas mode will be explored by extending the established 0-D/1-D engine model. This will require incorporating models of the pre-chamber, natural gas admission valve, pilot fuel injector, and adopting a predictive combustion model tailored for jet-ignition natural gas engines.

Author Contributions

Conceptualization, H.S.; methodology, H.S. and D.L.; software, H.S. and D.L.; validation, H.S.; formal analysis, H.S.; investigation, H.S.; data curation, H.S.; writing—original draft preparation, H.S.; writing—review and editing, D.L. All authors have read and agreed to the published version of the manuscript.

Funding

This research was funded by the National Key R&D Program of China (grant number 2022YFB4301403) and the Development of Liquid Cargo and Electromechanical Simulation Operation System for LNG Ship (grant number CBG3N21-3-3).

Institutional Review Board Statement

Not applicable.

Informed Consent Statement

Not applicable.

Data Availability Statement

The raw data supporting the conclusions of this article will be made available by the authors on request.

Conflicts of Interest

The authors declare no conflicts of interest.

Abbreviations

Abbreviations
0-DZero-dimensional
1-DOne-dimensional
ANOVAAnalysis of variance
ATDCAfter top dead center
BBDBox–Behnken Design
CACrank angle
CFDComputational fluid dynamics
CH4Methane
COCarbon monoxide
CO2Carbon dioxide
CRCompression ratio
ECAsEmission Control Areas
EGRExhaust gas recirculation
EVCExhaust valve closing
FITFuel injection timing
HCHydrocarbon
HP-EGRHigh-pressure exhaust gas recirculation
HRRHeat release rate
IMOInternational maritime organization
LP-EGRLow-pressure exhaust gas recirculation
LP-EGR-BLLow-pressure exhaust gas recirculation implemented with the blower
LP-EGR-BVLow-pressure exhaust gas recirculation implemented with the back-pressure valve
MCRMaximum continuous rating
NOxNitrogen oxides
NSGANon-dominated sequence genetic algorithm
PIProportional–integral
PMParticulate matter
PSOParticle swarm optimization
RSMResponse surface methodology
SCRSelective catalytic reduction
SOxSulfur oxides
VCRVariable compression ratio
Nomenclature
Variables related to the optimization process
BSFCBrake specific fuel consumption, g/kW·h
bsNOxBrake specific NOx emissions, g/kW·h
ppeakIn-cylinder peak pressure, bar
SMSurge margin, %
XVector of optimization variables
αEVCExhaust valve closing timing, °CA ATDC
αinjFuel injection timing, °CA ATDC
γCompression ratio
ϕEGREGR rate, %
Variables related to the combustion model
CdfDiffusion combustion rate multiplier
CentEntrainment rate multiplier
CignIgnition delay multiplier
CpmPremixed combustion rate multiplier
kTurbulent kinetic energy, m2/s2
mdfAir–fuel mixture mass available during diffusion combustion stage, kg
mentEntrained mass, kg
miniInjected fuel mass, kg
mpmPremixed combustion mass, kg
[O2]Oxygen concentration, mol/m3
SFuel spray tip length, m
tTime, s
tignIgnition time, s
TPulse temperature, K
tbBreakup time, s
uVelocity at spray tip, m/s
uinjVelocity at injector nozzle, m/s
VcylCylinder volume, m3
τignIgnition delay, s
ρPulse density, kg/m3
Variables related to the model of turbocharging and EGR system
BSFCengBrake specific fuel consumption of the engine, g/kW·h
BSFCgenBrake specific fuel consumption of the generator set, g/kW·h
BSFCLP_EGR_BLBrake specific fuel consumption of the engine with the LP-EGR-BL scheme, g/kW·h
gengInstantaneous fueling rate of the engine, g/h
ggenInstantaneous fueling rate of the generator set for driving the EGR blower, g/h
m ˙ c Compressor mass flow rate, kg/s
m ˙ c , s g Compressor mass flow rate at the surge line, kg/s
m ˙ E G R Mass flow rate of EGR gas, kg/s
PengPower of the engine, kW
PblPower of the EGR blower, kW
ηblEfficiency of the EGR blower, %
ηgenEfficiency used to account for the power losses during the power generation and distribution processes, %

References

  1. Ni, P.; Wang, X.; Li, H. A Review on Regulations, Current Status, Effects and Reduction Strategies of Emissions for Marine Diesel Engines. Fuel 2020, 279, 118477. [Google Scholar] [CrossRef]
  2. Raptotasios, S.I.; Sakellaridis, N.F.; Papagiannakis, R.G.; Hountalas, D.T. Application of a Multi-zone Combustion Model to Investigate the NOx Reduction Potential of Two-stroke Marine Diesel Engines Using EGR. Appl. Energy 2015, 157, 814–823. [Google Scholar] [CrossRef]
  3. Nitrogen Oxides (NOx)—Regulation 13. Available online: https://www.imo.org/en/OurWork/Environment/Pages/Nitrogen-oxides-(NOx)-%E2%80%93-Regulation-13.aspx (accessed on 5 March 2025).
  4. Tier III NOx. Available online: https://wingd.com/products-solutions/emissions-efficiency/tier-iii-nox (accessed on 5 March 2025).
  5. IMO 2020—Cutting Sulphur Oxide Emissions. Available online: https://www.imo.org/en/MediaCentre/HotTopics/Pages/Sulphur-2020.aspx (accessed on 5 March 2025).
  6. Deng, J.; Wang, X.; Wei, Z.; Wang, L.; Wang, C.; Chen, Z. A Review of NOx and SOx Emission Reduction Technologies for Marine Diesel Engines and the Potential Evaluation of Liquefied Natural Gas Fuelled Vessels. Sci. Total Environ. 2021, 766, 144319. [Google Scholar] [CrossRef] [PubMed]
  7. Stoumpos, S.; Theotokatos, G. Multiobjective Optimisation of a Marine Dual Fuel Engine Equipped with Exhaust Gas Recirculation and Air Bypass Systems. Energies 2020, 13, 5021. [Google Scholar] [CrossRef]
  8. Hiraoka, N.; Ueda, T.; Nakagawa, T.; Ito, K. Development of Low Pressure Exhaust Gas Recieculation System for Mitsubishi UE Diesel Engine. In Proceedings of the 28th CIMAC World Congress, Helsinki, Finland, 6–10 June 2016. [Google Scholar]
  9. Kaltoft, J.; Preem, M. Development of Integrated EGR System for Two-stroke Diesel Engines. In Proceedings of the 27th CIMAC World Congress, Shanghai, China, 13–16 May 2013. [Google Scholar]
  10. Nakagawa, T.; Ito, K.; Edo, K.; Miyanagi, A. The Latest Technologies of NOx Emission Control for UE Engines. In Proceedings of the 29th CIMAC World Congress, Vancouver, BC, Canada, 10–14 June 2019. [Google Scholar]
  11. Alegret, G.; Llamas, X.; Vejlgaard-Laursen, M.; Eriksson, L. Modeling of a Large Marine Two-stroke Diesel Engine with Cylinder Bypass Valve and EGR system. In Proceedings of the 10th Conference on Manoeuvring and Control of Marine Craft, Copenhagen, Denmark, 24–26 August 2015. [Google Scholar] [CrossRef]
  12. Lu, D.; Theotokatos, G.; Zhang, J.; Zeng, H.; Cui, K. Parametric Investigation of a Large Marine Two-stroke Diesel Engine Equipped with Exhaust Gas Recirculation and Turbocharger Cut Out Systems. Appl. Therm. Eng. 2022, 200, 117654. [Google Scholar] [CrossRef]
  13. Wang, D.; Shi, L.; Zhu, S.; Liu, B.; Qian, Y.; Deng, K. Numerical and Thermodynamic Study on Effects of High and Low Pressure Exhaust Gas Recirculation on Turbocharged Marine Low-speed Engine. Appl. Energy 2020, 261, 114346. [Google Scholar] [CrossRef]
  14. Tang, X.; Wang, P.; Zhang, Z.; Zhang, F.; Shi, L.; Deng, K. Collaborative Optimization of Exhaust Gas Recirculation and Miller Cycle of Two-stage Turbocharged Marine Diesel Engines based on Particle Swarm Optimization. J. Cent. South Univ. 2022, 29, 2142–2156. [Google Scholar] [CrossRef]
  15. Sun, X.; Liang, X.; Shu, G.; Lin, J.; Wang, Y.; Wang, Y. Numerical Investigations of Two-stroke Marine Diesel Engine Emissions using Exhaust Gas Recirculation at Different Injection Time. Ocean Eng. 2017, 144, 90–97. [Google Scholar] [CrossRef]
  16. Higashida, M.; Nakamura, T.; Onishi, I.; Yoshizawa, K.; Takata, H.; Hosono, T. Newly Developed Combined EGR & WEF System to Comply with IMO NOx Regulations Tier 3 for Two-stroke Diesel Engine. In Proceedings of the 27th CIMAC World Congress, Shanghai, China, 13–16 May 2013. [Google Scholar]
  17. Qu, R.; Zeng, H.; Ye, K.; Jiang, K.; Lu, D. Parameter Optimisation of Marine Four-stroke Engine EGR Systems using RSM and NSGA-III. Ships Offshore Struct. 2024. [Google Scholar] [CrossRef]
  18. VC-Turbo—The World’s First Production-Ready Variable Compression Ratio Engine. Available online: https://global.nissannews.com/en/releases/vc-turbo-the-worlds-first-production-ready-variable-compression-ratio-engine?lang=en-US (accessed on 6 April 2025).
  19. Rufino, C.H.; Ferreira, J.V. Study on the Efficiency of a Spark-ignition Variable Displacement and Compression Ratio Engine. Int. J. Engine Res. 2020, 22, 2607–2621. [Google Scholar] [CrossRef]
  20. Santhosh, M.; Padmanaban, K.P. Experimental Studies on Variable Compression Ratio Engine Fuelled with Cottonseed Oil Methyl Ester Biodiesel. Int. J. Oil Gas Coal Technol. 2016, 12, 81–104. [Google Scholar] [CrossRef]
  21. Ashkezari, A.Z. Numerical Analysis of Performance and Emissions Behaviour of a Bi-fuel Engine with Compressed Natural Gas Enriched with Hydrogen using Variable Compression Ratio Strategy. Int. J. Hydrogen Energy 2022, 47, 10762–10776. [Google Scholar] [CrossRef]
  22. Ananthakumar, S.; Jayabal, S.; Thirumal, P. Investigation on Performance, Emission and Combustion Characteristics of Variable Compression Engine Fuelled with Diesel, Waste Plastics Oil Blends. J. Braz. Soc. Mech. Sci. Eng. 2016, 39, 19–28. [Google Scholar] [CrossRef]
  23. Park, C.; Jang, I.; Kim, M.; Park, G.; Kim, Y. Effect of High Compression Ratio on Thermal Efficiency and Unburned Ammonia Emissions of a Dual-fuel High-pressure Direct Injection Marine Ammonia Engine. Appl. Therm. Eng. 2025, 261, 125183. [Google Scholar] [CrossRef]
  24. Wang, Z.; Jie, Z.; Liu, X. Combustion and Emission Characteristics of Methanol-Diesel Dual Fuel Engine at Different Altitudes. J. Mar. Sci. Eng. 2024, 12, 2210. [Google Scholar] [CrossRef]
  25. Xiong, Q.; Wan, Z.; Liu, L.; Zhao, B. Numerical Analysis of Combustion Process and Pressure Oscillation Phenomena in Low-pressure Injection Natural Gas/Diesel Dual Fuel Low Speed Marine Engine. Therm. Sci. Eng. Prog. 2023, 42, 101913. [Google Scholar] [CrossRef]
  26. WinGD Enhances Fuel-Flexible Efficiency with Variable Compression Ratio. Available online: https://wingd.com/news-media/news/wingd-enhances-fuel-flexible-efficiency-with-variable-compression-ratio (accessed on 6 April 2025).
  27. Zamboni, G.; Capobianco, M. Experimental Study on the Effects of HP and LP EGR in an Automotive Turbocharged Diesel Engine. Appl. Energy 2012, 94, 117–128. [Google Scholar] [CrossRef]
  28. Shen, K.; Li, F.; Zhang, Z.; Sun, Y.; Yin, C. Effects of LP and HP Cooled EGR on Performance and Emissions in Turbocharged GDI Engine. Appl. Therm. Eng. 2017, 125, 746–755. [Google Scholar] [CrossRef]
  29. Gürbüz, H.; Köse, Ş. A Theoretical Investigation on the Performance and Combustion Parameters in an Spark Ignition Engine Fueled with Different Shale Gas Mixtures. J. Eng. Gas. Turbines Power-Trans. ASME 2021, 143, 061015. [Google Scholar] [CrossRef]
  30. Tadros, M.; Ventura, M.; Soares, C.G. Optimization Procedure to Minimize Fuel Consumption of a Four-stroke Marine Turbocharged Diesel Engine. Energy 2019, 168, 897–908. [Google Scholar] [CrossRef]
  31. Alahmer, A.; Rezk, H.; Aladayleh, W.; Mostafa, A.O.; Abu-Zaid, M.; Alahmer, H.; Gomaa, M.R.; Alhussan, A.A.; Ghoniem, R.M. Modeling and Optimization of a Compression Ignition Engine Fueled with Biodiesel Blends for Performance Improvement. Mathematics 2022, 10, 420. [Google Scholar] [CrossRef]
  32. Zhang, Z.; Dong, R.; Tan, D.; Zhang, B. Multi-objective Optimization of Performance Characteristics of Diesel Particulate Filter for a Diesel Engine by RSM-MOPSO During Soot Loading. Process Saf. Environ. Protect. 2023, 177, 530–545. [Google Scholar] [CrossRef]
  33. Jin, W.; Gan, H.; Cong, Y.; Li, G. Performance Optimization and Knock Investigation on Marine Two-stroke Pre-Mixed Dual-fuel Engine Based on RSM and MOPSO. J. Mar. Sci. Eng. 2022, 10, 1409. [Google Scholar] [CrossRef]
  34. Gamma Technologies. GT-SUITE Flow Theory Manual; Gamma Technologies: Westmont, IL, USA, 2020. [Google Scholar]
  35. Gamma Technologies. GT-SUITE Engine Performance Application Manual; Gamma Technologies: Westmont, IL, USA, 2020. [Google Scholar]
  36. ISO 15550:2016; International Combustion Engines—Determination and Method for the Measurement of Engine Power—General Requirements. ISO: Geneva, Switzerland, 2016.
  37. Figari, M.; Theotokatos, G.; Coraddu, A.; Stoumpos, S.; Mondella, T. Parametric Investigation and Optimal Selection of the Hybrid Turbocharger System for a Large Marine Four-stroke Dual-fuel Engine. Appl. Therm. Eng. 2022, 208, 117991. [Google Scholar] [CrossRef]
  38. Rakopoulos, C.D.; Rakopoulos, D.C.; Mavropoulos, G.C.; Kosmadakis, G.M. Investigating the EGR Rate and Temperature Impact on Diesel Engine Combustion and Emissions Under various Injection Timings and Loads by Comprehensive Two-zone Modeling. Energy 2018, 157, 990–1014. [Google Scholar] [CrossRef]
  39. Wang, Z.; Zhou, S.; Feng, Y.; Zhu, Z. Research of NOx Reduction on a Low-speed Two-stroke Marine Diesel Engine by Using EGR (Exhaust Gas Recirculation)-CB (Cylinder Bypass) and EGB (Exhaust Gas Bypass). Int. J. Hydrogen Energy 2017, 42, 19337–19345. [Google Scholar] [CrossRef]
  40. Hountalas, D.T.; Zannis, T.C.; Mavropoulos, G.C. Potential Benefits in Heavy Duty Diesel Engine Performance and Emissions from the Use of Variable Compression Ratio; SAE Technical Paper; SAE: Warrendale, PA, USA, 2006. [Google Scholar] [CrossRef]
  41. Sapra, H.; Godjevac, M.; Visser, K.; Stapersma, D.; Dijkstra, C. Experimental and Simulation-based Investigations of Marine Diesel Engine Performance Against Static Back Pressure. Appl. Energy 2017, 204, 78–92. [Google Scholar] [CrossRef]
  42. Tang, X.; Wang, P.; Zhang, Z.; Zhang, F.; Shi, L.; Deng, K. Effects of High-pressure and Donor-cylinder Exhaust Gas Recirculation on Fuel Economy and Emissions of Marine Diesel Engines. Fuel 2022, 309, 122226. [Google Scholar] [CrossRef]
  43. Guan, C.; Theotokatos, G.; Zhou, P.; Chen, H. Computational Investigation of a Large Containership Propulsion Engine Operation at Slow Steaming Conditions. Appl. Energy 2014, 130, 370–383. [Google Scholar] [CrossRef]
  44. Tang, Y.; Zhang, J.; Gan, H.; Jia, B.; Xia, Y. Development of a Real-time Two-stroke Diesel Engine Model with In-cylinder Pressure Prediction Capability. Appl. Energy 2017, 194, 55–70. [Google Scholar] [CrossRef]
  45. Yu, X.; Zhu, L.; Wang, Y.; Filev, D.; Yao, X. Internal Combustion Engine Calibration using Optimization Algorithms. Appl. Energy 2022, 305, 117894. [Google Scholar] [CrossRef]
  46. Jung, J.; Song, S.; Hur, K.B. Numerical Study on the Effects of Intake Valve Timing on Performance of a Natural Gas-Diesel Dual-fuel Engine and Multi-objective Pareto Optimization. Appl. Therm. Eng. 2017, 121, 604–616. [Google Scholar] [CrossRef]
  47. Pratap, B.; Goyal, R.; Deo, M.; Chaudhary, N.; Chauhan, P.; Chauhan, A. Modeling and Experimental Study on Performance and Emission Characteristics of Citrullus Colocynthis (Thumba Oil) Diesel Fuelled Operated Variable Compression Ratio Diesel Engine. Energy 2019, 182, 349–368. [Google Scholar] [CrossRef]
  48. Ahmad, A.; Yadav, A.K.; Hasan, S. Enhancing Efficiency and Environmental Impacts of a Nano-enhanced Oleander Biodiesel-biohydrogen Dual Fuel Engine Equipped with EGR, Through Operational Parameter Optimization Using RSM-MOGA Technique. Int. J. Hydrogen Energy 2024, 78, 1157–1172. [Google Scholar] [CrossRef]
Figure 1. Layouts of LP-EGR-BV and LP-EGR-BL schemes (SOV: shut-off valve, WMC: water mist catcher).
Jmse 13 00765 g001
Figure 2. Layout of the baseline engine simulation model.
Jmse 13 00765 g002
Figure 3. Comparison between the simulation and measurement results.
Jmse 13 00765 g003
Figure 4. Relative errors of the simulation results with respect to the measurement results (neng: engine speed, Pb: brake power, BSFC: brake specific fuel consumption, ppeak: in-cylinder peak pressure, pcomp: in-cylinder compression pressure, nTC: turbocharger speed, ps: scavenging pressure, pe: exhasut pressure, Ts: scavenging temperature).
Jmse 13 00765 g004
Figure 5. Simulated in-cylinder pressure curves at various load points.
Jmse 13 00765 g005
Figure 6. Layout of the extended engine simulation model.
Jmse 13 00765 g006
Figure 7. Effects of EGR and CR on combustion process at 75% MCR: (a) In-cylinder pressure, (b) Apparent gross heat release rate (LP-EGR-BV scheme).
Jmse 13 00765 g007
Figure 8. Turbine performance map.
Jmse 13 00765 g008
Figure 9. Effects of EGR and CR on turbine inlet pressure at 75% MCR (LP-EGR-BV scheme).
Jmse 13 00765 g009
Figure 10. Effects of EGR and CR on the operation of turbine at 75% MCR: (a) Turbine expansion ratio, (b) Turbine mass flow rate, (c) Temperature drop across the turbine, (d) Turbine Power (LP-EGR-BV scheme).
Jmse 13 00765 g010
Figure 11. Effects of EGR and CR on the operation of compressor (LP-EGR-BV scheme).
Jmse 13 00765 g011
Figure 12. Effects of EGR and CR on BSFC and NOx emissions: (a) 25% MCR, (b) 50% MCR, (c) 75% MCR, (d) 100% MCR (LP-EGR-BV scheme).
Jmse 13 00765 g012
Figure 13. Effects of EGR and CR on maximum burned zone temperature at 75% MCR (LP-EGR-BV scheme).
Jmse 13 00765 g013
Figure 14. Effects of EGR and CR on air–fuel equivalence ratio at 75% MCR (LP-EGR-BV scheme).
Jmse 13 00765 g014
Figure 15. EGR rate required for compliance with Tier III regulation with CRs of 12.1 and 25 (LP-EGR-BV scheme).
Jmse 13 00765 g015
Figure 16. BSFC when complying with Tier III regulation with CRs of 12.1 and 25 and relative change between the two cases (LP-EGR-BV scheme).
Jmse 13 00765 g016
Figure 17. Comparison of the influences of EGR and CR on combustion process between LP-EGR-BV and LP-EGR-BL: (a) In-cylinder pressure, (b) Apparent gross heat release rate.
Jmse 13 00765 g017
Figure 18. Effects of EGR and CR on the operation of compressor (LP-EGR-BL scheme).
Jmse 13 00765 g018
Figure 19. Effects of EGR and CR on the operation of turbine at 75% MCR: (a) Turbine inlet temperature, (b) Turbine inlet pressure, (c) Turbine mass flow rate, (d) Turbine power (LP-EGR-BL scheme).
Jmse 13 00765 g019
Figure 20. Effects of EGR and CR on BSFC and NOx emissions: (a) 25% MCR, (b) 50% MCR, (c) 75% MCR, (d) 100% MCR (LP-EGR-BL scheme).
Jmse 13 00765 g020
Figure 21. EGR rate required for compliance with Tier III regulation with CRs of 12.1 and 25 (LP-EGR-BL scheme).
Jmse 13 00765 g021
Figure 22. BSFC when complying with Tier III regulation with CRs of 12.1 and 25 (LP-EGR-BL scheme).
Jmse 13 00765 g022
Figure 23. Flow chart of the optimization program.
Jmse 13 00765 g023
Figure 24. Optimization results of the engine settings: (a) Compression ratio, (b) Fuel injection timing, (c) EGR rate, (d) EVC timing.
Jmse 13 00765 g024
Figure 25. Optimization results of the engine BSFC and brake efficiency: (a) BSFC, (b) Brake efficiency.
Jmse 13 00765 g025
Figure 26. Operating parameters of the EGR blower (LP-EGR-BL scheme).
Jmse 13 00765 g026
Table 1. Engine’s main specifications.
ParameterUnitValue
Cylinder Number-6
Cylinder Boremm720
Strokemm3086
Speed at MCRRPM69.1
Power at MCRkW13,265
Mean Effective Pressure at MCRbar15.3
Firing order-1-6-2-4-3-5
Table 2. Results of regression analysis and ANOVA (LP-EGR-BV scheme).
R2Adjusted R2Predicted R2F-Valuep-Value
25% MCR
BSFC0.99880.99760.9930821.26<0.0001
bsNOx0.99540.99090.9736217.59<0.0001
Peak Pressure0.99980.99960.99884809.81<0.0001
50% MCR
BSFC0.99980.99960.99884730.26<0.0001
bsNOx0.97690.95380.866942.26<0.0001
Peak Pressure0.99970.99930.99802941.22<0.0001
75% MCR
BSFC0.99950.99900.99711957.28<0.0001
bsNOx0.98780.97560.929780.93<0.0001
Peak Pressure0.99900.99800.99421000.22<0.0001
100% MCR
BSFC0.99870.99730.9923750.07<0.0001
bsNOx0.98480.96970.912764.95<0.0001
Peak Pressure0.99520.99040.9725208.26<0.0001
Surge Margin0.99920.99830.99521202.13<0.0001
Table 3. Results of regression analysis and ANOVA (LP-EGR-BL scheme).
R2Adjusted R2Predicted R2F-Valuep-Value
25% MCR
BSFC0.99840.99670.9906609.65<0.0001
bsNOx0.99600.99200.9768247.48<0.0001
Peak Pressure0.99980.99960.99884935.51<0.0001
50% MCR
BSFC0.99950.99900.99711979.95<0.0001
bsNOx0.99260.98520.9574134.17<0.0001
Peak Pressure0.99970.99950.99853821.68<0.0001
75% MCR
BSFC0.97850.95690.876045.44<0.0001
bsNOx0.99630.99250.9785267.19<0.0001
Peak Pressure0.98020.96050.886149.58<0.0001
100% MCR
BSFC0.99730.99450.9842364.41<0.0001
bsNOx0.99550.99100.9740220.34<0.0001
Peak Pressure0.99560.99130.9748227.88<0.0001
Surge Margin0.99910.99830.99501160.54<0.0001
Table 4. Validation results of the optimization results.
LP-EGR-BV Scheme
25% MCR50% MCR75% MCR100% MCR
BSFC0.04−0.18−0.26−0.41
bsNOx−2.99−5.91−1.813.15
Peak Pressure0.37−0.840.25−0.76
Surge Margin---−0.91
LP-EGR-BL Scheme
25% MCR50% MCR75% MCR100% MCR
BSFC0.07−0.16−0.59−0.16
bsNOx1.02−1.60−12.97−3.39
Peak Pressure0.10−0.613.100.14
Surge Margin---−0.47
Table 5. Optimization results of engine operating parameters.
SchemeBrake-Specific NOx Emissions [g/kW·h]In-Cylinder Peak Pressure [bar]Surge Margin [%]Turbocharger Speed [RPM]Air–Fuel Equivalence Ratio [-]Turbine Inlet Temperature [K]
25% MCR
LP-EGR-BV3.40120.170.761032.43544
LP-EGR-BL3.37121.872.061782.44539
50% MCR
LP-EGR-BV3.37179.431.891182.27615
LP-EGR-BL3.32179.932.191682.27611
75% MCR
LP-EGR-BV3.38179.431.411,5631.98641
LP-EGR-BL3.39174.431.811,7061.93635
100% MCR
LP-EGR-BV3.29179.920.013,4161.78706
LP-EGR-BL3.38179.720.013,4981.87702
Table 6. Comparison between two LP-EGR schemes.
SchemeStructural ComplexityInitial CostMaintenance CostInstallation SpacePower ConsumptionFuel Economy
LP-EGR-BLComplexHighHighLargeYesSimilar
LP-EGR-BVSimpleLowLowSmallNo
Table 7. Estimated annual fuel consumption and fuel cost.
Engine TypeAnnual Fuel Consumption [t]Annual Fuel Consumption Reduction [t]Annual Fuel Cost [USD]Annual Fuel Cost Reduction [USD]
Original engine11,871.59-5,104,784.76-
LP-EGR-BV10,648.451223.144,578,832.97525,951.79
LP-EGR-BL10,676.851194.744,591,046.70513,738.06
Disclaimer/Publisher’s Note: The statements, opinions and data contained in all publications are solely those of the individual author(s) and contributor(s) and not of MDPI and/or the editor(s). MDPI and/or the editor(s) disclaim responsibility for any injury to people or property resulting from any ideas, methods, instructions or products referred to in the content.

