Article

Detailed Investigation of Cobalt-Rich Crusts in Complex Seamount Terrains Using the Haima ROV: Integrating Optical Imaging, Sampling, and Acoustic Methods

1
Key Laboratory of Marine Mineral Resources, Ministry of Natural Resources, Guangzhou Marine Geological Survey, China Geological Survey, Guangzhou 511458, China
2
National Engineering Research Center for Gas Hydrate Exploration and Development, Guangzhou 511458, China
3
Southern Marine Science and Engineering Guangdong Laboratory (Guangzhou), Guangzhou 511458, China
*
Author to whom correspondence should be addressed.
J. Mar. Sci. Eng. 2025, 13(4), 702; https://doi.org/10.3390/jmse13040702
Submission received: 12 March 2025 / Revised: 28 March 2025 / Accepted: 30 March 2025 / Published: 1 April 2025

Abstract

:
The remotely operated vehicle (ROV), a vital deep-sea platform, offers key advantages, including operational duration via continuous umbilical power, high task adaptability, and zero human risk. It has become indispensable for deep-sea scientific research and marine engineering. To enhance surveys of cobalt-rich crusts (CRCs) on complex seamount terrains, the 4500-m-class Haima ROV integrates advanced payloads, such as underwater positioning systems, multi-angle cameras, multi-functional manipulators, subsea shallow drilling systems, sediment samplers, and acoustic crust thickness gauges. Coordinated control between deck monitoring and subsea units enables stable multi-task execution within single dives, significantly improving operational efficiency. Survey results from Caiwei Guyot reveal the following: (1) ROV-collected data were highly reliable, with high-definition video mapping CRCs distribution across varied terrains. Captured crust-bearing rocks weighed up to 78 kg, drilled cores reached 110 cm, and acoustic thickness measurements had a 1–2 cm margin of error compared to in situ cores; (2) Video and cores analysis showed summit platforms (3–5° slopes) dominated by tabular crusts with gravel-type counterparts, summit margins (5–10° slopes) hosting gravel crusts partially covered by sediment, and steep slopes (12–15° slopes) exhibiting mixed crust types under sediment coverage. Thicker crusts clustered at summit margins (14 and 15 cm, respectively) compared to thinner crusts on platforms and slopes (10 and 7 cm, respectively). The Haima ROV successfully investigated CRC resources in complex terrains, laying the groundwork for seamount crust resource evaluations. Future advancements will focus on high-precision navigation and control, high-resolution crust thickness measurement, optical imaging optimization, and AI-enhanced image recognition.

1. Introduction

Cobalt-rich ferromanganese crusts (commonly called “crusts”) are sedimentary mineral deposits of manganese–iron oxides and hydroxides that accumulate over millennia on exposed bedrock of seamounts, island slopes, and other elevated seabed terrains at depths of 400–4000 m. These crusts can reach thicknesses of 25 cm and hold significant resource potential [1,2,3,4,5,6]. Globally distributed across the Pacific, Indian, and Atlantic Oceans, CRCs are most concentrated in the central and western Pacific. Their elemental composition varies significantly among ocean basins [7,8]. Spatial distribution and thickness are influenced by multiple factors, leading to notable disparities, even between adjacent seamounts within the same marine basin [4,6,7,9,10,11,12].
Large-scale crust exploration began in the 1980s [13,14]. Early investigations relied on geological dredging for sample collection, but this method lacked precise location data, had low operational efficiency, and offered limited spatial resolution. Technological advancements have since introduced more sophisticated survey tools—including TV-guided grab samplers, deep-sea shallow drills, and seabed imaging systems with underwater positioning—that have significantly improved survey precision. While direct sampling remains essential for resource assessment, its effectiveness is often constrained by operational limitations, weather conditions, and seafloor topography [15,16,17,18]. Over the past two decades, acoustic survey techniques have gained prominence in marine exploration due to their inherent advantages [19,20,21,22]. Advances in multibeam echo sounders, side-scan sonar, sub-bottom profilers, and in situ high-frequency thickness measurement systems have enabled widespread applications in crust resource exploration. Multibeam systems provide full-coverage bathymetric mapping [23,24] and analyze backscatter intensity for seabed substrate classification [16,17,24]. Side-scan sonar is widely used for large-scale seabed surveys to capture geomorphic and target data [25,26]. Sub-bottom profiling, when combined with geological samples and seabed imagery, differentiates sediment type, identifies bedrock/crust layers, and delineates sediment–crust boundaries, allowing regional-scale crust thickness estimation [27,28,29,30]. However, acoustic data from surface vessels remain lower in resolution than those from near-seabed platforms such as ROVs and autonomous underwater vehicles (AUVs).
In detailed exploration of complex terrains such as seamount escarpments, ridges, and gullies, conventional methods—including seabed cameras, drills, and shipboard acoustic surveys—face operational limitations. ROVs and AUVs equipped with optical cameras, coring drills, and acoustic crust thickness profilers effectively overcome these challenges [31]. ROV-mounted shallow deep-sea drills enable precise sampling in structurally complex areas [32,33]. Integrating ROV-deployed three-dimensional (3D) optical systems and acoustic thickness profilers allows crust exposure recognition and thickness determination through image reconstruction and acoustic data processing [34,35]. ROV/AUV-based in situ high-frequency thickness measurements have proven effective for high-resolution crust mapping and resource estimation [34,35,36,37,38,39]. The advanced capabilities of deep-sea robotic platforms for localized, high-precision surveys highlight the importance of ongoing technological advancements in crust exploration. The 4500-m-class Haima ROV exemplifies this progress, integrating multi-angle imaging systems, robotic manipulators, seabed drills, and acoustic thickness gauges to refine crust surveys in complex seamount terrains. This paper reviews the Haima ROV’s application in seamount crust exploration, using Caiwei Guyot as an example. It highlights methodological innovations, operational outcomes, and future directions to inform deep-sea mineral resource researchers.

2. Materials and Methods

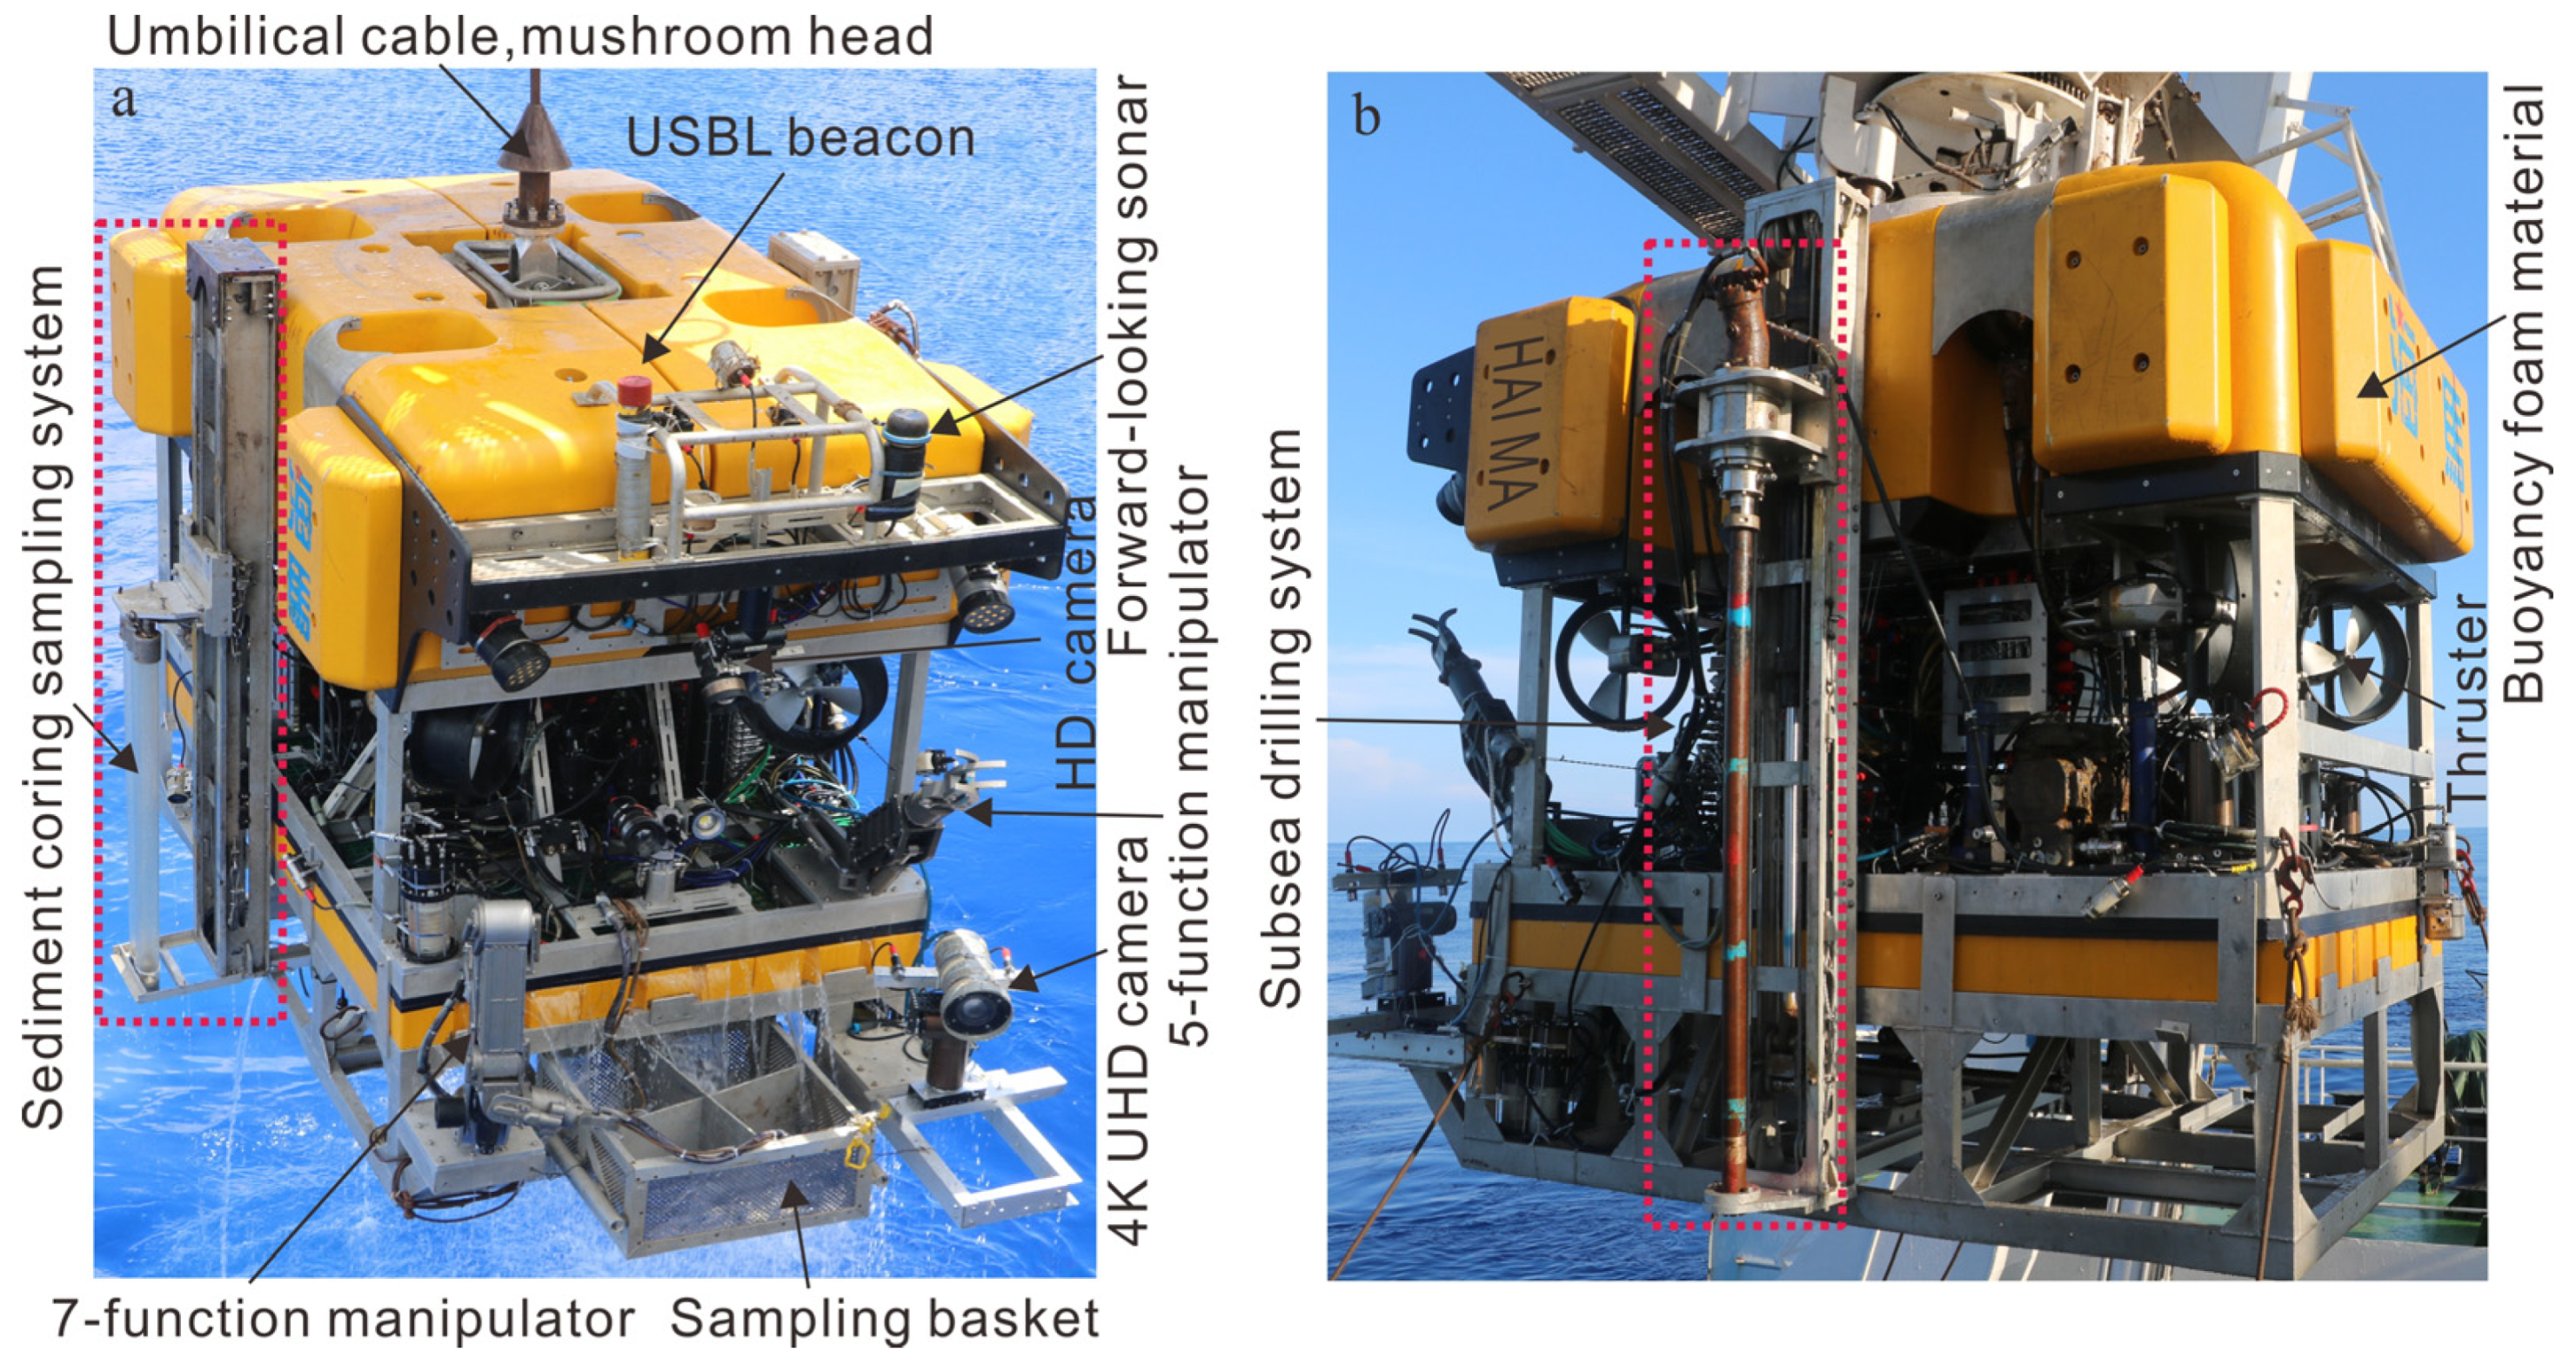
2.1. Survey Equipment

The Haima (Chinese for “Sea horse”) ROV —jointly developed by the Guangzhou Marine Geological Survey and Shanghai Jiao Tong University, China—is a 4500-m-class deep-sea heavy-duty operational system comprising a support vessel, deck control system, and a deck launch and recovery system, including an A-frame, swing restrictor, winch, umbilical cable, and heave compensation device. It also includes the ROV body and a suite of subsea tools [40,41]. The ROV integrates subsystems such as an underwater power distribution system, control system, hydraulic system, propulsion system, lighting, cameras, detection instruments, and operational tools (Figure 1) [42]. Its modular design enables functional expansion and modification to accommodate diverse seabed tasks. For deep-sea seamount crust surveys, the system features specialized payloads in addition to standard high-definition cameras and manipulator sampling tools. These include a 4K ultra-high-definition (UHD) camera (Figure 1a), a sediment sampling system, a deep-sea rock drill (Figure 1b) [32], and an acoustic crust thickness gauge. The main configurations of the Haima ROV body and its crust survey equipment are summarized in Table 1.

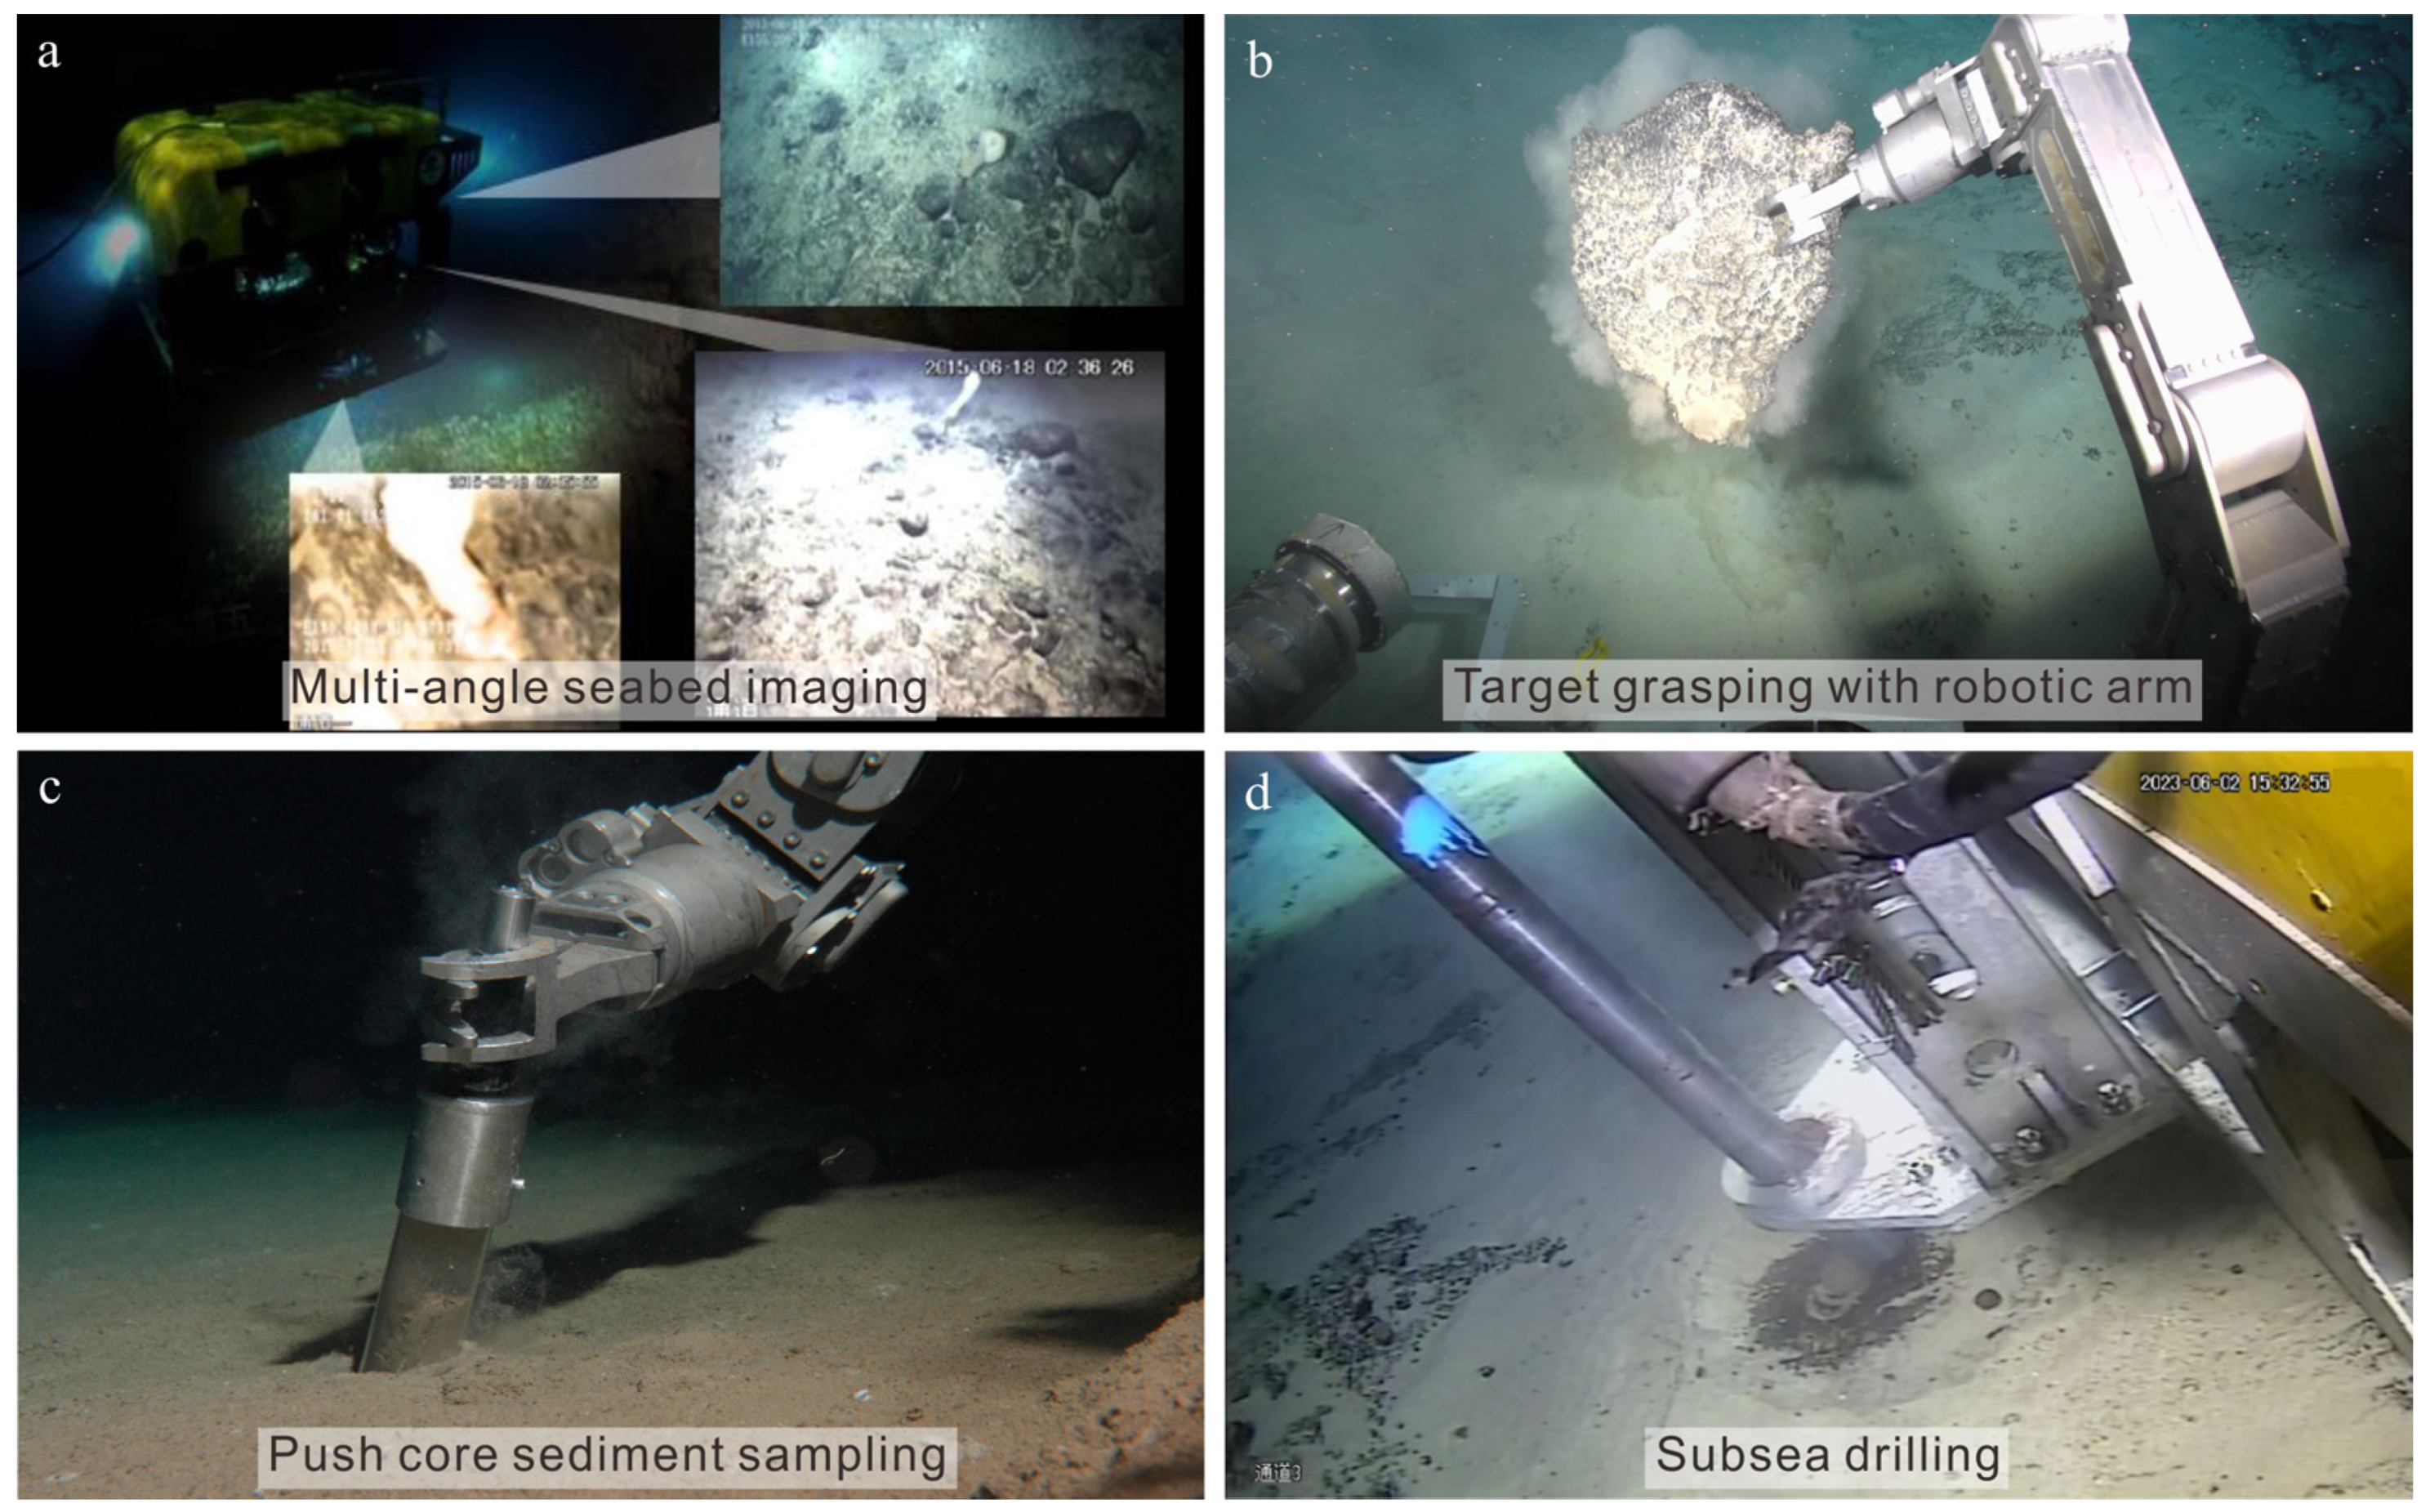
2.2. Detailed Survey Methods

Before deploying the ROV, high-precision bathymetric surveys must be conducted using the support vessel to ensure operational safety. During ROV operations, sea state conditions must not exceed Level 4, and the support vessel must maintain dynamic positioning throughout the mission. The submersible procedure consists of six key phases: pre-dive inspection, launch and water entry, descent, seabed operations, recovery, and post-dive inspection. The ROV employs directional and altitude control for seabed locomotion [43], while coordinated slow movement with the support vessel extends its observational coverage. The HiPAP 101 acoustic positioning system provides decimeter-level accuracy in both horizontal and vertical dimensions, minimizing path redundancy and improving operational efficiency.
During seabed transects or stationary observation, the ROV video recording system utilizes multiple cameras for environmental documentation (Figure 2a). A wide-angle camera enables large-FOV target reconnaissance, while a high-definition zoom camera (1080i resolution) with a pan-tilt mechanism (±360° azimuth, ±90° elevation) supports multi-angle close-range inspections [41]. An ultra-high-definition (4K) camera captures fine structural details. Upon identifying CRCs via video or forward-looking sonar, the ROV executes a precision landing for sampling operations. Gravelly crusts are directly collected using manipulators and stored in sample baskets for surface retrieval (Figure 2b). For sedimentary substrates, either manipulator-operated push core samplers (Figure 2c) or ROV-mounted sediment sampling systems are used. Tabular crust sampling is performed with a 1.5 m seabed drill rig integrated into the ROV (Figure 2d).
After video data acquisition, the seabed image recognition and mosaicking system processes the footage through frame extraction, feature point detection, and matching, ultimately generating a tiled 3D image (Figure 3) [44].
At key drilling sites, the ROV is precisely controlled to maintain an altitude of ~1 m above the seabed, where an onboard acoustic crust thickness gauge measures crustal thickness. This protocol ensures systematic validation between acoustically derived thickness data and physical core samples, improving measurement accuracy for marine mineral resource assessments.
The ROV-mounted acoustic crust thickness gauge consists of a subsea control unit and a parametric acoustic array probe. Data are transmitted in real-time to the deck-mounted control system via the ROV’s umbilical cable [45]. Measurable boundary reflections arise from acoustic impedance contrasts between crusts and bedrock. During the operation, the transducer emits a 1 MHz primary and a 100 kHz differential frequency. The software first detects primary frequency echoes to identify the seawater–crust interface, then analyzes differential frequency echo envelopes to determine crust–bedrock interface timing. Thickness is calculated based on time-of-flight (TOF) differences between these interfaces [38,39].

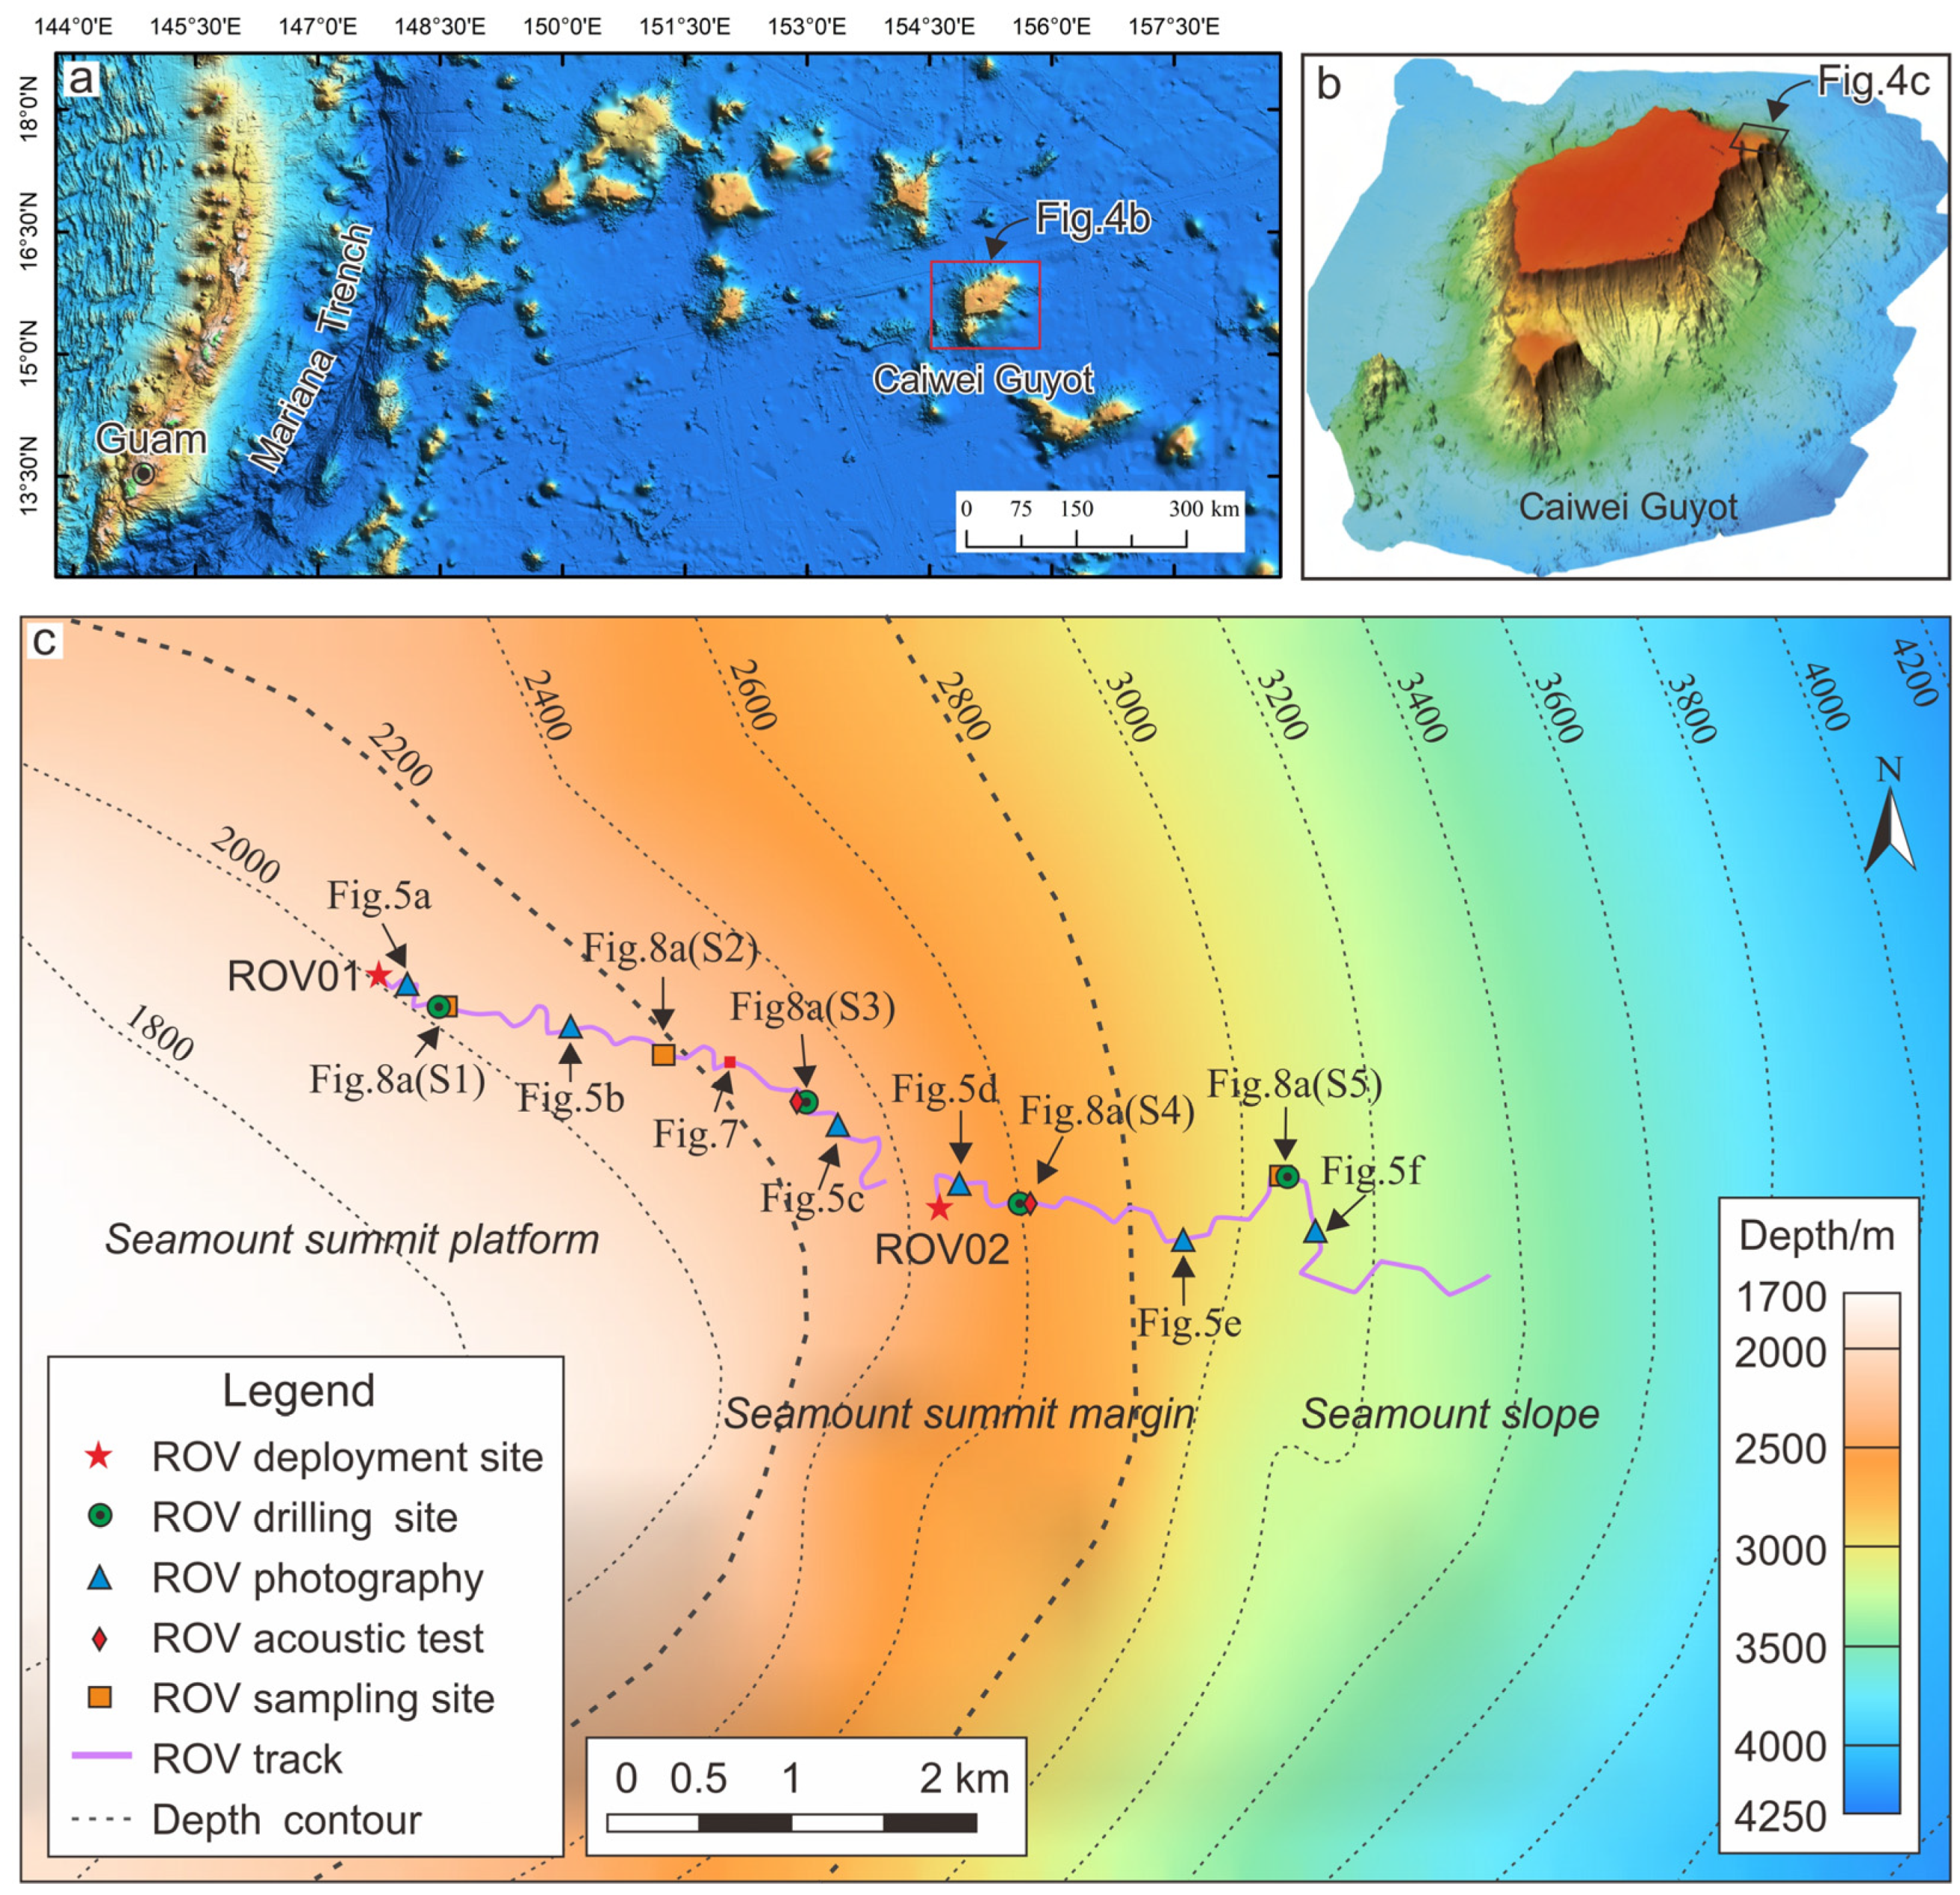
2.3. Data Collection Process in Caiwei Guyot

The Caiwei Guyot (14.9–16.1° N, 154.4–156° E), located east of Guam and the Mariana Trench within the Pacific Prime Crust Zone (PPCZ), extends 110 km in length and 95 km in width with a northeast-trending distribution. Its geomorphology consists of flat-topped summits and steep upper slopes transitioning to gentler lower slopes [46]. As a designated cobalt-rich ferromanganese crust exploration area, China has conducted extensive investigations, including bathymetric mapping, deep-sea drilling, and sub-bottom profiling. Exploration results indicate thick CRCs on the slopes of the Caiwei Guyot [47,48]. This paper presents a comprehensive ROV survey of Caiwei Guyot as a case study, detailing the data collection process.
Real-time ROV positioning on the seafloor is achieved through communication between the HiPAP 101 underwater positioning and navigation system on the support ship and the cNode mini USBL beacon mounted on the ROV. During a seamount survey in the western Pacific Ocean, the ROV traversed various complex terrains, including the summit platform, summit margin, and slopes (Figure 4). The ROV01 site dive traveled about 3.5 km from the summit platform to the summit margin while conducting high-definition video recording, sampling of gravelly crusts via the manipulator, sediment sampling, subsea drilling, and acoustic crust thickness measurements. The ROV02 site dive traveled about 3.6 km from the summit margin to the seamount slope (Figure 4). These operations integrated multi-angle visual recording and core sampling with quantitative acoustic characterization, enabling a comprehensive assessment of crust distribution, thickness variations, and substrate relationships across the seamount’s complex bathymetry.

3. Results

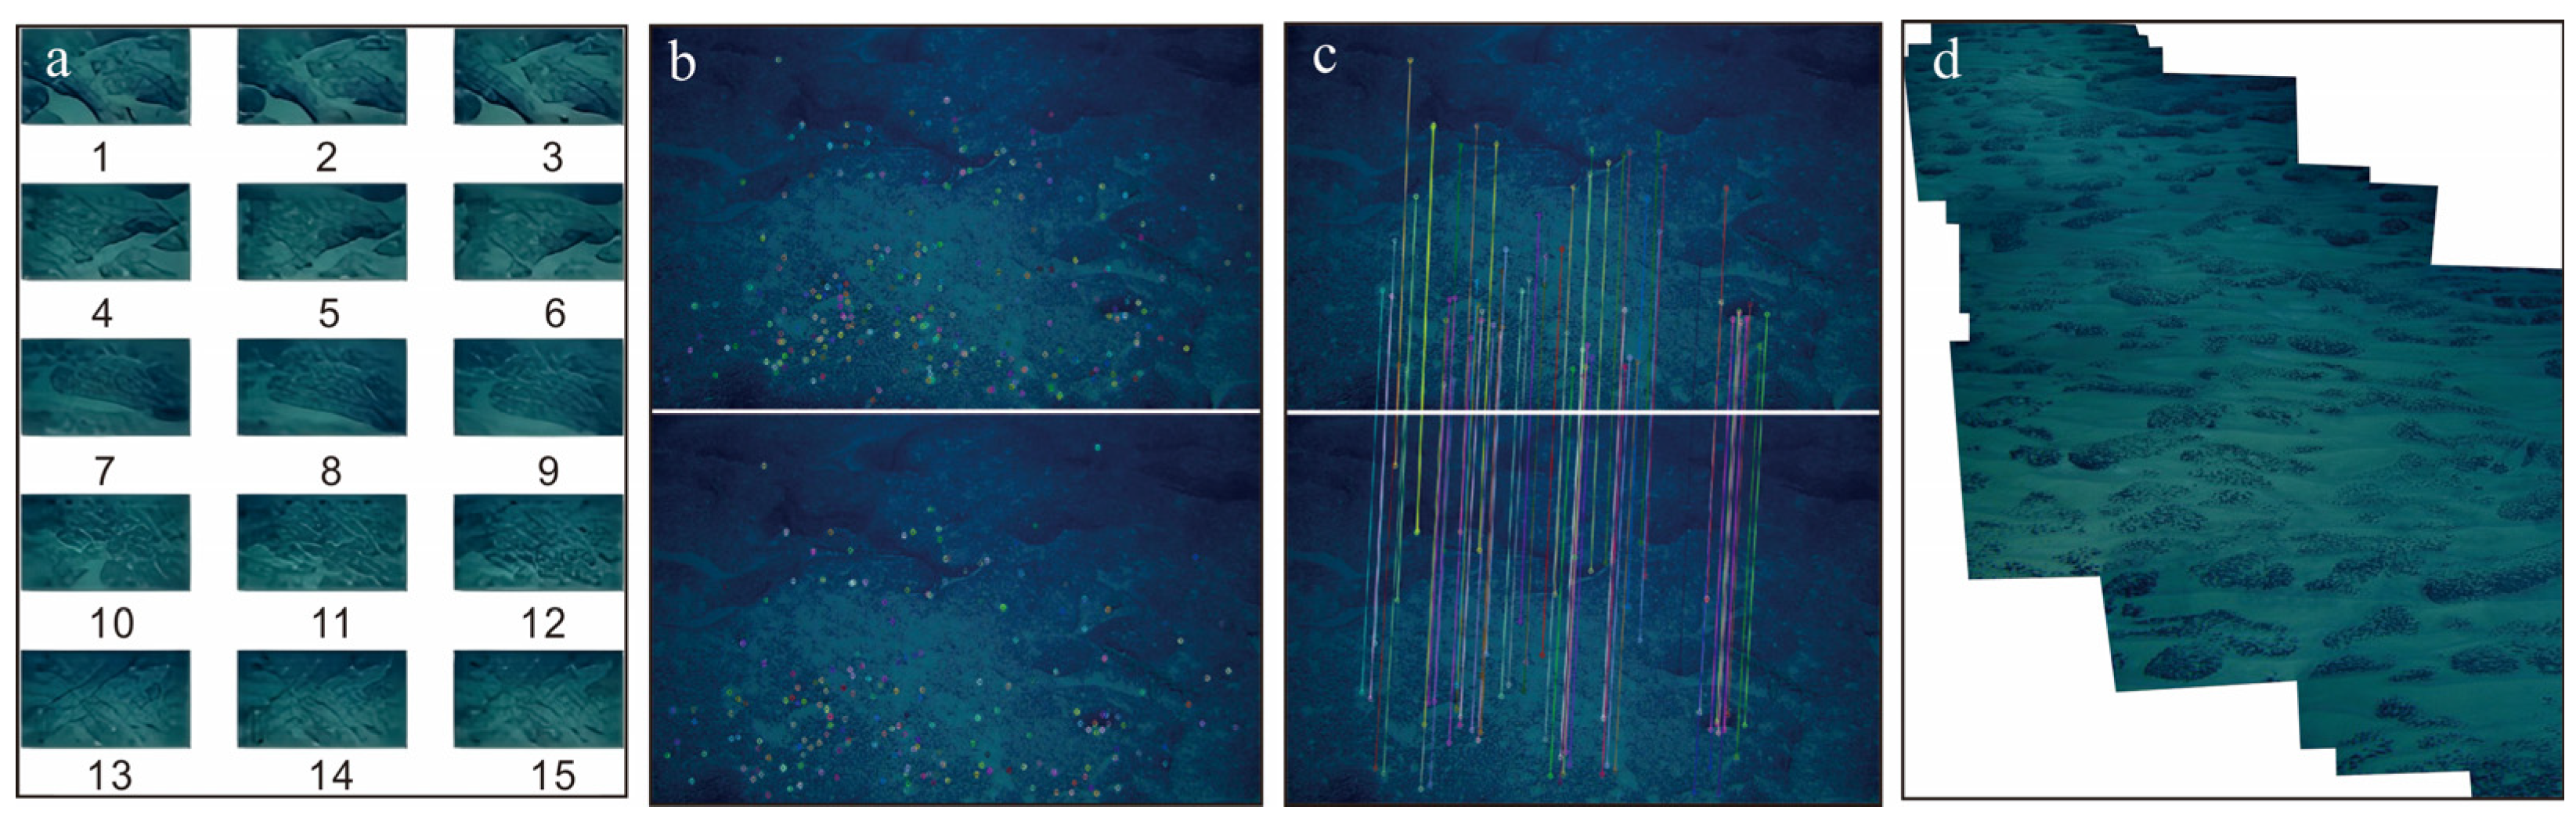
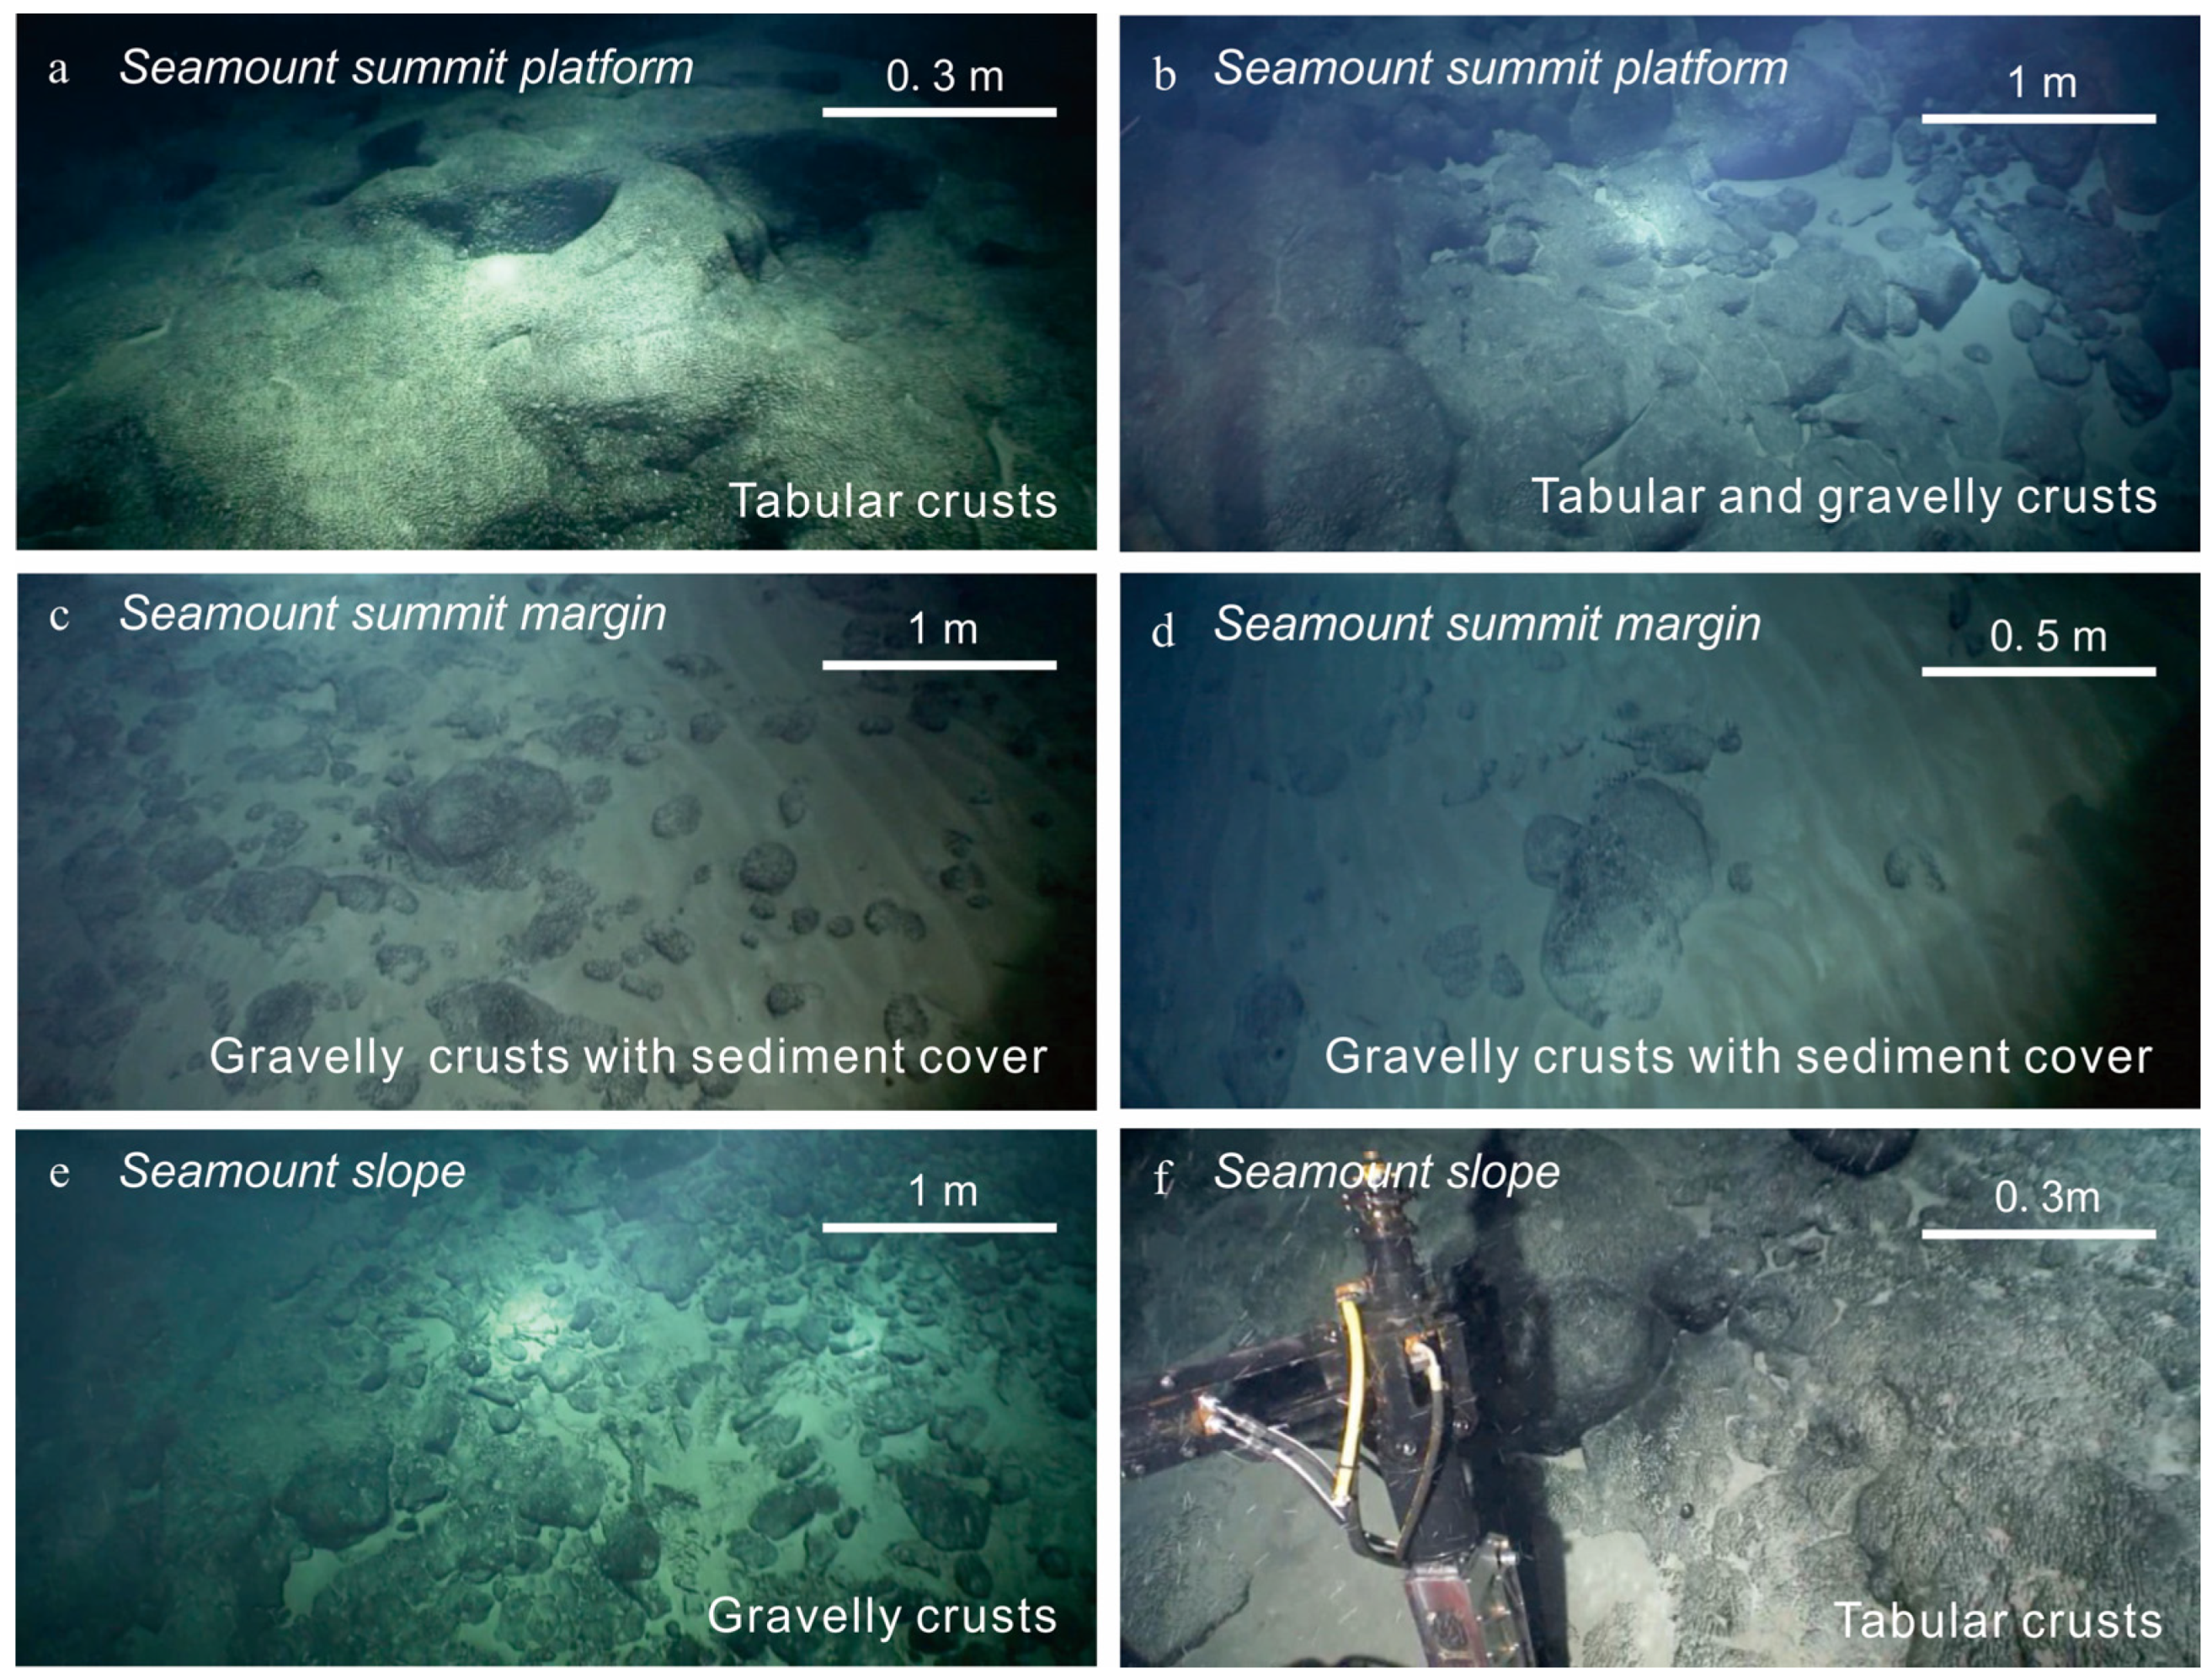
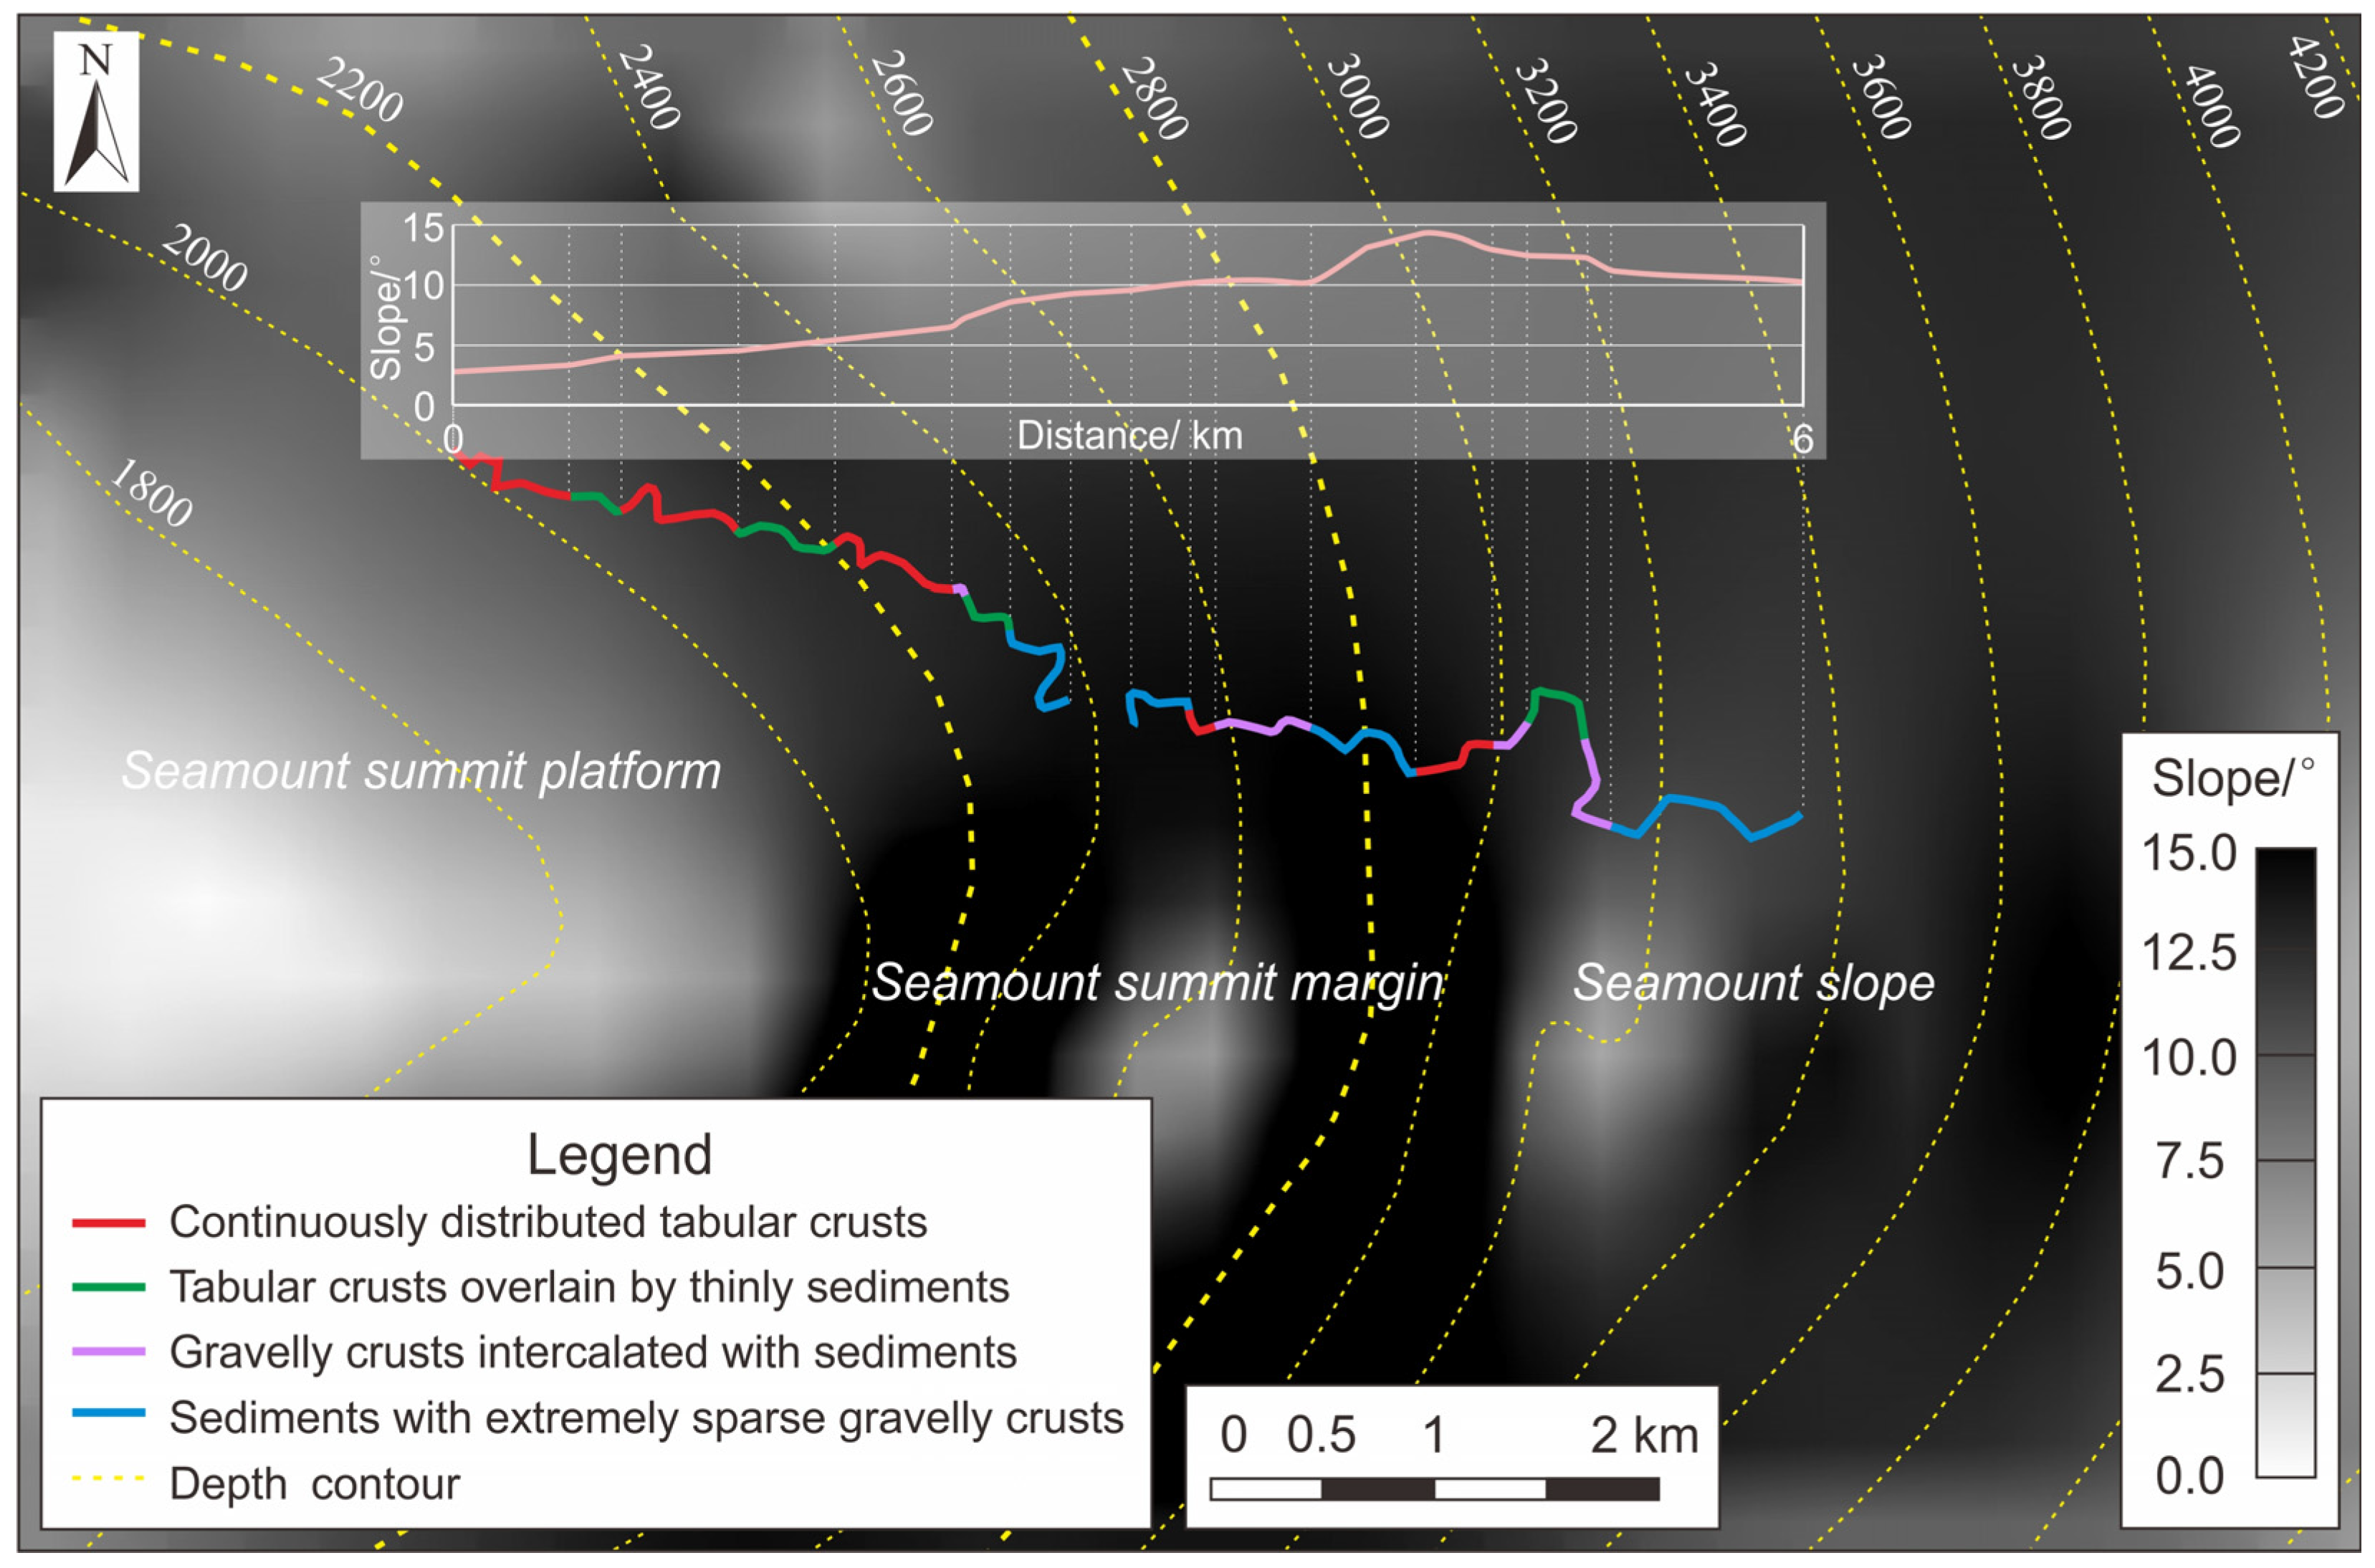
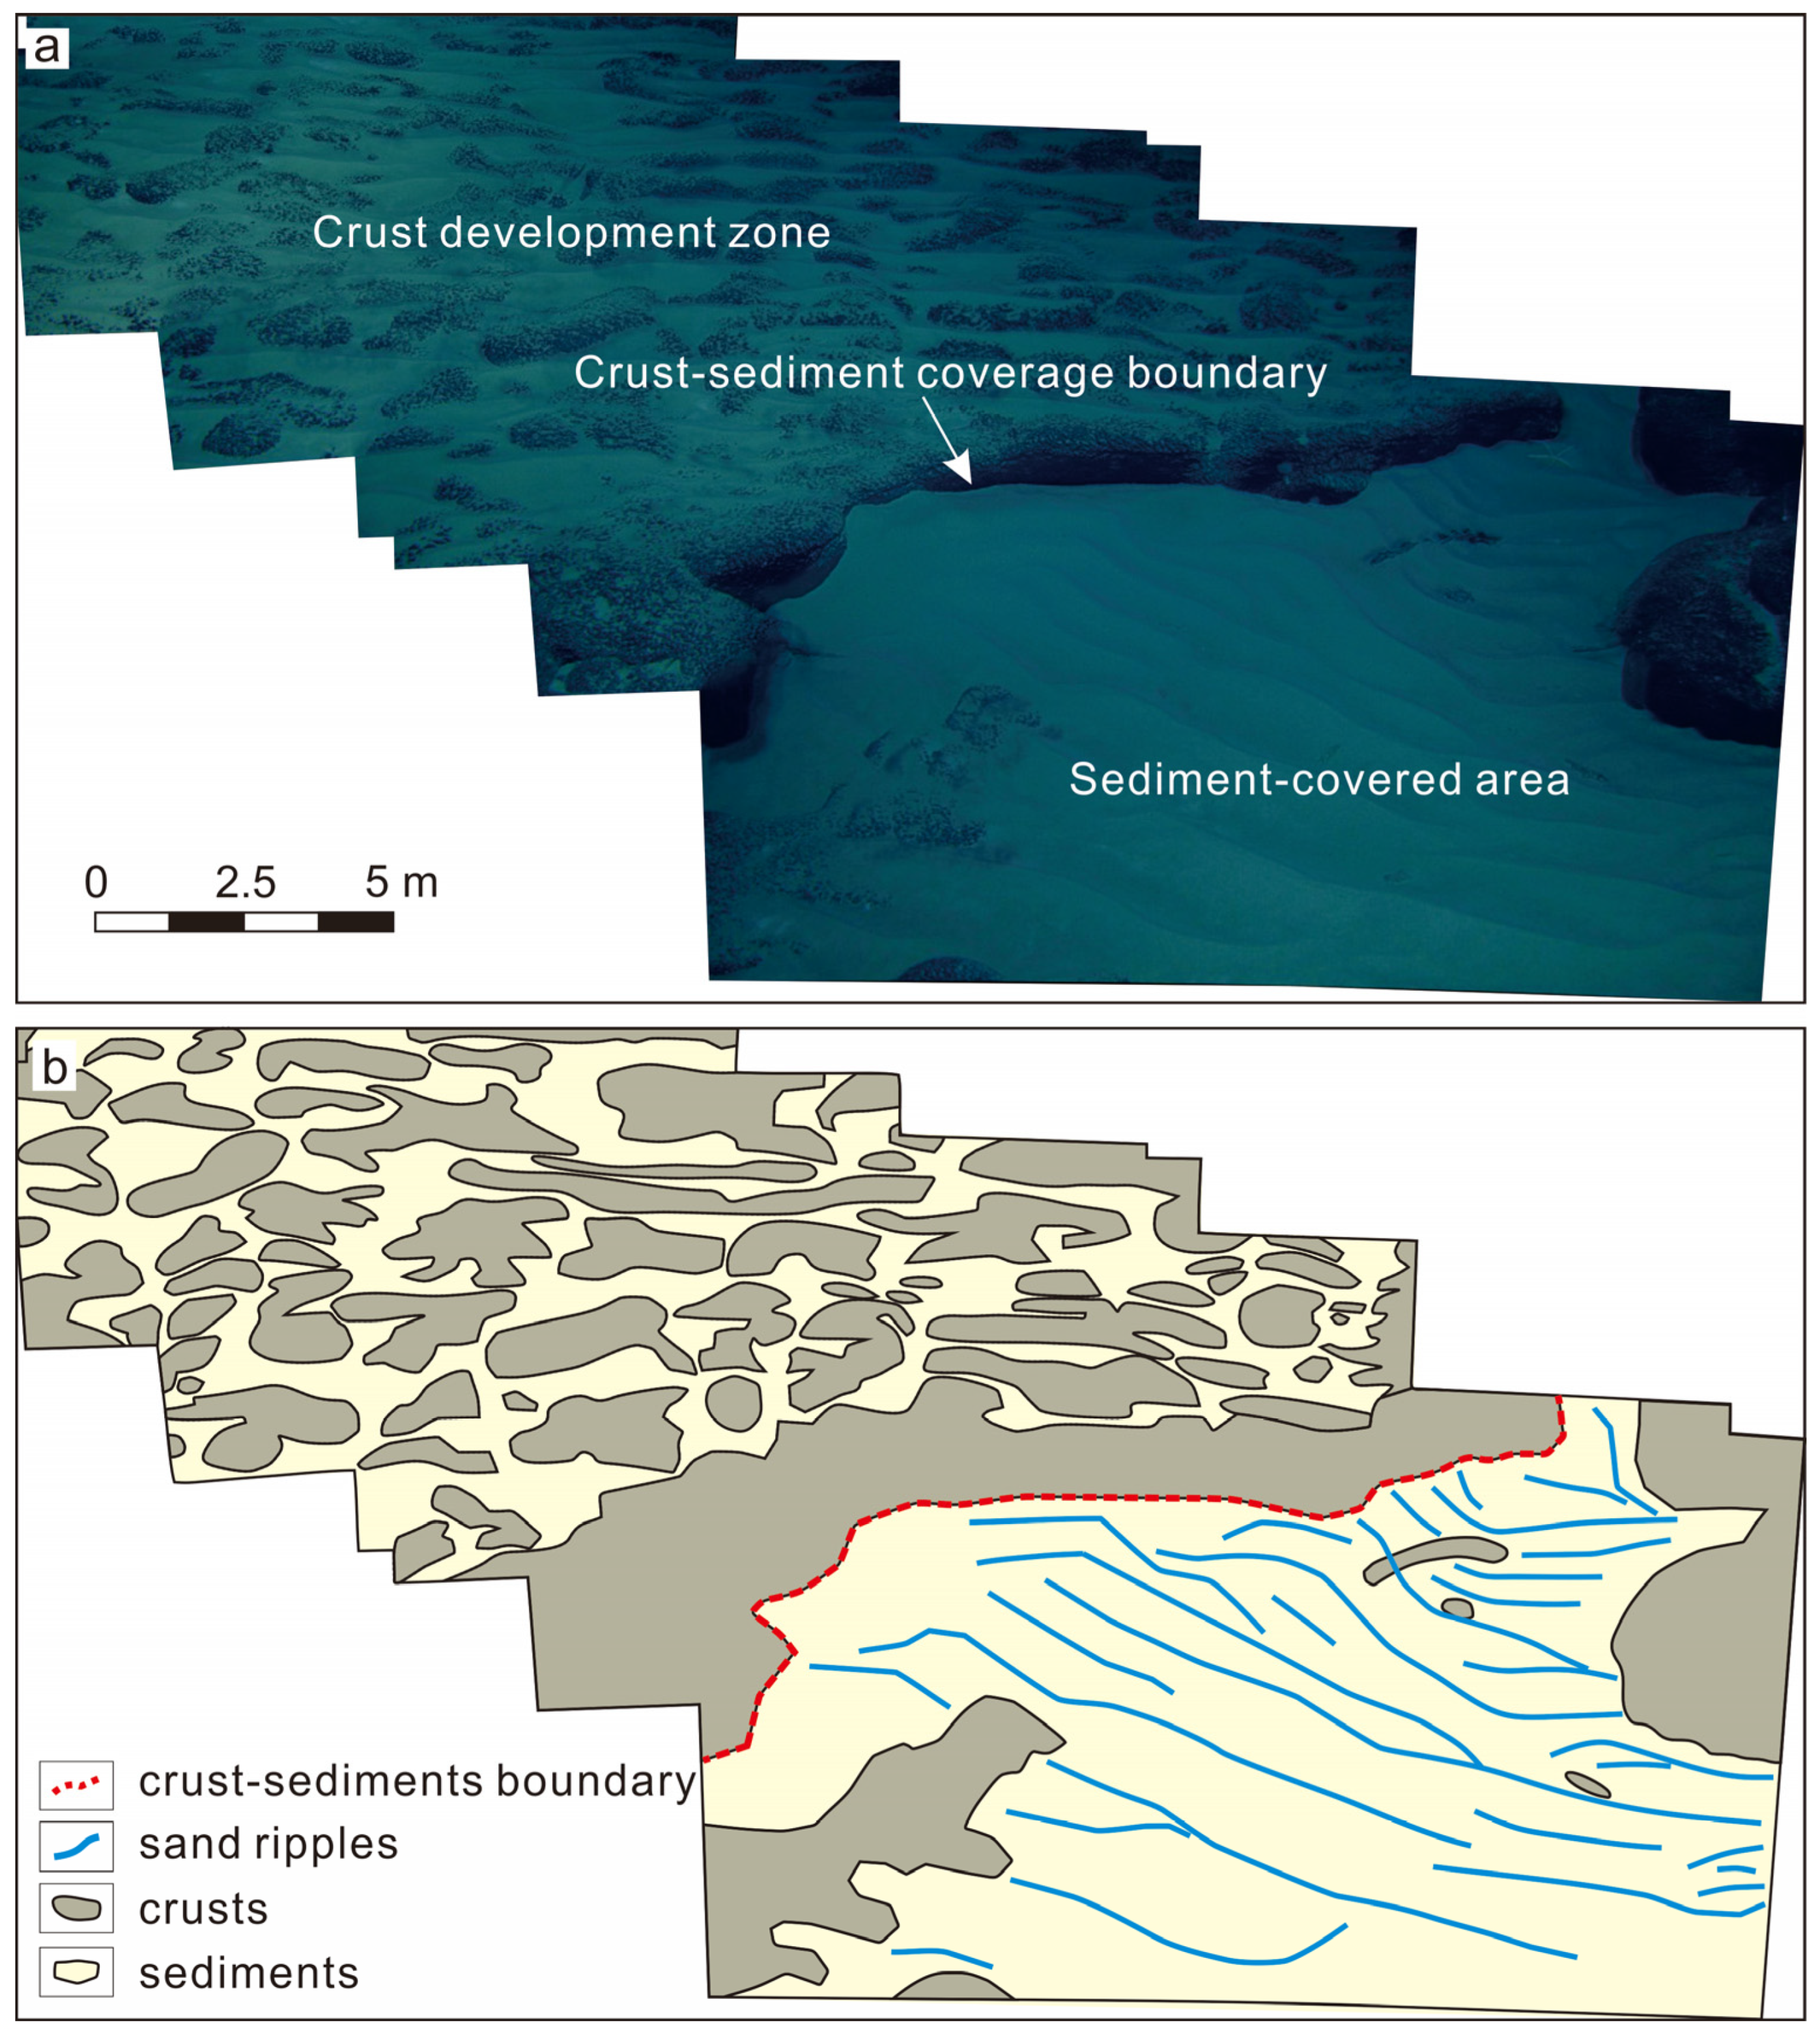
3.1. Optical Imaging: Spatial Distribution of Crusts

Multi-angle transect surveys using high-definition video imaging and in situ ROV exploration with manipulators and operational tools systematically revealed the crust types, spatial distribution patterns, and sediment characteristics within the study area. The predominant crust types—tabular and gravelly crusts—exhibited distinct spatial heterogeneity across varying water depths and slope gradients.
On the summit platform (2000–2200 m water depth), tabular crusts dominated, with minor gravelly crusts, forming continuous distributions (Figure 5a,b), although partially obscured by thin sediment layers. At the seamount summit (2200–2800 m), gravelly crusts prevailed, with sporadic sediment-covered tabular crusts (Figure 5c,d), while some areas contained only sediments and minimal gravelly crusts (blue segments in Figure 6). Along the seamount slope (2800–3400 m), both crusts were present (Figure 5e,f), although certain zones were sediment-mantled—particularly at depths below 3200 m, where only sediments and sparse gravelly crusts were observed (blue segments in Figure 6).
Notably, continuous and partially sediment-covered tabular crusts predominantly occurred on the summit platform with gentle slopes of 3–5° (red and green segments in Figure 6). In contrast, gravelly crusts dominated steeper slopes: 5–10° at the seamount margin and 12–15° on the slope (purple segments in Figure 6), highlighting slope-dependent crust differentiation.
High-definition video captured across seamount slope zones was processed using intelligent mosaicking to generate 3D seafloor imagery, enabling the identification of sediment zones, crust development areas, and crust—sediment boundaries (Figure 7). Sediment-covered crusts were observed in both tabular and gravelly crust zones, confirming that not all seamount crusts are fully exposed (Figure 7a). Additionally, sediment ripples in sediment-covered areas suggest the influence of directional deep-sea bottom currents on crust formation (Figure 7b). These findings highlight the spatial heterogeneity of crust distribution, where even seamount summit platforms dominated by tabular and gravelly crusts contain localized sediment patches or thin sediment-covered crusts.

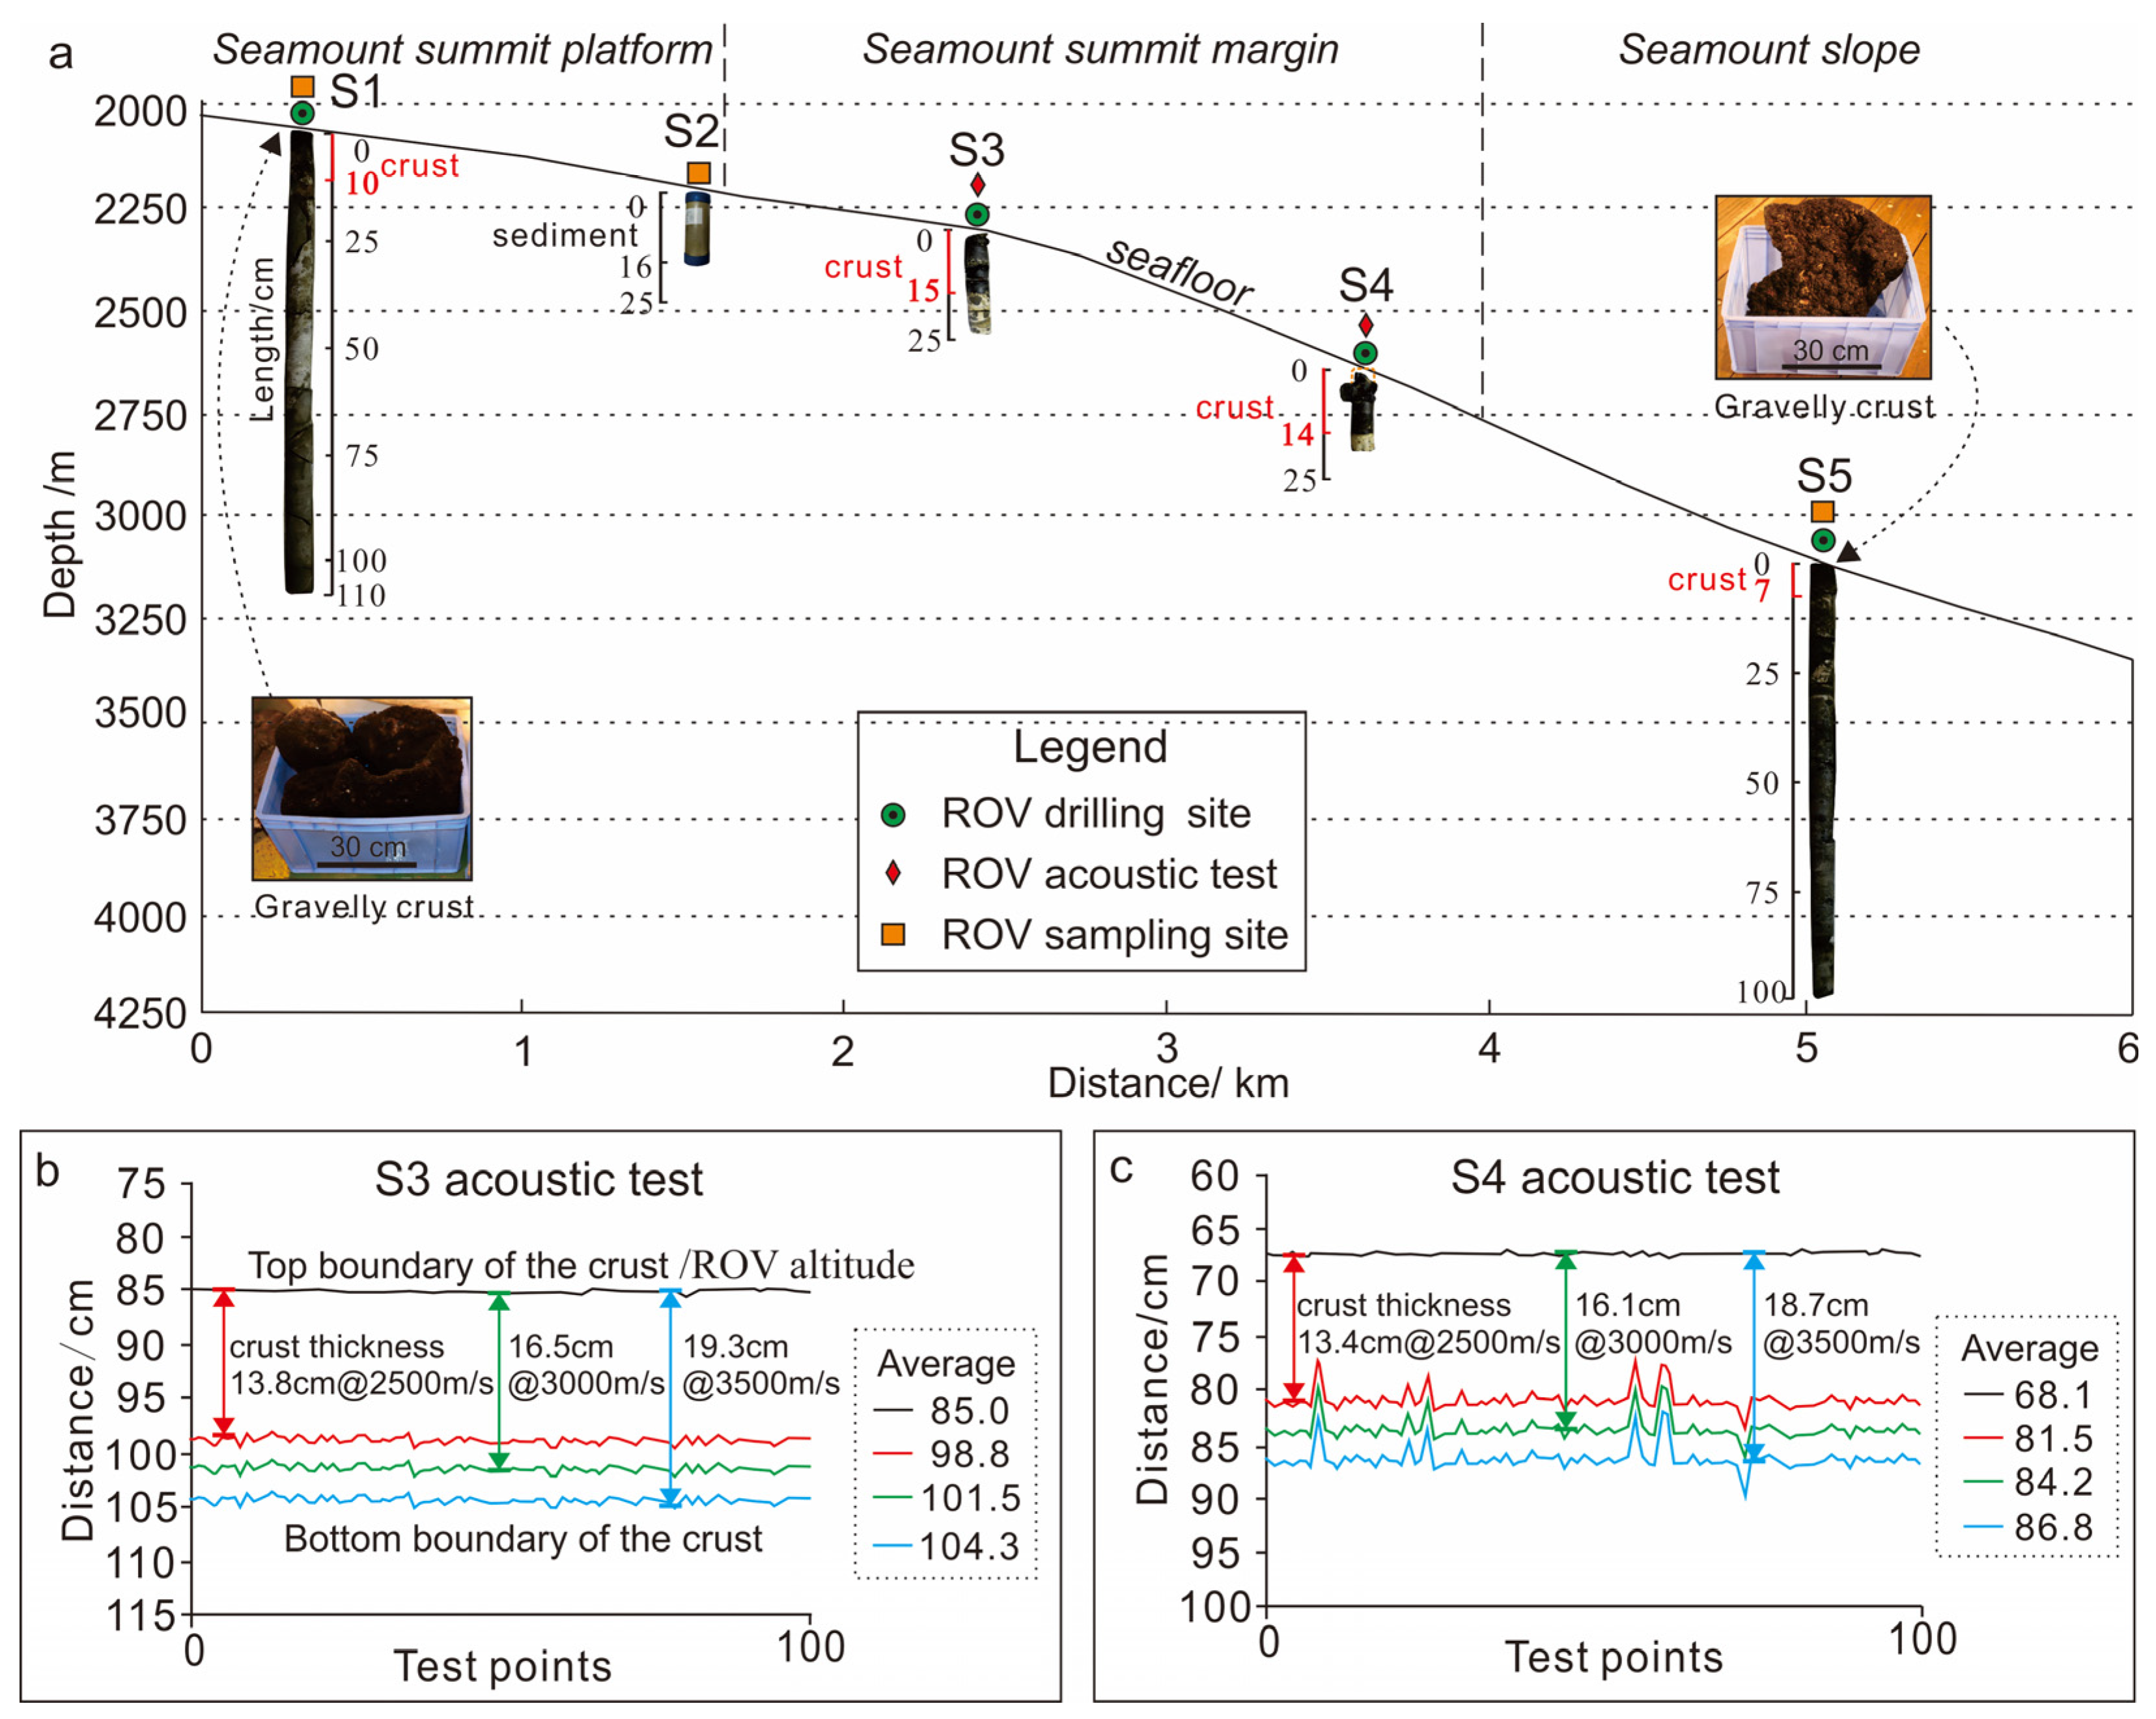
3.2. Sampling and Acoustic Measurements: Crust Thickness and Sample Component

ROV-based seafloor sampling primarily employs three methods: (1) collecting gravelly crusts with ROV manipulators, (2) retrieving core samples from tabular crust zones with ROV-mounted drilling rigs, and (3) acquiring sediment samples from sediment-covered areas with ROV-operated push corers. Tabular crust thickness was measured with ROV-deployed acoustic gauges. The results exhibited spatial variability of crusts, with thicker deposits at the summit margin (flat-top edges) and thinner crusts on the summit platform and slopes.
At Site S1, a 110 cm core sample was obtained via ROV drilling, consisting of a 10 cm crust layer, 50 cm of gravel-bearing carbonate rock, and 50 cm of volcaniclastic rock (Figure 8a). Gravelly crust samples weighing 78 kg were collected using ROV manipulators. At Site S2, no crust was retrieved, but a 16 cm sediment core (1.7 kg) was collected using ROV sediment sampling. The sediment showed minor disturbance, transitioning from coarse foraminiferal sand at the top to fine-grained whitish calcareous ooze at the base, with low moisture content and uniform coloration (Figure 8a). At Sites S3 and S4, ROV drilling yielded 23 cm and 21 cm cores, with crust layers of 15 cm and 14 cm, respectively (Figure 8a). In situ acoustic thickness measurements at sites S3 and S4 (Figure 8b, Table 2) showed crust thicknesses consistent with values from 2500 m/s and 3000 m/s acoustic velocities, with errors of 1–2 cm (Table 2). When the acoustic velocity was 2500 m/s, the minimum relative errors (Min. RE) of crust thickness measurements at Sites S3 and S4 were 8.0% and 4.3%, respectively (Table 2). At Site S5, a 100 cm core revealed a 7 cm crust layer, 40 cm of whitish conglomerate, 40 cm of volcaniclastic rock, and 13 cm of basalt, while 26.3 kg of gravelly crusts were collected (Figure 8a). These samples provided critical data on crust thickness, stratigraphy, and crust–substrate interactions, facilitating analysis of vertical metal element enrichment patterns and seamount evolution.
Acoustic velocity in the CRCs, a key parameter for resource exploration, ranged from 2500–3500 m/s in prior studies [35,49,50,51]. In Figure 8b,c, the black curve represents the distance between the crust–water interface and the acoustic array, while the red, green, and blue curves denote distances to the crust–substrate interface at assumed velocities of 2500 m/s, 3000 m/s, and 3500 m/s, respectively. Differences between these curves and the black curve reflect crust thickness estimates under varying velocities. Core-derived thicknesses closely aligned with values calculated at 2500–3000 m/s, validating the acoustic methodology.
Despite having only five observations, a strong quadratic relationship appears to exist between slope and depth. The coefficient of determination (R2) is 0.9968, with the fitted equation (Figure 9a):
Slope = −5 × 10⁻⁶ × Depth2 + 0.0363 × Depth − 48.748, R2 = 0.9968
Additionally, a slight positive correlation is observed between crusts thickness and both slope and depth (R2 values are 0.6792 and 0.7371, respectively), with the following linear equations (Figure 9b,c):
Thickness = 1.0695 × Slope, R2 = 0.6792
Thickness = 0.0037 × Depth, R2 = 0.7371
According to the fitting results from the study area data, seamount depth and slope exhibit a strong correlation, while crust thickness shows slight positive correlations with both slope and depth (Figure 9). This indicates that crust thickness is jointly influenced by depth and slope. It is crucial to emphasize that the limited sample size may lead to potential deviations between the fitting results and actual conditions, and more detailed conclusions require further research.

4. Discussion

4.1. Analysis of Spatial Distribution and Thickness Characteristics of Crusts in Seamount Complex Terrain

The Haima ROV survey results in the complex seamount terrain reveal that tabular crusts, nodular crusts, and sediments coexist in the Caiwei Guyot. Globally, seamount crust distribution is controlled by water depth, slope gradient, and sedimentation [13]. In the study area, tabular crusts are mainly found on the summit platform (3–5° slopes), while gravelly crusts are concentrated at the summit margins (5–10° slopes). This distribution aligns with the low-slope stable zone crust growth model, identified through fractal analysis of crusts on West Pacific seamounts, where tabular crusts occur on low-slope bedrock, and gravelly crusts, influenced by sedimentation, appear at the seamount base or flat summit areas [52]. The localized distribution of gravelly crusts at summit margins may be linked to variations in local bottom current scouring or sediment coverage [53].
Crust thickness in the study area is greatest at the seamount summit margins (14 and 15 cm, respectively) and decreases on the summit platform (10cm) and steeper slopes (7 cm) (Figure 8, Table 2), which is consistent with previous findings on crust thickness and seamount distribution [47,54,55]. The thickest crusts on West Pacific seamounts are typically found at slope-break zones (3–7° slopes), corresponding to the “summit margin” identified in this study [47]. Tabular crusts in these zones can exceed 10 cm in thickness, while reduced thickness on the summit platform may be due to sediment coverage. The thinner crust on steep slopes is likely a result of enhanced erosion and increased risk of detachment [52,56]. Substrate type may also influence thickness variations in tabular crusts [57].
Although current core and acoustic thickness data are limited, preliminary analysis suggests that summit margins may represent the maximum crust thickness (Figure 8). However, the fitting results from the five collected samples indicate that crust thickness is influenced by water depth and slope, exhibiting slight positive correlations with both parameters (Figure 9); these trends may reflect potential bias due to insufficient sample size. Future studies should incorporate additional sampling to validate the slope–thickness relationship and analyze core data to better understand seamount mineralization mechanisms [58].

4.2. Characteristics and Advantages of ROV-Based Fine-Scale Surveys in Complex Seamount Terrain

Through ROV applications in seamount crust resource exploration, we identified several advantages of ROV platforms. Compared to traditional deep-sea methods like towed seafloor cameras, seabed drilling, and shipborne acoustic surveys, ROV-based operations offer superior efficiency, precision, adaptability to complex terrains, and real-time data transmission capabilities. Deep-towed cameras [45] and acoustic systems [59,60] struggle with steep slopes (>20°), while seabed drills lack visual guidance and mobility, often failing in core sampling under rugged topography [32]. Shipborne acoustic tools (e.g., multibeam sonar, sub-bottom profilers) operate at frequencies below 1–2 MHz, which is insufficient for direct crust thickness or distribution mapping. However, current ROV systems have limitations in maneuverability and lack mobile continuous crust thickness measurements using acoustic gauges. Future upgrades to the Haima ROV will integrate mobile acoustic thickness profiling to expand survey coverage and enhance resource assessment accuracy.
ROVs, human operated vehicles (HOVs), AUVs, and deep tow systems (DTSs) each have distinct advantages for fine-scale surveys of CRCs on deep-sea seamounts, although their operational scenarios differ significantly. These near-seabed platforms operate in various modes: ROVs navigate freely, HOVs/AUVs perform untethered missions, and DTSs are towed. ROVs have advantages in mission duration (>12 h), maneuverability, modular expandability, real-time data transmission, and supporting heavy drilling rigs for sampling without risk to underwater personnel. In contrast, HOVs have limited operational duration, payload capacity (restricted to small drilling tools), and delayed data retrieval, despite their untethered mobility. AUVs are also untethered, lack real-time data capabilities, and cannot carry heavy equipment due to power constraints. DTSs, which are towed and limited in their configuration, prioritize acoustic, optical, or chemical sensors but lack flexibility for multi-task precision in complex terrains. A comparative analysis of these platforms is summarized in Table 3.

5. Conclusions

The Haima ROV has provided valuable insights into the spatial distribution and metallogenic mechanisms of CRCs on seamounts through the integrated acquisition of acoustic, optical, and core samples. Horizontally, it revealed distinct zonation between tabular and gravelly crusts, while vertically, it delineated thickness variations across different topographic zones of the seamount. Video and cores analysis showed summit platforms (3–5° slopes) dominated by tabular crusts with gravel-type counterparts, summit margins (5–10° slopes) hosting gravel crusts partially covered by sediment, and steep slopes (12–15° slopes) exhibiting mixed crust types under sediment coverage. Thicker crusts clustered at summit margins (14 and 15 cm, respectively) compared to thinner crusts on platforms and slopes (10 and 7 cm, respectively). Future studies should incorporate additional sampling to validate the slope–thickness relationship and analyze core data to better understand seamount mineralization mechanisms.
Equipped with an advanced survey platform, including underwater positioning systems, multi-angle cameras, multi-functional manipulators, shallow subsea drills, sediment sampling systems, and acoustic crust thickness gauges, the Haima ROV enabled stable multi-task operations in a single dive, significantly improving data acquisition efficiency in complex terrains. The ROV-based precision survey system offers unique advantages, including prolonged operational duration (unconstrained by power limitations), modular expandability, and risk-free personnel deployment. Future advancements will focus on high-precision navigation, high-resolution thickness measurement, optical imaging, and AI-enhanced image recognition for crust morphology analysis, further optimizing its capabilities in deep-sea mineral exploration.

Author Contributions

Conceptualization and methodology, Y.L. and H.Y.; sample collection, Y.L., Z.C. and L.W.; formal analysis, Y.L., H.Y., H.Z., B.Z. and S.Z.; writing—original draft preparation, Y.L., H.Y. and L.W.; writing—review and editing, Y.L., Z.C., H.Z., B.Z. and S.Z. All authors have read and agreed to the published version of the manuscript.

Funding

The authors gratefully acknowledge financial support from the Project of China Geological Survey (Grant No. DD20191009, DD20191002), National Natural Science Foundation of China (Grant No. 42442603), and National Key Research and Development Program of China (Grant No. 2023YFC2808700).

Data Availability Statement

Data are available upon request from the author, Y.L. (liyonghang@mail.cgs.gov.cn).

Conflicts of Interest

The authors declare no conflicts of interest.

References

  1. Friedrich, G.; Schmitz-Wiechowski, A. Mineralogy and chemistry of a ferromanganese crust from a deep-sea hill, central Pacific, “Valdivia” cruise VA 132. Mar. Geol. 1980, 37, 71–90. [Google Scholar] [CrossRef]
  2. Aplin, A.C.; Cronan, D.S. Ferromanganese oxide deposits from the central Pacific Ocean, I. Encrustations from the Line Islands Archipelago. Geochim. Cosmochim. Acta 1985, 49, 427–436. [Google Scholar] [CrossRef]
  3. Halbach, P. Processes controlling the heavy metal distribution in Pacific ferromanganese nodules and crusts. Geol. Rundsch. 1986, 75, 235–247. [Google Scholar] [CrossRef]
  4. Hein, J.R.; Koschinsky, A.; Bau, M.; Manheim, F.T.; Kang, J.K.; Roberts, L. Cobalt-rich ferromanganese crusts in the Pacific. In Handbook of Marine Mineral Deposits; Cronan, D.S., Ed.; CRC Press: Boca Raton, FL, USA, 2000; pp. 239–279. [Google Scholar]
  5. Ma, W.; Chu, F.; Jin, X. Method approach of resource assessment and ore delineation for the cobalt-rich crust. Acta Oceanol. Sin. 2008, 29, 67–73. [Google Scholar]
  6. Okamoto, N.; Usui, A. Regional distribution of Co-rich ferromanganese crusts and evolution of the seamounts in the Northwestern Pacific. Mar. Georesour. Geotechnol. 2014, 32, 187–206. [Google Scholar] [CrossRef]
  7. Hein, J.R.; Mizell, K.; Koschinsky, A.; Conrad, T.A. Deep-ocean mineral deposits as a source of critical metals for high and green technology applications: Comparison with land-based resources. Ore Geol. Rev. 2013, 51, 1–14. [Google Scholar] [CrossRef]
  8. Hein, J.R.; Koschinsky, A. Deep-ocean ferromanganese crusts and nodules. Treatise Geochem. 2014, 13, 273–291. [Google Scholar]
  9. Jiao, D.; Jin, X.; Chu, F.; Hu, G.; Wang, Y. Formation conditions and control factors of thick Co-rich ferromanganese crusts. Miner. Deposits 2007, 26, 296–306. [Google Scholar]
  10. Zhang, F.; Zhang, W.; Ren, X.; Zhang, X.; Zhu, K. Resource estimation of Co-rich crusts of seamounts in the three oceans. Acta Oceanol. Sin. 2015, 37, 88–105. [Google Scholar]
  11. Halbach, P.E.; Jahn, A.; Cherkashov, G. Marine Co-rich ferromanganese crust deposits: Description and formation, occurrences and distribution, estimated worldwide resources. In Deep-Sea Mining; Sharma, R., Ed.; Springer: Cham, Switzerland, 2017; pp. 65–141. [Google Scholar]
  12. Usui, A.; Nishi, K.; Sato, H.; Nakasato, Y.; Thornton, B.; Kashiwabara, T.; Tokumaru, A.; Sakumaru, A.; Yamaoka, K.; Kato, S.; et al. The continuous growth of hydrogenetic ferromanganese crusts since 17 Myr ago on Takuyo-Daigo Seamount, NW Pacific, at water depths of 800–5500 m. Ore Geol. Rev. 2017, 87, 71–87. [Google Scholar] [CrossRef]
  13. Liu, Y.; He, G.; Yao, H.; Yang, Y.; Ren, J.; Guo, L.; Mei, Y. Global distribution characteristics of seafloor cobalt-rich encrustation resources. Miner. Deposits 2013, 32, 1275–1284. [Google Scholar]
  14. Riemann, F. Biological aspects of deep-sea manganese nodule formation. Oceanol. Acta 1983, 6, 303–311. [Google Scholar]
  15. Yamazaki, T.; Tsurusaki, K.; Chung, J.S. A gravity coring technique applied to cobalt-rich manganese deposits in the Pacific Ocean. Georesour. Geotechnol. 1996, 14, 315–334. [Google Scholar] [CrossRef]
  16. Anderson, J.T.; Holliday, D.V.; Kloser, R.; Dave, G.R.; Simard, Y.; Brown, C.J.; Chapman, R.; Coggan, R.; Kieser, R.; Michaels, W.L.; et al. Acoustic seabed classification of marine physical and biological landscapes. ICES Coop. Res. Rep. 2007, 286, 1–6. [Google Scholar]
  17. Usui, A.; Okamoto, T. Geophysical and geological exploration of cobalt-rich ferromanganese crusts: An attempt of small-scale mapping on a Micronesian seamount. Mar. Georesour. Geotechnol. 2010, 28, 192–206. [Google Scholar]
  18. Luo, W.; He, S. Application of rock dredge to cobalt-rich crust investigation. Mar. Geol. Front. 2017, 33, 66–70. [Google Scholar] [CrossRef]
  19. He, Q.; Yuan, B. A preliminary study on detecting the thickness of cobalt-rich crust in the ocean by acoustic wave. Min. Technol. 2003, 3, 93–95. [Google Scholar]
  20. Jin, X. The development of research in marine geophysics and acoustic technology for submarine exploration. Prog. Geophys. 2007, 22, 1243–1249. [Google Scholar]
  21. Anderson, J.T.; Van, H.D.; Kloser, R.; Reid, D.G.; Simard, Y. Acoustic seabed classification: Current practice and future directions. ICES J. Mar. Sci. 2008, 65, 1004–1011. [Google Scholar]
  22. Yu, Q.; He, G.; Yang, Y. Status quo and prospect in acoustic detection technology for submarine cobalt-rich crust exploration. Mar. Geol. Front. 2024, 40, 83–92. [Google Scholar]
  23. Yeo, I.A.; Howarth, S.A.; Spearman, J.; Cooper, A.; Crossouard, N.; Taylor, J.; Turnbull, M.; Murton, B.J. Distribution of and hydrographic controls on ferromanganese crusts: Tropic Seamount, Atlantic. Ore Geol. Rev. 2019, 114, 103131. [Google Scholar]
  24. Yang, Y.; He, G.; Liu, Y.; Ma, J.; Wei, Z.; Guo, B. Automated multi-scale classification of the terrain units of the Jiaxie Guyots and their mineral resource characteristics. Acta Oceanol. Sin. 2022, 41, 129–139. [Google Scholar] [CrossRef]
  25. Johnson, H.P.; Helferty, M. The geological interpretation of side-scan sonar. Rev. Geophys. 1990, 28, 357–380. [Google Scholar]
  26. Atallah, L.; Smith, P.P. Automatic seabed classification by the analysis of side-scan sonar and bathymetric imagery. IEEE Proc. Radar Sonar Navig. 2004, 151, 327–336. [Google Scholar] [CrossRef]
  27. Lee, T.G.; Hein, J.R.; Lee, K.; Moon, J.W.; Ko, Y.T. Sub-seafloor acoustic characterization of seamounts near the Ogasawara Fracture Zone in the Western Pacific using chirp (3-7 kHz) sub-bottom profiles. Deep Sea Res. Part I 2005, 52, 1932–1956. [Google Scholar]
  28. He, G.; Liang, D.; Song, C.; Wu, S.; Zhou, J.; Zhang, X. Determining the distribution boundary of cobalt-rich crusts of Guyot by synchronous application of sub-bottom profiling and deep-sea video recording. Earth Sci. J. China Univ. Geosci. 2005, 30, 509–512. [Google Scholar]
  29. Li, S.; Tao, C.; Chu, F.; Wu, Z. A practical application of sub-bottom profile system to cobalt-rich crust investigation in middle Pacific Ocean. Ocean Technol. 2007, 26, 54–57. [Google Scholar]
  30. Mel’nikov, M.E.; Tugolesov, D.D.; Pletnev, S.P. The structure of the incoherent sediments in the Ita Mai Tai Guyot (Pacific Ocean) is based on acoustic profiling data. Oceanology 2010, 50, 582–590. [Google Scholar]
  31. Liu, Y.; Yao, H.; Deng, X. Application of the Jiaolong HOV to the seamount ferromanganese crust resource exploration. Geol. Rev. 2017, 63 (Suppl. S1), 231–232. [Google Scholar]
  32. Tian, L.; Sheng, Y. The Hai Ma ROV rich cobalt crust drilling technology research. Mech. Electr. Eng. Technol. 2015, 44, 13–15. [Google Scholar]
  33. Liu, G.; Wei, Z.; Lu, M.; Lu, Q.; Deng, D. Development of deep-sea shallow sampling drill on board ROV. In Proceedings of the 20th National Exploration Engineering (Geotechnical Drilling Engineering) Academic Exchange Conference, Geological Society of China, Beijing, China, 11–15 October 2019; pp. 343–347. [Google Scholar]
  34. Thornton, B.; Asada, A.; Ura, T.; Ohira, K.; Kirimura, D. The development of an acoustic probe to measure the thickness of ferromanganese crusts. In Proceedings of the Oceans 2010 IEEE, Sydney, NSW, Australia, 24–27 May 2010; pp. 1–9. [Google Scholar]
  35. Thornton, B.; Asada, A.; Bodenmann, A.; Sato, T.; Ura, T. Instruments and methods for acoustic and visual survey of manganese crusts. IEEE J. Ocean. Eng. 2013, 38, 86–203. [Google Scholar]
  36. Neettiyath, U.; Thornton, B.; Sugimatsu, H.; Sunaga, T.; Sakamoto, J.; Hino, H. Automatic detection of buried Mn-crust layers using a sub-bottom acoustic probe from AUV based surveys. In Proceedings of the Oceans 2022-Chennai, Chennai, India, 21–24 February 2022; pp. 1–7. [Google Scholar]
  37. Neettiyath, U.; Thornton, B.; Sangekar, M.; Ishii, K.; Sato, T.; Bodenmann, A. Automatic extraction of thickness information from sub-surface acoustic measurements of manganese crusts. In Proceedings of the OCEANS 2017-Aberdeen, Aberdeen, UK, 19–22 June 2017; pp. 1–7. [Google Scholar]
  38. Hong, F.; Feng, H.; Huang, M.; Wang, B.; Xia, J. China’s first demonstration of cobalt-rich manganese crust thickness measurement in the Western Pacific with a parametric acoustic probe. Sensors 2019, 19, 4300. [Google Scholar] [CrossRef]
  39. Feng, H.; Ren, X.; Huang, M.; Yang, Z. Key techniques of parametric array sonar for detecting the thickness of cobalt-rich crusts in deep sea. Technol. Acoust. 2020, 39, 267–271. [Google Scholar]
  40. Lian, L.; Ma, X.; Tao, J. Development history of 4500 m class “Haima” ROV. Nav. Archit. Ocean Eng. 2015, 31, 9–12. [Google Scholar]
  41. Chen, Z.; Tian, L.; Hu, B.; Chen, C.; Zhang, X.; Sheng, Y.; Tao, J. Application of “Haima” ROV in gas hydrate exploration. J. Ocean Technol. 2018, 37, 24–29. [Google Scholar]
  42. Tao, J.; Chen, Z.H. Development and application of HAIMA (ROV). J. Eng. Stud. 2016, 8, 185–191. [Google Scholar]
  43. Tian, L.; Sun, Y.; Zhang, Y. Motion control research based on ROV “Haima” sea trial. Mech. Electr. Inf. 2017, 6, 52–55. [Google Scholar]
  44. Johnson-Roberson, M.; Pizarro, O.; Williams, S.B.; Mahon, I. Generation and visualization of large-scale three-dimensional reconstructions from underwater robotic surveys. J. Field Robot. 2010, 27, 21–51. [Google Scholar]
  45. Zhang, X. Application of crust and shell acoustic thickness gauge in the exploration of oceanic cobalt-rich crusts resources. Mech. Electr. Eng. Technol. 2018, 47, 157–159. [Google Scholar]
  46. Zhang, H.; Yao, H.; Yang, Y.; Zhang, H. Origin of multiple flat tables on Caiwei Guyots in West Pacific. Mar. Geol. Quat. Geol. 2018, 38, 91–97. [Google Scholar]
  47. He, G.; Wang, H.; Ren, J.; Yang, Y.; Wang, F.; Zhang, L.; Deng, X.; Liu, S.; Zhao, B.; Lu, L.; et al. Research on the metallogenic mechanism of deep sea sedimentary mineral resources: Review and outlook. Acta Geol. Sin. 2024, 98, 3202–3212. [Google Scholar]
  48. He, G.; Yang, Y.; Wei, Z.; Yang, S.; Liu, Y.; Deng, X.; Yao, H.; Deng, Y.; Gao, J.; Fang, N.; et al. Mineral deposit characteristics of cobalt-rich Fe-Mn crusts in COMRA contract area, Western Pacific Ocean. Chin. J. Nonferrous Met. 2021, 31, 2649–2664. [Google Scholar]
  49. Anokhin, V.M.; Mel’nikov, M.E. Structural features of the northeastern slope of Govorov Guyot, Magellan Seamounts, Pacific Ocean. Russ. J. Pac. Geol. 2010, 4, 304–313. [Google Scholar]
  50. Ding, Z.; Pan, W.; Lin, Y. Research on simulating cobalt-rich crust in the ocean by high frequency acoustic waves. J. Ocean Technol. 2018, 37, 23–27. [Google Scholar]
  51. Pan, W.; Ding, Z.; Fan, C. Ultrasonic thickness measurement of ocean cobalt-rich crusts. Nondestr. Test. 2018, 40, 31–34. [Google Scholar]
  52. He, G. Preliminary fractal analysis of cobalt-rich crust distribution. Mar. Geol. Quat. Geol. 2001, 21, 89–92. [Google Scholar]
  53. Hein, J.R. Cobalt-rich ferromanganese crusts: Global distribution, composition, origin and research activities. In Minerals Other than Polymetallic Nodules of the International Seabed Area; International Seabed Authority: Kingston, Jamaica, 2004; pp. 188–256. [Google Scholar]
  54. Cheng, Y.; Jiang, X.; Song, S. Delineation of cobalt crust blocks and estimation of Co-rich crust resource of Govorov Guyot, Magellan Seamounts, Pacific Ocean. J. Jilin Univ. Earth Sci. Ed. 2015, 45, 1642–1656. [Google Scholar]
  55. Ma, W.; Yang, K.; Bao, G.; Zhang, K.; Dong, R.; Chu, F. Spatial distribution study of cobalt-rich crusts ore formation on the central Pacific seamount. Acta Oceanol. Sin. 2014, 36, 77–89. [Google Scholar] [CrossRef]
  56. Yamazaki, T.; Sharma, R. Morphological features of Co-rich manganese deposits and their relation to seabed slopes. Mar. Georesour. Geotechnol. 2000, 18, 43–76. [Google Scholar]
  57. Zhang, H.; Hu, J.; Zhao, J.; Han, Z.; Yu, P.; Wu, G.; Lei, J.; Lu, B.; Pulyaeva, I.A. Variations of calcareous nannofossils of cobalt-rich crusts and geological records at the Eocene-Oligocene transition in western Pacific seamounts. Sci. China Earth Sci. 2015, 58, 784–794. [Google Scholar] [CrossRef]
  58. Gao, J.; Liu, J.; Zhang, H.; Yan, S.; Wang, H. Geochemistry and source of platinum group elements in cobalt-rich crusts from Caiwei Seamounts in the western Pacific. Haiyang Xuebao 2023, 45, 82–94. [Google Scholar]
  59. Cao, J.; Liu, X.; Zhang, F.; Li, Q.; Zhang, D.; Wang, H. Application of DTA-6000 acoustic deep-tow system to cobalt-rich crust investigation. Mar. Geol. Quat. Geol. 2016, 36, 173–181. [Google Scholar]
  60. Xu, J.; Zheng, Y.; Bao, G.; Wu, X.; Zhang, K.; Jin, X. Research of seamount micro-topography based on acoustic deep-tow system investigation: A case from the Marcus-Wake Ridge area. J. Mar. Sci. 2011, 29, 17–24. [Google Scholar]
Figure 1. The primary components of the Haima ROV platform and its mission payload. (a) The front view of the Haima ROV displays critical operational modules, including the sediment sampling system, manipulator arms, high-definition cameras, and forward-looking sonar. (b) The lateral view displays specialized subsea tools such as the seabed drilling system.
Jmse 13 00702 g001
Figure 2. Schematic of ROV seabed operational methods. (a) Multi-angle seabed imaging; (b) Robotic grasping of gravelly crusts; (c) Push core sediment sampling; (d) 1.5 m subsea drill coring.
Jmse 13 00702 g002
Figure 3. 3D composite imagery of deep-sea crust development zone. (a) Video frame extraction; (b) Feature point identification; (c) Feature matching across tiles; (d) 3D image assembly.
Jmse 13 00702 g003
Figure 4. The ROV conducted precise crust surveys across complex seamount terrains. (a) Shows the regional location of the Caiwei Guyot, situated east of Guam and the Mariana Trench, within the PPCZ, with the location of (b) indicated by a red rectangle. (b) 3D topographic map of the Caiwei Guyot, with the location of (c) indicated by a black rectangle. (c) The ROV’s continuous traversal across diverse terrains, including the summit platform, summit margins, and seamount slopes, with purple lines representing ROV trajectories. During dives (ROV01 and ROV02), operations included seafloor video recording, imaging, crusts and sediments sampling, subsea drilling, and crust acoustic thickness measurements.
Jmse 13 00702 g004
Figure 5. Crust development characteristics across distinct seamount zones based on ROV subsea observations. (a,b) The summit platform is dominated by continuous tabular crusts with associated gravelly crusts. (c,d) The margin primarily features gravelly crusts that are partially covered by thin sediment layers. (e,f) Along the seamount slope, both gravelly and tabular crusts are observed.
Jmse 13 00702 g005
Figure 6. Crust distribution patterns across seamount zones, derived from ROV transect video analysis. Red segments indicate continuous tabular crusts, green segments represent tabular crusts with thin sediment cover, purple segments indicate gravelly crusts mixed with sediments, and blue segments indicate sediments with minimal gravelly crusts. The inset illustrates the slopes corresponding to different crust types. The spatial distribution of these crusts varies with water depth and slope gradient.
Jmse 13 00702 g006
Figure 7. 3D mosaic imagery revealing fine-scale crust distribution on seamount slopes. (a) displays ROV-derived 3D mosaic images, while (b) provides interpretive annotations. The corresponding location is mapped in Figure 4c. The mosaics delineate sediment zones, crust development zones, and transitional boundaries, with sediment ripple features suggesting bottom currents may influence crust growth.
Jmse 13 00702 g007
Figure 8. Samples were collected during ROV submersible dives and in situ acoustic crust testing results. (a) Core samples from S1 and S3–S5 indicate crust thicknesses ranging from 7–15 cm. Bulk gravelly crusts retrieved at S1 and S5 confirm the coexistence of gravelly and tabular crusts on the summit platform and slope. (b,c) show in situ acoustic-derived crust thickness measurements at Sites S3 and S4, respectively, demonstrating strong consistency with core-based data.
Jmse 13 00702 g008
Figure 9. Correlation fitting results among seamount depth, slope, and crust thickness. (a) Fitting results for slope versus depth exhibit a strong correlation. (b,c) Fitting results for crust thickness with slope and depth, respectively, show slight positive correlations.
Jmse 13 00702 g009
Table 1. Main configurations of the Haima ROV and crust survey equipment.
CategorySpecifications and Performance
Dimensions, Weight, Power
  • Dimensions: 3.45 m (L) × 2.1 m (W) × 2.63 m (H)
  • Weight: 5.6 t
  • Power: 150 hp
Underwater Lighting
  • 24 VDC LED lamps (8 channels)
  • 220 VAC HMI high-intensity lamps (2 channels)
Auxiliary Sensors
  • cNODE Mini 16-180-St USBL beacon (1 unit)
  • Tritech Gemini 720is Forward looking sonar (1 unit)
  • Kongsberg 1007 altimeter (1 unit)
  • Depth sensor (1 unit)
  • Gyrocompass (1 unit)
Underwater Cameras
  • 1-channel 4K UHD video (ILCE-7RM2 model)
  • 3-channel 1080i HD video (wide-angle, zoom)
  • 8-channel standard video
  • Gimbal systems (2 units: electric/hydraulic)
Manipulation System and Chassis
  • Titan 4 7-function manipulator (max. lifting capacity: 454 kg; max. reach: 1922 mm)
  • RigMaster2 5-function manipulator (max. lifting capacity: 270 kg; max. reach: 1372 mm)
  • Heavy-duty claw (1 unit)
  • Sampling basket chassis (1 unit)
  • Hydraulic cutting machine (1 unit)
Drilling System
  • 1.5 m subsea drilling system (1 set)
  • 1.5 m sediment coring system (1 set)
Acoustic Detection SystemAcoustic crust thickness gauge (1 set): Nonlinear parametric array (primary frequency: 1 MHz, difference frequency: 100 kHz)
Table 2. Comparison of acoustic measurements of crust thickness with actual thickness in the core.
SiteCrust Thickness (cm)Acoustic Crust Thickness (cm)Min. RESlope (°)Depth (m)
Velocity: 2500 m/sVelocity: 3000 m/sVelocity: 3500 m/s
S110.0////3.12046.3
S20////5.02192.1
S315.013.816.519.38.0%6.92307.0
S414.013.416.118.74.3%10.02682.8
S57.0////12.53095.0
Table 3. Comparative analysis of typical deep-sea fine-scale survey platforms.
PlatformOperational ModeAdvantagesLimitations
ROVTethered, free navigation, bottom landingExtended operational duration (>12 h), high power capacity, superior modular expandability, high maneuverability in localized areas, real-time data transmission; capable of deploying heavy drilling rigsHigh dependency on support vessels, limited operational depth range, constrained survey coverage (expanded via vessel mobility)
HOVUntethered, free navigation, bottom landingExceptional maneuverability, full ocean depth capability, real-time human-in-the-loop controlLimited mission duration (8–12 h), restricted survey coverage, elevated personnel safety risks, insufficient power capacity for heavy drilling equipment
AUVUntethered, autonomous navigationHigh maneuverability, operational stability, support for swarm collaboration, low dependency on support vesselsShort mission duration (hours to days), frequent recovery requirements, delayed data retrieval; limited to acoustic/optical/chemical sensors, incapable of heavy equipment deployment
DTSTethered, towed navigationMost extended operational duration, real-time data transmission, centimeter-level positioning accuracyPoor maneuverability (large turning radius), sensitivity to platform dynamics; restricted to acoustic/optical/chemical sensors, incapable of heavy equipment deployment
Disclaimer/Publisher’s Note: The statements, opinions and data contained in all publications are solely those of the individual author(s) and contributor(s) and not of MDPI and/or the editor(s). MDPI and/or the editor(s) disclaim responsibility for any injury to people or property resulting from any ideas, methods, instructions or products referred to in the content.

