
Deterioration of Protective Coating on Steel Structures in Harbor Attacked via Water and Sediment Erosion


Abstract
1. Introduction
2. Experimental Procedure
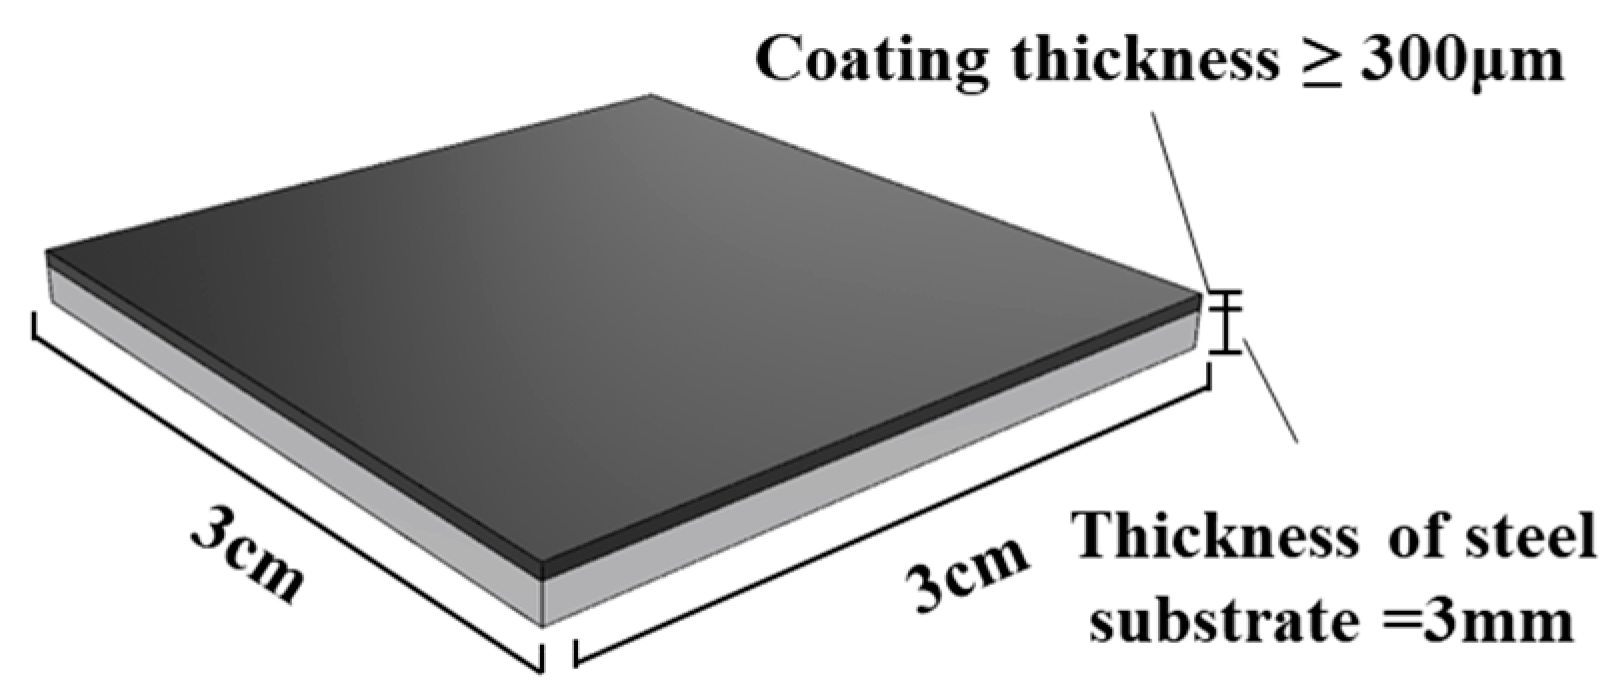
2.1. Experiment Object
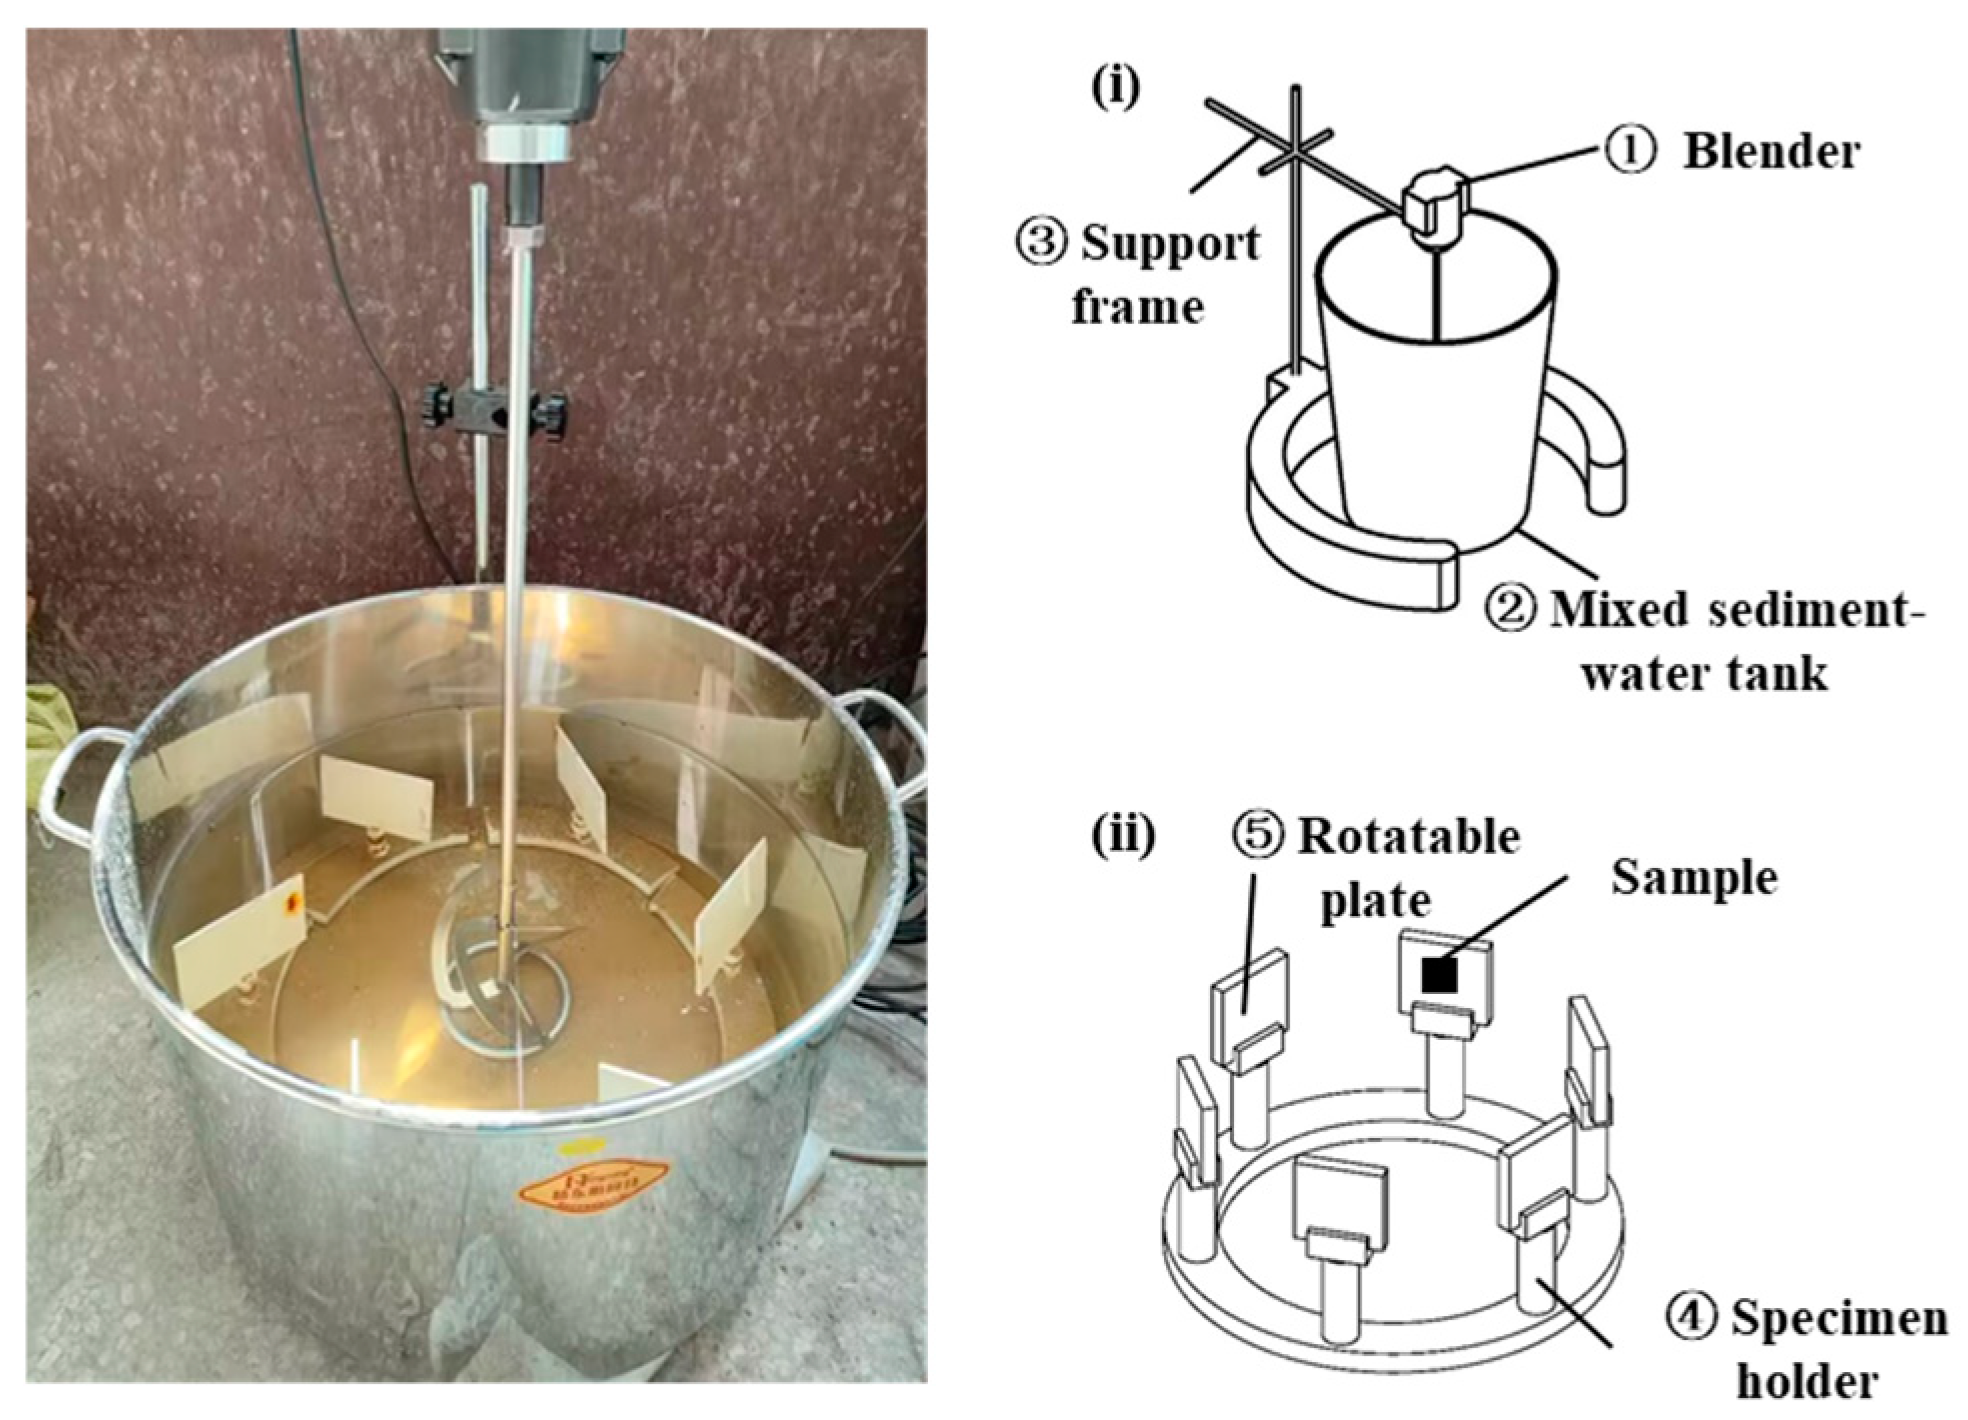
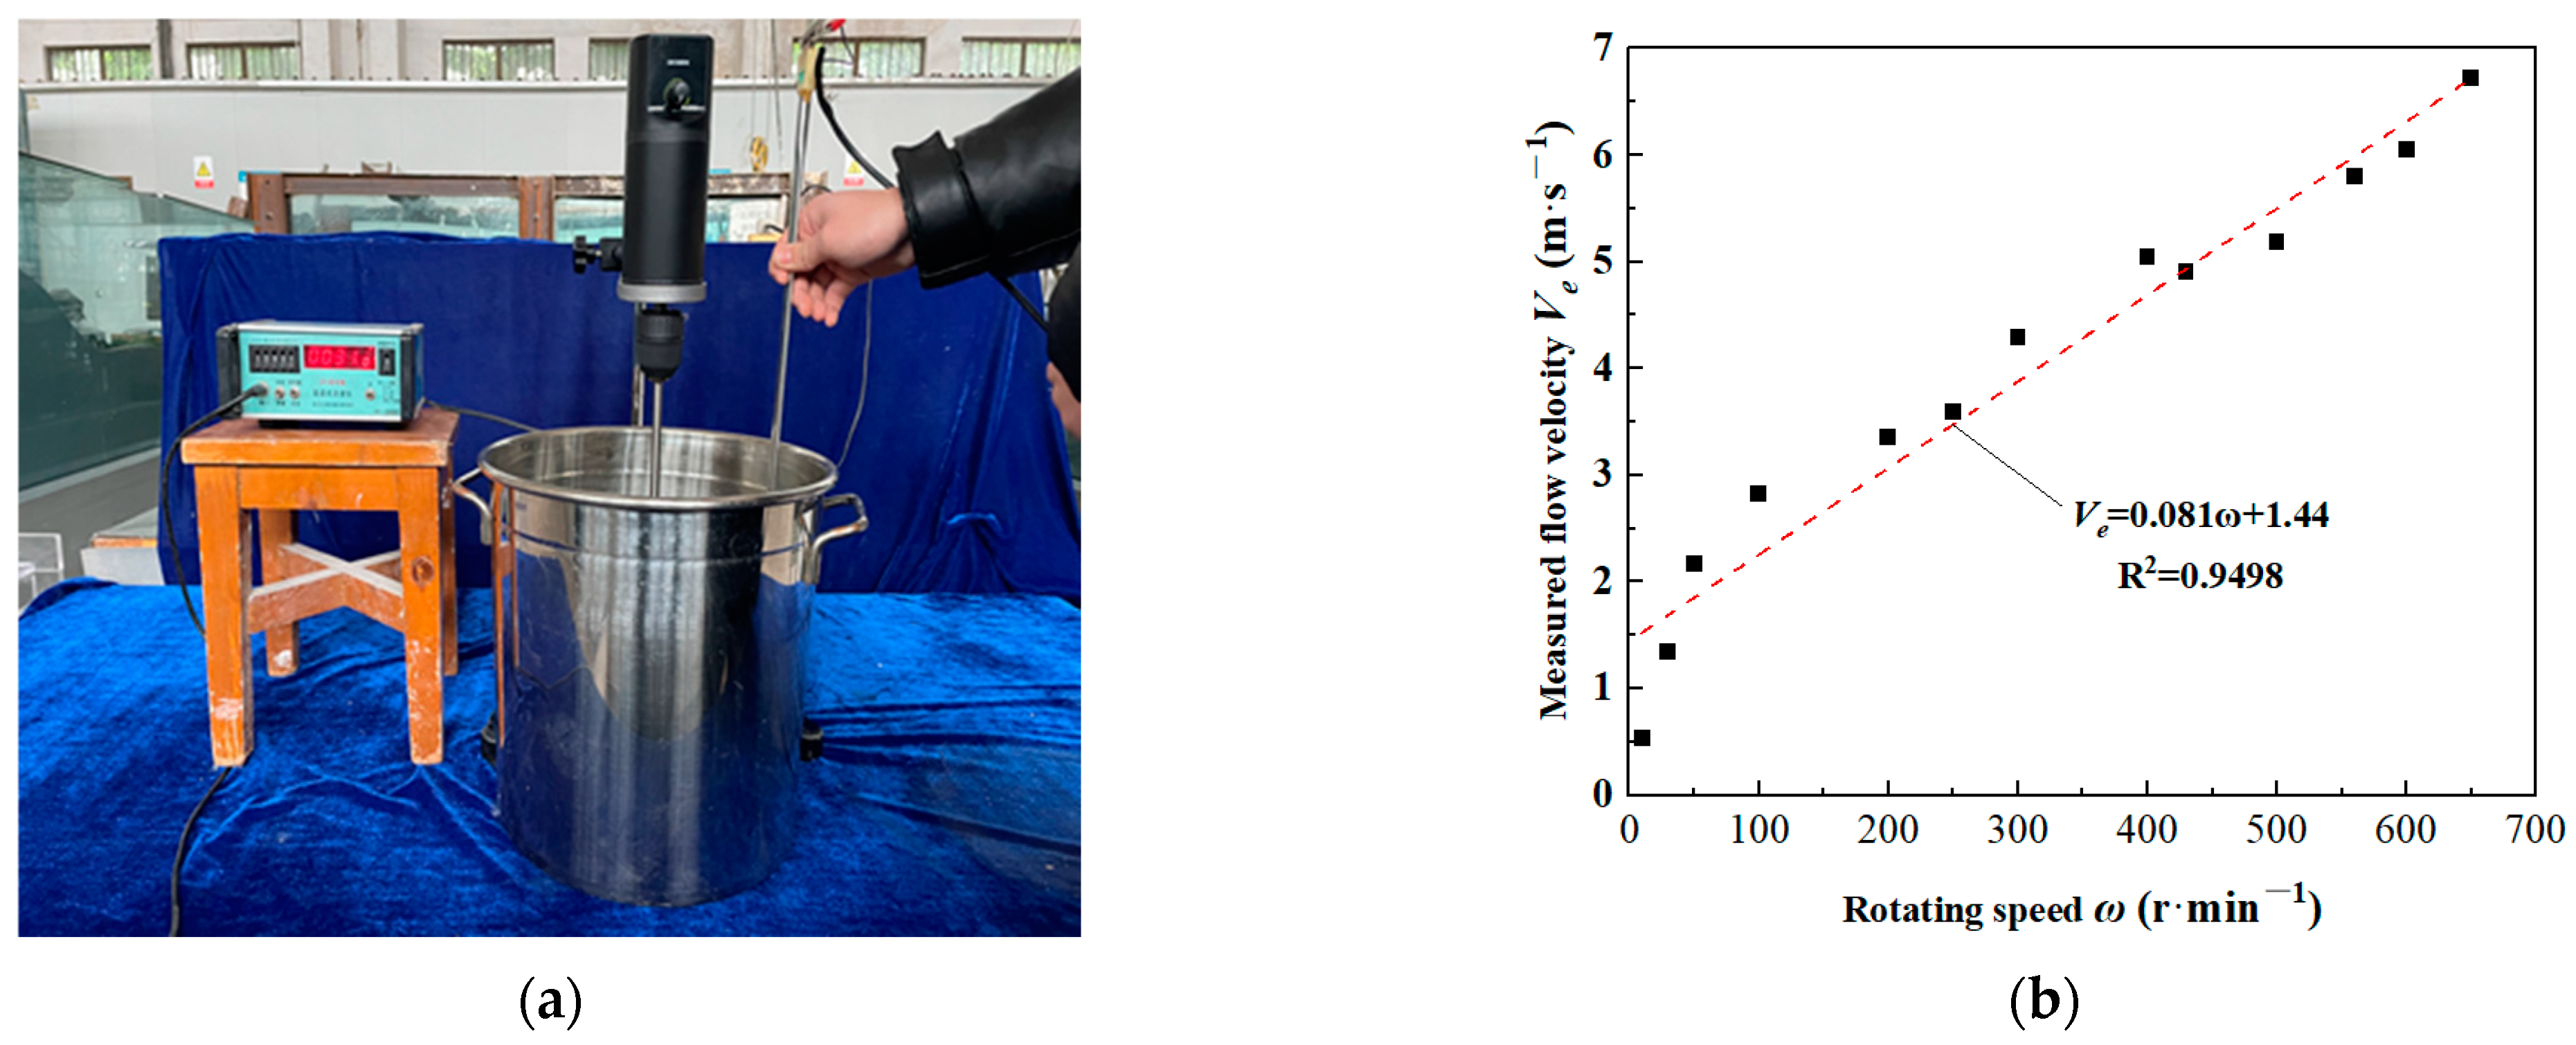
2.2. Testing Device
2.3. Test Conditions
2.4. Coating Damage Indicators
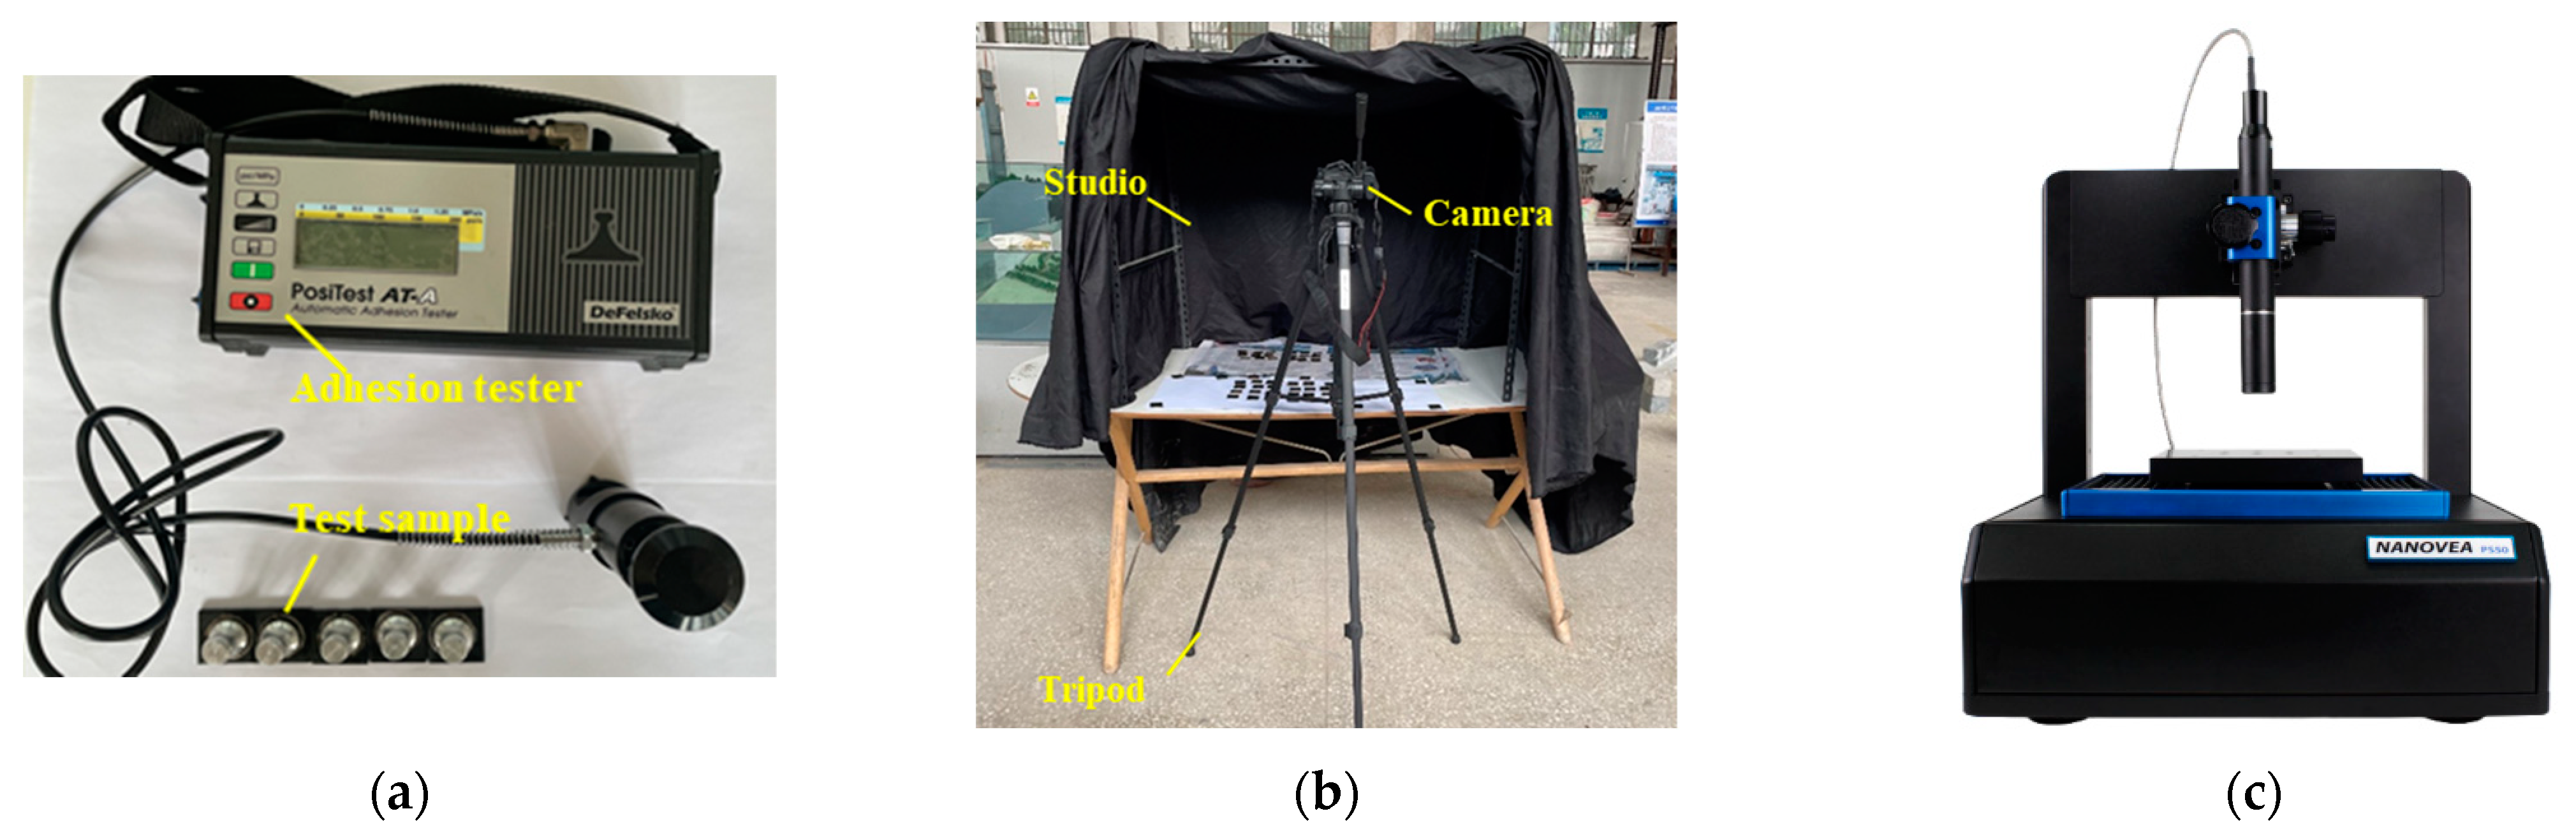
2.4.1. Adhesion
2.4.2. Damage Characteristic Values
- (1)
- Damage rate
- (2)
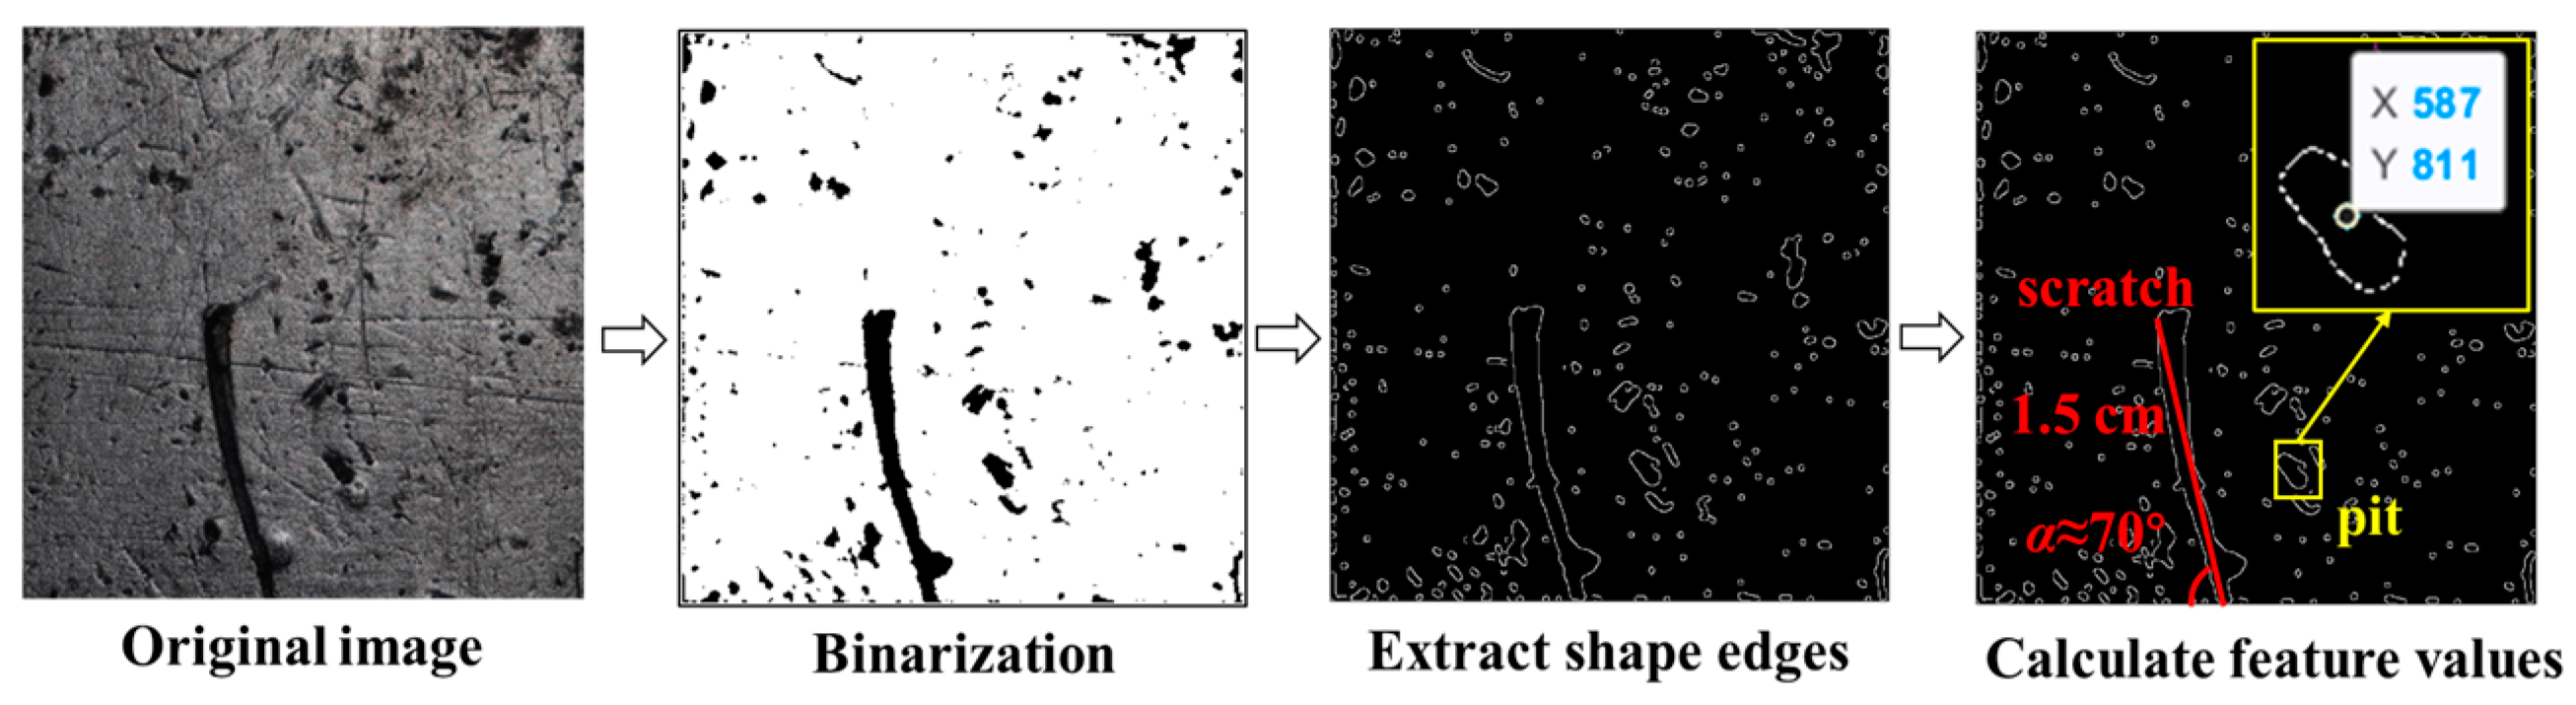
- Scratch and pit feature extraction
- (1)
- Scratch length and angle calculation
- (2)
- Pit diameter and centroid coordinates calculation
- (3)
- Erosion depth
3. Results and Discussion
3.1. Change Pattern of Erosion Adhesion of Protective Coating
3.2. Morphological Damage Characteristics of Protective Coating
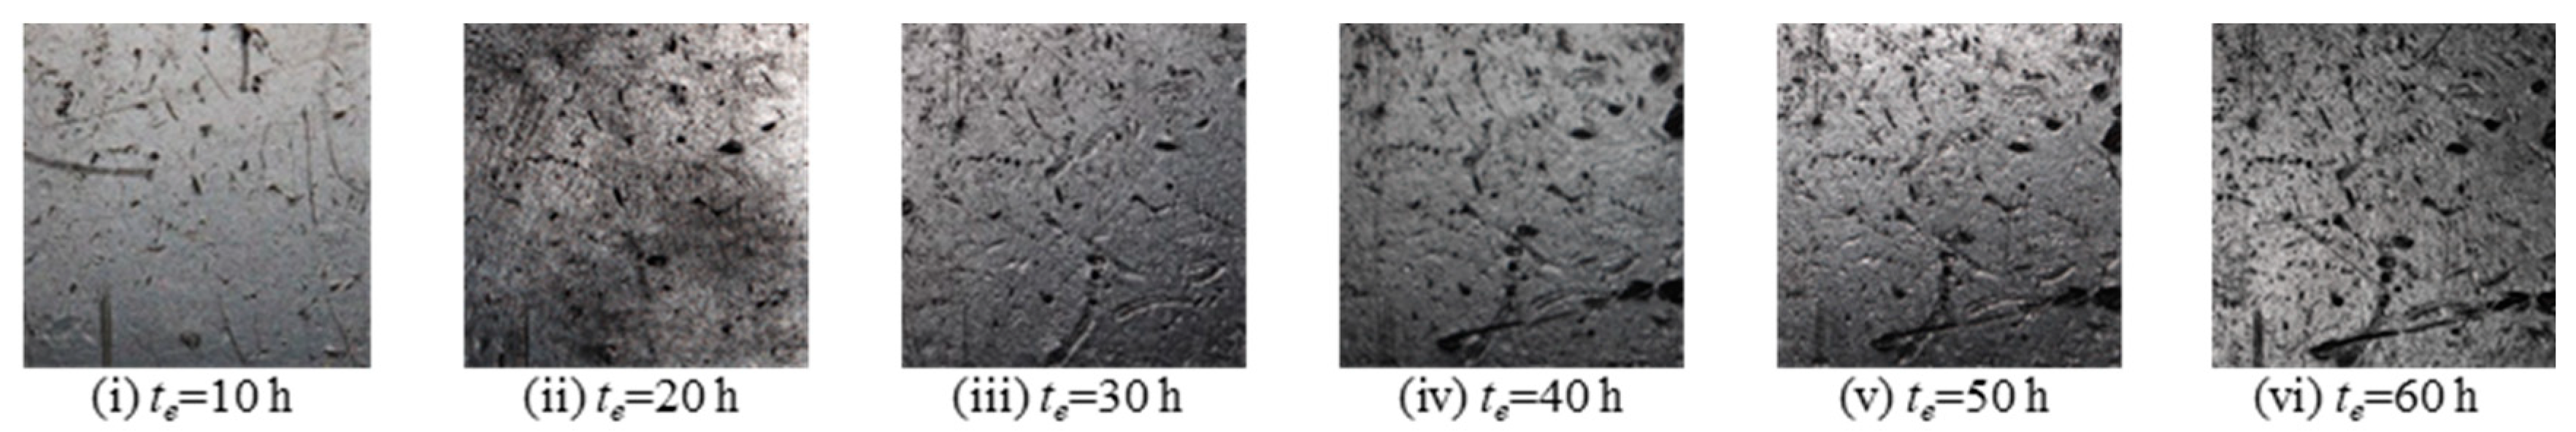
3.2.1. Morphological Damage Process
3.2.2. Damage Rate
- (1)
- Damage rate increment change
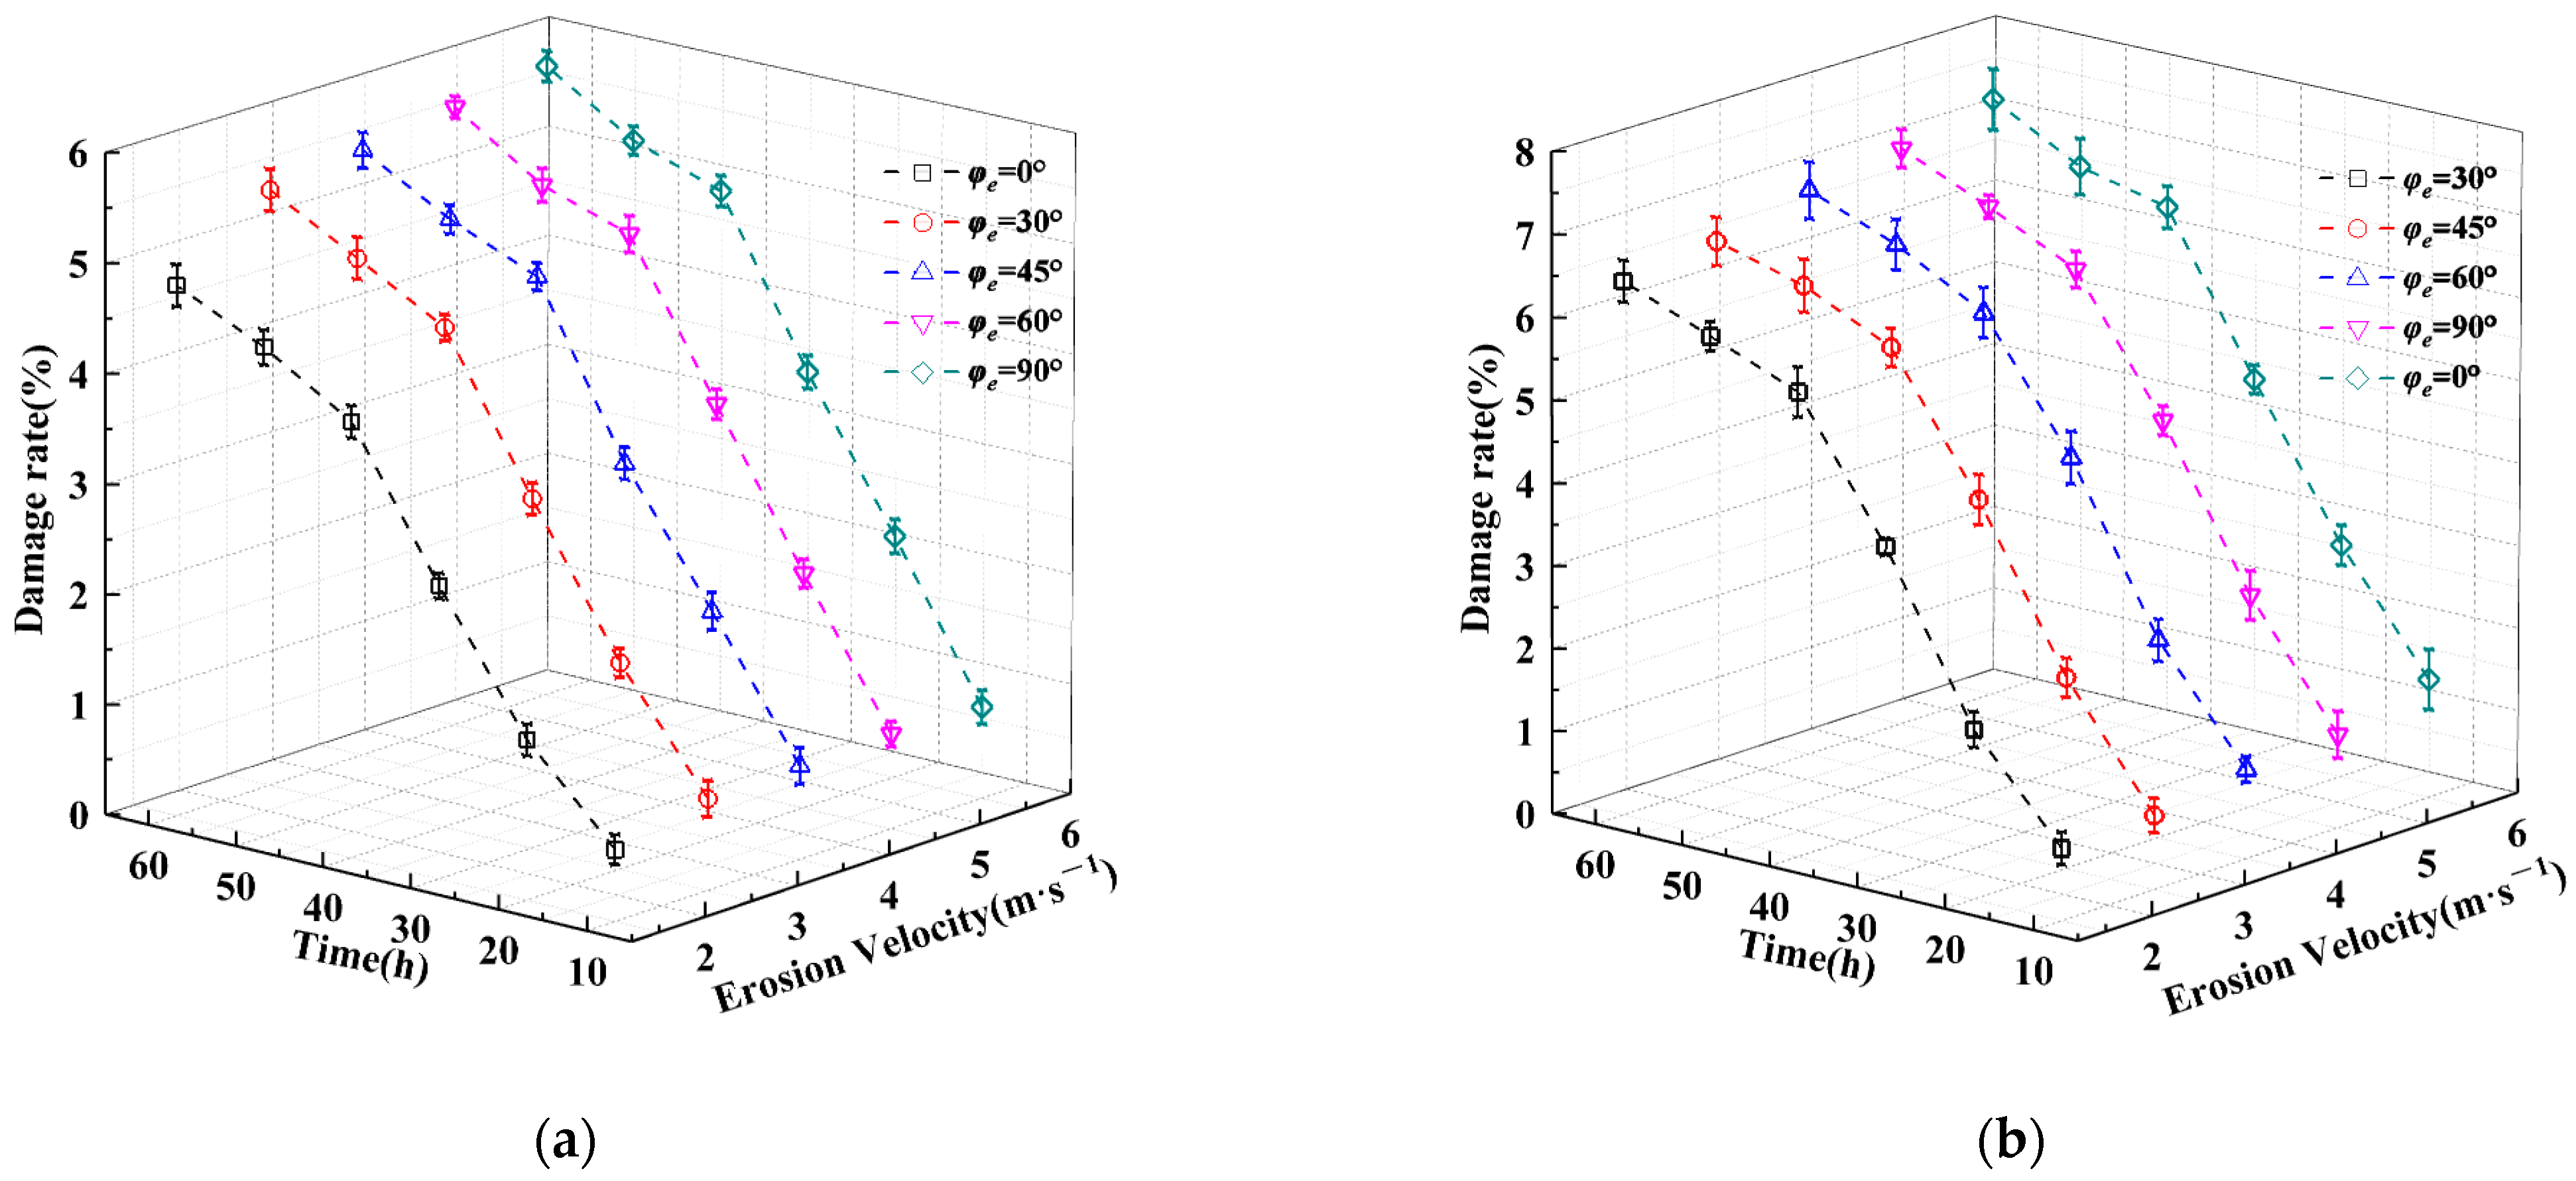
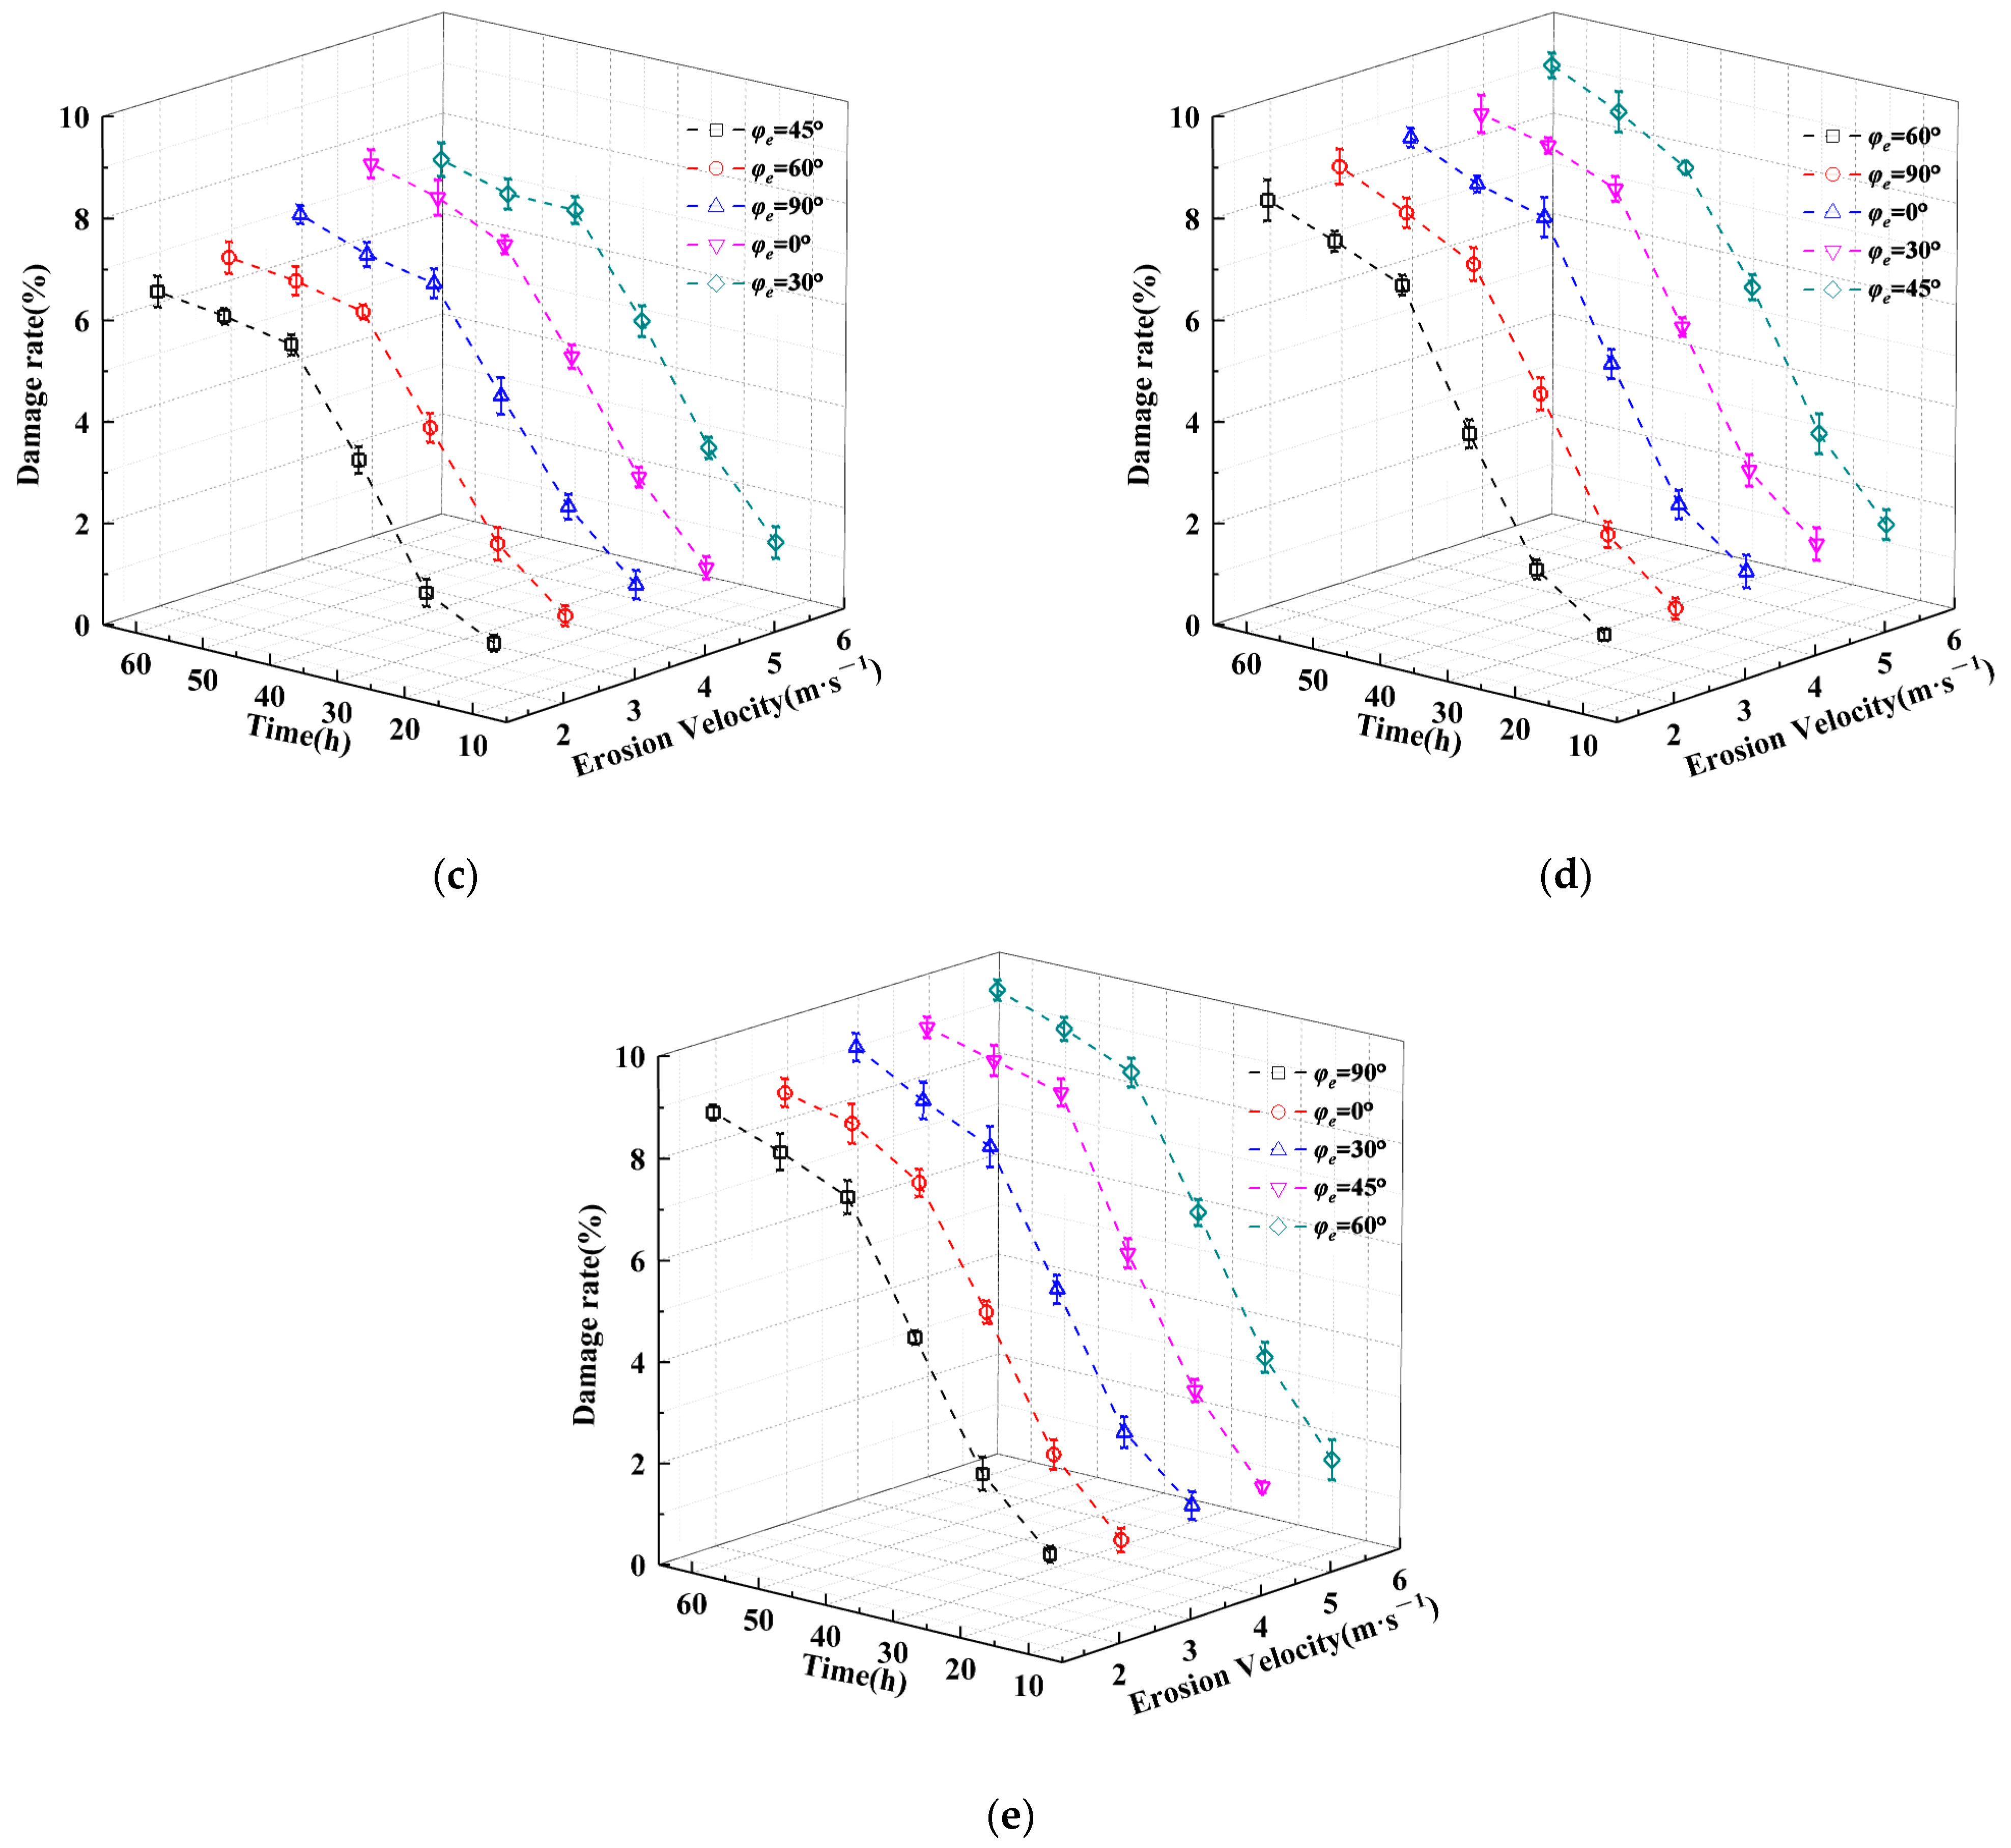
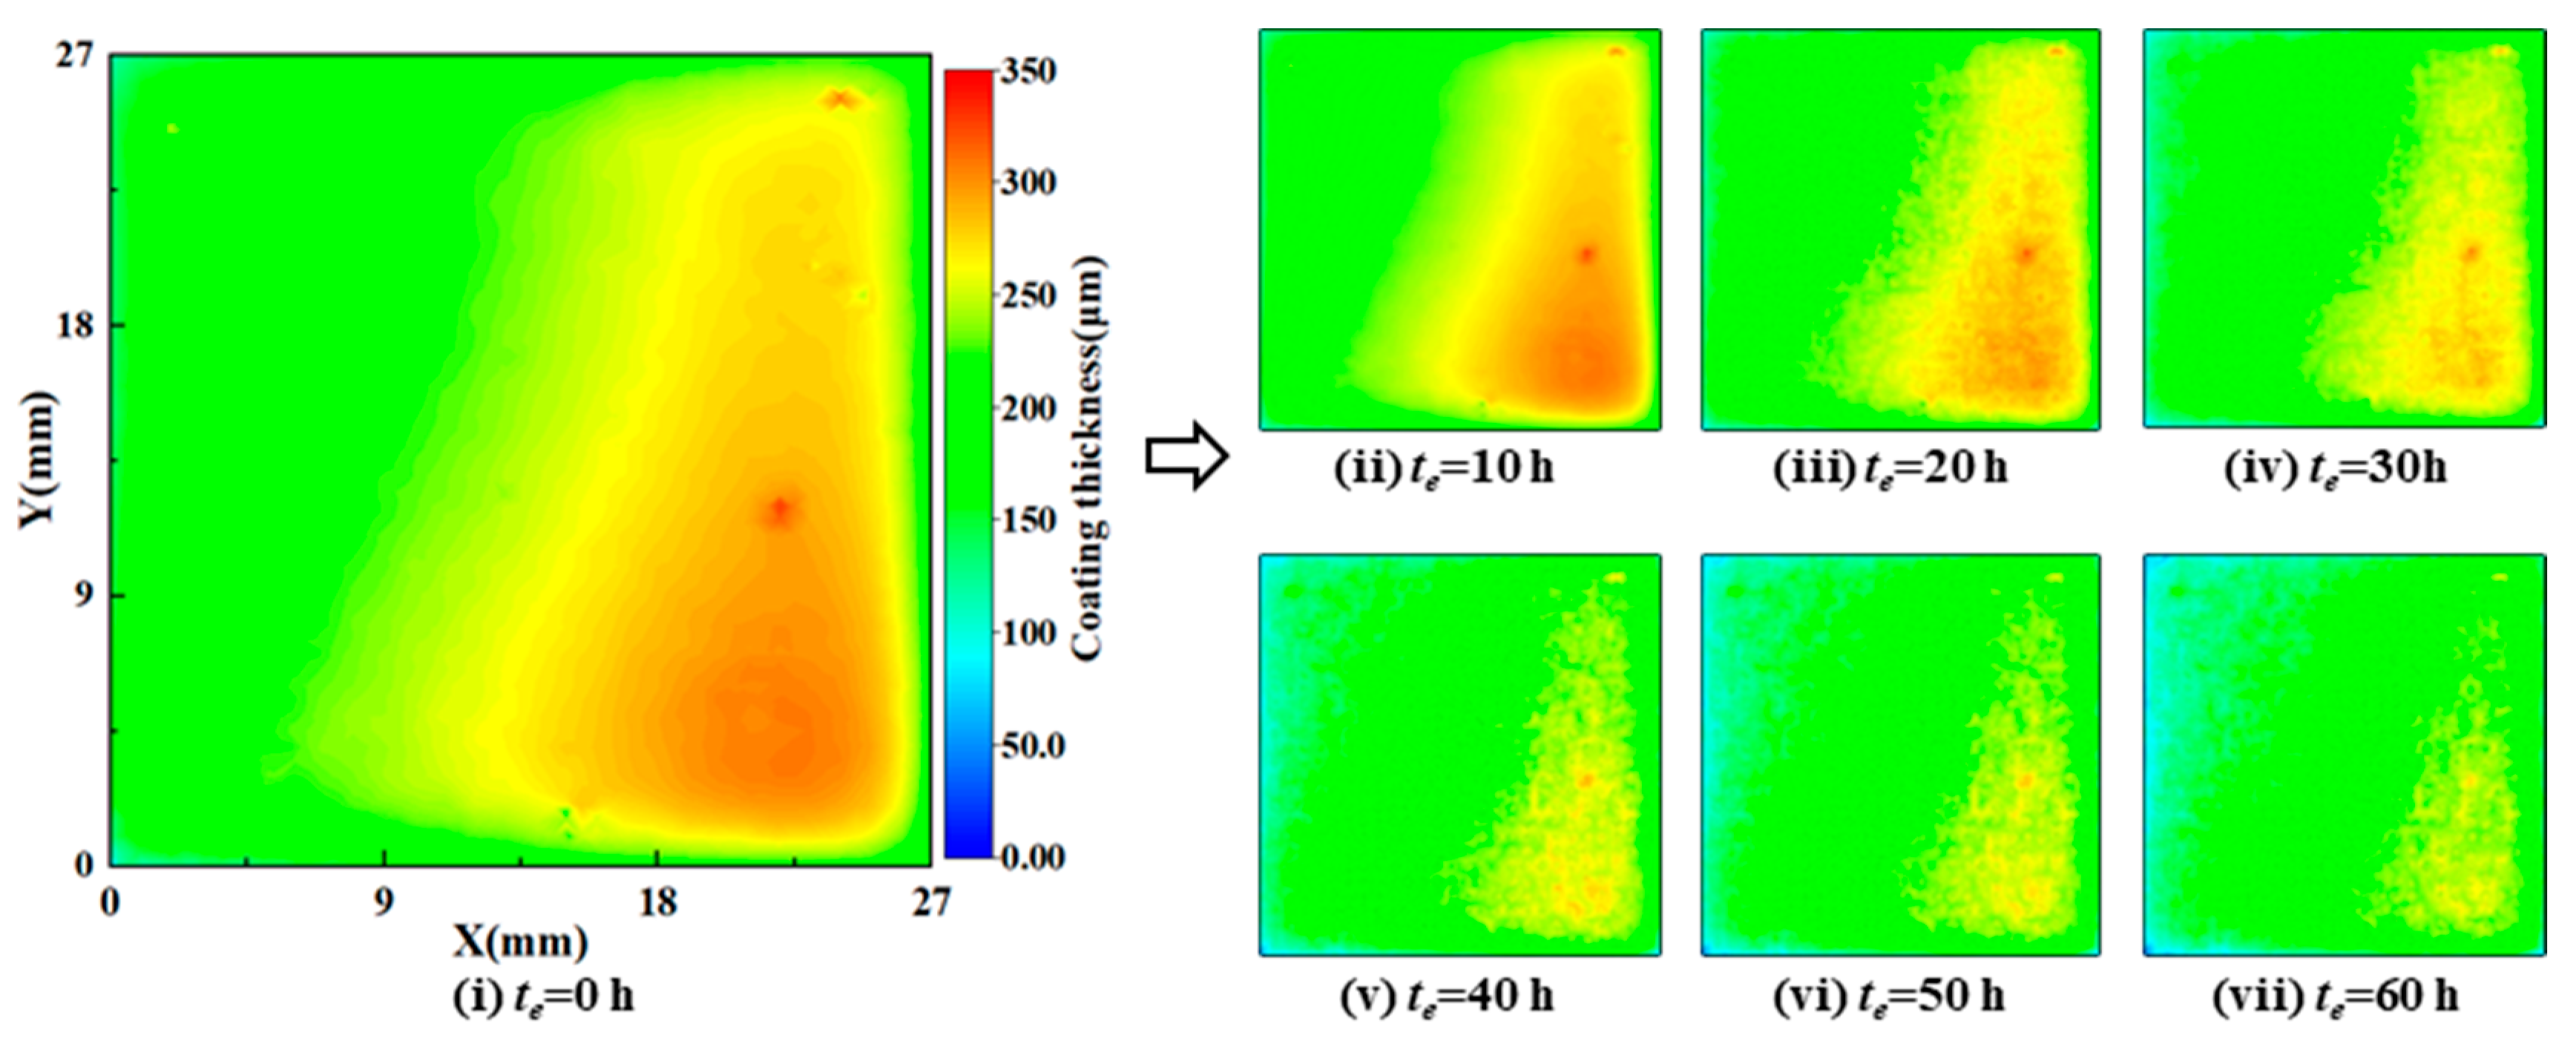
- In the early stage of erosion, the erosion damage area is small and mainly local damage, and a large number of pinholes appear on the surface of the specimen. As the erosion time increases, the damage area increases, and the local erosion areas gradually connect into one piece, indicating that the damage of the coating starts with local erosion and gradually extends to the entire surface, with surface damage characteristics of both scratches and pits;
- As the sediment concentration and erosion velocity increase, the surface damage rate of the coating becomes larger and larger, with a maximum of 9.8%. When the sediment concentration is in the range of 5 kg/m3 to 10 kg/m3, the damage rate gradually increases with the increase in erosion velocity under the condition of fixed sediment concentration. When the sediment concentration is in the range of 20 kg/m3 to 40 kg/m3, the damage rate does not change significantly with the increase in erosion velocity under the condition of fixed sediment concentration, indicating that the greater the sediment concentration, the smaller the impact of erosion velocity and erosion angle on the damage rate;
- Under the condition of certain sediment concentration and erosion velocity, the change trend of the damage rate of the protective coating of steel components with erosion time approximately presents a logarithmic function relationship.
- (2)
- Damage rate signal-to-noise ratio
3.2.3. Scratch Characteristic Values
3.2.4. Pit Characteristic Values
3.3. Variation Patterns in Erosion Depth
3.3.1. Erosion Depth Change Process
- (1)
- As the erosion time increases, the erosion depth increases, the uniform erosion component increases, and the local erosion areas gradually connect into one piece, with the erosion becoming more and more uniform;
- (2)
- The erosion depth is randomly distributed along each direction of the specimen surface. It is necessary to analyze the distribution law of the erosion depth in different directions to better grasp the distribution law of the erosion depth on the surface of steel components.
3.3.2. Statistical Analysis of Erosion Depth
- (1)
- As the sediment concentration and erosion velocity increase, the erosion depth of the coating becomes larger and larger, with a maximum of 120 μm. The greater the erosion velocity, the greater the erosion depth of the coating;
- (2)
- Under the condition of certain sediment concentration and erosion velocity, the change trend of the erosion depth of the protective coating of steel components with erosion time approximately presents a logarithmic function relationship.
3.4. Mathematical Relationship of Damage Indicators
4. Conclusions
- (1)
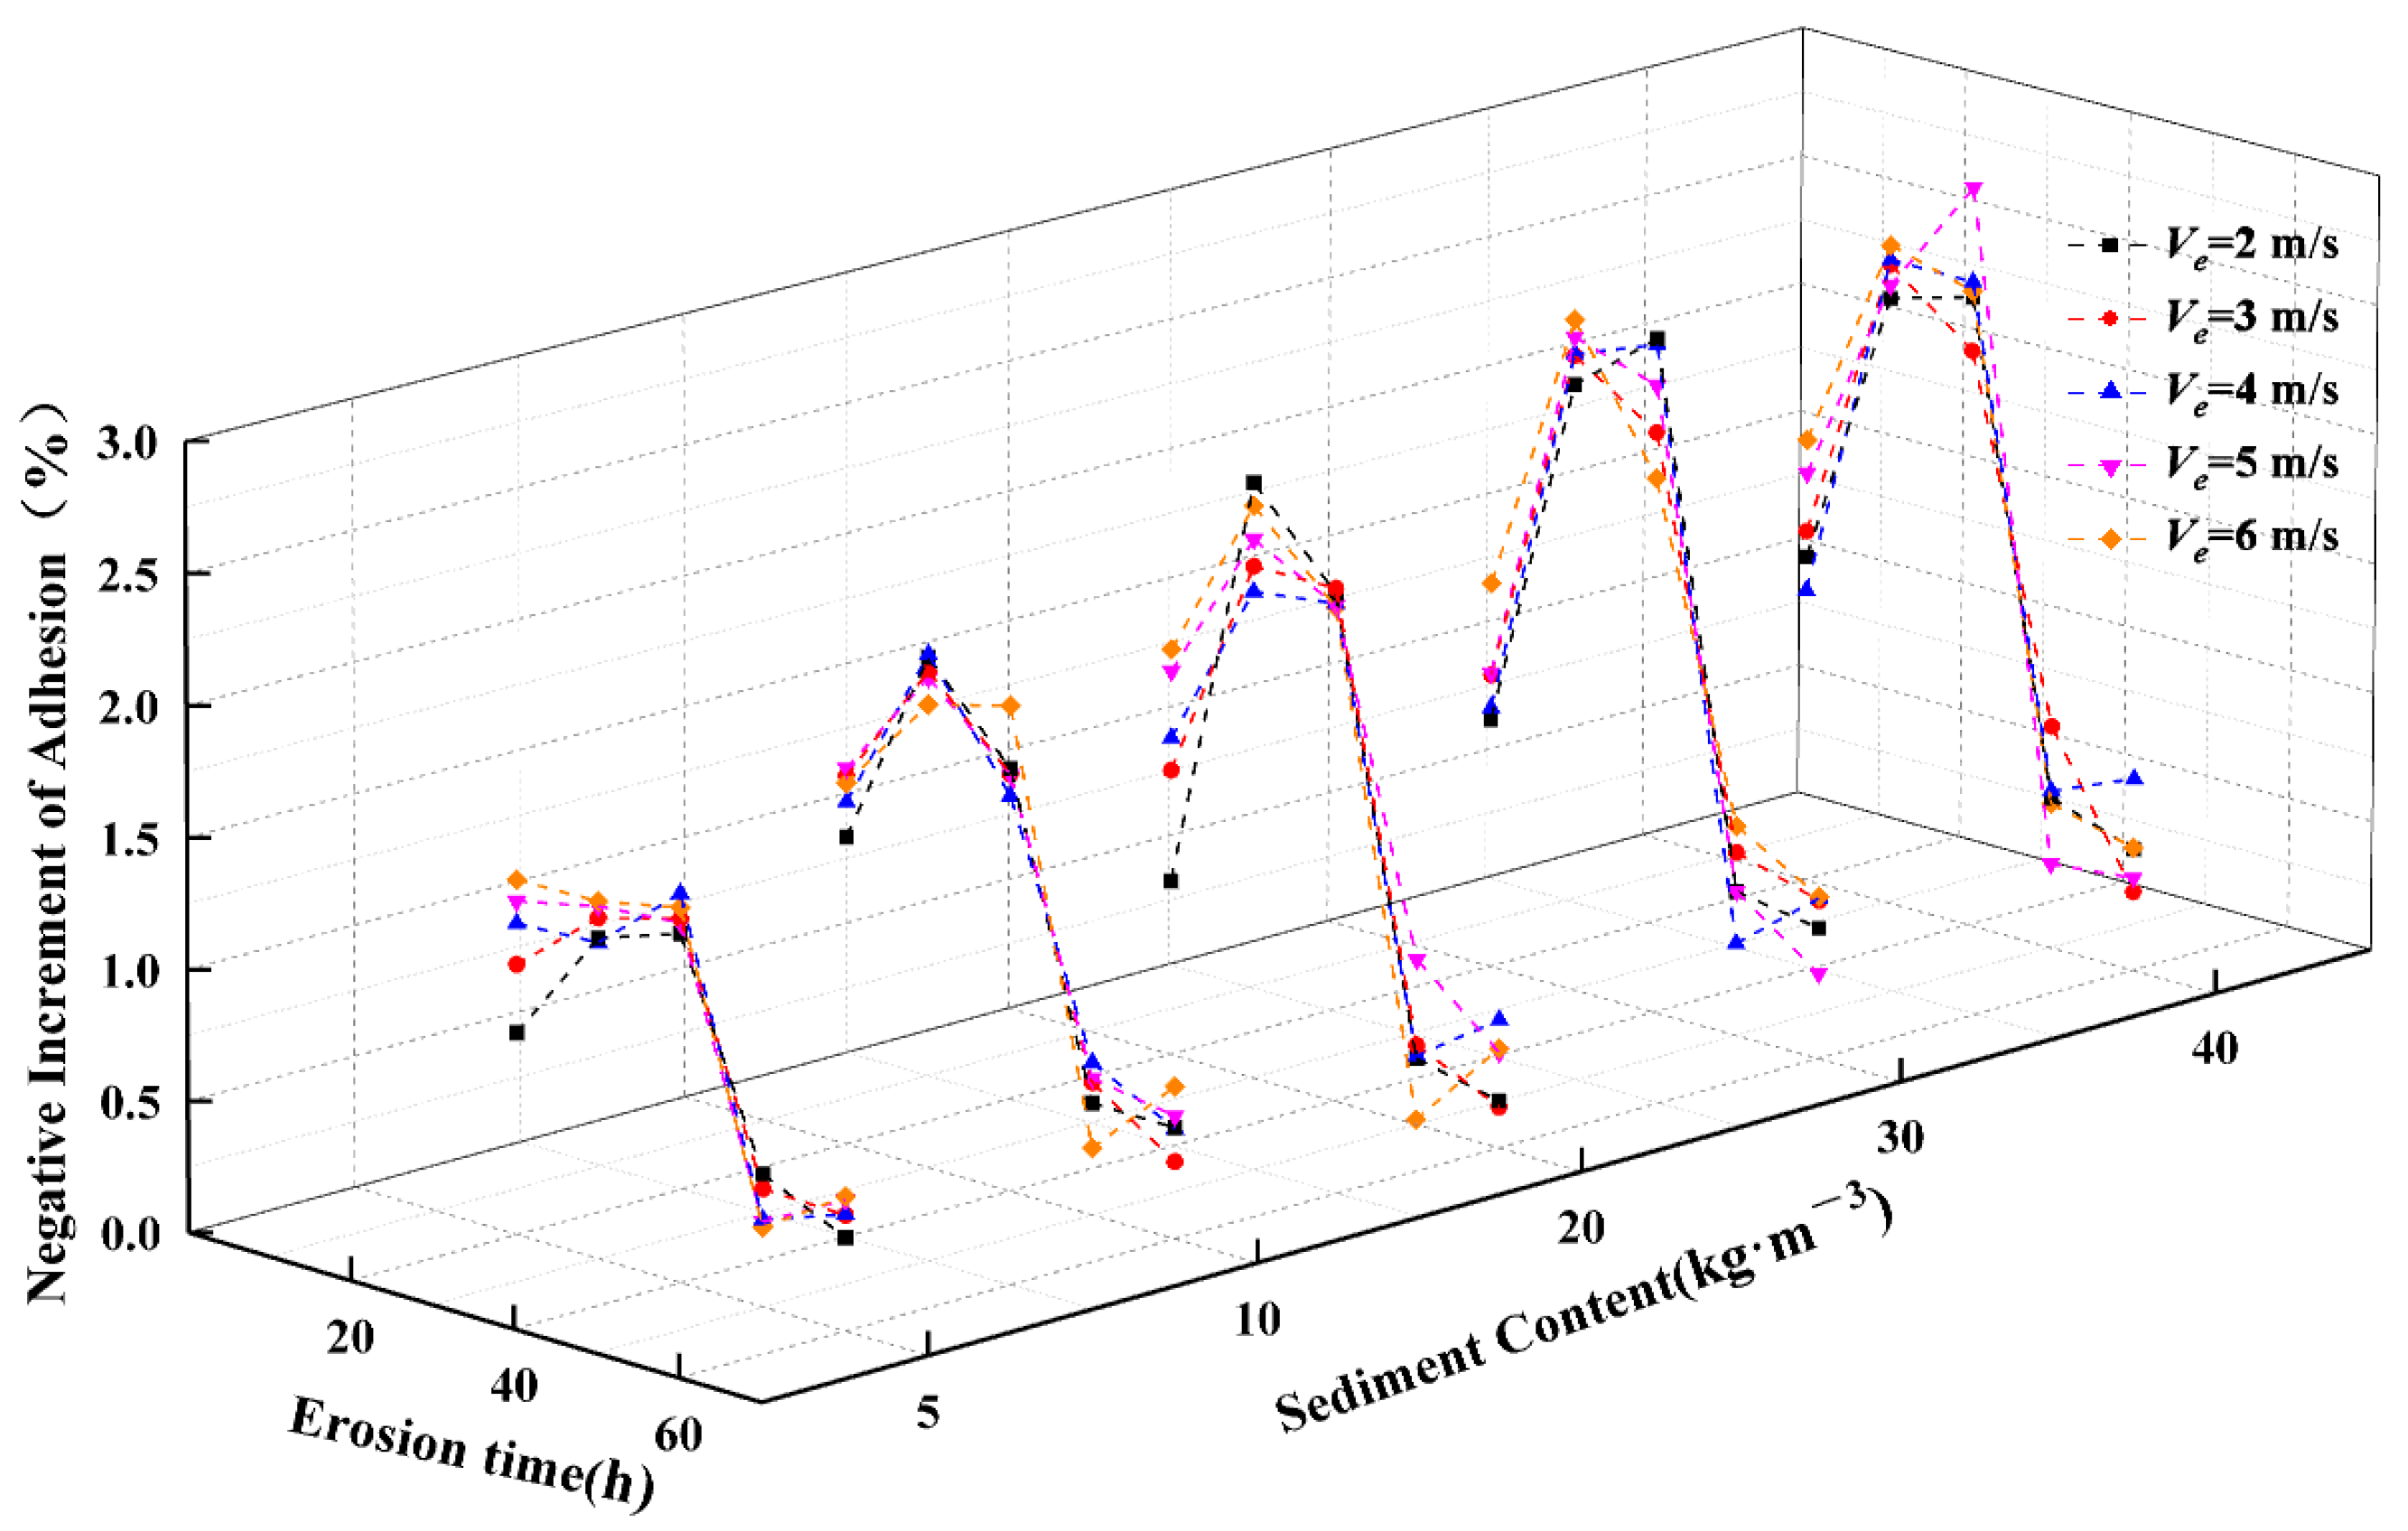
- Under different working conditions, the erosion adhesion of the protective coating of steel components decreases rapidly at first and then slowly with time. In the early stage of erosion, sediment particles are prone to form defects such as scratches and pits on the surface of the protective coating, resulting in a large surface roughness of the coating, and the adhesion changes more obviously at this time. However, as time goes by, the damage on the surface of the coating becomes more and more uniform, so the adhesion does not change significantly, and the negative increment of adhesion becomes smaller;
- (2)
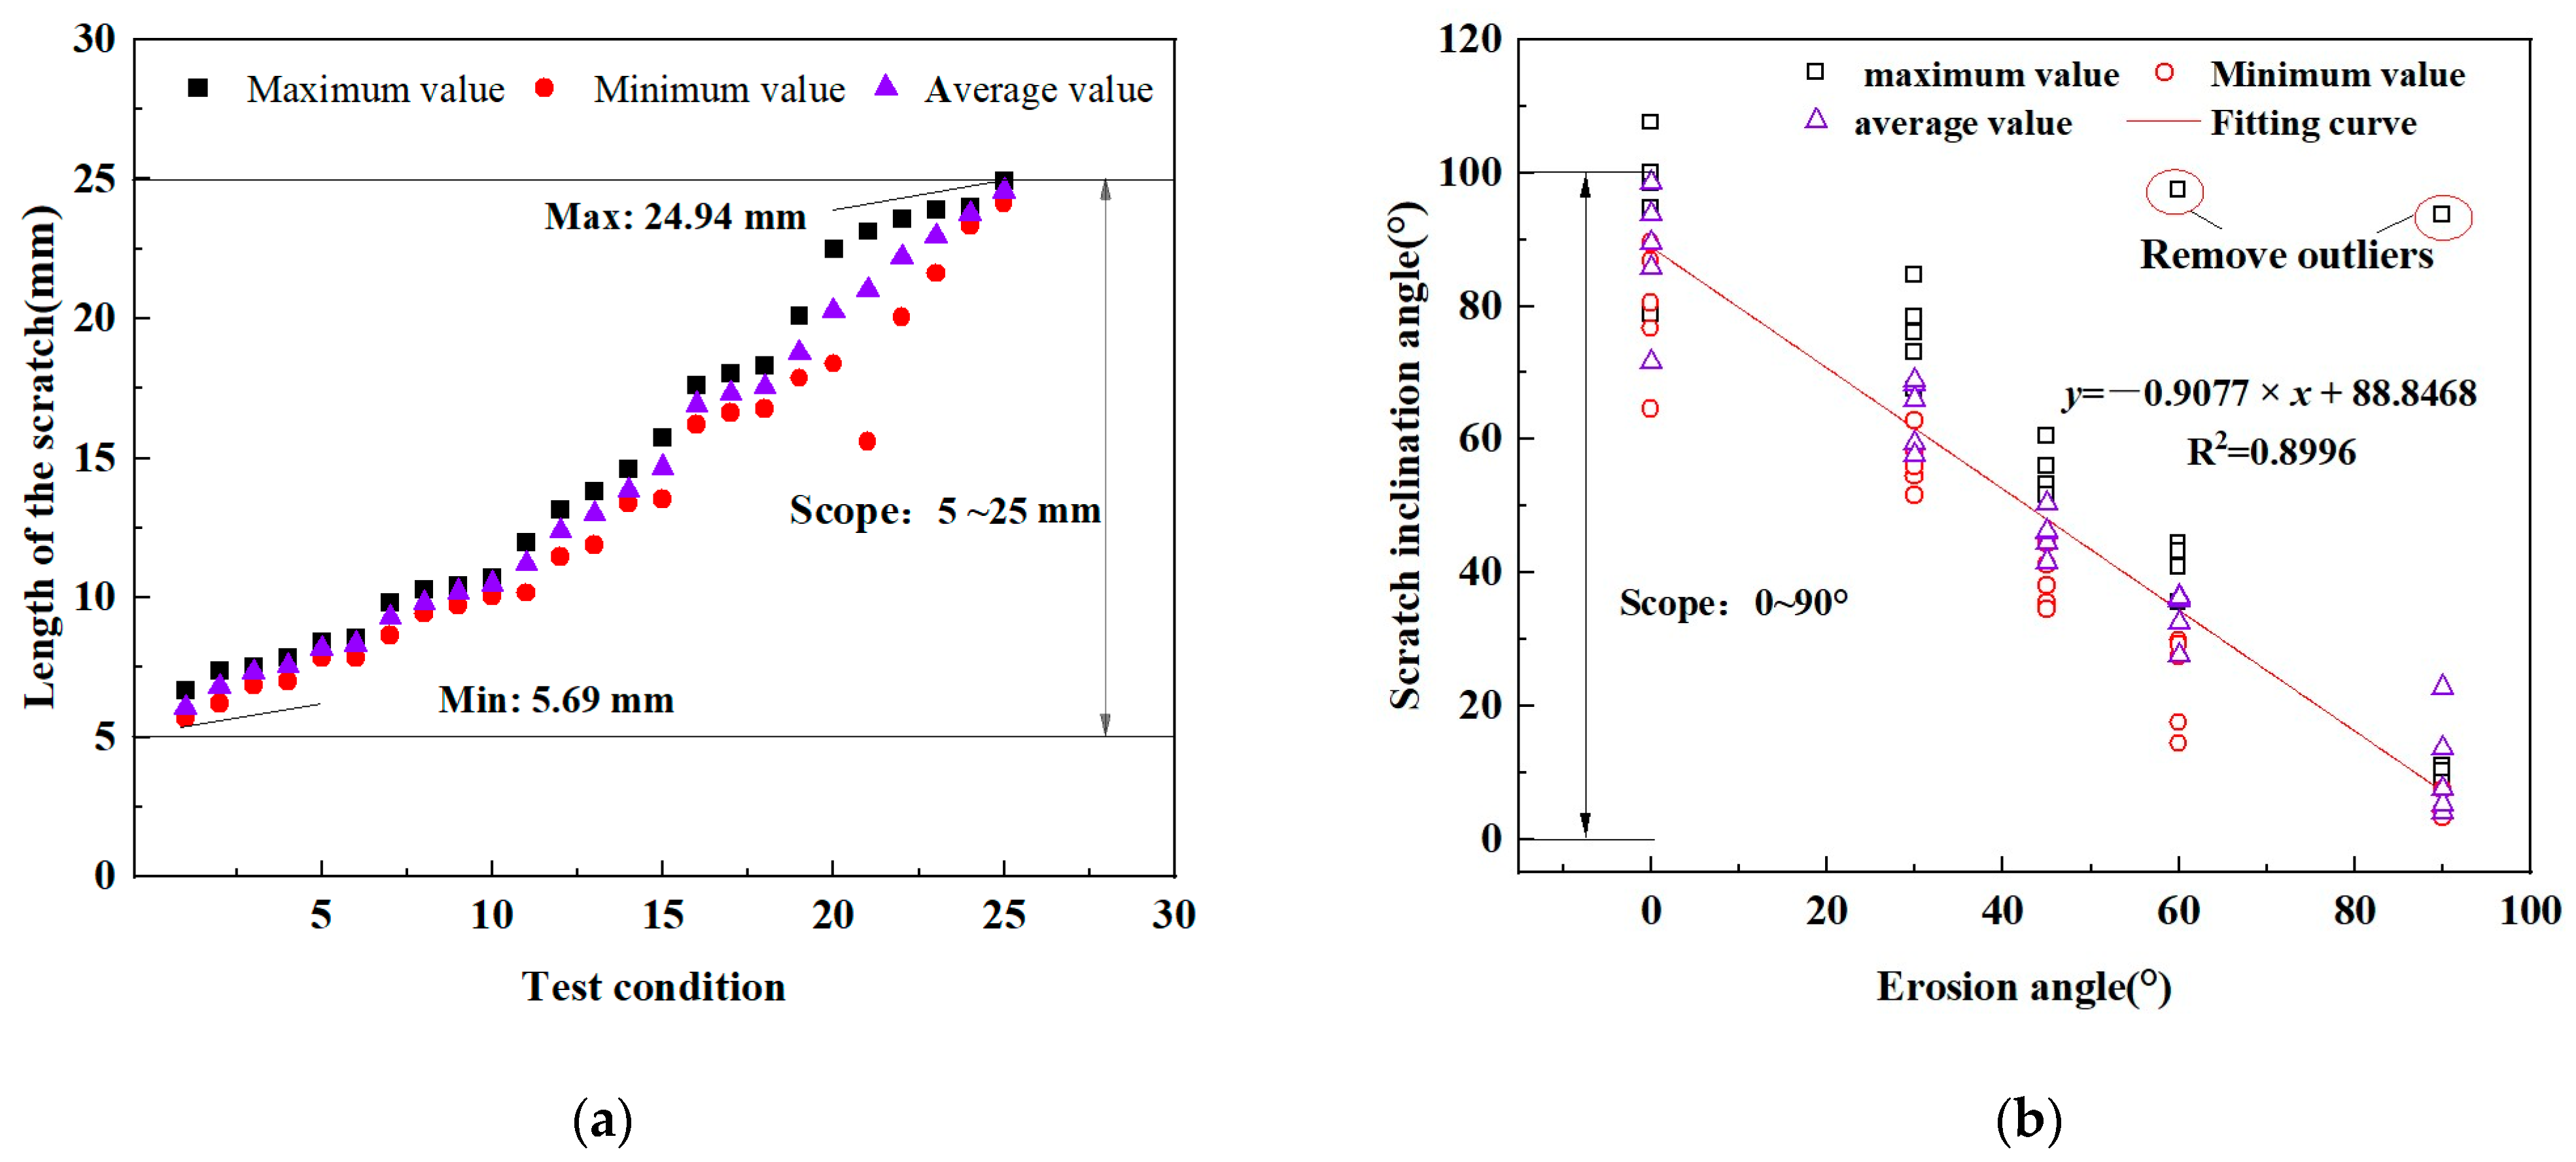
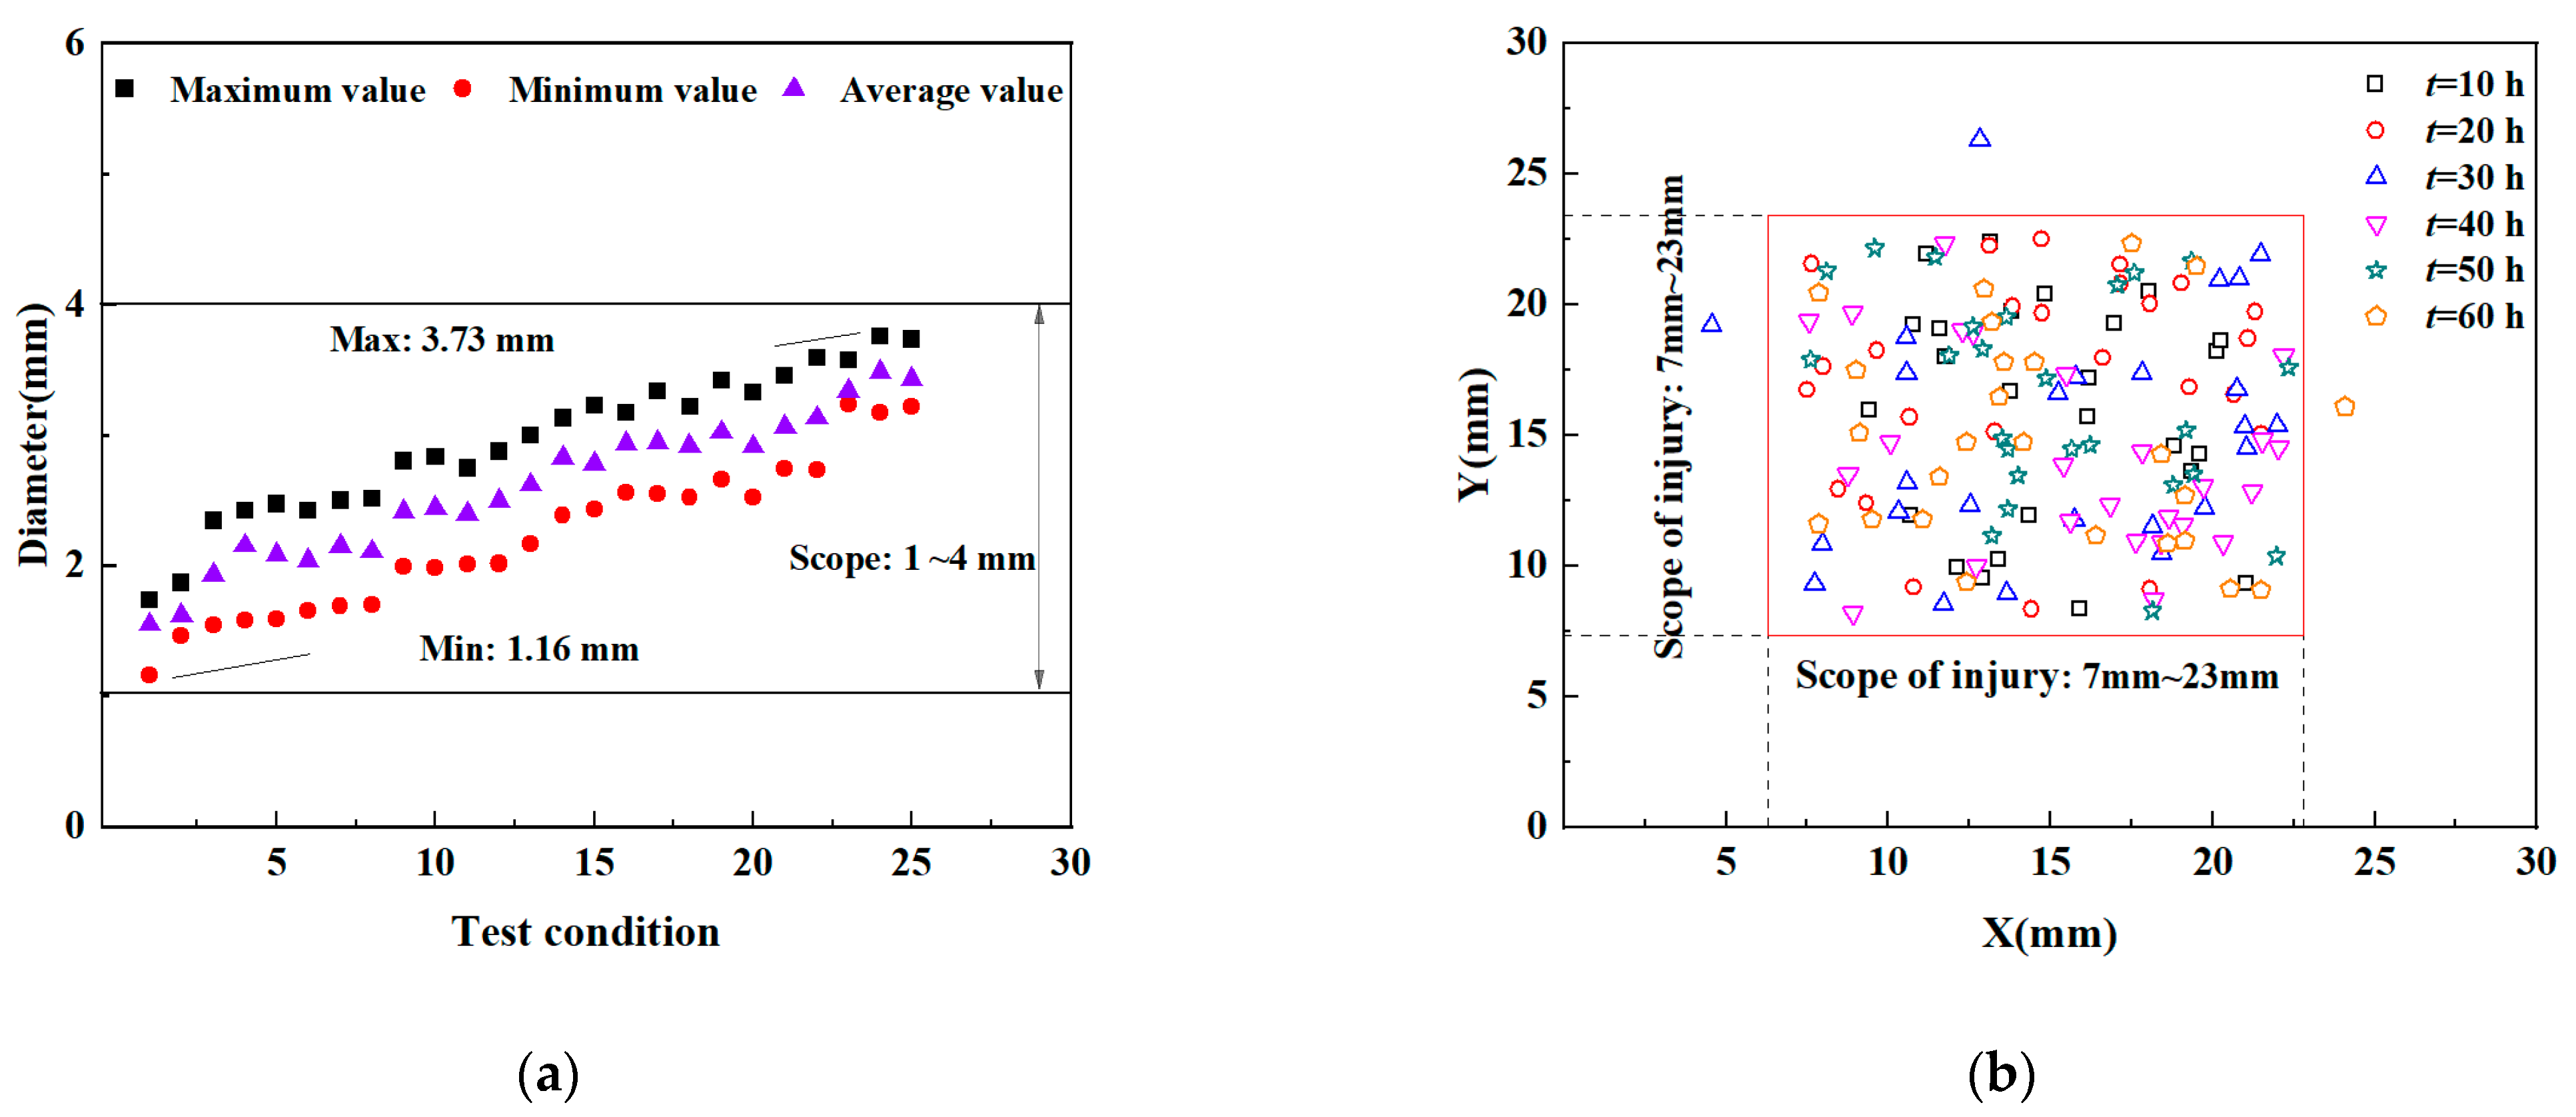
- In the early stage of erosion, the erosion damage area is small and mainly local damage, and a large number of pinholes appear on the surface of the specimen. As the erosion time increases, the damage of the coating starts with local erosion and gradually extends to the entire surface, with surface damage characteristics of both scratches and pits. Under the condition of certain sediment concentration and erosion velocity, the change trend of the damage rate with erosion time approximately presents a logarithmic function relationship, and the maximum damage rate can reach 9.8%. The sediment concentration has the greatest impact on the damage rate, followed by erosion velocity, and the erosion angle has the least impact on the coating damage. The characteristic values of scratch length under each working condition range from 5 mm to 25 mm, and the characteristic values of scratch inclination angle range from 0° to 90°; the characteristic values of pit diameter under each working condition range from 1 mm to 4 mm; and the area with the highest frequency of occurrence is within the range of 1.6 cm × 1.6 cm in the middle of the specimen;
- (3)
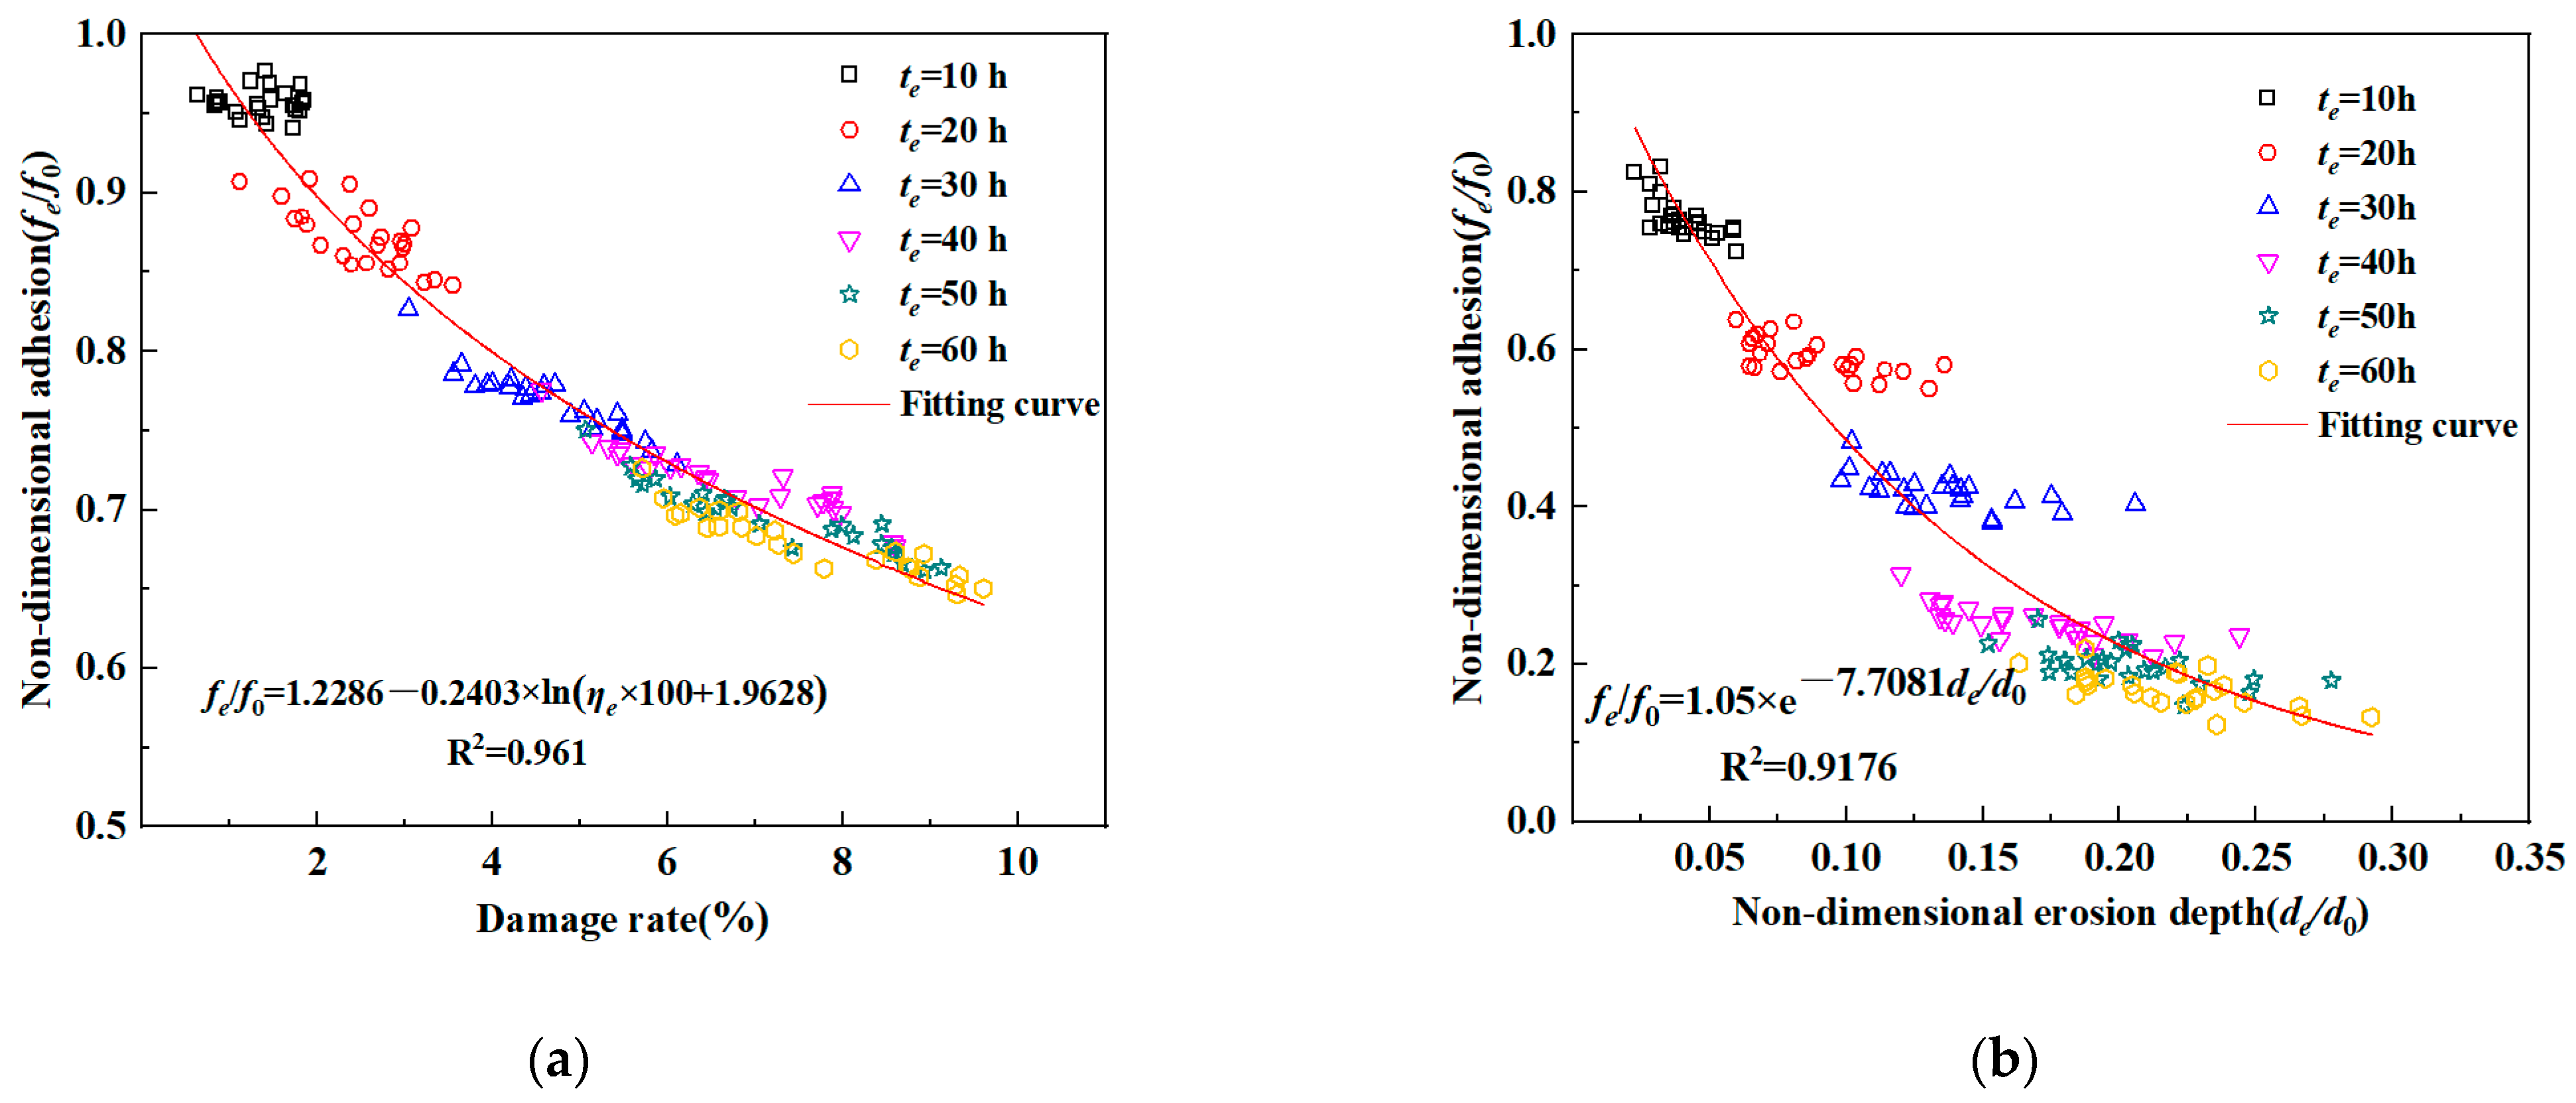
- Based on the erosion test data of the protective coating of steel components, the relationship between adhesion and damage rate, as well as adhesion and erosion depth, was established. It was found that the mean erosion depth and damage rate follow a linear function change law, and the adhesion and damage rate, as well as the adhesion and erosion depth, follow a logarithmic function change trend. The proposed empirical formula can provide a theoretical basis for quantitatively describing the surface defects of a coating.
Author Contributions
Funding
Data Availability Statement
Conflicts of Interest
Nomenclature
| Symbols | |||
| Ve | erosion velocity (m·s−1) | Dti | remaining thickness of the coating at ti hours of erosion (μm) |
| Vn | unit erosion rate (1 m·s−1) | ns | number of test repetitions |
| ω | rotational speed (r·min−1) | ρF | contribution rate of impact factor F |
| ωn | unit rotational speed (1 r·min−1) | n | number of rows in the orthogonal test |
| Se | sediment concentration (kg·m−3) | yi | calculated value of S/N |
| φe | erosion angle (°) | average value of S/N | |
| ηe | damage rate | f | number of levels of impact factor F |
| xi | pixel area of the i-th damaged area | ni | number of tests under the i-th level |
| X | total pixel area of the erosion damage image | average value under each level of impact factor F | |
| li | length of a certain scratch (mm) | fe | measured adhesion (MPa) |
| θi. | scratch inclination angle (°) | f0 | initial adhesion (2 MPa) |
| ri | pit diameter (mm) | d0 | initial erosion depth (350 μm) |
| de | erosion depth (μm) | ||
| Abbreviations | |||
| S/N | signal-to-noise ratio | SSE | sum of squared deviations of error |
| F | impact factor | SST | total sum of squared deviations |
| SSF | sum of squared deviations of impact factor F | ||
References
- Xie, Y.P.; Li, X.H. Influence of the Coupling Effect of Ocean Currents and Waves on the Durability of Pier Structure of Cross-sea Bridges. J. Coastal Res. 2020, 110, 87–90. [Google Scholar]
- Lian, Y.; Zhong, F.; Zheng, J.; Chen, W.; Ma, G.; Wang, S.; Yim, S.C. Effects of Mooring Line with Different Materials on the Dynamic Response of Offshore Floating Wind Turbine. J. Mar. Sci. Eng. 2023, 11, 2302. [Google Scholar] [CrossRef]
- Melchers, R.E.; Tan, M.Y. Long-term corrosion of abandoned offshore steel infrastructure. Corros. Eng. Sci. Technol. 2023, 58, 712–722. [Google Scholar]
- Lin, L.; Wang, F.C. Analytical behavior of concrete-filled steel tubular pile used in coastal wharf structure subjected to combined loads. Ocean. Eng. 2024, 308, 118388. [Google Scholar]
- Laleh, M.; Huo, Y.; Kannan, M.B.; Petersen, R.B.; Melchers, R.E.; Tan, M.Y. Probing and monitoring multiple forms of localised corrosion occurring concurrently on pipeline steels in marine environments. Corros. Sci. 2024, 240, 112453. [Google Scholar]
- Atta, A.M.; Ahmed, M.A.; Tawfek, A.M.; El-Faham, A. Functionalization of Silica with Triazine Hydrazide to Improve Corrosion Protection and Interfacial Adhesion Properties of Epoxy Coating and Steel Substrate. Coatings 2020, 10, 351. [Google Scholar] [CrossRef]
- Momber, A.W.; Langenkämper, D.; Möller, T.; Nattkemper, T.W. The exploration and annotation of large amounts of visual inspection data for protective coating systems on stationary marine steel structures. Ocean. Eng. 2023, 278, 114337. [Google Scholar]
- Shi, Y.; Wei, J.H.; Li, S.W.; Peng, S.T.; Zhang, B.W. Experimental study on containment of moderate-viscous oil by floating boom subject to waves and currents. Appl. Ocean. Res. 2020, 94, 102003. [Google Scholar]
- Li, M.; Zhang, R.; Liu, K.F. A New Marine Disaster Assessment Model Combining Bayesian Network with Information Diffusion. J. Mar. Sci. Eng. 2021, 9, 640. [Google Scholar] [CrossRef]
- Wang, Z.L.; Chen, Y.H.; Zeng, Z.Y.; Li, R.S.; Li, Z.Y.; Li, X.F.; Lai, C.G. Compound effects in complex estuary-ocean interaction region under various combination patterns of storm surge and fluvial floods. Urban. Clim. 2024, 58, 102186. [Google Scholar]
- Nakamura, T.; Nakai, Y.; Cho, Y.H.; Mizutani, N. Modeling Tsunami-Induced Erosion of Bridge-Abutment Backfill. J. Mar. Sci. Eng. 2020, 8, 922. [Google Scholar] [CrossRef]
- Liang, S.L.; Duan, L.L.; Geng, B.; Liu, Z.; Fan, M.L.; Wu, Y.H.; Tang, Y.; Zahid, A. Numerical investigation on erosion characteristics of elevated pile cap in high concentration sediment flow environment. Wear 2025, 562, 205646. [Google Scholar] [CrossRef]
- Behera, N.; Medabalimi, S.; Ramesh, M.R. Effect of Impact Angles and Temperatures on the Solid Particle Erosion Behavior of HVOF Sprayed WC-CO/NiCr/MO and Cr3C2-CONiCrAlY Coatings. J. Therm. Spray. Technol. 2023, 32, 2411–2425. [Google Scholar] [CrossRef]
- Pandey, A.; Gupta, A.; Kumar, D.; Goyal, R. HVOF-sprayed surface coating with various compositions of CO-NiCrAlY-Al2O3 to minimize sediment erosion in hydraulic turbines. Surf. Coat. Technol. 2024, 481, 130644. [Google Scholar] [CrossRef]
- Tempelis, A.; Mishnaevsky, L. Coating material loss and surface roughening due to leading edge erosion of wind turbine blades: Probabilistic analysis. Wear 2025, 566, 205755. [Google Scholar] [CrossRef]
- Zhang, K.; Yu, Y.H.; Zhao, H.T.; Yang, B.; Guo, A.J.; Zhang, H.L. Erosion wear resistance of graphite/epoxy resin coating under strong windblown sand and grit flow. Wear 2025, 564, 205700. [Google Scholar] [CrossRef]
- Peng, W.S.; Cao, X.W. Numerical simulation of solid particle erosion in pipe bends for liquid-solid flow. Powder Technol. 2016, 294, 266–279. [Google Scholar] [CrossRef]
- Shen, Z.J.; Chu, W.L.; Li, X.J.; Dong, W. Sediment erosion in the impeller of a double-suction centrifugal pump—A case study of the Jingtai Yellow River Irrigation Project, China. Wear 2019, 422, 269–279. [Google Scholar] [CrossRef]
- Jia, W.F.; Yi, Y.J. Numerical study of the water-sediment regulation scheme (WSRS) impact on suspended sediment transport in the Yellow River Estuary. Front. Mar. Sci. 2023, 10, 1135118. [Google Scholar] [CrossRef]
- Farokhipour, A.; Mansoori, Z.; Saffar-Avval, M.; Ahmadi, G. 3D computational modeling of sand erosion in gas-liquid-particle multiphase annular flows in bends. Wear 2020, 450, 203241. [Google Scholar] [CrossRef]
- Peng, W.S.; Cao, X.W.; Hou, J.; Xu, K.; Fan, Y.; Xing, S.H. Experiment and numerical simulation of sand particle erosion under slug flow condition in a horizontal pipe bend. J. Nat. Gas. Sci. Eng. 2020, 76, 103175. [Google Scholar]
- Zhu, L.X.; Luo, J.H.; Huang, C.C.; Zhou, L.; Li, L.F.; Li, Y.B.; Wang, Z.G. Erosion Resistance of Casing with Resin and Metallic Coatings in Liquid-Solid Two-Phase Flow. Processes 2024, 12, 790. [Google Scholar] [CrossRef]
- Liu, M.W.; Zeng, L.Q.; Yu, J.; Liang, Y.; Wang, J.J.; Yang, C.Y. Erosion characteristics and damage model of anti-corrosion coating on steel-structure in inland river wharf. J. Harbin Inst. Technol. 2019, 51, 115–122. [Google Scholar]
- Lepicka, M. Coating failure detection in scratch testing: A cross-sectional SEM/FIB microscopic study coupled with nonlinear analysis methods in a model titanium nitride/stainless steel system. Wear 2025, 562, 205670. [Google Scholar]
- Li, J.H.; Tao, J.L. CFD-DEM Two-Way Coupled Numerical Simulation of Bridge Local Scour Behavior under Clear-Water Conditions. Transport Res. Rec. 2018, 2672, 107–117. [Google Scholar]
- Wang, D.; Shao, S.D.; Li, S.W.; Shi, Y.; Arikawa, T.; Zhang, H.Q. 3D ISPH erosion model for flow passing a vertical cylinder. J. Fluid. Struct. 2018, 78, 374–399. [Google Scholar] [CrossRef]
- Xiao, Z.; Song, L.; Li, J.H. Stability of the large cylindrical structures in Hong Kong-Zhuhai-Macao bridge: A case study. Appl. Ocean. Res. 2020, 97, 102092. [Google Scholar]
- Zeng, L.Q.; Liu, M.W.; Wu, L.J.; Zhou, C.; Abi, E.D. Erosion characteristics of viscoelastic anticorrosive coatings for steel structures under sand flow. Constr. Build. Mater. 2020, 258, 120360. [Google Scholar] [CrossRef]
- Jung, K.H.; Kim, S.J. Optimization of test condition on DL-EPR test for AL-6XN superaustenitic stainless steel using Taguchi method. Surf. Interfaces 2023, 37, 102731. [Google Scholar]
- Yu, J.; Zhang, F.; Li, X.Z.; Li, S.; Lu, Y.; Cheng, Y.F. Study on interface adhesion between EP/IFR/HBPSi epoxy intumescent coating and steel substrate. Int. J. Adhes. Adhes. 2024, 132, 102186. [Google Scholar]
- GB/T 5210-2006; Adhesion Test for Paints and Varnishes to Be Pulled Apart. China Standards Press: Beijing, China, 2006.
- Hao, Y.H.; Wu, R.G.; Zhao, C.G.; Guo, X.; Ya, R.H. Effect of weathering on erosion resistance of toughened glass based on taguchi method. Bull. Chin. Ceram. Soc. 2020, 9, 2980–2986. [Google Scholar]
- Dong, J.Q.; Su, L.; Chen, Q.; Xu, W.W. Experimental study on thermale hydraulic performance of a wavy fin-and-flat tube aluminum heat exchanger. Appl. Therm. Eng. 2013, 51, 32–39. [Google Scholar]
- Zhou, F.; Zeng, X.; Wu, Q.L.; Gao, X.Y.; Tang, H.J. Flow characteristics around square columns and wind load distributions considering the end effect. J. Transp. Sci. Eng. 2024, 40, 16544. [Google Scholar]


| Rotational speed (ω)/r·min−1 | 50 | 100 | 250 | 430 | 560 |
| Erosion velocity (Ve)/m·s−1 | 2 | 3 | 4 | 5 | 6 |
| Particle size/mm | <0.16 | 0.16~0.32 | 0.32~0.64 | 0.64~1.28 | 1.28~2.00 |
| Particle size ratio/% | 0.0 | 17.6 | 44.9 | 84.5 | 100.0 |
| Impact Factors | Values |
|---|---|
| Erosion Velocity (Ve)/m·s−1 | 2, 3, 4, 5, 6 |
| Sediment Concentration (Se)/kg·m−3 | 5, 10, 20, 30, 40 |
| Erosion Angle (φe)/° | 0, 30, 45, 60, 90 |
| Test Condition | Sediment Content (kg·m−3) | Erosion Rate (m·s−1) | Erosion Angle (°) | Signal-to-Noise Ratio | |||||
|---|---|---|---|---|---|---|---|---|---|
| 10 h | 20 h | 30 h | 40 h | 50 h | 60 h | ||||
| 1 | 5 | 2 | 0 | −43.71 | −36.95 | −31.57 | −28.05 | −27.01 | −26.35 |
| 2 | 3 | 30 | −41.58 | −34.60 | −30.02 | −26.87 | −26.05 | −25.32 | |
| 3 | 4 | 45 | −41.25 | −33.77 | −29.77 | −26.52 | −25.93 | −25.20 | |
| 4 | 5 | 60 | −41.33 | −33.45 | −29.21 | −26.33 | −25.76 | −24.96 | |
| 5 | 6 | 90 | −41.57 | −33.21 | −29.02 | −26.09 | −25.58 | −24.78 | |
| 6 | 10 | 2 | 30 | −41.58 | −35.94 | −28.98 | −25.79 | −25.07 | −24.51 |
| 7 | 3 | 45 | −40.97 | −32.75 | −27.54 | −24.75 | −24.03 | −23.63 | |
| 8 | 4 | 60 | −37.57 | −32.33 | −27.16 | −23.94 | −23.53 | −23.33 | |
| 9 | 5 | 90 | −36.68 | −31.71 | −25.94 | −22.75 | −21.94 | −21.31 | |
| 10 | 6 | 0 | −35.74 | −30.47 | −25.23 | −22.26 | −21.34 | −21.04 | |
| 11 | 20 | 2 | 45 | −41.25 | −35.14 | −28.76 | −25.48 | −24.95 | −24.30 |
| 12 | 3 | 60 | −39.33 | −32.44 | −27.24 | −24.65 | −23.83 | −23.28 | |
| 13 | 4 | 90 | −36.65 | −31.40 | −26.82 | −23.78 | −23.43 | −22.82 | |
| 14 | 5 | 0 | −35.23 | −31.26 | −25.69 | −22.19 | −21.81 | −21.17 | |
| 15 | 6 | 30 | −34.66 | −30.52 | −25.22 | −21.96 | −21.32 | −20.60 | |
| 16 | 30 | 2 | 60 | −41.33 | −34.77 | −28.41 | −25.31 | −24.86 | −24.23 |
| 17 | 3 | 90 | −38.93 | −31.81 | −27.06 | −24.40 | −23.68 | −23.08 | |
| 18 | 4 | 0 | −37.44 | −31.00 | −26.22 | −23.36 | −22.59 | −22.17 | |
| 19 | 5 | 30 | −34.84 | −30.60 | −25.24 | −22.06 | −21.47 | −21.13 | |
| 20 | 6 | 45 | −35.11 | −29.51 | −24.81 | −21.30 | −20.98 | −20.64 | |
| 21 | 40 | 2 | 90 | −41.57 | −34.50 | −28.09 | −25.26 | −24.64 | −23.92 |
| 22 | 3 | 0 | −36.87 | −31.01 | −26.78 | −23.83 | −23.49 | −22.77 | |
| 23 | 4 | 30 | −37.17 | −30.62 | −25.78 | −23.05 | −23.03 | −22.57 | |
| 24 | 5 | 45 | −35.20 | −29.83 | −24.71 | −22.08 | −21.23 | −20.62 | |
| 25 | 6 | 60 | −34.74 | −28.99 | −24.28 | −21.34 | −20.79 | −20.35 | |
| Impact Factors | Sediment Concentration | Erosion Velocity | Erosion Angle | Error |
|---|---|---|---|---|
| Contribution rate (%) | 80.25 | 16.47 | 2.43 | 0.86 |
Disclaimer/Publisher’s Note: The statements, opinions and data contained in all publications are solely those of the individual author(s) and contributor(s) and not of MDPI and/or the editor(s). MDPI and/or the editor(s) disclaim responsibility for any injury to people or property resulting from any ideas, methods, instructions or products referred to in the content. |
© 2025 by the authors. Licensee MDPI, Basel, Switzerland. This article is an open access article distributed under the terms and conditions of the Creative Commons Attribution (CC BY) license (https://creativecommons.org/licenses/by/4.0/).
Share and Cite
Peng, B.; Wu, L.; Liu, M.; Zeng, L.; Hu, Z.; Ji, X.; Yu, K. Deterioration of Protective Coating on Steel Structures in Harbor Attacked via Water and Sediment Erosion. J. Mar. Sci. Eng. 2025, 13, 683. https://doi.org/10.3390/jmse13040683
Peng B, Wu L, Liu M, Zeng L, Hu Z, Ji X, Yu K. Deterioration of Protective Coating on Steel Structures in Harbor Attacked via Water and Sediment Erosion. Journal of Marine Science and Engineering. 2025; 13(4):683. https://doi.org/10.3390/jmse13040683
Chicago/Turabian StylePeng, Bingli, Linjian Wu, Mingwei Liu, Liqin Zeng, Zhen Hu, Xudong Ji, and Kui Yu. 2025. "Deterioration of Protective Coating on Steel Structures in Harbor Attacked via Water and Sediment Erosion" Journal of Marine Science and Engineering 13, no. 4: 683. https://doi.org/10.3390/jmse13040683
APA StylePeng, B., Wu, L., Liu, M., Zeng, L., Hu, Z., Ji, X., & Yu, K. (2025). Deterioration of Protective Coating on Steel Structures in Harbor Attacked via Water and Sediment Erosion. Journal of Marine Science and Engineering, 13(4), 683. https://doi.org/10.3390/jmse13040683