Article

Spatial Heterogeneity of the Microbial Community in the Surface Sediments in the Okinawa Trough

1
Key Laboratory of Gas Hydrate, Ministry of Natural Resources, Qingdao Institute of Marine Geology, Qingdao 266237, China
2
Laboratory for Marine Mineral Resources, Qingdao Marine Science and Technology Center, Qingdao 266237, China
3
Technology Innovation Center for Marine Methane Monitoring, Ministry of Natural Resources, Qingdao 266237, China
4
Laoshan Laboratory, Qingdao 266200, China
5
Development and Research Center, China Geological Survey, Beijing 100037, China
*
Authors to whom correspondence should be addressed.
J. Mar. Sci. Eng. 2025, 13(4), 653; https://doi.org/10.3390/jmse13040653
Submission received: 4 February 2025 / Revised: 20 March 2025 / Accepted: 20 March 2025 / Published: 25 March 2025
(This article belongs to the Special Issue Research Progress on Deep-Sea Organisms)

Abstract

:
The Okinawa Trough (OT) has been a focus of scientific research for many years due to the presence of vibrant hydrothermal and cold seep activity within its narrow basin. However, the spatial distribution and environmental drivers of microbial communities in OT sediments remain poorly understood. The present study aims to address this knowledge gap by investigating microbial diversity and abundance at ten different sampling sites in a transitional zone between hydrothermal vents and cold seeps in the OT. The microbial community at two sampling sites (G08 and G09) in close proximity to hydrothermal vents showed a high degree of similarity. However, lower bacterial and archaeal abundances were found in these sites. The archaeal groups, classified as Hydrothermarchaeota and Thermoplasmata, showed a comparatively higher relative abundance at these sites. In addition, ammonia-oxidizing archaea (AOA), from the family Nitrosopumilaceae, were found to have a higher relative abundance in the OT surface sediments at sampling sites G03, G04, G05, G06, and G07. This result suggests that ammonia oxidation may be actively occurring in these areas. Furthermore, Methylomirabilaceae, which are responsible for methane oxidation coupled with nitrite reduction, dominated three sampling sites (G07, G08, and G09), implying that N-DAMO may play an important role in mitigating methane emissions. Using the FAPROTAX database, we found that predicted prokaryotic microbial functional groups involved in methyl-reducing methanogenesis and hydrogenotrophic methanogenesis were most abundant at sites G08 and G09. At sampling sites G01 and G02, functional groups such as hydrocarbon degradation, methanotrophy, methanol oxidation, denitrification, sulfate respiration, and sulfur oxidation were more abundant. Nitrogen content is the most important environmental factor determining the bacterial and archaeal communities in the OT surface sediments. These results expand our knowledge of the spatial distribution of microbial communities in the transitional zone between hydrothermal vents and cold seeps in the OT.

1. Introduction

The deep seafloor comprises a variety of dynamic habitats that contribute significantly to the heterogeneity and diversity of microbial communities on Earth [1,2,3]. It has been estimated that the number of microorganisms inhabiting the seafloor is in excess of 1029 cells, which is approximately equivalent to the number of microorganisms present in seawater and soil [4]. The subsurface microbial biosphere plays a crucial role in global biogeochemical cycles because it alters the redox state of the crust and affects the distribution of minerals, gases, and organic matter through deep time [5]. The structure of seabed communities is primarily determined by the availability of electron donors and acceptors, which is usually influenced by sedimentation rates and sediment permeability [5,6,7,8].
The Okinawa Trough (OT) is a back-arc basin that extends from the Ryukyu Trench-Arc system along the margin of the East China Sea shelf [9]. Due to the coexistence of the development of thriving hydrothermal and cold seep activities in the narrow basin [10,11,12], the OT has attracted the attention of scientists for decades. The microbial community structures in various hydrothermal fields of the OT, such as Yonaguni Knoll IV, Iheya North Knoll, and Tangyin hydrothermal fields, have been extensively studied. It was found that the microbial community compositions and functions observed in different hydrothermal vents are quite different due to the geochemical and physical characteristics [13]. For instance, at the Yonaguni Knoll IV hydrothermal field, the primary bacterial and archaeal communities in the deep-sea sediments above a natural CO2 lake were identified as anaerobic methanotrophic archaea (ANME-2c), the Eel-2 group of Deltaproteobacteria, and sulfur-metabolizing chemolithotrophs belonging to the Gamma- and Epsilonproteobacteria [13]. Members of the Chloroflexi and deep-sea archaeal groups were previously identified as the dominant microorganisms in the subsurface sediments at the Iheya North hydrothermal field, Mid-Okinawa Trough [14]. Furthermore, in the southern OT’s “Tangyin” hydrothermal field, Epsilonproteobacteria and Bacteroidetes seem to be more prevalent in hydrothermal deposits [15]. In contrast, at non-hydrothermal sites from two different depths in the Mid-Okinawa Trough, Gammaproteobacteria and Thaumarchaeota were the dominant bacterial and archaeal groups, respectively. Compared to the extensive research on hydrothermal vents in the OT, relatively few studies have investigated microbial communities in OT cold seep sediments. These studies have shown that archaeal groups like ANMEs and bacterial groups like JS1 and SEEP-SRB are abundant in cold seep sediments [16], with methane seepage intensity being a key factor in shaping microbial community structures in the OT [16]. Metagenome analysis revealed potential coupling mechanisms between microbial methane, nitrogen, and sulfur cycling in the OT cold seep sediments [17]. However, the dynamics of microbial communities in marine environments where hydrothermal vents and cold seeps coexist remain poorly understood, and the impact of hydrothermal plumes on these communities requires further investigation.
In this study, we employed high-throughput 16S rRNA sequencing in conjunction with environmental data analysis to investigate the variations in microbial community composition and diversity within the transitional zone between hydrothermal vents and cold seeps in the OT. The aims of this research are to answer the following questions: (1) How do microbial community diversity and composition change in marine environments where hydrothermal vents and cold seeps coexist in the surface sediments of the OT? (2) What is the impact of hydrothermal activities on these microbial communities? (3) Which functional microorganisms are involved in geochemical cycling within the sediments?

2. Materials and Methods

2.1. Sample Collection

During the July–August 2020 cruise, ten gravity cores were collected from the hydrothermal-seep coexistence zone in the Mid-Okinawa Trough using an 11 cm diameter gravity corer (Figure 1). The water depths of the ten sampling sites ranged from 922 m to 1167 m. Two of the cores, G02 and G10, were retrieved from cold seeps in the central OT where fluid emission was tracked by acoustic flares in the water column. G02 was located on a seafloor dome structure, while G10 was recovered from a normal fault scarp. The processing of cores G02 and G10 indicated a reducing environment due to the strong sulfide odor detected. Core G08 was located approximately 5 km from the Minami-Ensei Knoll (MEK) hydrothermal field, while cores G03, G04, G05, G06, and G07 were located between G08 and G02. The sediments of the ten sediment cores, except G08 and G09, were homogeneous and consisted mainly of gray-black silty clay. In contrast, the marine sediments in G08 and G09 were sandy, consisting mainly of sandy mud and muddy sand. Samples for molecular analysis were taken from these cores at a depth of 7.5 cm using a sterile tongue depressor and immediately stored at −80 °C for nucleic acid extraction. The remaining undisturbed sediments at the corresponding level were compressed on board for geochemical analysis and kept on dry ice during transport. Methodology for sample collection has been described in Chen et al. [16]. To collect the headspace CH4, sediments were sampled using 5 mL syringes at a depth interval of 7.5 cm. The sediments were promptly placed into 20 mL glass vials containing 10 mL of saturated NaCl solution, capped with butyl rubber stoppers, and then stored inverted at 4 °C in a refrigerator.

2.2. Geochemical Analyses

Sediment methane was determined using an Agilent 6890N gas chromatograph (Agilent Technologies, Santa Clara, CA, USA) system with a flame ionization detector. Dissolved inorganic carbon (DIC) was measured using a Vario Micro Cube elemental analyzer (Elementar, Frankfurt, Germany) with high analytical accuracy. The concentration of dissolved organic carbon (DOC) was determined using an Iso TOCCUBE-ISOPRIME100 instrument (Elementar, Frankfurt, Germany). The concentrations of NH4+ and dissolved anions (SO42−, NO3, PO43−) in the pore water subsamples were measured using an ICS1600 ion chromatography system (Dionex Corporation, Sunnyvale, CA, USA). Dissolved iron (dFe) and dissolved manganese (dMn) concentrations in the pore water samples were determined using an ICP-MS iCAPQ instrument (Thermo Fisher Scientific, Waltham, MA USA). The concentration of H2S was measured using the methylene blue spectrophotometric method. Specifically, we employed zinc acetate and cadmium sulfate as precipitating agents to trap hydrogen sulfide in the sample. Subsequently, the trapped sulfide was reacted with N,N-dimethyl-p-phenylenediamine sulfate in an acidic medium (phosphoric acid) to form methylene blue. The absorbance of methylene blue was then measured at a wavelength of 665 nm using a TU-1901 double-beam ultraviolet spectrophotometer (Beijing Persee Instrument Co., Ltd., Beijing, China). The concentration of H2S was calculated based on a standard calibration curve.

2.3. DNA Extraction and 16S rRNA Sequencing

Genomic DNA was extracted from fresh sediment samples using the PowerSoil DNA Kit (MoBio Laboratories, Inc., Carlsbad, CA, USA) following the manufacturer’s instructions. The bacterial 16S rRNA and archaeal 16S rRNA gene copy numbers were quantified using the universal primer pair 338F (ACTCCTACGGGAGGCAGCA)/806R (GGACTACHVGGGTWTCTAAT) [19] and Arch519 (CAGCCGCCGCGGTAA)/Arch915 (GTGCTCCCCCGCCAATTCCT) [20]. All PCR assays were conducted using an ABI PRISM® 7500 Sequence Detection System (Applied Biosystems, Foster City, CA, USA). Each 20 μL reaction mixture consisted of 10 μL FastStart Universal SYBR Green Master (Rox) (Roche Diagnostics, Mannheim, Germany), 0.2 μL bovine serum albumin (BSA), 0.6 μL of each primer, and 2.0 μL sediment DNA. The qPCR amplification conditions for bacterial and archaeal targets included an initial denaturation at 95 °C for 10 min, followed by 40 cycles of 95 °C for 15 s and 58 °C for 1 min. Each sample was analyzed in triplicate, and the amplification products were confirmed by melt-curve analysis using the ABI PRISM® 7500 system. Standard curves were generated using 10-fold serial dilutions of plasmids containing the target gene fragments. The amplification efficiencies were 90% for bacteria and 109% for archaea, respectively, with strong linear relationships (R² > 0.99) considered reliable for these standard curves.
For PCR amplification, the 338F/806R primer pair was used to target the highly variable V3–V4 region of bacterial 16S rRNA genes, while the Arch519/Arch915 primer pair was employed for the V4–V5 region of archaeal 16S rRNA genes. The PCR reaction mixture comprised 0.25 μL of Q5 high-fidelity DNA polymerase, 5 μL of Q5 reaction buffer (5×), 5 μL of Q5 high-fidelity GC buffer (5×), 2 μL of dNTP mix (2.5 mM), 1 μL of each primer (10 μM), 2.0 μL of DNA template, and 8.75 μL of ddH2O. Amplification was conducted using the ABI 2720 thermocycler (Applied Biosystems, Foster City, CA, USA) with the following conditions: initial denaturation at 98 °C for 5 min, followed by 25 cycles of 98 °C for 30 s, annealing at 55 °C for the V3–V4 region or 65 °C for the V4–V5 region for 30 s, extension at 72 °C for 45 s, and a final extension at 72 °C for 5 min. The resulting PCR amplicons were purified using Vazyme VAHTSTM DNA Clean Beads (Vazyme, Nanjing, China) and quantified using the Quant-iT PicoGreen dsDNA Assay Kit (Invitrogen, Carlsbad, CA, USA). Amplicons from the same sediment core were pooled in equal amounts to construct sequencing libraries with the NEB Next Ultra DNA Library Prep Kit for Illumina (New England Biolabs, Ipswich, MA, USA) following the manufacturer’s protocol. Library quality was assessed using the Agilent Bioanalyzer 2100 system (Agilent Technologies, Santa Clara, CA, USA). Finally, sequencing was performed on the Illumina MiSeq platform by Shanghai Personal Biotechnology Co., Ltd. (Shanghai, China).

2.4. Analysis of 16S rRNA Gene Sequences

The q2-data2 plugin from the QIIME2 package (version 2023.5) was used to conduct quality control, denoising, paired-end sequence merging, and clustering reads into amplicon sequence variants (ASVs) with default parameters [21]. To improve the interpretability of the dataset and avoid potentially erroneous sequences, we filtered out ASVs that appeared in fewer than 2 samples or had a total frequency of less than 10. The microbiota alpha diversity, including the Good’s coverage, Faith_pd, Shannon diversity, Observed features and Pielou’s evenness, were calculated using the q2-diversity plugin. When calculating these diversity indices, we rarefied the total frequency of each sample to 13,384 and 12,555 for the bacterial and archaeal communities, respectively. A rarefied table was provided by random subsampling sequences using the alpha-rarefaction action within the q2-diversity plugin and the rarefaction cures were visualized using the ‘tidyverse’ package in R (version 4.3.2). The beta diversity was also estimated based on the Bray–Curtis distance. Taxonomy was assigned based on the SILVA reference database (release 138) with the default q2-feature-classifier naive Bayes model.

2.5. Statistical Analyses

To explore the relationships between environmental variables and the distribution of archaeal communities, canonical correspondence analysis (CCA) was conducted using the vegan package in R (version 4.3.2). This multivariate statistical method was applied to analyze the correlations between environmental parameters and archaeal community distribution. The analysis was based on the Hellinger transformation of microbial group relative abundance data and the original environmental variables [22]. The significance of these environmental variables was assessed using an analysis of variance (ANOVA) approach with 999 permutations. Additionally, Mantel tests were employed to evaluate the impact of environmental factors on both archaeal and bacterial communities in the OT sediments. The metabolic functions of the microbial communities were inferred using FAPROTAX (Functional Annotation of Prokaryotic Taxa), a bioinformatics tool that links prokaryotic taxa to specific metabolic or ecological functions based on 16S rRNA gene sequencing data [23].

3. Results

3.1. Environmental Parameters at the Sampling Sites

The environmental parameters of the study area are described in Table 1. The concentrations of CH4 and DOC exhibited the highest values at the cold seep G02. Conversely, lower concentrations of NH4+ and PO42− were detected at two sampling sites near hydrothermal vents (G08 and G09). Concentrations of Mn2+ were elevated at sites G05 and G07. Furthermore, sites G02 and G03 showed elevated concentrations of Fe2+.

3.2. Abundance of Microbial Community in OT Sediments

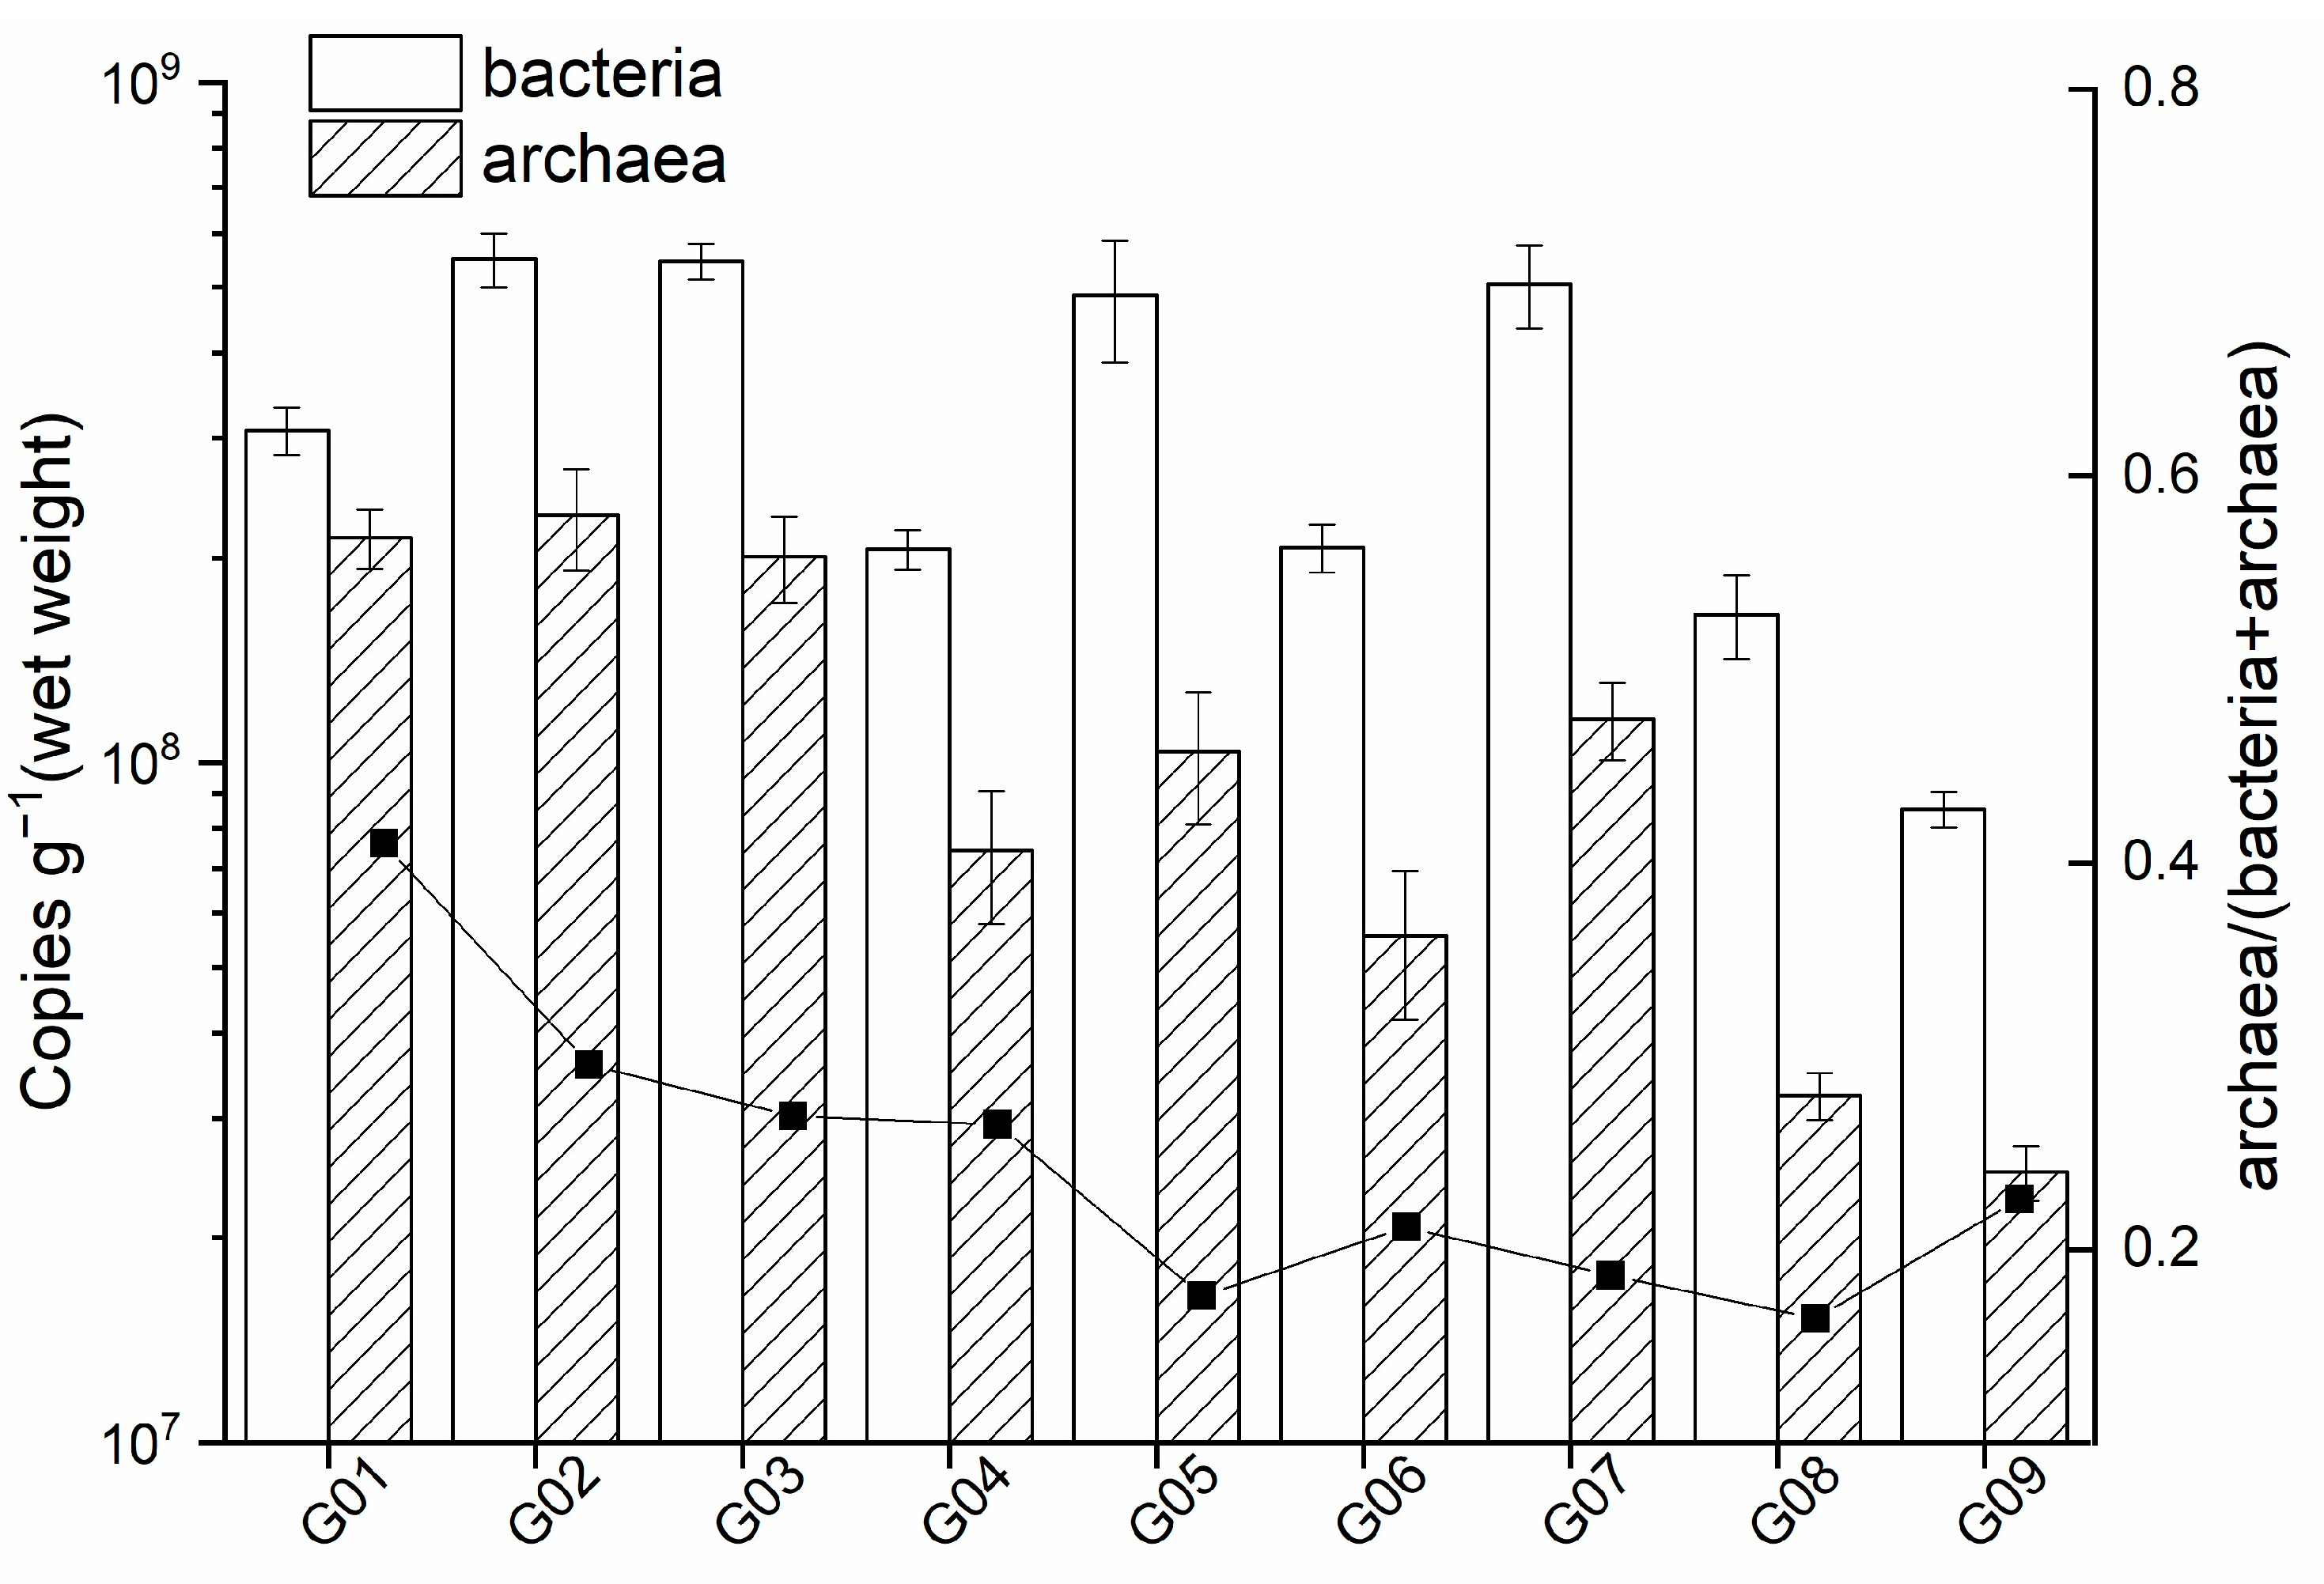
The observed bacterial and archaeal 16S rRNA gene abundances at the nine sampling sites ranged from 8.54 × 10⁷ to 5.50 × 10⁸ copies/g and 2.50 × 10⁷ to 2.31 × 10⁸ copies/g on a wet weight basis, respectively (Figure 2). Higher levels of bacterial and archaeal 16S rRNA gene copy numbers were detected at sampling sites G02 and G03. Conversely, lower levels were observed at two sampling sites near the hydrothermal vents. The percentages of archaeal abundance relative to total microbial abundance ranged from 16% to 41%, decreasing from sampling site G01 to G09.

3.3. Diversity of Archaeal and Bacterial Community

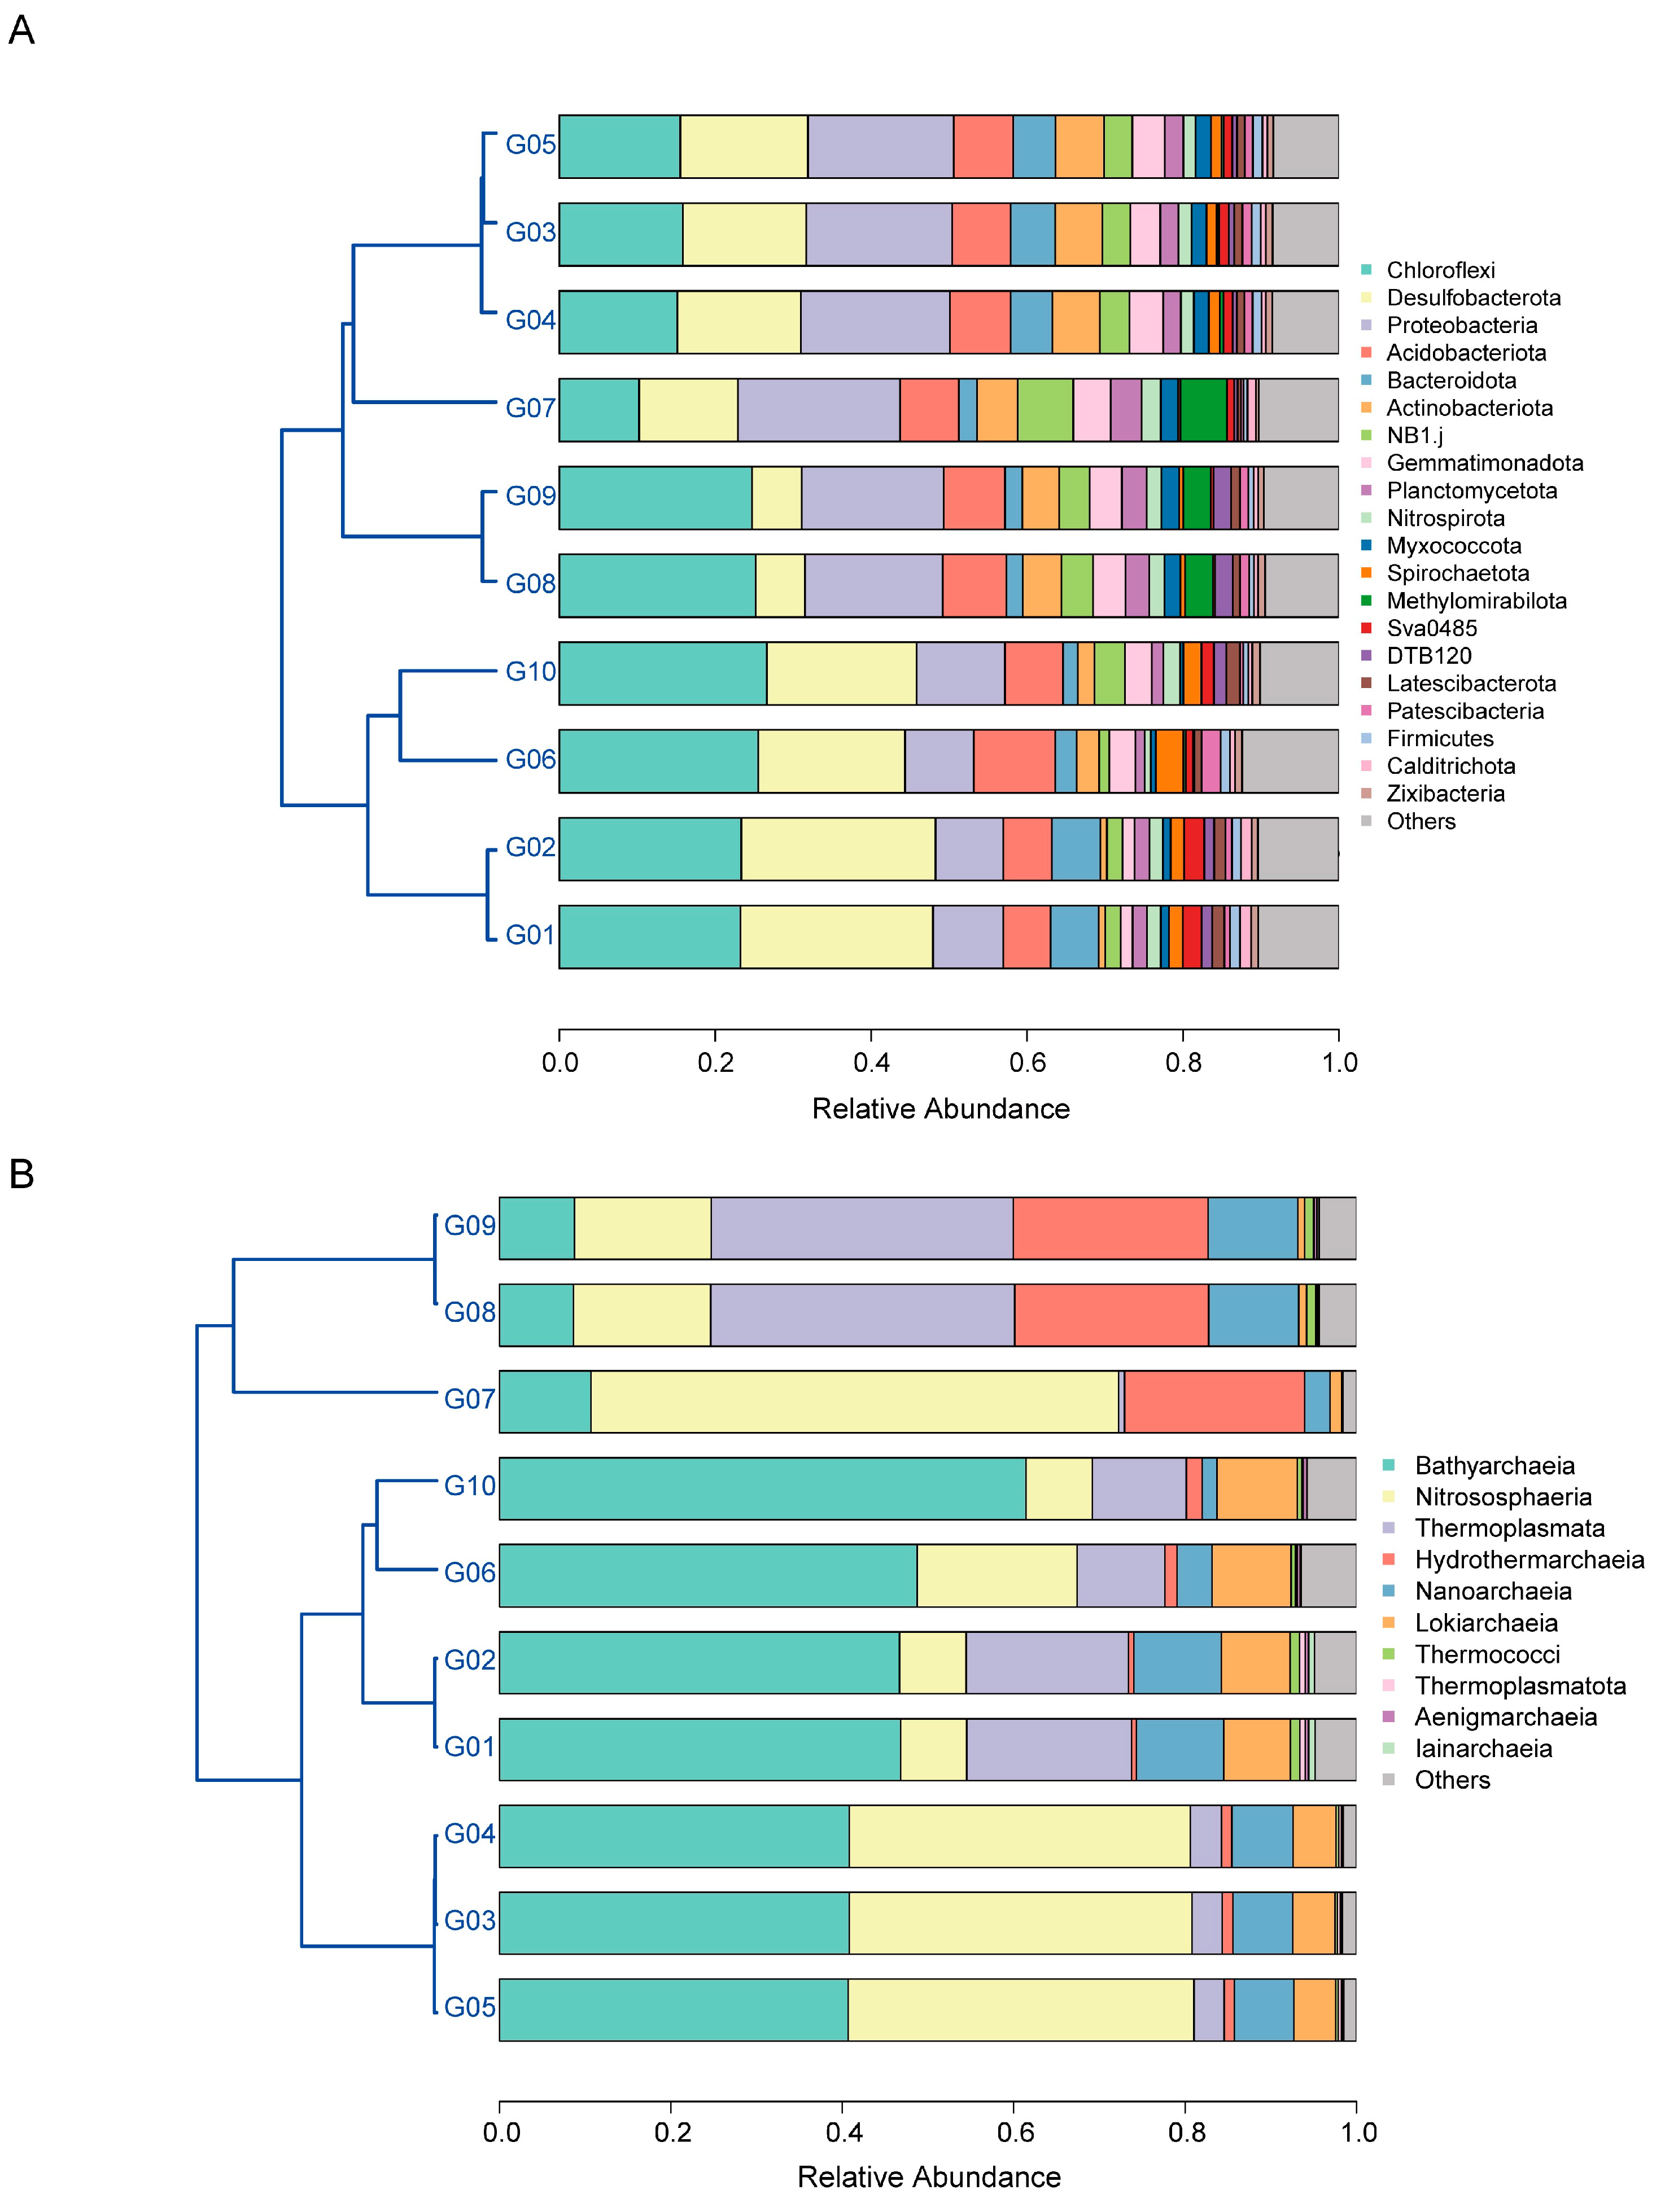
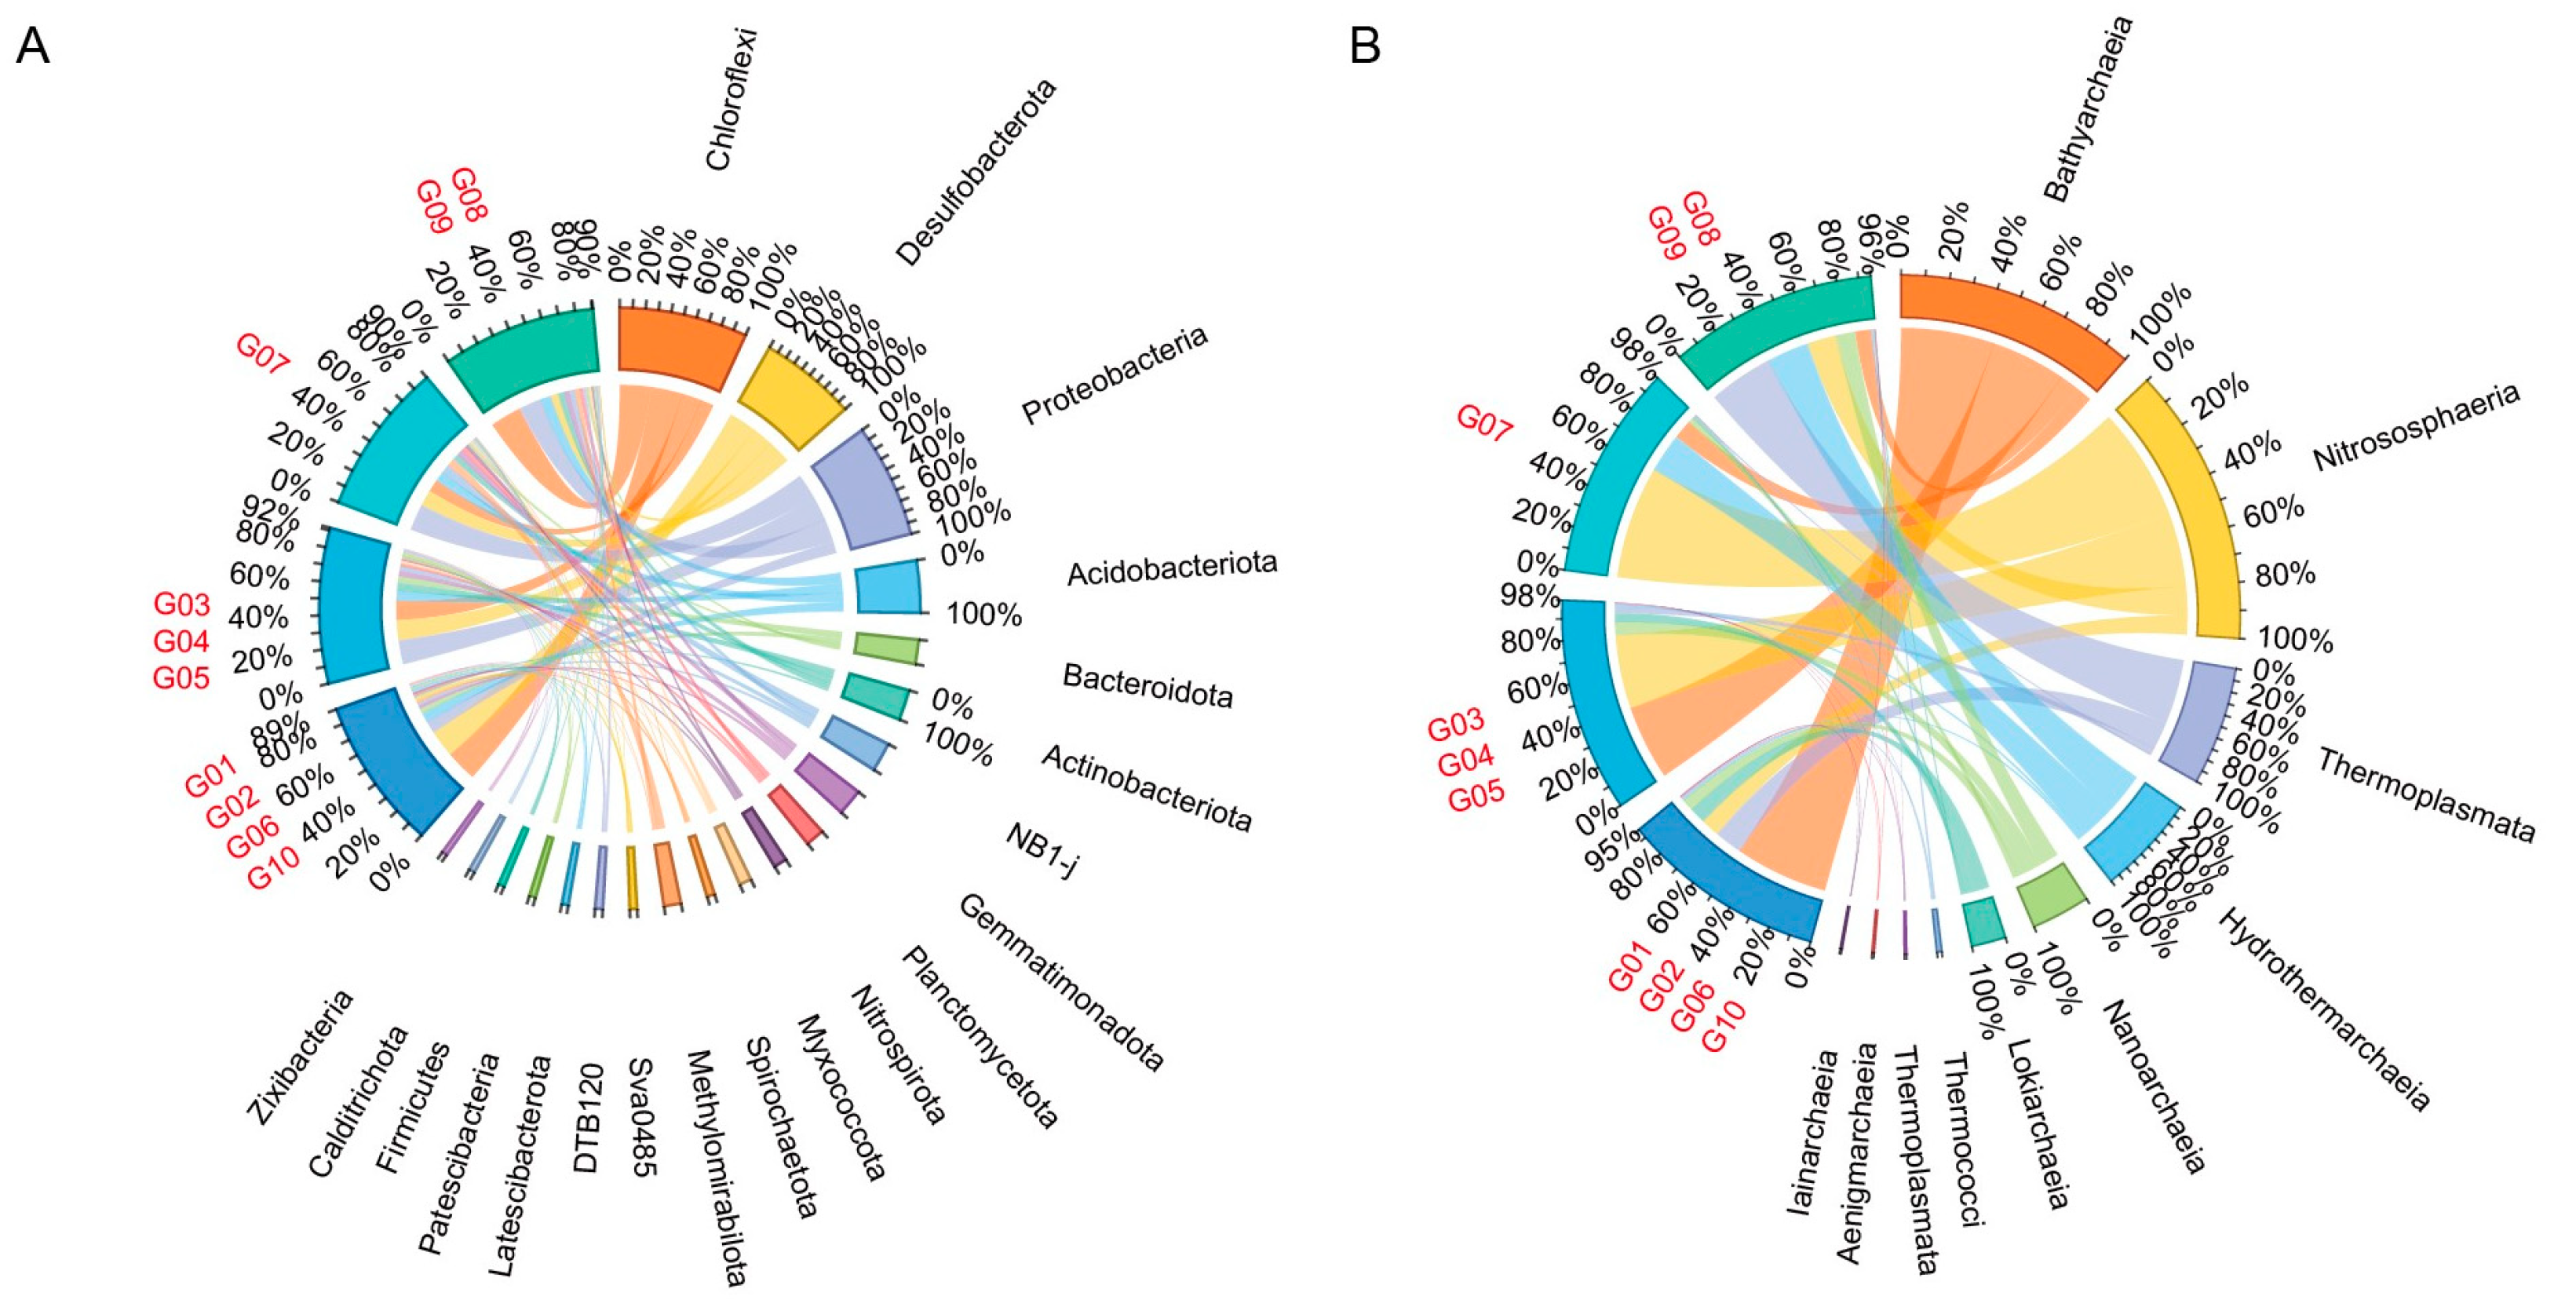
A total of 8671 bacterial and 1493 archaeal ASVs were identified from 104,037 bacterial and 77,410 archaeal high-quality sequences across the 10 sediment samples. The high values of Good’s coverage (95.55–99.91% for bacterial communities and 99.40–100% for archaeal communities) indicated sufficient sampling coverage in the OT sediments (Tables S1 and S2). The diversity indices, including Faith’s Phylogenetic Diversity (faith_pd), observed features, and Shannon entropy, indicated that sediment samples from G07 displayed the lowest diversity. Most of the bacterial sequence reads were associated with Chloroflexi, which accounted for 27.57% of all sequences, followed by Proteobacteria (16.43%), Desulfobacterota (10.77%), and Acidobacteriota (8.65%) (Figure 3). Within the Proteobacteria, Gammaproteobacteria (7.89%) and Alphaproteobacteria (7.02%) were the dominant groups, and their relative abundances varied between sediment samples (Figure S1). Alphaproteobacteria had the highest abundance in sites G08 and G09, whereas Gammaproteobacteria had the highest abundance in site G07 (Figure S1). Cluster analysis using the Bray–Curtis distance metric revealed that the bacterial and archaeal communities were divided into four distinct groups: G01, G02, G06, and G10 clustered together; G03, G04, and G05 clustered together; G07 formed a separate group; and G08 and G09 clustered together (Figure 3). It was interesting to note that the relative abundance of Methylomirabilota was higher at sampling sites G07, G08, and G09 than at the other sampling sites (Figure 3A and Figure 4A). For the archaeal community, sediment samples were clustered into different groups based on their dominant phyla (Figure 3B and Figure 4B). Samples G03, G04, and G05 were dominated by Bathyarchaeia and Nitrososphaeria, while G01, G02, G06, and G10 were characterized by a higher abundance of Bathyarchaeia (Figure 3B and Figure 4B). The G07 sample was rich in Nitrososphaeria (Figure 3B and Figure 4B). The sediment samples near the hydrothermal vent (G08 and G09) were dominated by Nitrososphaeria and Thermoplasmata (Figure 3B and Figure 4B). Hydrothermarchaeia had higher relative abundances in the sampling sites (G07, G08, and G09) (Figure 3B and Figure 4B).

3.4. Microbes Involved in Biogeochemical Cycles

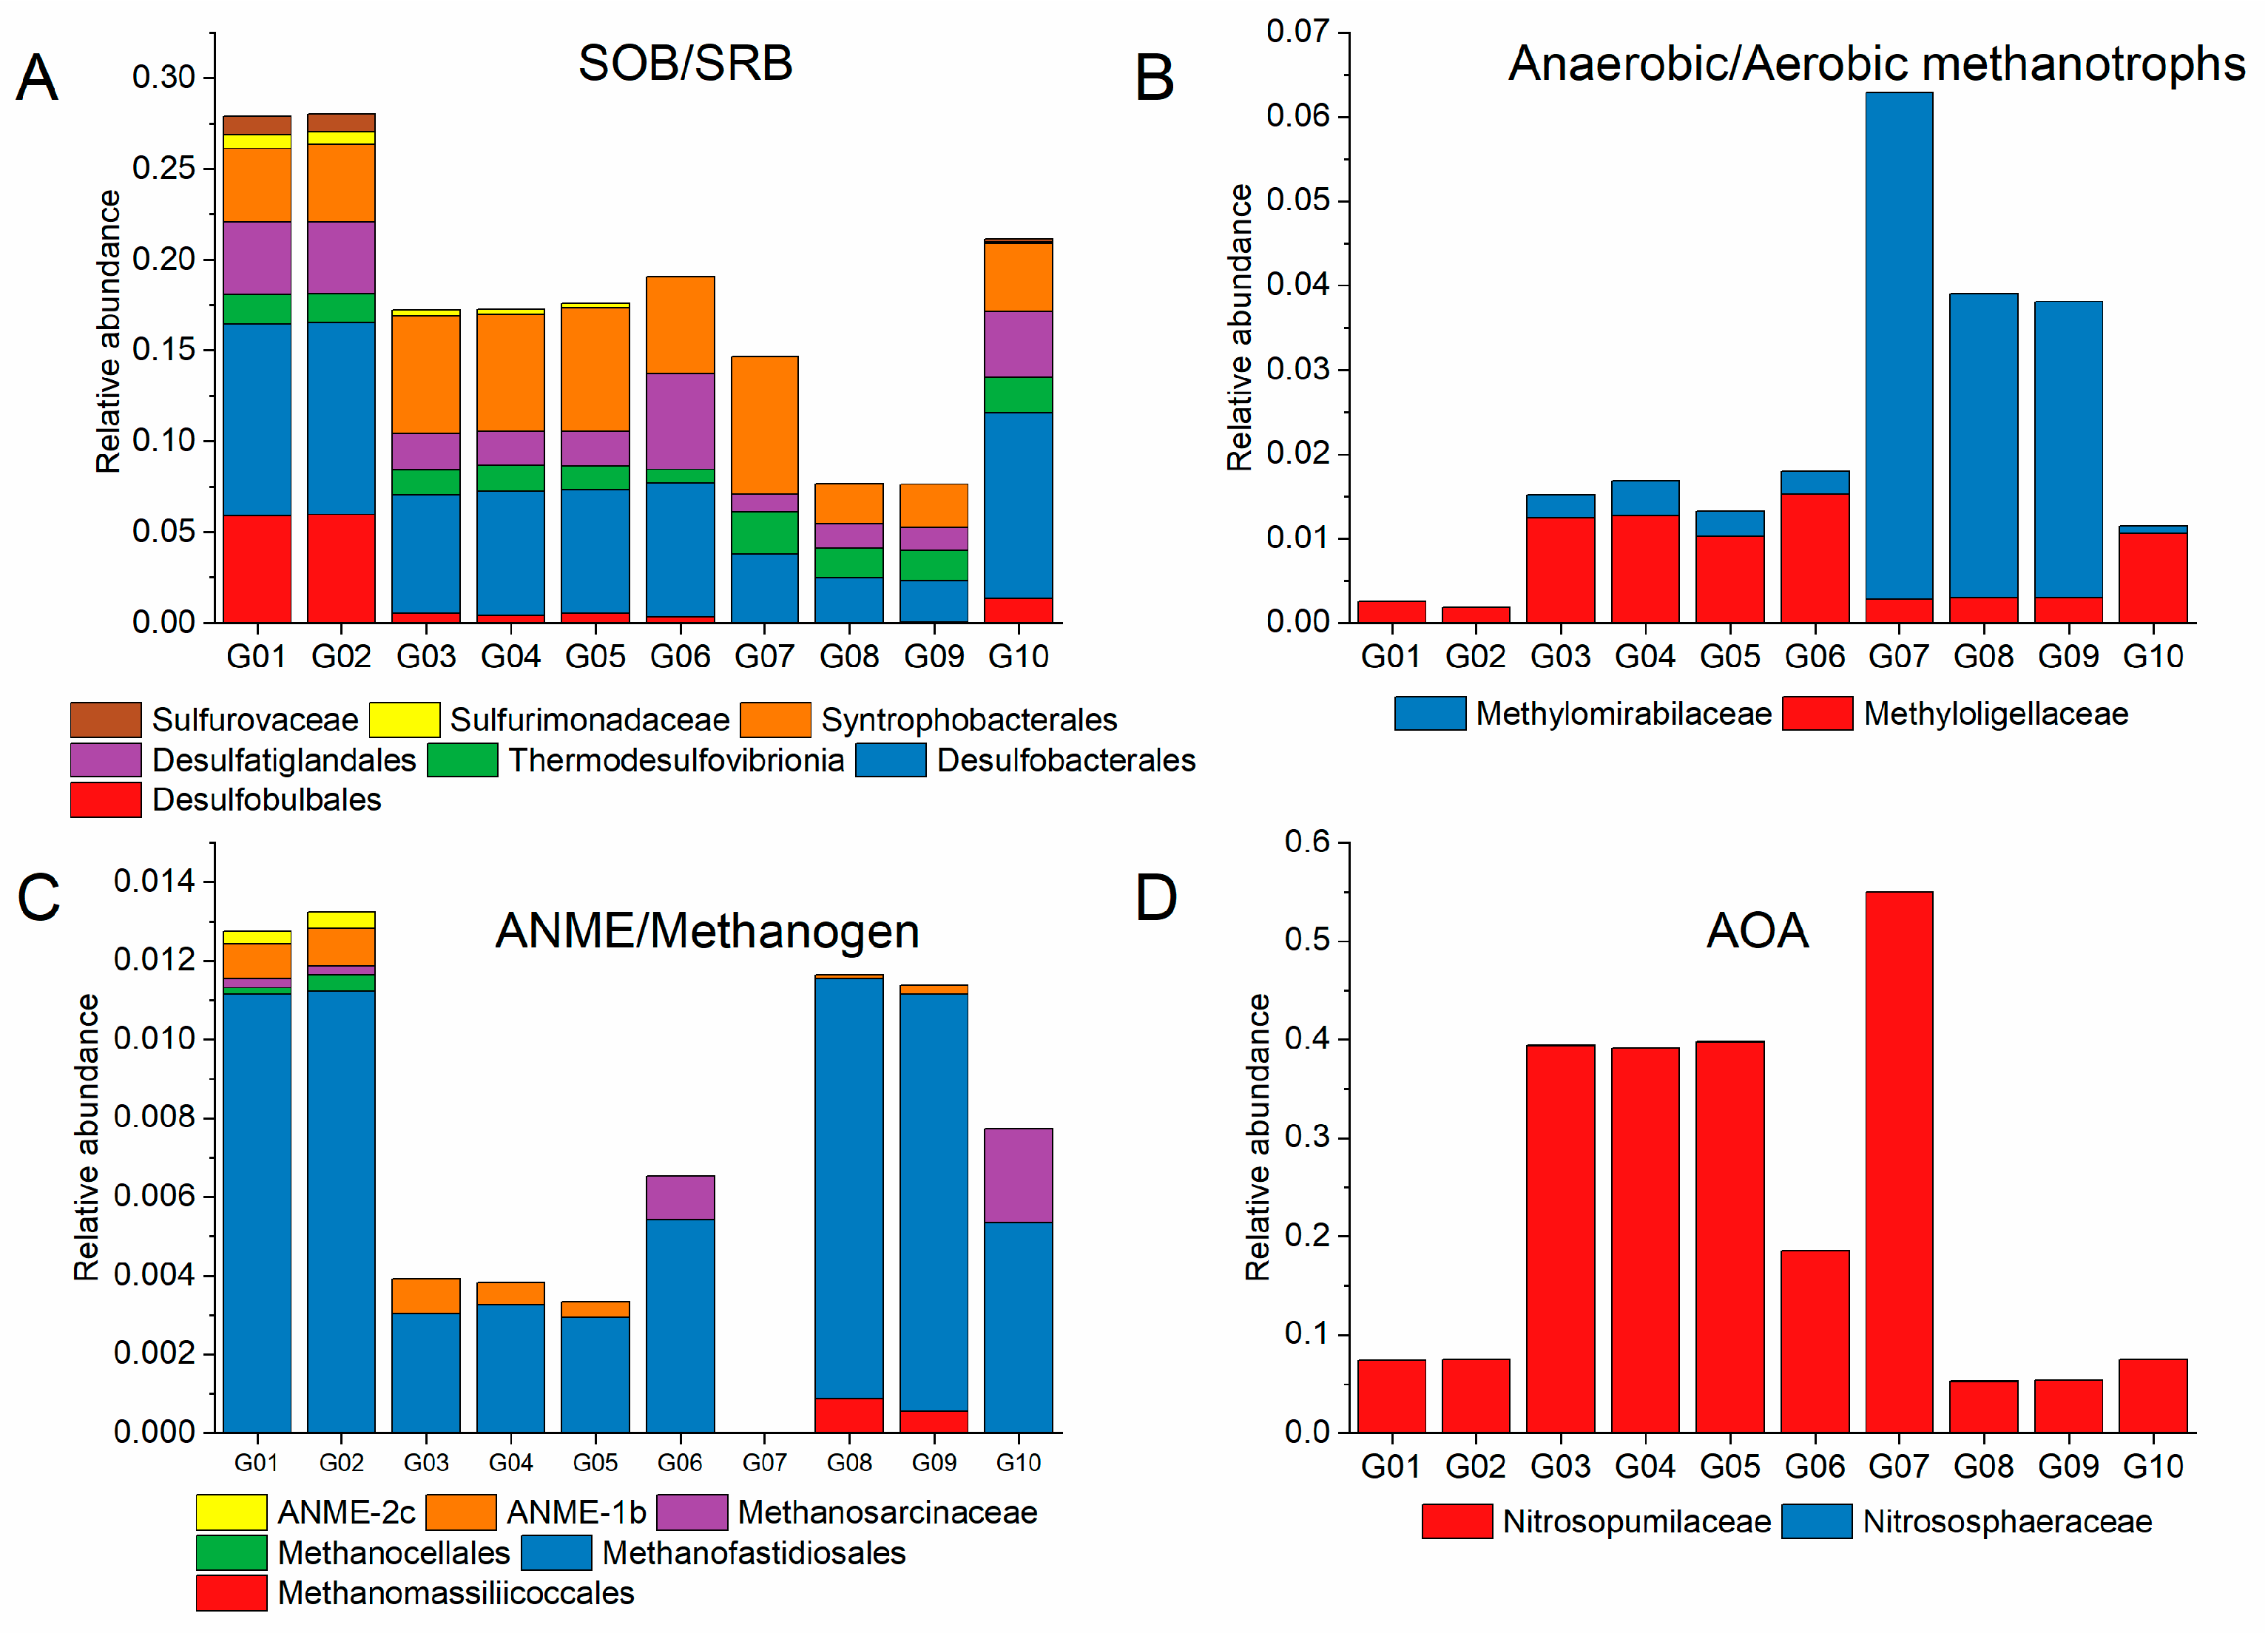
The abundance and distribution of microorganisms involved in methane, sulfur, and nitrogen metabolism were inferred from 16S rRNA sequences (Figure 5). Three orders (Desulfobulbales, Desulfobacterales, Desulfatiglandales) belonging to the Deltaproteobacteria and one class (Thermodesulfovibrionia) belonging to the Nitrospirae were found to be involved in sulfate reduction (Figure 5A). Desulfobulbales (mainly including Sva0081_sediment_group and SEEP-SRB1) were dominant at both sites G01 and G02 (Figure 5A). Sulfur-oxidizing bacteria (SOB) were mainly associated with Syntrophobacterales, with relative abundances ranging from 2.25% to 7.54% (Figure 5A). Sequence analysis of 16S rRNA genes also detected Methylomirabilaceae (mainly clade wb1.A12) and Methyloligellaceae, which are involved in aerobic methane oxidation. Methylomirabilaceae were enriched at sampling sites near the hydrothermal vents (G07, G08, and G09), while Methyloligellaceae dominated in the other sampling sites (Figure 5B). The most consistently detected methanogenic group was the Methanofastidiosales, with higher relative abundances in sampling sites G01, G02, G08, and G09 (>1%) (Figure 5C). Other methanogens detected in the sediments of the OT included Methanomassilicoccales, Methanosarcinaceae, and Methanocellales, all of which had relatively lower abundances (Figure 5C). Among these, Methanomassilicoccales exhibited higher relative abundances at sampling sites G08 and G09. In contrast, Methanosarcinaceae were more abundant at sites G06 and G10, while Methanocellales had higher relative abundance at sites G01 and G02. Anaerobic methane-oxidizing archaea (ANME), including ANME-1b and ANME-2c, which are associated with anaerobic CH4 oxidation, were also detected in the OT sediments, albeit at relatively low abundances (Figure 5C). The ammonia-oxidizing archaea (AOA) Nitrosopumilaceae, which include the genus Candidatus Nitrosopumilus and some unclassified members of Nitrosopumilaceae, were found in the OT sediments with relative abundances ranging from 5.26% to 55%, with the highest abundance at site G07 (Figure 5D).
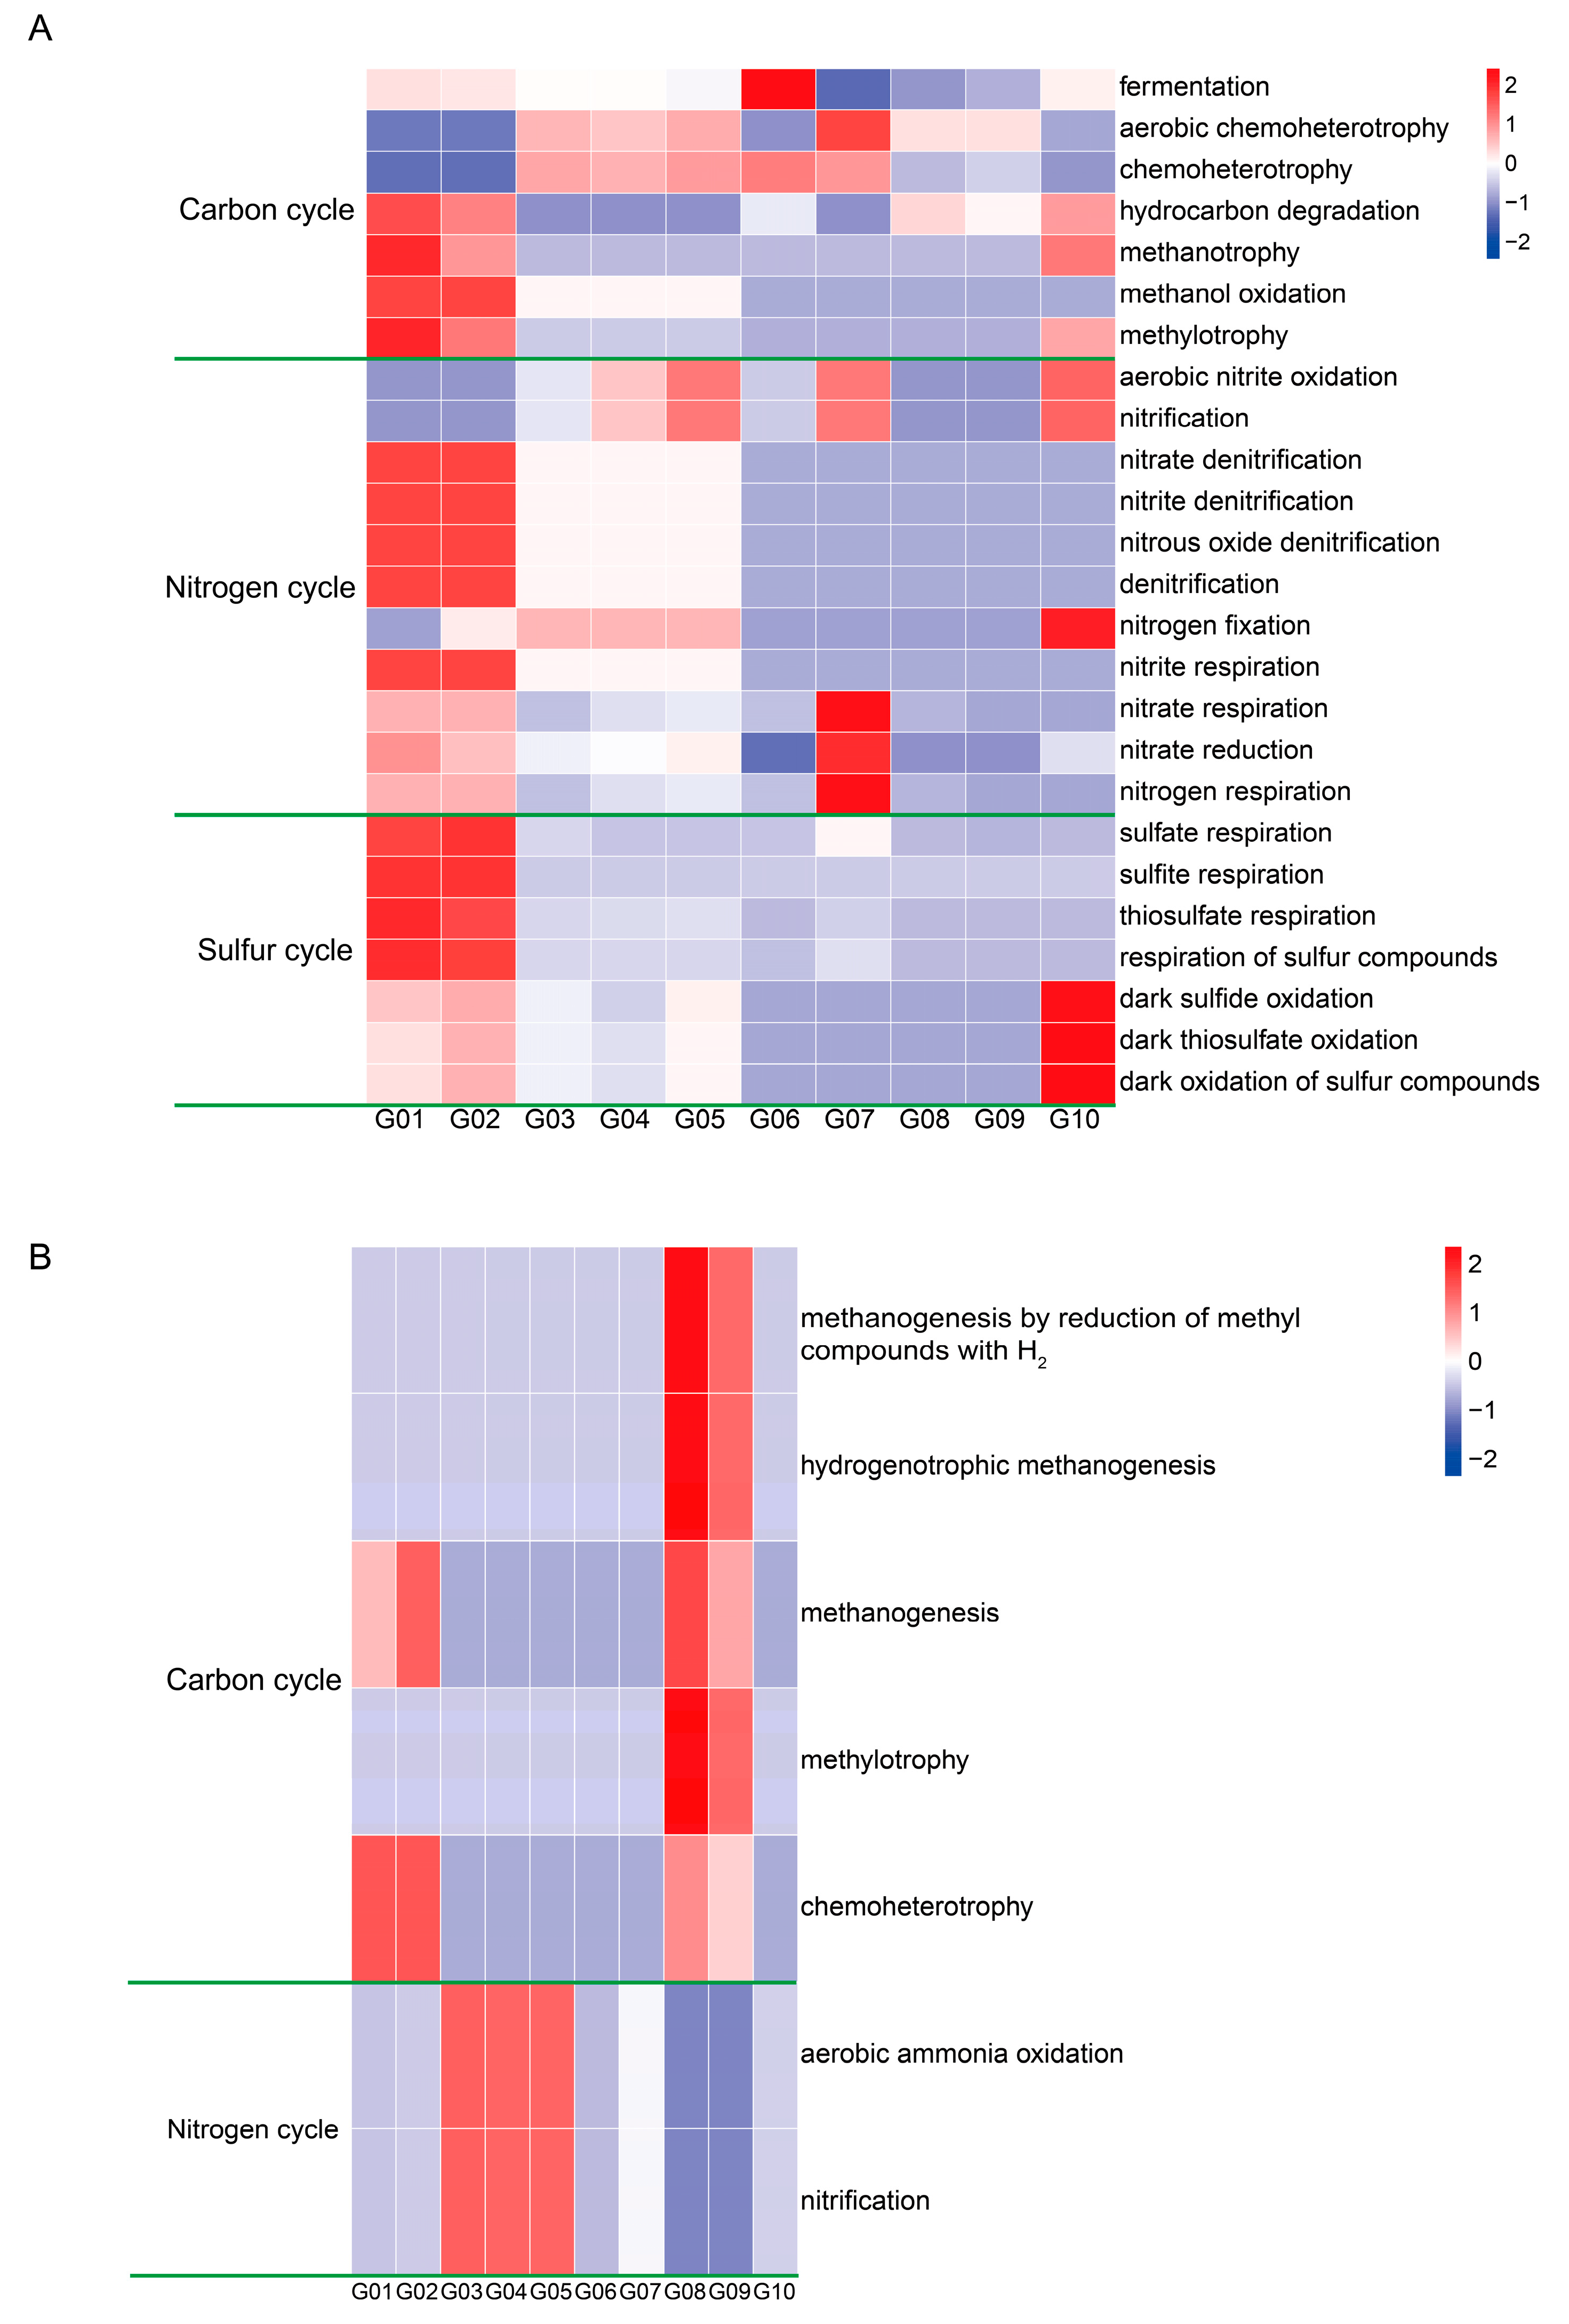
Obvious variations in functional groups associated with carbon (C), nitrogen (N), and sulfur (S) cycling were observed across different sampling sites, indicating that shifts in microbial community structure could influence sediment biogeochemical cycles (Figure 6). Functional groups involved in hydrocarbon degradation, methanotrophy, methanol oxidation, denitrification, sulfate respiration, and sulfur oxidation were predominant at sites G01 and G02 (Figure 6A). Notably, methanogenic functional groups, including methyl-reducing methanogenesis (the production of methane through the reduction in methyl compounds with H2) and hydrogenotrophic methanogenesis, were more abundant at sites G08 and G09 (Figure 6B). Additionally, aerobic ammonia oxidation by archaea was more prominent at sites G03, G04, and G05 (Figure 6B). These findings highlight the spatial heterogeneity of microbial functional roles in sediment ecosystems.

3.5. Spatial Distributions of Microbial Communities and Their Relationships with Environmental Factors

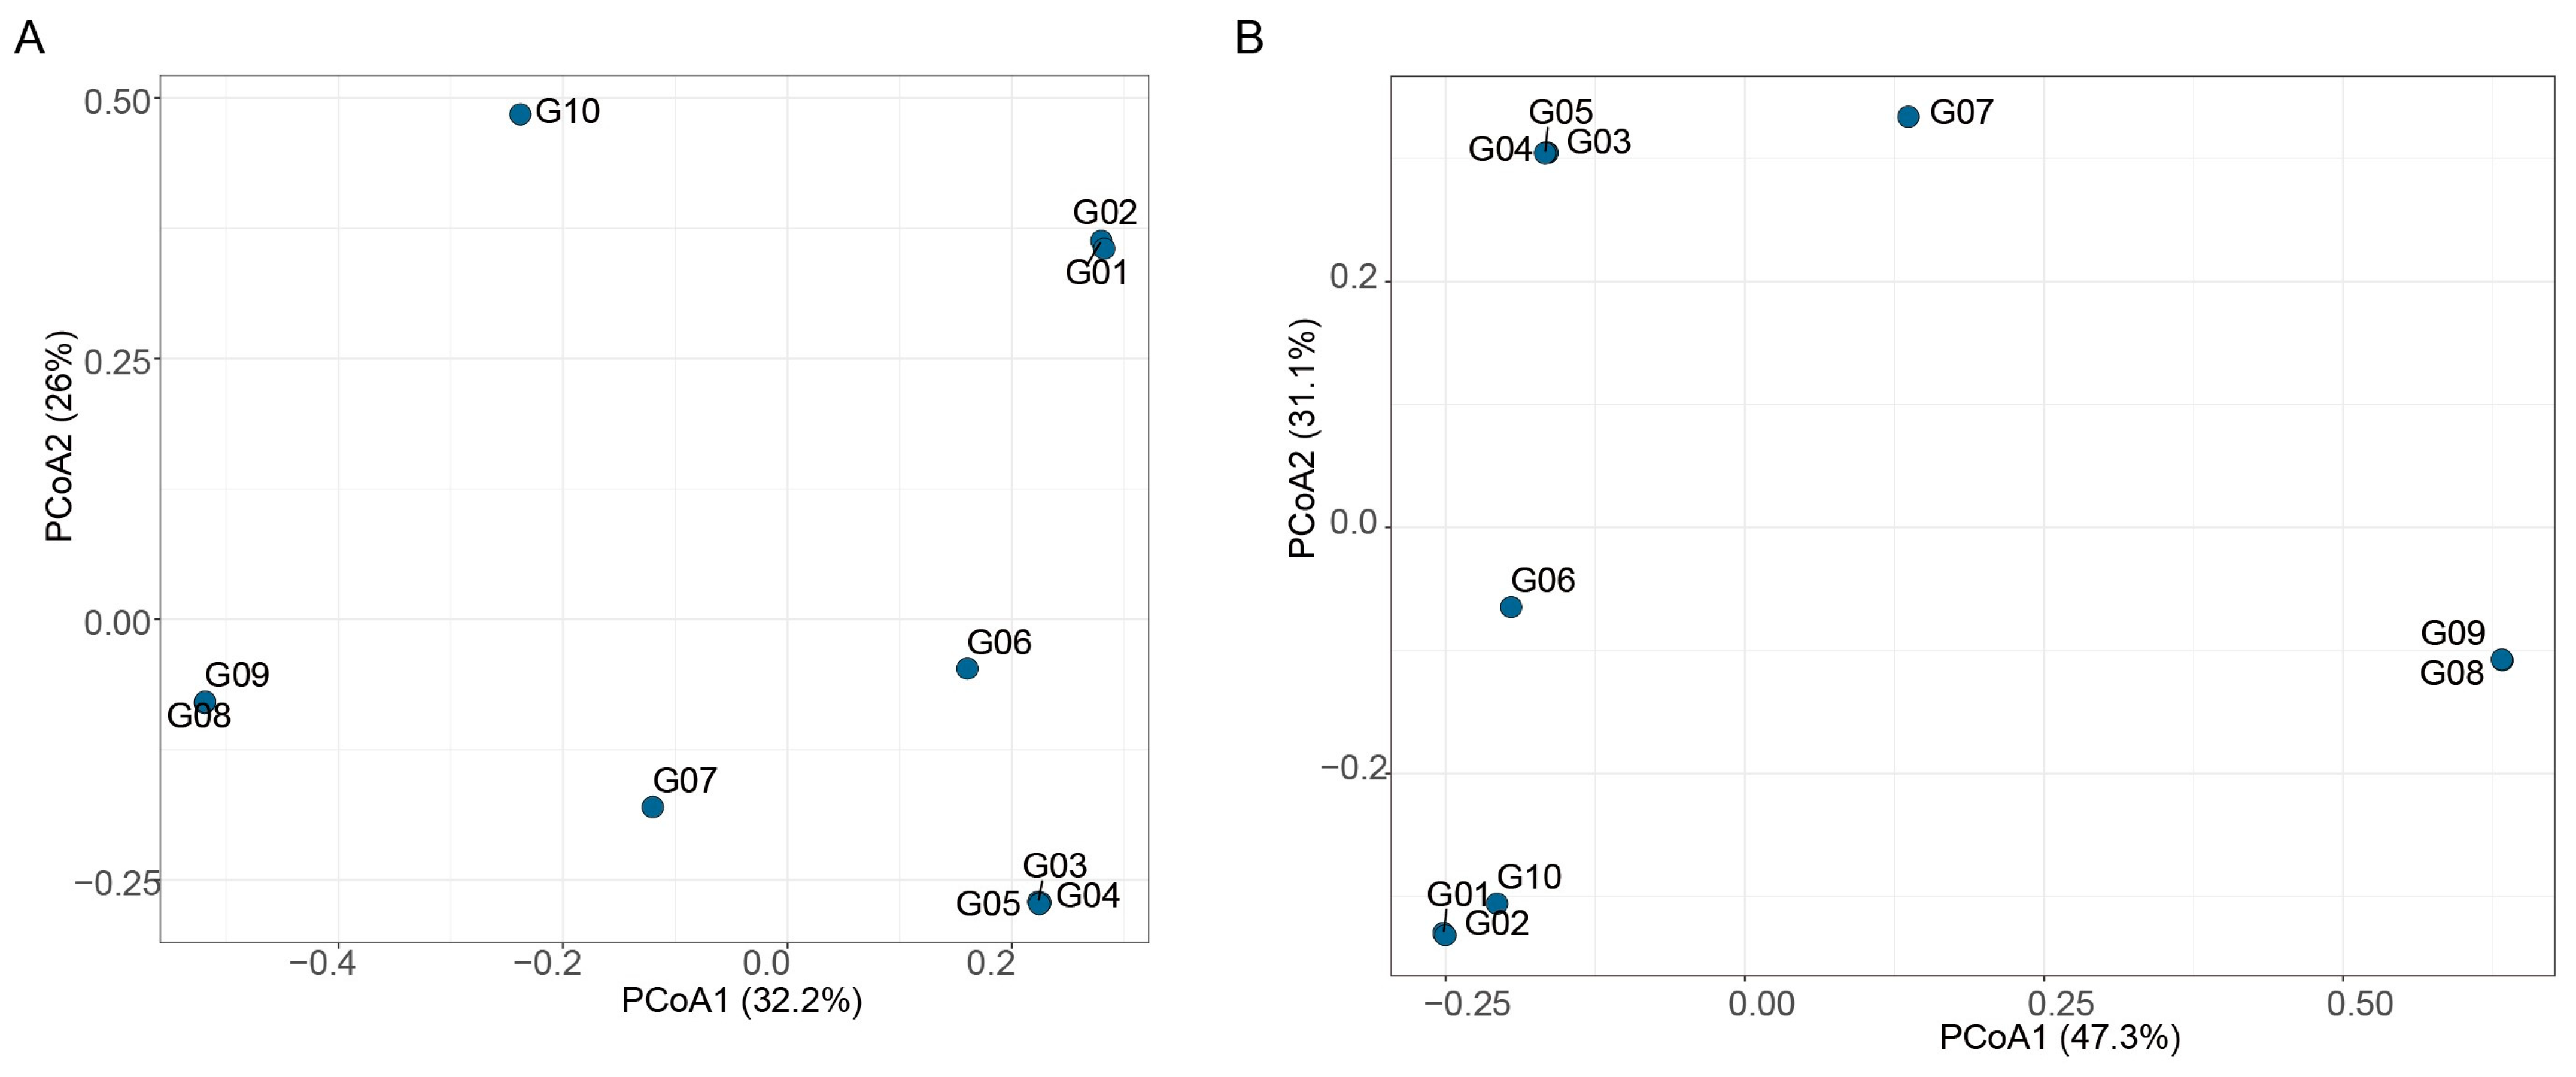
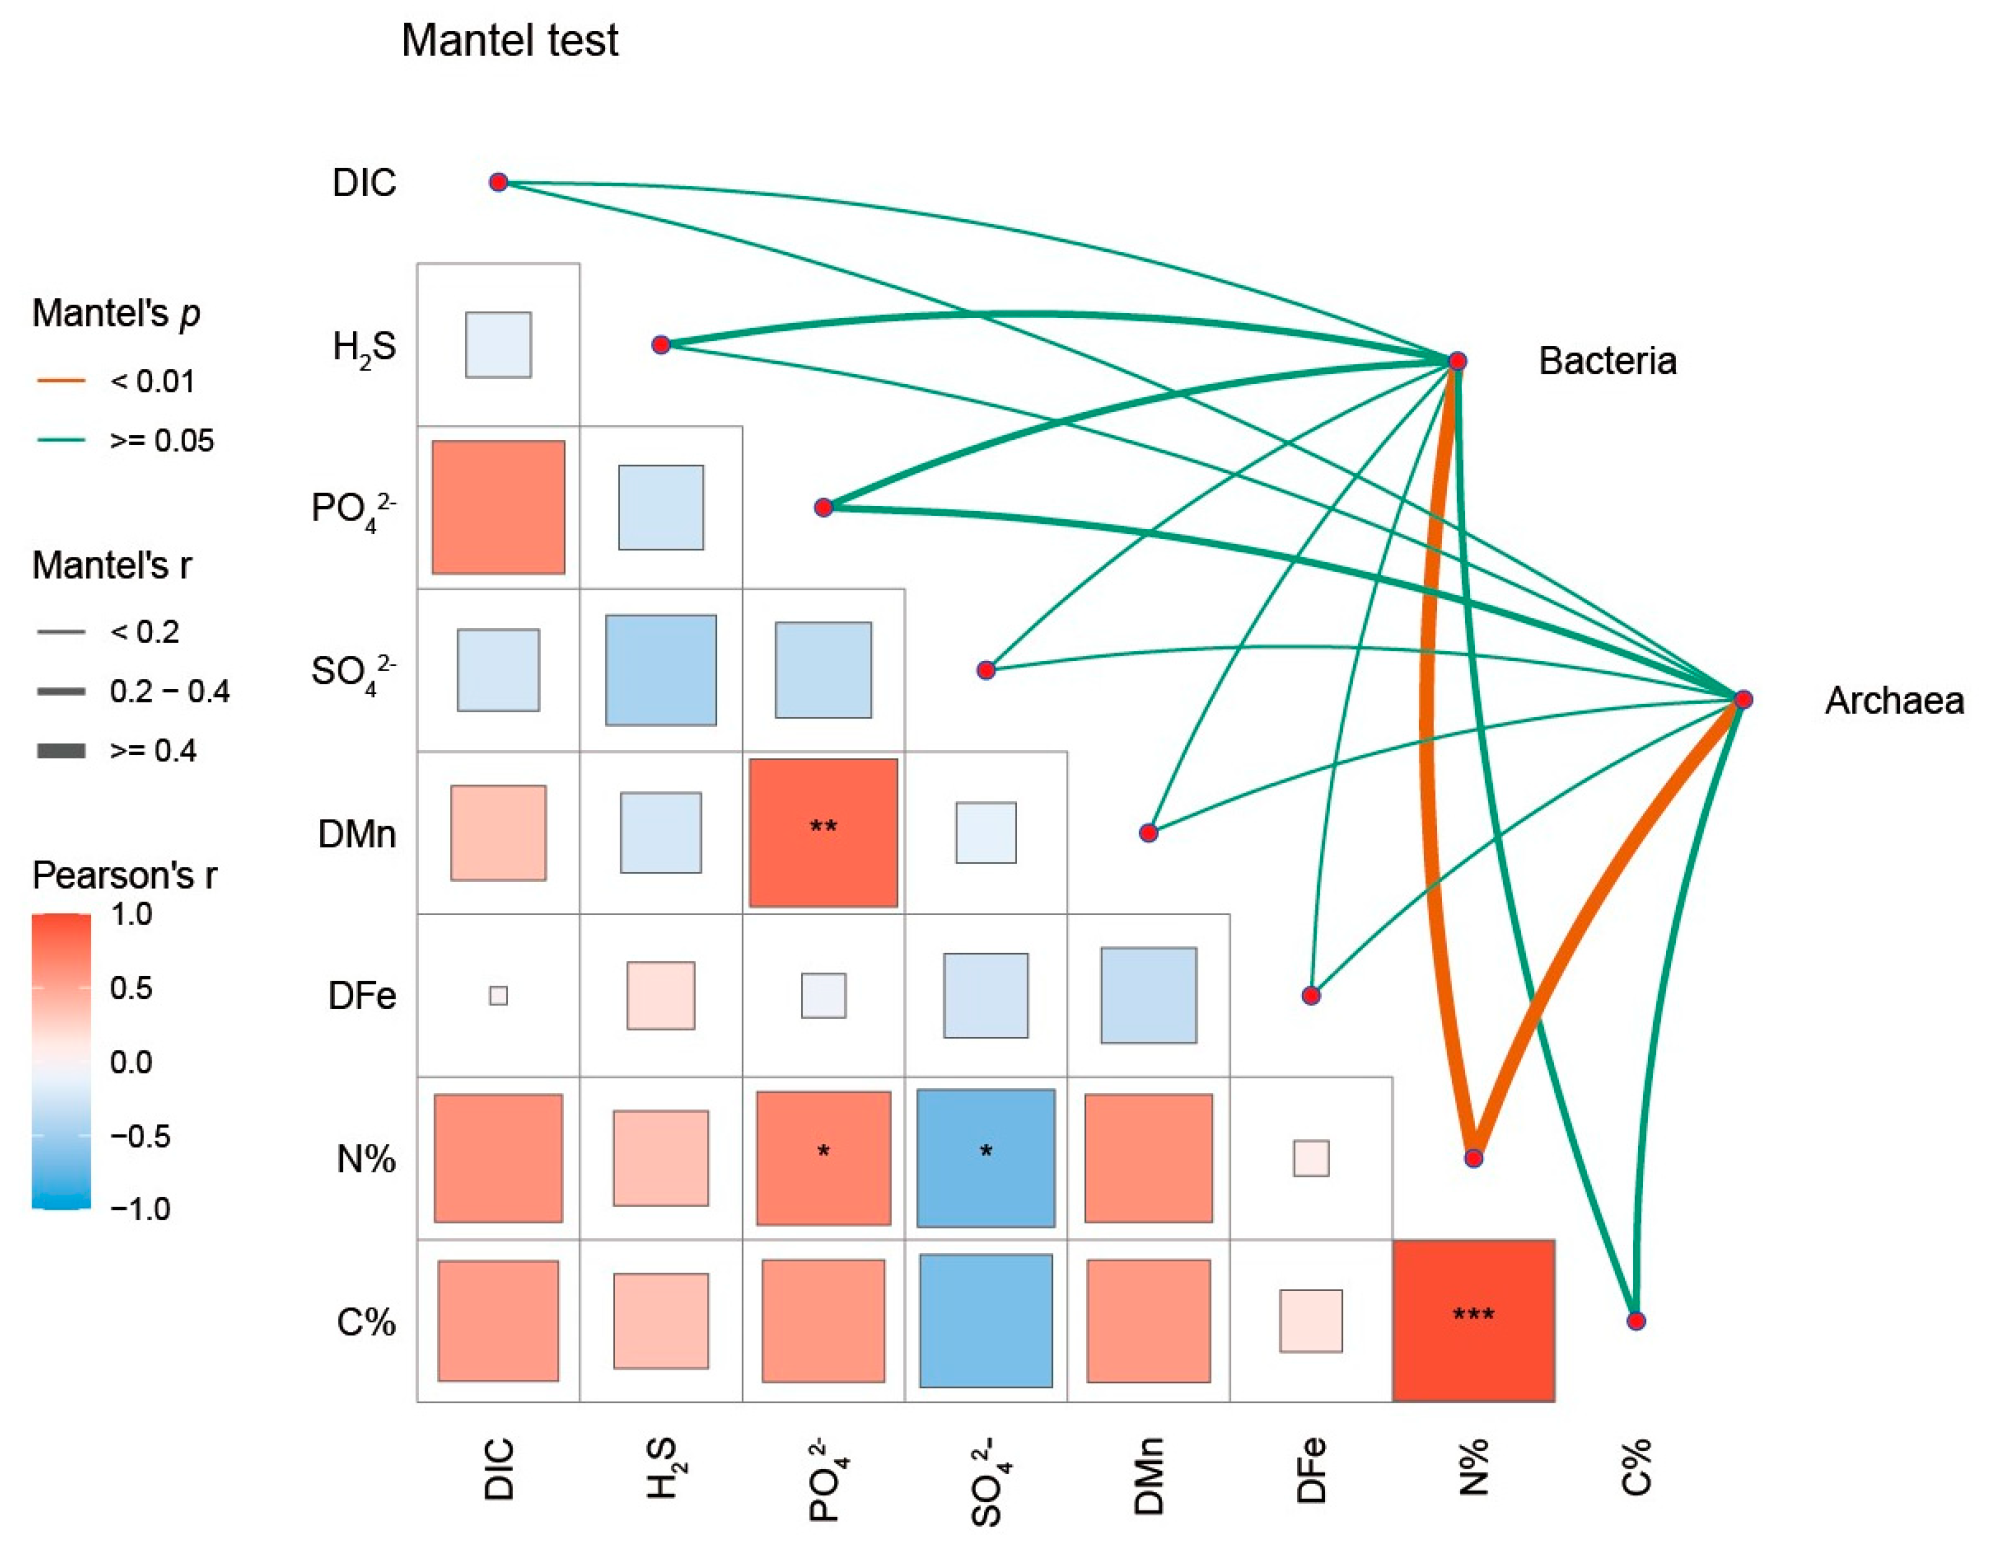
The PCoA analysis revealed that the bacterial and archaeal community compositions of G03, G04, and G05 were closely related, while G01 and G02 exhibited obvious similarity, and two adjacent vent sites, G08 and G09, were also closely related (Figure 7). The archaeal community of G10 exhibited a high degree of similarity with those of G01 and G02. In addition, both the bacterial and archaeal communities in the sampling sites G06 and G07 were separated from the other sampling sites. Environmental variables accounted for 58.2% and 78.4% of the variation in the bacterial and archaeal communities, respectively, as determined by canonical correspondence analysis (CCA) (Figure 8). The composition of the bacterial and archaeal communities was significantly correlated with the contents of carbon and nitrogen, as determined by ANOVA test (p < 0.01). Mantel tests were also conducted to ascertain the relationships between microbial diversity and environmental factors. These tests indicated that organic nitrogen had a significant impact on both archaeal and bacterial communities (p < 0.01) (Figure 9).

4. Discussion

In this study, we explored the diversity, abundance, and key environmental drivers shaping the microbial communities within the transitional zone between hydrothermal vents and cold seeps in the OT. Our results indicate that bacterial and archaeal communities are significantly affected by nitrogen and carbon contents (p < 0.01) (Figure 7). Organic matter content is a fundamental factor influencing marine sediment microbial communities [24,25]. Additionally, microbial communities at the two sampling sites near hydrothermal vents showed remarkable similarity, suggesting that hydrothermal plumes may play a crucial role in structuring these communities. This finding aligns with a study by Zhou et al. [26], which highlights the importance of geological factors in shaping microbial diversity and metabolism in deep-sea hydrothermal vents. In the sampled sites, Hydrothermarchaeota and Thermoplasmata were identified as dominant archaeal groups. Hydrothermarchaeota, previously known as Marine Benthic Group-E, are prevalent in deep-sea hydrothermal environments, such as the crustal fluids of the Juan de Fuca Ridge flank [27]. These archaea are capable of reducing nitrate, sulfate, and possibly metal oxides, cycling carbon monoxide, and potentially synthesizing acetate and fixing CO2 [28,29]. Thermoplasmata, on the other hand, are common in thermophilic environments like hydrothermal vents and geothermal springs [30,31]. They are typically acidophilic and contribute significantly to the iron and sulfur cycles [32]. Among the microbial groups, Chloroflexi, Desulfobacterota, and Bathyarchaeota were the most abundant in the OT sediments. Chloroflexi exhibit a versatile facultative anaerobic metabolism, enabling them to thrive in diverse extreme environments [33]. Their preferred substrates for fermentation include carbohydrates, complex polymers like cellulose, and amino acids [34]. Desulfobacterota (formerly Deltaproteobacteria) primarily consist of sulfate-reducing bacteria and are found across various ecosystems. Bathyarchaeota members can utilize organic matter such as acetate [35], detrital proteins [36], plant sugars [37], and aromatic compounds [38] as growth substrates in anaerobic metabolism and energy production.
Microbes play an indispensable role in driving the biogeochemical cycles for marine ecosystems. Methanogenesis is the final degradation process of organic matter in anoxic environments. The most consistently identified methanogenic group in the studied sediments was the H2-dependent methylotrophic methanogens, specifically the Methanofastidiosales order. Methanofastidiosales are known to produce methane through the reduction in methanol and methylamines, coupled with the oxidation of hydrogen [39]. This methylotrophic methanogenesis pathway has been shown to play an important role in subseafloor anaerobic sediments [40]. Despite the dominance of sulfate-reducing bacteria (SRBs) in cold seep sediments, which often outcompete methanogens for common substrates such as hydrogen or acetate, this competitive pressure can be alleviated by the utilization of non-competitive C₁ substrates by methylotrophic methanogens [41,42,43]. The anaerobic oxidation of methane (AOM) has been identified as an important methane sink in anoxic environments. AOM has the capacity to couple with a variety of electron acceptors, including sulfate, nitrate/nitrite, humic substances, and diverse metal oxides [44]. In addition to the ANME archaea, the following sulfate-reducing taxa were identified in the OT sediments: Desulfobulbales, Desulfobacterales, Thermodesulfovibrionia, Desulfatiglandales, and Syntrophobacterales. SEEP-SRB1 belonging to the Desulfobacterales and SEEP-SRB4 belonging to the Desulfobulbales are known partners of the ANME archaea. SEEP-SRB1 was shown to form coccoid consortia with ANME-1 [45]. SEEP-SRB4 has been proposed to form AOM aggregates with ANME-3 [46]. The family Methylomirabilaceae was found to be dominant in the sampling sites G07, G08, and G09, with the highest abundance recorded at the G07 sampling site. It was hypothesized that Methylomirabilaceae could generate oxygen intracellularly from the nitrate/nitrite reduction, facilitating the oxidation of methane and respiration [47]. Furthermore, aerobic ammonia-oxidizing archaea Nitrosopumilacea were found to be predominant at the G07 site. This finding indicated that the aerobic ammonia oxidation process, which involves the conversion of ammonia to nitrate, may engage in metabolic interaction with the DAMO process by providing the nitrate. The presence of ANMEs conducting AOM coupled with sulfate reduction, including ANME-1b and ANME-2c, was mainly observed at site G02, albeit in minor abundance (<0.1%). In marine sediments, ANMEs clades are usually dominated in the sulfate methane transition zone (SMTZ). In a previous study, it was reported that the sequences affiliated with ANMEs were predominant in the SMTZ of G02 (below 49 cmbsf) [16]. In addition, analysis of the samples revealed that aerobic methanotrophic bacteria from the family Methyloligellaceae were predominant in the transition zone (G03-G06). It was suggested that aerobic methane oxidation might play an important role in regulating methane emissions in these ordinary sediments. It was mentioned that these predictions are not a substitute for direct functional evidence. Therefore, we plan to integrate our findings with metagenomic or metatranscriptomic analyses in future studies to provide a more comprehensive understanding of the microbial activities.

5. Conclusions

In the present study, we found that the microbial community in the surface sediments of the Mid-OT exhibited high spatial heterogeneity. Hydrothermarchaeota and Methylomirabilota were detected as dominant archaeal groups in three sampling sites near the hydrothermal vents (G07, G08, and G09). Additionally, Thermoplasmata dominated the sampling sites G08 and G09. The aerobic ammonia-oxidizing archaea, Nitrosopumilaceae, were found to be prevalent in the surface sediments of the OT, except at the sampling sites near the hydrothermal vents and cold seeps. We identified that the predicted prokaryotic microbial functional groups involved in methyl-reducing methanogenesis and hydrogenotrophic methanogenesis were most abundant at these sampled sites. Functional groups such as hydrocarbon degradation, methanotrophy, methanol oxidation, denitrification, sulfate respiration, and sulfur oxidation played key roles in two sampling sites (G01 and G02). In addition, it was intriguing to find that methane oxidation might couple with various acceptors including nitrate/nitrite, sulfate, and oxidation.

Supplementary Materials

The following supporting information can be downloaded at: https://www.mdpi.com/article/10.3390/jmse13040653/s1, Figure S1: Spatial distribution of sediment bacterial and archaeal richness and diversity, based on 16S rRNA gene analysis, and the composition of Proteobacteria. Table S1: Spatial distribution of sediment bacterial richness and diversity estimates based on the 16S rRNA gene. Table S2: Spatial distribution of sediment archaeal richness and diversity estimates based on the 16S rRNA gene.

Author Contributions

Conceptualization: Y.C.; methodology, Y.C.; software, Y.C.; validation, N.W. and Z.S.; formal analysis, Y.C. and C.X.; investigation, Y.C., C.X., J.L., Y.X., X.Z. and Y.Z.; data curation, Y.C.; writing—original draft preparation, Y.C.; writing—review and editing, N.W. and Z.S.; supervision, N.W. and Z.S.; project administration, N.W. and Z.S.; funding acquisition N.W. and Z.S. All authors have read and agreed to the published version of the manuscript.

Funding

This research was funded by the Laoshan Laboratory (project numbers: LSKJ202203500), National Natural Science Foundation of China (project numbers: 92358301, 42106137, 42176057, and 42106052), and the Marine Geological Survey Program of China Geological Survey (No. DD20230402).

Data Availability Statement

The data supporting the conclusions of this article were deposited into the NCBI Sequence Read Archive (SRA) database (BioProject ID: PRJNA1218044). Further inquiries can be directed to the corresponding authors.

Acknowledgments

The authors thank the captions, crew and scientific parties who participated on board the R/V Haiyang Dizhi 9 organized by the Qingdao Institute of Marine Geology in 2020.

Conflicts of Interest

The authors declare no conflicts of interest.

References

  1. Learman, D.R.; Henson, M.W.; Thrash, J.C.; Temperton, B.; Brannock, P.M.; Santos, S.R.; Mahon, A.R.; Halanych, K.M. Biogeochemical and Microbial Variation across 5500 km of Antarctic Surface Sediment Implicates Organic Matter as a Driver of Benthic Community Structure. Front. Microbiol. 2016, 7, 284. [Google Scholar] [CrossRef]
  2. Stuart, C.T.; Rex, M.A.; Etter, R.J. (Eds.) Large-scale spatial and temporal patterns of deep-sea benthic species diversity. In Ecosystems of the Deep Oceans; Elsevier: Amsterdam, The Netherlands, 2003; pp. 295–312. [Google Scholar]
  3. Ramirez-Llodra, E.; Brandt, A.; Danovaro, R.; De Mol, B.; Escobar, E.; German, C.R.; Levin, L.A.; Martinez Arbizu, P.; Menot, L.; Buhl-Mortensen, P.; et al. Deep, diverse and definitely different: Unique attributes of the world’s largest ecosystem. Biogeosciences 2010, 7, 2851–2899. [Google Scholar] [CrossRef]
  4. Kallmeyer, J.; Pockalny, R.; Adhikari, R.; Smith, D.; D’Hondt, S. Global distribution of microbial abundance and biomas in subseafloor sediment. Proc. Natl. Acad. Sci. USA 2012, 109, 16213–16216. [Google Scholar] [CrossRef] [PubMed]
  5. D’Hondt, S.; Pockalny, R.; Fulfer, V.M.; Spivack, A.J. Subseafloor life and its biogeochemical impacts. Nat. Commun. 2019, 10, 3519. [Google Scholar] [CrossRef] [PubMed]
  6. Probandt, D.; Knittel, K.; Tegetmeyer, H.E.; Ahmerkamp, S.; Holtappels, M.; Amann, R. Permeability shapes bacterial communities in sublittoral surface sediments. Environ. Microbiol. 2017, 19, 1584–1599. [Google Scholar] [CrossRef]
  7. Orsi, W.D. Ecology and evolution of seafloor and subseafloor microbial communities. Nat. Rev. Microbiol. 2018, 16, 671–683. [Google Scholar] [CrossRef]
  8. Hoshino, T.; Doi, H.; Uramoto, G.I.; Wörmer, L.; Adhikari, R.R.; Xiao, N.; Morono, Y.; D’Hondt, S.; Hinrichs, K.U.; Inagaki, F. Global diversity of microbial communities in marine sediment. Proc. Natl. Acad. Sci. USA 2020, 117, 27587–27597. [Google Scholar] [CrossRef]
  9. Shinjo, R.; Kato, Y. Geochemical constraints on the origin of bimodal magmatism at the Okinawa Trough, an incipient back-arc basin. Lithos 2000, 54, 117–137. [Google Scholar]
  10. Glasby, G.; Notsu, K. Submarine hydrothermal mineralization in the Okinawa Trough, SW of Japan: An overview. Ore Geol. Rev. 2003, 23, 299–339. [Google Scholar]
  11. Sun, Z.; Wei, H.; Zhang, X.; Shang, L.; Yin, X.; Sun, Y.; Xu, L.; Huang, W.; Zhang, X. A unique Fe-rich carbonate chimney associated with cold seeps in the Northern Okinawa Trough, East China Sea. Deep. Sea Res. Part I Oceanogr. Res. Pap. 2015, 95, 37–53. [Google Scholar]
  12. Sun, Z.; Wu, N.; Cao, H.; Xu, C.; Liu, L.; Yin, X.; Zhang, X.; Geng, W.; Zhang, X. Hydrothermal metal supplies enhance the benthic methane filter in oceans: An example from the Okinawa Trough. Chem. Geol. 2019, 525, 190–209. [Google Scholar]
  13. Nunoura, T.; Oida, H.; Nakaseama, M.; Kosaka, A.; Ohkubo, S.B.; Kikuchi, T.; Kazama, H.; Hosoi-Tanabe, S.; Nakamura, K.-i.; Kinoshita, M. Archaeal diversity and distribution along thermal and geochemical gradients in hydrothermal sediments at the Yonaguni Knoll IV hydrothermal field in the Southern Okinawa Trough. Appl. Environ. Microbiol. 2010, 76, 1198–1211. [Google Scholar] [PubMed]
  14. Yanagawa, K.; Breuker, A.; Schippers, A.; Nishizawa, M.; Ijiri, A.; Hirai, M.; Takaki, Y.; Sunamura, M.; Urabe, T.; Nunoura, T. Microbial community stratification controlled by the subseafloor fluid flow and geothermal gradient at the Iheya North hydrothermal field in the Mid-Okinawa Trough (Integrated Ocean Drilling Program Expedition 331). Appl. Environ. Microbiol. 2014, 80, 6126–6135. [Google Scholar] [PubMed]
  15. Wang, L.; Yu, M.; Liu, Y.; Liu, J.; Wu, Y.; Li, L.; Liu, J.; Wang, M.; Zhang, X.-H. Comparative analyses of the bacterial community of hydrothermal deposits and seafloor sediments across Okinawa Trough. J. Mar. Syst. 2018, 180, 162–172. [Google Scholar] [CrossRef]
  16. Chen, Y.; Xu, C.; Wu, N.; Sun, Z.; Liu, C.; Zhen, Y.; Xin, Y.; Zhang, X.; Geng, W.; Cao, H.; et al. Diversity of Anaerobic Methane Oxidizers in the Cold Seep Sediments of the Okinawa Trough. Front. Microbiol. 2022, 13, 819187. [Google Scholar] [CrossRef]
  17. Chen, Y.; Dong, X.; Sun, Z.; Xu, C.; Zhang, X.; Qin, S.; Geng, W.; Cao, H.; Zhai, B.; Li, X.; et al. Potential coupling of microbial methane, nitrogen, and sulphur cycling in the Okinawa Trough cold seep sediments. Microbiol. Spectr. 2024, 12, e03490-23. [Google Scholar] [CrossRef]
  18. Wu, N.; Xu, C.; Li, A.; Cao, H.; Chen, Y.; Zhang, X.; Geng, W.; Zhai, B.; Li, Q.; Sun, Z. Oceanic carbon cycle in a symbiotic zone between hydrothermal vents and cold seeps in the Okinawa Trough. Geosyst. Geoenviron. 2022, 1, 100059. [Google Scholar] [CrossRef]
  19. Lee, C.K.; Barbier, B.A.; Bottos, E.M.; McDonald, I.R.; Cary, S.C. The Inter-Valley Soil Comparative Survey: The ecology of Dry Valley edaphic microbial communities. ISME J. 2012, 6, 1046–1057. [Google Scholar] [CrossRef]
  20. Coolen, M.J.L.; Hopmans, E.C.; Rijpstra, W.I.C.; Muyzer, G.; Schouten, S.; Volkman, J.K.; Sinninghe Damsté, J.S. Evolution of the methane cycle in Ace Lake (Antarctica) during the Holocene: Response of methanogens and methanotrophs to environmental change. Org. Geochem. 2004, 35, 1151–1167. [Google Scholar] [CrossRef]
  21. Callahan, B.J.; McMurdie, P.J.; Rosen, M.J.; Han, A.W.; Johnson, A.J.; Holmes, S.P. DADA2: High-resolution sample inference from Illumina amplicon data. Nat. Methods 2016, 13, 581–583. [Google Scholar] [CrossRef]
  22. Borcard, D.; Gillet, F.; Legendre, P. Canonical ordination. In Numerical Ecology With R; Springer International Publishing: Cham, Switzerland, 2011; pp. 203–297. [Google Scholar]
  23. Louca, S.; Parfrey, L.W.; Doebeli, M. Decoupling function and taxonomy in the global ocean microbiome. Science 2016, 353, 1272–1277. [Google Scholar] [CrossRef] [PubMed]
  24. Liu, J.; Liu, X.; Wang, M.; Qiao, Y.; Zheng, Y.; Zhang, X.-H. Bacterial and archaeal communities in sediments of the north Chinese marginal seas. Microb. Ecol. 2015, 70, 105–117. [Google Scholar] [CrossRef] [PubMed]
  25. Oni, O.E.; Schmidt, F.; Miyatake, T.; Kasten, S.; Witt, M.; Hinrichs, K.-U.; Friedrich, M.W. Microbial communities and organic matter composition in surface and subsurface sediments of the Helgoland mud area, North Sea. Front. Microbiol. 2015, 6, 1290. [Google Scholar] [CrossRef] [PubMed]
  26. Zhou, Z.; St John, E.; Anantharaman, K.; Reysenbach, A.-L. Global patterns of diversity and metabolism of microbial communities in deep-sea hydrothermal vent deposits. Microbiome 2022, 10, 241. [Google Scholar] [CrossRef]
  27. Jungbluth, S.P.; Amend, J.P.; Rappé, M.S. Metagenome sequencing and 98 microbial genomes from Juan de Fuca Ridge flank subsurface fluids. Sci. Data 2017, 4, 170037. [Google Scholar] [CrossRef]
  28. Carr, S.A.; Jungbluth, S.P.; Eloe-Fadrosh, E.A.; Stepanauskas, R.; Woyke, T.; Rappé, M.S.; Orcutt, B.N. Carboxydotrophy potential of uncultivated Hydrothermarchaeota from the subseafloor crustal biosphere. ISME J. 2019, 13, 1457–1468. [Google Scholar] [CrossRef]
  29. Kato, S.; Nakano, S.; Kouduka, M.; Hirai, M.; Suzuki, K.; Itoh, T.; Ohkuma, M.; Suzuki, Y. Metabolic Potential of As-yet-uncultured Archaeal Lineages of Candidatus Hydrothermarchaeota Thriving in Deep-sea Metal Sulfide Deposits. Microbes Environ. 2019, 34, 293–303. [Google Scholar] [CrossRef]
  30. Vilhelmsson, O.; Sigurbjornsdottir, M.A.; Thorsteinsdottir, G.V.; Cascone, M.; Corso, D.; Tonietti, L.; Migliaccio, F.; Nappi, N.; Ricciardelli, A.; Selci, M. Diversity of Thermophilic Prokaryotes. In Thermophilic Anaerobes: Phylogeny, Physiology and Biotechnological Applications; Springer: Berlin/Heidelberg, Germany, 2023; pp. 21–90. [Google Scholar]
  31. Qi, Y.-L.; Chen, Y.-T.; Xie, Y.-G.; Li, Y.-X.; Rao, Y.-Z.; Li, M.-M.; Xie, Q.-J.; Cao, X.-R.; Chen, L.; Qu, Y.-N.; et al. Analysis of nearly 3000 archaeal genomes from terrestrial geothermal springs sheds light on interconnected biogeochemical processes. Nat. Commun. 2024, 15, 4066. [Google Scholar] [CrossRef]
  32. Maszenan, A.; Seviour, R.; Patel, B.; Janssen, P.; Wanner, J. Defluvicoccus vanus gen. nov., sp. nov., a novel Gram-negative coccus/coccobacillus in the ‘Alphaproteobacteria’ from activated sludge. Int. J. Syst. Evol. Microbiol. 2005, 55, 2105–2111. [Google Scholar] [CrossRef]
  33. Freches, A.; Fradinho, J.C. The biotechnological potential of the Chloroflexota phylum. Appl. Environ. Microbiol. 2024, 90, e01756-23. [Google Scholar] [CrossRef]
  34. Petriglieri, F.; Kondrotaite, Z.; Singleton, C.; Nierychlo, M.; Dueholm Morten, K.D.; Nielsen Per, H. A comprehensive overview of the Chloroflexota community in wastewater treatment plants worldwide. mSystems 2023, 8, e0066723. [Google Scholar] [CrossRef] [PubMed]
  35. Webster, G.; Rinna, J.; Roussel, E.G.; Fry, J.C.; Weightman, A.J.; Parkes, R.J. Prokaryotic functional diversity in different biogeochemical depth zones in tidal sediments of the Severn Estuary, UK, revealed by stable-isotope probing. FEMS Microbiol. Ecol. 2010, 72, 179–197. [Google Scholar] [CrossRef]
  36. Lloyd, K.G.; Schreiber, L.; Petersen, D.G.; Kjeldsen, K.U.; Lever, M.A.; Steen, A.D.; Stepanauskas, R.; Richter, M.; Kleindienst, S.; Lenk, S. Predominant archaea in marine sediments degrade detrital proteins. Nature 2013, 496, 215–218. [Google Scholar] [CrossRef] [PubMed]
  37. Lazar, C.S.; Baker, B.J.; Seitz, K.; Hyde, A.S.; Dick, G.J.; Hinrichs, K.U.; Teske, A.P. Genomic evidence for distinct carbon substrate preferences and ecological niches of B athyarchaeota in estuarine sediments. Environ. Microbiol. 2016, 18, 1200–1211. [Google Scholar]
  38. Meng, J.; Xu, J.; Qin, D.; He, Y.; Xiao, X.; Wang, F. Genetic and functional properties of uncultivated MCG archaea assessed by metagenome and gene expression analyses. ISME J. 2014, 8, 650–659. [Google Scholar] [CrossRef]
  39. Zhang, C.-J.; Pan, J.; Liu, Y.; Duan, C.-H.; Li, M. Genomic and transcriptomic insights into methanogenesis potential of novel methanogens from mangrove sediments. Microbiome 2020, 8, 94. [Google Scholar] [CrossRef]
  40. Vigneron, A.; L’Haridon, S.; Godfroy, A.; Roussel Erwan, G.; Cragg Barry, A.; Parkes, R.J.; Toffin, L. Evidence of Active Methanogen Communities in Shallow Sediments of the Sonora Margin Cold Seeps. Appl. Environ. Microbiol. 2015, 81, 3451–3459. [Google Scholar] [CrossRef]
  41. Maltby, J.; Sommer, S.; Dale, A.W.; Treude, T. Microbial methanogenesis in the sulfate-reducing zone of surface sediments traversing the Peruvian margin. Biogeosciences 2016, 13, 283–299. [Google Scholar] [CrossRef]
  42. Xiao, K.-Q.; Beulig, F.; Kjeldsen, K.U.; Jørgensen, B.B.; Risgaard-Petersen, N. Concurrent Methane Production and Oxidation in Surface Sediment from Aarhus Bay, Denmark. Front. Microbiol. 2017, 8, 1198. [Google Scholar] [CrossRef]
  43. Xiao, K.-Q.; Beulig, F.; Røy, H.; Jørgensen, B.B.; Risgaard-Petersen, N. Methylotrophic methanogenesis fuels cryptic methane cycling in marine surface sediment. Limnol. Oceanogr. 2018, 63, 1519–1527. [Google Scholar] [CrossRef]
  44. Zhao, Y.; Liu, Y.; Cao, S.; Hao, Q.; Liu, C.; Li, Y. Anaerobic oxidation of methane driven by different electron acceptors: A review. Sci. Total Environ. 2024, 946, 174287. [Google Scholar] [PubMed]
  45. Wegener, G.; Krukenberg, V.; Riedel, D.; Tegetmeyer, H.E.; Boetius, A. Intercellular wiring enables electron transfer between methanotrophic archaea and bacteria. Nature 2015, 526, 587–590. [Google Scholar] [PubMed]
  46. Ruff, S.E.; Biddle, J.F.; Teske, A.P.; Knittel, K.; Boetius, A.; Ramette, A. Global dispersion and local diversification of the methane seep microbiome. Proc. Natl. Acad. Sci. USA 2015, 112, 4015–4020. [Google Scholar]
  47. Zhu, B.; Karwautz, C.; Andrei, S.; Klingl, A.; Pernthaler, J.; Lueders, T. A novel Methylomirabilota methanotroph potentially couples methane oxidation to iodate reduction. mLife 2022, 1, 323–328. [Google Scholar] [PubMed]
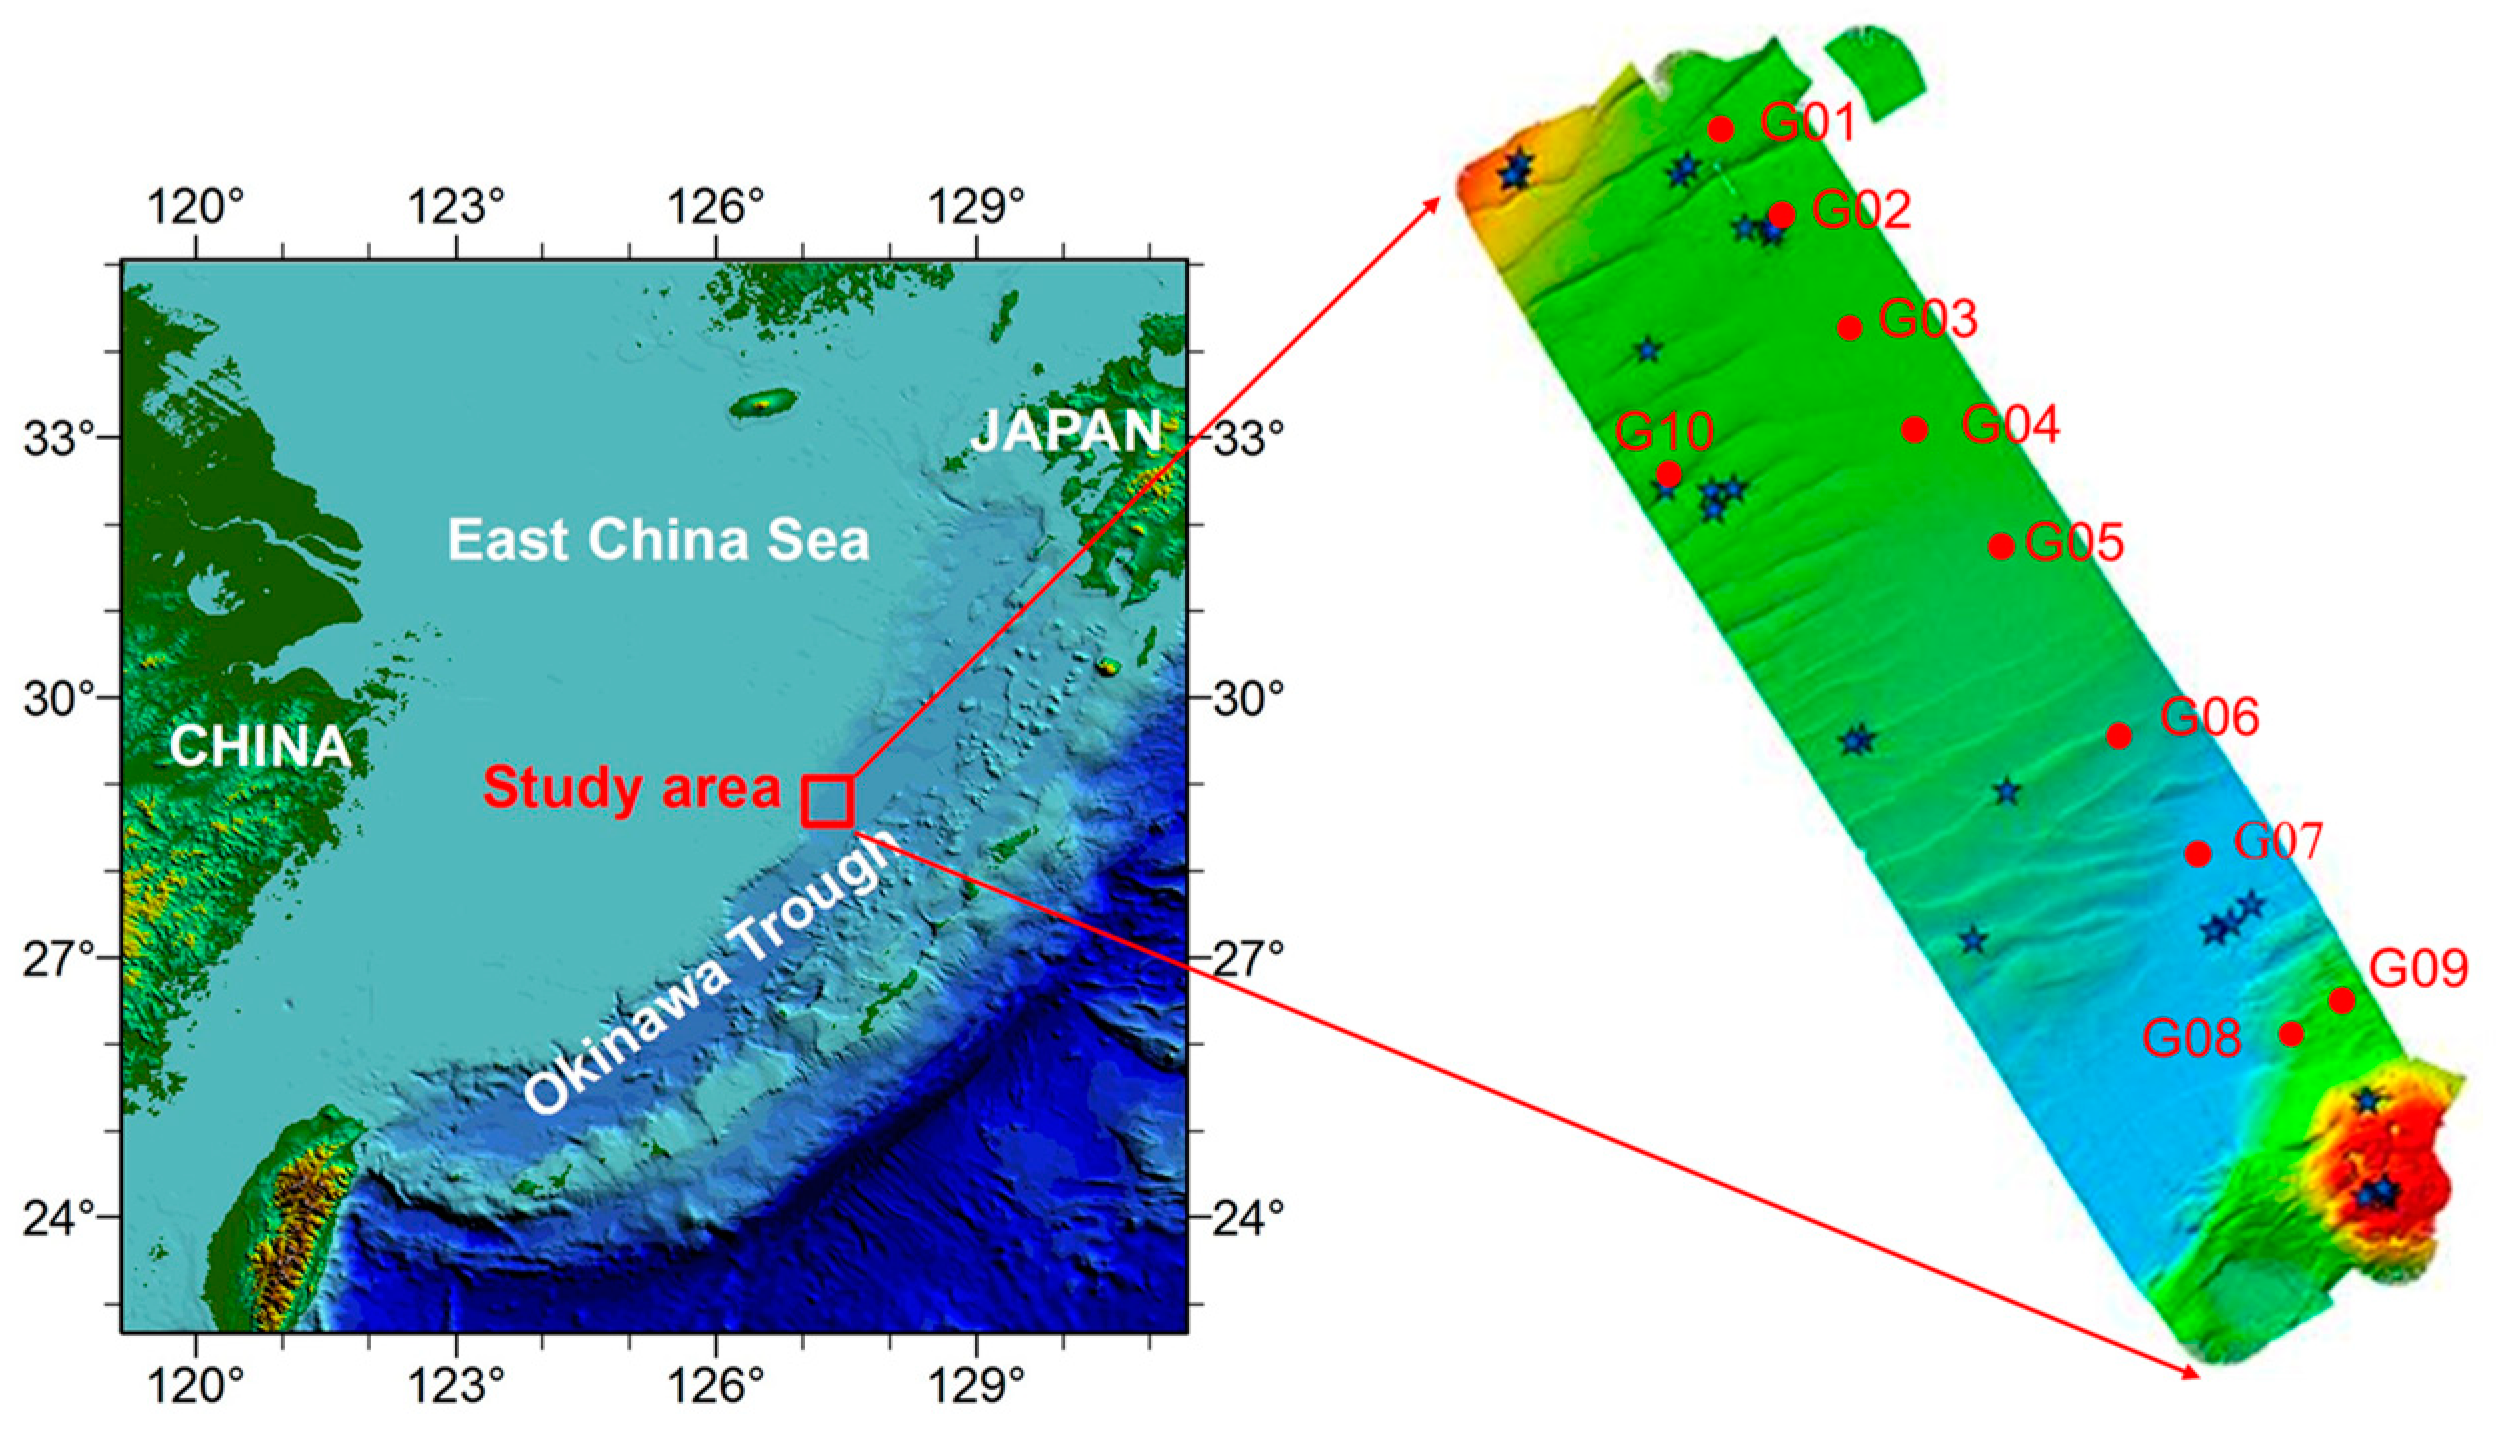
Figure 1. Sampling collection of sampling sites (redrawn from [18]). The cold seep sampling sit (G02) and hydrothermal field of Minami-Ensei Knoll is about 50 km. The five-pointed stars represent the distribution of acoustic plumes in water, and the red circle represents the sampling site.
Jmse 13 00653 g001
Figure 2. The total 16S rRNA gene abundance of the microbial community and the percentage of archaeal abundance in the total microbial abundance were measured in the OT surface sediments. The abundance of the microbial community at sampling site G10 was not determined.
Jmse 13 00653 g002
Figure 3. Relative abundance of bacterial groups (at phylum level) (A) and archaeal groups (at class level). (B) observed in 10 sampling sites from the OT.
Jmse 13 00653 g003
Figure 4. Distribution and proportion of microbial groups in the ten sampling sites (one side of the circle is the sample group, the other side is the dominant bacterial groups at phylum level (A) and archaeal groups at class level (B).
Jmse 13 00653 g004
Figure 5. Relative abundances of key microbial groups: (A) sulfur-reducing bacteria (SRB) and sulfur-oxidizing bacteria (SOB) derived from bacterial sequences; (B) anerobic and aerobic methanotrophic bacteria obtained from bacterial sequences; (C) methanogens and anaerobic methanotrophic archaea (ANME) derived from archaeal sequences; (D) ammonia-oxidizing archaea (AOA) retrieved from archaeal sequences.
Jmse 13 00653 g005
Figure 6. Heatmap of the abundance of predicted bacterial (A) and archaeal (B) functional groups based on carbon, nitrogen, and sulfur cycles summarized by sampling site.
Jmse 13 00653 g006
Figure 7. PCoA analysis based on a Bray–Curtis distance matrix to examine the compositional differences in bacterial communities (A) and archaeal communities (B) at the ASV level.
Jmse 13 00653 g007
Figure 8. CCA biplot of environmental parameters and bacterial composition (A) and archaeal composition (B) at the ASV level. Correlation coefficient with a p-value score less than 0.05 is labeled with “*”. The red color indicates the sampling sites, while the black color denotes the environmental factors.
Jmse 13 00653 g008
Figure 9. Mantel correlation analysis was performed to assess the relationships between environmental factors and microbial communities in the OT surface sediments. The analysis was based on the R-value and p-value calculations using the R package ggcor (version 4.3.2). Correlation coefficients with p-values less than 0.05 are labeled with “*”, less than 0.01 with “**”, and less than 0.001 with “***”. In the visualization, the color of the lines indicates the p-value, whereas the thickness of the lines corresponds to the R-value. Additionally, on the left side, Pearson correlation analysis was conducted for each environmental factor. The color and size of the squares represent the strength and direction of the correlation, respectively.
Jmse 13 00653 g009
Table 1. Concentration profiles of environmental parameters in porewater samples from multiple sites in the OT, showing spatial variability.
SiteWater Depth (m)CH4 (µM)DIC (mM)DOC (mM)H2S (µM)NO3 (nM)PO42− (µM)NH4+
(µM)
SO42− (Mm)dMn (µM)dFe (µM)
G01922 3.5664.5727.22
G0295626.261.841.461.27 1.4028.2727.434.6219.85
G0310101.562.090.870.61384.784.2956.4827.6349.8326.38
G0410420.701.931.200.4617.391.90103.1127.7356.5810.96
G0510761.261.800.700.46302.173.7346.6928.46171.7313.60
G0611073.592.170.750.1210.872.4738.6328.7146.4210.14
G071167 2.10 0.38 6.2142.9227.41170.591.05
G0810780.591.720.460.3950.000.596.6729.508.316.22
G099950.461.660.630.22228.260.844.4827.893.1915.10
G1010300.731.860.731.48 1.023.3927.6636.877.54
Disclaimer/Publisher’s Note: The statements, opinions and data contained in all publications are solely those of the individual author(s) and contributor(s) and not of MDPI and/or the editor(s). MDPI and/or the editor(s) disclaim responsibility for any injury to people or property resulting from any ideas, methods, instructions or products referred to in the content.