Article

Morphodynamics and Successional Characteristics of Bowl Blowout in the Late Stage of Coastal Foredune

1
College of Soil and Water Conservation, Southwest Forestry University, Kunming 650224, China
2
School of Geography and Planning, Sun Yat-sen University, Guangzhou 510275, China
3
School of Resources and Planning, Guangzhou Xinhua University, Guangzhou 510520, China
4
School of Tourism and Geography, Shaoguan University, Shaoguan 512005, China
*
Author to whom correspondence should be addressed.
J. Mar. Sci. Eng. 2025, 13(4), 638; https://doi.org/10.3390/jmse13040638
Submission received: 6 March 2025 / Revised: 19 March 2025 / Accepted: 20 March 2025 / Published: 23 March 2025
(This article belongs to the Special Issue Morphological Changes in the Coastal Ocean)

Abstract

:
Coastal foredune blowout is a significant indicator of shoreline retreat, activation of backshore dune fields, and land desertification. Among current research on the terminal phase of coastal foredune blowouts, few studies explain blowouts’ morphological and airflow interaction mechanisms in the late stage through comprehensive field surveys and observations. In this study, the coastal blowout on the foredune at Tannanwan Beach, Pingtan Island, China, is investigated to explore the morphodynamics and evolutionary characteristics of blowout morphology. High-resolution RTK GPS technology and two-dimensional ultrasonic anemometers are utilized to repeatedly measure and observe the morphology of late-stage bowl blowouts. The results revealed that the following: (1) During the entire survey period, the bowl blowout is characterized by deepening erosion of the lateral walls and accretion in the deflation basin, with the maximum erosion depth on the east lateral wall reaching up to 3.99 m and the maximum accumulation height occurring in the front half of the deflation basin. (2) The wind direction and the morphology of the bowl blowout significantly impact the airflow characteristics within the blowout, and the airflow distribution within the blowout further affects the development of the blowout morphology. (3) The bowl blowout is in the late stage of its life cycle.

1. Introduction

Blowouts are depressions formed by aeolian erosion or the aeolian deflation of sand grains in dunes. They are characterized by saucer-, cup-, or trough-shaped depressions or hollows. The aeolian sand accumulation behind the blowout forms various geomorphological features (aeolian sand accumulation areas), which are also part of the blowout [1,2]. Blowouts are complex aeolian landforms that occur in coastal dunes, lake shores, arid (desert), semi-arid, semi-humid sandy grasslands, and desert areas [3,4,5,6,7,8,9,10,11,12,13]. Due to the diverse environmental, material, dynamic conditions, and development processes, the study of blowouts has consistently been a focus of Aeolian landform research. In recent years, research on coastal dune blowouts has primarily concentrated on their basic morphology, development conditions, dynamic mechanisms, and evolutionary processes [8,14,15,16,17,18,19,20]. Researchers have concluded that blowouts developing at the interface of beaches and foredunes or shore-back dunes serve as crucial channels for sediment transfer between beaches and foredunes. In addition, they are significant indicators of coastal erosion, dune activation behind the shore, and land desertification.
The evolution of coastal foredune trough blowouts occurs in four stages: (1) formation of erosion gaps; (2) expansion and deepening of the trough mouth, initiating blowouts; (3) continuous erosion within the blowout up to the backshore height, widening the blowout walls; and (4) ending of erosion and beginning of accumulation, leading to blowout die out [18]. Studies have shown that when the blowout reaches the erosion base level, or the morphology restricts erosion, it tends to stabilize [21]. This stabilization occurs when the blowout becomes too wide to generate accelerating flow that raises sediment transport and continuous erosion, or when its area reaches a certain extent and is affected by the resistance of the underlying layer and surrounding vegetation, as well as the local airflow within the blowout. Therefore, the expansion of the blowout can decrease or stop [1,8,22], and the blowout will enter the demise stage [23,24]. However, there is currently a lack of comprehensive research on the morphological characteristics of late-stage bowl blowouts. During blowout formation and development [25], when airflow enters the blowout, the fluid pressure alters due to the change in topography, resulting in changes in wind speed and direction. These changes lead to variations in sediment erosion, deposition, and transport. Such processes cause morphological changes, producing a morphodynamic feedback effect on the flow. The interaction between wind dynamics and topography has always been the core focus of blowout research. However, only Gares has conducted a detailed study on the morphology and airflow pattern of different developmental stage trough blowouts under the same wind conditions using the “time-space substitution” method [18], and there is limited knowledge about the morphology-dynamic process of late-stage bowl blowouts.
Therefore, based on the cyclic evolution model of coastal foredune blowouts and the conceptual framework model for the reactivation of supply-limited blowouts in dune fields [18,21], this study selects a typical late-stage bowl blowout in the coastal dune area of Pingtan Island as the research object. The basic characteristics of the late-stage bowl blowout are investigated through fieldwork, and the morphological and airflow interaction mode of the bowl blowout is elucidated through high-precision repeated surveys and wind flow dynamics observations of the bowl blowout. The main issues addressed in this study are as follows: (1) the interaction mechanism between the morphology and airflow of the bowl blowout; and (2) the essential characteristics of the bowl blowout in the late stage. This study aims to reveal the morphological dynamic processes and late-stage characteristics of the bowl blowout, providing a scientific basis for the sustainable protection, utilization, and development of coastal dune landscapes.

2. Materials and Methods
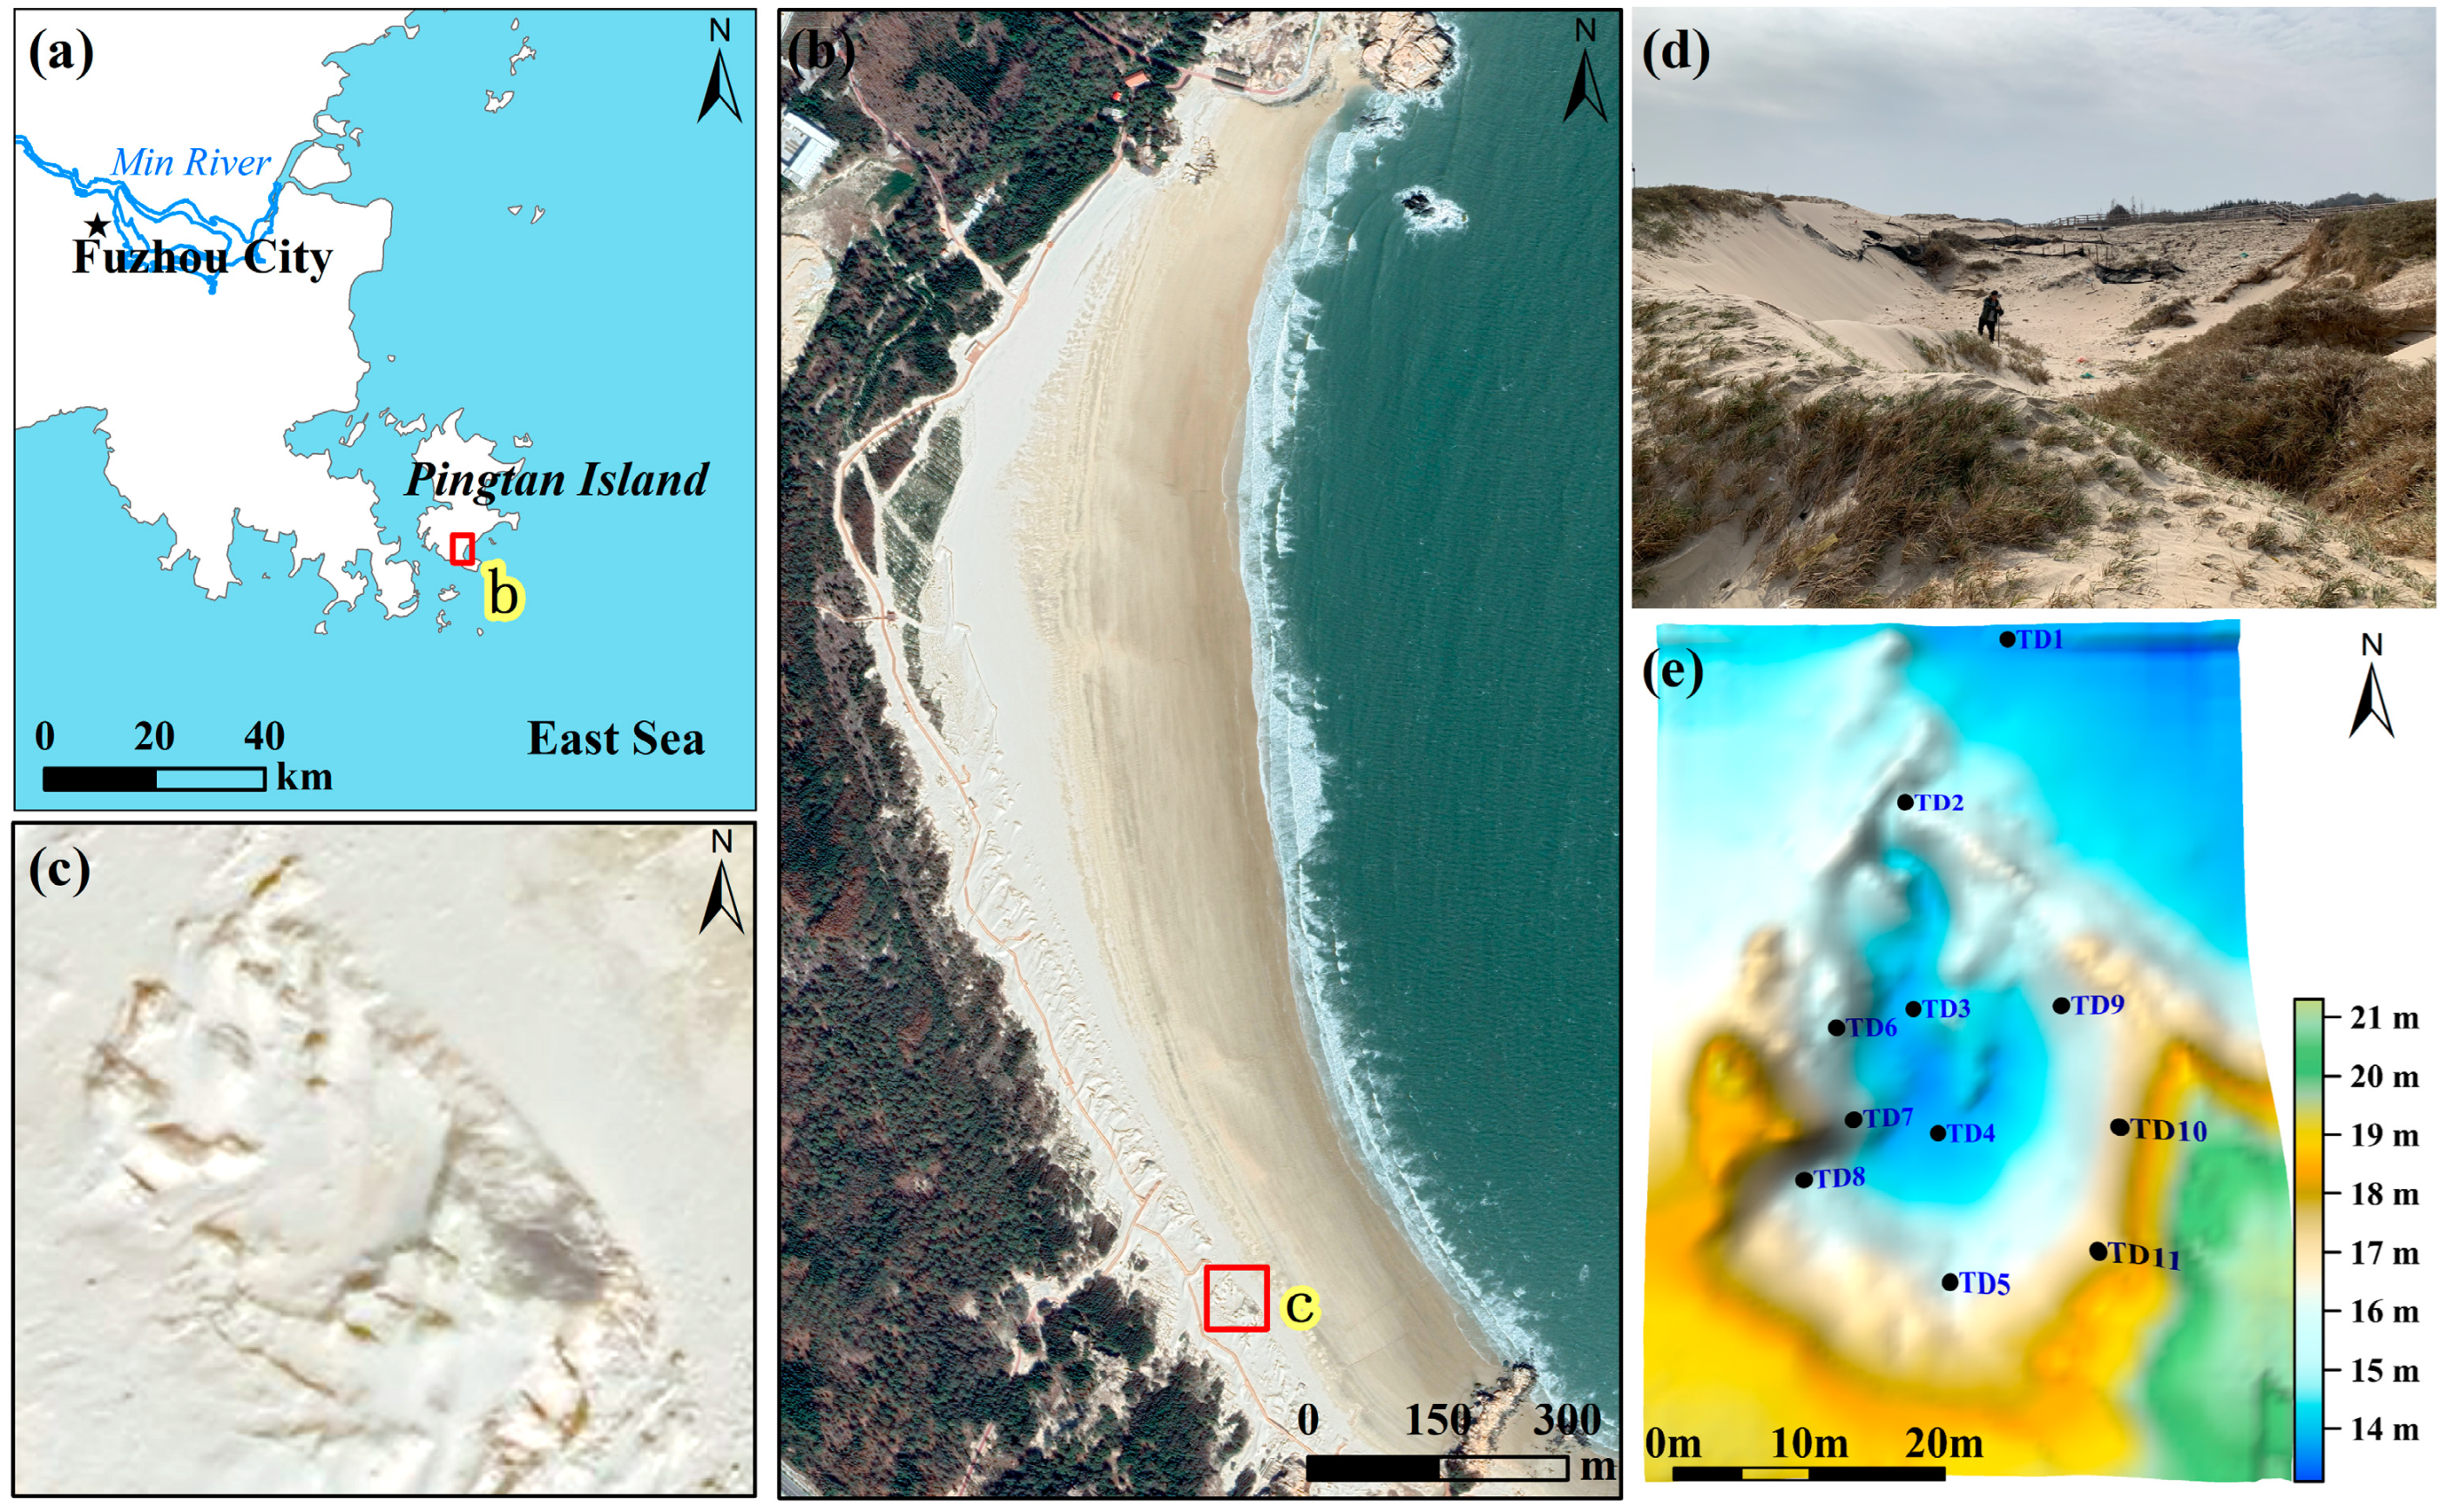
2.1. Study Area

Fujian Pingtan Island (25°15′–25°45′ N, 119°32′–120°10′ E) is situated on the west coast of the Taiwan Strait. This region experiences strong, persistent northeasterly onshore winds at the strait’s horn mouth [26], the abundant sand supply from the Min River, and the suitable topographic conditions of the island’s cape bay distribution have contributed to developing Pingtan Island’s rich coastal aeolian landforms (Figure 1a). The island features an aeolian landform area of approximately 86.85 km2, including numerous typical aeolian accumulation and erosion landforms [26] (Figure 1a). Climatically, it is classified as part of the South China Sea subtropical monsoon climate, with an average annual wind speed of 4.8 m/s. From March to June, the prevailing wind direction is primarily from the southwest, while, for the remainder of the months, it is mainly from the northeast. This creates a wind energy environment characterized by low wind energy, medium variability, and sharp bimodal wind conditions [27]. The island experiences frequent windy days and significant typhoon activity, with 110 recorded typhoon impacts between 1981 and 2017, typically two to five times yearly, mainly from July to September. The maximum wind speed caused by typhoons reaches 25.0 m/s, often generating winds exceeding 10 m/s, greatly influencing the morphology and evolution of aeolian landforms [27].
Tannan Bay is situated southeast of Pingtan Island, between two cape promontories along a sandy coast. The southern shoreline primarily extends in the NNW direction, while the northern section extends almost in the NNE direction (Figure 1b). The northern shoreline, characterized by its small angle or parallel orientation to the prevailing northeast wind, experiences minimal effective force for sand transport and accumulation by the northeast prevailing wind, resulting in weak dynamic characteristics of the aeolian sand in this region. The morphology of the sand dunes is also influenced by the bay’s structure [28]. The southern shoreline forms a larger angle with its orientation (NNW) and the prevailing wind direction (NNE). Therefore, sediment from the northern shoreline is transported to the central and southern dune areas by the longshore wind, forming tall shrub dunes. By contrast, the northern section is primarily characterized by sand sheets and embryonic foredunes. The formation of tall shrub dunes is also associated with the dissipative beaches in this area, which have a width of 350–450 m. Combined with the northeast prevailing wind and a long fetch, these conditions are more conducive to transporting and accumulating sediment in the central and southern aeolian landform areas [29]. The aeolian landform types in this dune system mainly include embryonic foredunes, shrub dunes, complex shrub dunes, and blowouts. Vegetation in the area is dominated by Spinifex littoreus, Ipomoea pes-caprae (L.) R. Br., and Casuarina equisetifolia.
The bowl blowout has developed in the southern part of the beach area of Tannan Bay’s sandy coast, forming an elliptical shape with a major axis of 46 m, a minor axis of 36 m, and a depth of 56 m. The major axis orientation is 353°. The bowl blowout has developed six shrub dunes inside, with the west lateral wall primarily covered by Spinifex littoreus, while the east lateral wall’s inner side lacks vegetation cover, and the outer side is covered by Spinifex littoreus. Currently, the bowl blowout entrance is not prominent, as it is mainly blocked by a small foredune, likely caused by the closure of the blowout entrance (Figure 1c,d).

2.2. Methods

2.2.1. Field Topographic Survey and Laboratory Analysis

The survey of the blowout primarily employed RTK GPS survey technology (accuracy: horizontal 0.8 cm + 1 ppm × D, vertical 1.5 cm + 1 ppm × D). A total station instrument initially measured three fixed positions in the study area. Each observation utilized single-station differential multi-point fitting RTK survey technology, which was aligned with the three known fixed positions to achieve a survey accuracy of 23 cm [30]. This accuracy met the precision requirements for measuring the morphological changes of coastal dunes and has been successfully applied in related coastal dune research [31]. Based on the size of the bowl blowout in the study area, 572 typical survey points were established. Sampling intervals of 0.5 × 0.5 m were set for the interior of the blowout and its edge within a 1 m area, while 1 m × 1 m intervals were applied for the outer area of the blowout. Multiple blowout morphological characteristics were recorded during the surveys (survey 1: January 2021; survey 2: May 2021; survey 3: July 2021; survey 4: October 2021; survey 5: January 2022) (Figure 1e). Topographic surveys were primarily conducted in different seasons. From March to June, the prevailing wind direction is mainly from the southwest, while, during the remaining months, it is predominantly from the northeast. In addition, summer and autumn mark the typhoon season, prompting topographic surveys both before the typhoon (July) and after the typhoon (October). The resulting datasets were processed and analyzed using Surfer 23 (Golden Software) and ArcGIS 10.8 (Esri), focusing on spatial interpolation and modeling.

2.2.2. Field Airflow Observation and Laboratory Analysis

Airflow observation was conducted during the period of the prevailing northeast wind. For the airflow observation, 11 two-dimensional ultrasonic anemometers produced by the British Gill company (Lymington, UK) and CR1000X data loggers produced by the American Campbell Scientific company (Logan, UT, USA) were primarily used, with a data collection frequency of 1 s, recording the average airflow for 1 min. During the airflow observation in January 2021 (topographic survey 1), the airflow 0.3 m above the ground within the blowout was the focus. Before the experiment, a 3 m high wind pole was set up on the beach, and two two-dimensional ultrasonic anemometers were placed at 0.3 and 2 m as reference stations, with the remaining 9 anemometers positioned at different parts of the blowout based on its morphological characteristics (Figure 1e). Simultaneously, the observed airflow data were processed in groups of 10 min, and 3 data groups were randomly selected for statistical analysis.
Since the airflow within the blowout does not conform to the logarithmic distribution [4], to minimize the influence of temporal fluctuations in wind speed, the 0.3-m anemometer from Tower 1 (on the beach) was used as a reference for wind speed and direction normalization. The fractional speed-up ratio (δs), as defined by Jackson and Hunt (1975) [32], was then calculated as follows:
δ s = ( u z U z ) / U z
where uz is the wind speed at height z, and Uz is the reference wind speed. The speed-up ratio provides a metric for assessing the changes in wind speed relative to the incoming airflow. The coefficient of variation for the wind speed (Fs) was used to measure the turbulence of the airflow at each measuring station in the blowout [33,34]. The value of Fs, which represents the stability of the airflow velocity at the measurement height z, was determined as follows:
F s = S D w s / U ¯ Z
where SDws is the standard deviation of the wind speed at height z, and U ¯ Z is the average wind speed. Smaller values for Fs and SDws correspond to a more stable airflow direction and a lower turbulence level.

2.2.3. Field Sediment Sampling and Laboratory Analysis

Prior to airflow observation, sediment samples were systematically collected from various positions within the bowl blowout depression at Tannan Bay. Sampling locations were strategically positioned 50 cm downwind from each airflow observation point. Eleven surface sediment samples (0–2 cm depth) were obtained using a standardized sampling frame (5 × 5 cm area), with each sample weighing approximately 200–300 g. All collected specimens were immediately sealed in pre-labeled sampling bags and transported to the laboratory for subsequent analysis.
Grain size distribution was determined using a Malvern Panalytical Mastersizer 2000 (Malvern Instruments Ltd., Malvern, UK) laser diffraction particle size analyzer following standard pretreatment protocols: organic matter removal through H2O2 oxidation, carbonate dissolution using 10% HCl, and dispersion with sodium hexametaphosphate ((NaPO3)6). Particle size classification adhered to the USDA texture classification system with six distinct fractions: very coarse sand (1.00–0.50 mm), coarse sand (0.50–0.25 mm), medium sand (0.25–0.10 mm), fine sand (0.10–0.05 mm), very fine sand (0.05–0.01 mm), and clay (<0.01 mm). Critical percentile diameters (5%, 10%, 16%, 25%, 50%, 75%, 84%, 90%, and 95%) were systematically recorded to facilitate comprehensive grain-size parameter calculations, including moment measures and Folk–Ward graphical parameters.

3. Results

3.1. Morphological Changes and Erosion-Accumulation Patterns of Bowl Blowout

3.1.1. Morphological Changes of Bowl Blowout

During the topographic survey in January 2021, the bowl blowout did not have a distinct entrance; there was only an opening leading into the blowout, located in the lee of a small foredune at the back of the blowout. Between survey 1 and survey 2, the overall morphological change of the bowl blowout was not significant (Figure 2a). Between survey 3 and survey 5, there was a clear trend of retreat at the entrance of the blowout, where the small foredune was located, while the west lateral wall of the blowout remained largely unchanged. By contrast, the east lateral wall exhibited noticeable expansion, particularly in the area of the blowout’s exit, where the east lateral wall showed a significant expansion trend. Between survey 3 and survey 4, a second opening appeared in the entrance area of the east lateral wall, which then strengthened the expansion and deepening of the bowl blowout (Figure 2a).

3.1.2. Erosion–Accretion Changes of Bowl Blowouts

Overall, during the survey period, the bowl blowout was primarily characterized by lateral wall erosion and deflation basin accretion or deposition, with variations in erosion and accumulation across different locations (Figure 2b–e). From survey 1 to survey 2, minor erosion occurred at the lateral walls and their periphery. Sand deposition occurred near the blowout’s entrance and exit, deflation basin, and the rear part of the eastern lateral wall (Figure 2b). From survey 2 to survey 4, significant erosion was observed at the edges of the lateral walls and their periphery, with maximum erosion reaching up to 1 m. Sand accretion occurred in the front half of the deflation basin, while erosion was noted in the back half. Between survey 1 and survey 3, sand accretion also occurred in the front half of the deflation basin, whereas accretion and erosion alternated in the back half from survey 4 to survey 5 (Figure 2c–e). Significant sediment deposition was recorded on the entrance’s windward slope and lee slope, with up to a 1 m elevation increase, due to the appearance of a second opening and its rapid expansion from survey 2 to survey 4.

3.2. Airflow Field Changes

3.2.1. Reference Station Wind Conditions

During the airflow observation period, the wind directions at the reference station (2 m) during observations 1, 2, and 3 were 23°, 29°, and 35°, respectively, with angles of 30°, 36°, and 42° relative to the long-axis direction of the blowout (353°) (Table 1). The airflow stability coefficients (Fs) were below 0.2, indicating a lack of turbulence in the back beach.

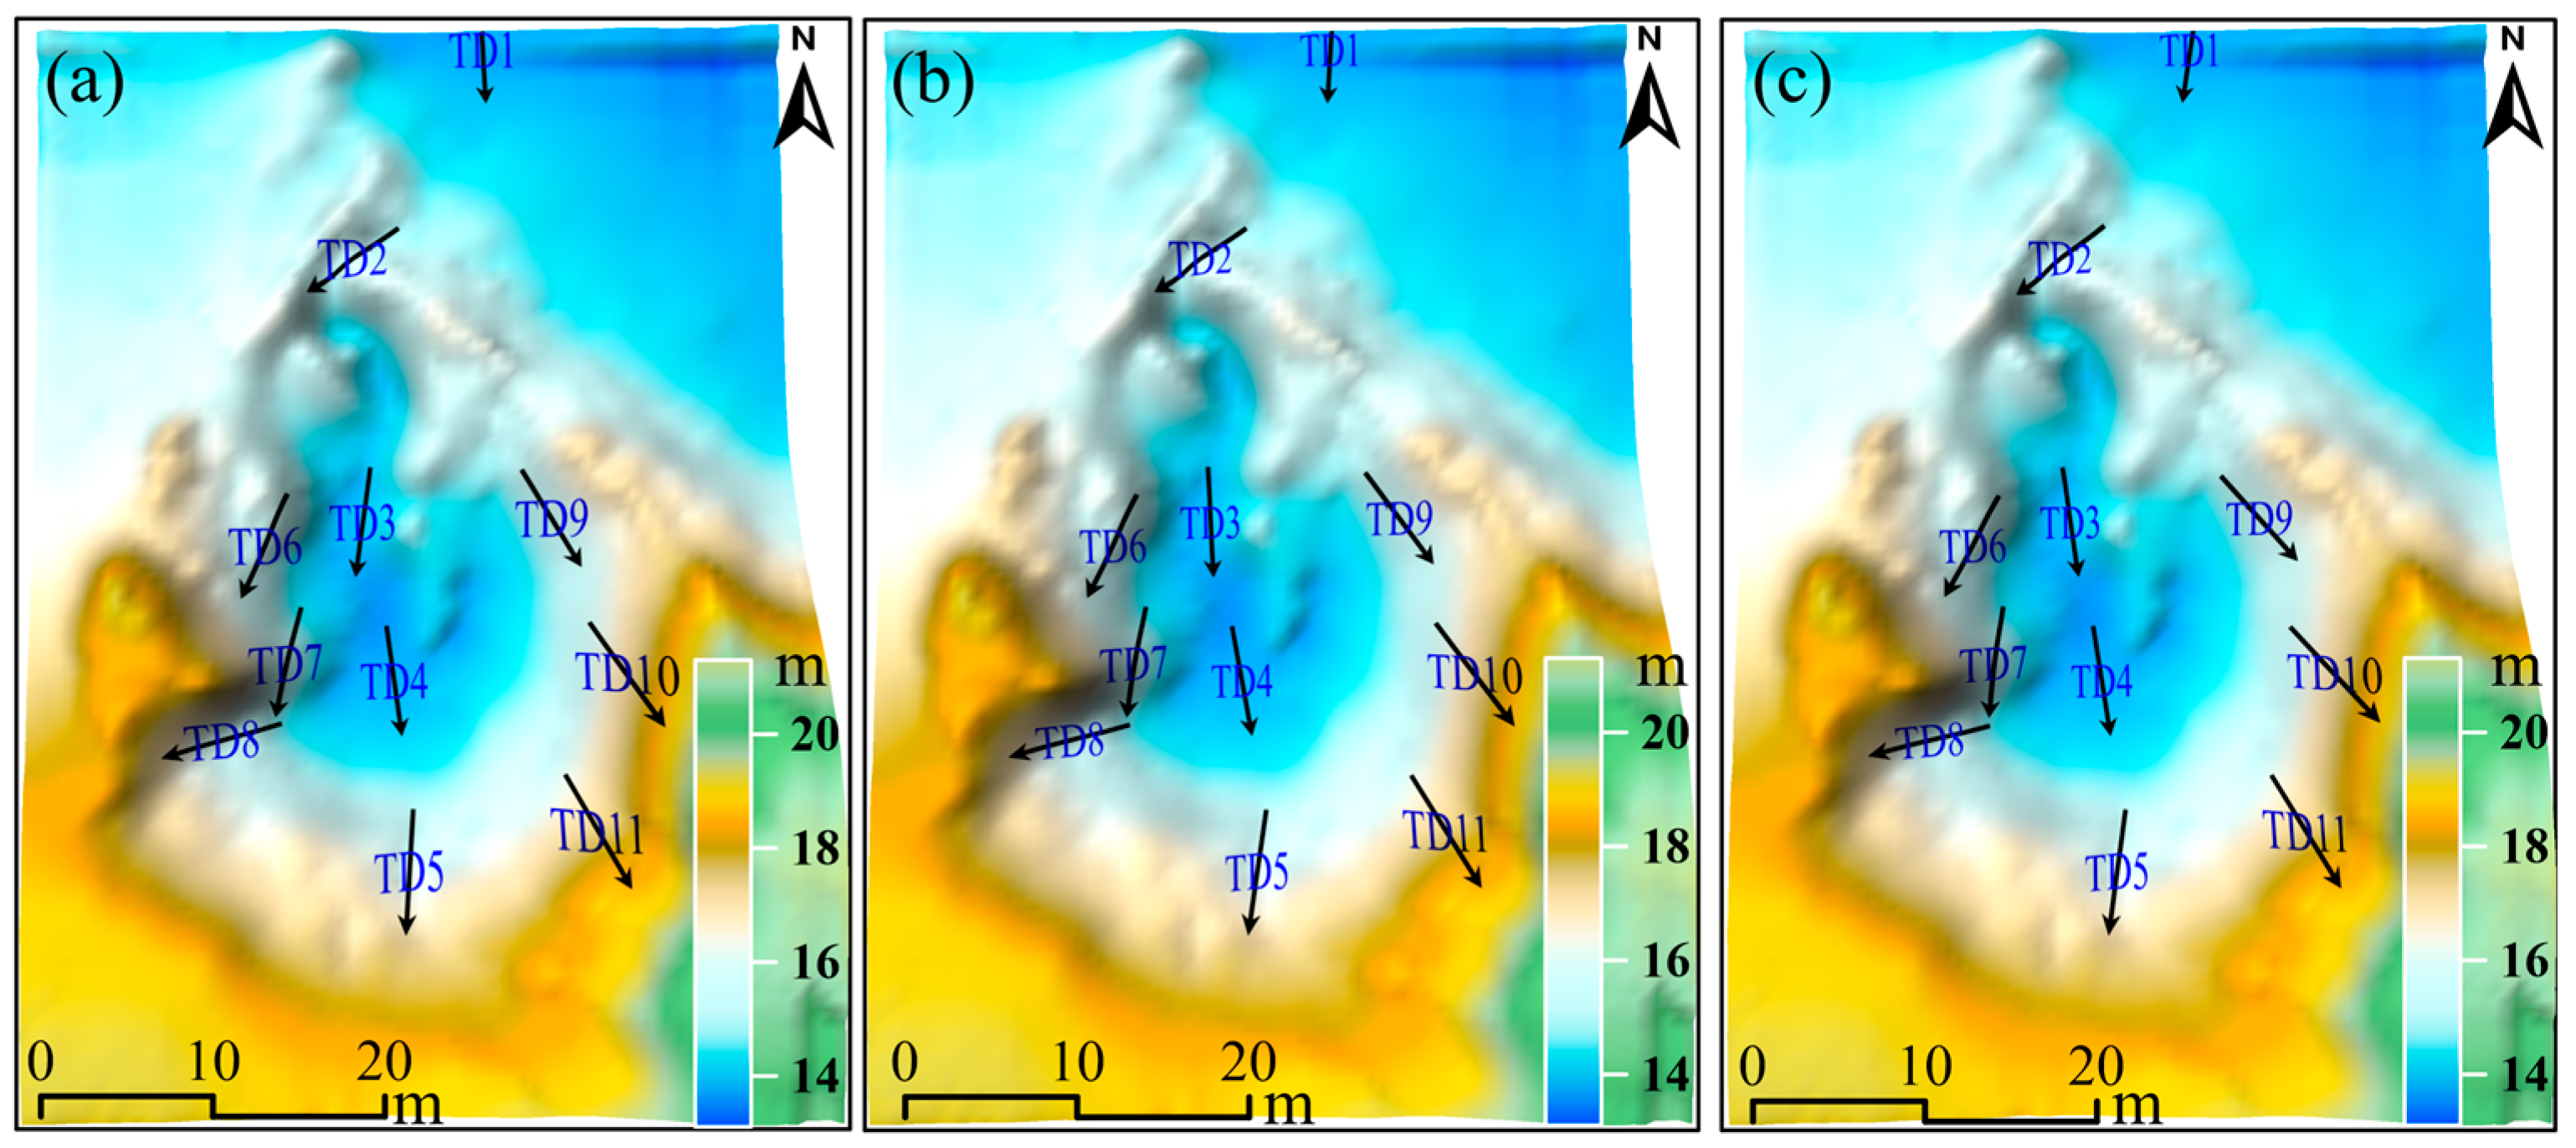
3.2.2. Wind Direction Changes Within the Bowl Blowout

Overall, the airflow within the bowl blowout exhibited a generally consistent pattern despite variations in the approaching wind direction, with only some observation points showing significant changes in direction (Figure 3). Under different incoming wind directions, the east lateral wall remained relatively stable in airflow, deflecting towards the SSE. Similarly, the west lateral wall exhibited continuous deflection towards the SW. When the approaching wind was at a 30° angle relative to the axial direction of the blowout, the airflow was rapidly deflected by the foredune, turning WSW and then immediately following the blowout’s topography to the front one-third section of the deflation basin, where it diverged into three airflow streams. One stream followed the deflation basin towards the blowout’s half point before exiting towards the rear one-third section. Throughout this process, the airflow direction shifted towards the SSW in the front one-third section, towards the SSE in the half section, and back to the SSW in the rear one-third section. Another stream followed the west lateral wall towards the SSW, eventually turning at TD8 towards the west lateral wall and flowing out of the blowout towards the WSW. The third stream followed the east lateral wall towards the SSE, with minimal airflow direction variation along the east lateral wall. When the approaching wind was at angles of 36° and 42° relative to the blowout, there were significant variations in direction compared to the 30° entry, including a large angle deflection in the turn direction at the TD3 point in the front one-third section. In addition, under different incoming wind directions, the airflow at TD6 on the west lateral wall was generally consistent with the incoming wind direction.

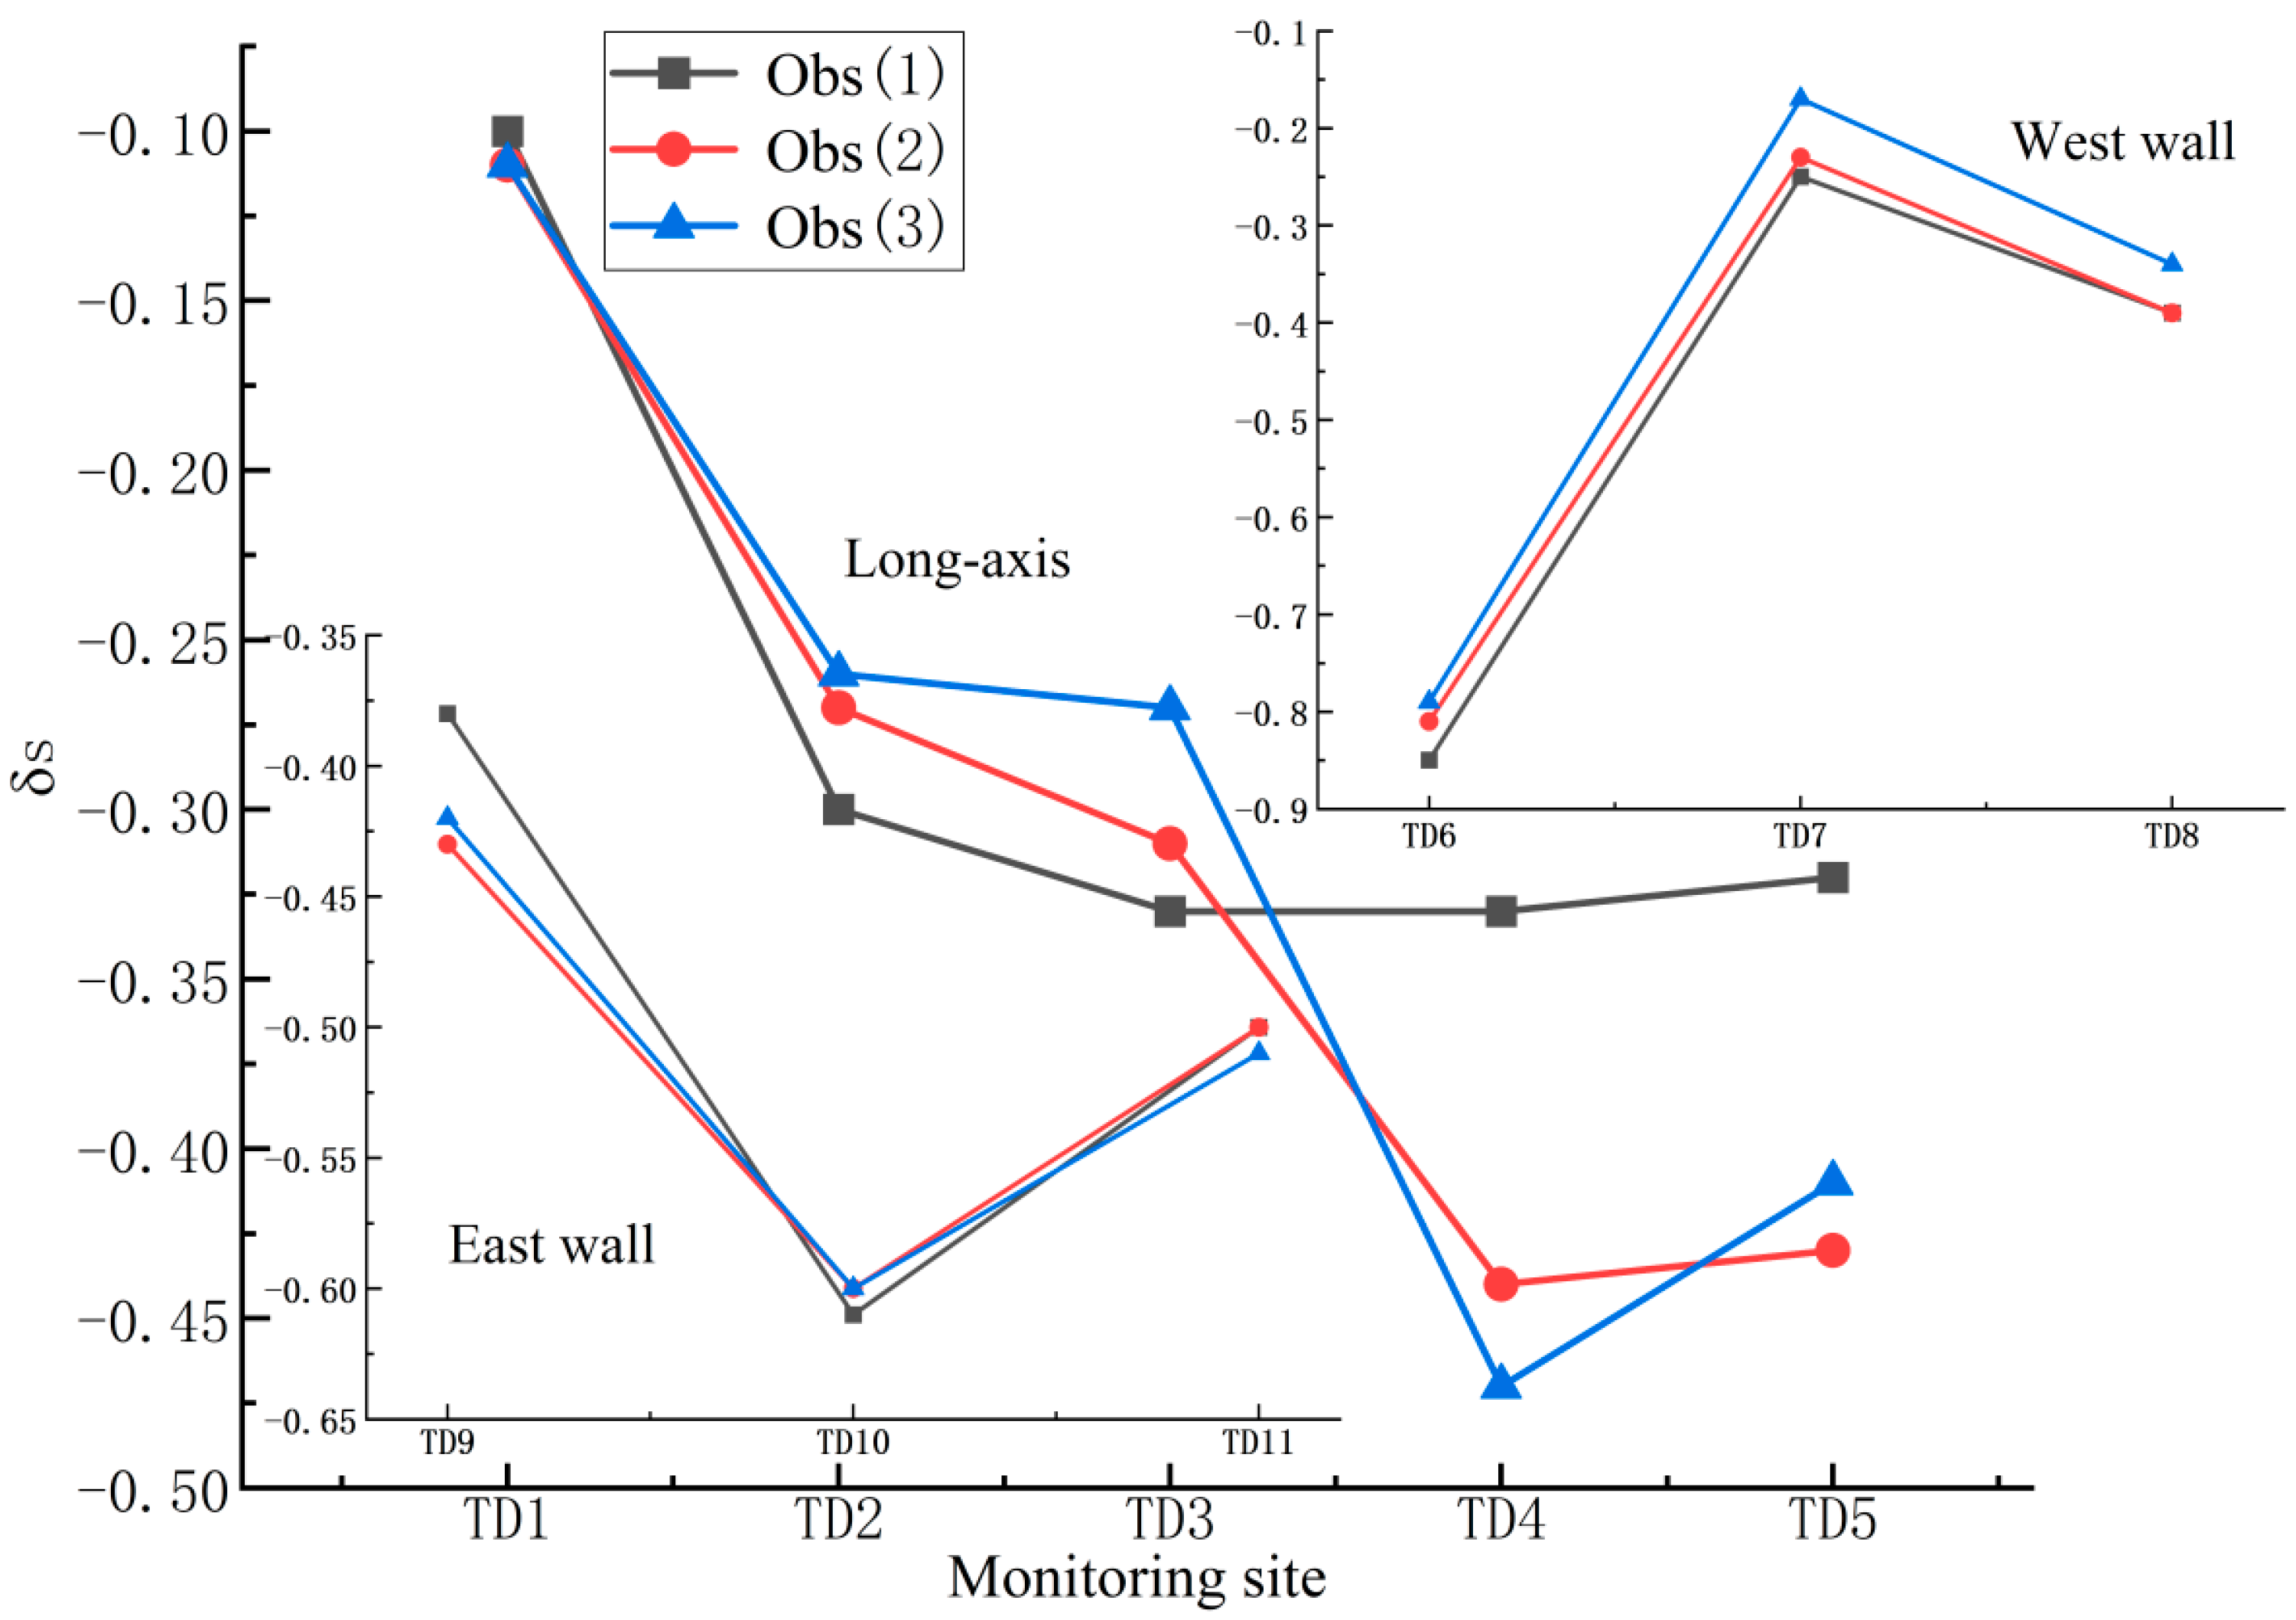
3.2.3. Airflow Changes Within the Blowout

Throughout the observation period, the airflow within the bowl blowout was lower than the reference wind speed, and the relative acceleration rates were negative. The relative acceleration rates from the back beach to the blowout entrance exhibited a decreasing trend, with the approaching wind speed ranging from 89.46% to 90.25% of the beach reference wind speed. At the blowout entrance (i.e., the sheltered lee slopes of the foredune), the airflow decelerated and continued to slow as it flowed through the deflation basin to the half point, then accelerated as the terrain rose, flowing out of the blowout exit. However, the exit wind speed did not recover to the incoming wind speed level, reaching only 57.57% to 67.66% of the incoming wind speed (Figure 4). Under different incoming wind directions, the relative acceleration rate at the west lateral wall of the blowout initially increased and then decreased as it exited the blowout, primarily because TD8 was located on the sheltered lee slopes of the blowout. The eastern lateral wall initially experienced deceleration and acceleration as the airflow exited the blowout, mainly due to TD10 being positioned at the concave part of the eastern lateral wall. The airflow speed at TD6 on the west lateral wall was the lowest within the entire blowout, only 14.19% to 20.61% of the reference wind speed, showing the most significant deceleration, primarily due to the obstruction caused by the frontal shrub dune (Figure 3 and Figure 4). Simultaneously, during observations 2 and 3, the relative acceleration rates at the half point along the long axis of the deflation basin and at the rear one-third point were lower than those observed during observation 1. Across observations 1–3, only TD6 recorded an Fs value of 0.34 in observation 2, while all other stations showed an Fs below 0.2, suggesting localized turbulence occurred at TD6 during observation 2.

3.3. Sediment Grain Size Characteristics

The mean grain size (Mz) of sediments in the bowl blowout ranged from 1.046 to 2.195 Φ (mean: 1.561 Φ). Medium sand (1–2 Φ) was dominant at 42.773%, followed by fine sand (2–3 Φ, 29.437%) and coarse sand (0–1 Φ, 22.778%) (Table 2). By comparison, backshore sediments had a coarser mean grain size of 1.83 Φ, with medium sand accounting for 50.865%, fine sand 37.902%, and coarse sand 9.264%. Very fine sand (3–4 Φ) made up 1.969%, while very coarse sand (–1–0 Φ), silt (>4 Φ), and clay (>8 Φ) were absent throughout the study area. A comparative analysis revealed that the deflation basin’s floor sediments (mean 1.561 Φ) were coarser than backshore deposits (1.83 Φ), yet both were similar in lacking silt–clay fractions (Table 2).
Spatially, three morphological units exhibited different patterns: long-axis sediments averaged 1.525 Φ, with medium sand at 44.188%. The western lateral wall showed higher Mz (1.774 Φ) and 42.041% medium sand. The eastern lateral wall was coarsest, averaging 1.395 Φ with 41.617% medium sand.

4. Discussion

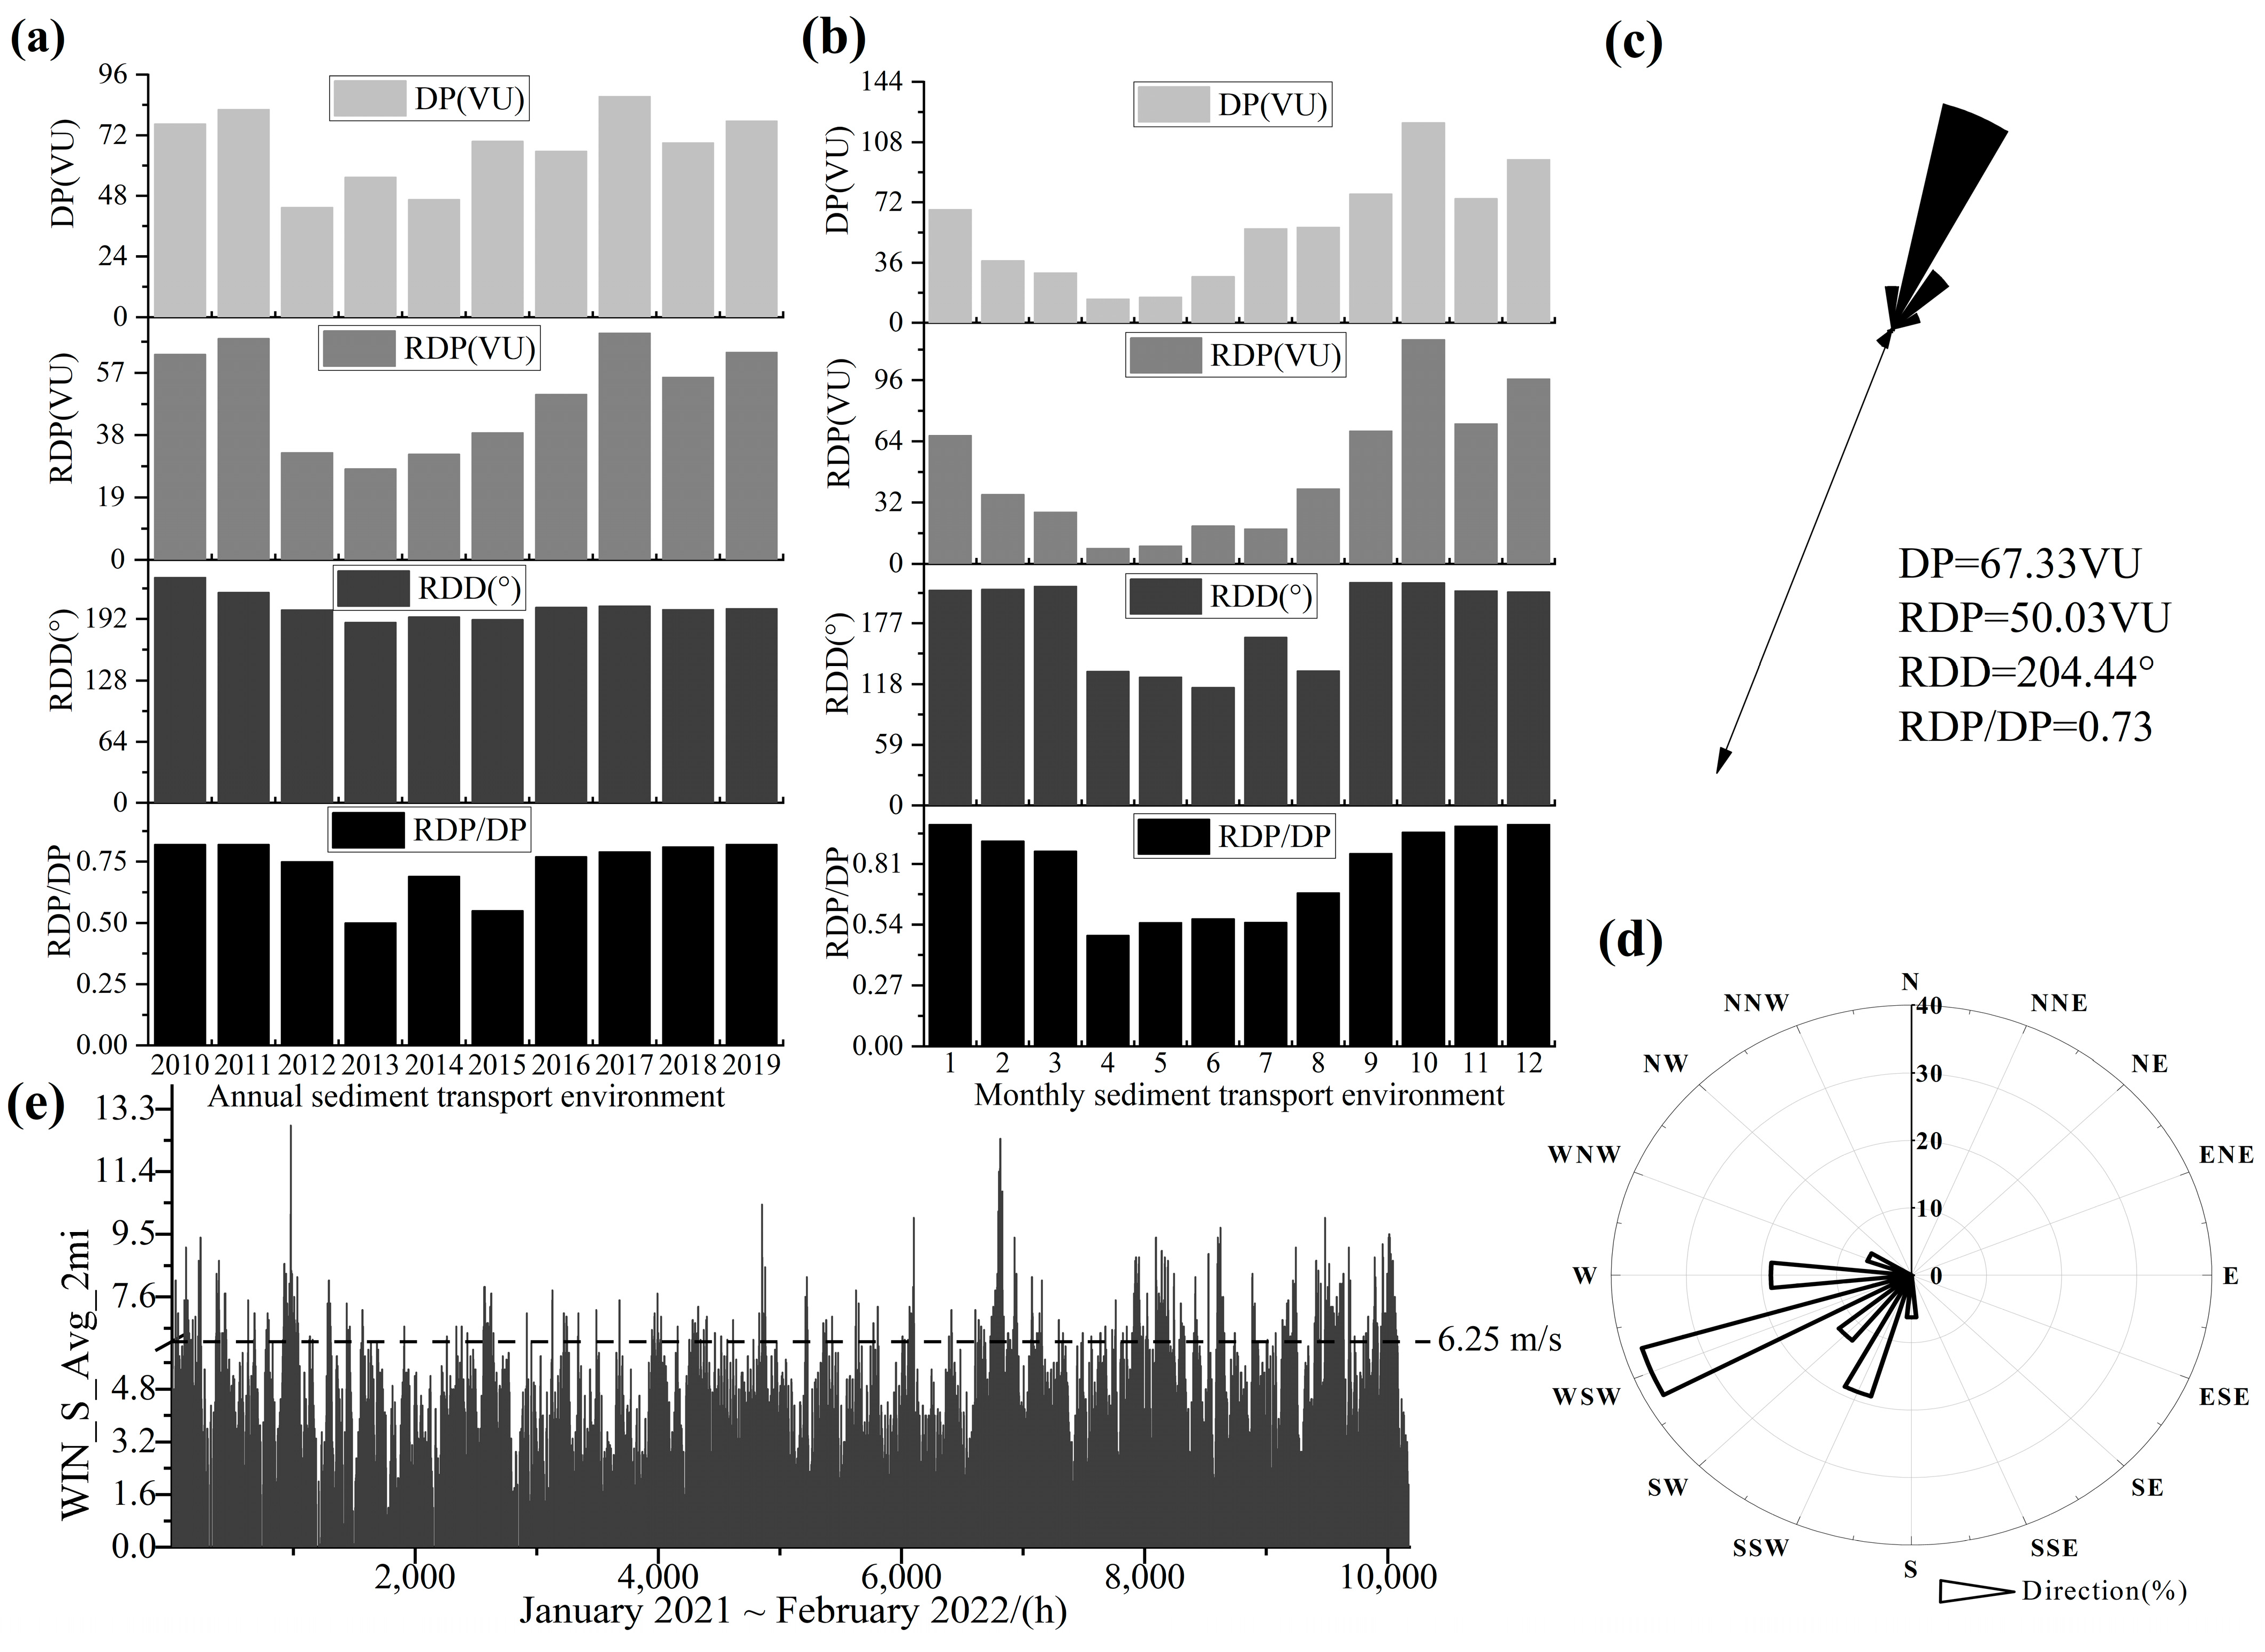
4.1. The Impact of Sediment Transport Environment on the Tannan Bay Blowouts

Sediment transport potential not only evaluates the strength of the wind energy environment but assesses the directional composition of regional wind conditions. It is an important basis for evaluating the long-term sediment transport environment of aeolian landform areas. The study by Wu et al. [35] on the South China coast aeolian landforms shows that the wind speed for sand initiation in Pingtan Island is 5 m/s. Based on the definition of sediment transport potential, the long-term sediment transport environment of Pingtan Island was calculated [4] (Figure 5a–c). The sediment transport potential of Pingtan Island over the past 10 years is 67.33 VU, with a wind direction variability of 0.73, and a resultant sediment transport direction of SSW. This indicates a low wind energy environment with medium variability and sharp bimodal wind conditions (Figure 5a,c). Seasonally, the sediment transport potential (DP), and resultant sediment transport potential (RDP), exhibit low values in spring and summer (March to August) and high values in autumn and winter (September to February of the following year) (Figure 5b). The resultant sediment transport wind direction (RDD) shows an extensive fluctuation range in spring and summer, while in autumn and winter, the fluctuations are smaller. In spring and summer, the wind direction variability (RDP/DP) demonstrates high variability (<0.3), medium variability (0.3–0.8), and low variability (>0.8), reflecting complex or sharp bimodal wind conditions, sharp bimodal or sharp unimodal wind conditions, and wide single-peak or narrow single-peak wind conditions. In autumn and winter, the variability is predominantly medium (0.3–0.8) and low (>0.8). This is primarily due to the influence of the Mongolian high-pressure system from September to February, which brings prevailing northeast winds, a high frequency of sand-initiation winds, relatively high wind speeds, and a resultant sediment transport direction with minimal fluctuation. During this period, the wind direction variability is between 186.06° and 240.35°, with values ranging from 0.83 to 1. In addition, rainfall during this period accounts for only 29.83% of the annual total, resulting in lower surface humidity and enhanced aridity. These conditions reduce the sand particles’ internal cohesion and threshold value, making them more susceptible to being blown and eroded. Simultaneously, some vegetation dies or becomes buried by sand particles, decreasing vegetation coverage and exposing large areas of aeolian landforms. Therefore, this period is the main occurrence of coastal wind erosion, with the prevailing northeast wind playing a crucial role in the formation and development of blowouts on Pingtan Island.
The opening direction of the Tannan Bay cape is 245°. In January 2022, 16 blowouts were surveyed on the foredunes along Tannanwan Beach, 1.67 km long, with an overall blowout density of 9.58 blowouts/km, mainly concentrated in the southern area of Tannan Bay. Seventy-five percent of the blowouts have orientations of W, WSW, and SW (Figure 5d). Comparing all blowout orientations to the cape opening direction (Figure 1b) and the regional resultant sediment transport wind direction (Figure 5c) indicates that the blowout opening direction is almost consistent with the cape opening direction, and there is a specific difference with the resultant sediment transport wind direction. This indicates that the Tannan Bay cape shoreline orientation controls the blowout orientation, while the RDD is a secondary factor. In addition, Jungerius [36] measured the long-term morphological changes of coastal blowouts and found that strong winds have a small impact on the topographical changes of blowouts. High aeolian sediment transport leads to significant sand accretion within blowouts, resulting in sediment accumulation. They concluded that blowouts are formed under the most frequent wind conditions, with morphological changes best related to wind speeds between 6.25 m/s and 12.5 m/s. Blowouts are not adapted to the airflow dynamics of high-speed wind events (>12.5 m/s). In the study area, wind speeds between 6.25 m/s and 12.5 m/s account for 48.60% of the total above-threshold sand initiation winds, indicating that such winds have a fine-tuning effect on the morphology of the bowl blowout, as shown by the results from survey 1 to survey 2 (Figure 2b and Figure 5e). The blowout in the study area has formed a shrub foredune at the entrance, and the deflation basin is 0.5–1.5 m lower than the back beach. Multiple shrub dunes and embryonic dunes are present in the deflation basin, with widely distributed Spinifex littoreus and Ipomoea pes-caprae (L.) R. Br. Sand grains are mainly medium and coarse sand (Table 2). Smaller wind strengths cannot produce erosion in the deflation basin. However, from survey 2 to survey 5, the side edges and their periphery, as well as the entrance and exit areas of the blowout, were mainly eroded. Most erosion depths exceeded 1 m, and the deflation basin exhibited accumulation in the front half and erosion in the rear half (Figure 2c–e). All of the above indicates that the blowouts in this area are not only affected by regular wind conditions but are mainly controlled by typhoons. A group of typhoons, “Yanhua” (35 m/s), “Lupit” (18 m/s), and “Chanthu” (55 m/s), landed on the study sites, causing significant erosion of the blowout during the survey period. Therefore, typhoons are key to the significant morphological changes in the bowl blowout, which differs from Jungerius research findings [36].

4.2. Feedback Mechanism Between Blowout Airflow and Morphology

The wind direction and the morphology of the blowout affect the characteristics of the airflow field within the blowout. The bowl blowout measured in this study is 2–3 times larger than the blowouts previously measured by others [33]. When airflow enters the bowl blowout, it immediately deflects (consistently in three observations) but does not diffuse. Instead, it enters a narrow, curved channel into the deflation basin TD3. Therefore, the airflow direction in the front one-third of the blowout is mainly controlled by topographic deflection. Turbulence is primarily caused by the large number of shrub dunes in this area, resulting in a complex internal morphology of the blowout (Figure 1d and Figure 3), which aligns with the findings of Hesp et al. [2,37]. Hesp’s research indicates that, when the approaching wind is inclined at 23–25° to the blowout, the airflow undergoes noticeable turning within the blowout, and the degree and complexity of the deflection depend on the local topography within the blowout. Large-scale turbulence and vortex flow frequently occur within the blowout [2]. When the angle between the oblique airflow and the blowout body is 0–100°, the wind is drawn into the blowout by the low pressure within it, and the wind direction adjusts to align with the blowout’s orientation [37]. As the angle between the approaching wind and the blowout body increases (30–42°), airflow in the center of the deflation basin moves in a direction parallel to the blowout. In addition, airflow along the entire eastern and western lateral wall deflects slowly, indicating that the influence of the blowout topography on airflow dynamics becomes more significant as the angle between the approaching wind and the blowout body increases. This result is consistent with the findings of Pease and Gares [38], though the depth of this bowl blowout is greater than that reported in their study.
Similarly, the airflow distribution within the blowout also affects the development of the blowout morphology. During the observation period in Tannan Bay, the wind speed ranged between 9.97 and 10.82 m/s, and the relative acceleration rate of the airflow within the entire bowl blowout was lower than the reference wind speed on the beach. Therefore, the erosion intensity within the blowout decreased from the entrance to the exit of the blowout. Among these observations, the control of shrub dunes and Spinifex littoreus on the west lateral wall’s inner side resulted in accumulation in the lower part of the west lateral wall, while the upper part exhibited significant erosion during survey period 2 to 5, with most erosion depths exceeding 1 m. On the front inner side of the east lateral wall, airflow diffusion and the presence of shrub dunes and Spinifex littoreus contributed to accumulation, with accumulation heights exceeding 1 m. The top of this wall, controlled by Spinifex littoreus, exhibited lower erosion levels. By contrast, the middle and rear part of the east lateral wall, lacking vegetation cover and influenced by sediment particle size (Table 2), experienced maximum erosion. The top of this area, approaching the wind direction, exhibited a strong erosion state, with most regions showing erosion depths greater than 1 m (Figure 1d and Figure 2c–e). Therefore, the east lateral wall and the upper part of the west lateral wall were primarily influenced by the incoming wind conditions, demonstrating a strong erosion state during survey periods 2 to 5. The large size of the bowl blowout resulted in a relative acceleration rate of the airflow that was lower than the reference wind speed on the beach during the entire observation period. However, the wind speed during the observation period exceeded the threshold for sand initiation, which raised the diffusion and deceleration of the airflow upon entering the blowout. As a result, sediment primarily accumulated in the front half of the blowout. In the rear half, the airflow gradually strengthened due to the rising terrain, causing slight erosion. Throughout the topographic survey period, the blowout was predominantly characterized by lateral wall erosion and deflation basin accumulation.

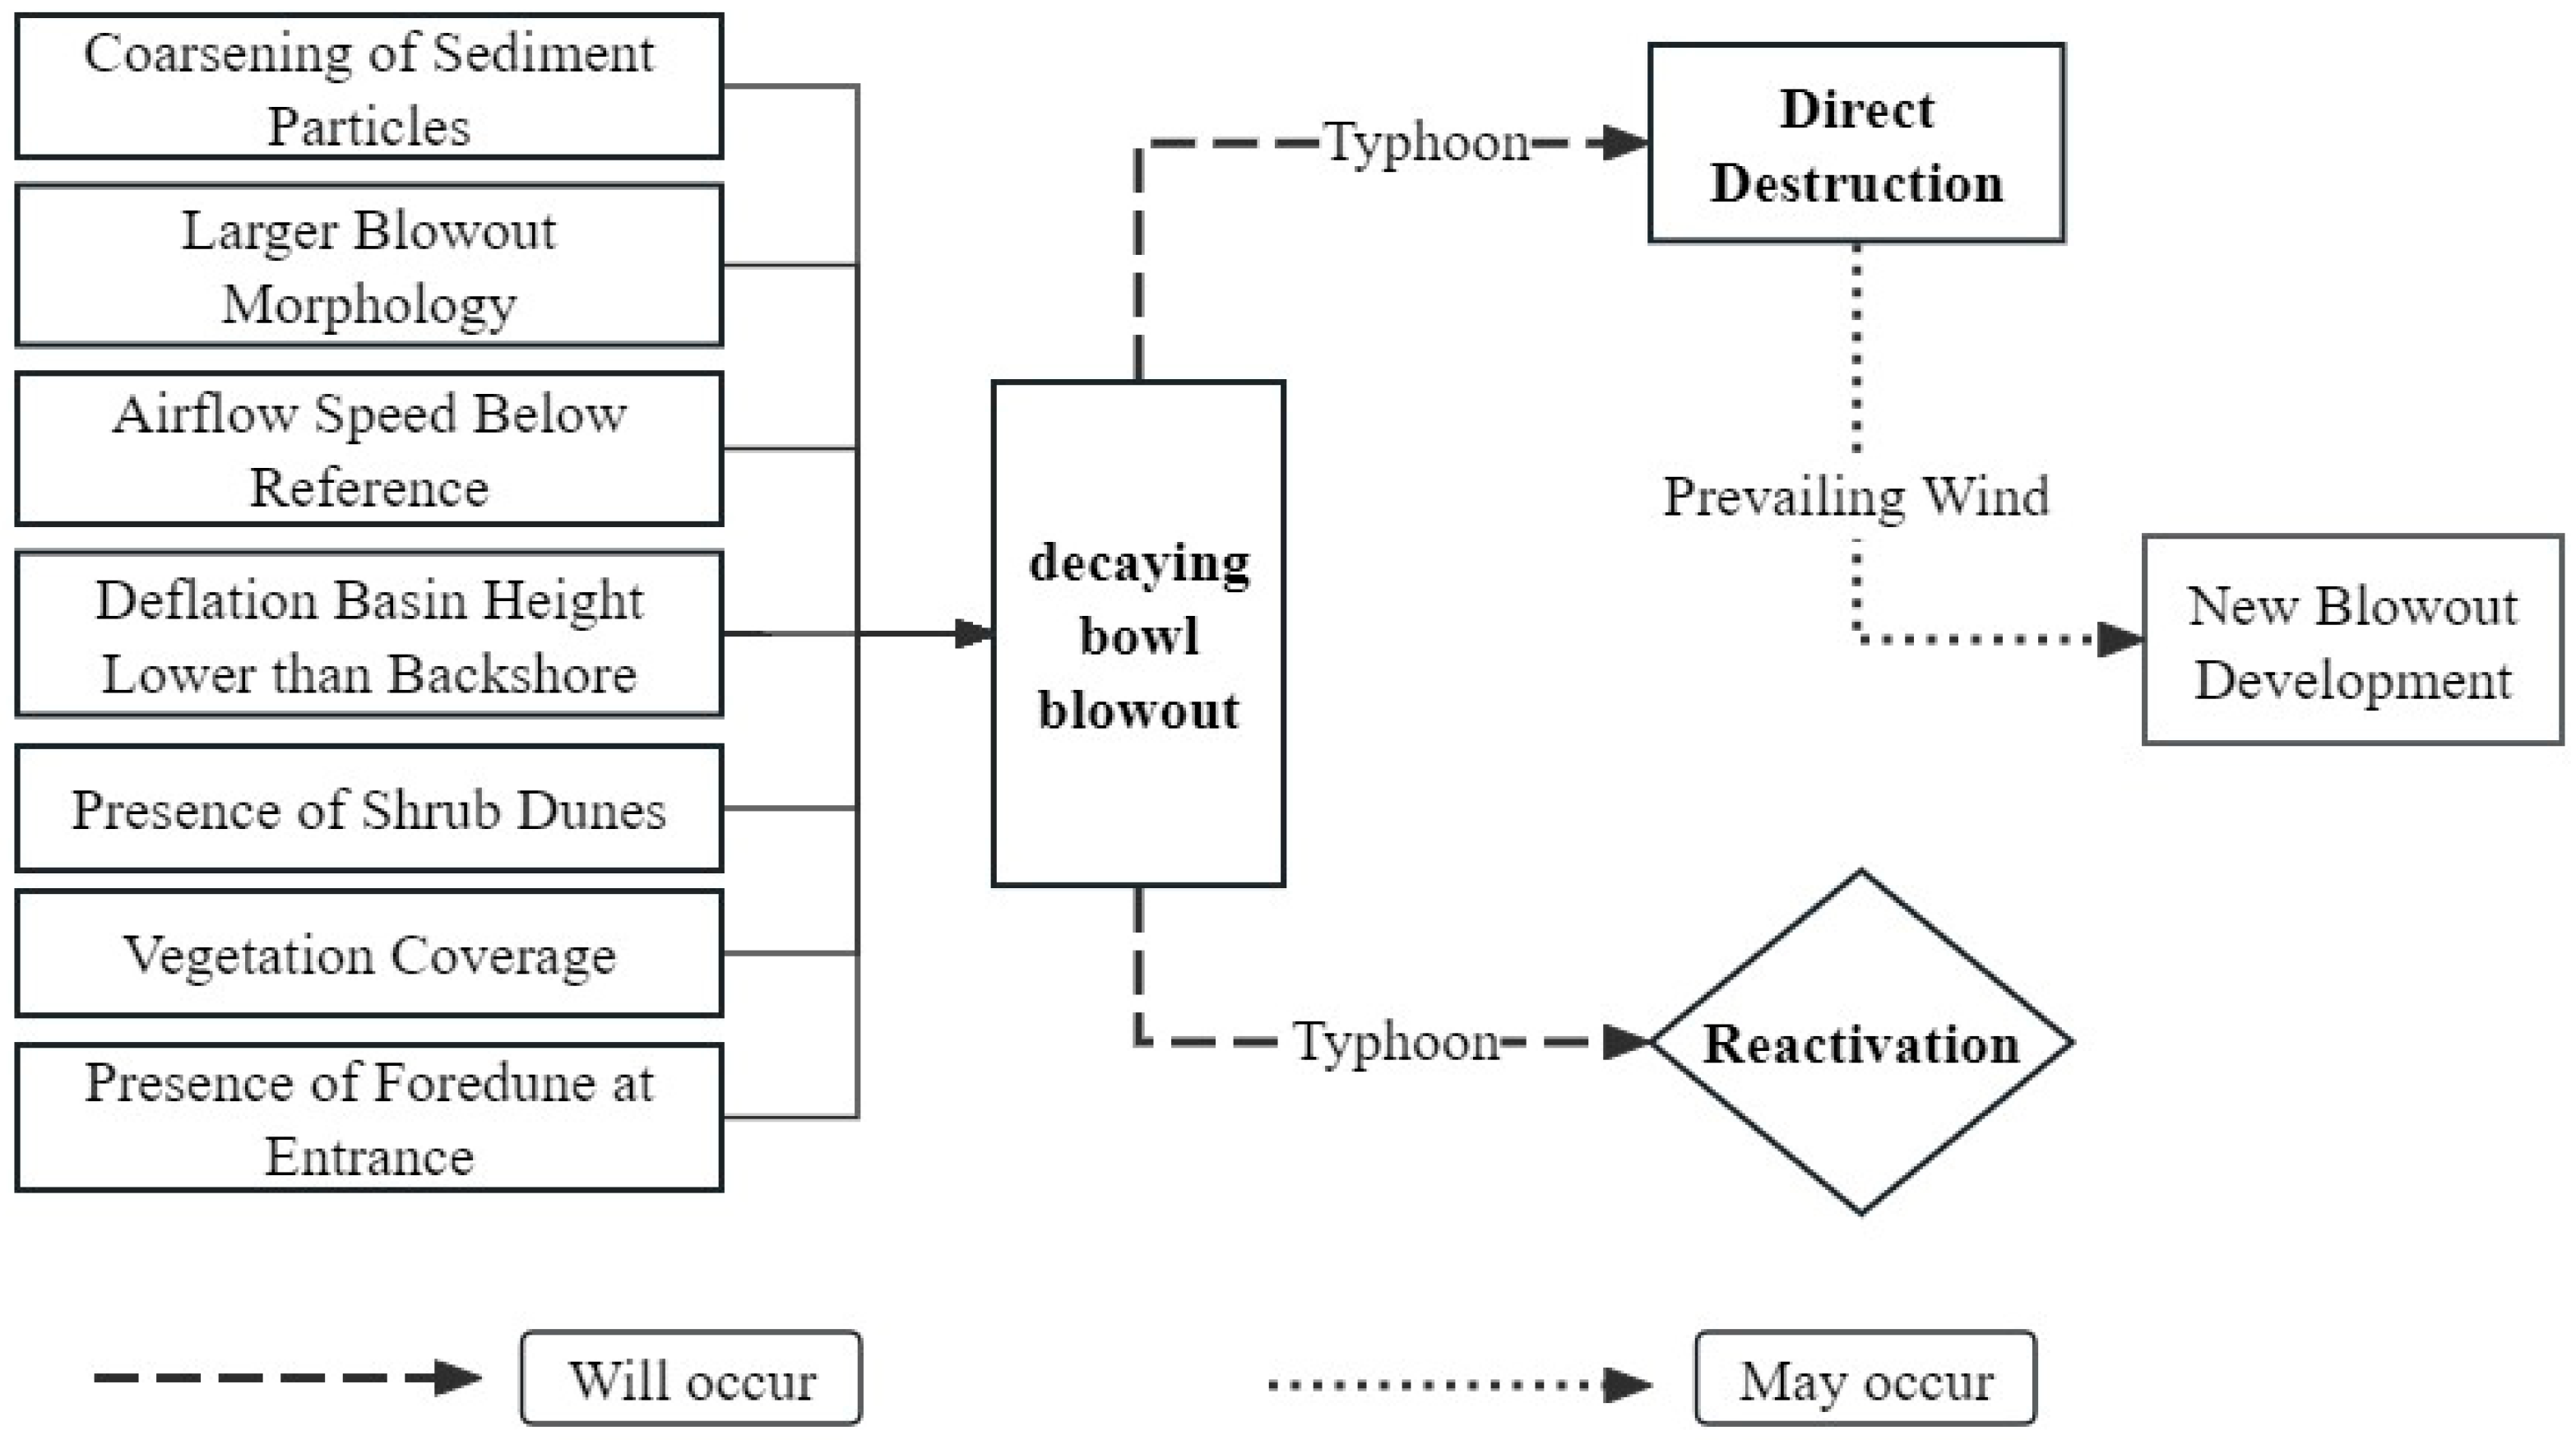
4.3. Discussion on the Development Stage of Bowl Blowout

The research by Barchyn and Hugenholtz on the reactivation of supply-limited blowouts indicates that depth limitation refers to the situation where a blowout expands to an erodible base layer [21]. In depth-limited blowouts, an erodible layer prevents further downward expansion of the blowout, which can manifest as an erosion-resistant coarse particle sediment layer, the presence of underlying bedrock, or the blowout approaching the groundwater level [7,39]. Morphological limitation refers to a situation where the base layer does not restrict the downward expansion of a blowout. No such underlying layer exists in morphologically limited blowouts, allowing the blowout to expand downward without limit until its morphology restricts the wind’s ability to erode the bottom [40]. The findings of Gares and Nordstrom [18] indicate that, during the third and fourth stages of blowout evolution, continuous erosion occurs within the blowout channel up to the backshore height, alongside the widening of the blowout’s lateral walls. This process concludes with the cessation of erosion and the onset of accumulation, leading to blowout demise. The research by Zhang et al. [41] on the blowouts of the coastal foredune in Liushui Town, Pingtan Island, posits that, during the formation and evolution of blowouts, the process transitions from morphological limitation to depth limitation due to factors such as sediment particle size and vegetation coverage. Based on this, the bowl blowout in this study transitions from morphological limitation to depth limitation, which is inconsistent with the conclusion of Barchyn and Hugenholtz [21] that depth limitation generally results in trough-shaped blowouts. It also differs from the conclusion of Gares and Nordstrom [18] regarding the fourth stage of blowout evolution. However, it aligns with the findings of Zhang et al. [41]. The primary reason is that the beach is a dissipative type [29], which promotes a thick accumulation of sediment in the dune area and is controlled by Spinifex sericeus. This initially causes the development of the bowl blowout to be primarily controlled by vegetation (morphological limitation). When the morphological erosion reaches the coarse sediment layer, near the groundwater table, and other factors, the bowl blowout transitions to being depth limitation (Figure 6).
The wind speeds within the bowl blowout are relatively stable, with low variability and small fluctuations, and the wind direction changes are also minor and stable (Figure 3 and Figure 4). Throughout the three airflow observation periods, the airflow speeds within the blowout were consistently lower than the reference wind speeds, with a relative acceleration rate that exhibited negative feedback. Specifically, the airflow speed at the blowout entrance was 89.46% to 90.25% of the beach reference wind speed, and the airflow speed at the blowout exit was 57.57% to 67.66% of the beach reference wind speed, which aligns with the findings of Gares and Nordstrom [18]. Gares and Nordstrom [18] suggested that, when blowouts reach a critical size in terms of depth, length, and width, the positive feedback between the deepening of parabolic, saucer, and bowl blowouts and airflow acceleration diminishes and becomes negative or even results in airflow deceleration within the blowout. This condition cannot support aeolian sand transport along the erosional basin, leading to sand accumulation in the erosional basin and ultimately contributing to the stabilization of the blowout. Therefore, this bowl blowout is in a decay phase from a morphodynamic perspective. Simultaneously, during the survey period from 2 to 4, the blowout experienced significant erosion due to the landing of typhoons “In-Fa”, “Lupit”, and “Chanthu”, which is consistent with the results of another typhoon group event on Pingtan Island [42]. The study by Yang et al. on the coastal climbing dune at Baiquan Mountain near Tannan Bay, Pingtan Island, demonstrated that a typhoon group consisting of “Nepartak”, “Meranti”, and “Megi” in the summer and autumn of 2016 reduced the volume of a coastal climbing dune in the central part of Pingtan Island by 0.13%, and the maximum height of the dune was reduced by 1.43 m [42]. Accordingly, under the influence of typhoons, the bowl blowout will either be directly destroyed or become reactive, and following direct destruction, new blowouts can develop (Figure 6).
The deflation basin of the bowl blowout is significantly lower than the backshore by 0.5 to 1.5 m, and the sediment particles are relatively coarse, dominated by medium and coarse sands (Table 2). In addition, the entrance of the bowl blowout is a foredune, and six small shrub dunes appear within the blowout, covered with numerous rodent tracks and thick vines, indicating that the blowout is consistent with the fourth stage described by Gares and Nordstrom [18], where erosion ceases and accumulation begins. However, the noticeably higher sidewalls of the bowl blowout, particularly the 5 to 8 m high lateral walls, and especially the east lateral wall without vegetation cover, led to significant erosion during the survey periods from 2 to 5, raising the expansion of the blowout toward the east lateral wall (Figure 2c–e). In addition, the top of the east sidewall is covered with rodent tracks, and during the survey period, erosion was observed below the roots of the rodent tracks at the edge of the east lateral wall, leading to the collapse of the top edge. Due to vegetation cover, the west lateral wall experienced lower erosion intensity than the east lateral wall. However, the outer side of the west lateral wall, lacking vegetation cover, resulted in significant airflow-induced erosion along the outer perimeter of the west lateral wall, with erosion depths of about 2 m (Figure 2c–e). Studies indicate that the expansion of a blowout to a critical size due to wind erosion depends on wind conditions, sediment availability, the presence of a lag or wet layer, and climate factors [1,38], as well as the capacity for wind to transport sediments to a certain depth. Beyond this scale, sediment invasion can occur, the blowout tends to be fixed by vegetation, or it evolves into a migrating parabolic dune [22,43]. Hence, the current bowl blowout is in a phase of decay, but differences in the form of the blowout, vegetation coverage, sediment particle size, and regional wind conditions (typhoons) lead to variations compared to the results of Gares and Nordstrom [18].

5. Conclusions

This study focuses on a typical late-stage bowl blowout in the coastal foredune of Tannan Bay, Pingtan Island. It comprehensively conducts a quantitative analysis of the interaction between the morphology and airflow of the blowout and its successional stage characteristics. The following conclusions are drawn:
(1)
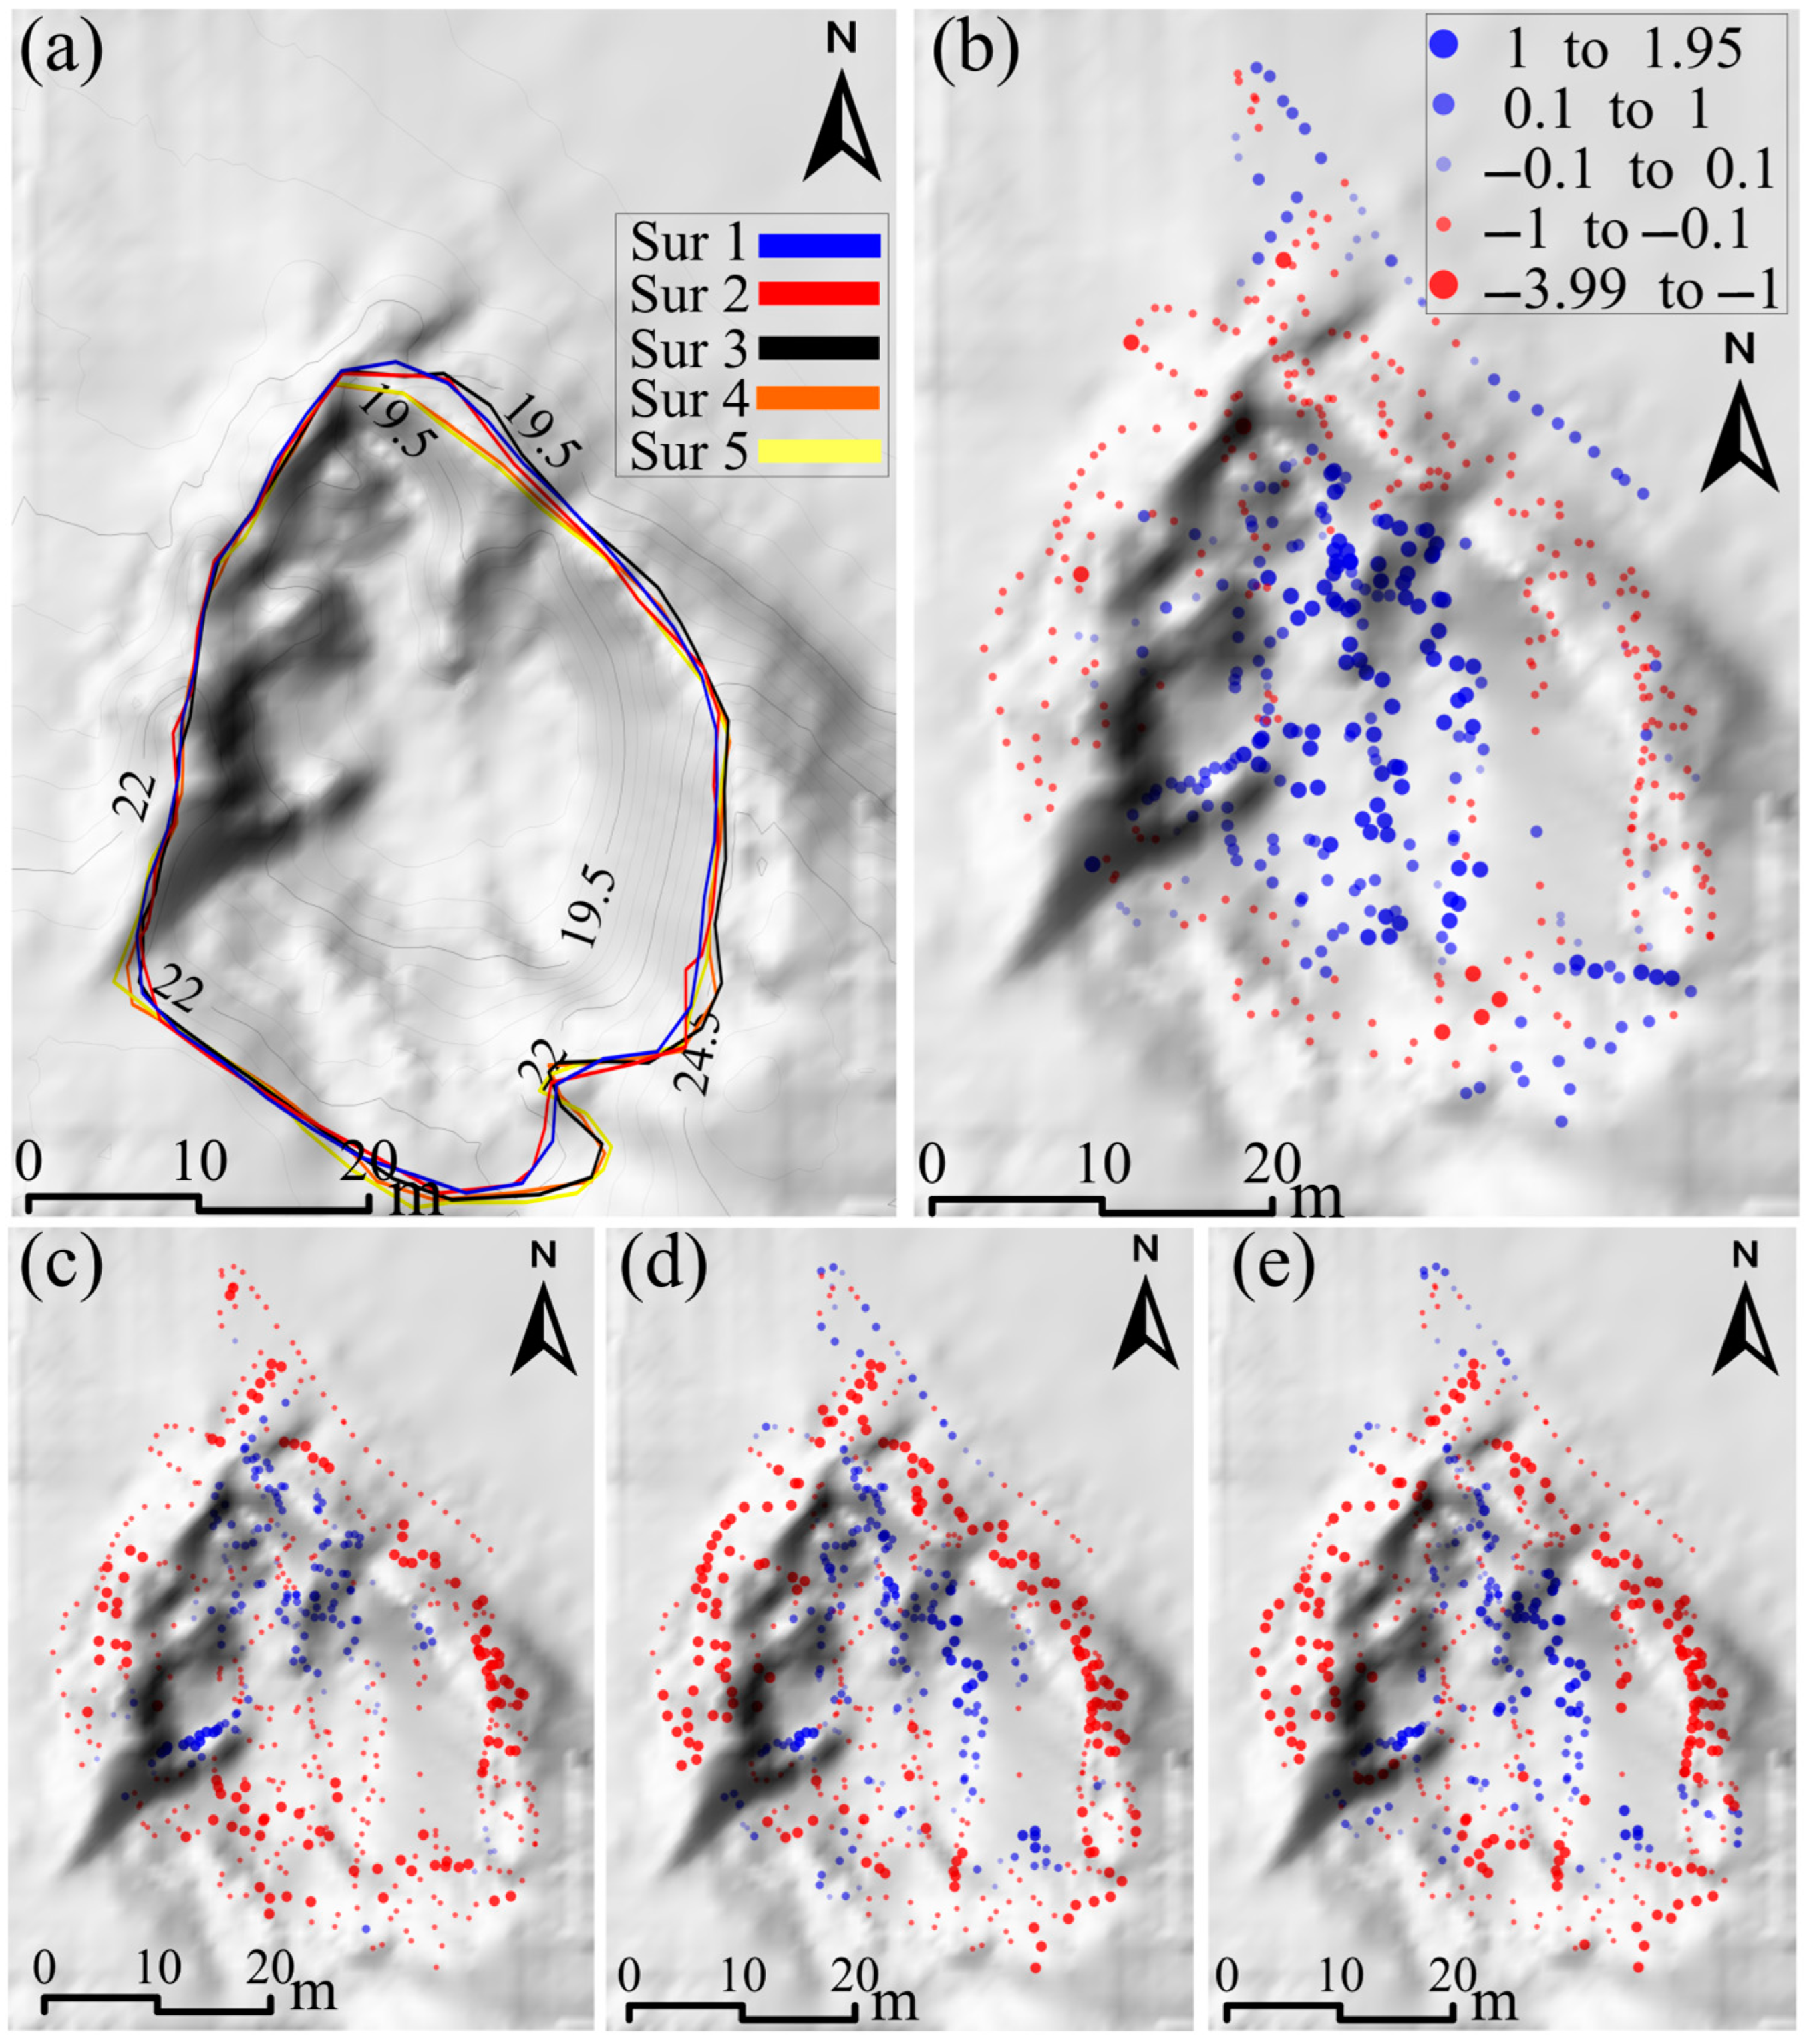
During the topographic survey period, the bowl blowout exhibited no significant morphological changes from survey 1 to survey 2. From survey 2 to survey 5, a clear landward retreat trend of the foredune at the entrance of the bowl blowout was observed, with no significant changes on the west lateral wall and a significant expansion trend on the east lateral wall. During this period, typhoons were the primary influence. Based on the erosion and accretion patterns between survey 1 and survey 2, significant accumulation occurred in the deflation basin, and minor erosion was observed on the lateral walls. Since survey 2, continuous aeolian accretion was in the deflation basin, while erosion was on the lateral walls. The maximum erosion depth on the eastern wall reached 3.99 m.
(2)
Under different wind directions, the wind speed at various parts of the blowout remained relatively stable, with small variability and change ranges. The wind direction was also stable throughout the blowout. The airflow speed within the blowout was lower than the reference wind speed, and the relative acceleration rate exhibited a more significant negative feedback effect from the entrance to the exit of the blowout. The wind speed at the entrance of the blowout ranged from 89.46% to 90.25% of the wind speed at the beach reference station, and the wind speed at the exit of the blowout ranged from 57.57% to 67.66% of the incoming wind speed. In addition, this study found that the wind direction and morphology of the blowout have a pronounced impact on the airflow characteristics within the blowout, and the distribution of airflow within the blowout also affects the development of the blowout morphology.
(3)
The bowl blowout investigated in this study is larger, with a deepening morphology and airflow acceleration. The sediment particles primarily consist of medium to coarse sand. The deflation basin is dominated by accumulation, and multiple shrub dunes are distributed in the front half of the deflation basin. The blowout height is 0.5 to 1.5 m lower than the backshore height. The front half consists of shrub dunes, and the lateral wall areas are extensively covered with Spinifex littoreus and Ipomoea pes-caprae (L.) R. Br., indicating that the bowl blowout has reached the late stage of its life cycle and is classified as depth-limited. Therefore, it cannot evolve into a trough blowout. In addition, influenced by typhoons, the lateral walls of the bowl blowout in the late stage continue to expand through erosion without reaching a critical size for the blowout.

Author Contributions

Conceptualization, S.Z.; methodology, S.Z.; writing—original draft preparation, S.Z. and Y.D.; review and editing, W.T., S.F. and L.Y. All authors have read and agreed to the published version of the manuscript.

Funding

This research was funded by the National Natural Science Foundation of China (Nos. 42401005, and 41871006, and 42101008).

Data Availability Statement

The data presented in this study are available upon request from the corresponding author.

Conflicts of Interest

The authors declare no conflicts of interest.

References

  1. Hesp, P.A. Foredunes and blowouts: Initiation, geomorphology and dynamics. Geomorphology 2002, 48, 245–268. [Google Scholar] [CrossRef]
  2. Hesp, P.A.; Hyde, R. Flow dynamics and geomorphology of a trough blowout. Sedimentology 1996, 43, 505–525. [Google Scholar] [CrossRef]
  3. Luo, W.; Wang, Z.; Lu, J.; Yang, L.; Qian, G.; Dong, Z.; Bateman, M.D. Mega-blowouts in Qinghai–Tibet Plateau: Morphology, distribution and initiation. Earth Surf. Process. Landf. 2018, 44, 449–458. [Google Scholar] [CrossRef]
  4. Smyth, T.A.G.; Jackson, D.; Cooper, A. Airflow and aeolian sediment transport patterns within a coastal trough blowout during lateral wind conditions. Earth Surf. Process. Landf. 2014, 39, 1847–1854. [Google Scholar] [CrossRef]
  5. Smyth, T.A.G.; Jackson, D.W.T.; Cooper, A. Three dimensional airflow patterns within a coastal trough-bowl blowout during fresh breeze to hurricane force winds. Aeolian Res. 2013, 9, 111–123. [Google Scholar] [CrossRef]
  6. Zhou, Y.; Hasi, E.; Wang, Z.; Qing, D.; Han, X.; Yin, J.; Wu, Z. Dynamics of blowouts indicating the process of grassland desertification. Land Degrad. Dev. 2022, 33, 2885–2897. [Google Scholar] [CrossRef]
  7. Pye, K. Morphological development of coastal dunes in a humid tropical environment, Cape Bedford and Cape Flattery, North Queensland. Geogr. Ann. Ser. A-Phys. Geogr. 1982, 64, 213–227. [Google Scholar] [CrossRef]
  8. Jungerius, P.D. A simulation model of blowout development. Earth Surf. Process. Landf. 1984, 9, 509–512. [Google Scholar] [CrossRef]
  9. Byrne, M.L. Seasonal sand transport through a trough blowout at Pinery Provincial Park, Ontario. Can. J. Earth Sci. 1997, 34, 1460–1466. [Google Scholar] [CrossRef]
  10. Mir-Gual, M.; Pons, G.X.; Martín-Prieto, J.Á.; Roig-Munar, F.X.; Rodríguez-Perea, A. Geomorphological and ecological features of blowouts in a western Mediterranean coastal dune complex: A case study of the Es Comú de Muro beach-dune system on the island of Mallorca, Spain. Geo-Mar. Lett. 2013, 33, 129–141. [Google Scholar] [CrossRef]
  11. Hesp, P.A.; Hilton, M.; Konlecher, T. Flow and sediment transport dynamics in a slot and cauldron blowout and over a foredune, Mason Bay, Stewart Island (Rakiura), NZ. Geomorphology 2017, 295, 598–610. [Google Scholar] [CrossRef]
  12. Zhou, Y.; Wang, Z.; Qing, D. Morphological changes and dynamic mechanism of blowouts on fixed dunes in the Otingdag sandy land, China. China J. Sci. Bull. 2023, 68, 1298–1311. (In Chinese) [Google Scholar] [CrossRef]
  13. Łabuz, T.A.; Grunewald, R.; Bobykina, V.; Chubarenko, B.; Česnulevičius, A.; Bautrėnas, A.; Morkūnaitė, R.; Tõnisson, H. Coastal Dunes of the Baltic Sea Shores: A Review. Quaest. Geogr. 2018, 37, 47–71. [Google Scholar] [CrossRef]
  14. Smyth, T.; Fox, B.; Rooney, P.; Bodenbender, B.; De Vries-Zimmerman, S.; O’Keeffe, N. Patterns and controls of topographic change within the deflation basins of a trough and bowl coastal blowout. Earth Surf. Process. Landf. 2024, 49, 3737–3749. [Google Scholar] [CrossRef]
  15. Smith, A.; Gares, P.A.; Wasklewicz, T.; Hesp, P.; Walker, I.J. Three years of morphologic changes at a bowl blowout, Cape Cod, USA. Geomorphology 2017, 295, 452–466. [Google Scholar] [CrossRef]
  16. Gares, P.A. Topographic changes associated with coastal blowouts at Island Beach state park, New Jersey. Earth Surf. Process. Landf. 1992, 17, 589–604. [Google Scholar] [CrossRef]
  17. Talavera, L.; Costas, S.; Ferreira, S. Controls on blowout evolution in southern Portugal: A 49-year analysis. Sci. Total Environ. 2024, 955, 176769. [Google Scholar] [CrossRef]
  18. Gares, P.A.; Nordstorm, K.F. A cyclic model of foredune blowout evolution for a leeward coast, Island beach, New Jersey. Ann. Assoc. Am. Geogr. 1995, 85, 1–20. [Google Scholar]
  19. Barchyn, T.E.; Hugenholtz, C.H. Dune field reactivation from blowouts: Sevier Desert, UT, USA. Aeolian Res. 2013, 11, 75–84. [Google Scholar] [CrossRef]
  20. Fraser, G.S.; Bennett, S.W.; Olyphant, G.A.; Bauch, N.J.; Ferguson, V.; Gellasch, C.A.; Millard, C.L.; Mueller, B.; O’Malley, P.J.; Way, J.N.; et al. Windflow circulation patterns in a coastal dune blowout, south coast of Lake Michigan. J. Coast. Res. 1998, 14, 451–460. [Google Scholar]
  21. Barchyn, T.E.; Hugenholtz, C.H. Reactivation of supply-limited dune fields from blowouts: A conceptual framework for state characterization. Geomorphology 2013, 201, 172–182. [Google Scholar] [CrossRef]
  22. Carter, R.W.G.; Hesp, P.A.; Nordstrom, K. Erosional landforms in coastal dunes. In Coastal Dunes: Form and Process; Nordstrom, K., Psuty, N., Carter, R.W.G., Eds.; John Wiley and Son: Brisbane, Australia, 1990; pp. 217–250. [Google Scholar]
  23. Miyanishi, K.; Johnson, E.A. Coastal dune succession and the reality of dune processes. In Plant Disturbance Ecology: The Process and the Response; Johnson, E.A., Miyanishi, K., Eds.; Academic Press: San Diego, CA, USA, 2007; pp. 249–282. [Google Scholar]
  24. Abhar, K.C.; Walker, I.J.; Hesp, P.A.; Gares, P.A. Spatial-temporal evolution of aeolian blowout dunes at Cape Cod. Geomorphology 2015, 236, 148–162. [Google Scholar] [CrossRef]
  25. Smyth, T.A.; Hesp, P.A.; Walker, I.J.; Wasklewicz, T.; Gares, P.A.; Smith, A.B. Topographic change and numerically modelled near surface wind flow in a bowl blowout. Earth Surf. Process. Landf. 2019, 44, 1988–1999. [Google Scholar] [CrossRef]
  26. Yang, L.; Dong, Y.; Huang, D. Morphological Response of Coastal Dunes to Typhoons and Winter Monsoons on Pingtan Island, China. J. Mar. Sci. Eng. 2024, 12, 1758. [Google Scholar] [CrossRef]
  27. Zhang, S.Y. Morphological Changes and its Dynamic Mechanism of Blowout in Coastal Foredune: A Case Study in Pingtan Island, China; Sun Yat-sen University: Guanzhou, China, 2022. (In Chinese) [Google Scholar]
  28. Chen, F.; Li, Z.G.; Wang, R.G.; Wang, R.K.; Zhang, W.K. Characteristics of grain size distribution of surface eolian sands in Haitan island, Fujian. J. Appl. Oceanogr. 1993, 12, 385–392. (In Chinese) [Google Scholar]
  29. He, Y.; Liu, J.; Cai, F.; Li, B.; Qi, H.; Zhao, S. Aeolian sand transport influenced by tide and beachface morphology. Geomorphology 2022, 396, 107987. [Google Scholar] [CrossRef]
  30. Huang, D.Q.; Dong, Y.X.; Ha, S.; Ma, J. The application of multi-station RTKGPS in the survey of coastal dune. Acta Sci. Nat. Univ. Sunyatseni 2007, 46, 121–124. (In Chinese) [Google Scholar]
  31. Zhang, S.; Qiu, X.; Fu, S.; Fu, J.; Chen, S.; Tian, W.; Huang, D.; Dong, Y. Evolution of blowouts in artificial foredunes on Pingtan Island, China. Earth Surf. Process. Landf. 2022, 47, 2597–2611. (In Chinese) [Google Scholar] [CrossRef]
  32. Jackson, P.S.; Hunt, J.C.R. Turbulent wind flow over a low hill. Q. J. R. Meteorol. Soc. 1975, 101, 929–955. [Google Scholar] [CrossRef]
  33. Hugenholtz, C.H.; Wolfe, S.A. Form- flow interactions of an aeolian saucer blowout. Earth Surf. Process. Landf. 2009, 34, 919–928. [Google Scholar] [CrossRef]
  34. Walker, I.J.; Nickling, W.G. Simulation and measurement of surface shear stress over isolated and closely spaced transverse dunes in a wind tunnel. Earth Surf. Process. Landf. 2003, 28, 1111–1124. [Google Scholar] [CrossRef]
  35. Wu, Z.; Huang, S.; Hu, S.Z.; Wu, K.G.; Jin, Z.M.; Zhu, Y. Research on the Landforms of the Wind-drift Sand in South China Coast; Science Press: Beijing, China, 1995. (In Chinese) [Google Scholar]
  36. Jungerius, P.D.; Witter, J.V.; van Boxel, J.H. The effects of changing wind regimes in the development of blowouts in the coastal dunes of The Netherlands. Landsc. Ecol. 1991, 6, 41–48. [Google Scholar] [CrossRef]
  37. Hesp, P.A.; Pringle, A. Flow behaviour in a trough blowout. Tangimoana, New Zealand. J. Coast. Res. 2001, 34, 597–601. [Google Scholar]
  38. Pease, P.; Gares, P. The influence of topography and approach angles on local deflections of airflow within a coastal blowout. Earth Surf. Process. Landf. 2013, 38, 1160–1169. [Google Scholar] [CrossRef]
  39. Jerolmack, D.J.; Ewing, R.C.; Falcini, F.; Martin, R.L.; Masteller, C.; Phillips, C.; Reitz, M.D.; Buynevich, I. Internal boundary layer model for the evolution of desert dune fields. Nat. Geosci. 2012, 5, 206–209. [Google Scholar] [CrossRef]
  40. Hugenholtz, C.H.; Wolfe, S.A. Morphodynamics and climate controls of two aeolian blowouts on the northern Great Plains. Earth Surf. Process. Landf. 2006, 31, 1540–1557. [Google Scholar] [CrossRef]
  41. Zhang, S.; Dong, Y.Y.; Hasi, E.; Huang, D.Q. Morphodynamics and morphological evolution characteristics of blowouts dunefields: A case study in Haitan Island, Fujian. Geogr. Res. 2024, 43, 255–271. (In Chinese) [Google Scholar]
  42. Yang, L.; Dong, Y.X.; Huang, D.Q. Morphological change of coastal climbing dunes in Pingtan Island of China after typhoon group. J. Desert Res. 2020, 40, 1–8. (In Chinese) [Google Scholar]
  43. Hesp, P.A.; Walker, I.J. Coastal Dunes. In Treatise on Geomorphology; Shroder, J.F., Ed.; Academic Press: San Diego, CA, USA, 2013; Volume 11, pp. 328–355. [Google Scholar]
Figure 1. Study Area Profile. (a) Administrative division; (b) Imagery of the study area; (c) General situation of the blowout; (d) Photograph of the blowout (2021); (e) Air flow observation points in the blowout.
Jmse 13 00638 g001
Figure 2. Morphological Characteristics of the Bowl Blowout. (a) Morphological changes of the bowl blowout; (b) Erosion–accumulation changes from survey 1 to 2; (c) Erosion–accumulation changes from survey 1 to 3; (d) Erosion–accumulation changes from survey 1 to 4; (e) Erosion–accumulation changes from survey 1 to 5.
Jmse 13 00638 g002
Figure 3. Airflow Patterns within the Blowout under Different Approach Flow Directions. (a) Approach flow direction at 23°; (b) Approach flow direction at 29°; (c) Approach flow direction at 35°.
Jmse 13 00638 g003
Figure 4. Relative Acceleration Rate of Wind Speed (δs) in the Bowl Blowout.
Jmse 13 00638 g004
Figure 5. Regional Environmental Characteristics: (a) Annual sediment transport environment; (b) Monthly sediment transport environment; (c) Average annual sediment transport environment; (d) Long-axis orientation of the blowout; (e) Wind speed during the survey period.
Jmse 13 00638 g005
Figure 6. Schematic Diagram of the Evolution of Bowl Blowout in the Late Stage of Coastal Foredune.
Jmse 13 00638 g006
Table 1. Wind Conditions at the Reference Station under Different Approach Flow Directions (z = 2 m).
Observation TimeApproach Wind Direction (°)Approach Wind Speed (m/s)Fsδs
Observation 12310.360.090.00
Observation 2299.970.090.00
Observation 33510.820.060.00
Table 2. Grain Size Distribution (%) of Sediments Across Different Morphological Units of the Bowl Blowout.
LocationSampleMz
(Φ)
Clay
(>8Φ)
Silt (4~8Φ)V. Fine Sand
(3~4Φ)
Fine Sand
(2~3Φ)
Medium Sand
(1~2Φ)
Coarse Sand
(0~1Φ)
V. Coarse Sand
(−1~0Φ)
BackshoreTD11.830001.96937.90250.8659.2640.000
BlowoutLong AxisTD21.499000.86523.39551.18724.2810.273
TD31.386001.04920.61146.69929.6681.973
TD41.736004.92735.24239.59617.6752.559
TD51.480003.45526.21739.26926.7914.268
Mean 1.525002.57426.36644.18824.6042.268
W. lateral wallTD62.195003.90261.80234.1140.1820
TD71.232000.08112.83549.66635.7561.662
TD81.896004.70341.21942.34411.2860.447
Mean 1.774002.89538.61942.04115.7410.703
E. lateral wallTD91.950001.35545.02950.7912.8260
TD101.188002.29318.18534.86435.6738.985
TD111.046001.3879.83339.19543.6465.940
Mean 1.395001.67824.34941.61727.3814.975
Overall Mean 1.561002.40229.43742.77322.7782.611
Disclaimer/Publisher’s Note: The statements, opinions and data contained in all publications are solely those of the individual author(s) and contributor(s) and not of MDPI and/or the editor(s). MDPI and/or the editor(s) disclaim responsibility for any injury to people or property resulting from any ideas, methods, instructions or products referred to in the content.

