Article

Tidal Exclusion Barriers Fragment an Invertebrate Community into Taxonomically and Functionally Distinct Estuarine and Wetland Assemblages

by
Sorcha Cronin-O’Reilly
1,
Alan Cottingham
1,
Linda H. Kalnejais
2,
Kath Lynch
2 and
James R. Tweedley
1,3,*
1
Centre for Sustainable Aquatic Ecosystems, Harry Butler Institute, Murdoch University, 90 South Street, Murdoch, WA 6150, Australia
2
Department of Water and Environmental Regulation, Government of Western Australia, Busselton, WA 6280, Australia
3
School of Environmental and Conservation Sciences, Murdoch University, 90 South Street, Murdoch, WA 6150, Australia
*
Author to whom correspondence should be addressed.
J. Mar. Sci. Eng. 2025, 13(4), 635; https://doi.org/10.3390/jmse13040635
Submission received: 27 February 2025 / Revised: 18 March 2025 / Accepted: 19 March 2025 / Published: 22 March 2025
(This article belongs to the Special Issue Benthic Ecology in Coastal and Brackish Systems—2nd Edition)

Abstract

:
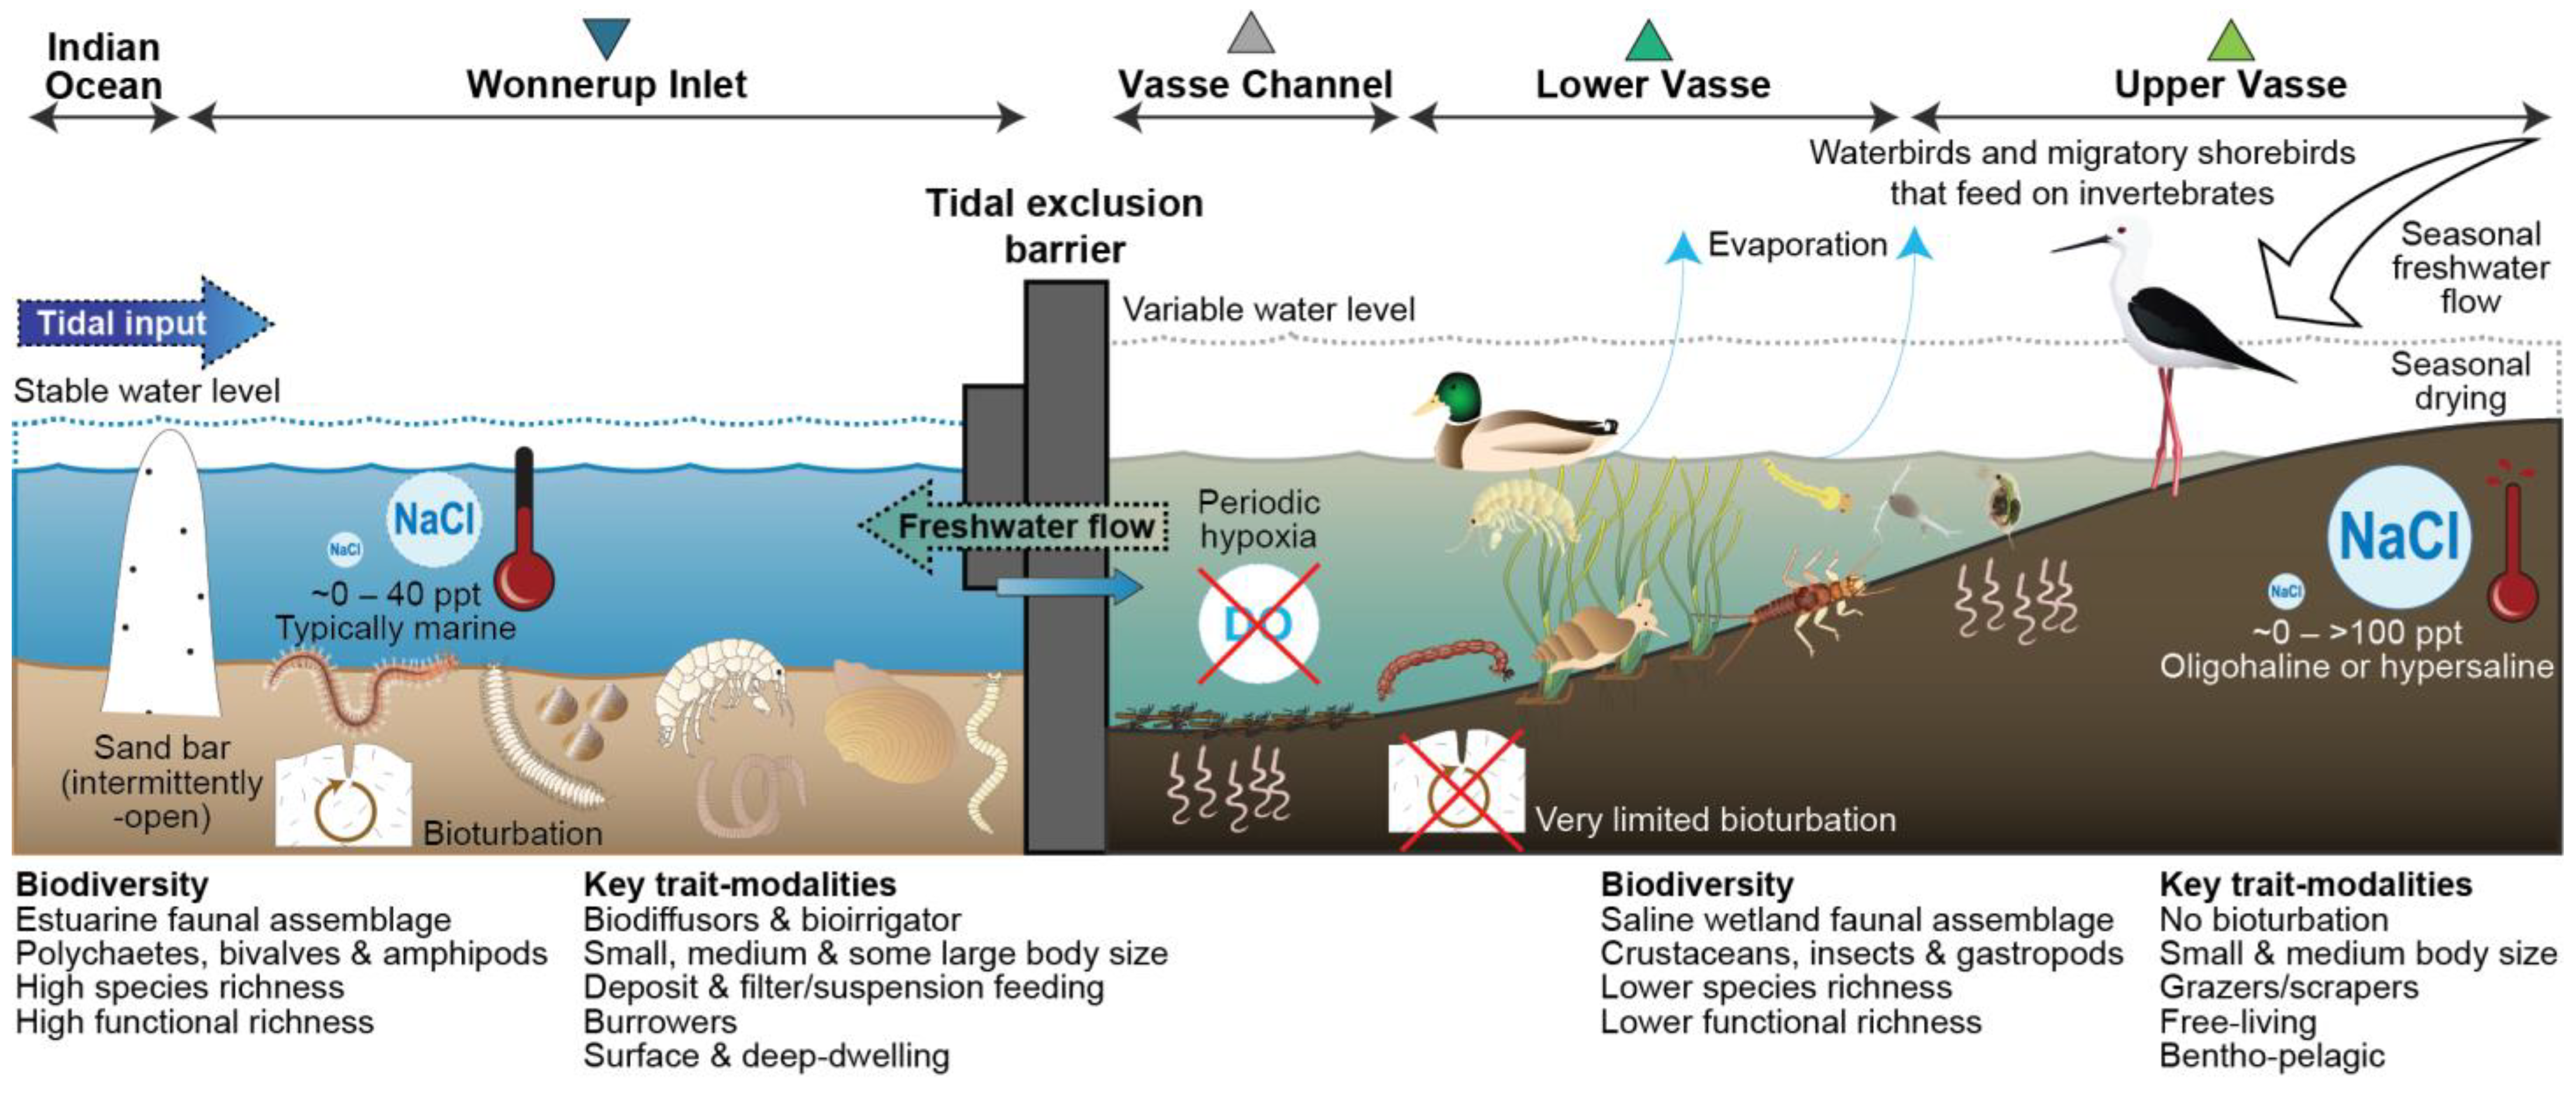
Various types of tidal barriers are used in estuaries to reduce saltwater intrusion and regulate freshwater discharge, but they often alter the physicochemical environment and faunal composition. With the use of these structures expected to increase due to climate change, there is a need to understand their impacts. A tidal exclusion barrier in the Ramsar-listed Vasse–Wonnerup Estuary (Australia) was found to act as an ecotone, fragmenting the estuarine gradient into two distinct components, a relatively stable marine-like environment downstream and a highly variable oligohaline to hypersaline (~0 to >100 ppt) environment upstream. The downstream regions contained a speciose and functionally rich estuarine fauna, comprising mainly polychaetes and bivalves. The upstream regions were taxonomically and functionally depauperate, containing insects, gastropods, and ostracods typically found in saline wetlands. The fragmentation of the estuary has likely impacted the provision of ecosystem services, with the fauna downstream mainly comprising burrowing species that bioturbate and, thus, aid in nutrient cycling. In contrast, the environmental conditions caused by the barrier and the resultant epifaunal invertebrate assemblages upstream aid little in bioturbation, but provide nutrition for avian fauna. These results may help in understanding the impacts of constructing new barriers in coastal ecosystems in response to climate change.

Graphical Abstract

1. Introduction

Estuaries are transitional ecosystems located between terrestrial and marine environments and are strongly influenced by both freshwater and tidal flows, the magnitudes of which vary temporally [1,2]. These dynamic physicochemical and productive environments support a unique suite of species and ecosystem services, such as nutrient cycling and the provision of nursery areas and feeding grounds for migratory birds [3,4,5]. Estuaries are also focal points of human settlement due to their productive waters and floodplains, which facilitate fisheries, agriculture, industry, trade, and recreation [6,7]. Human use has often led to substantial modification to estuaries and their rivers/catchments, including dredging, the clearing of riparian vegetation, land reclamation, and eutrophication [8,9]. Another common modification is the construction of tidal barriers to reduce saltwater intrusion onto agricultural land, reduce flooding from storm surges, regulate freshwater discharge, facilitate water storage, and generate electricity [10,11].
There are numerous types of tidal barriers [12,13], with Bice et al. [14] identifying four main categories based on the extent to which they disrupt the connectivity between upstream and downstream areas. The categories are (i) surge barriers, i.e., barriers deployed during flood risk but remain open otherwise, e.g., the Thames Barrier (UK) has been closed 221 times during its 41 years of operation [15], (ii) part-tide barriers, i.e., those that restrict but do not preclude tidal flux, e.g., fixed-crest weirs or tide gates, (iii) tidal exclusion barriers (TEBs) that prevent the intrusion of seawater, and (iv) barriers with a pumping station (closure dam), which prevent saltwater intrusion and impound freshwater.
The infrequent operation of surge barriers has led numerous authors to deem that these structures have a limited impact on connectivity and animal migration [14]. However, the construction of such fixed infrastructure can locally enhance water velocities and reduce tidal amplitudes in an estuary, leading to stratification and increased water residence times [16,17]. More restrictive barriers can have a range of more severe impacts, including the loss of upstream tidal flux and alterations in freshwater flow, which, in turn, alter environmental conditions [14,18,19]. For example, reducing or precluding tidal flux can result in the disconnection of freshwater–estuarine–marine habitats, with upstream habitats becoming freshwater/brackish environments [20]. A decreased water flow and/or the retention of water can facilitate the accumulation of nutrients and non-nutrient contaminants and lead to oxygen depletion [21,22] and fish kills [23]. Reductions in freshwater discharge into downstream habitats can result in marinization and coastal squeeze [24]. Moreover, a reduced freshwater flow decreases cues for the upstream migration of diadromous species, with such movements also being prevented by physical barriers and/or obstructed for periods of the tidal cycle in the case of part-tide barriers [14,25]. These impacts reduce connectivity, increase habitat fragmentation, and alter faunal competition. While most research has been conducted on fish faunas [20,26,27,28], barriers can also alter the composition of invertebrate communities [29,30,31].
Rising sea levels and alterations in freshwater flow due to climate change, combined with an expanding anthropogenic footprint in coastal areas, will result in an increasing use of existing tidal barriers and the construction of new structures [32]. While there is a paucity of data before construction to help assess the effects of barriers on estuaries, Orton et al. [16] considered that obtaining ecological measurements after surge barriers are built, particularly those built decades earlier, can significantly improve our understanding of their environmental effects.
Tidal exclusion barriers were first constructed in the Vasse–Wonnerup in southwestern Australia almost 120 years ago to stop the flooding of low-lying agricultural land and the nearby townsite of Busselton with seawater during storm surges. Their construction fundamentally changed the Vasse–Wonnerup from an estuarine environment to a fresh-brackish wetland where parts of the system dried during summer [33]. Since 1988, seawater from the lower estuarine reaches has been allowed through the TEBs into the Vasse and later the Wonnerup during summer and autumn to maintain a minimum water level, altering the salinity regime and resulting in salinities ranging from oligohaline to hypersaline [34,35]. While the original TEBs have been replaced several times, there is little understanding of how their continued presence has influenced faunal communities. Several studies on large-bodied fish fauna, initiated in response to fish kills, suggest that the fish communities on each side of the TEBs are different but that under certain conditions fish move through a fish gate in the barrier [23,28,36].
This study aimed to determine how the biodiversity and species composition of benthic macroinvertebrate fauna differed in areas of the Vasse–Wonnerup on either side of the TEBs and their similarity to a range of other aquatic environments in southwestern Australia. Furthermore, as estuaries, wetlands, and their associated biota provide numerous ecosystem goods and services [4,5], the same faunal data were analysed using functional diversity metrics to investigate if the functioning of the estuarine (downstream) and wetland (upstream) areas differed [37]. The results help to understand how historical management actions influence coastal ecosystems today and could be used to inform ecological impact assessments for future TEB construction projects required to mitigate the ever-increasing effects of climate change.

2. Materials and Methods

2.1. Study Site

The Vasse–Wonnerup (33°36′52″ S; 115°25′23″ E) is an intermittently open estuary (i.e., sandbar opens multiple times each year) on the west coast of southwestern Australia. It is internationally recognised as an ecologically important wetland by the Ramsar Convention, as it has supported over 20,000 waterbirds from 90 species [38,39]. The system comprises the Vasse and Wonnerup estuaries, Wonnerup Inlet, and the Deadwater (Figure 1). The Vasse and Wonnerup estuaries are ~9.5 and 5.5 km long, up to 700 and 900 m wide, and, although their surface areas change markedly throughout the year due to highly seasonal river flow, their regularly inundated areas cover 3 and 3.5 km2, respectively [33,35]. The two estuaries contain broad, shallow basins (~1 m deep in winter), and each has a narrow exit channel at their downstream end that is connected via two TEBs to the Wonnerup Inlet [34]. The Vasse Channel is ~1.6 km long and typically 30–40 m wide but narrows to 10 m near one of the two islands. It reaches a depth of 2 m and the substrate comprises black sulfidic ooze 10–20 cm deep, however, immediately upstream of the TEB, this layer was found to be 60–100 cm deep [40]. The Wonnerup Inlet contains the estuary mouth, which is a sandbar that breaches naturally during high flows or is artificially breached [36]. This part of the estuary is ~2 km long, up to 100 m wide and 2 m deep, and covers an area of 0.11 km2. The Deadwater is a 2 km long, narrow lagoon (15–100 m wide, up to 2 m deep; 0.14 km2) that lies parallel to the shore behind coastal dunes. This region receives no freshwater flow from rivers but is connected to the Wonnerup Inlet. Unlike the two estuaries, the Wonnerup Inlet and the Deadwater are tidally influenced when the sandbar is open and maintain a more consistent water level throughout the year, as they do not have large areas that dry out [34].
The TEBs were first installed in 1908, replaced in 1927, refurbished in 1942 and 1991, and replaced again in 2004 [33]. Currently, each barrier (~40 m wide) contains numerous flap gates that push against the barrier, thus preventing the upstream movement of inflow from tides and/or storm surges but allowing water to move downstream into the Wonnerup Inlet when the water level on the upstream side is sufficient to open the flap gates (Figure A1). To retain water in the estuaries during summer, checkboards can be added that increase the effective sill height [33,35]. A propped gate (4 m long and 2 m wide) and/or smaller fish gate (4 m long and 0.4 m wide) can be opened when the tidal height/water level is sufficient to allow water to move in a desired direction. These gates are typically used to increase the water levels in upstream areas during summer/autumn to compensate for evaporation, improve water quality, and allow fish to escape the poor water quality on the upstream side by moving into the Wonnerup Inlet and/or the ocean [23].

2.2. Sample Collection and Processing

During March 2017, the benthic macroinvertebrate community was sampled at four sites in each of the two regions downstream and the five regions upstream of the Vasse and Wonnerup TEBs (Figure 1 and Figure A1). The two regions downstream were the Wonnerup Inlet (IT) and the Deadwater (DW), with the Vasse Channel (VC), Upper and Lower Vasse (UV and LV, respectively), and the Upper and Lower Wonnerup (UW and LW, respectively) located upstream of the TEBs. At each of the four sites, two replicate sediment samples were collected from a depth of 15 cm using an Ekman grab (Wildco, Yulee, FL, USA; 0.225 m−2). Sediment was wet sieved using a 500 µm sieve, preserved in a 5% formalin solution for one week, and stored in a 70% ethanol solution. Benthic macroinvertebrates were extracted from the sediment samples, identified to the lowest practical taxonomic level, and counted. Measurements of the water temperature (°C), salinity (ppt), and dissolved oxygen concentration (mgL−1) during sampling and over a broader period were collected with a YSI ProDSS multiparameter sonde (YSI Inc., Yellow Springs, OH, USA) at 0.2 m intervals through the water column at each site. Routine sampling provided information for the broader period and was typically undertaken within each region at least every month, except for the Deadwater, which was only sampled in the dry period (i.e., from November to April). The water quality data were extracted from a publicly accessible government database [41]. Higher-frequency data were also available from the Vasse Channel 20 and 240 m upstream of the TEB from YSI EXO2 multiparameter sondes (YSI Inc., Yellow Springs, OH, USA) recording every 5 min and mounted 0.5 m off the bottom.

2.3. Data Analysis

2.3.1. Taxonomic Diversity and Composition

A series of analyses were conducted to assess whether the benthic macroinvertebrate community structure differed broadly upstream and downstream of the TEBs and throughout the estuary using the PRIMER v7 multivariate statistics software package [42] with the PERMANOVA+ add-on [43]. The abundance of each macroinvertebrate species in each sample was used to calculate the number of species (species richness), total abundance (225 cm−2), Simpson’s index (1−λ’), and quantitative taxonomic distinctness (Δ*) [44]. The two values for each taxonomic diversity measure were then averaged for each site, providing four replicate values per region. Based on plots of the loge of the mean and standard deviation and a Draftsman plot, total abundance was fourth-root transformed, and none of the variables were found to be autocorrelated [45]. The data for each measure were used to construct a Euclidean distance matrix, which was subjected to a one-way permutational analysis of variance (PERMANOVA) [43] to determine if they differed significantly (p < 0.05) with region (seven levels, i.e., Wonnerup Inlet, Deadwater, Vasse Channel, Lower Vasse, Upper Vasse, Lower Wonnerup, and Upper Wonnerup). When a significant difference was detected, a pairwise PERMANOVA test and a bar plot of the back-transformed means were used to identify the pairwise combination of regions responsible for the differences, with the magnitude of such differences gauged from pairwise t values.
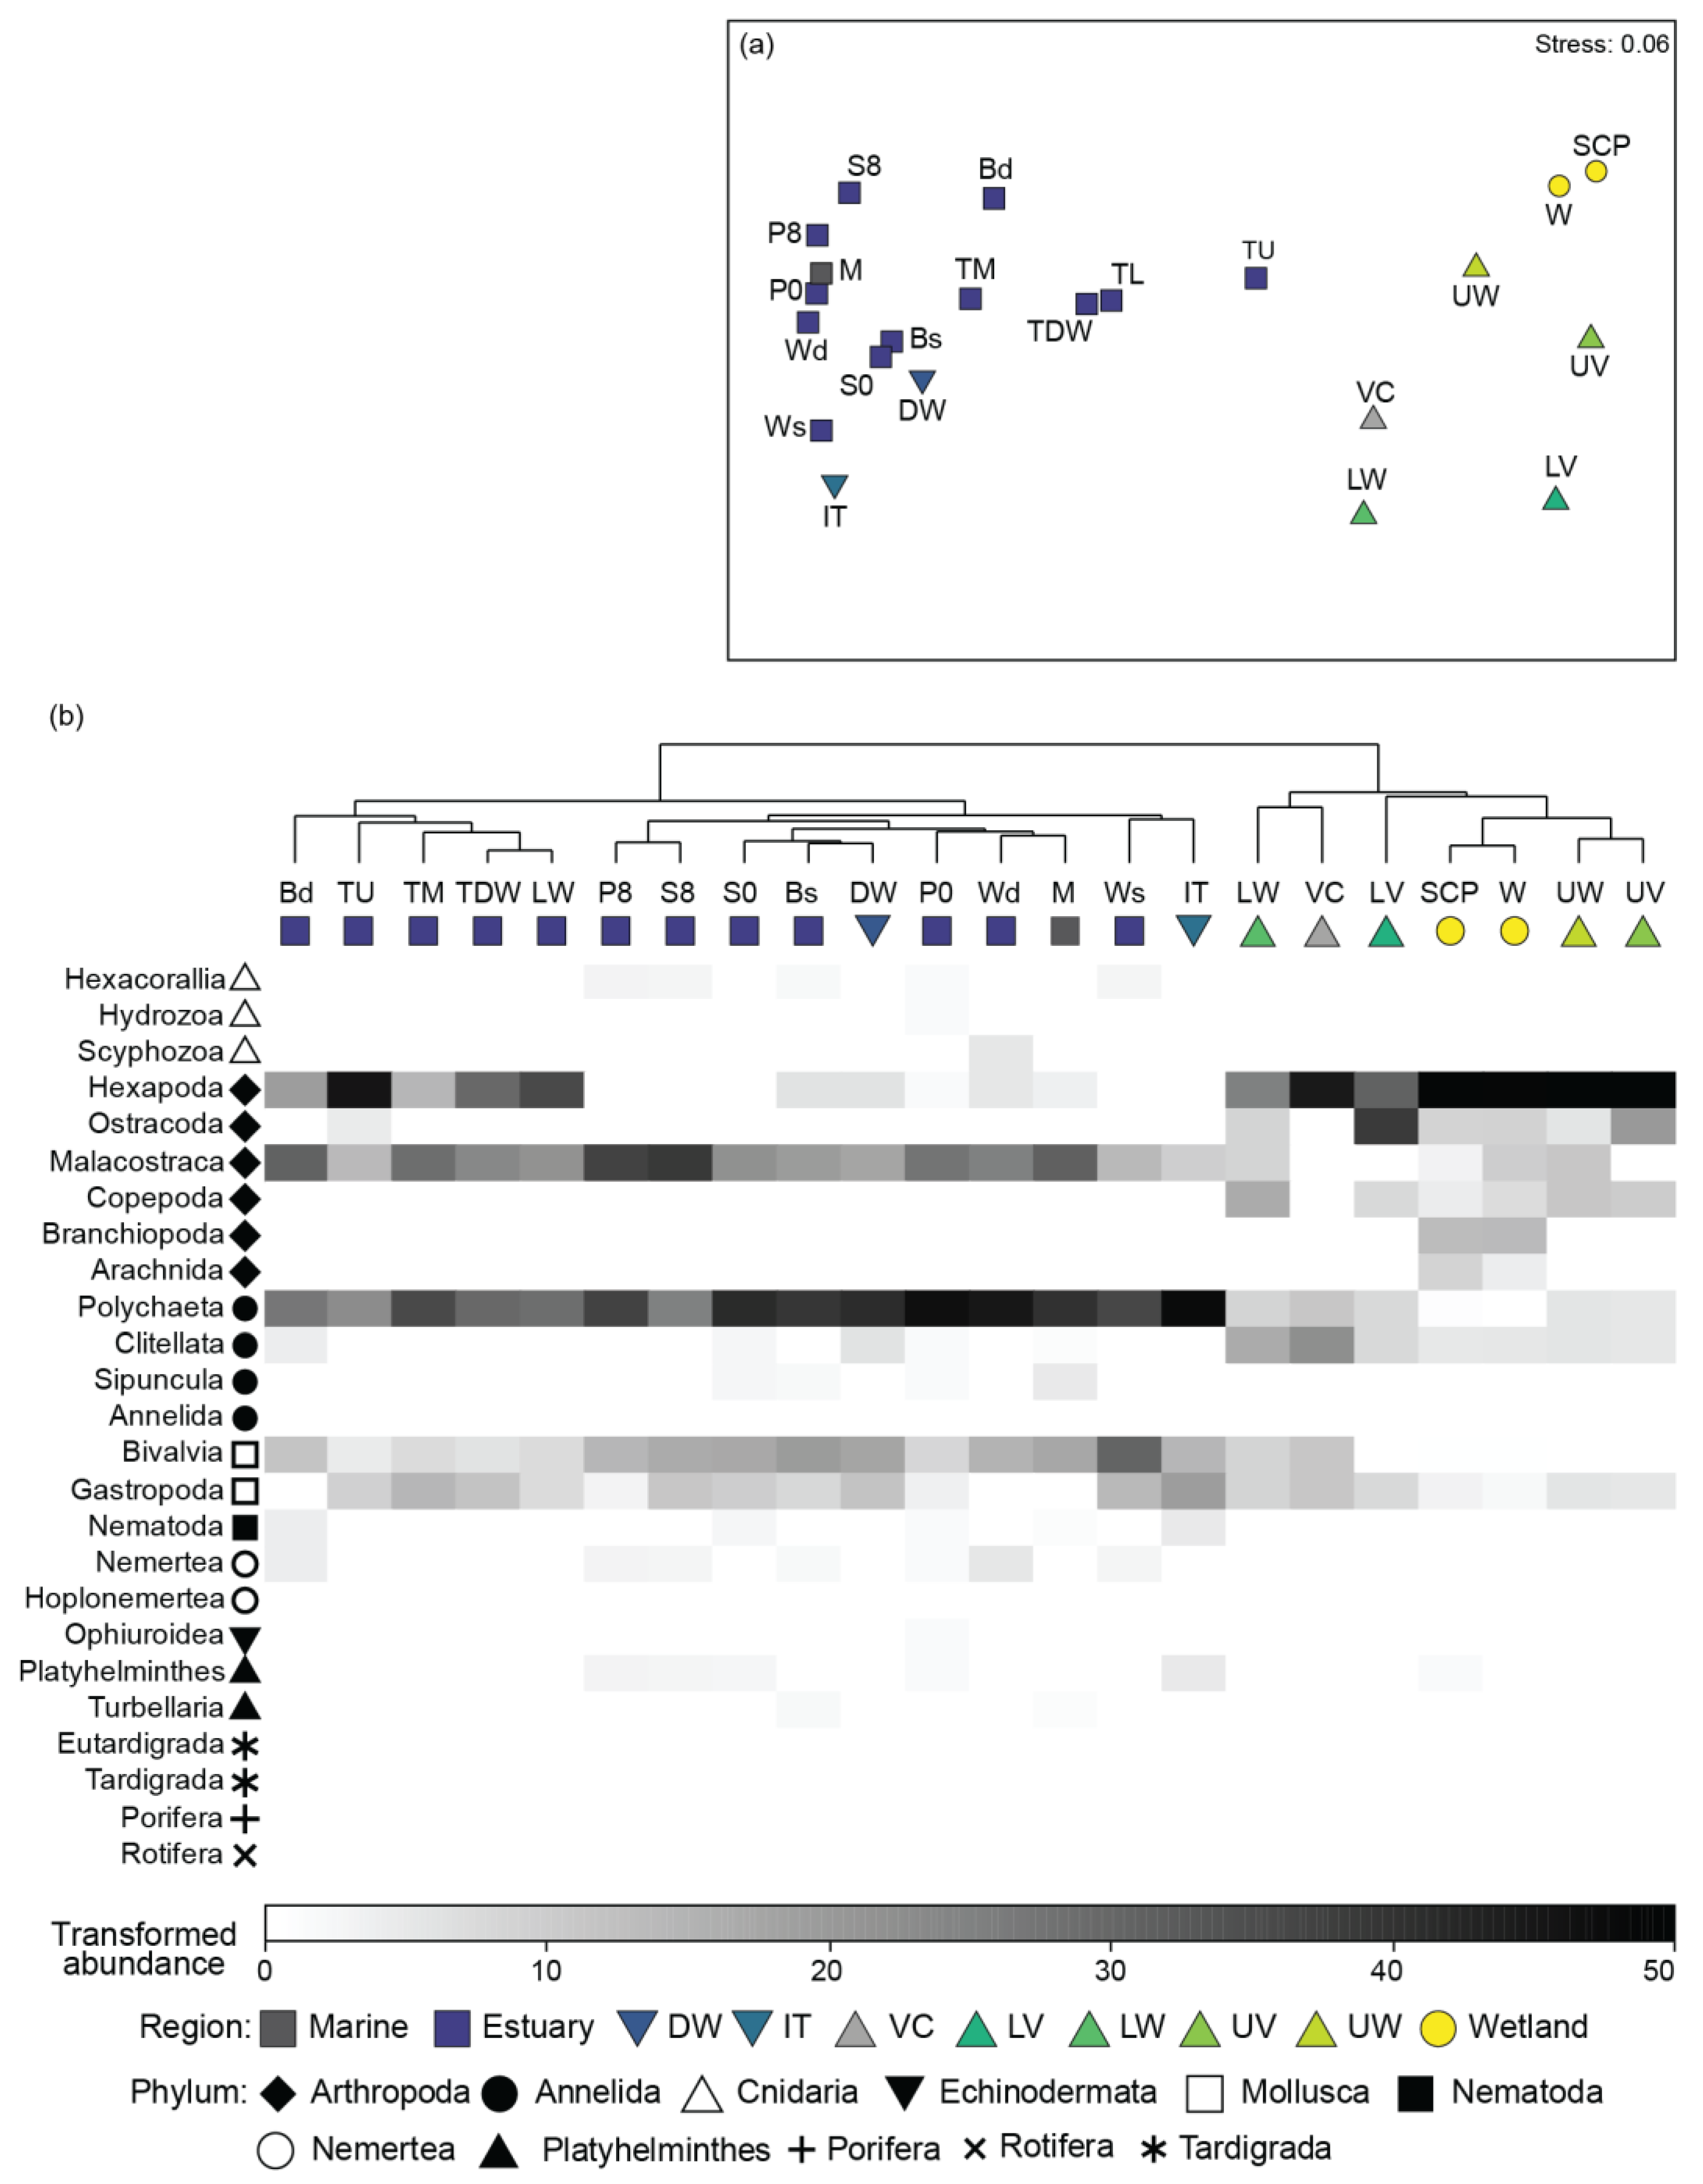
For multivariate community composition data, the count of each species was averaged for each site, dispersion-weighted [46], and then square-root transformed to balance the contributions of rare and common species. The pretreated data were then used to construct a Bray–Curtis similarity matrix that was subjected to a one-way PERMANOVA. To visualise the spatial patterns exhibited by the macroinvertebrate community, a non-metric multidimensional scaling (nMDS) ordination plot [47] was constructed from the Bray–Curtis resemblance matrix. A shade plot derived from the transformed abundance data was built to visualise the trends exhibited by the benthic macroinvertebrate taxa [48]. This plot is a simple visualisation of the frequency matrix, where a white space for a species demonstrates that this particular species was not collected and the depth of shading from grey to black is linearly proportional to the transformed abundance of that species. Taxa were clustered into distinct and non-distinct SIMPROF clusters based on their Index of Association and placed in optimum serial order. Note that, for clarity, only species whose transformed abundances were ≥10% of the total number of individuals in any region were included on the plot.

2.3.2. Functional Trait Analysis

Five functional traits, i.e., bioturbation mode, body size, feeding mode, living habit, and sediment position, comprising 28 trait modalities, were selected (Table 1; Table S1). Each species was classified into trait modalities using information provided by the South Australian Macrobenthic Traits (SAMT) database [49]. The SAMT database uses fuzzy coding, applying a score (ranging from 0 to 1) across modalities that corresponds with their affinity to the trait (e.g., 1, meaning it belongs solely to that modality or if a species has equal affinities to two modalities, 0.5 for each). For species not listed in the SAMT database, which were mainly insects, the Australian River Assessment System (AusRivAS) trait database for freshwater invertebrates was consulted [50]. This database combines seven other trait databases, some of which apply fuzzy coding. Given that the AusRivAS trait database has trait modalities tailored for freshwater invertebrates, care was taken in assigning them to the most appropriate trait groups in the SAMT database. For example, some species are classified as collectors or gatherers in AusRivAS, while species in the SAMT database are classified as subsurface deposit feeders or deposit feeders. In this instance, species classified as collectors and gatherers were classified as deposit feeders, as they primarily feed on detritus on the substrate. Other groups were synonymous (e.g., filterers vs filter feeders). For bioturbation, no trait information was supplied in the AusRivAS database [50], the New Zealand Freshwater Macroinvertebrate Trait Database [51], or the South African freshwater invertebrate database [52]. As three insect taxa (Chironomidae, Ceratopogonidae, and Dolichopodidae) were grouped as having no bioturbation effect in the SAMT database, the same grouping was applied to other insects. In total, 42 of the 54 taxa (77% of taxa, 97.5% of invertebrates) recorded were identified to a sufficient taxonomic level to be assigned to functional guilds.
A suite of functional diversity metrics, i.e., the functional richness, functional evenness, functional diversion, functional dispersion, Rao’s quadratic entropy, functional redundancy, and community-level weighted means (CWMs) of each trait modality, were calculated for each site in the seven regions in the Vasse–Wonnerup and also for each region. Values were calculated using the “FD” package [53] in R v4.3.2 [54]. Functional richness is a measure of the amount of niche space occupied by the species within a community, and functional evenness is the extent to which the individuals in a community are distributed across niche space [55]. Functional divergence is the distance between a high species abundance and the centre of functional space, with high values indicating a high degree of niche differentiation and, thus, low resource competition. Functional dispersion estimates the mean distance of all species to the weighted centroid of a community in a trait space, with larger values indicating that niche overlap is small and resource utilization efficiency is high [56]. Functional redundancy is the ratio between Rao’s quadratic entropy and Shannon diversity (H’) [57] and provides information on how common the expressed traits are within a habitat, with a higher ratio being indicative of a lower functional redundancy.
The data for each functional diversity measure and the CWM for each trait modality at each site did not require transformation and were each used to create a Euclidean distance matrix, subjected to one-way PERMANOVA, and used to produce bar graphs. Note that, as several of the sites from the Vasse Channel were depauperate, insufficient replicates were available for statistical analyses of functional richness, evenness, and dispersion, Rao’s quadratic entropy, and functional redundancy. Therefore, this region was excluded from the analyses of those variables, but a mean value is provided on the associated bar graphs. The CWM values for all trait modalities were used to create a Bray–Curtis similarity matrix. This was, in turn, subjected to a multivariate PERMANOVA and used by Principal Coordinates Analysis (PCoA) to produce an ordination plot [43]. Superimposed on the plot were vectors for trait modalities that differed significantly among regions. Radar plots were also produced using the CWM values for each region.

2.3.3. Broader Comparisons of Faunal Composition

Regional differences in the benthic macroinvertebrate faunal composition in the Vasse–Wonnerup (with TEBs) were compared visually to those from the nearby Toby Inlet (24 km away), which does not have TEBs. In brief, macroinvertebrates were sampled with the same Ekman grab, with two replicate samples collected from six sites in each of the four regions of the Toby Inlet, i.e., the Upper, Middle, and Lower estuaries and the Deadwater, in November 2017 [58]. The abundance of each species at each site in both estuaries was combined into a single matrix and then pretreated as above, using dispersion weighting and square-root transformation. These pretreated data were used to construct a Bray–Curtis similarity matrix that was subjected to nMDS ordination. For clarity, the pretreated data for the 68 species were aggregated to a higher taxonomic level (class or higher), averaged for each region, and used to produce a shade plot. Higher taxonomic levels were arranged via seriation and regions by cluster analysis.
The benthic macroinvertebrate species present in the various regions of the Vasse–Wonnerup were then compared to a range of estuaries, wetlands, and coastal waters across southwestern Australia. A taxa list was compiled using species recorded from the shallow waters of the Swan–Canning and Peel–Harvey estuaries in the 1980s and 2000s [59,60] on the lower west coast of Western Australia, the shallow and deeper (>2 m) waters of the Broke and Wilson Inlets [61,62] on the south coast, and in wetlands across the Swan Coastal Plain [63] and Warrren [64] bioregions in which these six estuaries are located (Figure 1). Data were also available for shallow, coastal waters adjacent to the Swan–Canning Estuary [65]. All taxa in the list were checked for up-to-date nomenclature and taxonomy using the World Register of Marine Species (https://www.marinespecies.org/, accessed on 7 June 2024) and Atlas of Living Australia (https://www.ala.org.au/, accessed on 7 June 2024) to ensure consistency. The presence/absence of each species was aggregated to a ‘class’ (or higher) level to calculate the species richness per taxonomic group. These data were then standardized to a percentage composition and used to produce a Bray–Curtis similarity matrix, nMDS plot, and shade plot for visual comparison. Aquatic systems were ordered according to a cluster dendrogram and higher taxonomic levels by seriation.

3. Results

3.1. Environmental Conditions

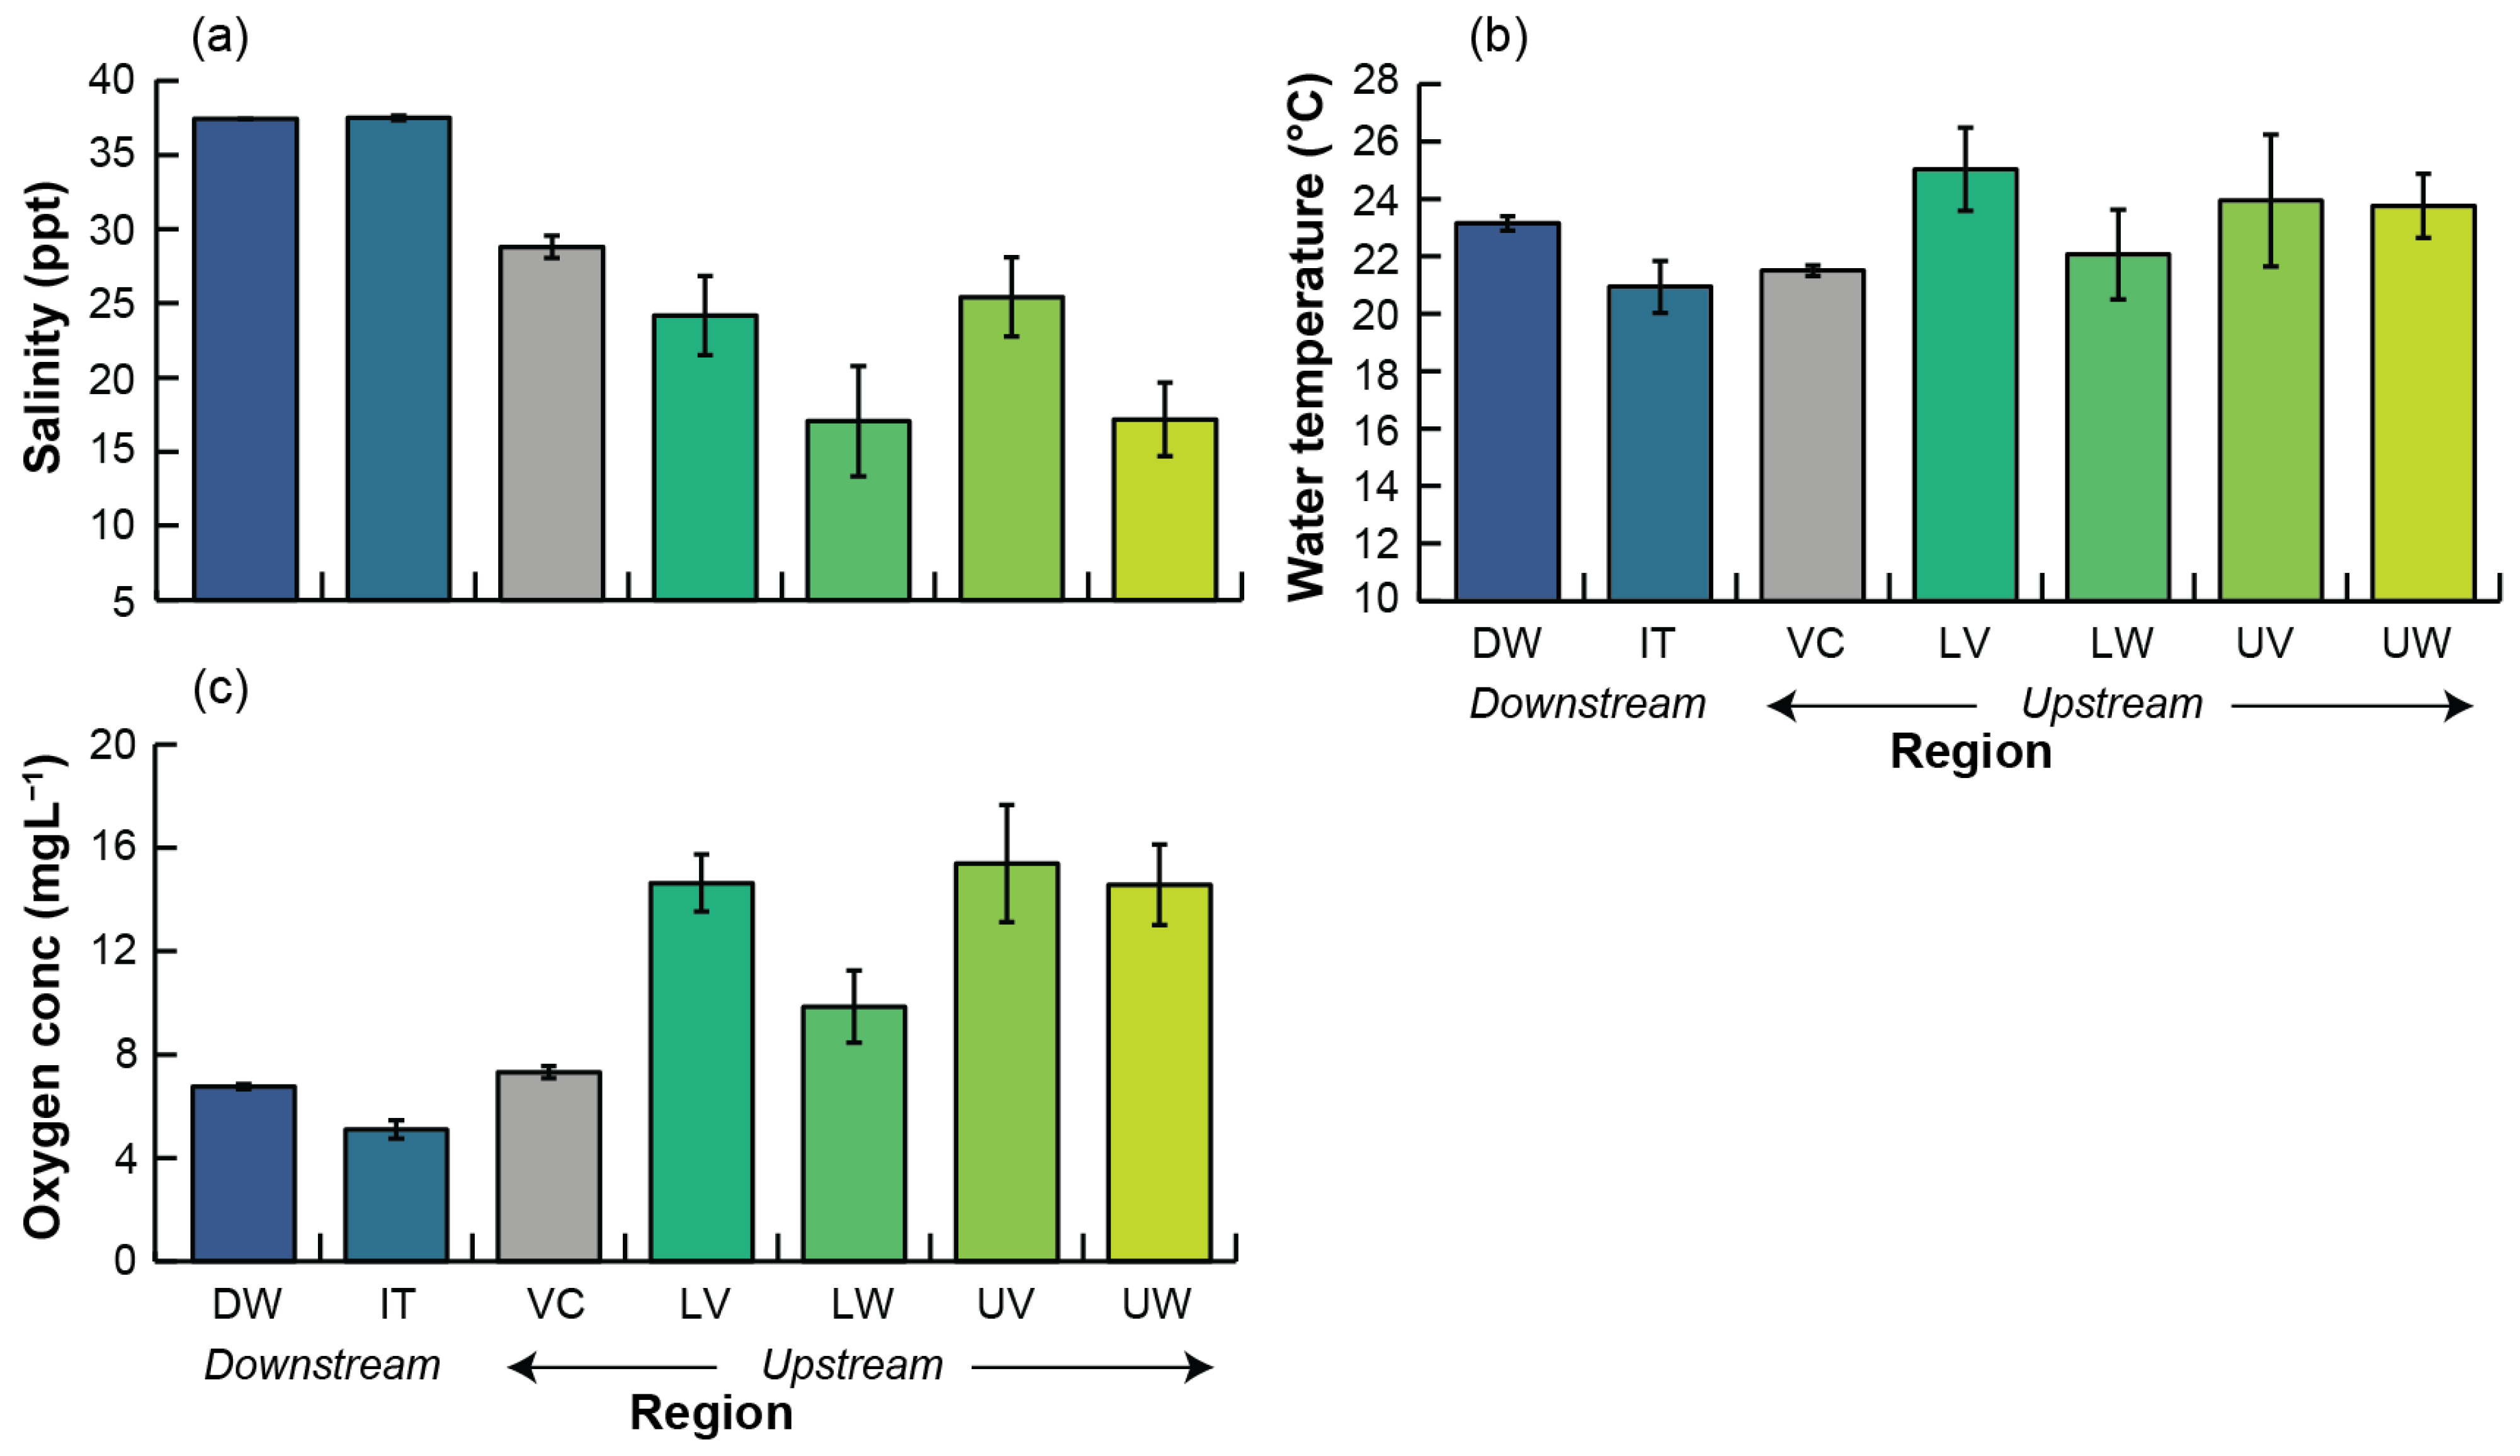
During sampling in March 2017, the sandbar at the mouth of the estuary was open to the ocean and the mean salinity was ~37 ppt in both the Wonnerup Inlet and the Deadwater (Figure 2a). The salinities were lower on the upstream side of the TEBs, i.e., ~29 ppt in the Vasse Channel and 24 and 25 ppt in the Lower and Upper Vasse, while slightly lower values of ~17 ppt were recorded in both regions of the Wonnerup Estuary. The mean water temperature was relatively similar among all regions, ranging from 21 °C in the Wonnerup Inlet and the Vasse Channel to 25 °C in the Lower Vasse (Figure 2b). Due to the shallow water depth and warm air temperature, these values were likely influenced by the time of day that the measurements were recorded. The daytime dissolved oxygen concentrations exceeded 14 mgL−1 in the Upper and Lower Vasse and Upper Wonnerup, likely caused by high levels of phytoplankton, as no macrophytes were present. The oxygen concentrations were lower in the Vasse Channel and regions downstream of the TEBs, i.e., 5–7 mgL−1 (Figure 2c).
Hourly data for oxygen concentration measurements from two loggers in the Vasse Channel between 1 December 2016 and 31 March 2017 (n = 2904) varied substantially from 0.0 to 40 mgL−1. These values underwent a cyclical pattern of change over 24 h, with the average concentrations being highest at 6 pm (i.e., 11.4 and 15.1 mgL−1 at each logger), following a day of sunlight and photosynthesis, and being least at 8 am (~4 mgL−1 at both loggers). Hypoxic conditions (i.e., <2 mgL−1) were recorded in each month, with the duration of such conditions varying markedly. A total of 29 h of hypoxia were recorded in December 2016, reaching a peak of 249 h (>10 days) in January 2017 before declining to 79 and 4.5 h, respectively, in February and March. Although hypoxic conditions were recorded at all hours of the day and night, 50% of hypoxia occurred between 4 and 9 am.
Regular monitoring between 2017 and 2020 showed that, among the regions, the salinities in the Deadwater during summer/autumn were the most stable, ranging from 17 to 43 ppt (median = 38.6 ppt), with most values being slightly greater than seawater (Figure 3). The salinities in the Wonnerup Inlet, which receives water from both TEBs, declined to a minimum of 0.5 ppt but were otherwise relatively similar to those in the Deadwater. Upstream of the TEBs, the salinities were far more variable. The values ranged from ~0 ppt in all regions to 60 and 70 ppt in the Lower Vasse and Lower Wonnerup and to 83 and 97 ppt in the Upper Wonnerup and Upper Vasse, respectively. The distribution of salinity values varied and typically formed two peaks in the Vasse Channel, i.e., ~0–10 and 32–40 ppt. This pattern was less evident in the regions further upstream, with one peak containing salinities of ~0–~10 and the second peak covering a salinity range of 30–50 in the Lower Vasse and Lower Wonnerup and 50–70 ppt in the Upper Vasse and Upper Wonnerup (Figure 3). The water temperatures ranged from 11 to 36 °C across the regions. The average dissolved oxygen concentrations were lower in the Wonnerup Inlet and the Vasse Channel (5 and 7 mgL−1, respectively) than in the other regions (9–13 mgL−1), with a broader range of values recorded upstream of the TEBs. Hypoxic conditions were recorded in 3.8% and 1.5% of the measurements in the Vasse Channel and Lower Wonnerup, never in the Deadwater, and between 0.3 and 0.98% in the remaining regions.

3.2. Faunal Community

A total of 7332 benthic macroinvertebrates were recorded in the Vasse–Wonnerup, comprising 54 taxa representing 5 phyla (Arthropoda, Annelida, Mollusca, Nematoda, and Platyhelminthes) and 29 families (Table A1). Three taxa contributed >70% to the total number of invertebrates, namely the estuarine bivalve Arthritica semen (27%), the freshwater mud snail Potamopyrgus sp. (23%), and the polychaete Capitella ‘capitata’ (species complex, 22%). Most taxa (28) were arthropods, 60% of which were insects (class Hexapoda). The most abundant arthropod was the amphipod Corophium minor (8%), while the most abundant insect group was larvae of the non-biting midge family Chironomidae (4%). The next most specious phylum was the Annelida (14 taxa) and included species from Nereididae (Simplisetia aequisetis), Opheliidae (Armandia intermedia), and Spionidae (e.g., Pseudopolydora kempi). Nine taxa were molluscs, comprising three bivalves and six gastropods.
Of the 42 taxa classified into trait modalities, 22 were grouped as not having a bioturbation effect, 8 as surface modifiers, 6 as bioirrigators, and 1 as a biodiffusor. The remaining five taxa used a combination of bioirrigation and surface modification. In terms of body size, 6 taxa were classified as small (0.5–5 mm), 14 as small to medium, 11 as medium (5–20 mm), 2 as medium to large, and 6 as large (>20 mm). The remaining three taxa exhibited the full size range. The dominant feeding modes were scavenger/opportunist (7 taxa) and combined deposit and filter feeding (7), followed by species that were predators (6) and filter feeders (5). Four taxa were solely deposit feeders, and three were grazers/scrapers of plant material. The remaining 10 taxa used a combination of two or more feeding types. Regarding living habit, 26 of the invertebrate taxa present were classified as free-living/surface crawlers, 5 as burrowers, and 1 as a tube dweller. The 10 remaining taxa used a combination of burrowing and free-living or tube-dwelling habits. Most taxa held a bentho-pelagic sediment position (25 taxa), while 6 taxa occupied deep (>3 cm) sediment depths. Four taxa occupied shallow (top 3 cm) sediment depths. The remaining seven taxa occupied a wider sediment depth profile or occupied surface sediments and held a bentho-pelagic position.

3.3. Taxonomic Composition

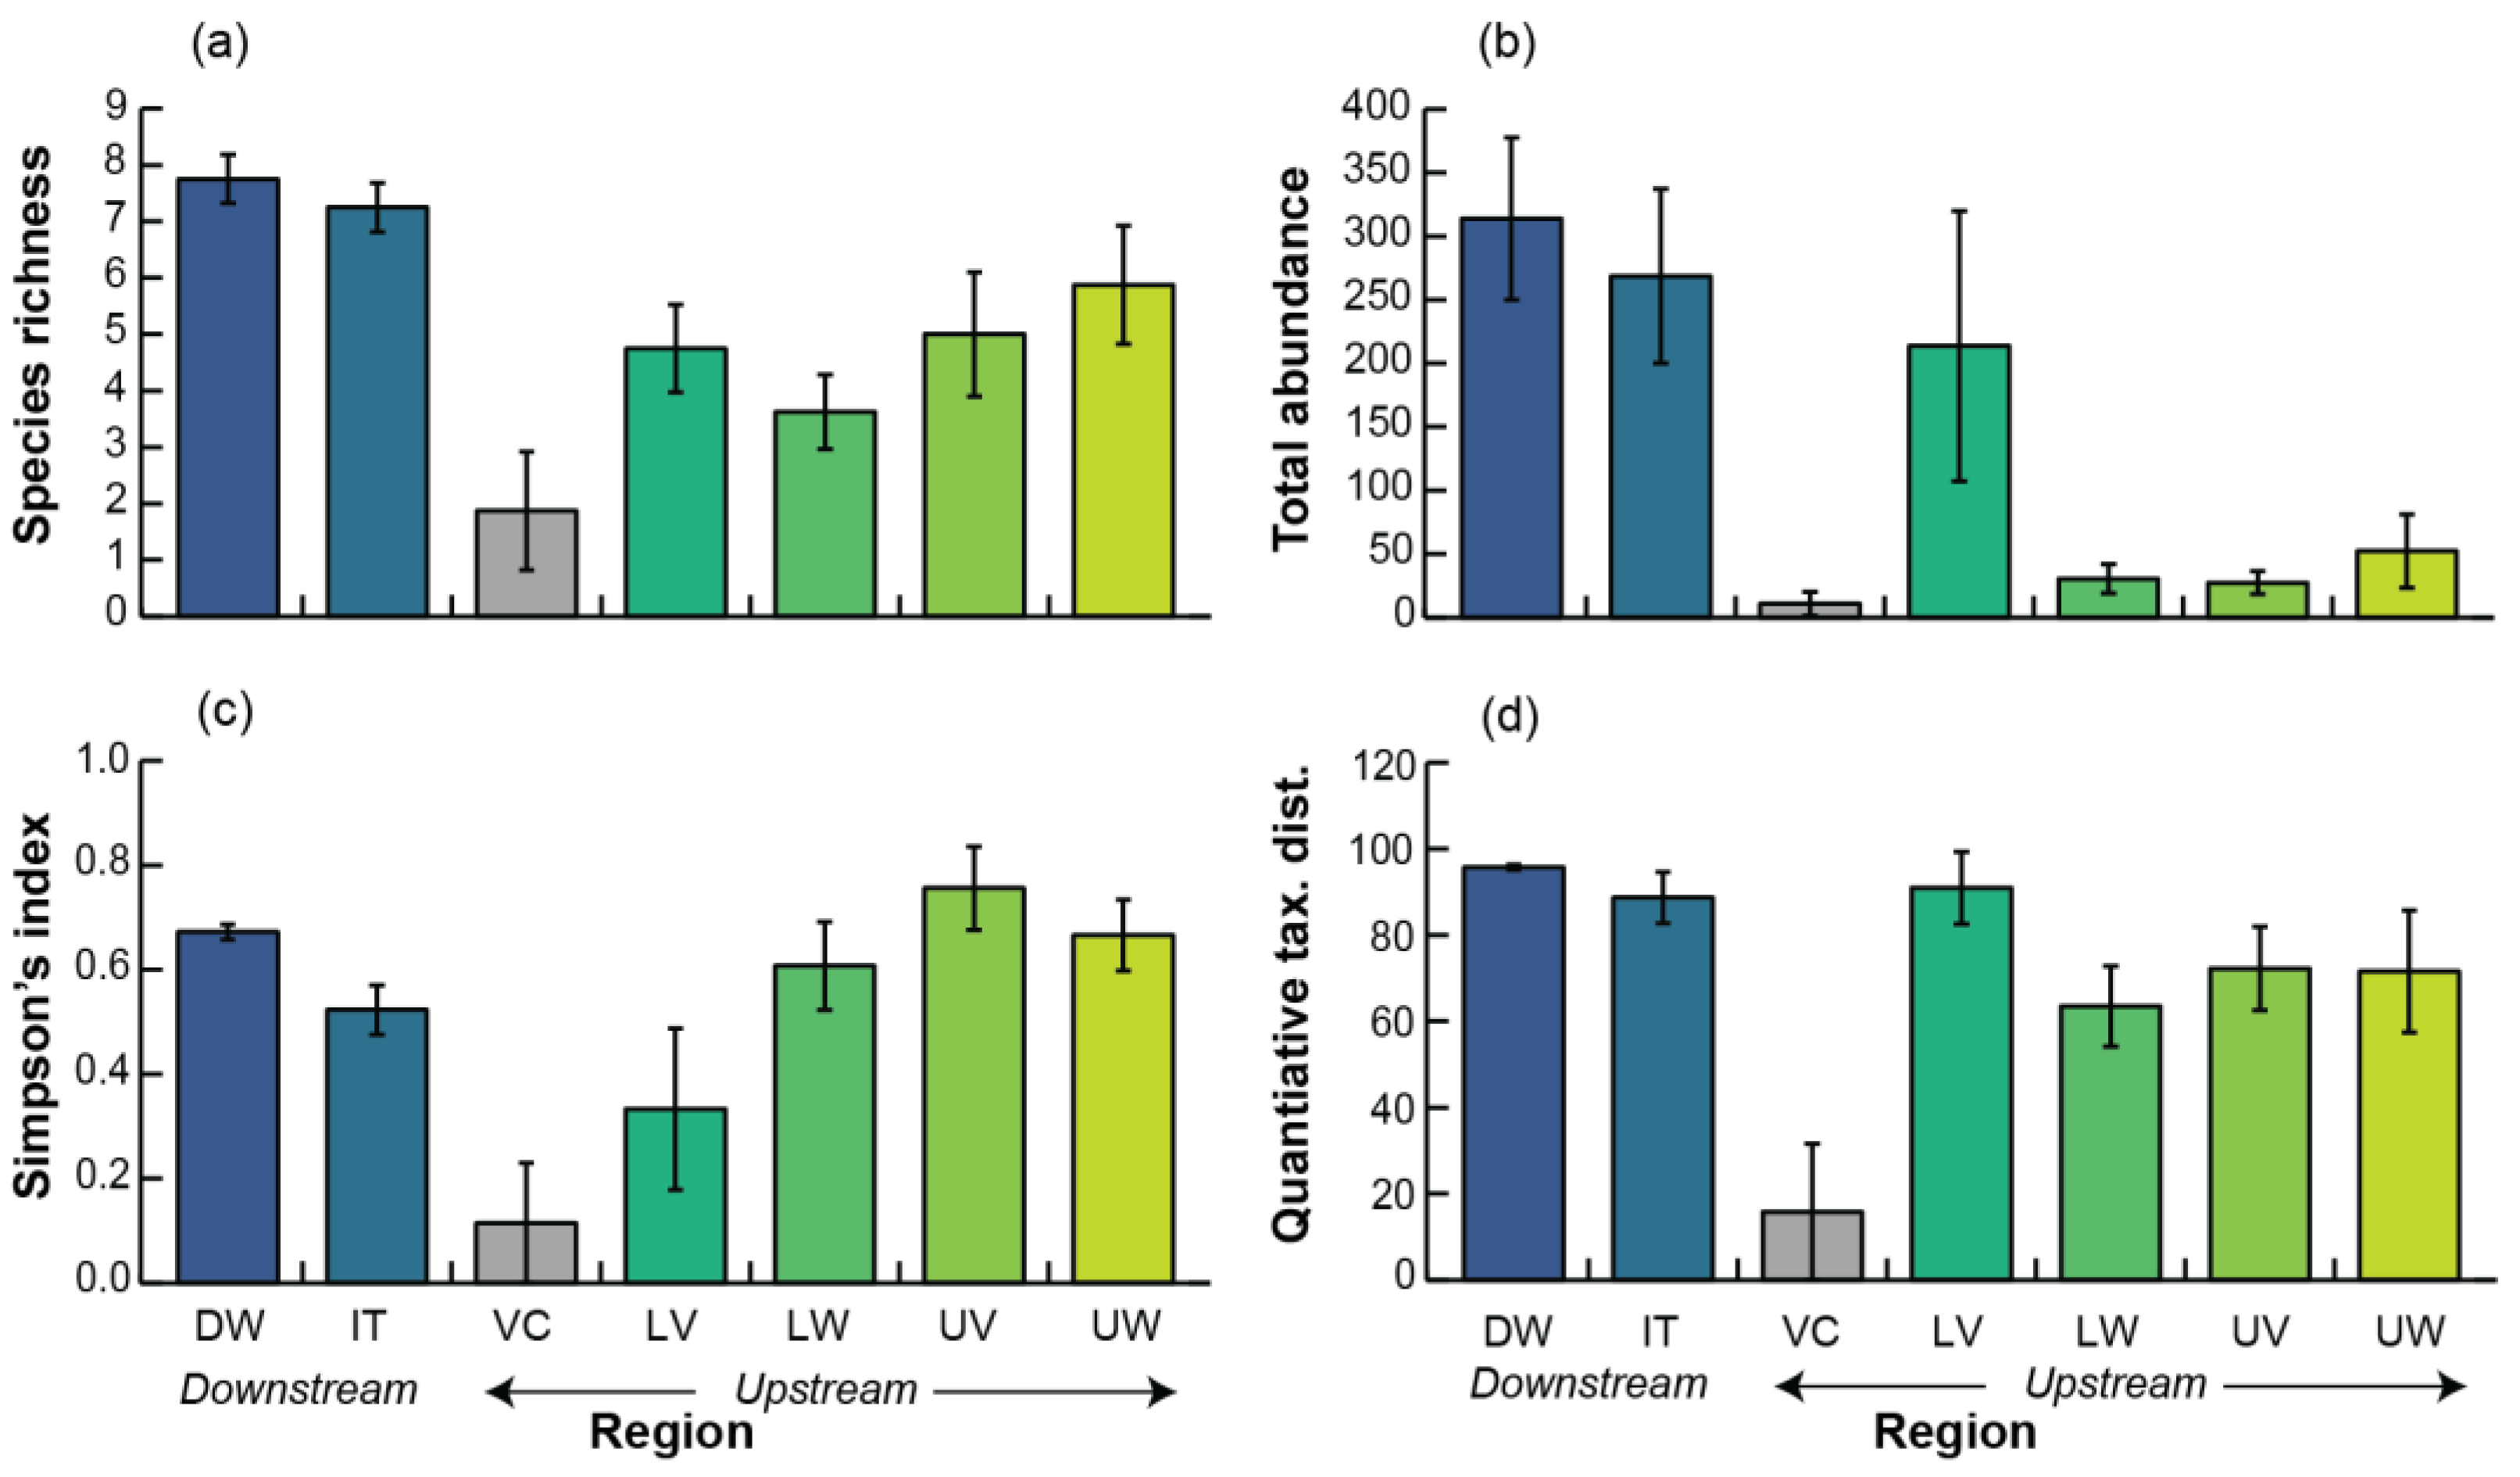
All taxonomic diversity measures differed significantly among regions (Table A2 and Table S2). Species richness was greater in the areas downstream of the TEBs (Wonnerup Inlet and the Deadwater) than in the Lower Wonnerup, Lower Vasse, or the Vasse Channel upstream (Figure 4a). The mean richness ranged from seven to eight species downstream, while only four to five species were found in the lower regions of the Vasse and Wonnerup estuaries and less than two in the Vasse Channel (Figure 4a). Total abundance was also significantly greater downstream of the TEBs (269 and 314 individuals 225 cm−2) than upstream (11–52), except for in the Lower Vasse (214), where large abundances of Potamopyrgus sp. in some samples resulted in a large standard error and no significant difference from the other regions (Figure 4b; Table S2). Significant differences in Simpson’s index occurred when comparing the Upper Vasse, Upper Wonnerup, and Deadwater to the Vasse Channel, which had low values (0.1) compared to those regions (>0.6; Figure 4c). The Wonnerup Inlet also had significantly lower Simpson’s index values (0.5) than the Upper Vasse (0.8) and Deadwater (0.7). Quantitative taxonomic distinctness was consistently high in the Deadwater (96) and was significantly greater than in other regions, except for the Lower Vasse and Wonnerup Inlet (Figure 4d). While values of this index in the Vasse Channel were low on average (16), replicate values ranged from 0 to 63, which meant that it only significantly differed from the Lower Vasse (91) and Wonnerup Inlet (89).
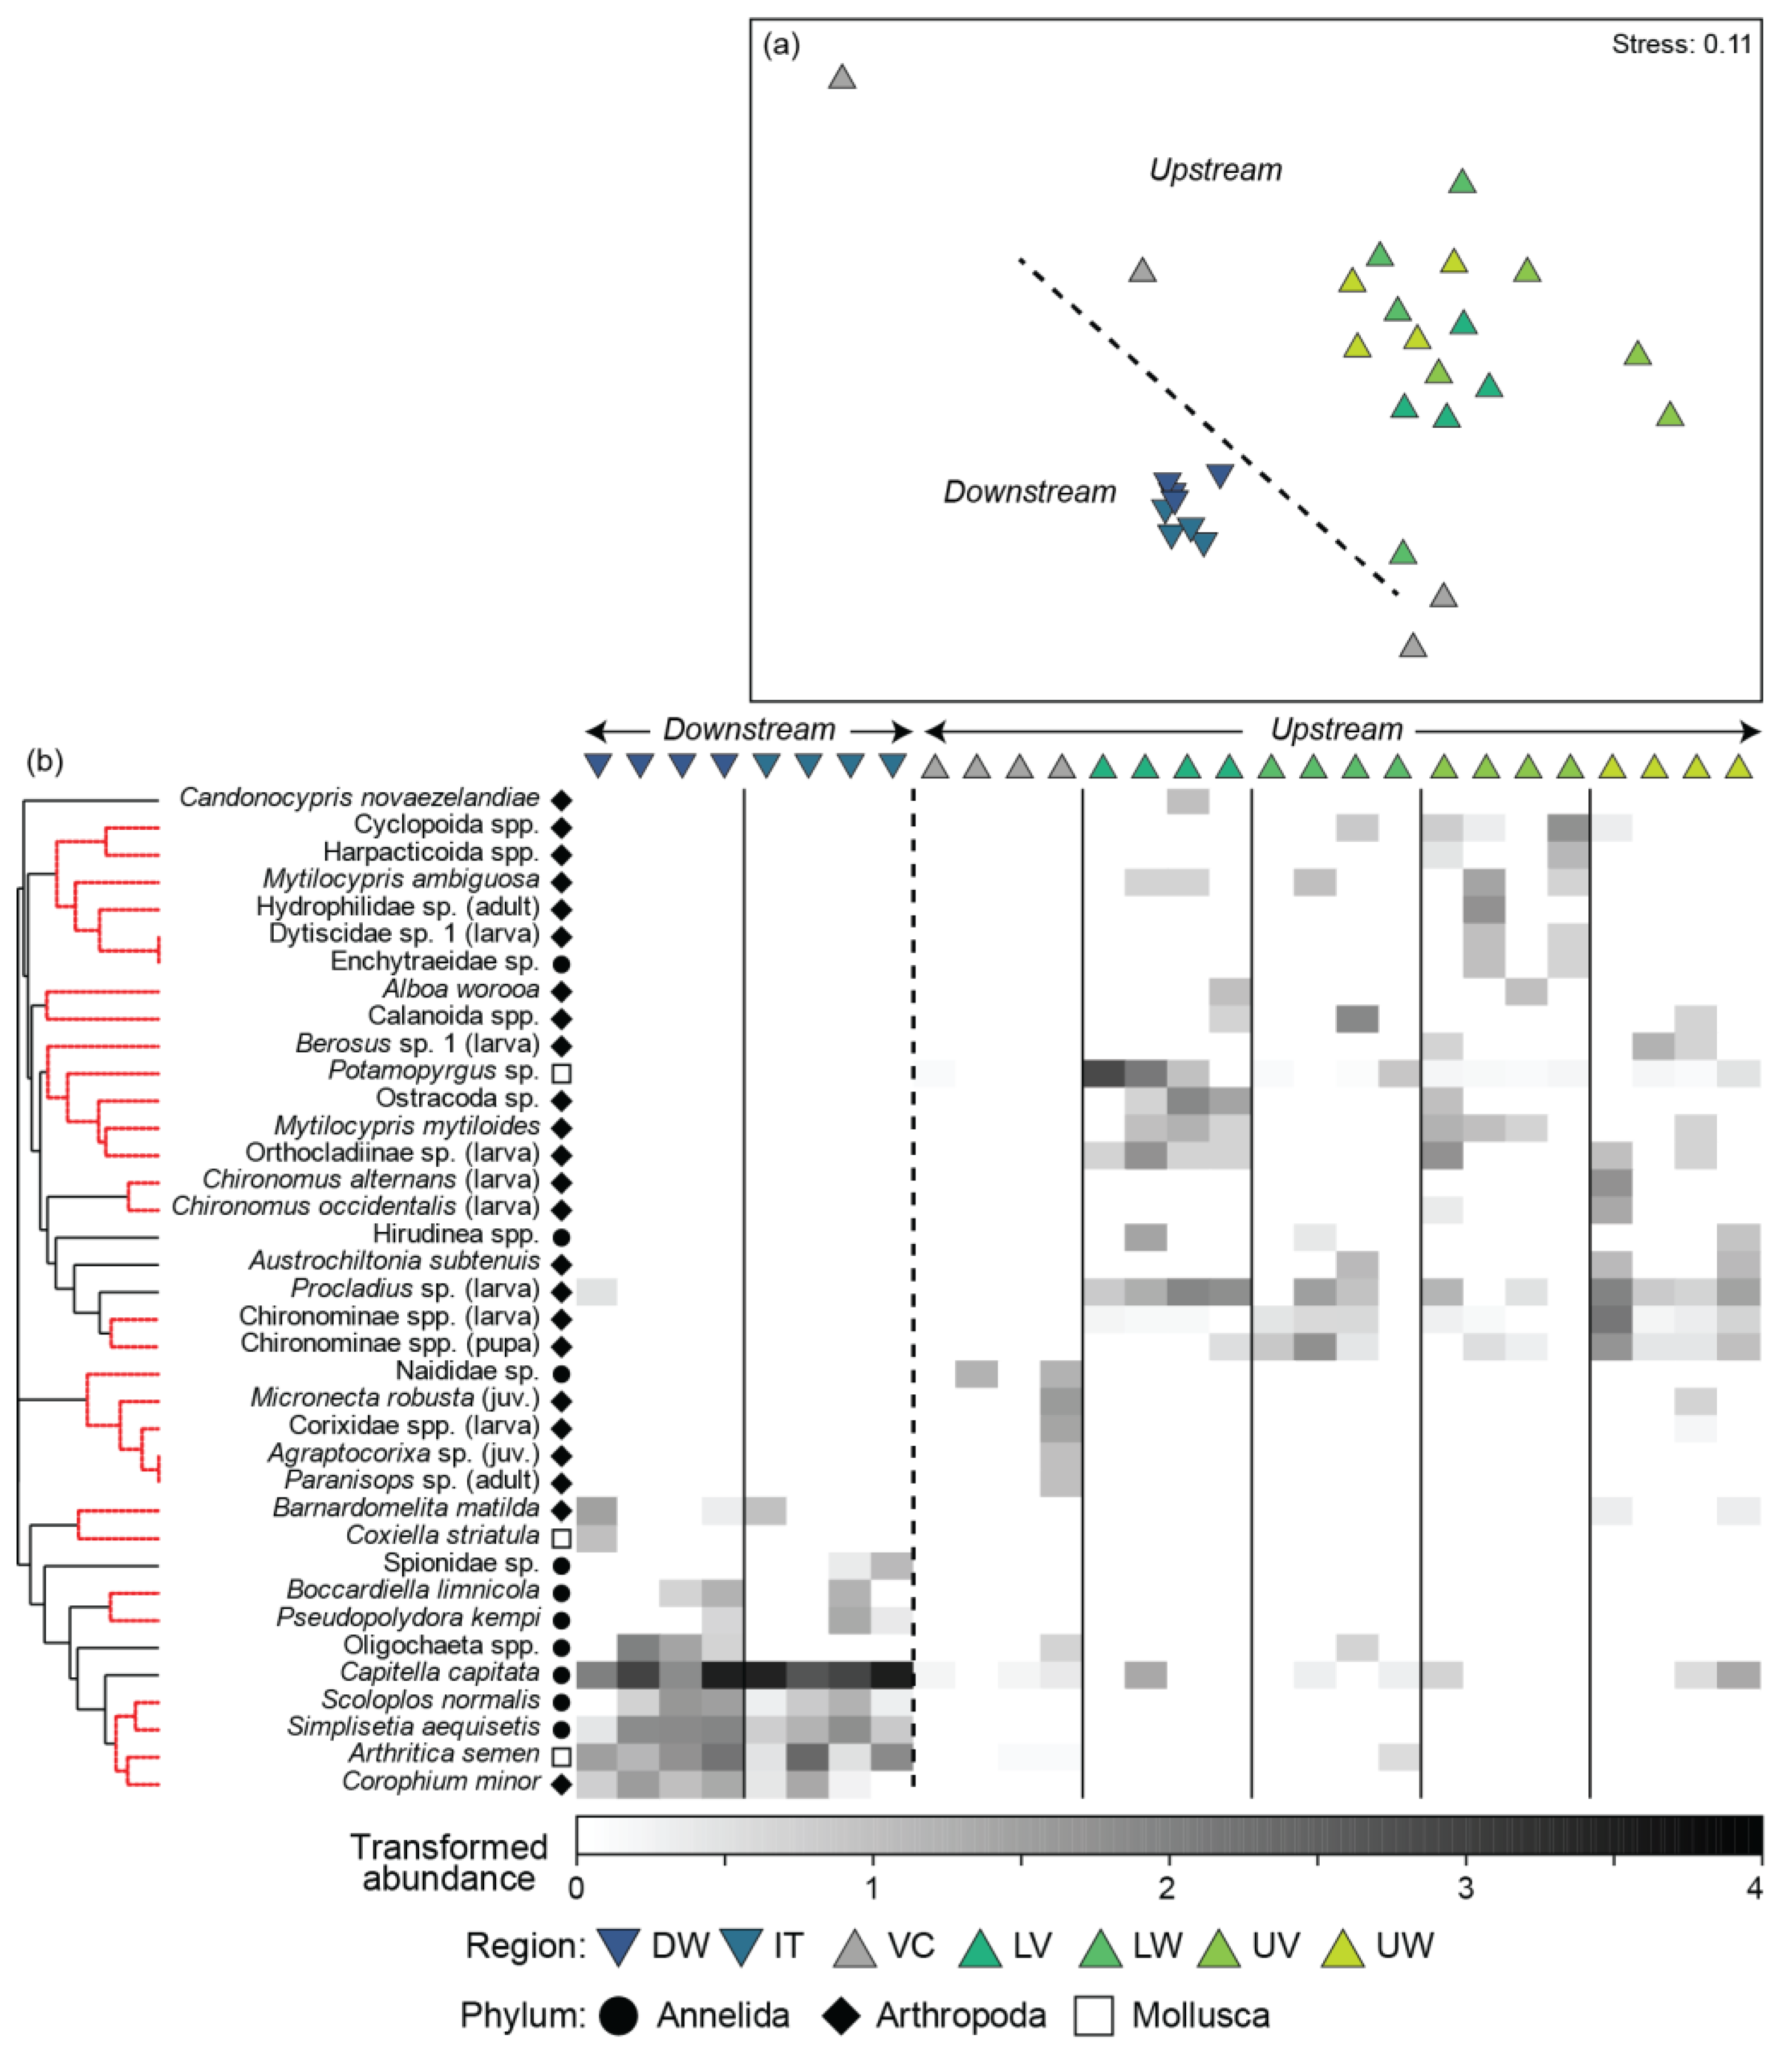
Faunal composition also differed spatially (Table A2), with regions belonging to one of two groups, i.e., downstream and upstream of the TEBs, while the Vasse Channel was an outlier. The greatest significant pairwise comparisons occurred between the regions on either side of the TEBs (t = 2.1–3.4), as well as between the Vasse Channel and all other regions except the Lower Wonnerup (t = 1.6–2.2; Table S2). In contrast, the community composition was typically homogenous in the upper and lower regions of the Wonnerup and Vasse upstream of the TEBs (t = 0.9–1.6) and for the two regions downstream of the TEBs (t = 1.1). There is clear separation of the fauna at sites downstream and upstream of the TEBs on the nMDS plot (Figure 5a).
The sites in the Wonnerup Inlet and the Deadwater form a tight cluster (dispersion = 0.316) on the bottom left of the plot. In contrast, those from the Lower and Upper Vasse and Wonnerup estuaries form a broader cluster (dispersion = 1.140) towards the top right, while those of the Vasse Channel are highly variable and spread between the two clusters (dispersion = 1.402). In terms of their species composition, downstream of the TEBs, infaunal taxa such as the polychaetes C. ‘capitata’, P. kempi, S. aequisetis, and Scoloplos normalis and the bivalves A. semen and Hiatula biradiata dominated (Figure 5b). Sites upstream of the TEBs were typically dominated by epifaunal insects from Chironomidae and Coleoptera, crustaceans such as Austrochiltonia subtenuis and Mytilocypris mytiloides, and the freshwater mud snail Potamopyrgus sp. Few species were recorded in the Vasse Channel, with those that were comprising a mix of the two faunas. For example, low abundances of C. ‘capitata’ and A. semen were recorded at several sites located closest to the TEB, while several insects were recorded at the site nearest to the Lower Vasse (Figure 5b).

3.4. Functional Diversity

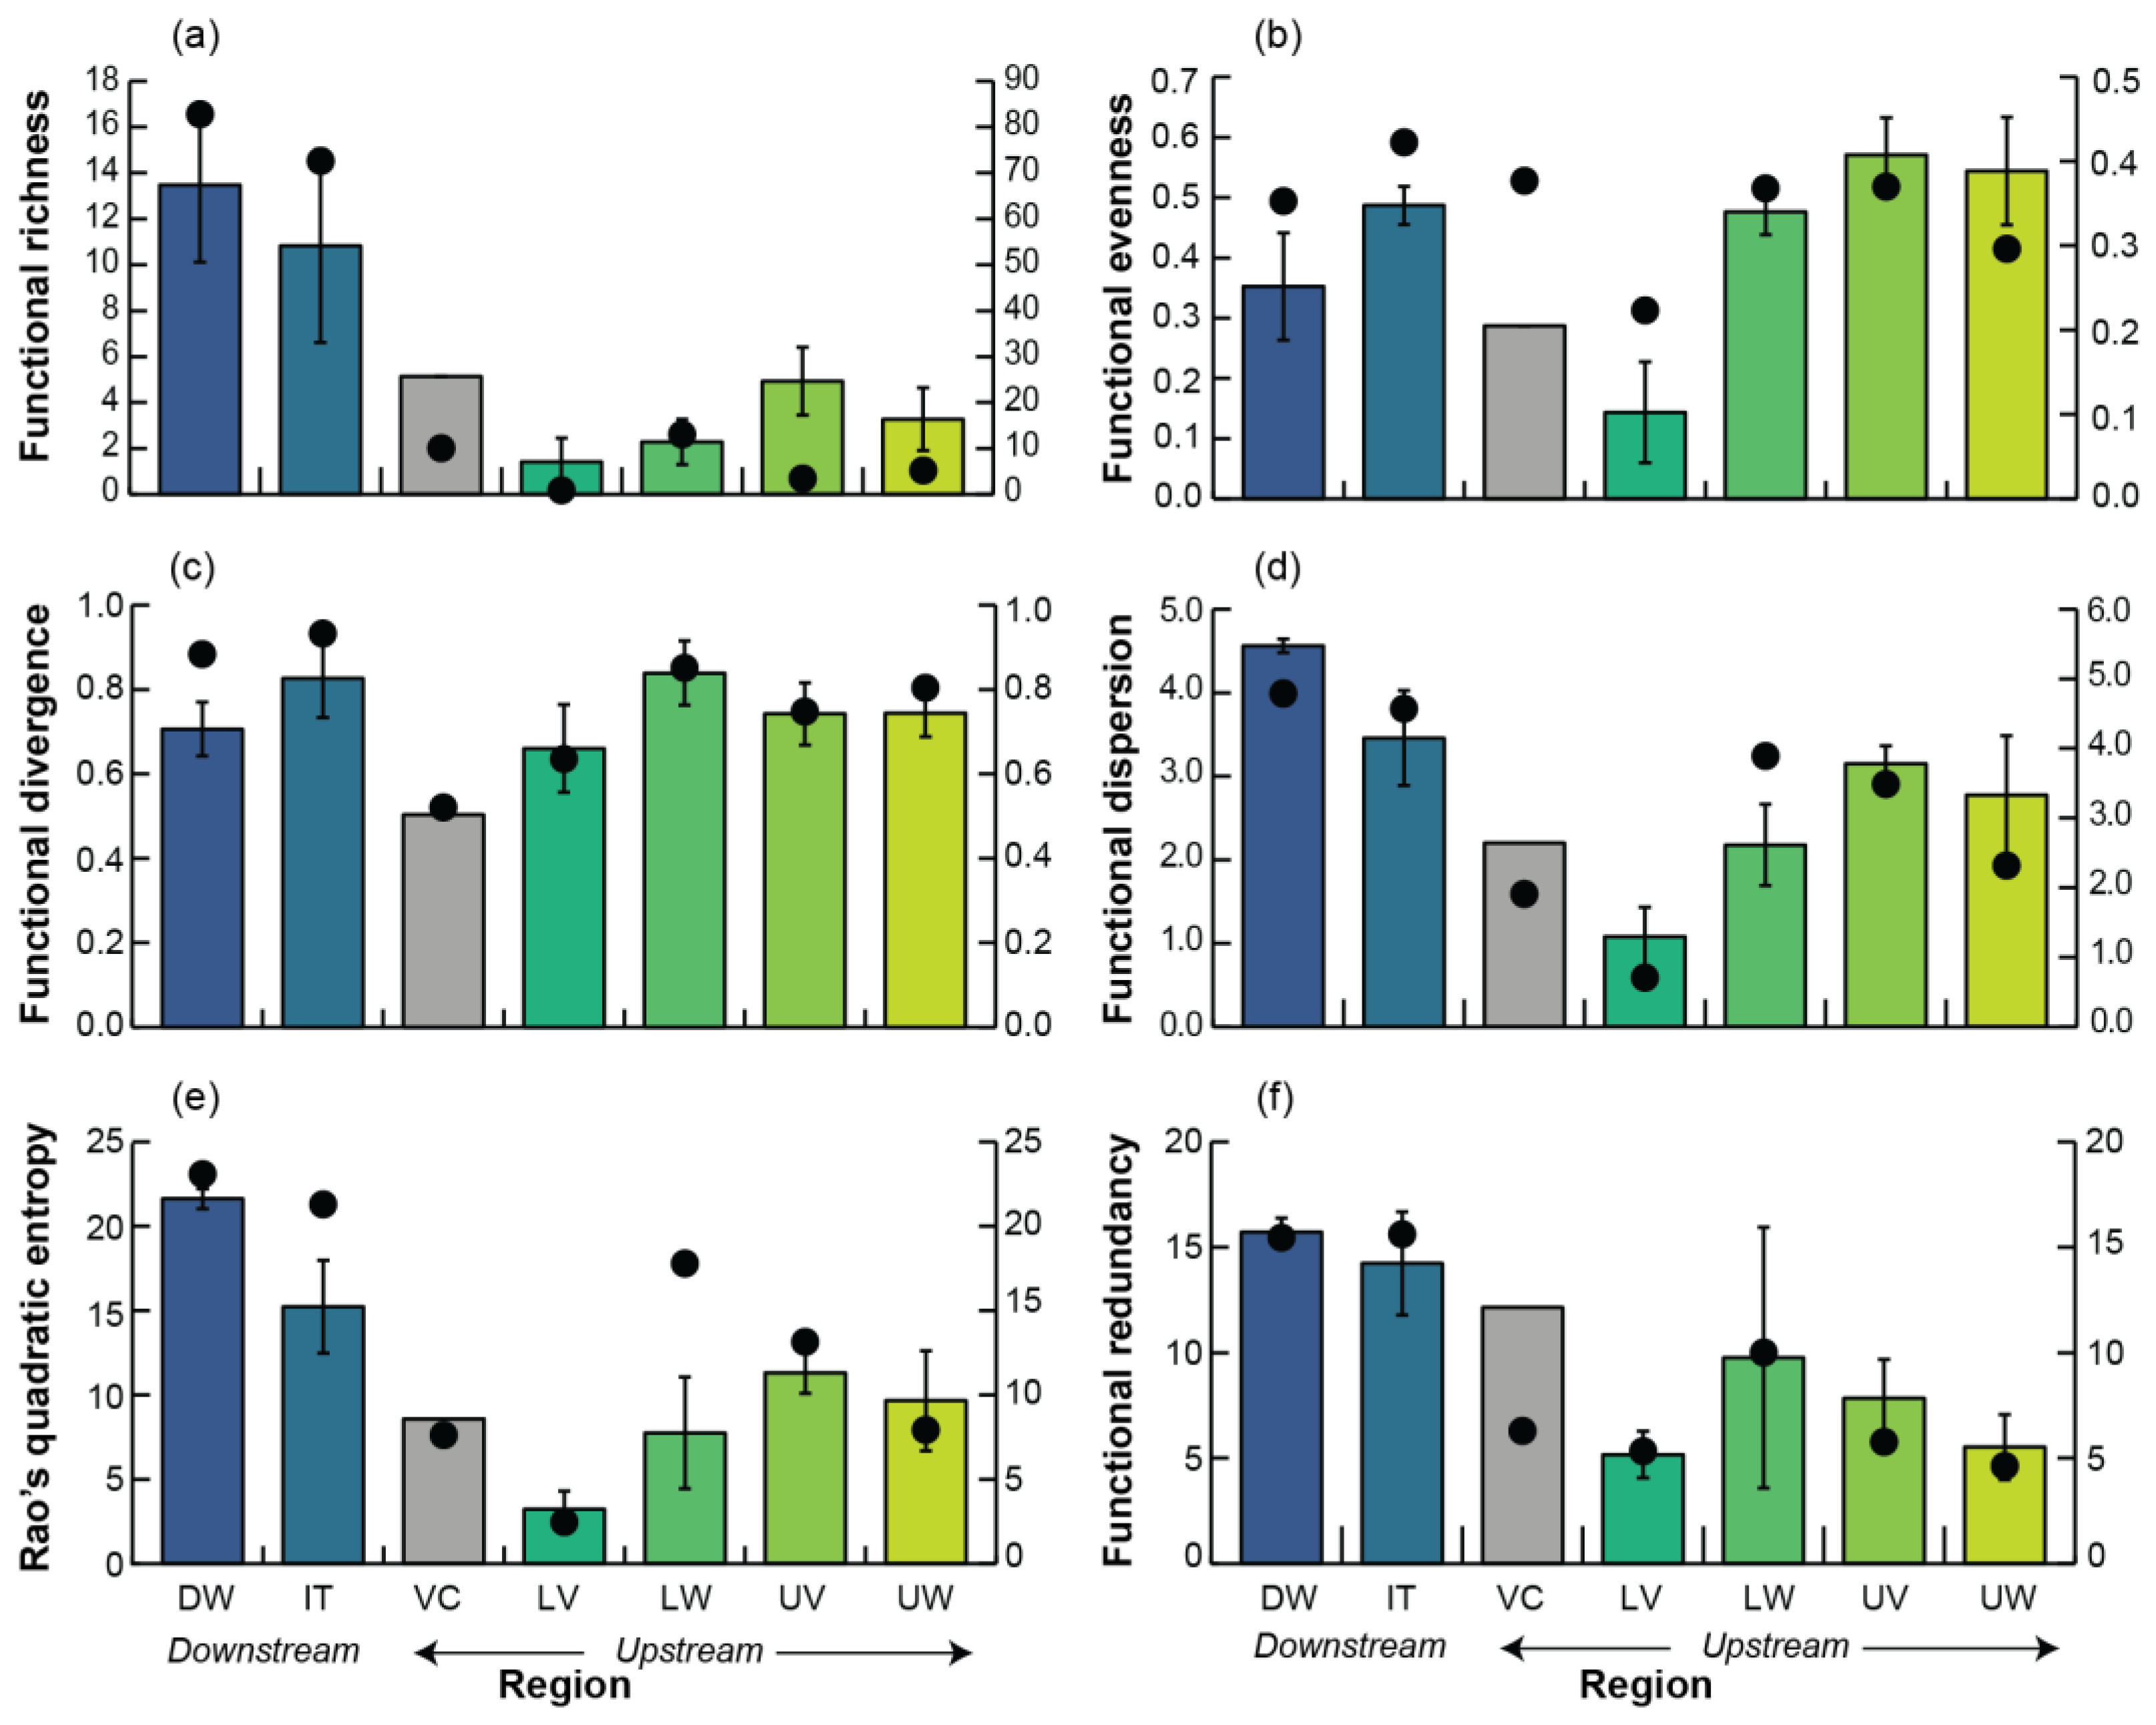
All functional diversity measures, except functional divergence and functional redundancy, differed significantly among regions (Table A2 and Table S2). Functional richness was greater in regions downstream of the TEB (Figure 6a). The mean functional richness was 10.8 and 13.5 in the Wonnerup Inlet and the Deadwater, respectively, which was significantly greater than that in the Lower Vasse and Lower Wonnerup (<2.3) and marginally significant (both p = 0.056) when compared to the Upper Wonnerup (3.2). Functional evenness was relatively consistent across all sites (0.49–0.57), except in the Lower Vasse (0.14) and, to a lesser extent, the Deadwater (0.35). The values of mean functional divergence ranged from 0.71 to 0.83 among regions. The pattern of differences for functional dispersion and Rao’s quadratic entropy were similar among regions and larger downstream of the TEBs (Figure 6d,e). The values for both measures were significantly greater in the Deadwater than in all other regions (except for the Wonnerup Inlet for Rao’s quadratic entropy) and in the Wonnerup Inlet and the Upper Vasse compared to the Lower Vasse. The trends for mean functional redundancy were similar to those for Rao’s quadratic entropy, however, the substantial variability resulted in no significant differences being detected among regions (p = 0.082; Table A2).
The CWMs of trait modalities’ expression differed significantly among regions, with pairwise testing allocating the regions to one of the following two groups: (i) downstream of the TEB, i.e., the Deadwater and Wonnerup Inlet, and (ii) upstream of the TEB, i.e., the Lower and Upper Vasse and Lower and Upper Wonnerup (Table A2 and Table S2). The Vasse Channel was an outlier, but statistically different from the Deadwater and Lower Vasse. This pattern of differences is clearly illustrated on the PCO plot, where sites on each side of the TEBs are separated along the horizontal axis, which explains 77% of the total variation (Figure 7a).
Of the 20 trait modalities, significant differences among regions were detected in 16 (Table S3). Among those relating to bioturbation, the CWMs for biodiffusors, bioirrigators, and no bioturbation differed significantly among regions. On average, biodiffusors and bioirrigators each represented from 36 to 43% of individuals in the two regions downstream of the TEBs, but typically ≤6% in the upstream regions (Figure 7b). The reverse was true for no bioturbation, with none of the individuals in the Wonnerup Inlet and the Deadwater expressing this trait modality, but this value increased to 51% in the Lower Vasse and was from 63 to 87% in the remaining regions. Differences in body size were restricted to the large trait modality, with greater CWM values in the Deadwater and Wonnerup Inlet (18 and 12%, respectively) than in the other regions (all <1%; Figure 7b). This was mainly due to H. biradiata, S. normalis, and S. aequisetis occurring only in the two downstream regions. In all regions, most individuals were either small- (32–96%) or medium-sized (4–67%).
All trait modalities associated with feeding differed among regions, except for predators (Table S2). The Wonnerup Inlet, Deadwater, and Vasse Channel were dominated by deposit feeders (42–46%) and the former two regions also by sub-surface deposit feeders (20 and 13%) and filter/suspension feeders (30 and 40%, respectively). In contrast, grazer/scrapers contributed from 9 to 94% and from 3 to 75% in the Upper and Lower Vasse and Wonnerup (Figure 7b). Omnivores only made a significant contribution (4%) in the Upper Vasse, with taxa expressing this trait absent from the Wonnerup Inlet, Deadwater, and Vasse Channel. The vast majority of invertebrates in the regions upstream of the TEBs were free-living (86–99%) in their living habit, with a bentho-pelagic (85–98%) sediment position. Downstream of the TEBs, invertebrates were predominantly burrowers (75–82%), followed by free-living (16–23%), and tube -welling (2%). The strong benthic living habit of invertebrates in the Wonnerup Inlet and Deadwater was reflected by 64 and 50% having a surface shallow surface position, 35 and 50% having a deeper position, and <1% being bentho-pelagic in both regions, respectively.

3.5. Broader Comparisons

Samples of benthic macroinvertebrate communities from sites in the Toby Inlet (no TEBs) fell between those upstream and downstream of the TEBs in the Vasse–Wonnerup on the nMDS plot (Figure 8a). Thus, there was a gradient from the left to the right of regions of the Vasse–Wonnerup downstream of the TEBs to all regions in the Toby Inlet and finally to regions of the Vasse–Wonnerup upstream of the TEBs. The shade plots showed that the average communities present in the lower, middle, and Deadwater regions of the Toby Inlet were most similar in composition to the regions downstream in the Vasse–Wonnerup due to their shared abundances of polychaetes, bivalves, and malacostracan crustaceans (e.g., amphipods, Figure 8b). Nematodes and flatworms were solely found downstream of the TEBs in the Vasse–Wonnerup. In contrast, communities in the upper region of the Toby Inlet were grouped with upstream regions of the Vasse–Wonnerup due to their similar abundances of hexapods (e.g., Coleoptera and Diptera), copepods, ostracods, and oligochaete worms of the Clitellata class and an absence of bivalves.
The nMDS plot for a broader ecosystem comparison encompassing species richness records at high taxonomic levels from marine, estuarine, and fresh (i.e., wetland) waters showed that communities upstream of the Vasse–Wonnerup TEBs were most similar to those found in wetlands in the Swan Coastal Plain and Warren bioregions (Figure 9a). In contrast, those communities downstream of the TEBs in the Vasse–Wonnerup were similar to those of estuarine and marine environments in southwestern Australia. Again, those in the regions upstream of the TEBs in the Vasse–Wonnerup were most similar to the wetlands due to the high percentages of species of hexapods, ostracods, copepods, and oligochaetes that they hosted (Figure 9b). In contrast, estuarine and marine waters hosted higher percentages of polychaete, malacostracan, and bivalve species while also hosting some pure marine species from the phyla Echinodermata, Nemertea, and Cnidaria.

4. Discussion

Tidal barriers are used in estuaries globally to reduce saltwater intrusion and flooding and to regulate freshwater discharge [10,11]. Disrupting the hydrology of these ecosystems can alter the physicochemical environment and obstruct (or prevent) the movement of animals, leading to the fragmentation of habitats and shifts in faunal composition [14,20]. Rising sea levels, an increased storm frequency, and alterations in freshwater flow due to climate change, combined with an expanding anthropogenic footprint in coastal areas, will result in the increasing use of existing tidal barriers and the construction of new structures [32]. This study aimed to determine how the construction of two TEBs in the Vasse–Wonnerup almost 120 years ago has influenced benthic macroinvertebrate fauna using taxonomic and functional measures of diversity and community composition. Where possible, the findings from this study have been viewed in conjunction with evidence from the broader literature.

4.1. Environmental Conditions

Several authors have stated that the initial construction of the TEBs in 1908 fundamentally changed the Vasse–Wonnerup from an estuarine environment to a fresh-brackish wetland where the shallower upper reaches dry when the river flow is minimal or absent [33]. The subsequent managed flow of seawater through the TEBs to maintain the water levels upstream (−0.1 m AHD) led to periodic hypersalinity [34,35]. In the current study, the sandbar at the mouth of the estuary was artificially breached in late December 2016 and remained open when sampling occurred three months later in late March. The salinity of ~37 ppt in the Wonnerup Inlet and the Deadwater reflects the partial exchange of water in the lower reaches of the estuary with the ocean due to the tidal range of up to 1.2 m and evapoconcentration. The salinities in the regions upstream of the TEBs were lower than those downstream due to high spring rainfall and no managed seawater inflow due to high water levels.
Although normoxic conditions were recorded in the Vasse Channel during sampling, an examination of logger data indicated that this region experienced periodic hypoxia (<2 mgL−1) in the four months examined (from December 2016 to March 2017), and particularly in January, when 249 h of such conditions were recorded. This region of the estuary is known to become hypoxic, which has led to fish kills [23]. Similar conditions have occurred elsewhere, with hypoxic zones present on the upstream side of TEBs in tidal creeks in Canada, but not in areas downstream or in creeks without TEBs [21]. Moreover, the extreme range of oxygen concentrations recorded in the Vasse Channel (i.e., 0–40 mgL−1) has been recorded upstream of TEBs in eastern Australia [66]. These authors also showed that the influx of saline water could increase the mean oxygen concentration and moderate extreme diurnal fluctuations. However, any influxes of saline water need to be carefully controlled to prevent stratification-induced hypoxia [67,68].
Using data derived over the longer term (summer/autumn periods of 2017–2020), the Deadwater underwent the smallest variations in salinity (range = 26; i.e., 17–43 ppt), followed by the Wonnerup Inlet (range = 38; i.e., 2–40 ppt), with the latter region receiving direct freshwater discharge through the TEBs. In contrast, there were greater variations over the same period of 59 and 66 ppt in the Lower Vasse and Lower Wonnerup and 79 and 96 ppt in the Upper Wonnerup and Upper Vasse, respectively. This mirrors data collected throughout the entire year between 1998 and 2000, where the salinities ranged from 4 to 37 and from 0.4 to 37 ppt in the Deadwater and Wonnerup Inlet but from 0.4 to 95 and from 0.3 to 98 ppt in the Vasse and Wonnerup, respectively [34]. These authors also recorded higher maximum water temperatures upstream of the TEBs.
The stable marine salinities of the downstream regions are facilitated by the artificial breaching of the sandbar during summer [36], which largely prevents hypersalinity through tidal exchange, and by the highly seasonal timing of rainfall and inflow [69]. The presence of the TEBs facilitates the retention of freshwater flow upstream, creating a freshwater/brackish environment, which can become markedly hypersaline (up to 132 ppt) due to evaporation during the hot, dry summer climate and the managed inflow of seawater. This situation differs from systems with larger catchments, e.g., the Murray–Darling in South Australia, where TEBs solely prevent the intrusion of seawater and, despite the substantial abstraction of river water, the salinities in Lake Alexandrina and Albert remain relatively fresh, i.e., <1 ppt, throughout the year [70,71].

4.2. Benthic Macroinvertebrate Fauna

4.2.1. Taxonomic Composition

The number of species was greater in regions downstream of the TEBs than those upstream. This pattern fits that recorded in estuaries without barriers [72,73] and the Ramane diagram of an increased richness from oligohaline to polyhaline salinities [74]. Moreover, areas of Elkhorn Slough (United States) that have restricted tidal exchange due to barriers were found to contain lower numbers of invertebrate species [75]. These areas also experienced more variation in salinity than those with greater tidal exchange. Regions upstream of the TEBs in the Vasse–Wonnerup experience extreme variations in salinity, e.g., from ~0 to >100 ppt, and increases in salinity and its variability have been correlated with decreases in the diversity of benthic communities elsewhere [76,77]. Therefore, the richness values in this study, which were recorded during polyhaline conditions, may be greater than those at other times of the year for the regions above the TEBs that experience hypersalinity. Total abundance was also far lower in regions upstream of the TEBs, except in the Lower Vasse. Such changes could reflect several factors, including the hypoxia present in the Vasse Channel (see below), the timing of reproduction in the taxa present, and the presence of large numbers of waterbirds and shorebirds, many of which feed on invertebrates [38]. Greater densities of nematodes were recorded downstream of the TEBs in the Murray River Estuary and Lake Alexandrina in South Australia [31].
The values for Simpson’s index and quantitative taxonomic distinctness were relatively consistent in all regions on both sides of the TEBs, except for the Vasse Channel. This region experienced periodic hypoxia, which can disproportionally affect different species, with crustaceans being particularly sensitive and some molluscs and particularly annelids being more tolerant [78,79]. The main taxa present in this region were a range of oligochaetes and C. ‘capitata’, which are able to thrive in low-oxygen and organic-rich sediments [80], alongside several corixids. The latter group of taxa store gas, which they replenish through contact with the air surface interface [81,82]. The relative dominance of only a small number of tolerant taxa from selected higher taxonomic groups and the absence of a range of other more sensitive taxa, e.g., crustaceans, explain the lower values of all taxonomic diversity measures in this region.
There was a pronounced shift in the faunal composition between the Deadwater and the Wonnerup Inlet downstream of the TEBs and the regions of the Vasse and Wonnerup estuaries upstream. Polychaetes (e.g., C. ‘capitata’, S. aequisetis, and S. normalis), crustaceans (e.g., C. minor), and bivalves (e.g., A. semen) dominated the fauna of the downstream regions, with the higher taxa being characteristic of invertebrate faunas in estuaries globally [83,84] and the key species of those in southern Australia [59,60,61,85]. This is supported by the results of the broader comparison, where the samples for the Deadwater and Wonnerup Inlet were most similar to those from shallow waters of the seasonally open Broke and Wilson inlets (Figure 10). In contrast, the fauna of Lower and Upper Vasse and Wonnerup regions were dominated by numerous larval insects (particularly chironomids), ostracods (e.g., M. mytiloides and M. ambiguosa), and gastropods (e.g., Potamopyrgus sp.). Samples from these regions were most similar to wetlands across the Swan Coastal Plain and Warren bioregions. Davis et al. [86] sampled 41 wetlands in the former bioregion to produce a classification of wetland types based on environmental conditions and faunal composition, one of which was ‘saline wetland’. These wetlands were characterised by a small number of halophilic taxa (e.g., M. mytiloides, Mytilocypris ambiguosa, and Potamopyrgus sp.) and a larger number of salt-tolerant freshwater species, including numerous ostracods (e.g., Candonocypris novaezelandiae and Alboa worooa), chironomids, coleopterans, corixids, and the amphipod A. subtenuis, all of which were abundant in the upstream regions of the Vasse–Wonnerup (Table A1). While few concurrent studies of invertebrate fauna on either side of a TEB have been conducted in the Murray River Estuary, there was a difference in the composition of nematodes, with the fauna on the upstream side comprising freshwater genera and the downstream taxa comprising marine genera that are common in other Australian estuaries [31].
The samples from the Vasse Channel lie in the middle of the two clusters of sites and are widely dispersed, reflecting the depauperate faunal community, likely due to hypoxia. As this region is located immediately upstream of the TEB in the Vasse Estuary, it could be expected to be a ‘buffer zone’ and comprise taxa from the saline wetland assemblage of the other upstream regions and euryhaline estuarine taxa. While some of the latter species have been recorded in a wide range of salinities and could tolerate the variable salinity, many brood their young in pouches or their burrows [87]. The lack of a pelagic larvae phase would limit the upstream spread of estuarine species despite periods of managed seawater inflow.
Comparisons of the differences among regions in the Vasse–Wonnerup with TEBs and the nearby Toby Inlet without TEBs show that, instead of an ecocline where species composition changes sequentially along the salinity gradient, the TEBs act as an ecotone [88]. Similar abrupt changes were observed in the nematode and macroinvertebrate faunas on the upstream and downstream sides of the TEBs in the Murray River Estuary [31,85,89]. The upstream areas of estuaries in South Korea with a barrier were found to harbour a different fauna from those with no barrier, with the barrier leading to the formation of a homogeneous freshwater environment that primarily comprised freshwater taxa [30]. In contrast, in estuaries without barriers, there was a longitudinal salinity gradient and a suite of freshwater and estuarine species.
At the whole-system scale, the benthic macroinvertebrate fauna of the Vasse–Wonnerup is relatively rich compared to other estuaries in southwestern Australia. For example, the 54 taxa (n = 56) recorded in the current study is a value greater than that recorded in seasonally open estuaries, i.e., 43 in the Wilson Inlet (n = 140), 36 in the Broke Inlet (n = 384), and 26 in the Toby Inlet (n = 24), and in all but one study in permanently open estuaries, i.e., 52 and 44 in the Swan–Canning Estuary (both n = 100) and 28 and 63 in the Peel–Harvey Estuary (both n = 100) [58,59,60,61]. Typically, an increased benthic macroinvertebrate species richness in estuaries is related to the extent of connectivity with the ocean, which facilitates the recruitment of marine species [90,91]. In the case of the Vasse–Wonnerup, however, its relatively high richness is due to the inclusion of both estuarine and saline wetland taxa, which are adapted to the unique environmental conditions upstream and downstream of the TEBs. Similarly, in Elkhorn Slough, which comprises a spectrum of tidally restricted habitats behind various water control structures, Ritter et al. [75] found that estuary-wide richness was maximized by having some representation of habitats with minimal tidal exchange, as some species were unique to these areas.

4.2.2. Functional Diversity

As with species richness, the values of functional richness and functional dispersion were greater in regions downstream of the TEBs than those upstream. These results indicate that the species in the assemblages in downstream regions expressed a greater number of traits and utilised a larger component of the niche space, that niche overlap is small, and that resource utilisation efficiency is high [56]. Numerous authors have shown relationships between the number of species and these measures of functional diversity, which are positively linked to ecosystem functioning, while others have identified contrasting patterns in taxonomic and functional biodiversity [37] and references therein. The similar patterns exhibited by these metrics in the current study likely reflect the salinity gradient and extent of environmental variability in the regions upstream and downstream of the TEBs. In both tropical and temperate estuaries, functional diversity is reduced in lower salinities [92,93], mirroring the pattern in the Ramane diagram [74]. In addition, estuaries have long been regarded as environmentally naturally stressed areas because of the high degree of variability in their physicochemical characteristics [94]; however, the extent of the variability in the environmental conditions upstream of TEBs likely represents additional stressors for species [76]. This would limit the number of taxa able to survive [95] and, thus, also the number of traits able to be expressed, lowering functional diversity. Kim et al. [30] also found that functional richness was greater in estuaries without a barrier due to the maintenance of a salinity gradient.
In addition to the species composition differing upstream and downstream of the TEBs, there were marked differences in the expressions of traits. The areas downstream of the TEBs were inhabited by burrowing species that bioturbate, some of which have a large body size. In contrast, upstream of the TEBs, species were free-living and bentho-pelagic, small/medium in body size, and fed mainly by grazing/scavenging. Such differences may reflect the estuarine vs saline wetland composition of the fauna. However, the absence of burrowing species and bioturbators could be due to differences in the characteristics of the sediment [37], with fine organic-rich sediment (including sulfidic black ooze) accumulating on the upstream side of both TEBs from regular inputs of nutrients delivered by freshwater flow [40,96]. The presence of individuals with a large body size downstream reflects a more stable environment that is better suited for longer-lived, specialist species and that many of the insects in the upstream regions are larvae, e.g., chironomids. Finally, the absence of grazers in downstream areas may be due, in part, to the lack of macrophytes and macroalgae such as Ruppia, Stuckenia, and Lamprothamnium [97].

4.3. Impacts of the Tidal Exclusion Barriers to Ecosystem Service Provision

Estuaries provide ecosystem services including water filtration, nutrient storage and cycling, and the provision of nursery and feeding areas. Benthic macroinvertebrates are renowned for enhancing benthic metabolism and nutrient exchange through their bioturbation and bioirrigation behaviours, which manipulate sediment properties and supply oxygen and solutes to sites of microbial activity [98]. The resulting processes, in turn, maintain sediments in a favourable, oxic state with limited production and/or enhanced remediation of harmful toxins (e.g., sulphides) and contribute to nutrient removal via nitrification–denitrification coupling [98,99]. Sediments with bioturbation have been found to undergo more rapid and complete decomposition compared to sediments without bioturbation [100,101]. The magnitude of this effect depends on the sediment chemistry, the mode of bioturbation, and the size of the organism. Biodiffusers move material from deeper layers into the oxic layer and increase the volume of sediment exposed to oxygen, while bioirrigators actively pump their burrows with oxygenated water and provide oxygen or other electron acceptors to otherwise anoxic sediments. Due to the extent of this effect on body size, larger species enhance process rates more than smaller species, and sediments comprising small-bodied invertebrates can, thus, have limited effects on such processes [102].
There was a stark absence of bioturbators and bioirrigators upstream of the TEBs, with most species also being free-living rather than burrowers. Without bioturbation, the rate of organic matter remineralisation is likely low, leading to a faster accumulation of organic matter in the sediments. With more organic matter present, much of it poorly degraded and still fairly labile, oxygen is consumed faster and the likelihood of oxygen depletion extending into the water column under stratification or stagnant flow conditions increases. Thus, the lack of bioturbators likely contributes to the occurrence of low dissolved oxygen in the water column upstream of the TEBs. Water quality is impacted further, as the rates of denitrification and anaerobic ammonium oxidation have been found to be from 100 to 400% higher in bioturbated sediments [103,104]. These reactions provide important ecosystem services that ameliorate the effects of eutrophication. Most nutrients in the Vasse–Wonnerup are in the form of dissolved organic nitrogen (DON), which, once broken down by microbes into readily available inorganic forms (e.g., ammonium), is likely rapidly utilized by nuisance algae and macrophytes, leading to the further accumulation of DON and organic carbon [96], contributing to ever-worsening water and sediment conditions. The presence of burrowing macroinvertebrates may assist in reducing the pool of organic nitrogen present by establishing a nitrification–denitrification pathway at the sediment–water interface, which could remove a proportion of the nitrogen as N2 gas.
The nutrient-rich, sheltered waters of estuaries are utilised by species for their entire life cycle and by the juveniles of marine species as nursery areas, many of which are important for recreational and commercial fisheries. Surveys of the fish fauna in the shallow waters around the margin of the Vasse–Wonnerup and in the deeper waters have shown that there is a sequential decline in species richness and abundance of fish along the longitudinal axis of the system [36,105]. This likely reflects the increased variability in the water depth and salinity in the upstream areas, which are less suited to some species. Moreover, as with barriers elsewhere [14], the presence of the TEBs in the Vasse–Wonnerup can inhibit the movement of fish, as there is no connection at times, and, even when open, fish only move through under a particular set of hydrological conditions [23,28]. The Vasse–Wonnerup is Ramsar-listed on the basis that it regularly supports over 20,000 waterbirds and ≥1% of the global population of several species, including the Black-winged Stilt and Red-necked Avocet [38]. The numbers of waterbirds and migratory shorebirds have consistently been several orders of magnitude higher in regions upstream of the TEBs than those downstream [38,97]. These species have high energy requirements and many feed on benthic macroinvertebrates [39]. However, they are only able to forage effectively in a narrow range of water depths based on their bill and leg length [106,107], and their foraging efficiency increases as receding waters concentrate prey [108]. As such, the wider, shallow expanses of the Vasse and Wonnerup estuaries provide a more advantageous feeding habitat, particularly for migratory species that need to rapidly improve their body condition, which directly influences migration survival rates and subsequent breeding success [109].

4.4. Limitations

It should be noted that this study was based on a single sampling occasion, and, thus, the trends may vary during times when the physicochemical conditions are different, for example, when the salinities upstream of the TEBs are oligohaline or hypersaline. Surveys conducted for other purposes have shown that the fauna upstream of the TEBs does comprise a similar suite of wetland species over a broader range of salinities [97,110]. However, Lam-Gordillo et al. [37] did detect temporal differences in functional diversity metrics, with a greater expression of traits in summer than in winter. Thus, it is unclear how the presence of oligohaline or hypersaline conditions would influence the results. For example, lower salinities may allow for the survival of less salt-tolerant freshwater species present in adjacent wetlands and the river that flows into the Vasse–Wonnerup. Conversely, extreme hypersaline conditions typically result in a reduced species richness and homogenisation of the faunal assemblage [111].
The assignment of taxa to trait modalities assumed that all insects had no effect on bioturbation. This was based on the current assignment of insects in the SAMT database and a lack of bioturbation modalities being provided in multiple freshwater trait databases [50,51,52]. In reality, it is likely that larvae of some freshwater insects produce physical effects on the sediment matrix and, thus, influence ecosystem function. For example, bioirrigating mayfly larvae inhabit U-shaped burrows and can increase sediment oxygen penetration and influence nutrient flux rates [112] and non-biting midge larvae can also affect the oxidation of metals and their release into the water column [113]. The current SAMT assignment of insects as having ‘no bioturbation’ likely stems from a comparative approach, where the physical mixing impacts of small insect larvae are dwarfed to negligible amounts when compared to larger, estuarine bivalves or polychaetes. Indeed, some studies show no such functional effect of chironomid larvae, e.g., [114], which highlights the idiosyncrasy of species impacts on functional processes in different scenarios. As a result, this study may have over-estimated the functional differences above and below the TEBs in relation to bioturbation. It would thus be beneficial to update, expand, and integrate current trait databases to facilitate future research aiming to compare ecosystem function across multiple ecosystem types.

5. Conclusions

As the management of TEBs is a contentious issue [115] and the initial installation in the Vasse–Wonnerup was conducted almost 120 years ago, the purpose of this study was to understand how the TEBs have influenced invertebrate fauna rather than to provide management recommendations. The TEBs were found to act as an ecotone, separating a speciose and functionally rich estuarine faunal assemblage downstream from that of a more depauperate saline wetland assemblage upstream. The composition of the faunas is influenced by the relatively stable marine-like environment downstream and the highly variable oligohaline to hypersaline conditions upstream (Figure 10). The fragmentation of the estuarine gradient into two distinct components has likely impacted the provision of ecosystem services, with the species downstream mainly comprising burrowing species that bioturbate and, thus, aid in nutrient cycling, whereas the shallow waters, seagrass and epifaunal assemblages upstream provide nutrition for birds but are lower in species richness and functional diversity, providing limited bioturbation to help ameliorate the impact of eutrophication. These results may help in understanding the impacts of the construction of new barriers in response to climate change.

Supplementary Materials

The following supporting information can be downloaded at: www.mdpi.com/article/10.3390/jmse13040635/s1, Table S1. Trait modality scores for each of the 42 taxa that were able to be identified to a sufficient taxonomic level to be reliably assigned to functional guilds. Table S2. PERMANOVA test results for differences in the community-level weighted means of trait values among regions. Table S3. PERMANOVA test results for differences in the community-level weighted means of trait values among regions. Table S4. PERMANOVA test results for differences in the community-level weighted means of trait values among regions.

Author Contributions

Conceptualization, J.R.T., L.H.K., and K.L.; data curation, S.C.-O., J.R.T., and L.H.K.; formal analysis, S.C.-O., J.R.T., and A.C.; funding acquisition, J.R.T., K.L.; investigation, S.C.-O., L.H.K., and J.R.T.; methodology, J.R.T.; K.L.; project administration, J.R.T., L.H.K., and K.L.; visualization, J.R.T.; writing—original draft preparation, all authors; writing—review and editing, all authors. All authors have read and agreed to the published version of the manuscript.

Funding

This research was funded by the Department of Water and Environmental Regulation as part of the Revitalising Geographe Waterways program and Murdoch University.

Data Availability Statement

The environmental data used in this study were derived from https://wir.water.wa.gov.au/ (accessed on 7 February 2025) and the faunal data presented in this study are available on request from the corresponding author.

Acknowledgments

The authors acknowledge the Noongar people as the Traditional Custodians of the land on which this research took place and pay their respects to Elders past, present, and emerging. We greatly appreciate the field sampling carried out by Kurt Krispyn, Lachie Ramm, and Jason Crisp. This research was conducted under a Department of Primary Industries and Regional Development research exemption 2772. Images in Figure 10 from provided by the Integration and Application Network (https://ian.umces.edu/media-library/; accessed on 7 February 2025) under Attribution-ShareAlike 4.0 International (CC BY-SA 4.0).

Conflicts of Interest

Linda H. Kalnejais and Kath Lynch are employed by the funder and provided input into the interpretation of the water quality data and the writing of the manuscript. The other authors declare no conflicts of interest.

Appendix A

Table A1. Mean density (individuals 225 cm−2) of each taxon in each region of the Vasse–Wonnerup. Averages for the regions downstream (down) and upstream (up) of the tidal exclusion barriers and for the entire system (overall) are also provided. Taxa ranked by overall abundance. The phylum (P) to which each taxon belongs is also given. M = Mollusca; An = Annelida; Ar = Arthropoda; N = Nemertea; and Pl = Platyhelminthes.
TaxonPOverallDWITDownVCLVLWUVUWUp
Arthritica semenM35.64134.75110.88122.810.25 3.63 0.78
Potamopyrgus sp.M30.50 0.25195.5011.881.754.1342.70
Capitella ‘capitata’ (species complex)An28.1676.50107.3891.940.635.000.501.255.882.65
Corophium minorAr10.8655.7520.2538.00
Simplisetia aequisetisAn6.5529.3816.5022.94
Chironominae spp. (larva)Ar4.61 0.504.630.5026.636.45
Chironominae spp. (pupa)Ar1.73 0.385.500.505.752.43
Procladius sp. (larva)Ar1.660.13 0.06 5.001.750.883.882.30
Scoloplos normalisAn1.617.883.385.63
Harpacticoida spp.Ar1.07 7.50 1.50
Corixidae spp. (larva)Ar1.04 7.13 0.131.45
Cyclopoida spp.Ar0.80 0.884.630.131.13
Hydrochus sp. (adult)Ar0.79 5.50 1.10
Hirudinea spp.An0.70 3.250.25 1.380.98
Barnardomelita matildaAr0.643.001.252.13 0.250.05
Hiatula biradiataM0.431.631.381.50
Nereididae sp.An0.411.251.631.44
Spionidae sp.An0.36 2.501.25
Orthocladiinae sp. (larva)Ar0.32 1.13 0.750.380.45
Pseudopolydora kempiAn0.300.381.751.06
Chironomus occidentalis (larva)Ar0.27 0.131.750.38
Oligochaeta spp.An0.271.63 0.810.13 0.13 0.05
Ostracoda sp.Ar0.25 1.50 0.25 0.35
Mytilocypris mytiloidesAr0.23 0.75 0.750.130.33
Agraptocorixa sp. (juv.)Ar0.16 1.13 0.23
Calanoida spp.Ar0.16 0.130.88 0.130.23
Mytilocypris ambiguosaAr0.16 0.250.250.63 0.23
Boccardiella limnicolaAn0.130.500.380.44
Bivalvia sp.M0.110.500.250.38
Chironomus alternans (larva)Ar0.11 0.750.15
Hydrophilidae sp. (adult)Ar0.11 0.75 0.15
Micronecta robusta (juv.)Ar0.11 0.63 0.130.15
Berosus sp. (larva)Ar0.09 0.130.500.13
Armandia intermediaAn0.050.130.250.19
Austrochiltonia subtenuisAr0.05 0.13 0.250.08
Dytiscidae sp. 1 (larva)Ar0.05 0.38 0.08
Enchytraeidae sp.An0.05 0.38 0.08
Alboa worooaAr0.04 0.13 0.13 0.05
Gastropoda sp. 2M0.040.130.130.13
Hydrophilidae sp. 2 (larva)Ar0.04 0.25 0.05
Megaporus sp. (larva)Ar0.04 0.25 0.05
Naididae sp.An0.04 0.25 0.05
Candonocypris novaezelandiaeAr0.02 0.13 0.03
Ceratopogonidae sp. (larva)Ar0.02 0.130.03
Coxiella striatulaM0.020.13 0.06
Desdemona ornataAn0.02 0.130.06
Gastropoda sp. 1M0.02 0.130.06
Gastropoda sp. 3M0.02 0.130.06
Mysida sp.Ar0.020.13 0.06
Nematoda spp.N0.02 0.130.06
Paranisops sp. (adult)Ar0.02 0.13 0.03
Planorbidae sp.M0.02 0.130.06
Platyhelminthes sp.Pl0.02 0.130.06
Polychaeta sp.An0.02 0.130.06
Number of taxa 5417212591312201834
Total number of individuals 130.93313.75268.75291.2510.50213.6330.3827.2552.2566.80
Figure A1. (a) Map of the Vasse–Wonnerup showing the tidal exclusion barriers on the Wonnerup (WTEB) and Vasse (VTEB) estuaries. Photographs (bd) show one or both barriers and parts of the two estuaries, Deadwater and Wonnerup Inlet. (e) Conceptual model of the components of the barriers during a period of high freshwater flow as occurs in winter/spring and (f) photograph of the VTEB in August. (g) Conceptual model of the components of the barriers during a period of low freshwater flow as occurs in autumn/spring. (h,i) Photograph of the WTEB in March and (j) of the fish gate in the VTEB. Photographs taken by James Tweedley, Kurt Krispyn, Sorcha Cronin-O’Reilly, and the Department of Water and Environmental Regulation.
Jmse 13 00635 g0a1
Table A2. PERMANOVA test results for taxonomic and functional diversity measures and species composition among regions of the Vasse–Wonnerup. Significant differences (p < 0.05) in bold.
MetricsTermd.f.Mean SquaresPseudo-Fp
Species richnessRegion616.66.040.004
Residual212.8
Total abundanceRegion64.48.050.001
Residual210.5
Simpson’s indexRegion60.26.190.002
Residual210.0
Quantitative taxonomic distinctnessRegion62952.27.030.006
Residual21419.8
Functional richnessRegion53.684.890.007
Residual182.8
Functional evennessRegion50.84.740.009
Residual180.2
Functional divergenceRegion50.20.800.555
Residual180.2
Functional dispersionRegion55.66.750.002
Residual180.8
Rao’s quadratic entropyRegion5161.88.02<0.001
Residual1820.2
Functional redundancyRegion578.42.280.082
Residual1834.3
Community-level weighted meansRegion64715.28.82<0.001
Residual21534.9
Species compositionRegion68961.63.780.001
Residual212368.7

References

  1. McLusky, D.S.; Elliott, M. The Estuarine Ecosystem: Ecology, Threats and Management, 3rd ed.; Oxford University Press: Oxford, UK, 2004. [Google Scholar]
  2. Tweedley, J.R.; Warwick, R.M.; Potter, I.C. The contrasting ecology of temperate macrotidal and microtidal estuaries. Oceanogr. Mar. Biol. Annu. Rev. 2016, 54, 73–172. [Google Scholar] [CrossRef]
  3. Sheaves, M.; Baker, R.; Nagelkerken, I.; Connolly, R.M. True value of estuarine and coastal nurseries for fish: Incorporating complexity and dynamics. Estuaries Coasts 2015, 38, 401–414. [Google Scholar]
  4. Barbier, E.B.; Hacker, S.D.; Kennedy, C.; Koch, E.W.; Stier, A.C.; Silliman, B.R. The value of estuarine and coastal ecosystem services. Ecol. Monogr. 2010, 81, 169–193. [Google Scholar] [CrossRef]
  5. Pennifold, M.; Davis, J. Macrofauna and nutrient cycling in the Swan River Estuary, Western Australia: Experimental results. Hydrol. Process. 2001, 15, 2537–2553. [Google Scholar] [CrossRef]
  6. Potter, I.C.; Warwick, R.M.; Hall, N.G.; Tweedley, J.R. The physico-chemical characteristics, biota and fisheries of estuaries. In Freshwater Fisheries Ecology; Craig, J., Ed.; Wiley-Blackwell: Chichester, UK, 2015; pp. 48–79. [Google Scholar]
  7. Wilson, J.G. Productivity, fisheries and aquaculture in temperate estuaries. Estuar. Coast. Shelf Sci. 2002, 55, 953–967. [Google Scholar] [CrossRef]
  8. Kennish, M.J. Estuaries: Anthropogenic Impacts. In Encyclopedia of Coastal Science; Finkl, C.W., Makowski, C., Eds.; Springer International Publishing: Cham, Switzerland, 2017; pp. 1–9. [Google Scholar]
  9. Jung, N.W.; Lee, G.-h.; Dellapenna, T.M.; Jung, Y.; Jo, T.-C.; Chang, J.; Figueroa, S.M. Economic Development Drives Massive Global Estuarine Loss in the Anthropocene. Earth’s Futur. 2024, 12, e2023EF003691. [Google Scholar] [CrossRef]
  10. Bice, C.M.; Furst, D.; Lamontagne, S.; Oliver, R.L.; Zampatti, B.P.; Revill, A.S. The Influence of Freshwater Discharge on Productivity, Microbiota Community Structure and Trophic Dynamics in the Murray Estuary: Evidence of Freshwater Derived Trophic Subsidy in the Sandy Sprat; Goyder Institute for Water Research: Adelaide, Australia, 2015. [Google Scholar]
  11. Burt, N.; Rees, A. Guidelines for the Assessment and Planning of Estuarine Barrages; Thomas Telford Publishing: London, UK, 2001. [Google Scholar]
  12. Mooyaart, L.; Jonkman, S.; de Vries, P.; Van der Toorn, A.; van Ledden, M. Storm surge barrier: Overview and design considerations. Coast. Eng. Proc. 2014, 1, 45. [Google Scholar]
  13. Mooyaart, L.F.; Jonkman, S.N. Overview and design considerations of storm surge barriers. J. Waterw. Port Coast. Ocean Eng. 2017, 143, 06017001. [Google Scholar]
  14. Bice, C.M.; Huisman, J.; Kimball, M.E.; Mallen-Cooper, M.; Zampatti, B.P.; Gillanders, B.M. Tidal barriers and fish—Impacts and remediation in the face of increasing demand for freshwater and climate change. Estuar. Coast. Shelf Sci. 2023, 289, 108376. [Google Scholar] [CrossRef]
  15. Environment Agency. The Thames Barrier. Available online: https://www.gov.uk/guidance/the-thames-barrier (accessed on 6 February 2025).
  16. Orton, P.; Ralston, D.; van Prooijen, B.; Secor, D.; Ganju, N.; Chen, Z.; Fernald, S.; Brooks, B.; Marcell, K. Increased Utilization of Storm Surge Barriers: A Research Agenda on Estuary Impacts. Earth’s Futur. 2023, 11, e2022EF002991. [Google Scholar] [CrossRef]
  17. Louters, T.; Berg, J.H.; Mulder, J.P.M. Geomorphological changes of the Oosterschelde tidal system during and after the implementation of the Delta project. J. Coast. Res. 1998, 14, 1134–1151. [Google Scholar]
  18. Nienhuis, P.H.; Smaal, A.C. The Oosterschelde estuary, a case-study of a changing ecosystem: An introduction. Hydrobiologia 1994, 282, 1–14. [Google Scholar] [CrossRef]
  19. Leentvaar, J.; Nijboer, S.M. Ecological Impacts of the Construction of Dams in an Estuary. Water Sci. Technol. 1986, 18, 181–191. [Google Scholar] [CrossRef]
  20. Roshni, K.; Renjithkumar, C.R.; Raghavan, R.; Ranjeet, K. Fish distribution and assemblage structure in a hydrologically fragmented tropical estuary on the south-west coast of India. Reg. Stud. Mar. Sci. 2021, 43, 101693. [Google Scholar] [CrossRef]
  21. Gordon, J.; Arbeider, M.; Scott, D.; Wilson, S.M.; Moore, J.W. When the Tides Don’t Turn: Floodgates and Hypoxic Zones in the Lower Fraser River, British Columbia, Canada. Estuaries Coasts 2015, 38, 2337–2344. [Google Scholar] [CrossRef]
  22. Yen, N.T.M.; Vanreusel, A.; Lins, L.; Thai, T.T.; Nara Bezerra, T.; Quang, N.X. The Effect of a Dam Construction on Subtidal Nematode Communities in the Ba Lai Estuary, Vietnam. Diversity 2020, 12, 137. [Google Scholar] [CrossRef]
  23. Beatty, S.J.; Tweedley, J.R.; Cottingham, A.; Ryan, T.; Williams, J.; Lynch, K.; Morgan, D.L. Entrapment of an estuarine fish associated with a coastal surge barrier can increase the risk of mass mortalities. Ecol. Eng. 2018, 122, 229–240. [Google Scholar] [CrossRef]
  24. Torio, D.D.; Chmura, G.L. Assessing Coastal Squeeze of Tidal Wetlands. J. Coast. Res. 2013, 29, 1049–1061. [Google Scholar] [CrossRef]
  25. Rillahan, C.B.; Alcott, D.; Castro-Santos, T.; He, P. Activity Patterns of Anadromous Fish below a Tide Gate: Observations from High-Resolution Imaging Sonar. Mar. Coast. Fish. 2021, 13, 200–212. [Google Scholar] [CrossRef]
  26. Yoon, J.-D.; Jang, M.-H.; Jo, H.-B.; Jeong, K.-S.; Kim, G.-Y.; Joo, G.-J. Changes of fish assemblages after construction of an estuary barrage in the lower Nakdong River, South Korea. Limnology 2016, 17, 183–197. [Google Scholar] [CrossRef]
  27. Yoon, J.-D.; Kim, J.-H.; Park, S.-H.; Kim, E.; Jang, M.-H. Impact of estuary barrage construction on fish assemblages in the lower part of a river and the role of fishways as a passage. Ocean Sci. J. 2017, 52, 147–164. [Google Scholar] [CrossRef]
  28. Addicoat, R.; Tweedley, J.R.; Ryan, T.; Cottingham, A.; Morgan, D.L.; Lynch, K.; Beatty, S.J. Determining the fine-scale movement of an estuarine fish through a tidal-exclusion barrier improves the understanding of mass fish mortality risk. Estuar. Coast. Shelf Sci. 2025, 313, 109085. [Google Scholar] [CrossRef]
  29. Jannah, M.R.; Saha, D.; Bappy, M.M.M.; Nur, A.-A.U.; Banik, P.; Albeshr, M.F.; Arai, T.; Hossain, M.B. Macrobenthos community responses to tidal barrier in a sub-tropical river estuary: Insights for coastal management. Reg. Stud. Mar. Sci. 2024, 79, 103842. [Google Scholar] [CrossRef]
  30. Kim, M.K.; Kim, M.C.; Suh, K.I.; Kim, D.G. Impact of artificial barriers on benthic macroinvertebrate functional diversity in estuarine ecosystems. Entomol. Res. 2024, 54, e12728. [Google Scholar] [CrossRef]
  31. Nicholas, W.L.; Bird, A.F.; Beech, T.A.; Stewart, A.C. The nematode fauna of the Murray River estuary, South Australia; the effects of the barrages across its mouth. Hydrobiologia 1992, 234, 87–101. [Google Scholar] [CrossRef]
  32. Bernier, N.B.; Hemer, M.; Mori, N.; Appendini, C.M.; Breivik, O.; de Camargo, R.; Casas-Prat, M.; Duong, T.M.; Haigh, I.D.; Howard, T.; et al. Storm surges and extreme sea levels: Review, establishment of model intercomparison and coordination of surge climate projection efforts (SurgeMIP). Weather. Clim. Extrem. 2024, 45, 100689. [Google Scholar] [CrossRef]
  33. Lane, J.A.; Hardcastle, K.A.; Tregonning, R.J.; Holtfreter, S. Management of the Vasse-Wonnerup Wetland System in Relation to Sudden, Mass Fish Deaths; Vasse Estuary Technical Working Group: Busselton, Australia, 1997; p. 55. [Google Scholar]
  34. Lane, J.A.K.; Clarke, A.G.; Winchcombe, Y.C. Depth, Salinity and Temperature Profiling of Vasse-Wonnerup Wetlands in 1998–2000; Western Australian Department of Environment and Conservation: Busselton, Australia, 2011; p. 73. [Google Scholar]
  35. Marillier, B. Reconnecting Rivers Flowing to the Vasse Estuary; Water Science Technical Series, report no. 81, Water Science Branch; Department of Water and Environmental Regulation: Perth, Australia, 2018. [Google Scholar]
  36. Tweedley, J.R.; Beatty, S.J.; Cottingham, A.; Morgan, D.L.; Lynch, K.; Lymbery, A.J. Spatial and temporal changes in the fish fauna of a low-inflow estuary following a mass mortality event and natural and artificial bar breaches. Coasts 2024, 4, 366–391. [Google Scholar] [CrossRef]
  37. Lam-Gordillo, O.; Baring, R.; Dittmann, S. Taxonomic and Functional Patterns of Benthic Communities in Southern Temperate Tidal Flats. Front. Mar. Sci. 2021, 8, 723749. [Google Scholar] [CrossRef]
  38. Lane, J.A.K.; Clarke, A.G.; Pearson, G.B. Waterbirds of the Vasse-Wonnerup Wetlands in 1998–2000 and Some Comparisons with Earlier Data; Western Australian Department of Environment and Conservation: Busselton, Australia, 2007; p. 51. [Google Scholar]
  39. Wetland Research & Management. Ecological Character Description: Vasse-Wonnerup Wetlands Ramsar Site South-West Western Australia; Wetland Research & Management: Perth, Australia, 2007; p. 319. [Google Scholar]
  40. Department of Water and Environmental Regulation. Sediments of the Vasse Estuary Exit Channel: A Study of the Characteristics and Feasibility of Removing Sediments; Department of Water and Environmental Regulation: Perth, Australia, 2019; p. 72. [Google Scholar]
  41. DWER. Water Information Reporting. Available online: http://wir.water.wa.gov.au/Pages/Water-Information-Reporting.aspx (accessed on 7 February 2025).
  42. Clarke, K.R.; Gorley, R.N. PRIMER v7: User Manual/Tutorial; PRIMER-E: Plymouth, UK, 2015; p. 296. [Google Scholar]
  43. Anderson, M.J.; Gorley, R.N.; Clarke, K.R. PERMANOVA+ for PRIMER: Guide to Software and Statistical Methods; PRIMER-E: Plymouth, UK, 2008. [Google Scholar]
  44. Clarke, K.R.; Warwick, R.M. A taxonomic distinctness index and its statistical properties. J. Appl. Ecol. 1998, 35, 523–531. [Google Scholar] [CrossRef]
  45. Clarke, K.R.; Gorley, R.N.; Somerfield, P.J.; Warwick, R.M. Change in Marine Communities: An Approach to Statistical Analysis and Interpretation, 3 ed.; PRIMER-E Ltd.: Plymouth, UK, 2014. [Google Scholar]
  46. Clarke, K.R.; Chapman, M.G.; Somerfield, P.J.; Needham, H.R. Dispersion-based weighting of species counts in assemblage analyses. Mar. Ecol. Prog. Ser. 2006, 320, 11–27. [Google Scholar] [CrossRef]
  47. Clarke, K.R. Non-parametric multivariate analyses of changes in community structure. Aust. J. Ecol. 1993, 18, 117–143. [Google Scholar]
  48. Clarke, K.R.; Tweedley, J.R.; Valesini, F.J. Simple shade plots aid better long-term choices of data pre-treatment in multivariate assemblage studies. J. Mar. Biol. Assoc. U. K. 2014, 94, 1–16. [Google Scholar] [CrossRef]
  49. Lam-Gordillo, O.; Baring, R.; Dittmann, S. Establishing the South Australian Macrobenthic Traits (SAMT) database: A trait classification for functional assessments. Ecol. Evol. 2020, 10, 14372–14387. [Google Scholar] [CrossRef]
  50. Kefford, B.J.; Botwe, P.K.; Brooks, A.J.; Kunz, S.; Marchant, R.; Maxwell, S.; Metzeling, L.; Schäfer, R.B.; Thompson, R.M. An integrated database of stream macroinvertebrate traits for Australia: Concept and application. Ecol. Indic. 2020, 114, 106280. [Google Scholar] [CrossRef]
  51. Phillips, N.; Smith, B. New Zealand Freshwater Macroinvertebrate Trait Database; National Institute of Water & Atmospheric Research: Hamilton, New Zealand, 2018. [Google Scholar]
  52. Odume, O.N.; Akamagwuna, F.C.; Ntloko, P.; Dallas, H.F.; Nnadozie, C.F.; Barber-James, H.M. A trait database for southern African freshwater invertebrates. Afr. J. Aquat. Sci. 2023, 48, 64–70. [Google Scholar] [CrossRef]
  53. Laliberté, E.; Legendre, P.; Shipley, P. FD: Measuring Functional Diversity from Multiple Traits, and Other Tools for Functional Ecology; 2014. Available online: https://cran.r-project.org/web/packages/FD/FD.pdf (accessed on 15 August 2024).
  54. R Core Team. R: A Language and Environment for Statistical Computing; R Foundation for Statistical Computing: Vienna, Austria, 2024; Available online: https://www.R-project.org/ (accessed on 15 August 2024).
  55. Mason, N.W.H.; Mouillot, D.; Lee, W.G.; Wilson, J.B. Functional richness, functional evenness and functional divergence: The primary components of functional diversity. Oikos 2005, 111, 112–118. [Google Scholar] [CrossRef]
  56. Kuebbing, S.E.; Maynard, D.S.; Bradford, M.A. Linking functional diversity and ecosystem processes: A framework for using functional diversity metrics to predict the ecosystem impact of functionally unique species. J. Ecol. 2018, 106, 687–698. [Google Scholar] [CrossRef]
  57. van der Linden, P.; Patrício, J.; Marchini, A.; Cid, N.; Neto, J.M.; Marques, J.C. A biological trait approach to assess the functional composition of subtidal benthic communities in an estuarine ecosystem. Ecol. Indic. 2012, 20, 121–133. [Google Scholar] [CrossRef]
  58. Tweedley, J.R.; Cottingham, A.; Krispyn, K.N.; Beatty, S.J. Influence of Bar Opening on the Fish Fauna of Toby Inlet; Murdoch University: Perth, Australia, 2018; p. 36. [Google Scholar]
  59. Wildsmith, M.D.; Rose, T.H.; Potter, I.C.; Warwick, R.M.; Clarke, K.R. Benthic macroinvertebrates as indicators of environmental deterioration in a large microtidal estuary. Mar. Pollut. Bull. 2011, 62, 525–538. [Google Scholar]
  60. Wildsmith, M.D.; Rose, T.H.; Potter, I.C.; Warwick, R.M.; Clarke, K.R.; Valesini, F.J. Changes in the benthic macroinvertebrate fauna of a large microtidal estuary following extreme modifications aimed at reducing eutrophication. Mar. Pollut. Bull. 2009, 58, 1250–1262. [Google Scholar]
  61. Tweedley, J.R.; Warwick, R.M.; Valesini, F.J.; Platell, M.E.; Potter, I.C. The use of benthic macroinvertebrates to establish a benchmark for evaluating the environmental quality of microtidal, temperate southern hemisphere estuaries. Mar. Pollut. Bull. 2012, 64, 1210–1221. [Google Scholar] [CrossRef]
  62. Platell, M.E.; Potter, I.C. Influence of water depth, season, habitat and estuary location on the macrobenthic fauna of a seasonally closed estuary. J. Mar. Biol. Assoc. U. K. 1996, 76, 1–21. [Google Scholar]
  63. Horwitz, P.; Rogan, R.; Halse, S.; Davis, J.; Sommer, B. Wetland invertebrate richness and endemism on the Swan Coastal Plain, Western Australia. Mar. Freshw. Res. 2009, 60, 1006–1020. [Google Scholar] [CrossRef]
  64. Trayler, K.M.; Davis, J.A.; Horwitz, P.; Morgan, D.L. Aquatic fauna of the Warren bioregion, south-west Western Australia: Does reservation guarantee preservation? J. R. Soc. West. Aust. 1996, 79, 281–291. [Google Scholar]
  65. Wildsmith, M.D.; Potter, I.C.; Valesini, F.J.; Platell, M.E. Do the assemblages of the benthic macroinvertebrates in nearshore waters of Western Australia vary among habitat types, zones and seasons? J. Mar. Biol. Assoc. U. K. 2005, 85, 217–232. [Google Scholar] [CrossRef]
  66. Johnston, S.G.; Slavich, P.G.; Hirst, P. The impact of controlled tidal exchange on drainage water quality in acid sulphate soil backswamps. Agric. Water Manag. 2005, 73, 87–111. [Google Scholar] [CrossRef]
  67. Nel, M.; Adams, J.B.; Human, L.R.D.; Nunes, M.; Van Niekerk, L.; Lemley, D.A. Ineffective artificial mouth-breaching practices and altered hydrology confound eutrophic symptoms in a temporarily closed estuary. Mar. Freshw. Res. 2023, 74, 1519–1535. [Google Scholar] [CrossRef]
  68. Becker, A.; Laurenson, L.J.B.; Bishop, K. Artificial mouth opening fosters anoxic conditions that kill small estuarine fish. Estuar. Coast. Shelf Sci. 2009, 82, 566–572. [Google Scholar] [CrossRef]
  69. Hallett, C.S.; Hobday, A.J.; Tweedley, J.R.; Thompson, P.A.; McMahon, K.; Valesini, F.J. Observed and predicted impacts of climate change on the estuaries of south-western Australia, a Mediterranean climate region. Reg. Environ. Change 2018, 18, 1357–1373. [Google Scholar] [CrossRef]
  70. Bourman, R.P.; Murray-Wallace, C.V.; Wilson, C.; Mosley, L.; Tibby, J.; Ryan, D.D.; De Carli, E.D.; Tulley, A.; Belperio, A.P.; Haynes, D.; et al. Holocene freshwater history of the Lower River Murray and its terminal lakes, Alexandrina and Albert, South Australia, and its relevance to contemporary environmental management. Aust. J. Earth Sci. 2022, 69, 605–629. [Google Scholar] [CrossRef]
  71. Chiew, F.H.S.; Hale, J.; Joehnk, K.D.; Reid, M.A.; Webster, I.T. Independent Review of Lower Lakes Science Informing Water Management; Report for the Murray-Darling Basin Authority: Canberra, Australia, 2020; p. 79. [Google Scholar]
  72. Ysebaert, T.; Meire, P.; Maes, D.; Buijs, J. The benthic macrofauna along the estuarine gradient of the Schelde Estuary. Neth. J. Aquat. Ecol. 1993, 27, 327–341. [Google Scholar]
  73. Jones, A.; Watson-Russell, C.; Murray, A. Spatial patterns in the macrobenthic communities of the Hawkesbury Estuary, New South Wales. Mar. Freshw. Res. 1986, 37, 521–543. [Google Scholar] [CrossRef]
  74. Whitfield, A.K.; Elliott, M.; Basset, A.; Blaber, S.J.M.; West, R.J. Paradigms in estuarine ecology—A review of the Remane diagram with a suggested revised model for estuaries. Estuar. Coast. Shelf Sci. 2012, 97, 78–90. [Google Scholar] [CrossRef]
  75. Ritter, A.F.; Wasson, K.; Lonhart, S.I.; Preisler, R.K.; Woolfolk, A.; Griffith, K.A.; Connors, S.; Heiman, K.W. Ecological Signatures of Anthropogenically Altered Tidal Exchange in Estuarine Ecosystems. Estuaries Coasts 2008, 31, 554–571. [Google Scholar] [CrossRef]
  76. Van Diggelen, A.D.; Montagna, P.A. Is Salinity Variability a Benthic Disturbance in Estuaries? Estuaries Coasts 2016, 39, 967–980. [Google Scholar] [CrossRef]
  77. Tweedley, J.R.; Dittmann, S.R.; Whitfield, A.K.; Withers, K.; Hoeksema, S.D.; Potter, I.C. Hypersalinity: Global distribution, causes, and present and future effects on the biota of estuaries and lagoons. In Coasts and Estuaries; Wolanski, E., Day, J.W., Elliott, M., Ramachandran, R., Eds.; Elsevier: Amsterdam, The Netherlands, 2019; pp. 523–546. [Google Scholar]
  78. Vaquer-Sunyer, R.; Duarte, C.M. Thresholds of hypoxia for marine biodiversity. Proc. Natl. Acad. Sci. USA 2008, 105, 15452–15457. [Google Scholar] [CrossRef]
  79. Tweedley, J.R.; Hallett, C.S.; Warwick, R.M.; Clarke, K.R.; Potter, I.C. The hypoxia that developed in a microtidal estuary following an extreme storm produced dramatic changes in the benthos. Mar. Freshw. Res. 2016, 67, 327–341. [Google Scholar] [CrossRef]
  80. Glasby, C.J.; Erséus, C.; Martin, P. Annelids in Extreme Aquatic Environments: Diversity, Adaptations and Evolution. Diversity 2021, 13, 98. [Google Scholar] [CrossRef]
  81. Popham, E.J. Respiration of Corixidae (Hemiptera-Heteroptera). Nature 1959, 183, 914. [Google Scholar] [CrossRef]
  82. Popham, E.J. On the respiration of aquatic Hemiptera Heteroptera with special reference to the Corixidae. Proc. Zool. Soc. Lond. 1960, 135, 209–242. [Google Scholar] [CrossRef]
  83. Tweedley, J.R.; Warwick, R.M.; Potter, I.C. Can biotic indicators distinguish between natural and anthropogenic environmental stress in estuaries? J. Sea Res. 2015, 102, 10–21. [Google Scholar]
  84. Hale, S.S.; Hughes, M.M.; Buffum, H.W. Historical Trends of Benthic Invertebrate Biodiversity Spanning 182 Years in a Southern New England Estuary. Estuaries Coasts 2018, 41, 1525–1538. [Google Scholar] [CrossRef]
  85. Dittmann, S.; Baring, R.; Baggalley, S.; Cantin, A.; Earl, J.; Gannon, R.; Keuning, J.; Mayo, A.; Navong, N.; Nelson, M.; et al. Drought and flood effects on macrobenthic communities in the estuary of Australia’s largest river system. Estuar. Coast. Shelf Sci. 2015, 165, 36–51. [Google Scholar] [CrossRef]
  86. Davis, J.A.; Rosich, R.S.; Bradely, J.S.; Growns, J.E.; Schmidt, L.G.; Cheal, F. Wetland classification on the basis of water quality and invertebrate community data. In Wetlands of the Swan Coastal Plain; Water Authority of Western Australia and Environmental Protection Authority: Perth, Australia, 1993; Volume 6, p. 242. [Google Scholar]
  87. Rose, T.H.; Tweedley, J.R.; Warwick, R.M.; Potter, I.C. Influences of microtidal regime and eutrophication on estuarine zooplankton. Estuar. Coast. Shelf Sci. 2020, 238, 106689. [Google Scholar] [CrossRef]
  88. Attrill, M.J.; Rundle, S.D. Ecotone or Ecocline: Ecological Boundaries in Estuaries. Estuar. Coast. Shelf Sci. 2002, 55, 929–936. [Google Scholar] [CrossRef]
  89. Walker, K.F.; Corbin, T.A.; Cummings, C.R.; Geddes, M.C.; Goonan, P.M.; Kokkin, M.J.; Lester, R.E.; Madden, C.P.; McEvoy, P.K.; Whiterod, N.; et al. Freshwater Macro-Invertebrates. In Natural History of the Coorong, Lower Lakes, and Murray Mouth Region (Yarluwar-Ruwe); Mosley, L., Ye, Q., Shepherd, S., Hemming, S., Fitzpatrick, R., Eds.; University of Adelaide Press: Adelaide, Australia, 2019; pp. 349–370. [Google Scholar]
  90. Dye, A.H.; Barros, F. Spatial patterns of macrofaunal assemblages in intermittently closed/open coastal lakes in New South Wales, Australia. Estuar. Coast. Shelf Sci. 2005, 64, 357–371. [Google Scholar]
  91. Teske, P.R.; Wooldridge, T.H. A comparison of the macrobenthic faunas of permanently open and temporarily open/closed South African estuaries. Hydrobiologia 2001, 464, 227–243. [Google Scholar]
  92. Loiseau, V.; Gendreau, Y.; Calosi, P.; Cusson, M. Freshwater input significantly reduces specific and functional diversity of small subarctic estuaries. Estuar. Coast. Shelf Sci. 2024, 305, 108856. [Google Scholar] [CrossRef]
  93. Morais, G.C.; Gusmao, J.B.; Oliveira, V.M.; Lana, P. Macrobenthic functional trait diversity at multiple scales along a subtropical estuarine gradient. Mar. Ecol. Prog. Ser. 2019, 624, 23–37. [Google Scholar]
  94. Elliott, M.; Quintino, V. The Estuarine Quality Paradox, Environmental Homeostasis and the difficulty of detecting anthropogenic stress in naturally stressed areas. Mar. Pollut. Bull. 2007, 54, 640–645. [Google Scholar] [CrossRef]
  95. Cronin-O’Reilly, S.; Krispyn, K.N.; Maus, C.; Standish, R.J.; Loneragan, N.R.; Tweedley, J.R. Empirical evidence of alternative stable states in an estuary. Sci. Total Environ. 2024, 954, 176356. [Google Scholar] [CrossRef] [PubMed]
  96. McCallum, R.; Eyre, B.; Hyndes, G.; McMahon, K.; Oakes, J.M.; Wells, N.S. Importance of internal dissolved organic nitrogen loading and cycling in a small and heavily modified coastal lagoon. Biogeochemistry 2021, 155, 237–261. [Google Scholar] [CrossRef]
  97. Department of Water and Environmental Regulation. Year on the Vasse-Wonnerup Wetlands: An Ecological Snapshot March 2017—January 2018; Department of Water and Environmental Regulation: Busselton, Australia, 2019; p. 20. [Google Scholar]
  98. Welsh, D.T. It’s a dirty job but someone has to do it: The role of marine benthic macrofauna in organic matter turnover and nutrient recycling to the water column. Chem. Ecol. 2003, 19, 321–342. [Google Scholar] [CrossRef]
  99. Lam-Gordillo, O.; Huang, J.; Barceló, A.; Kent, J.; Mosley, L.M.; Welsh, D.T.; Simpson, S.L.; Dittmann, S. Restoration of benthic macrofauna promotes biogeochemical remediation of hostile sediments; An in situ transplantation experiment in a eutrophic estuarine-hypersaline lagoon system. Sci. Total Environ. 2022, 833, 155201. [Google Scholar] [CrossRef]
  100. Aller, R.C. Bioturbation and remineralization of sedimentary organic matter: Effects of redox oscillation. Chem. Geol. 1994, 114, 331–345. [Google Scholar] [CrossRef]
  101. Kristensen, E.; Holmer, M. Decomposition of plant materials in marine sediment exposed to different electron acceptors (O2, NO3, and SO42−), with emphasis on substrate origin, degradation kinetics, and the role of bioturbation. Geochim. Cosmochim. Acta 2001, 65, 419–433. [Google Scholar] [CrossRef]
  102. Cronin-O’Reilly, S.; Wells, N.S.; McCallum, R.; Hallett, C.S.; Tweedley, J.R.; Valesini, F.J.; Eyre, B.D. Chronically stressed benthic macroinvertebrate communities exhibit limited effects on ecosystem function in a microtidal estuary. Mar. Ecol. Prog. Ser. 2022, 701, 1–16. [Google Scholar]
  103. Gao, J.; Zhi, Y.; Huang, Y.; Shi, S.; Tan, Q.; Wang, C.; Han, L.; Yao, J. Effects of benthic bioturbation on anammox in nitrogen removal at the sediment-water interface in eutrophic surface waters. Water Res. 2023, 243, 120287. [Google Scholar] [CrossRef]
  104. Laverock, B.; Gilbert, J.A.; Tait, K.; Osborn, A.M.; Widdicombe, S. Bioturbation: Impact on the marine nitrogen cycle. Biochem. Soc. Trans. 2011, 39, 315–320. [Google Scholar] [CrossRef]
  105. Tweedley, J.R.; Keleher, J.; Cottingham, A.; Beatty, S.J.; Lymbery, A.J. The Fish Fauna of the Vasse-Wonnerup and the Impact of a Substantial Fish Kill Event; Murdoch University: Perth, Australia, 2014; p. 113. [Google Scholar]
  106. Collazo, J.A.; Dawn, A.O.H.; Kelly, C.A. Accessible Habitat for Shorebirds: Factors Influencing Its Availability and Conservation Implications. Waterbirds Int. J. Waterbird Biol. 2002, 25, 13–24. [Google Scholar]
  107. Aarif, K.M.; Zouhar, J.; Musilova, Z.; Musil, P.; Nefla, A.; Muzaffar, S.B.; Rubeena, K.A. Bill Length of Non-breeding Shorebirds Influences the Water Depth Preferences for Foraging in the West Coast of India. Ecol. Evol. 2024, 14, e70396. [Google Scholar] [CrossRef] [PubMed]
  108. Ma, Z.; Cai, Y.; Li, B.; Chen, J. Managing Wetland Habitats for Waterbirds: An International Perspective. Wetlands 2010, 30, 15–27. [Google Scholar] [CrossRef]
  109. Schaffer-Smith, D.; Swenson, J.J.; Reiter, M.E.; Isola, J.E. Quantifying shorebird habitat in managed wetlands by modeling shallow water depth dynamics. Ecol. Appl. 2018, 28, 1534–1545. [Google Scholar] [CrossRef]
  110. Tweedley, J.R.; Chambers, J.M.; Potter, I.C. The Benthic Macroinvertebrate Faunas of the Vasse-Wonnerup Estuary as Indicators of Environmental Degradation; Report for the South West Catchments Council; Murdoch University: Perth, Australia, 2011; p. 41. [Google Scholar]
  111. Krispyn, K.N.; Loneragan, N.R.; Whitfield, A.K.; Tweedley, J.R. Salted mullet: Protracted occurrence of Mugil cephalus under extreme hypersaline conditions. Estuar. Coast. Shelf Sci. 2021, 261, 107533. [Google Scholar] [CrossRef]
  112. Michael, T.C.; Costello, D.M.; Fitzgibbon, A.S.; Kinsman-Costello, L.E. Invertebrate activities in wetland sediments influence oxygen and nutrient dynamics at the sediment-water interface. Wetlands 2023, 43, 96. [Google Scholar] [CrossRef]
  113. Chakraborty, A.; Saha, G.K.; Aditya, G. Macroinvertebrates as engineers for bioturbation in freshwater ecosystem. Environ. Sci. Pollut. Res. 2022, 29, 64447–64468. [Google Scholar] [CrossRef]
  114. Ganglo, C.; Manfrin, A.; Mendoza-Lera, C.; Lorke, A. Effects of chironomid larvae density and mosquito biocide on methane and carbon dioxide dynamics in freshwater sediments. PLoS ONE 2024, 19, e0301913. [Google Scholar] [CrossRef]
  115. Mosley, L.M.; Bourman, B.; Muller, K.; Tibby, J. Comment on Finlayson et al. ‘Continuing the discussion about ecological futures for the lower Murray river (Australia) in the Anthropocene’. Mar. Freshw. Res. 2022, 73, 573–577. [Google Scholar] [CrossRef]
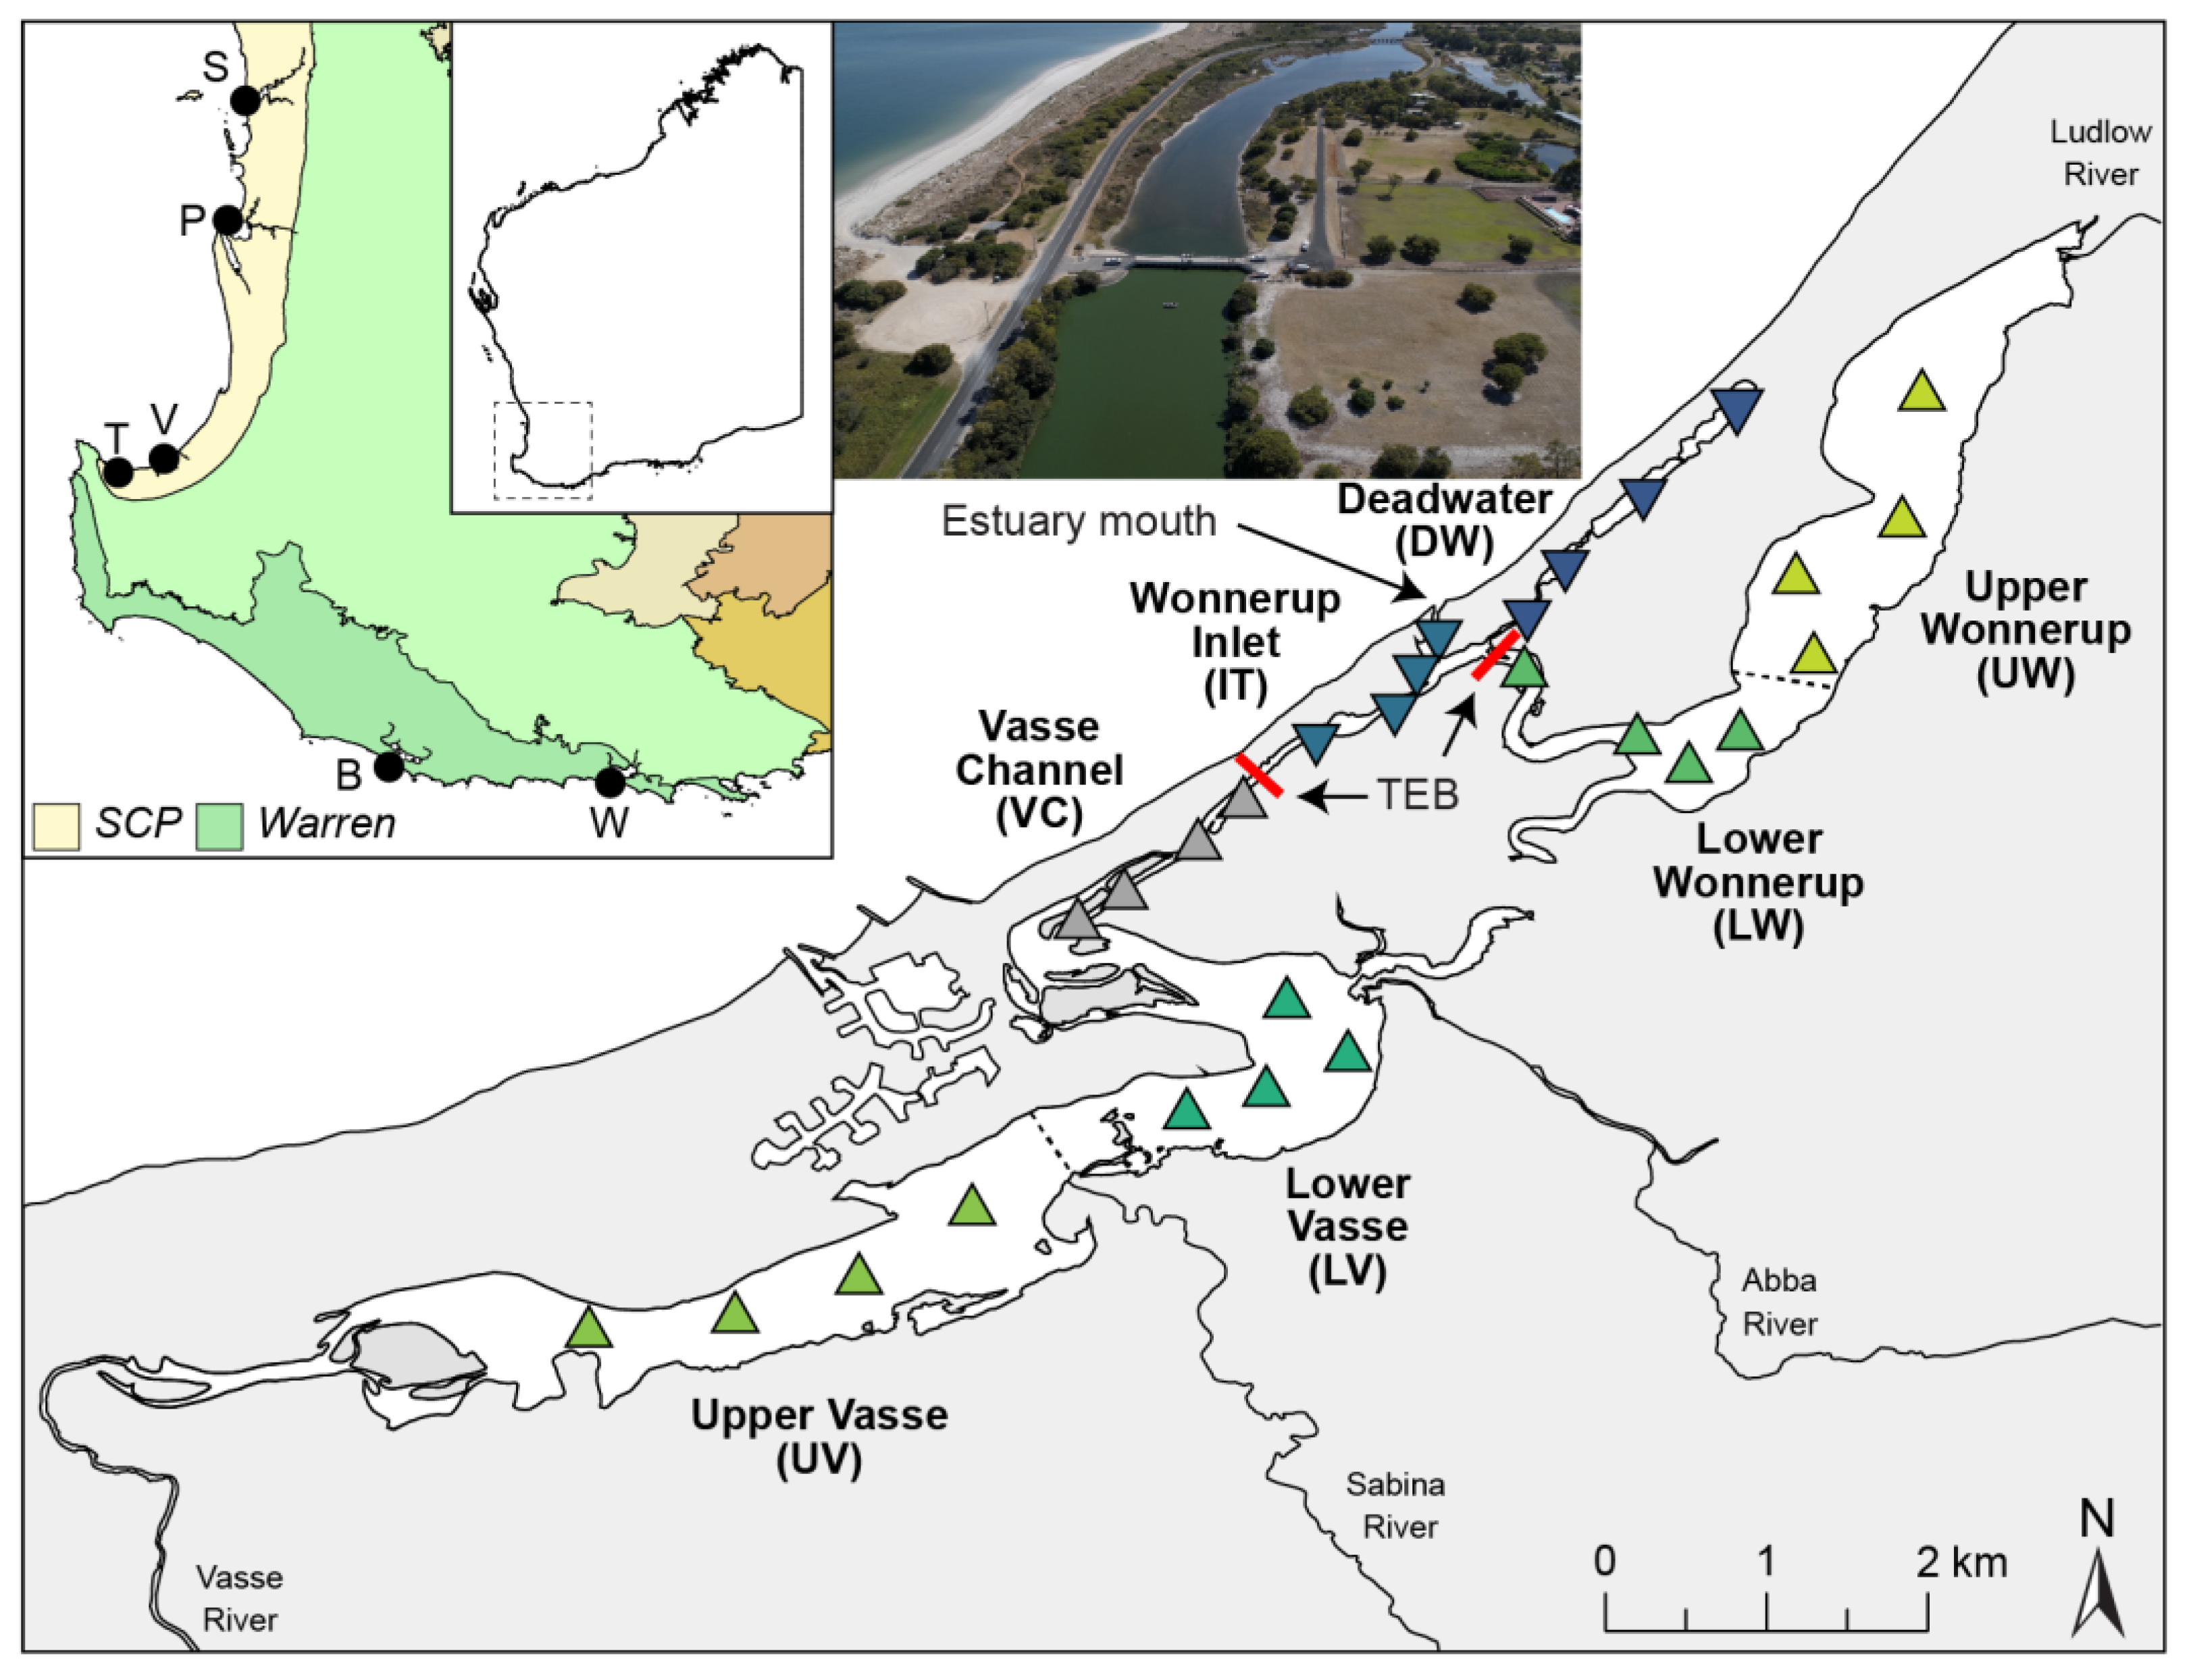
Figure 1. Map of the Vasse–Wonnerup showing the sites sampled in each of the seven regions and the two tidal exclusion barriers (TEBs; red lines). The inset photograph shows the Vasse TEB (see also Figure A1); note the colouration of the water between the upstream side (wetland waters in the foreground; green) and the downstream side (marine waters in the background; blue). Inset maps show the location of the six other estuaries sampled in southwestern Australia. Shading represents the Interim Biogeographic Regionalisation for Australia regions. S = Swan–Canning; P = Peel–Harvey; V = Vasse–Wonnerup; T = Toby; B = Broke; W = Wilson; SCP = Swan Coastal Plain.
Jmse 13 00635 g001
Figure 2. Mean (±1 SE) value for (a) salinity (ppt), (b) water temperature (°C) and (c) dissolved oxygen concentration (mgL−1) in each region of the Vasse–Wonnerup in March 2017. DW = Deadwater; IT = Wonnerup Inlet; VC = Vasse Channel; LV = Lower Vasse; LW = Lower Wonnerup; UV = Upper Vasse; UW = Upper Wonnerup.
Jmse 13 00635 g002
Figure 3. Raincloud plots, i.e., the combination of a scatter plot, probability density, and a box plot, of the environmental measures recorded at sites from each region of the Vasse–Wonnerup in (a,c,e) all months and (b,d,f) summer and autumn months in 2017 and 2020. Data extracted from [41]. Note that data for the Deadwater (DW) were only available for months during summer and autumn.
Jmse 13 00635 g003
Figure 4. Mean (±1 SE) values for (a) species richness, (b) total abundance (individuals per 225 cm2), (c) Simpson’s index, and (d) qualitative taxonomic distinctness in each region of the Vasse–Wonnerup.
Jmse 13 00635 g004
Figure 5. (a) Non-metric multidimensional scaling plot of invertebrate community composition at each site in each region of the Vasse–Wonnerup. The dashed line denotes the position of the sites in relation to the TEBs (i.e., upstream or downstream). (b) Shade plot of the most abundant taxa in each region of the Vasse–Wonnerup. Taxa are arranged in significantly distinct (full line) and non-distinct (dashed line) clusters based on their pattern of abundance among sites.
Jmse 13 00635 g005
Figure 6. Mean (±1 SE) values for (a) functional richness, (b) functional evenness, (c) functional divergence, (d) functional dispersion, (e) Rao’s quadratic entropy, and (f) functional redundancy in each region of the Vasse–Wonnerup using data for each site as replicates (bar and primary y-axis) and each region (black dot and secondary y-axis).
Jmse 13 00635 g006
Figure 7. (a) PCO ordination of the trait modalities at each site in each region of the Vasse–Wonnerup. Modalities that differed significantly amongst regions (Tables S3 and S4) were overlaid as vectors. (b) Community-weighted means (CWMs) of trait-modalities expression in each region. The scale represents the percentage contribution to CWMs. Trait modality labels (acronyms) are defined in Table 1.
Jmse 13 00635 g007
Figure 8. (a) Non-metric multidimensional scaling plot of invertebrate community composition in each region of the Vasse–Wonnerup (TEB regulated) and Toby Inlet (no regulation). (b) Shade plot of the abundance of higher taxonomic levels (class or higher) in each region of each system. Regions ordered according to a cluster dendrogram and higher taxonomic levels by seriation. Toby Inlet regions, i.e., TDW = Deadwater, TL = Lower, TM = Middle, and TU = Upper.
Jmse 13 00635 g008
Figure 9. (a) Non-metric multidimensional scaling plot of the percentage of species numbers per class in the Vasse–Wonnerup (DW IT, VC, LV, LW, UV, and UW), Toby Inlet (TDW, TL, TM, and TU), Peel–Harvey Estuary (P), and Swan–Canning Estuary (S) in the 1980s (8) and 2000s (0), the shallow and deep waters of Broke Inlet (Bs and Bd) and Wilson Inlet (Ws and Wd, respectively), and wetlands in the Swan Coastal Plain (SCP) and Warren (W) bioregions and marine waters (M) on the lower west coast of Western Australia. (b) Shade plot of the percentage of species belonging to higher taxonomic levels (class or higher) in the various aquatic systems. Systems ordered according to a cluster dendrogram and higher taxonomic levels by seriation.
Jmse 13 00635 g009
Figure 10. Conceptual model showing the influence of the tidal exclusion barriers on the environmental conditions and benthic macroinvertebrate fauna of the Vasse–Wonnerup.
Jmse 13 00635 g010
Table 1. Trait modalities of the South Australian Macrobenthic Traits database [49] that invertebrate taxa were assigned to.
TraitModalityAcronym
Bioturbation modeBiodiffusorBdiff
BioirrigatorBirrig
Surface modifierSurmo
No bioturbationNbio
Body sizeLarge (>20 mm)Lar
Medium (5–20 mm)Med
Small (0.5–5 mm)Sma
Feeding modeDeposit feederDefe
Filter/Suspension feederFisus
Grazer/ScraperGraz/Sc
OmnivoreOn
PredatorPred
Scavenger/OpportunistScav
Sub-surface deposit feederSsdefe
Living habitBurrowerBurr
Free-living/Surface crawlerFree
Tube dwellingTubdw
Attached/SessileAtt/S
Sediment positionBentho-pelagicBe-pel
Deeper than 3 cmDeep
Surface shallow <3 cmSurfsh
AttachedAtt
Disclaimer/Publisher’s Note: The statements, opinions and data contained in all publications are solely those of the individual author(s) and contributor(s) and not of MDPI and/or the editor(s). MDPI and/or the editor(s) disclaim responsibility for any injury to people or property resulting from any ideas, methods, instructions or products referred to in the content.