Article

Full-Scale Numerical Simulation of a Free-Running Cruise Ship in Heavy Head Sea Conditions

1
Merchant Marine College, Shanghai Maritime University, Shanghai 201306, China
2
School of Ship and Ocean Engineering, Jiangsu Shipping College, Nantong 226010, China
3
College of Ocean Science and Engineering, Shanghai Maritime University, Shanghai 201306, China
*
Author to whom correspondence should be addressed.
J. Mar. Sci. Eng. 2025, 13(4), 626; https://doi.org/10.3390/jmse13040626
Submission received: 25 February 2025 / Revised: 14 March 2025 / Accepted: 19 March 2025 / Published: 21 March 2025
(This article belongs to the Section Ocean Engineering)

Abstract

:
For a cruise ship in heavy sea conditions, self-propulsion performance prediction is important for ensuring its safety. In this study, a numerical simulation approach that models the free running of a ship is presented, and a full-scale small cruise ship is verified using a ship model experiment. Based on this method, a free-running cruise ship encountering six kinds of wave conditions was simulated, and the characteristics of the ship’s motion, added resistance, and propeller loading were analyzed. The results demonstrated that the free-running approach can simulate the self-propelled motion of a full-scale ship, and that it converges more quickly than the traditional self-propulsion simulation method. The ship’s speed, heave, pitch, and thrust fluctuated when it moved through the waves, and λ/Lwl had a greater influence on the amplitude of these fluctuations than did H/Lwl. Furthermore, the propeller loading exhibited a sharp increase, and the maximum loading coefficient exceeded 500%, which may pose a safety risk.

1. Introduction

Studying the self-propulsion performance [1] of cruise ships in heavy sea conditions is important for ensuring people’s safety. The hydrodynamic performance of a ship can be precisely estimated by extrapolating the towing tank test results or numerical simulation results for a model-scale ship. The extrapolation method is typically based on a similarity law and is recommended by the International Towing Tank Conference (ITTC). This method is reliable for classical transport ships and typical propulsion systems, but its results are unsuitable for new types of ships, propulsion equipment [2], and energy-saving devices, particularly for ships with unconventional lineages [3]. However, full-scale sea trials cannot be conducted in the design stage, and self-propulsion tests of real ships require numerous time cycles in strict wave conditions, which are costly. Therefore, numerical methods are more effective for studying the performance and local flow characteristics of full-scale ships. In recent years, comparing the numerical calculations of computational fluid dynamics (CFD) to the results obtained by tests of model-scale ships has become a relatively widespread approach for studying the self-propulsion performance of full-scale ships.
Lin and Kouh [4] studied the characteristics of the thrust deduction factor for ship self-propulsion and demonstrated the existence of a scale effect on the thrust deduction. They performed a numerical simulation of a medium-speed container ship using CFD software and concluded that the scale effect of the thrust deduction coefficient was small and that the wake field of the model-scale ship was significantly different from the actual wake field. This difference is the primary origin of the scale effect on a ship’s self-propulsion performance. Similarly, Guo et al. [5] pointed out that the scale effect results in a large difference between the wake field of the scale model and that of an actual ship. Ponkratov and Zegos [6] highlighted the importance of verifying the self-propulsion of full-scale ships. In addition, Wang et al. [7] used the Reynolds-averaged Navier–Stokes (RANS) and volume of fluid (VOF) methods to conduct a self-propulsion analysis of the ship–propeller–rudder systems of model-scale and full-scale KRISO (Korea Research Institute of Ships and Ocean Engineering) container ships (KCS) and found that the scale effects of the velocity and wake field at the self-propulsion point were substantial. Furthermore, Li et al. [8] simulated the self-propulsion performance of a full-scale KCS ship and found that the scale effects of the rotation and wake fraction at the self-propulsion point were also significant in calm water. The wake fraction of the full-scale ship was smaller than that of the scale model, and the rotation of the full-scale ship was larger than that of the model-scale ship at the self-propulsion point. Moreover, Kösterke et al. [9] concluded that the thrust deduction caused by the scale effect should be taken into account when simulating the propeller thrust. Sun et al. [3] analyzed the hydrodynamic performance of a full-scale self-propelled ship and concluded that the numerical simulation results for the ship were consistent with those of the sea tests at the self-propulsion points. This conclusion provided an effective reference for the application of a full-scale simulation method for predicting the self-propulsion performance of ships.
According to the studies described above, the impact of the scale effect on the prediction of the self-propulsion performance of ships, particularly the details of the wake, cannot be ignored. Simulation analyses of full-scale ships can eliminate the scale effect problems caused by model-scale ship tests or simulations. However, the large number of grids and the multi-coupled motion in full-scale ship simulations complicate the calculations and decrease their efficiency. To overcome these problems, simulation techniques that can quickly analyze the self-propulsion performance of ships (e.g., the propeller body force and overset grid methods) have emerged.
In the propeller body force method, a source term is generally added to the momentum equation to replace the influence of the propeller rotation on the surrounding flow field. Therefore, performing a numerical simulation of the propeller rotation and building a propeller grid are unnecessary, rendering the calculations significantly simpler. Consequently, this method is widely used in self-propulsion analyses [10]. Although the propeller body force method can be used to obtain a ship’s trajectory, describing the propeller flow field in detail is insufficient because the relative motions of the hull, propeller, shaft, and rudder are coupled. To address this problem, overset grid technology was developed to effectively handle the multiple degrees of freedom (DOFs) of the hull and the rotation of the propeller and rudder. For instance, Castro et al. [11] used overset grid technology to perform self-propulsion calculations for a full-scale KCS container ship in calm water, for which the propeller rotation was arbitrary. Based on this technology, Wang and Wan [12] independently developed a three-dimensional numerical wave generation and absorption module to execute a numerical simulation of ship–propeller–rudder interactions under head sea conditions. In addition, Liu et al. [13] used the dynamic overset grid method to evaluate the scale effect of the self-propulsion performance of a submarine; the results showed that the scale effect on the pressure component of the submarine’s resistance was negligible, but the thrust ratio of the full-scale propeller was higher than that of the model-scale propeller under similar conditions. Furthermore, Kinaci and Ozturk [14] performed a self-propulsion and turning analysis of a model-scale ship using the sliding mesh and overset grid techniques in calm water, which accounted for the asymmetrical influence of the propeller’s motion on the flow field around the ship. Moreover, Saydam et al. [15] verified the power prediction accuracy of a self-propulsion calculation method incorporating CFD for a scale-model ship. Yu et al. [16] quickly and accurately predicted the maneuverability of a twin-screw propulsion ship and compared it to the sea test results of a full-scale ship.
In summary, studies on self-propelled ships generally consider calm water conditions; few studies evaluate the self-propulsion performance of full-scale ships under rough sea [17] conditions, especially in environments with large wave amplitudes. However, the “safe return to port” requirements of the International Maritime Organization (IMO) [18] for cruise ships include heavy sea conditions; thus, examining the self-propulsion performance of cruise ships is required. In self-propulsion simulations, the ship’s forward motion is generally restricted to ensure a specific relative speed between the water flow and ship, and the self-propulsion point is determined via test analyses. However, this situation does not represent true free running, and quickly obtaining the speed of the ship given the specified propeller rotation is impossible. If the forward motion of the ship in a fixed water domain is uninhibited with a certain degree of rotation, the region of the domain and the mesh will be very large, increasing the complexity of the calculation.
In this study, firstly, based on relative motion between the ship and the current, a free-running simulation approach for predicting the speed and motion performance of a full-scale ship is proposed. Secondly, a small X-bow cruise ship was adopted as the research object, and the validity of this numerical approach was verified by the model test results. Finally, the free-running performance of the ship was analyzed in six possible heavy sea conditions, and the ship’s motion, added resistance, propeller load characteristics, and so on were discussed.

2. Numerical Model and Methodology

This study conducted resistance tests on a small cruise ship in both calm water and wavy conditions based on the STAR-CCM+ software(14.02) provided by Siemens. In these simulations, the water was assumed to be an incompressible Newtonian fluid obeying mass conservation and momentum balance laws.

2.1. Governing Equations

The Reynolds-averaged Navier–Stokes (RANS) method was used to predict the flow field around the model- and full-scale ships. The governing equations for an incompressible turbulent flow describe the instantaneous conservation of mass (continuity equations) and momentum (RANS equations) [19], which can be expressed as
ρ t + ρ u i x i = 0 ,
ρ u i t + x i ρ u i u j = p x j + x j μ u i x j ρ u i u j ¯ + S j ,
respectively, where ui and uj (i, j = 1, 2, 3) are the time-averaged velocity components, p is the time-averaged pressure, ρ is the density of the fluid, μ is the dynamic viscosity coefficient, ρ u i u j ¯ is the Reynolds stress term, and Sj is the source term.
The turbulence model selected in the simulations was the normal k-ε model, which has exhibited a favorable capacity for predicting ship wake fields [20]. In addition, the volume of fluid (VOF) method was adopted to model the free surface boundary [21]. This method introduces an additional transport equation for the unknown variable that represents the volume fraction of water inside each finite volume mesh; it is expressed as
α i = V i V ,
i = 1 N α i = 1 ,
where α is the volume fraction, V i is the volume of water in the mesh, and V is the total volume of the mesh.

2.2. Wall Functions y+

Wall functions are used in CFD to model the boundary layer flow when the mesh on the surface of the boundary is not sufficiently dense to fully solve the flow phenomena. The y+ wall function is a nondimensional distance describing the relationship between the height of the first cell of the boundary layer mesh and the flow characteristics; it is expressed as
y + = y u t v ,
where y represents the absolute distance from the wall, ut represents the frictional velocity, and v represents the viscous velocity.

2.3. Generating Waves and Absorbing Waves

Each wave was modeled using the fifth-order Stokes wave theory, which produces a wave model that closely resembles a real wave. The wave profile and phase velocity depend on the water depth, wave height, and current, which must satisfy
U R = H λ 2 d 3 ,
where U R is the Ursell number, which indicates the nonlinearity of long surface gravity waves on a fluid layer [22], H is the wave height, λ is the wavelength, and d is the water depth.
A wave forcing approach was used in the simulation to eliminate wave reflections. The solution to the discretized Navier–Stokes (N–S) equations for a theoretical solution or simplified numerical solution over a specified distance reduces the complexity of the computations by decreasing the size of the solution domain. This forcing approach also eliminates problems associated with the reflections of surface waves at the boundaries owing to the damping feature of gradual forcing. The wave forcing approach [21] applies only to the momentum equation, to which is added a source term of the form
q ϕ = γ ρ φ φ ,
where γ is the forcing coefficient, ρ is the density of the fluid, φ is the current solution of the transport equation, and φ* is the value toward which the solution is forced.
The source term in Equation (6) was applied by varying the forcing coefficient over a specified forcing zone. The forcing coefficient varied smoothly from zero at the inner edge of the forcing zone to the maximum value γ at the outer edge of the forcing zone (the boundary); this variance is expressed as
γ = γ 0 cos 2 π x / 2 ,
where γ0 is the maximum forcing coefficient and x* is the width of the forcing zone. Further details can be found in the STAR-CCM+ user guide [21].

2.4. Moving Coordinate System

By defining a moving coordinate system, the relative motion of the water body could be tracked; the relative speed was calculated using
v r = v v p + v e ,
v p = v t + ω p × r p ,
v e = ω e × r e ,
where ω p denotes the angular velocity of the reference coordinate system, ω e denotes the angular velocity of the embedded reference coordinate system, r p denotes the position vector relative to the reference coordinate system, and r e denotes the position vector relative to the embedded reference coordinate system.

3. Computational Setups

3.1. Approach Procedure

Currently, when CFD is used to simulate a self-propelled ship, the freedom of the ship’s forward motion is generally restricted. And the velocity of the current is assigned a direction opposite to that of the ship’s forward motion, which is equivalent to simulating the free running of the ship. Multiple simulation tests are required to obtain accurate self-propulsion points. If a ship is allowed to run freely in water, a very large water region is required, but this results in too many grids. If a full-scale simulation is used, even more grids are required, which could render the calculations completely impossible. Based on the moving coordinate system described in Equations (9)–(11), the water background region can move with the ship to ensure that their relative motion remains unchanged. Therefore, the total number of grids in the calculation domain remains the same, which ensures that the simulation is executed without increasing the number of required calculations, thus achieving the true free running of the ship.
To realize a free-running simulation of a ship and facilitate its application in wavy conditions, the procedure shown in Figure 1 was adopted. First, based on the ship’s principal parameters, full-scale ship simulations and model tests were conducted under calm water conditions. The simulation accuracy was verified by comparing the open-water characteristics of the propeller to the resistance and self-propelled characteristics of the ship. Second, based on the self-propelled simulation model, a free-running analysis was performed under static water conditions. Subsequently, the velocity and motion characteristics at the self-propulsion point for the designed rpm (revolutions per minute) were examined using the model tests. When the errors met the requirements, the simulation conditions were used for heavy sea conditions with large wave heights. Finally, the characteristics of the ship’s speed, propeller load, and motion were analyzed.

3.2. Model Test

A small cruise ship was adopted as the object in this study. The total length of this cruise ship was 104.11 m, its width was 18.4 m, and the design draft was 5.1 m. Figure 2 shows the test model of the ship, which had a scale ratio of 14.5. The numerical model described in this study did not include bow thrusters or bilge keels. In the ship resistance simulation, the geometric model did not include the shaft or propeller. All the tank tests were conducted under calm water conditions, and the rudder angle was set to 0°. The main parameters of the full- and model-scale ships are listed in Table 1.
During the resistance test, the model was towed at speeds corresponding to the same Froude number (Fn) used for the full-scale ship, and the total model resistance RTm was measured. The results for the model were converted to those of the full-scale ship according to the 1978 ITTC Performance Prediction Method. Additionally, the frictional resistance coefficient CF was calculated using the 1957 ITTC model-ship correlation line, which describes the relationship between CF and the Reynolds number (Rn) via
C F = 0.075 log 10 R n 2 2 ,   R n = V L ν ,   F n = V g L ,
where V is the speed, L is the length of the waterline of the ship and model, ν is the kinematic viscosity (ITTC 1960), and g is the acceleration due to gravity. During the self-propulsion tests, the propeller thrust (T) and torque (Q) were measured, and rate of revolution (n) was set manually.

3.3. Numerical Modeling

3.3.1. Geometric Model

The geometric model used in the numerical simulation is shown in Figure 3. The geometric model included rudders, shafts, and propellers. The main parameters of the ship model are listed in Table 1 (Section 3.2).

3.3.2. Computational Domain and Mesh

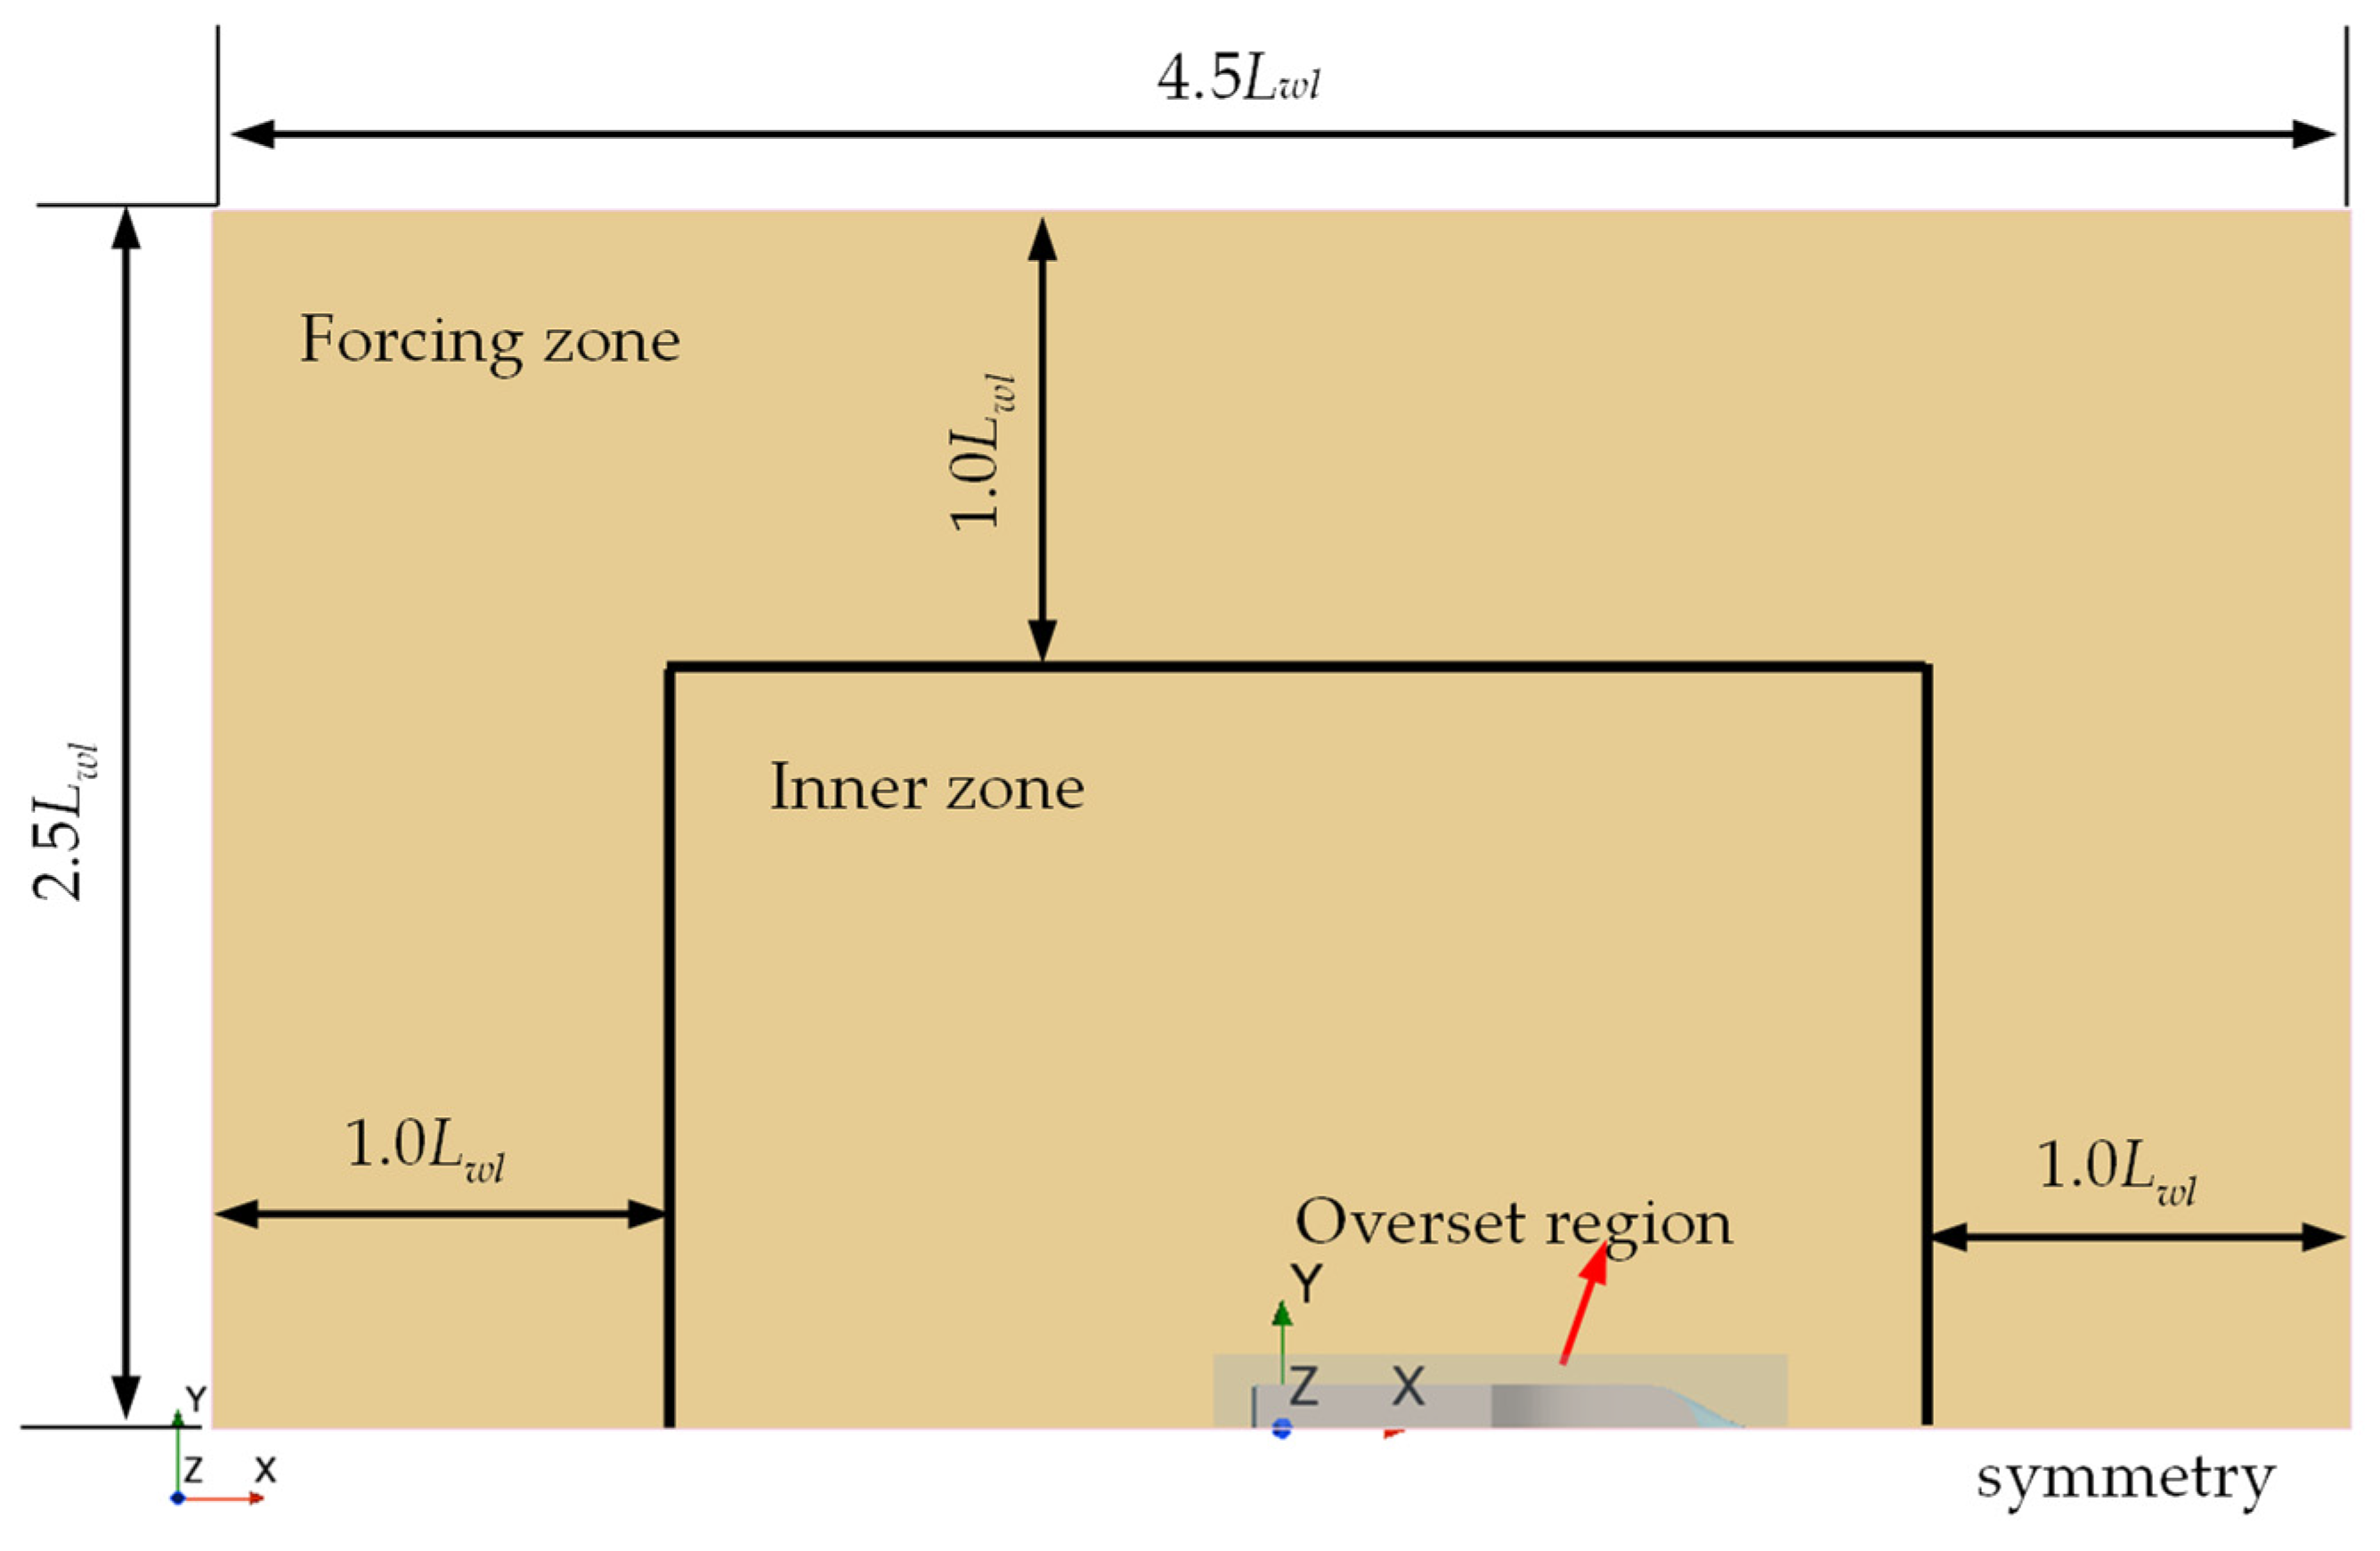
The small cruise ship was symmetrical from left to right; therefore, half of the calculation domain was used for the resistance and self-propulsion calculations. The calculation model adopted the actual size of the ship to avoid the scale effect. The calculation domain was constructed as shown in Figure 4. The ship’s coordinate system was established at the rear of the ship, and the origin was marked as O. The X-axis was placed within the ship, pointing from the rear to the bow. The Y-axis was oriented parallel with the stern, pointing to the port side. The Z-axis pointed vertically upward and originated 5.10 m above the ship’s baseline. The size of the computational domain was −3.0 Lwlx ≤ 1.5 Lwl, 0 ≤ y ≤ 2.5 Lwl, and −3.0 Lwlz ≤ 2.0 Lwl. The front, side, top, and bottom boundaries were designated as velocity inlets, and the rear boundary was designated as the pressure outlet. To facilitate a comparison with the experimental results, the hull, rudder, and propeller surfaces were defined as smooth walls.
In the resistance and wave simulations, the overset mesh technique was used to accurately capture the motion of the hull, and wave forcing boundaries were used at the water velocity inlets and pressure outlet to eliminate the effects of reflected waves [23]. Figure 5 shows the forcing zone that was applied in all the simulations [21].
To improve the accuracy of the nonuniform flow field simulation, refining the grid in certain areas was required. In this study, the cut-cell method was used to generate the mesh. Different-sized volumes were employed to refine the surfaces with large curvature changes, such as the bows, rudders, Kelvin wave systems, and other areas. The boundary layer of the body of the ship was set to 12. The mesh of the resistance computational domain is shown in Figure 6a, and the overset region and local fine mesh are shown in Figure 6b.

3.4. Open-Water Simulations of the Propeller

The open-water test results were expressed in terms of the following dimensionless quantities: the advance coefficient J , thrust coefficient K T , torque coefficient K Q , and open-water efficiency η . These quantities are defined as
J = V A n D K T = T ρ n 2 D 4 K Q = Q ρ n 2 D 5 η = J K T 2 π K Q ,
where T is the propeller thrust, Q is the propeller torque, ρ is the density of the fluid, n is the revolution rate, and D is the diameter of the propeller.
To obtain a complete CFD prediction of the self-propulsion factors, full-scale open-water curves are necessary; thus, open-water simulations of the full-scale propeller were conducted. These simulations tested the ability of the code to predict the open-water characteristics of the full-scale propeller. The surfaces of this propeller were assumed to be smooth, the k–ε based RANS turbulence model was used, and the computations were performed on a workstation with 64 processors and 128 GB of memory.
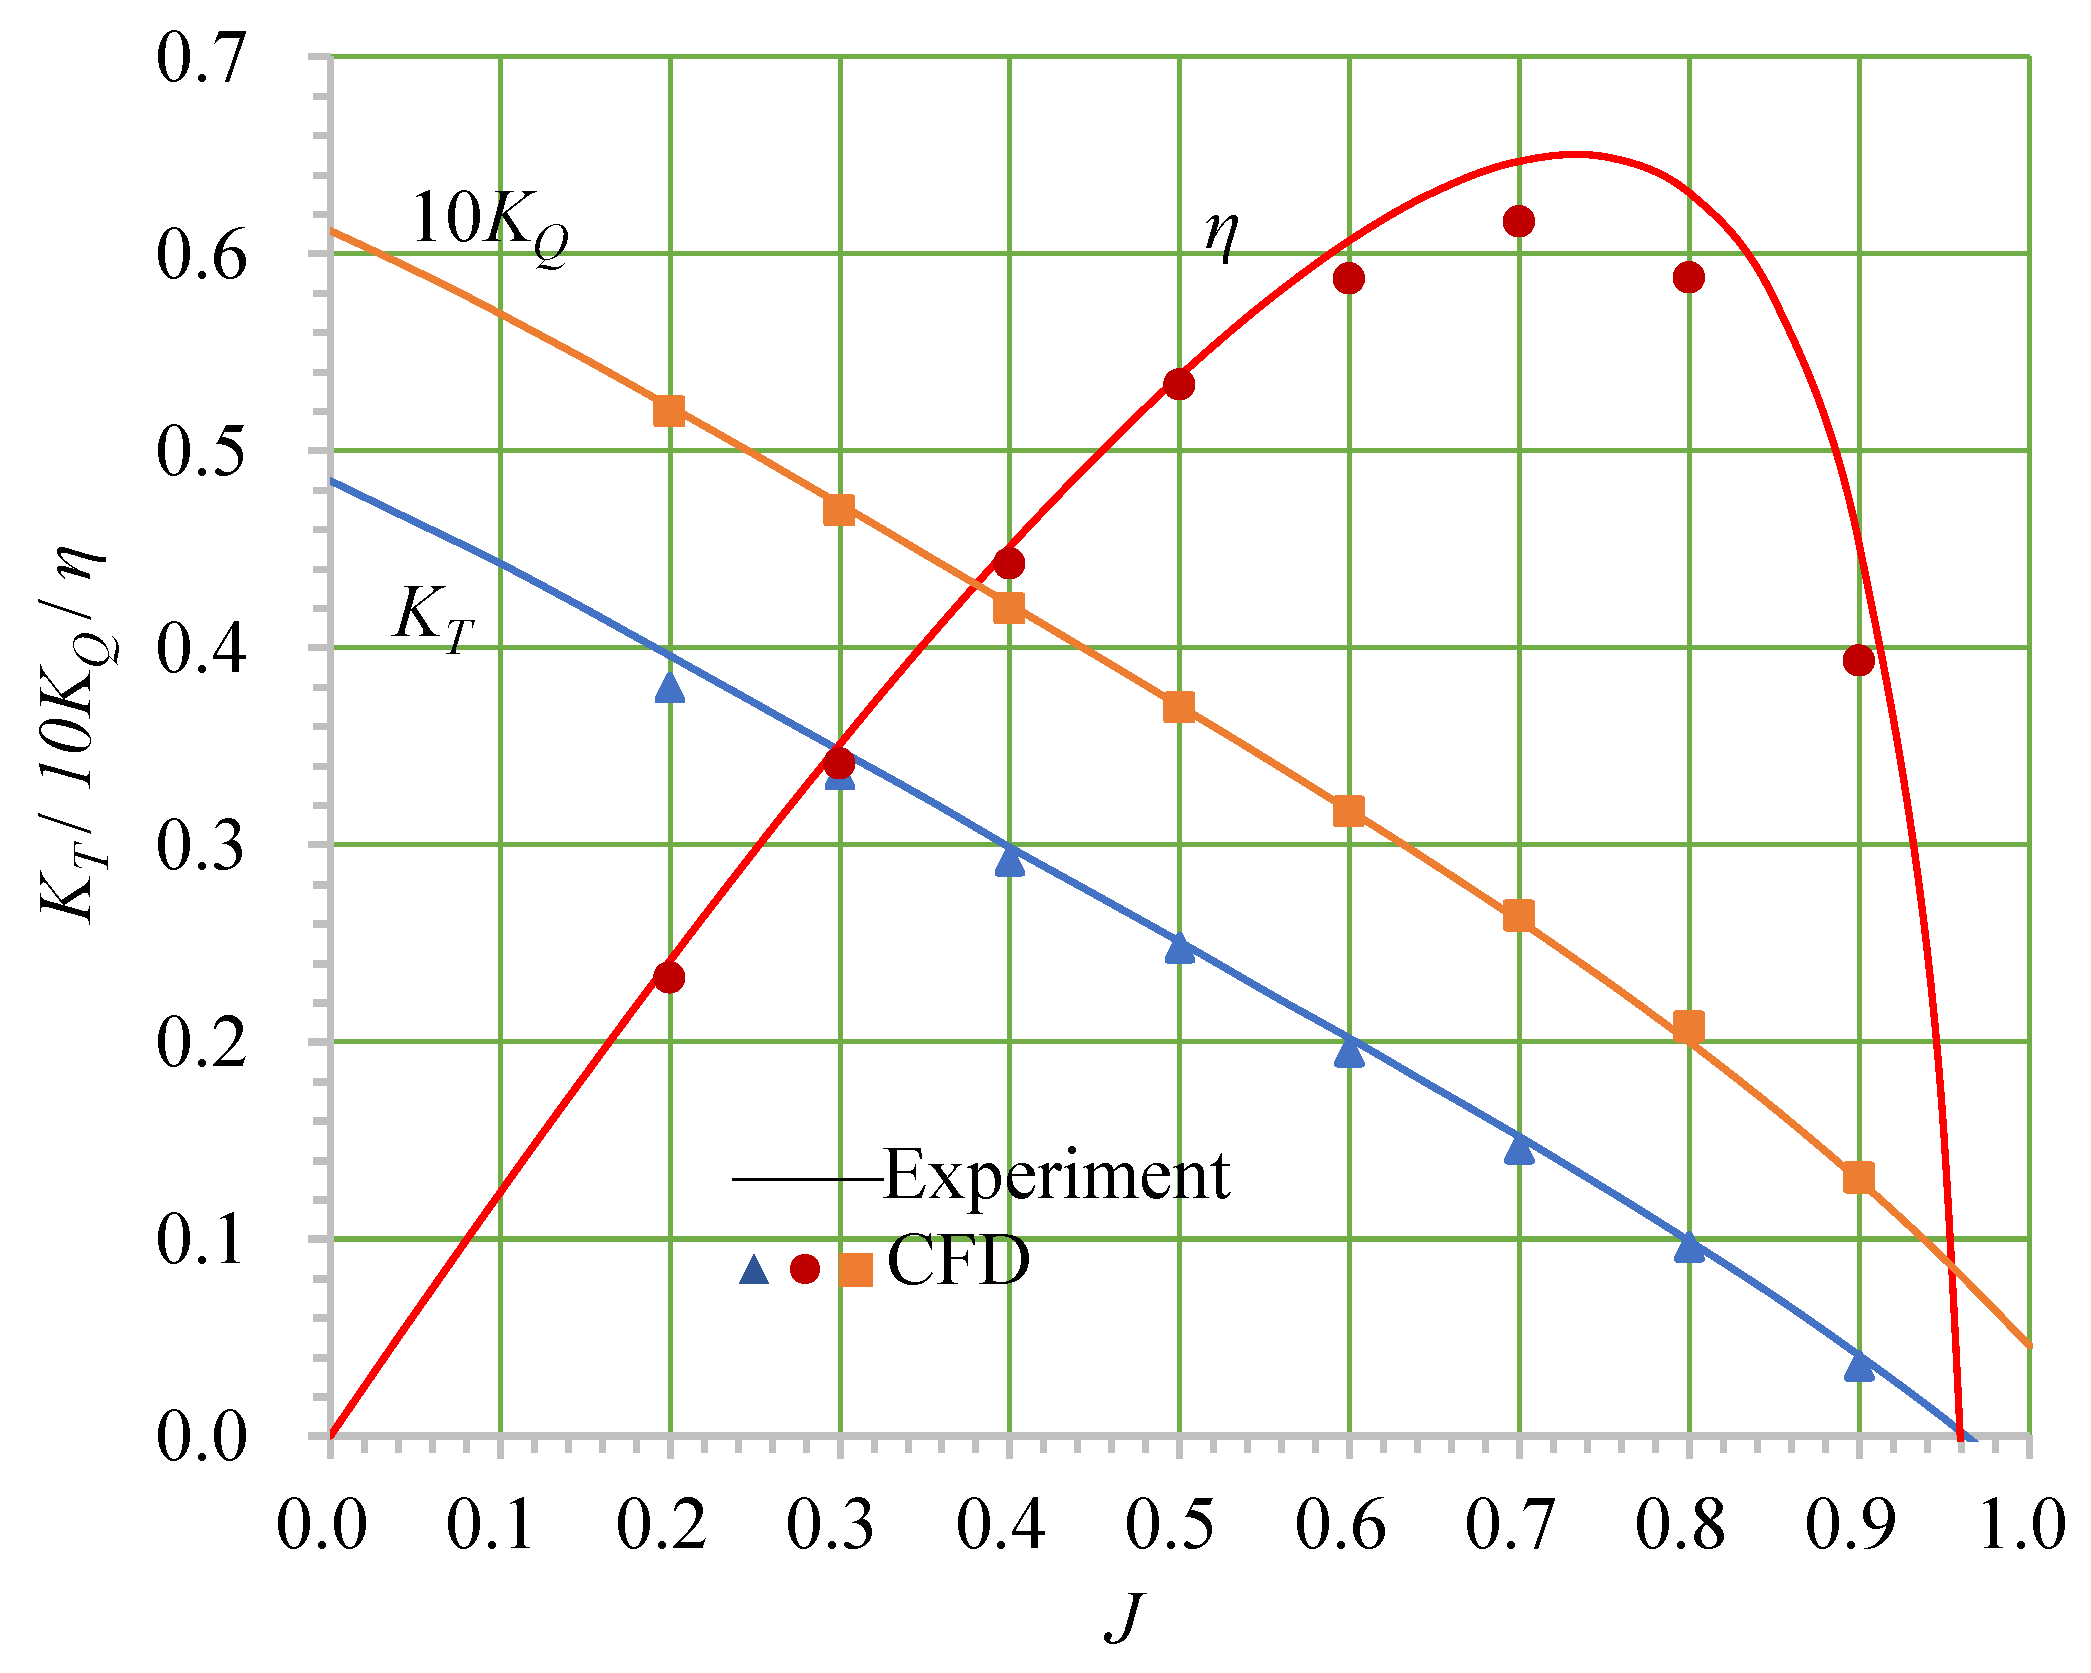
Figure 7 shows a comparison between the computed and experimental values of the open-water characteristics of the propeller. The calculated thrust coefficient K T was slightly smaller than that obtained by the tests. Additionally, the calculated torque coefficient K Q was slightly smaller than the test value at low R n , but was larger than the test value at high R n . When J < 0.7, the calculated propeller efficiency was consistent with the test value, and the error was less than 5%. When J > 0.7, the error increased but remained within an acceptable range.

3.5. Resistance Simulation

The resistance coefficient C t s for a full-scale ship is expressed as [19]
C t s = C t m + ( 1 + k ) ( C f s C f m ) + Δ C f ,
where
C t = R t / ( ρ S V 2 / 2 ) C f = 0.075 / ( lg R n 2 ) 2 Δ C f = [ 105 ( k s / L ) 1 / 3 0.64 ] × 10 3 ,
where C t is the resistance coefficient, R t is the resistance of the full-scale ship, ρ is the density of the fluid, S is the wetted surface of the full-scale ship, V is the speed of the full-scale ship, ( 1 + k ) is the form factor, C f is the friction resistance coefficient, Δ C f is the roughness coefficient, ks is the surface roughness, and the subscripts s and m indicate the full-scale ship and test model, respectively.
In the resistance simulations for this cruise ship, the basic grid size was adjusted to generate different numbers of grids with the same topological structure, which were denoted as G1, G2, and G3 according to the grid density. Based on these three sets of grids, the calculated cruise ship resistance was Fn = 0.25 (design speed). The results are shown in Table 2. The grid convergence verification method was based on the process described by Wilson et al. [24]. The convergence ratio R G can be calculated as
R G = = S f S m S m S c ,
where S f , S m , and S c represent the calculation results corresponding to the fine, medium, and coarse grids, respectively.
The estimated order of accuracy P R E is expressed as
P R E = ln S m S c / S f S m / ln ( r ) .
The distance metric to the asymmetric range P G is
P G = P R E / P t h ,
where P t h denotes the theoretical order of accuracy. The grid uncertainty is expressed as
U G = ( 2.45 0.85 P G ) S f S m r P R E 1 , 0 < P G 1 ( 16.4 P G 14.8 ) S f S m r P R E 1 , P G > 1 .
The calculated grid convergence ratio R G , distance metric to the asymmetric range P G , and grid uncertainty U G are listed in Table 3.
Table 2 indicates that the differences between the simulated resistances of the three sets of grids and their test values were less than 5%. In Table 3, the value of R G obtained via the simulations was less than 1, which indicated that the grid converged monotonically. The grid uncertainty U G was 5.825%D, where D is the corresponding experimental value. Overall, the results demonstrated excellent grid-convergence characteristics. The resistance tests and self-propulsion calculations in the next step were conducted using grid G1.

3.6. Traditional Self-Propulsion Simulation

A traditional self-propulsion simulation was executed based on the resistance simulation model. During the simulation, one half of the calculation domain was used. The size and boundary conditions of this calculation domain were identical to those used in the resistance simulation. A shaft and a propeller were added to the self-propulsion model. A rotation area was assigned around the propeller, and the propeller was rotated using sliding grids. The meshes, which were refined near the edges of the propeller, are shown in Figure 8. To ensure a sufficiently high simulation accuracy, two DOFs (pitch and heave) were allowed [25] during the simulation. The calculation results are shown in Table 4.

4. Results and Discussion

4.1. Free Running in Calm Water

Figure 9 shows the relative motion settings of the free-running simulation area. A local coordinate system was established at the hull. The forward speed of the hull was extracted and applied to the background calculation domain. Thus, the relative speed between the ship and calculation domain was held constant, which attained the true free running of the ship without enlarging the water domain.
Table 4 compares the calculated values of the traditional self-propulsion and free-running approaches tested in this study for a full-scale ship under hull–propeller–rudder coupling conditions when Fn = 0.241 (design speed). The differences between the simulation and model test values for the propulsion force and ship velocity were +2.50% and −0.73%, respectively, which satisfied the calculation accuracy requirements. The lower ship speed and larger propulsion force in the free-running approach may have been caused by the scale effect exhibited during the extrapolation of the model tests. A comparison between the average values of the pitch and heave angles revealed that the errors between the free-running simulation and tank test were −4.28% and +6.84%, respectively; thus, their calculation accuracies were acceptable.
Figure 10 shows the free-wave surfaces generated by the free-running and traditional self-propulsion simulation methods at t = 270 s; the figure indicates that they exhibited minimal differences. Figure 11 compares the time history curves of the ship’s pitch and heave motions generated by the two methods. The figure shows that the calculation results of the two methods were very similar, but the ship motion curves obtained by the traditional self-propulsion method fluctuated significantly. The free-running method almost completely converged at approximately 250 s, but the traditional self-propulsion method required more time to converge. Therefore, when modeling full-scale self-propulsion, the free-running method can save more time and reduce the calculation costs.

4.2. Free Running in Waves

4.2.1. Wave Model

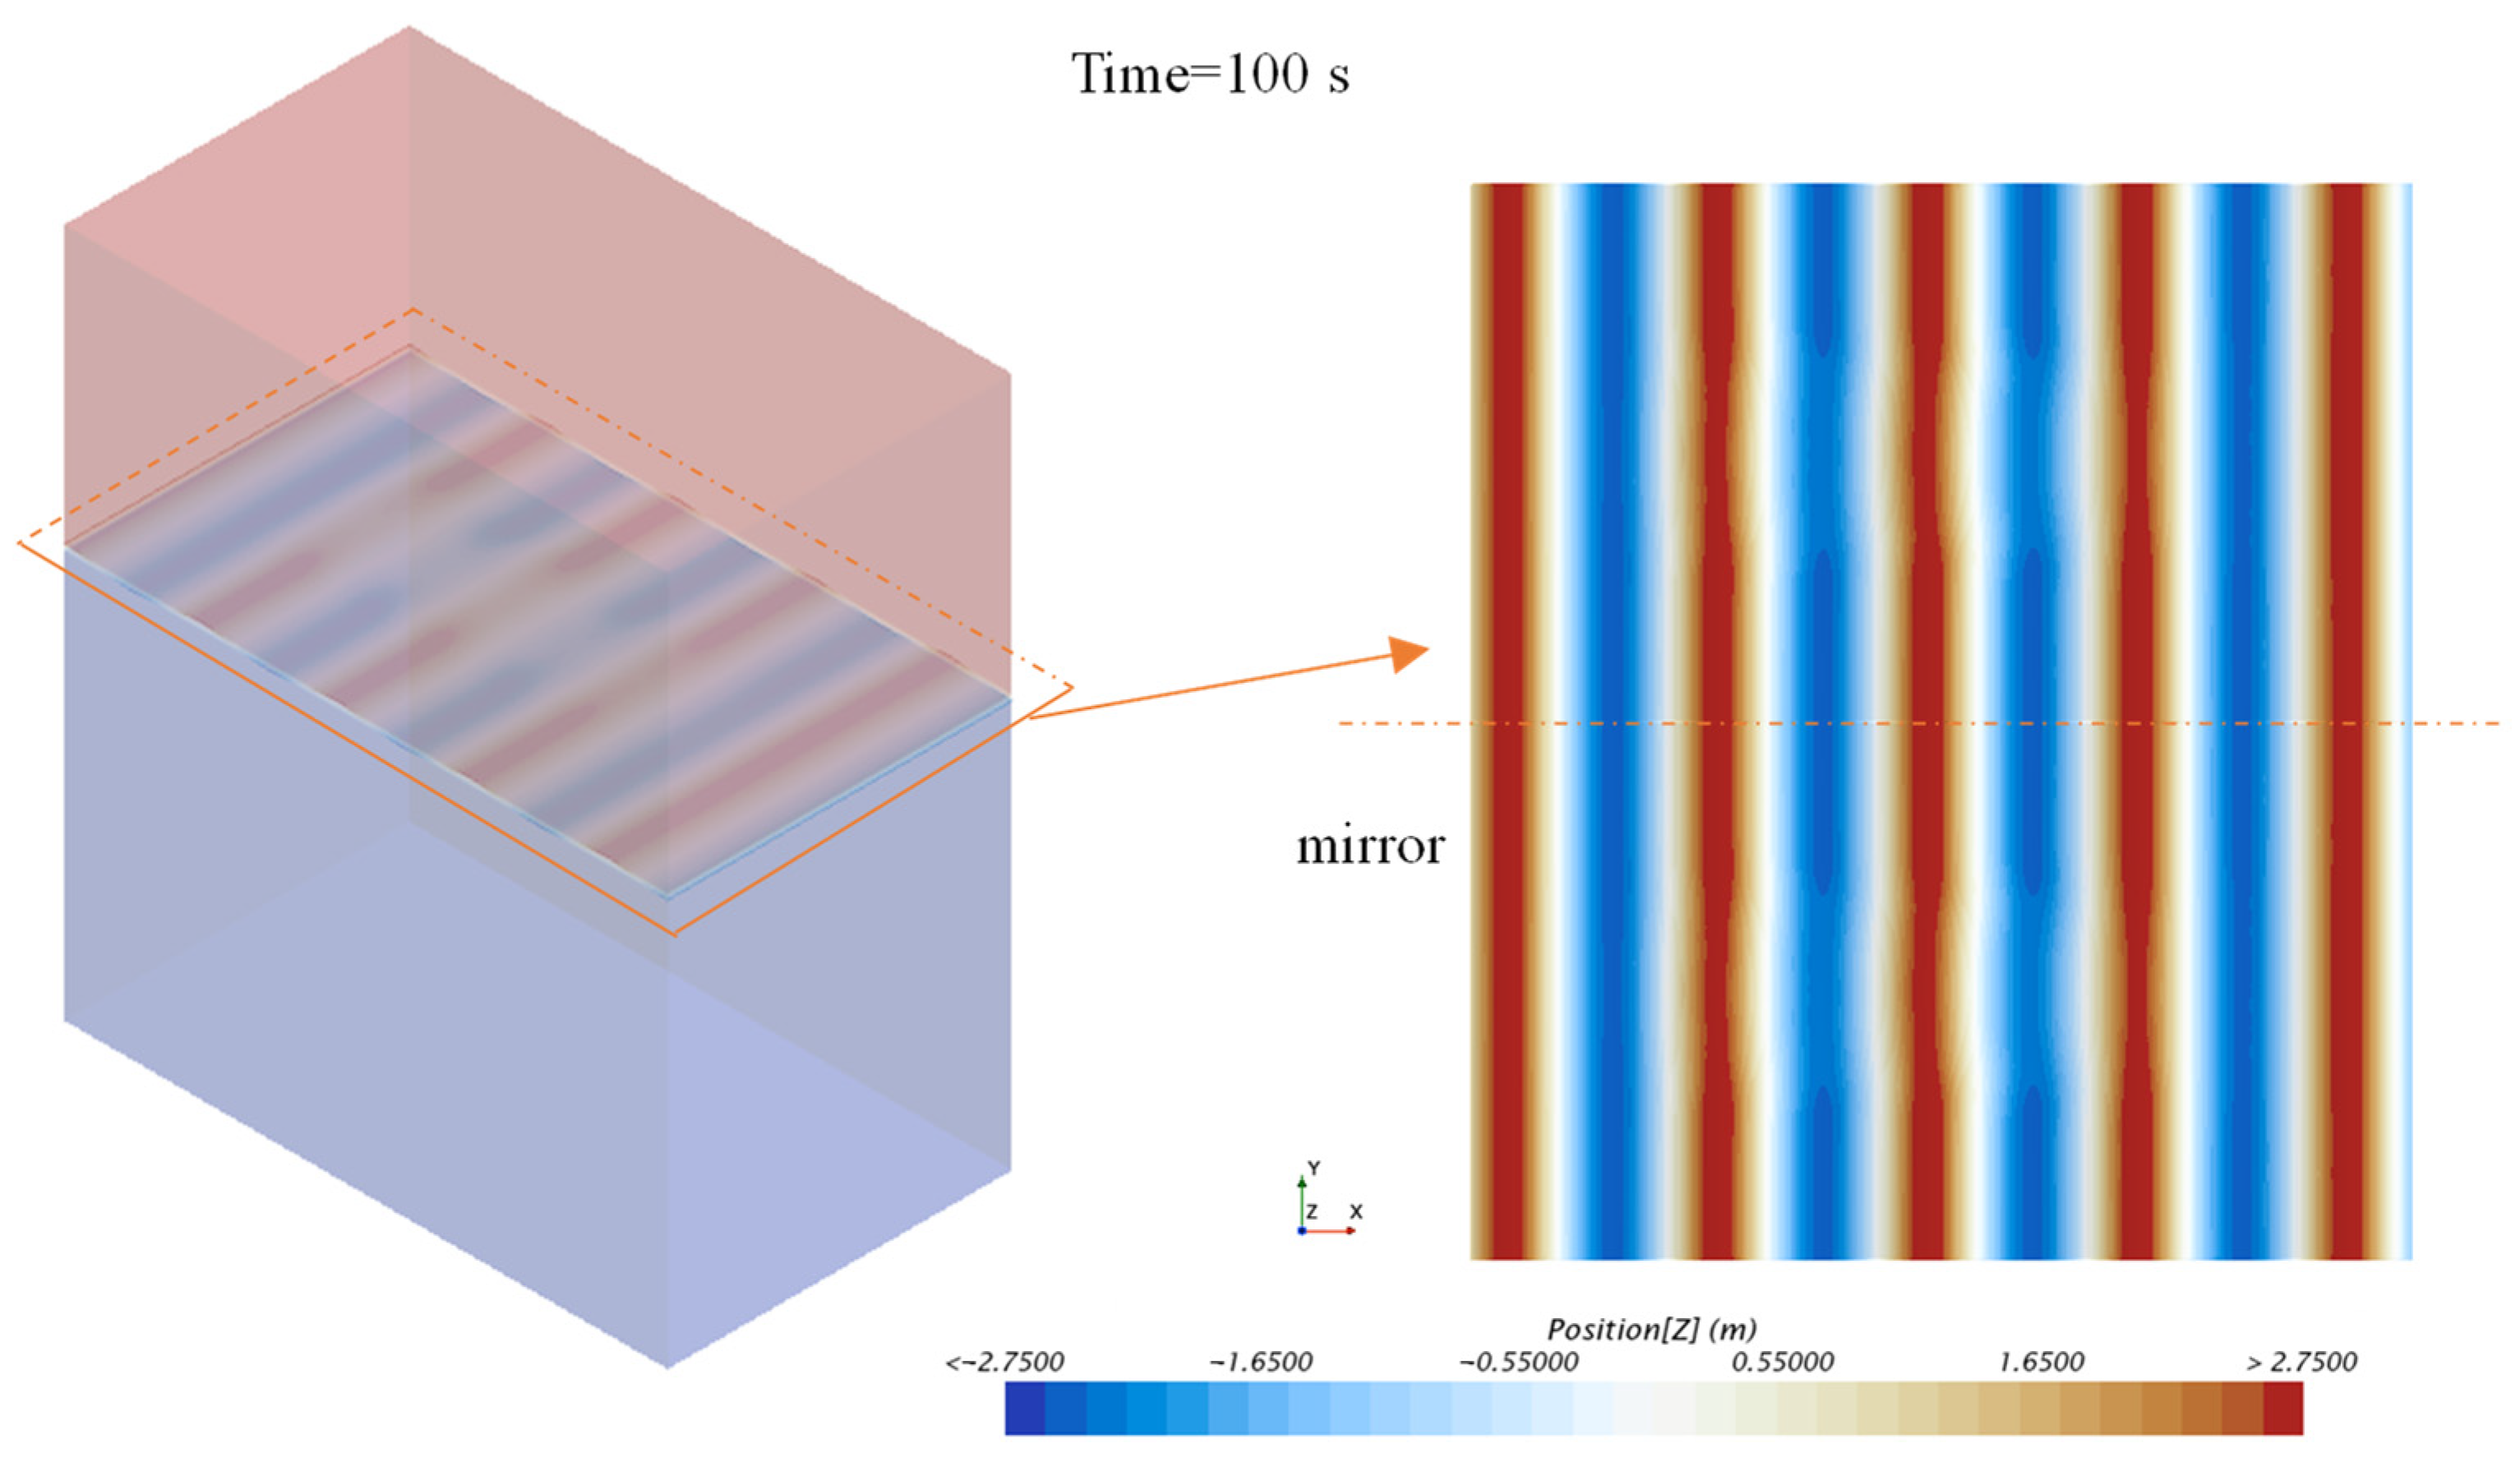
The wave was modeled using the fifth-order Stokes wave theory. The boundary condition settings of the domain were the same as those in the resistance and self-propulsion simulations. Similarly, wave forcing was applied at the boundaries of the inlet, sides, and outlet to force the incident wave to maintain its height. The results of the wave generation for the entire calculation domain are shown in Figure 12. The left panel shows the wave surface of the half domain, and the right panel shows the free surface of the wave height. The wave height calculated by the CFD simulation was 5.5 m, and the origin of the wave surface’s elevation was fixed at the draft position. Figure 12 shows the effect of the wave height after approximately 100 s. According to the figure, the wave simulation was accurate. The wave height of the free surface at the entrance of the domain was monitored, and a comparison between the theoretically calculated values demonstrated that they were consistent, as shown in Figure 13. The data displayed in Table 5 indicate that the errors between the CFD simulations and theoretical calculations were acceptably small (within 3%), which are similar to the reference [26].

4.2.2. Calculation Conditions

During the CFD simulations of the full-scale cruise ship’s self-propulsion characteristics in head waves, 3DOF semi-captive conditions (free-to-heave, surge, and pitch) were considered. To generate different wind and sea conditions, the maximum wave heights under conditions with wind levels 6 and 7 were adopted [27]. Head wave simulations were carried out using waves with amplitudes of H/Lwl = 0.025, 0.030, and 0.040 and wavelengths of λ/Lwl = 0.8 and 1.2. In total, six different wave states were calculated. The typical parameters of the simulation conditions are displayed in Table 6. The variable V0 is the ship’s estimated speed in the sea; it can be simplified via wave-added resistance analysis using
R i = k V i 2 ,
where Ri is the resistance under condition i with speed Vi, and k is the ratio parameter. Assuming k is a constant, when the resistance is obtained, the speed can be approximated as
V 2 = V 1 R 2 R 1 .
The initial CFD calculation speed was estimated using the resistance calculation, which can reduce the calculation time required to balance the drag and thrust.

4.3. Motion Analysis

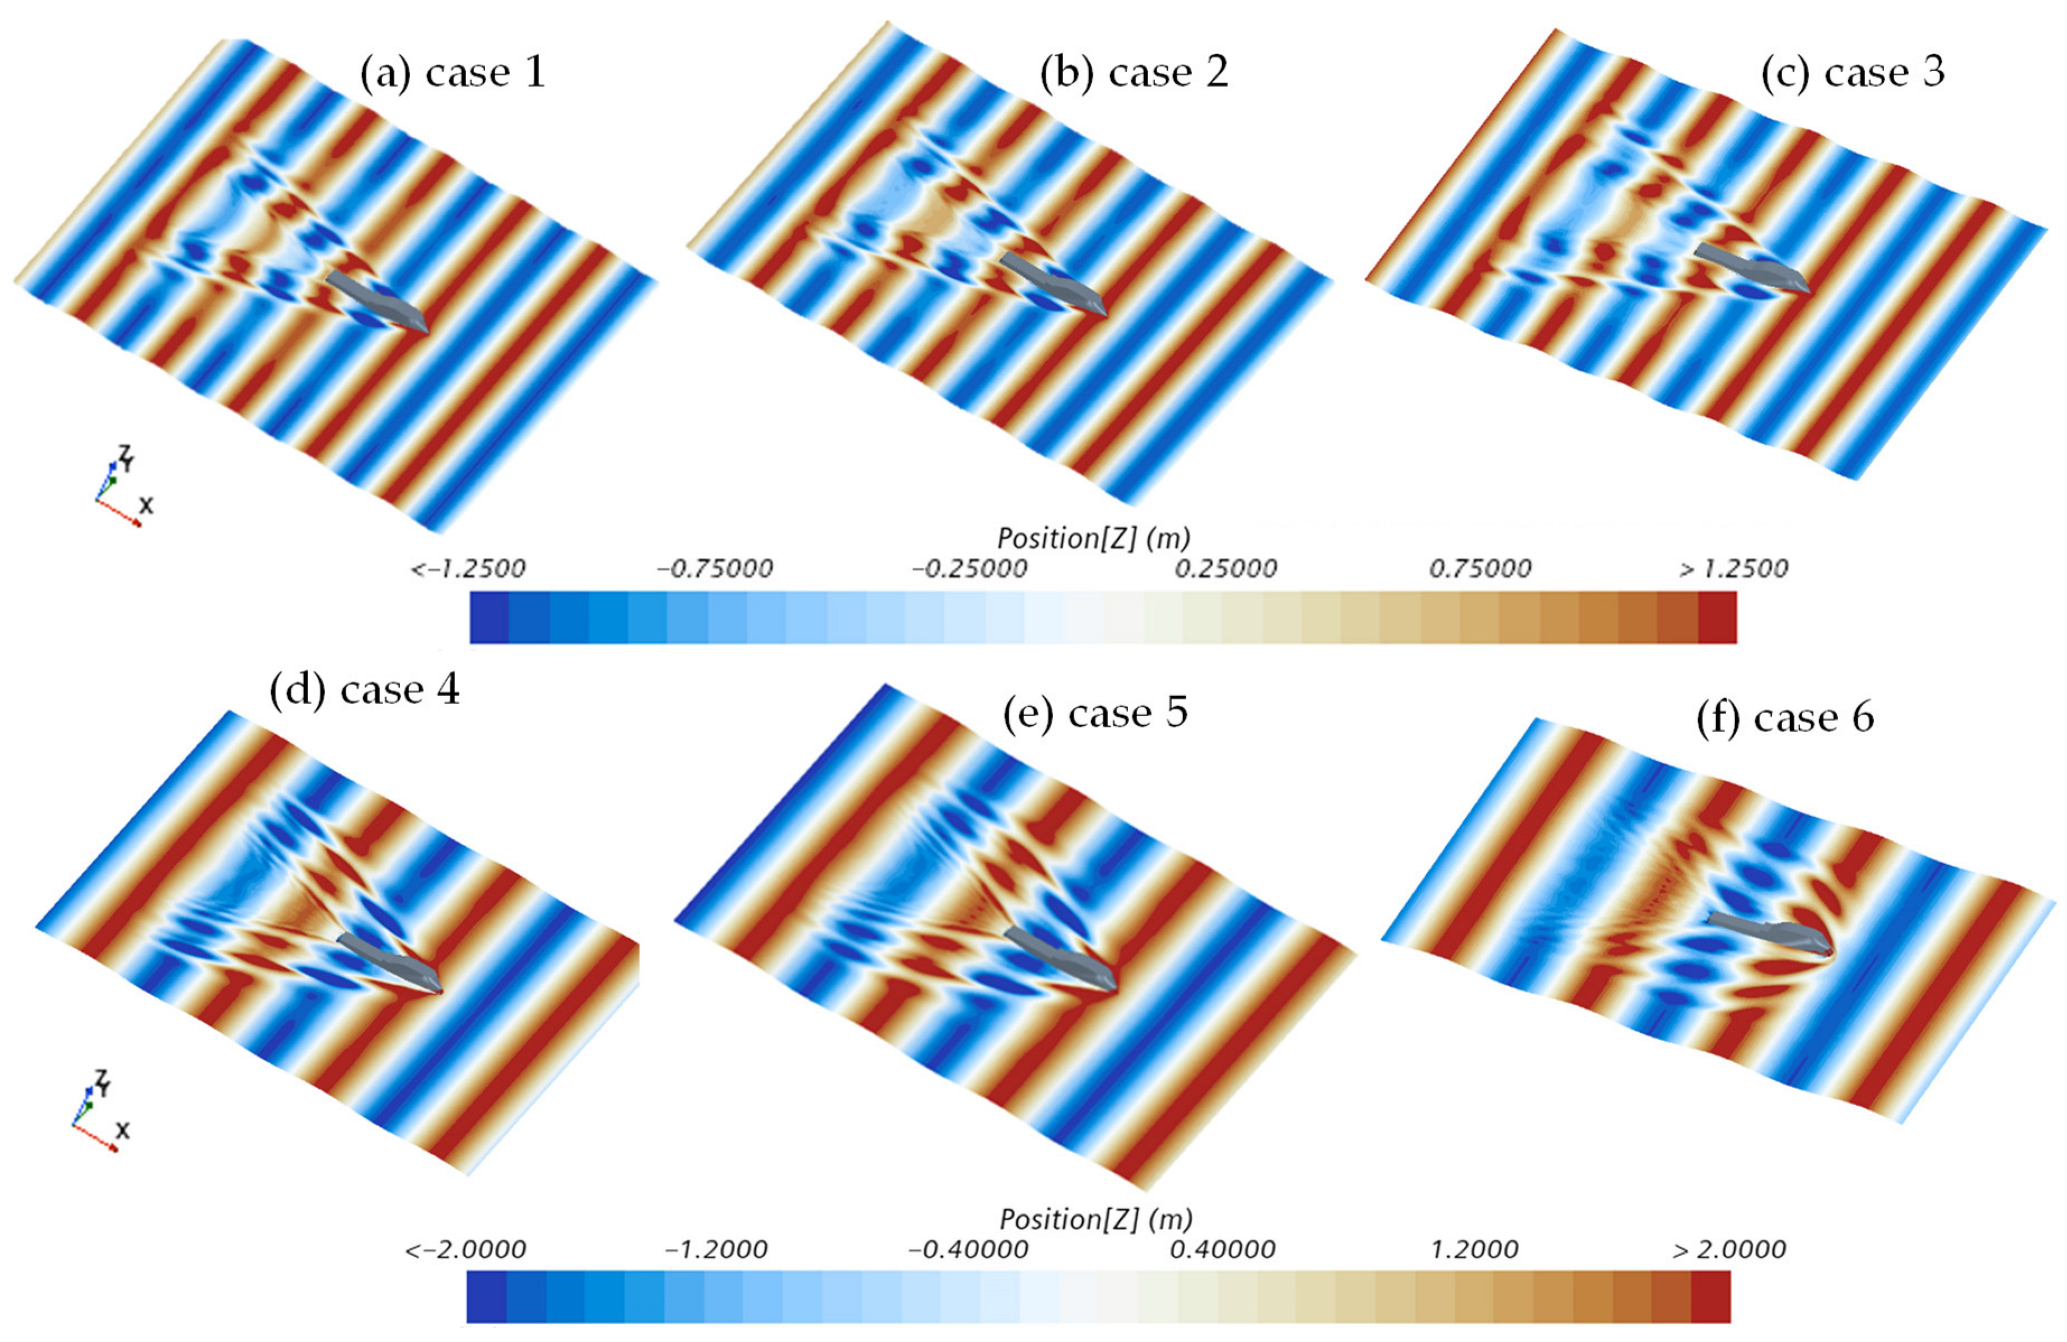
Figure 14 shows the free surfaces of the six wave conditions for a ship undergoing a head sea. For the same wavelength, the diffusion area of the bow wave system increased as the wave height increased. In particular, in case 6, for the increments in the wave height and wavelength encountered during the cruise, the outward diffusion angle of the waves on the side of the hull increased significantly, and the motion of the hull through the waves was clearly hampered. This indicated that the ship encountered greater resistance, and that it was difficult to move forward using the propeller at this rated speed.
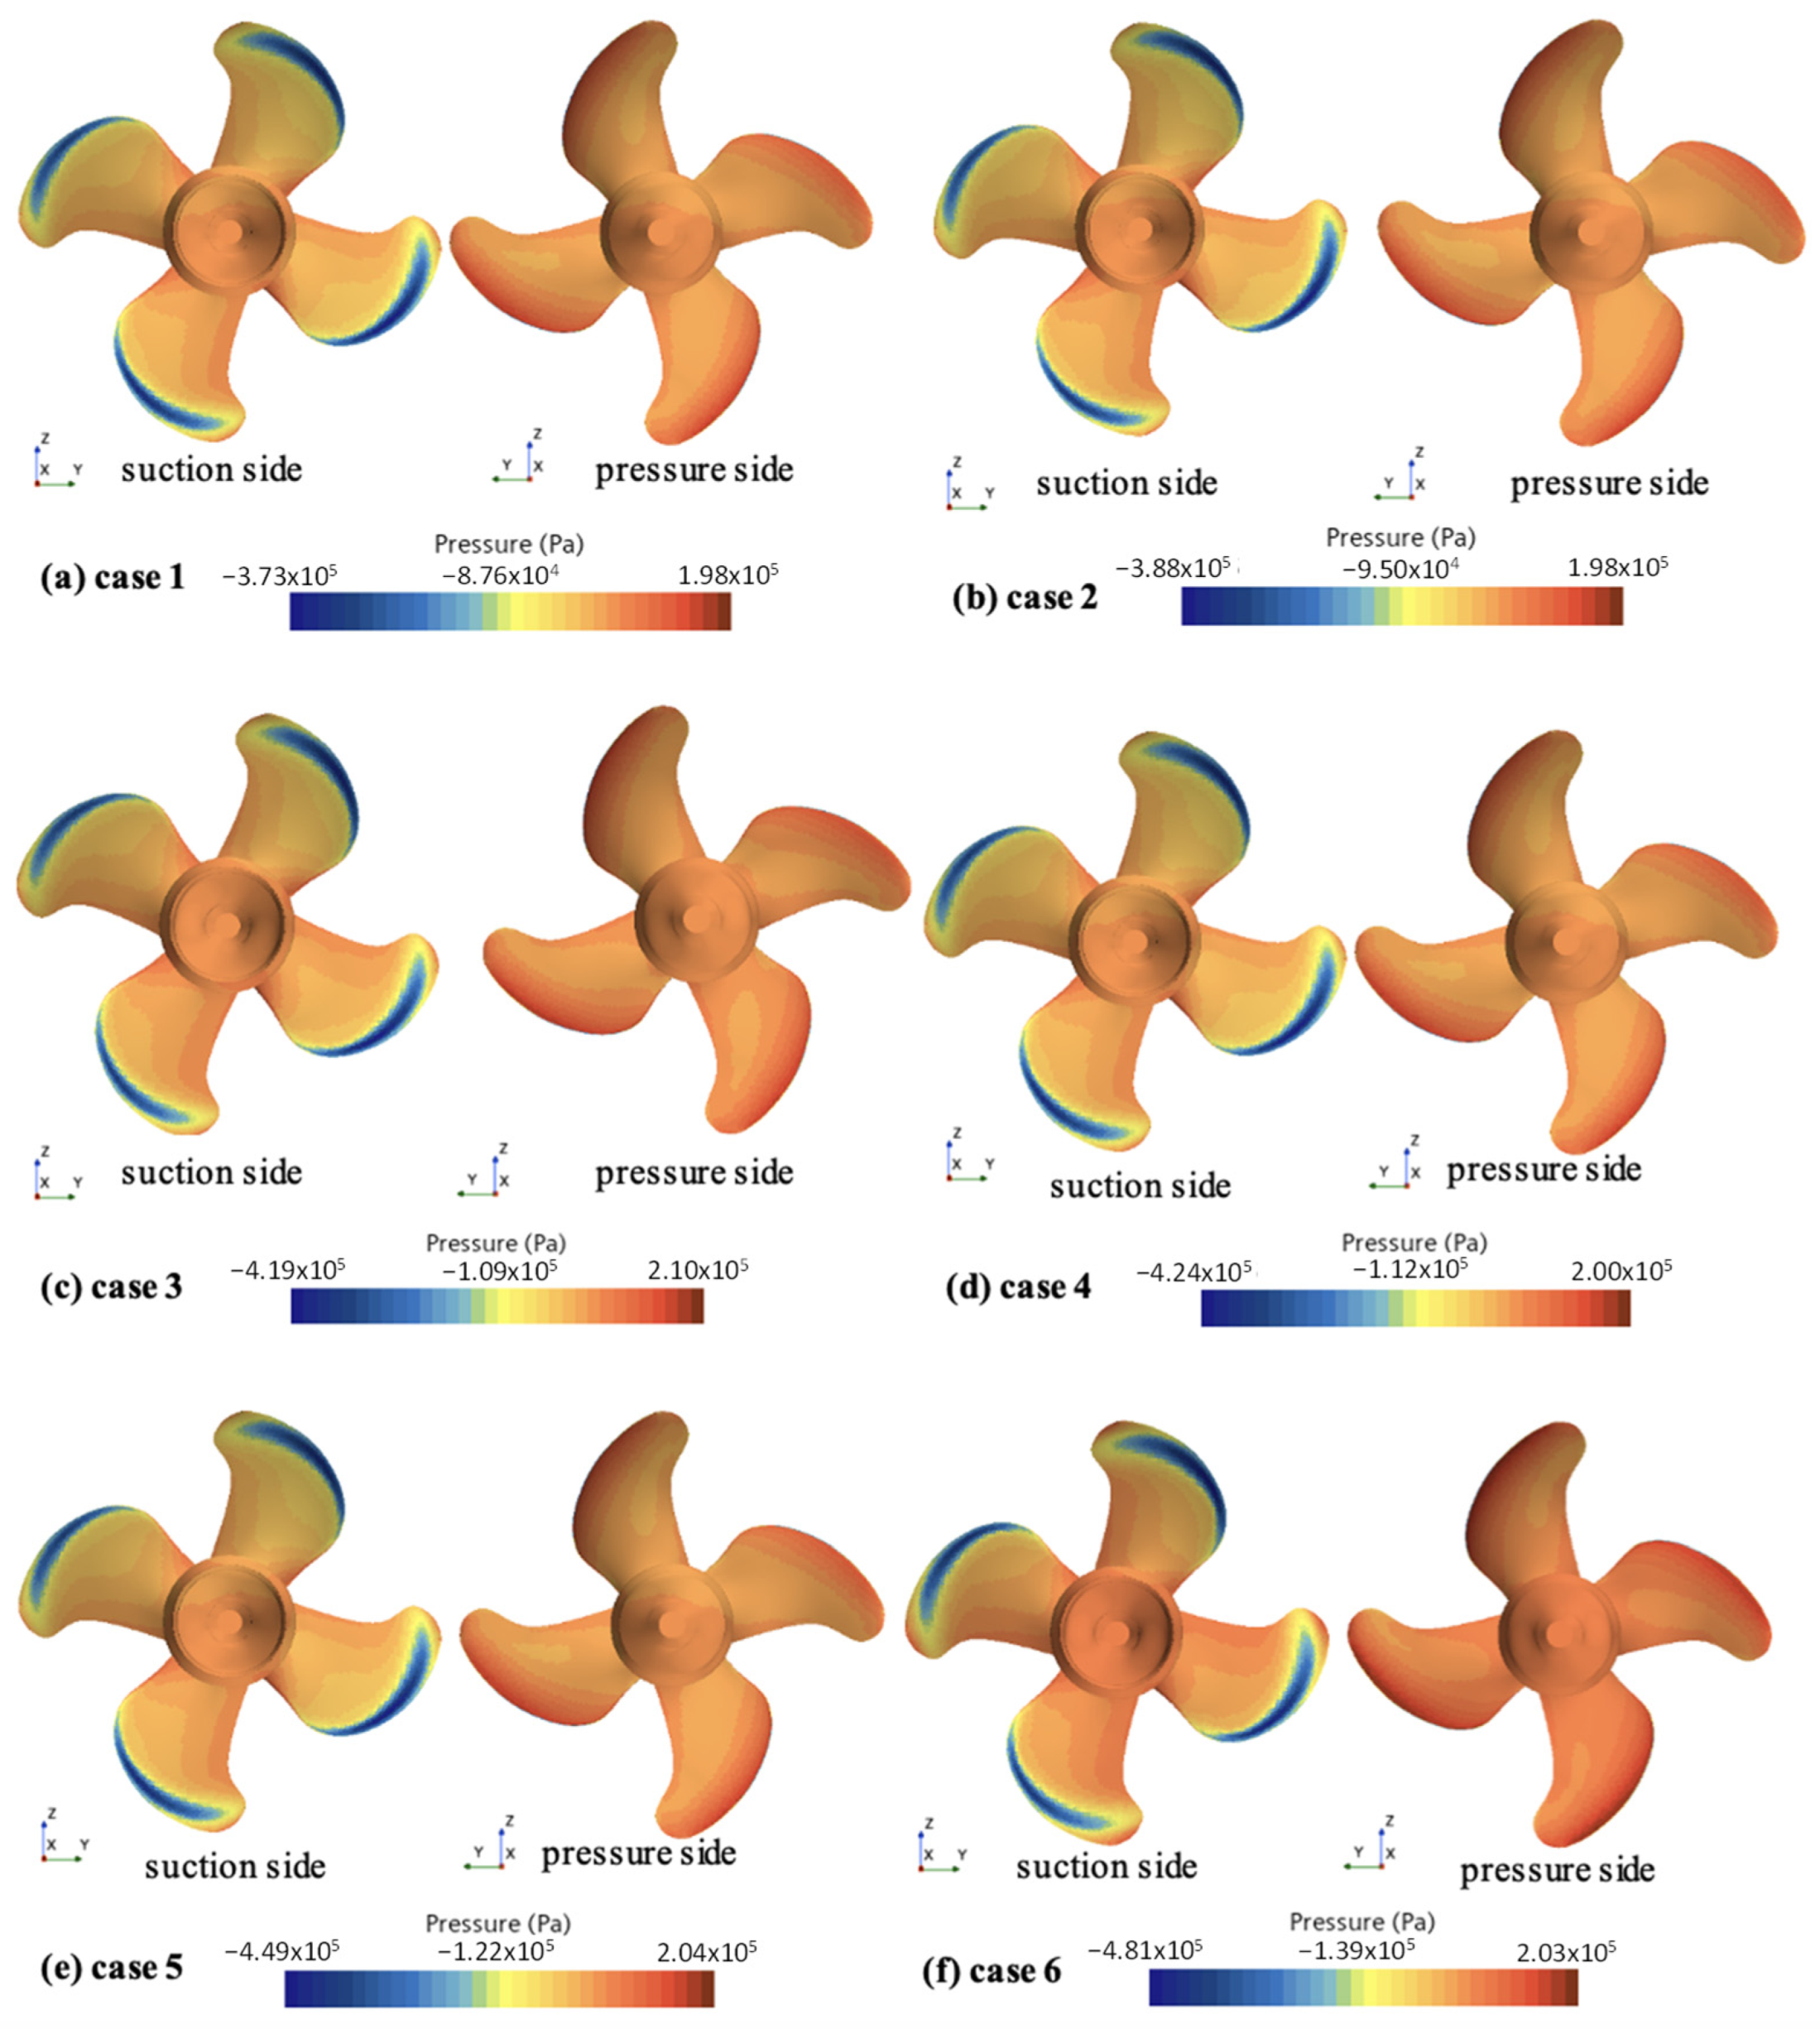
Figure 15 presents the loading distributions of the suction and pressure surfaces on the propeller under the six wave conditions. The pressure distributions on the propeller under all the conditions were similar; however, the maximum and minimum pressures were different. The maximum pressure was primarily concentrated at the edge of the suction surface of the propeller blade, whereas the minimum pressure was primarily concentrated at the edge of the pressure surface of the propeller blade. In addition, the low-stress area was slightly smaller than the high-stress area.
Table 7 shows the free-running calculation results under the six wave conditions and calm water. In the table, Vt is the average cruise speed after converging; Fnt is the Froude number under Vt; Vt-crest and Vt-trough are the crest and trough values of the ship’s speed after converging, respectively; t is the time at which the ship’s speed converges; T is the propeller thrust after the speed converges; Pmax and Pmin are the maximum and minimum surface pressures of the propeller after the speed converges; and ΔP is the maximum pressure difference (calculated as PmaxPmin). The table clearly shows that the initial speed V0 of the full-scale cruise ship was estimated more accurately and the ship’s speed converged faster. In addition, the smaller the final convergence speed Vt, the higher the corresponding propeller thrust T and minimum pressure Pmin. The values of T and the ΔP were higher when the ship encountered waves than when it traveled through calm water. The distributions of the maximum and minimum pressures under each condition were very similar; thus, the local pressure difference at the edge of the propeller blade was approximated using PmaxPmin. The data displayed in Table 7 indicate that as the wavelength and wave height increased, the pressure difference became increasingly large, which was consistent with the change in the propeller thrust. The greater the local pressure difference, the greater the loading of the local structure of the propeller. As a result of this pressure difference, the blade may deform.
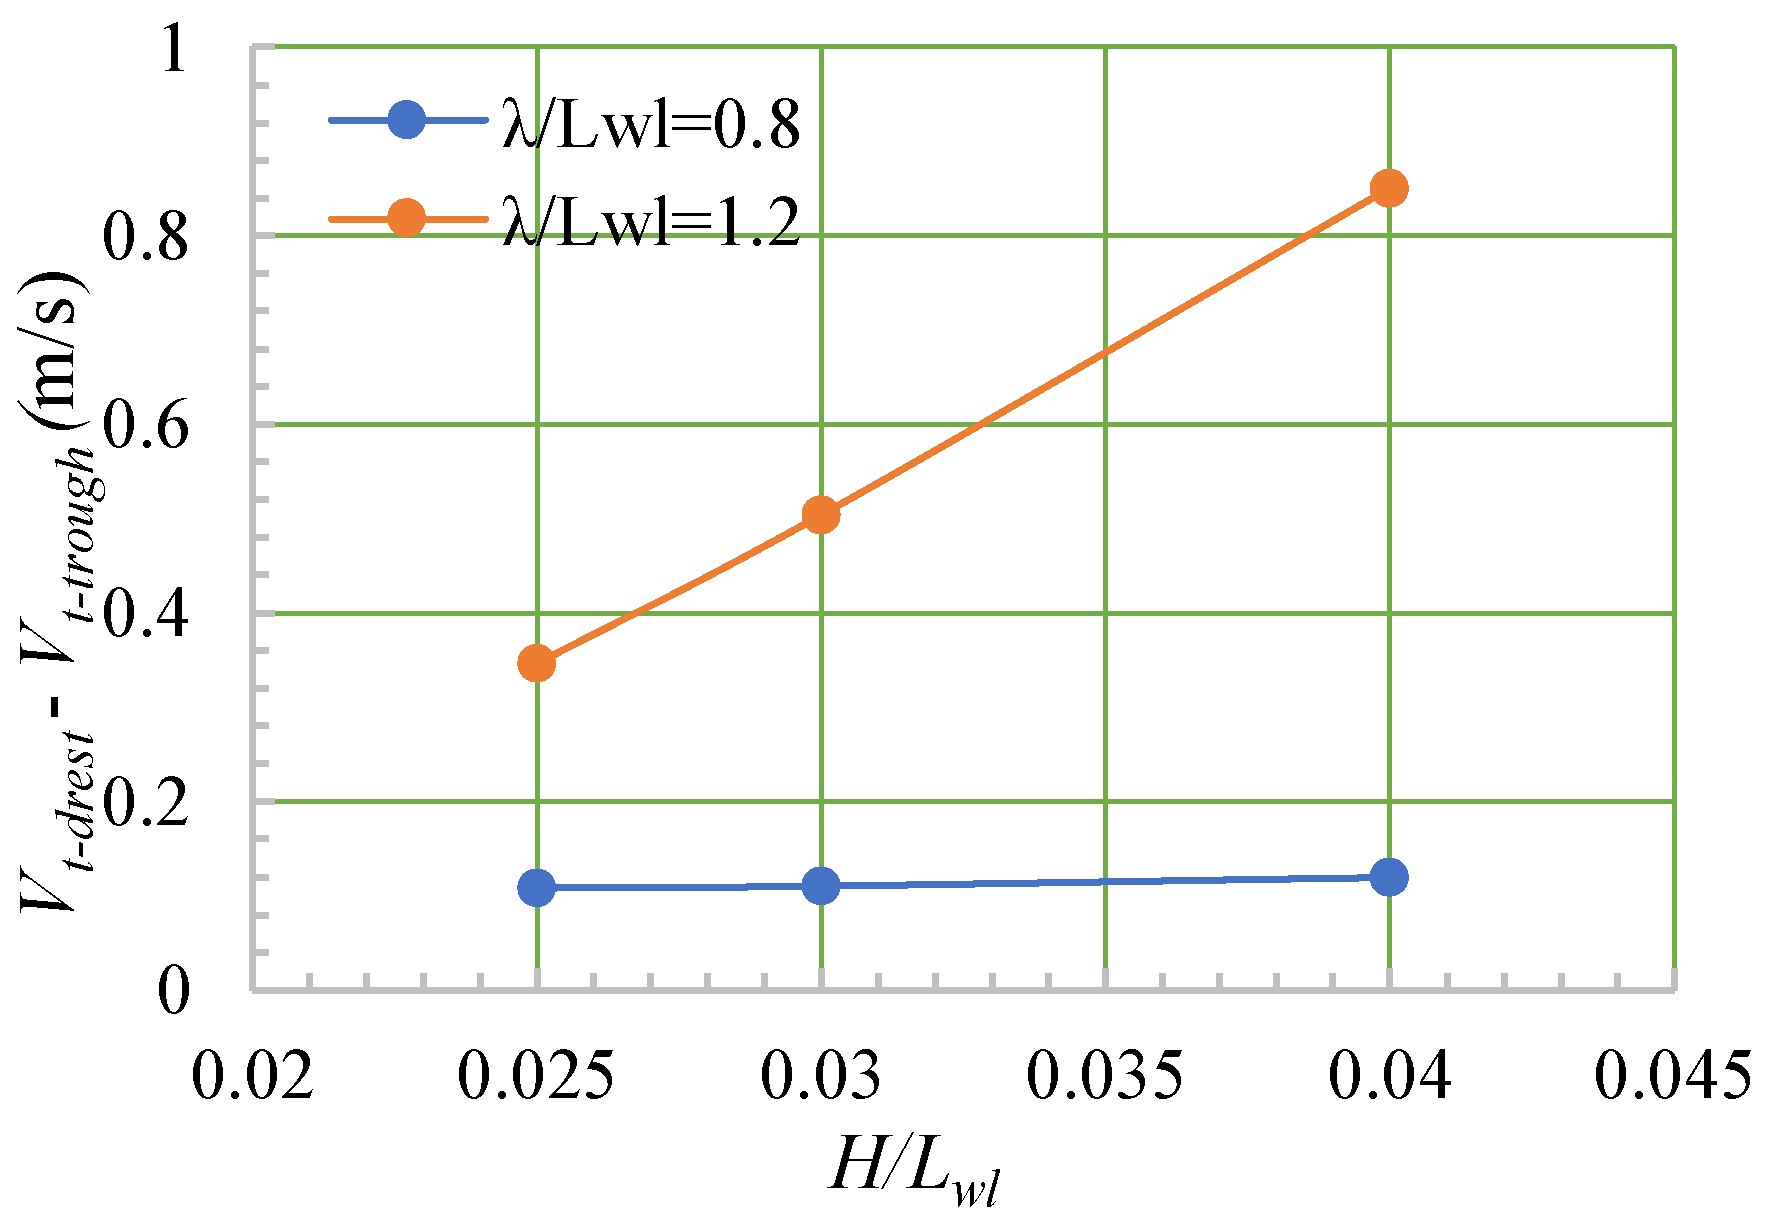
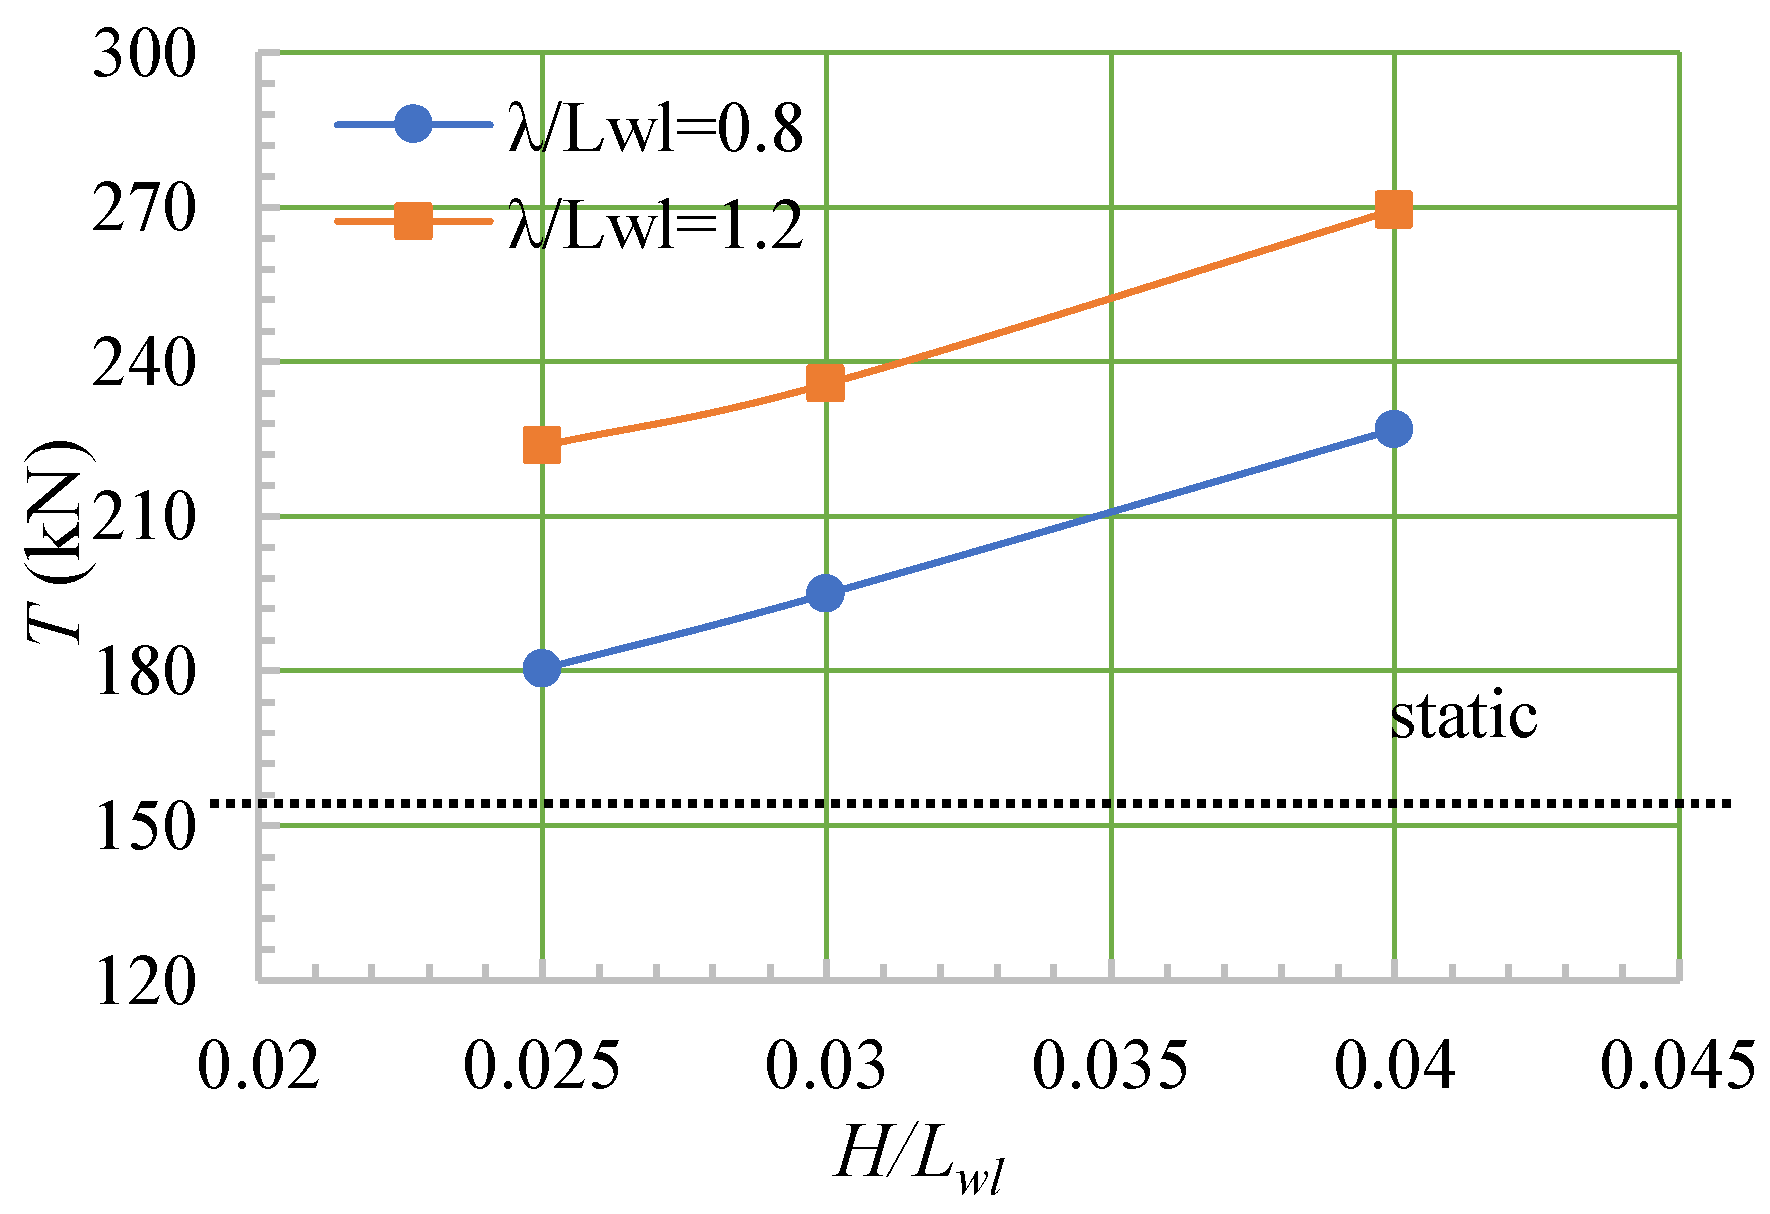
Figure 16 shows the change in speed as a function of the wave amplitude. When the wavelength was fixed, the ship speed decreased as the wave height increased. Similarly, when the wave height was fixed, the ship speed decreased as the wavelength increased. Figure 17 shows the amplitudes of the fluctuations in the ship’s speed. When the wavelength was fixed, the speed fluctuation amplitude increased as the wave height increased, and the larger the wavelength, the more significant the rate of change (the steeper the slope of the curve). When the wavelength was constant, the speed fluctuation amplitude increased as the wavelength increased. Figure 18 shows the thrust as a function of the wave amplitude, and Figure 19 shows the maximum pressure difference as a function of the wave amplitude. These two trends were similar; for the same wavelength, the larger the wave height, the larger the propeller thrust and maximum pressure difference. Similarly, for the same wave height, the larger the wavelength, the larger the thrust and maximum pressure difference. The thrust and pressure difference were much larger than those under static water conditions.
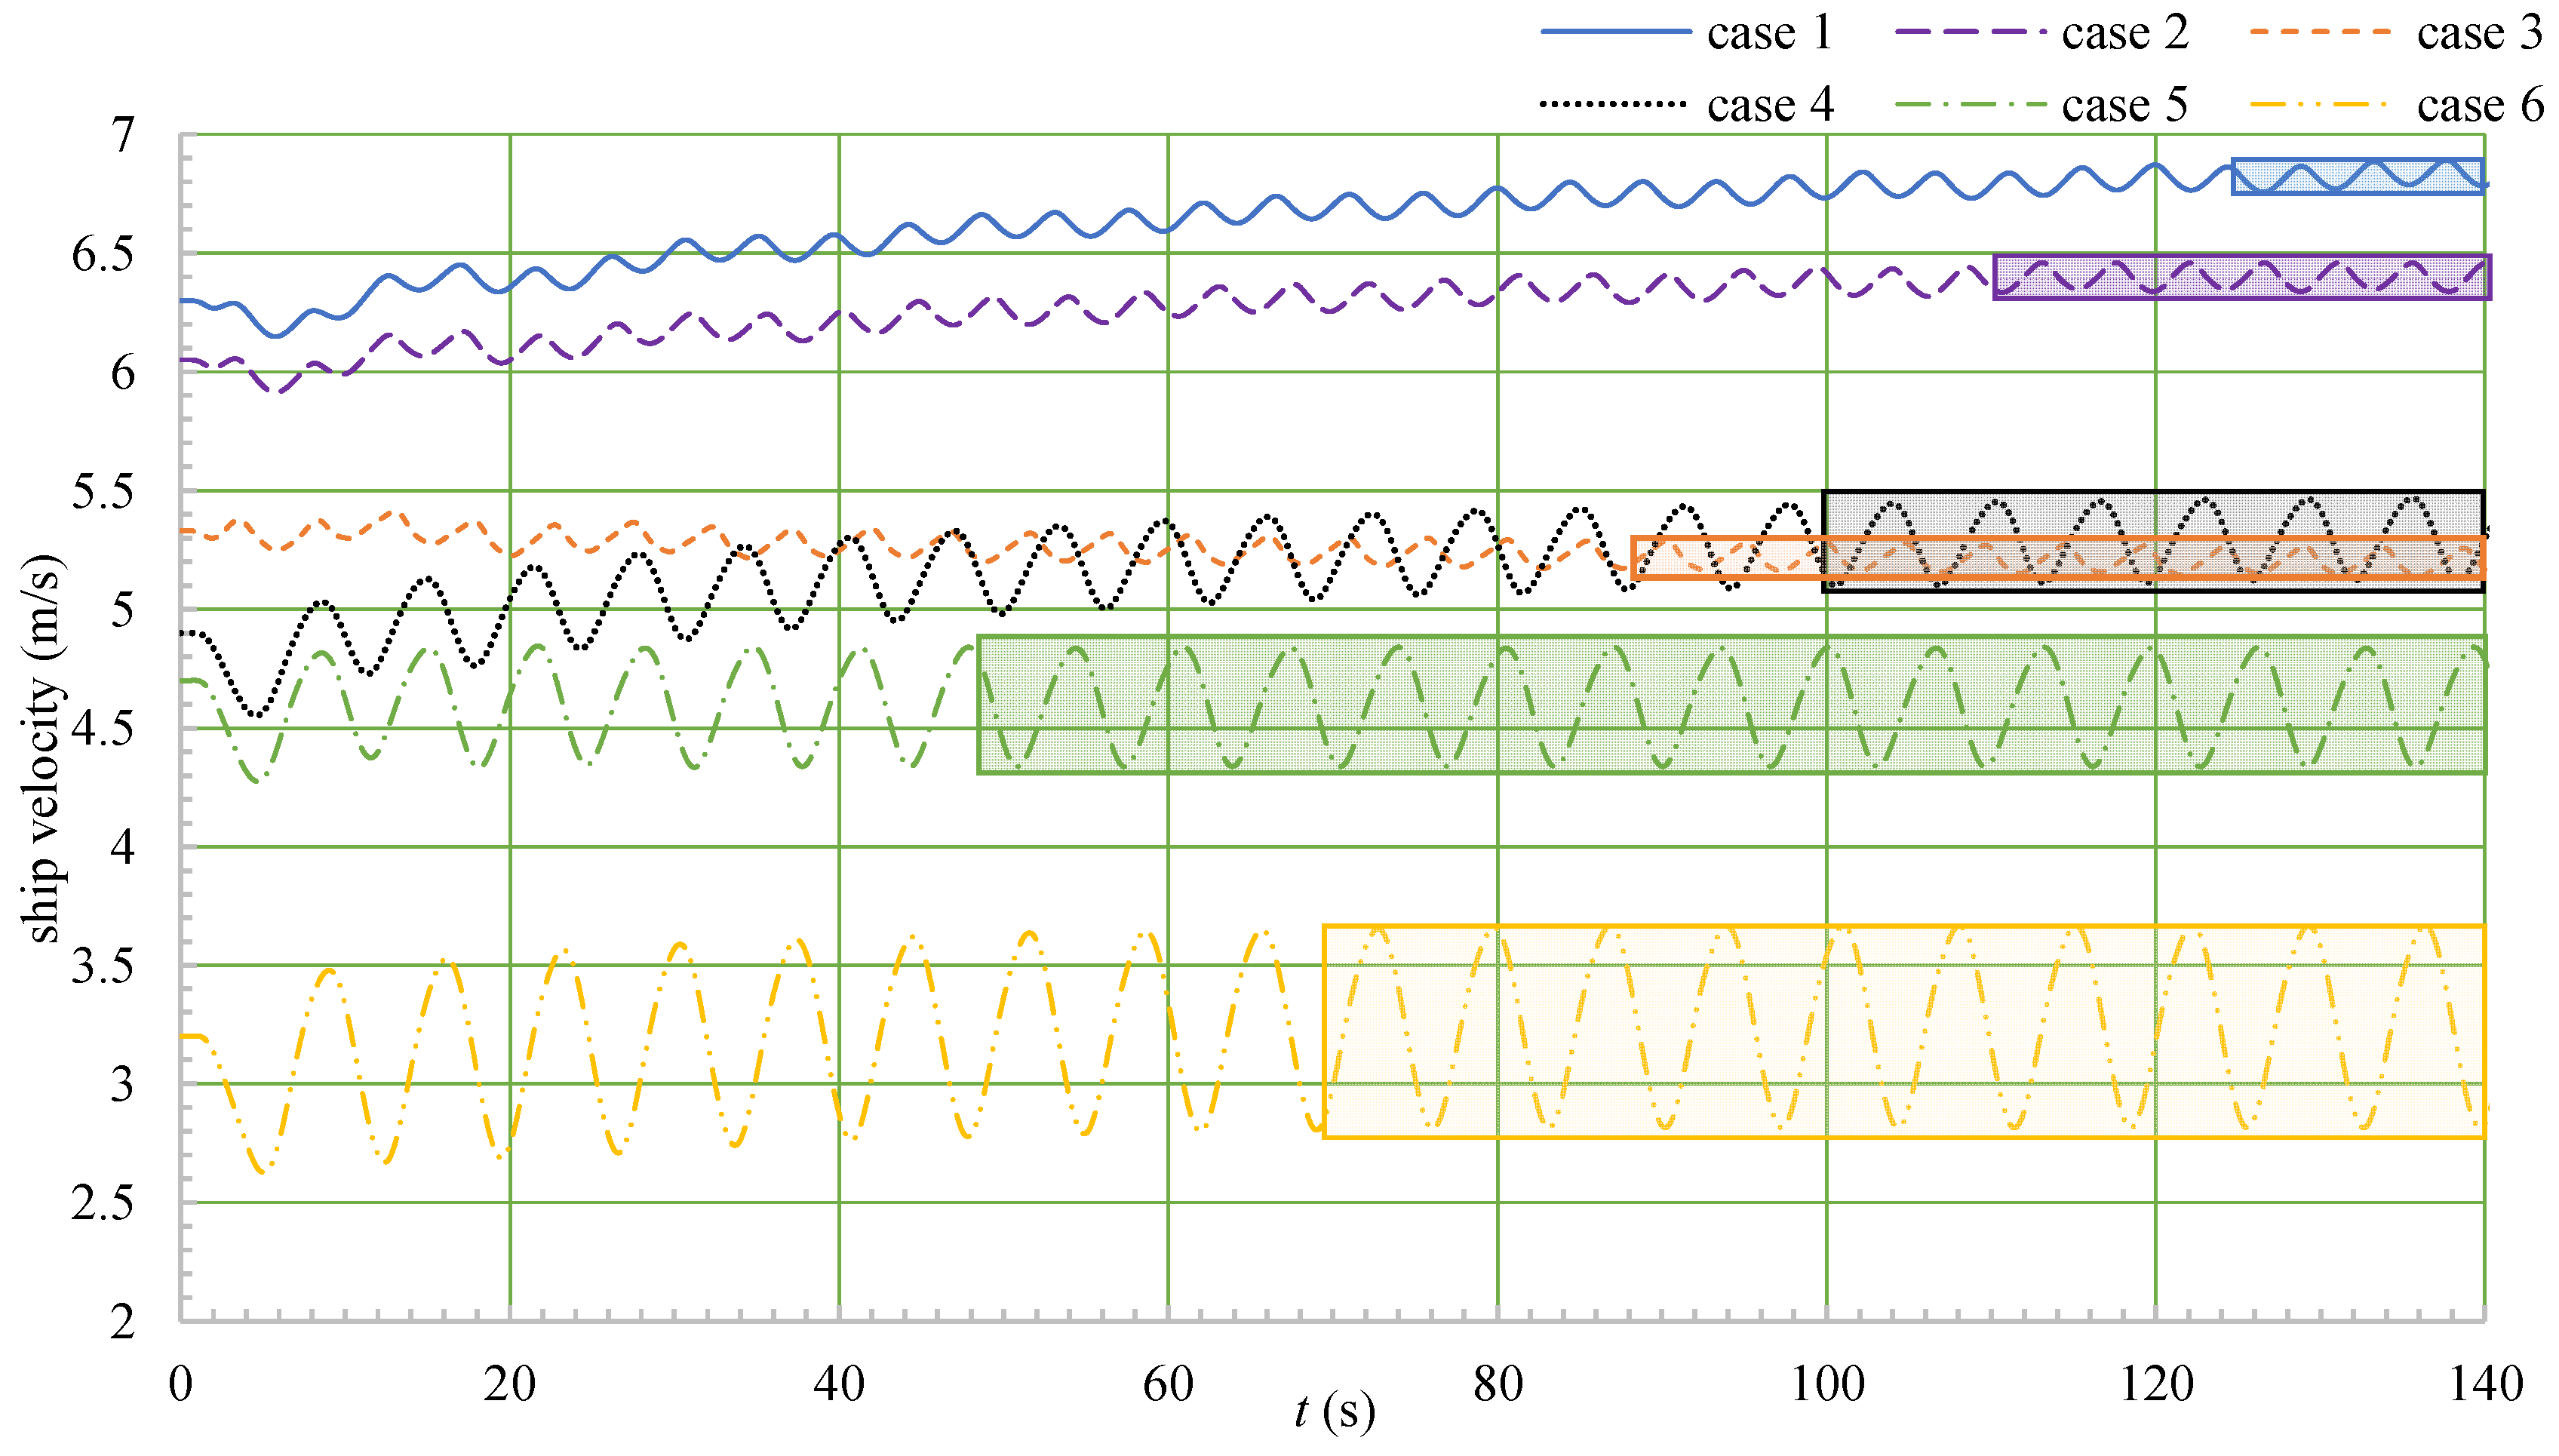
Figure 20 shows the convergence of the ship’s speed over time. The shaded regions indicate the time frames over which the speed reached a state characterized by relatively stable fluctuations. The average value of several periods was used as the convergence speed. The fluctuations in the speed strongly depended on the length and height of the wave encountered by the ship. According to the difference between Vt-crest and Vt-trough, the larger the wavelength and wave height, the greater the fluctuation amplitude of the speed after it converged. An extreme difference analysis was carried out on the speed fluctuations for the six cases, and the wave parameters λ/Lwl and H/Lwl were defined as the design variables (i.e., the variables to be tested). The parameter λ/Lwl had two levels and H/Lwl had three levels. The design variables and the corresponding levels are shown in Table 8. Table 9 shows the results of the extreme difference analysis, where Ki represents the sum of the test results of one factor at level i, Ki’ represents the mean value of Ki, and R is the extreme difference value (which is the mean value of the maximum Ki minus the minimum Ki, and is used to order the primary and secondary factors). The results of the extreme difference calculation indicated that the ratio λ/Lwl was the most important factor affecting the speed fluctuations, followed by the ratio H/Lwl.
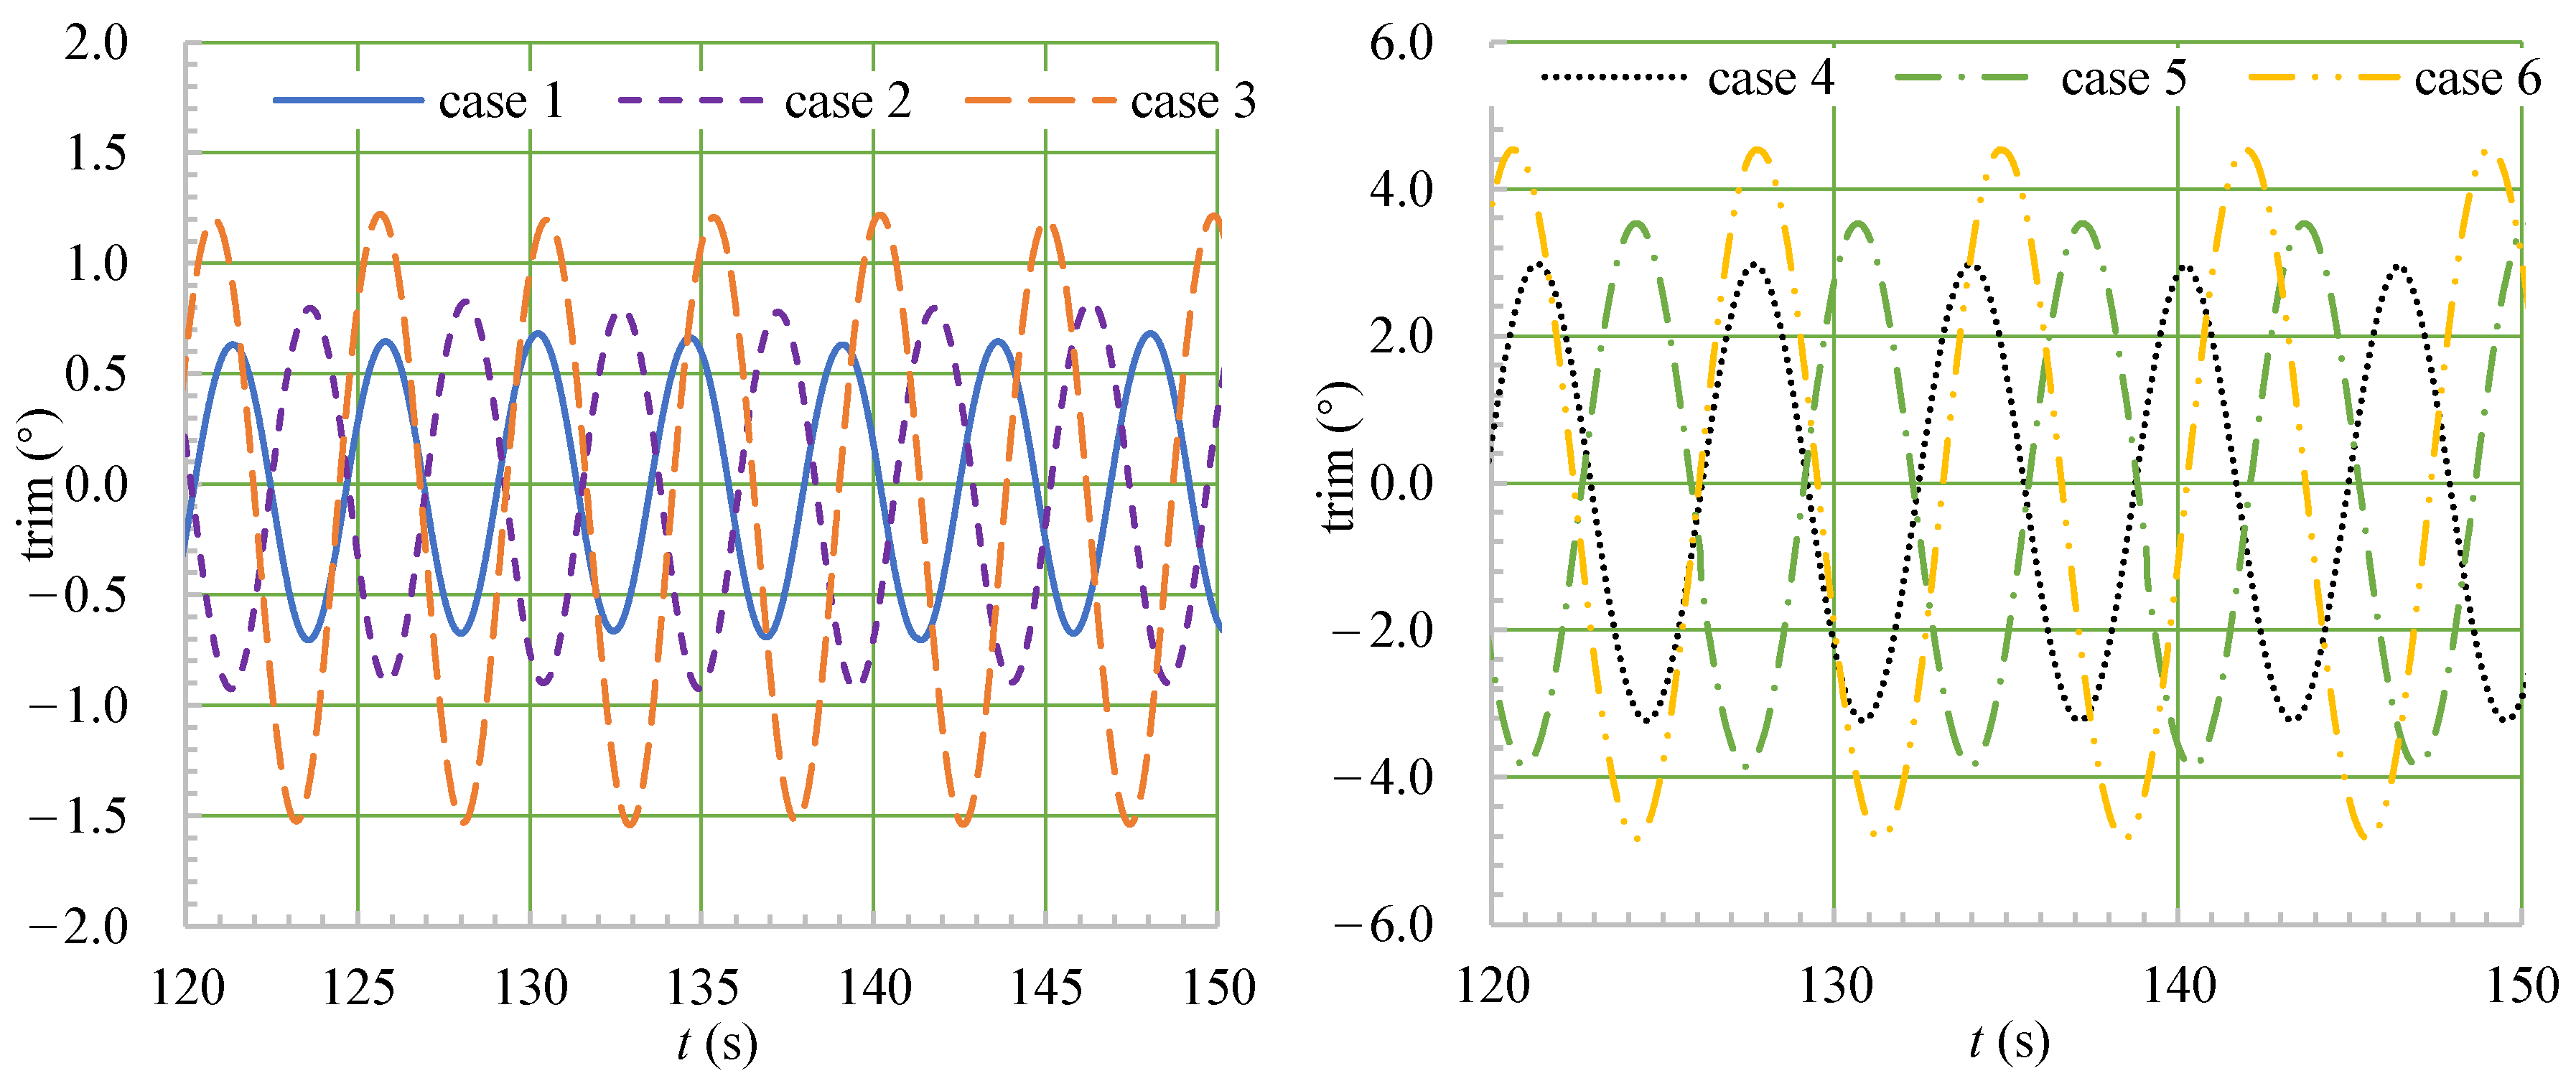
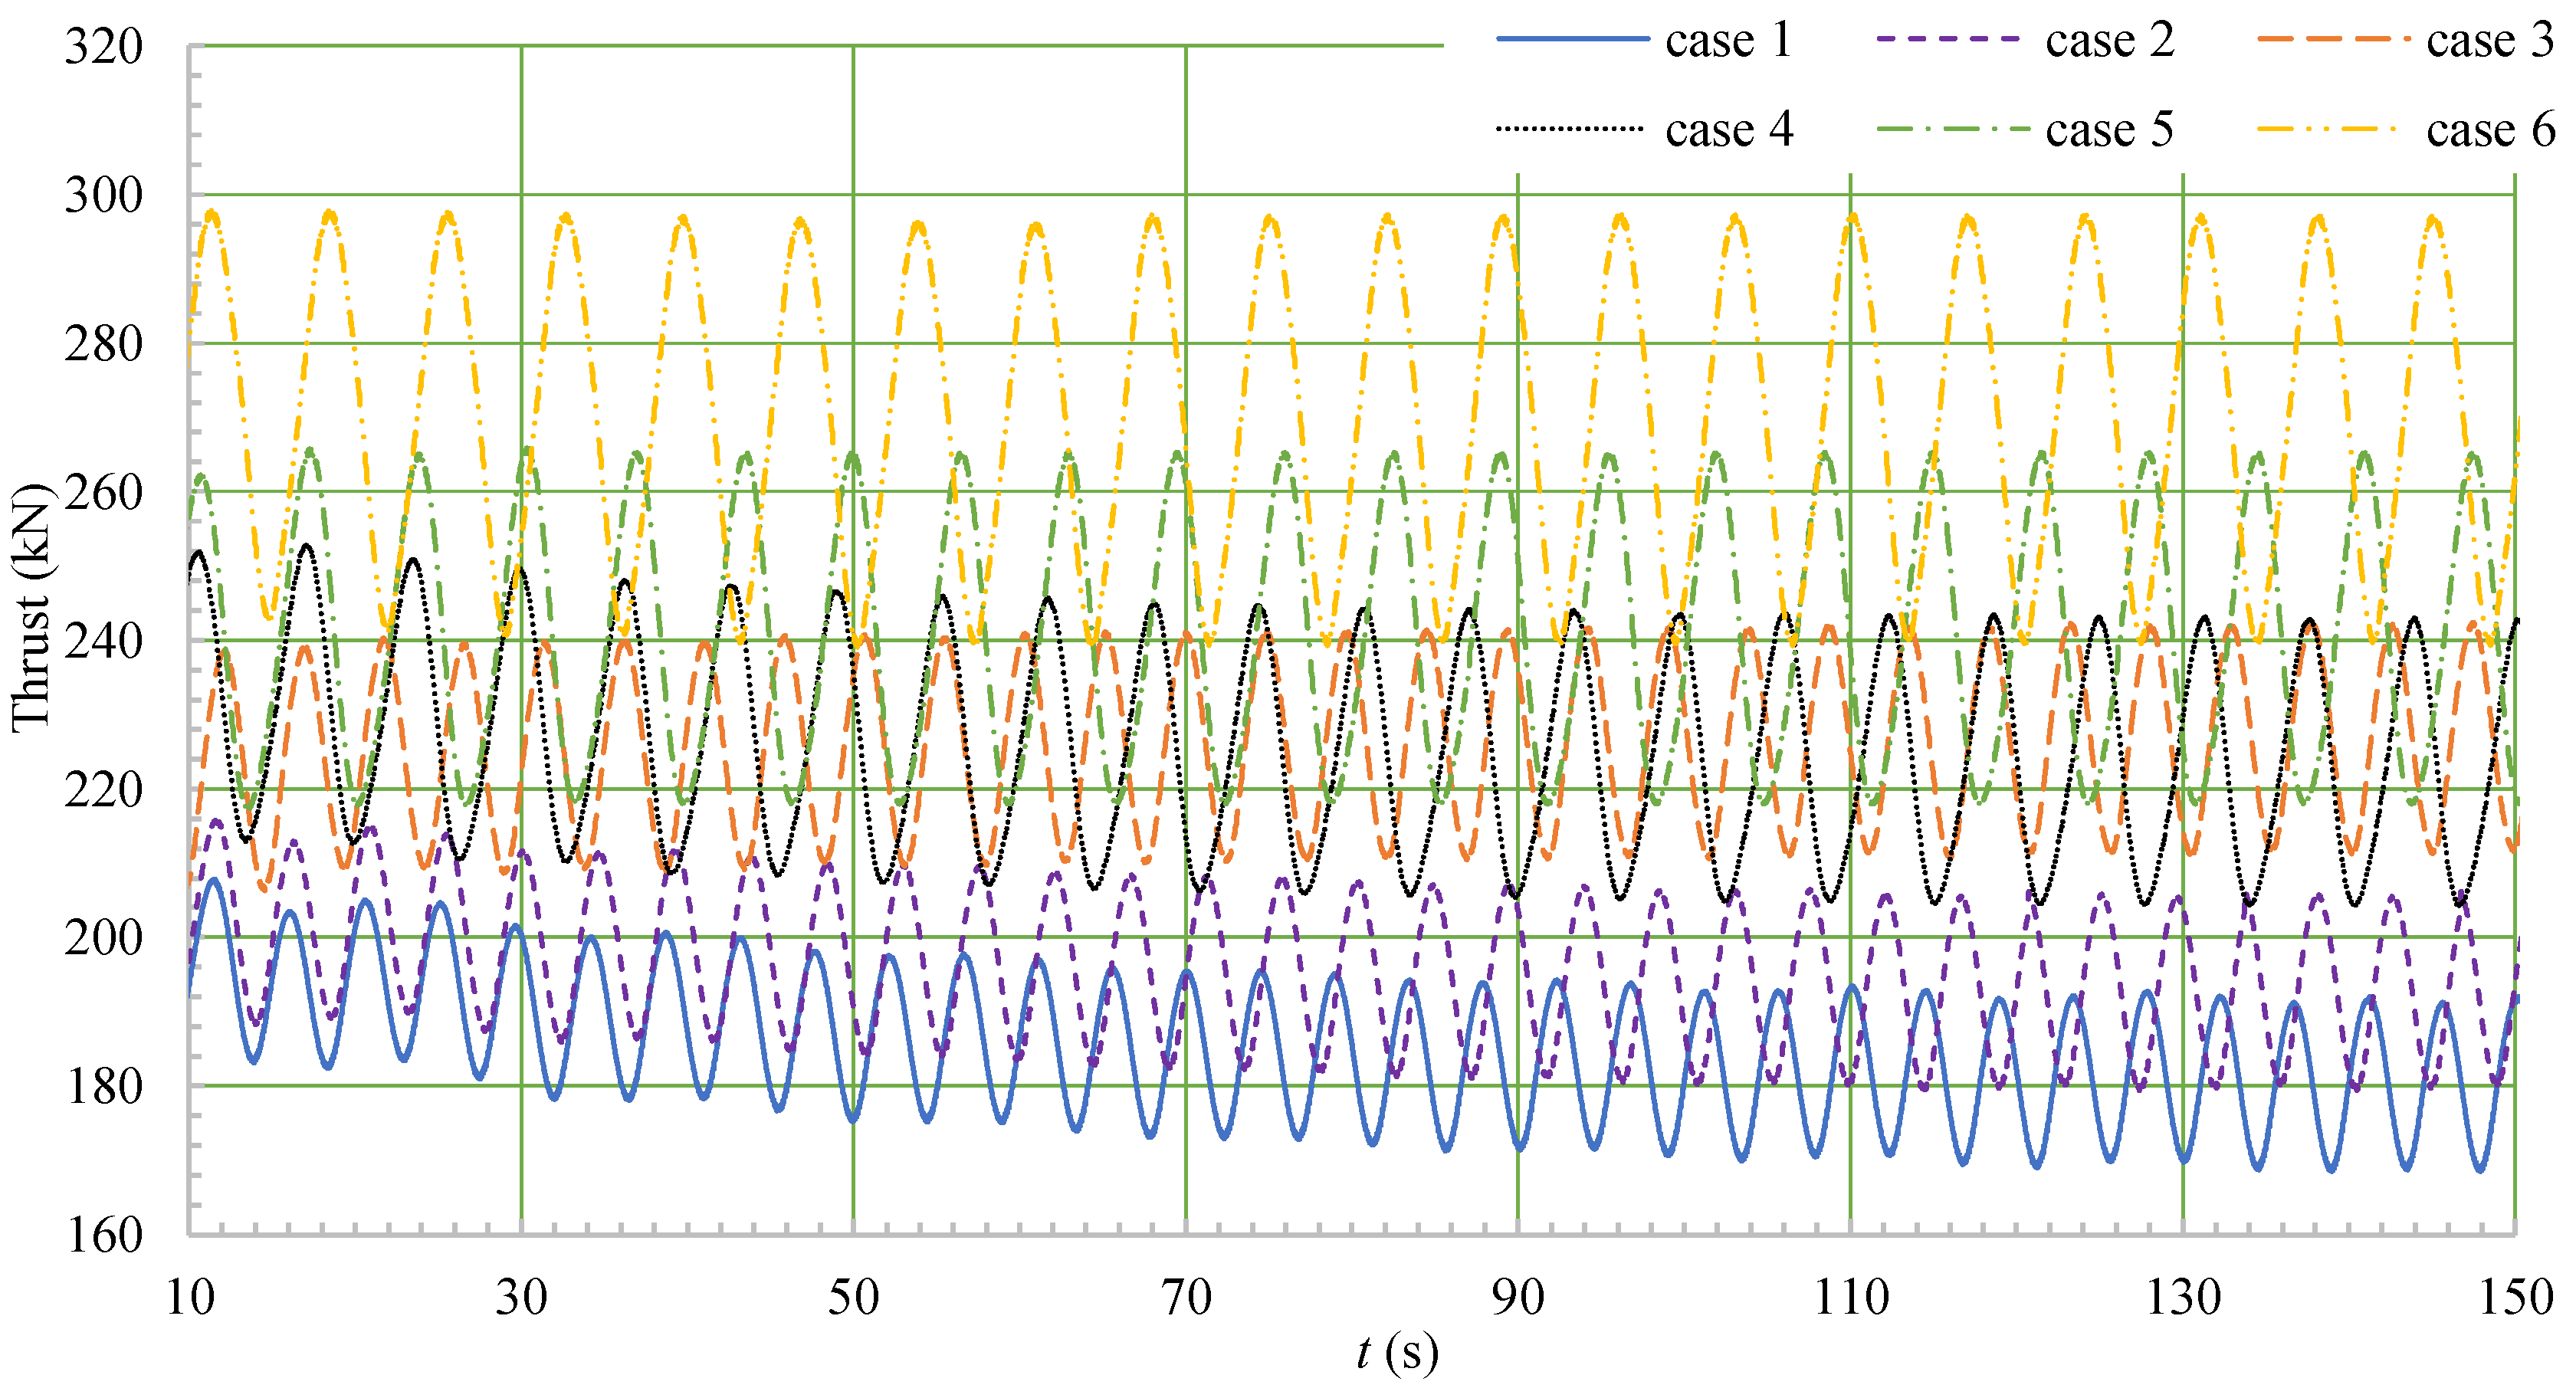
Figure 21 and Figure 22 show the time domain curves of the ship’s heave and pitch motion in stable conditions. When the wavelength was constant, the difference between the fluctuations of the heave and pitch also increased as the wave height increased. In addition, the average values of the sinkage and trim angles significantly increased as the wavelength increased. Figure 23 shows the time-domain curve of the propeller thrust. The mean value of the propeller thrust changed significantly with the level of the wind and waves. Case 1 exhibited the smallest fluctuations, case 6 exhibited the largest fluctuations, and the variations in the thrust were consistent with the laws of ship motion. The extreme difference analysis of the fluctuations in the sinkage, trim, and propeller thrust showed that the ratio λ/Lwl affected the thrust more than the ratio H/Lwl, which was consistent with the fluctuations in the ship’s speed.

4.4. Wave-Added Resistance

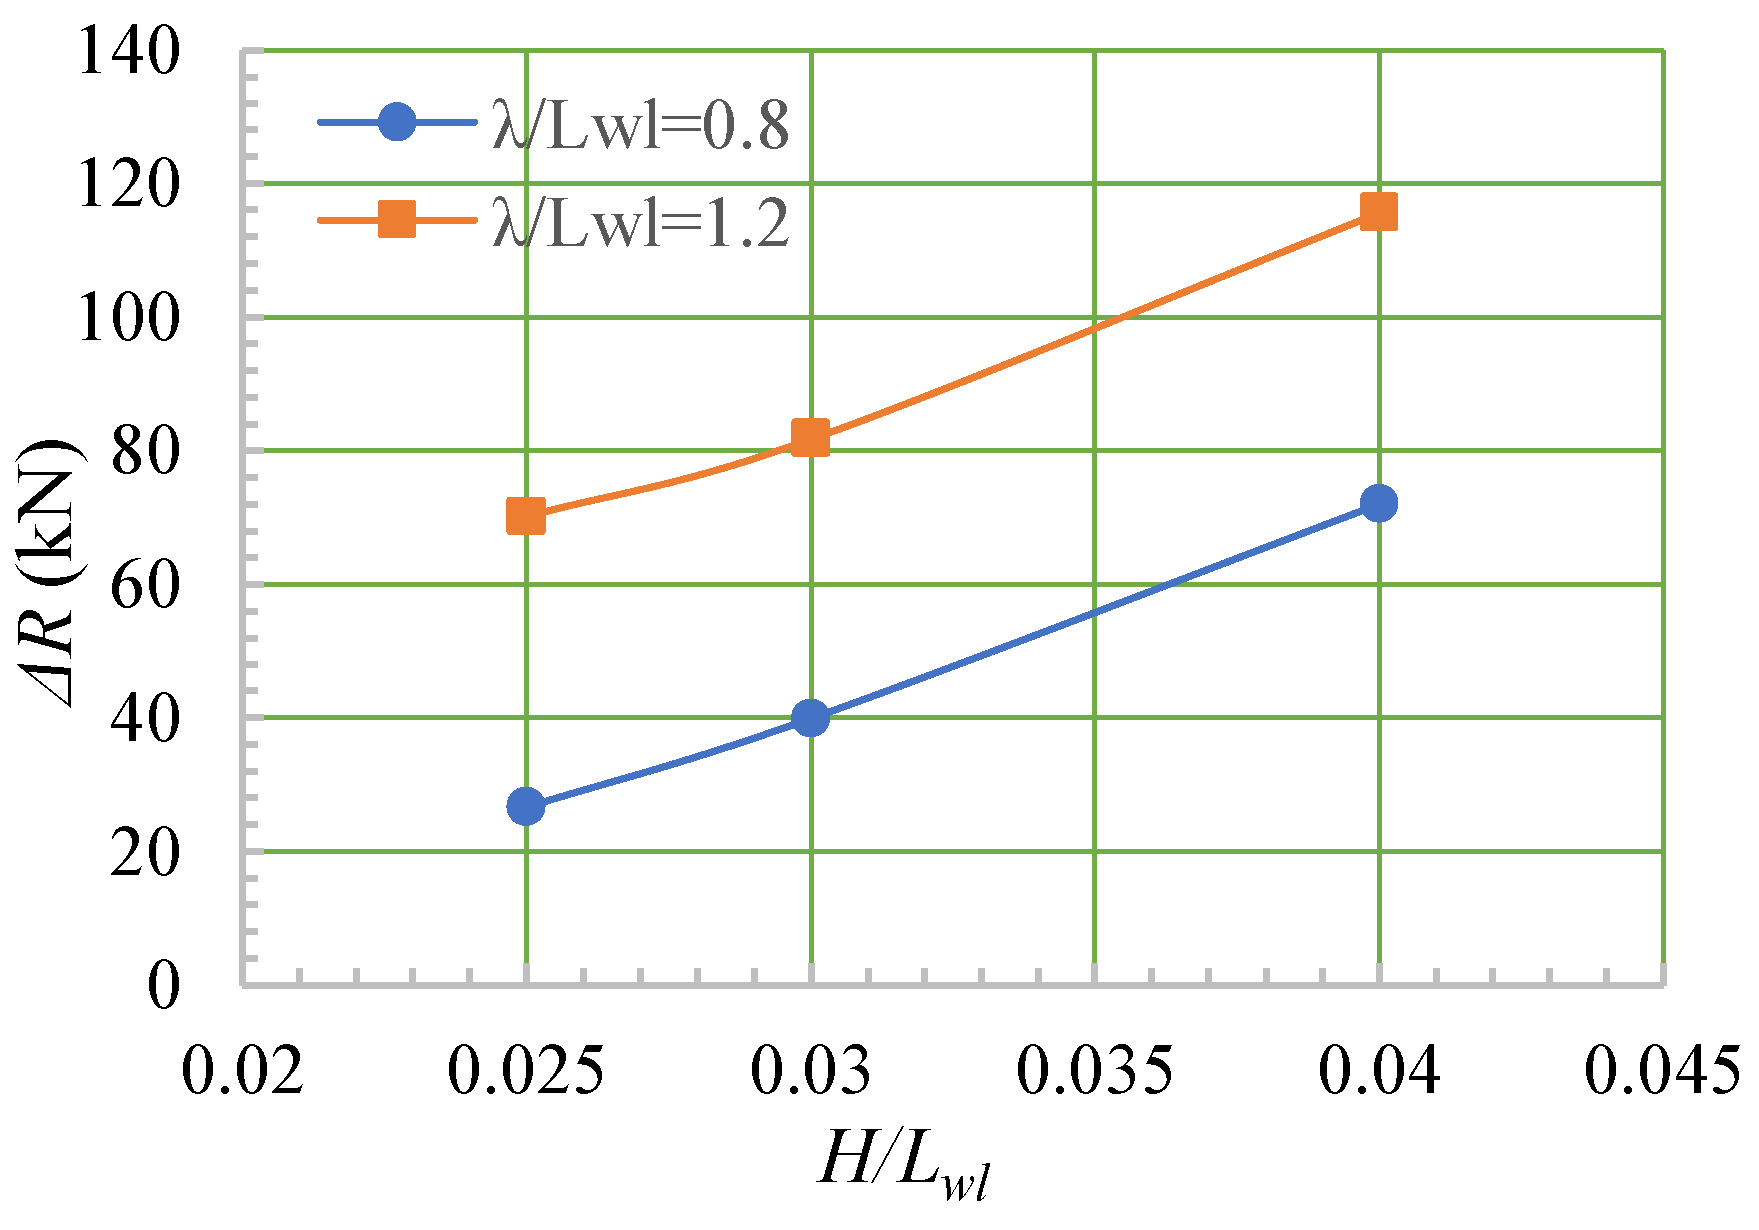
At a design rotation of 185 rpm, the resistance characteristics were analyzed using a free-running approach under the six wave conditions with calm water, and the total drag force was compared to that in calm water. The results are shown in Table 10, where R is the total resistance, ΔR is the total added resistance of the waves relative to calm water, η T R is the relative error between the propeller thrust and resistance, and η Δ R is the percentage error relative to the total resistance in calm water. In terms of the average resistance and average thrust, the relative error η T R was small (below 1%), indicating that the ship’s motion was converging. The added resistance of the ship when subjected to the waves was significant, and the proportion of the added resistance increased as the wavelength and wave height increased. The maximum increase in the resistance was 75.52%.
Figure 24 shows the average added resistance for different waves, and Figure 25 shows the Froude number corresponding to the different waves. As the wave height increased, the wave resistance of the ship constantly increased, whereas the speed constantly decreased. This occurred because the velocity and pressure fields surrounding the hull changed as the wave pushed on the hull, which caused large pitch and heave motions owing to the fluid force and moment acting on the hull. This constituted the main component of the added resistance of the waves. For the same wavelength, as the wave height increased, the ship’s pitch and heave also increased. Consequently, the pressure difference on the hull continued to increase, which generated a continuous increase in the added resistance of the waves.

4.5. Propeller Load Analysis

According to the analysis described above, as the wavelength and wave height increased, the load on the propeller in the free-running simulation increased continually, and the local pressure difference reached nearly 700 kPa; thus, the load on the propeller was very large. The load coefficient of the propeller was determined using
σ T = 2 T ρ A 0 V 2 ,
where T is the thrust, A0 is the disk area of the propeller, ρ is the density of water, V is the advance speed of the propeller, and σ T is the load coefficient (which is a dimensionless number that indicates the thrust generated per unit area of the propeller).
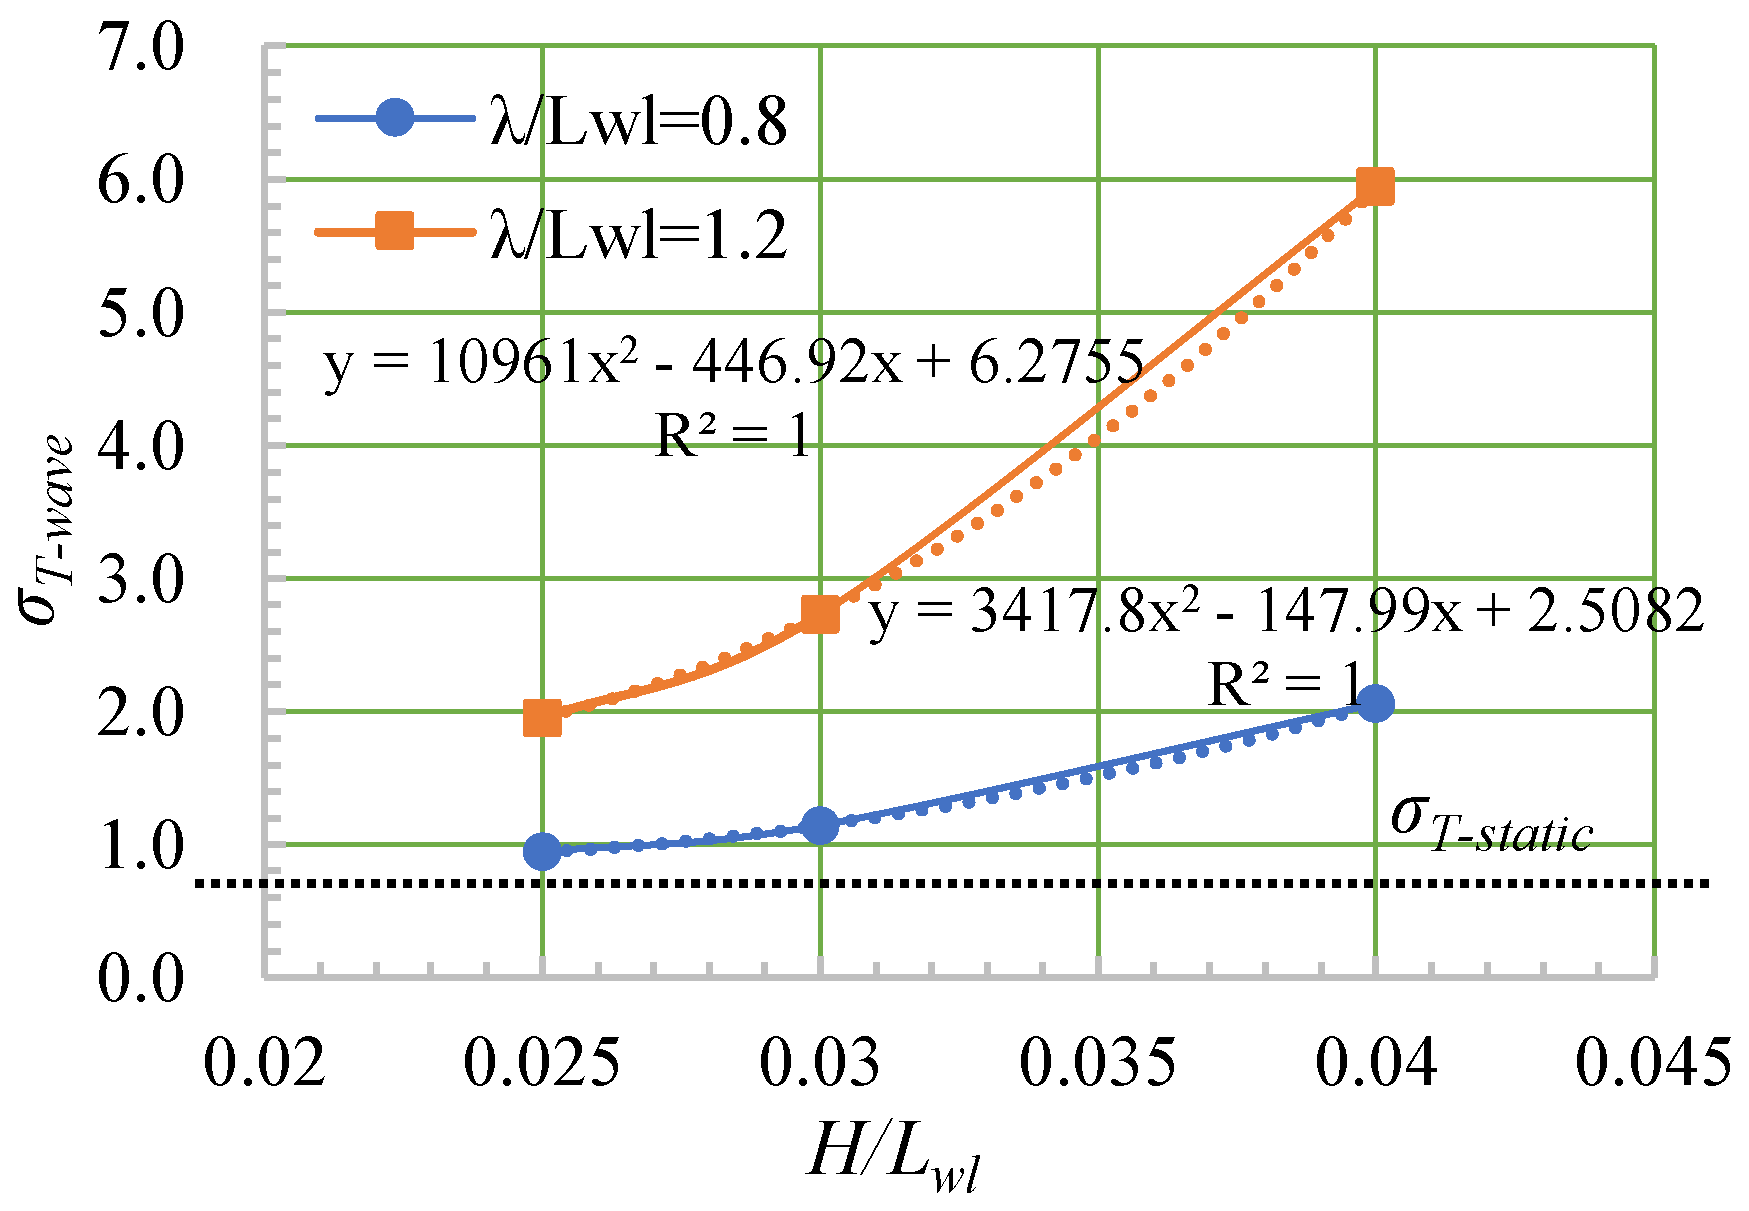
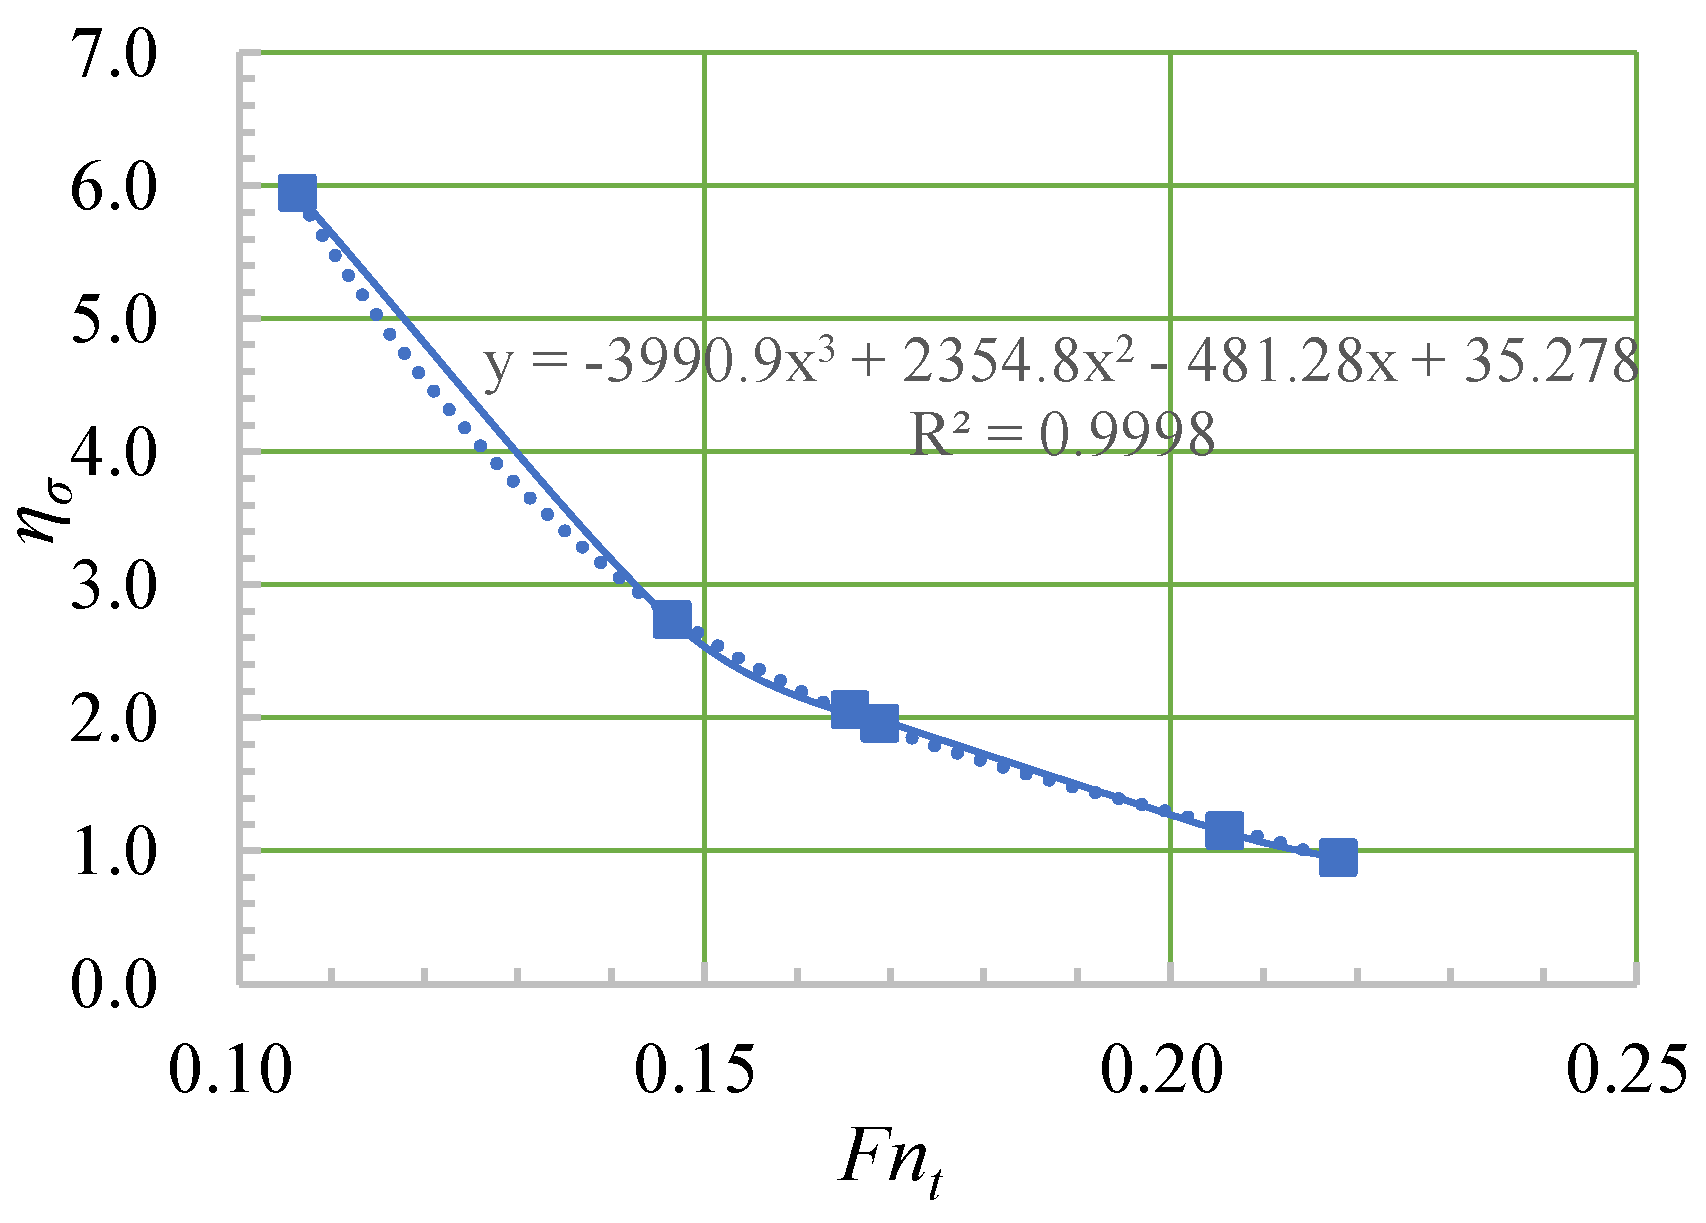
Using Equation (19), the propeller load coefficients under the conditions of the six waves and calm water were calculated; the results are shown in Table 11. In the table, σ T w a v e is the load coefficient for waves, σ T s t a t i c is the load coefficient for calm water, and η σ = σ T w a v e / σ T s t a t i c is the ratio of the load coefficient for waves to that for calm water. The table indicates that the larger the wind level, the larger the load coefficient of the propeller. In addition, the load coefficient of the propeller under wave motion was much higher than that under static water conditions, especially for case 4, in which the wave height and wavelength were 1.2 times the length of the ship and the load coefficient of the propeller reached 5.94 (931% of the coefficient for calm water). This implied that the load on the propeller was extremely large, which could pose safety risks.
Figure 26 shows the load coefficient curves for different waves. The load coefficients increased as H/Lwl increased, and the ratio corresponding to a wavelength of 1.2λ increased faster than that corresponding to 0.8λ. Figure 27 shows the η σ curve as a function of Fn, which demonstrates that η σ decreased as Fn increased for a given rotation rate of the propeller. Hence, if the velocity of the ship is reduced by the waves, the loading of the propeller will increase sharply. Figure 28 shows the wake of the propeller under three wave conditions with calm water, which were selected for their large load coefficients.
In summary, the primary reason for the sharp crossing of the propeller load when the ship was subjected to waves was the large wave-added resistance. The pressure difference between the bow and stern of the ship resulted in a large pressure resistance on the hull, which significantly increased the total resistance on the hull. Under this condition, to keep the ship moving forward at a certain speed, the propeller must increase the thrust to offset the increase in resistance, but this reduces the efficiency. The added resistance, in turn, reduces the advance speed of the propeller, leading to a sharp rise in the load. Additionally, when in bad sea conditions, such as wind level 7 or higher, the ship speed will be reduced even further and the load on the propeller will be even larger. This excessive load may cause a sharp increase in the structural stress on the propeller, which will likely cause the propeller blade to deform, posing structural safety risks.

5. Conclusions and Future Work

In this study, a method for numerically simulating a free-running ship was proposed, and it was used to simulate a small cruise ship encountering six wave conditions. The characteristics of the ship’s motion, added resistance, propeller loading, propeller stress, and deformation were analyzed. The main conclusions of this study are as follows.
(1)
The free-running method based on relative motion simulated the self-propelled motion of full-scale ships more effectively than the traditional self-propulsion method without expanding the background domain, and the motion of the ship converged relatively quickly.
(2)
When the ship moved in a head sea, the ship’s speed, heave, and pitch fluctuated, and λ/Lwl had a greater impact on the fluctuations of the speed, motion, and thrust than did H/Lwl.
(3)
For the same wavelength, as the wave height increased, the added wave resistance of the ship continued to increase.
(4)
Under heavy sea conditions, the loading of the ship’s propeller increased sharply, and the load coefficient exceeded 500%, posing certain safety risks that must be considered in the design of the propeller.
Compared with the self-propulsion simulation approach [1], this paper offers a good choice to obtain the behaviors of the ship in waves. In summary, the load on the propeller was particularly heavy in waves, and the deformation of the propeller could not be ignored. In addition, a fluid–structure coupling phenomenon may have occurred. However, during the hydrodynamic simulation, the influence of the deformation of the propeller on the hydrodynamic performance was not considered. Therefore, in future studies, a method for calculating fluid–structure interactions will be adopted to further examine the hydrodynamic performance of the propeller in cruise ships under heavy sea conditions.

Author Contributions

S.G.: writing—original draft, data curation, software; J.Z.: conceptualization, methodology, validation, investigation; K.S.: validation, writing—review and editing; J.J.: writing—review and editing. All authors have read and agreed to the published version of the manuscript.

Funding

The authors would like to acknowledge the support of the Ministry of Industry and Information Technology of the People’s Republic of China (No. MC-201918-C10) and the Natural Science Foundation of Jiangsu Province of China (No. BK20230285).

Data Availability Statement

The original contributions presented in this study are included in the article. Further inquiries can be directed to the corresponding author.

Conflicts of Interest

The authors declare that they have no known competing financial interests or personal relationships that could have influenced the work reported in this paper.

References

  1. Oleksiy, B.; Yasushi, K. Development of detailed engine model for evaluation ship performance in waves by a self-propulsion model test. J. Mar. Sci. Technol. 2021, 6, 9. [Google Scholar] [CrossRef]
  2. Wu, R.; Zhang, C.; Chen, X.; Wang, Z.; Yan, X. Influence Analysis of Podded Propulsors Installation Position Based on Self Propulsion Simulation. In Proceedings of the 7th International Conference on Transportation Information and Safety (ICTIS), Xi’an, China, 4–6 August 2023. [Google Scholar] [CrossRef]
  3. Sun, W.; Hu, Q.; Hu, S.; Su, J.; Xu, J.; Wei, J.; Huang, G. Numerical analysis of full-scale ship self-propulsion performance with direct comparison to statistical sea trail results. J. Mar. Sci. Eng. 2020, 8, 24. [Google Scholar] [CrossRef]
  4. Lin, T.Y.; Kouh, J.S. On the scale effect of thrust deduction in a judicious self-propulsion procedure for a moderate-speed containership. J. Mar. Sci. Technol. 2015, 20, 373–391. [Google Scholar] [CrossRef]
  5. Guo, C.; Zhang, Q.; Shen, Y. A non-geometrically similar model for predicting the wake field of full-scale ships. J. Mar. Sci. Appl. 2015, 14, 225–233. [Google Scholar] [CrossRef]
  6. Ponkratov, D.; Zegos, C. Validation of ship scale CFD self-propulsion simulation by the direct comparison with sea trials results. In Proceedings of the Fourth International Symposium on Marine Propulsors, Austin, TX, USA, 31 May–4 June 2015. [Google Scholar]
  7. Wang, C.; Sun, S.; Li, L.; Ye, L. Numerical prediction analysis of propeller bearing force for full-scale hull-propeller-rudder system. Int. J. Nav. Archit. Ocean Eng. 2016, 8, 589–601. [Google Scholar] [CrossRef]
  8. Li, L.; Wang, C.; Sun, S.; Sun, S. Numerical simulation and scale effect of self-propulsion test of a full-scale ship. J. Harbin Eng. Univ. 2016, 37, 7. [Google Scholar]
  9. Kösterke, M.; Voß, J.P.; Riesner, M.; Greve, M. Propeller design and dynamic hull-propeller interaction of an XLUUV. In Proceedings of the Eighth International Symposium on Marine Propulsors, smp’24, Berlin, Germany, 17–20 March 2024. [Google Scholar] [CrossRef]
  10. Wang, J.; Wan, D. CFD simulations of ship maneuvering motion. J. Harbin Eng. Univ. 2018, 39, 5. [Google Scholar]
  11. Castro, A.M.; Carrica, P.M.; Stern, F. Full scale self-propulsion computations using discretized propeller for the KRISO container ship KCS. Comput. Fluids 2011, 51, 35–47. [Google Scholar] [CrossRef]
  12. Wang, J.; Wan, D. Investigations of self-propulsion in waves of fully appended ONR Tumblehome model. Appl. Math. Mech. 2016, 37, 1345–1358. [Google Scholar] [CrossRef]
  13. Liu, L.; Chen, M.; Yu, J.; Zhang, Z.; Wang, X. Full-scale simulation of self-propulsion for a free-running submarine. Phys. Fluids 2021, 33, 047103. [Google Scholar] [CrossRef]
  14. Kinaci, O.K.; Ozturk, D. Straight-ahead self-propulsion and turning maneuvers of DTC container ship with direct CFD simulations. Ocean Eng. 2022, 244, 110381. [Google Scholar] [CrossRef]
  15. Saydam, A.Z.; Küçüksu, G.N.; İnsel, M.; Gökçay, S. Uncertainty quantification of self-propulsion analyses with RANS-CFD and comparison with full-scale ship trials. Brodogradnja 2022, 73, 107–129. [Google Scholar] [CrossRef]
  16. Yu, Q.; Yang, Y.; Geng, X.; Jiang, Y.; Li, Y.; Tang, Y. Integrating computational fluid dynamics for maneuverability prediction in dual full rotary propulsion ships: A 4-DOF mathematical model approach. J. Mar. Sci. Eng. 2024, 12, 762. [Google Scholar] [CrossRef]
  17. Mizythras, P.; Boulougouris, E.; Theotokatos, G. Computational investigation of ship propulsion performance in rough seas. In Proceedings of the International Conference on Maritime Safety and Operations, Glasgow, UK, 13–14 October 2016. [Google Scholar]
  18. Marine Safety Committee. MSC.1/Circ.1369/ Add.1, Annex Interpretation 18, p. 12. 2012. Available online: https://imorules.com/GUID-40D3CA4B-D851-42ED-965F-42F0C56EF286.html (accessed on 20 February 2024).
  19. Song, K.; Guo, C.; Wang, C.; Sun, C.; Li, P.; Wang, W. Numerical analysis of the effects of stern flaps on ship resistance and propulsion performance. Ocean Eng. 2019, 193, 106621. [Google Scholar] [CrossRef]
  20. He, G.; Jing, P.; Jin, R.; Zhang, W.; Zhang, J.; Liu, T. Two-dimensional numerical study on fluid resonance in the narrow gap between two rigid-connected heave boxes in waves. Appl. Ocean Res. 2021, 110, 102628. [Google Scholar] [CrossRef]
  21. CD-adapco. User Guide of STAR-CCM+, version 14.02.010-R8; CD-adapco: Melville, NY, USA, 2019. [Google Scholar]
  22. Det Norske Veritas. Environmental Conditions and Environmental Loads; Recommended Practice DNV-RP-C205; Det Norske Veritas: Oslo, Norway, 2007; p. 24. [Google Scholar]
  23. Kim, D.; Song, S.; Tezdogan, T. Free running CFD simulations to investigate ship manoeuvrability in waves. Ocean Eng. 2021, 236, 109567. [Google Scholar] [CrossRef]
  24. Wilson, R.; Shao, J.; Stern, F. Discussion: Criticisms of the “Correction Factor” Verification Method. J. Fluids Eng. 2004, 126, 704–706. [Google Scholar] [CrossRef]
  25. Wang, L.; Guo, C.; Su, Y.; Zhang, D. Numerical study of the propeller-induced exciting force under the open freedom condition. J. Harbin Eng. Univ. 2017, 38, 6. [Google Scholar] [CrossRef]
  26. Liu, L.; Chen, M.; Wang, X.; Zhang, Z.; Yu, J.; Feng, D. CFD prediction of full-scale ship parametric roll in head wave. Ocean Eng. 2021, 222, 109180. [Google Scholar] [CrossRef]
  27. Maritime Safety Administration of the People’s Republic of China, Sea Surface Wind Scale and Performance. 2017. Available online: https://www.msa.gov.cn/page/article.do?articleId=74CE6926-0897-41E9-A22C-44EF17BE7B1B (accessed on 23 February 2024).
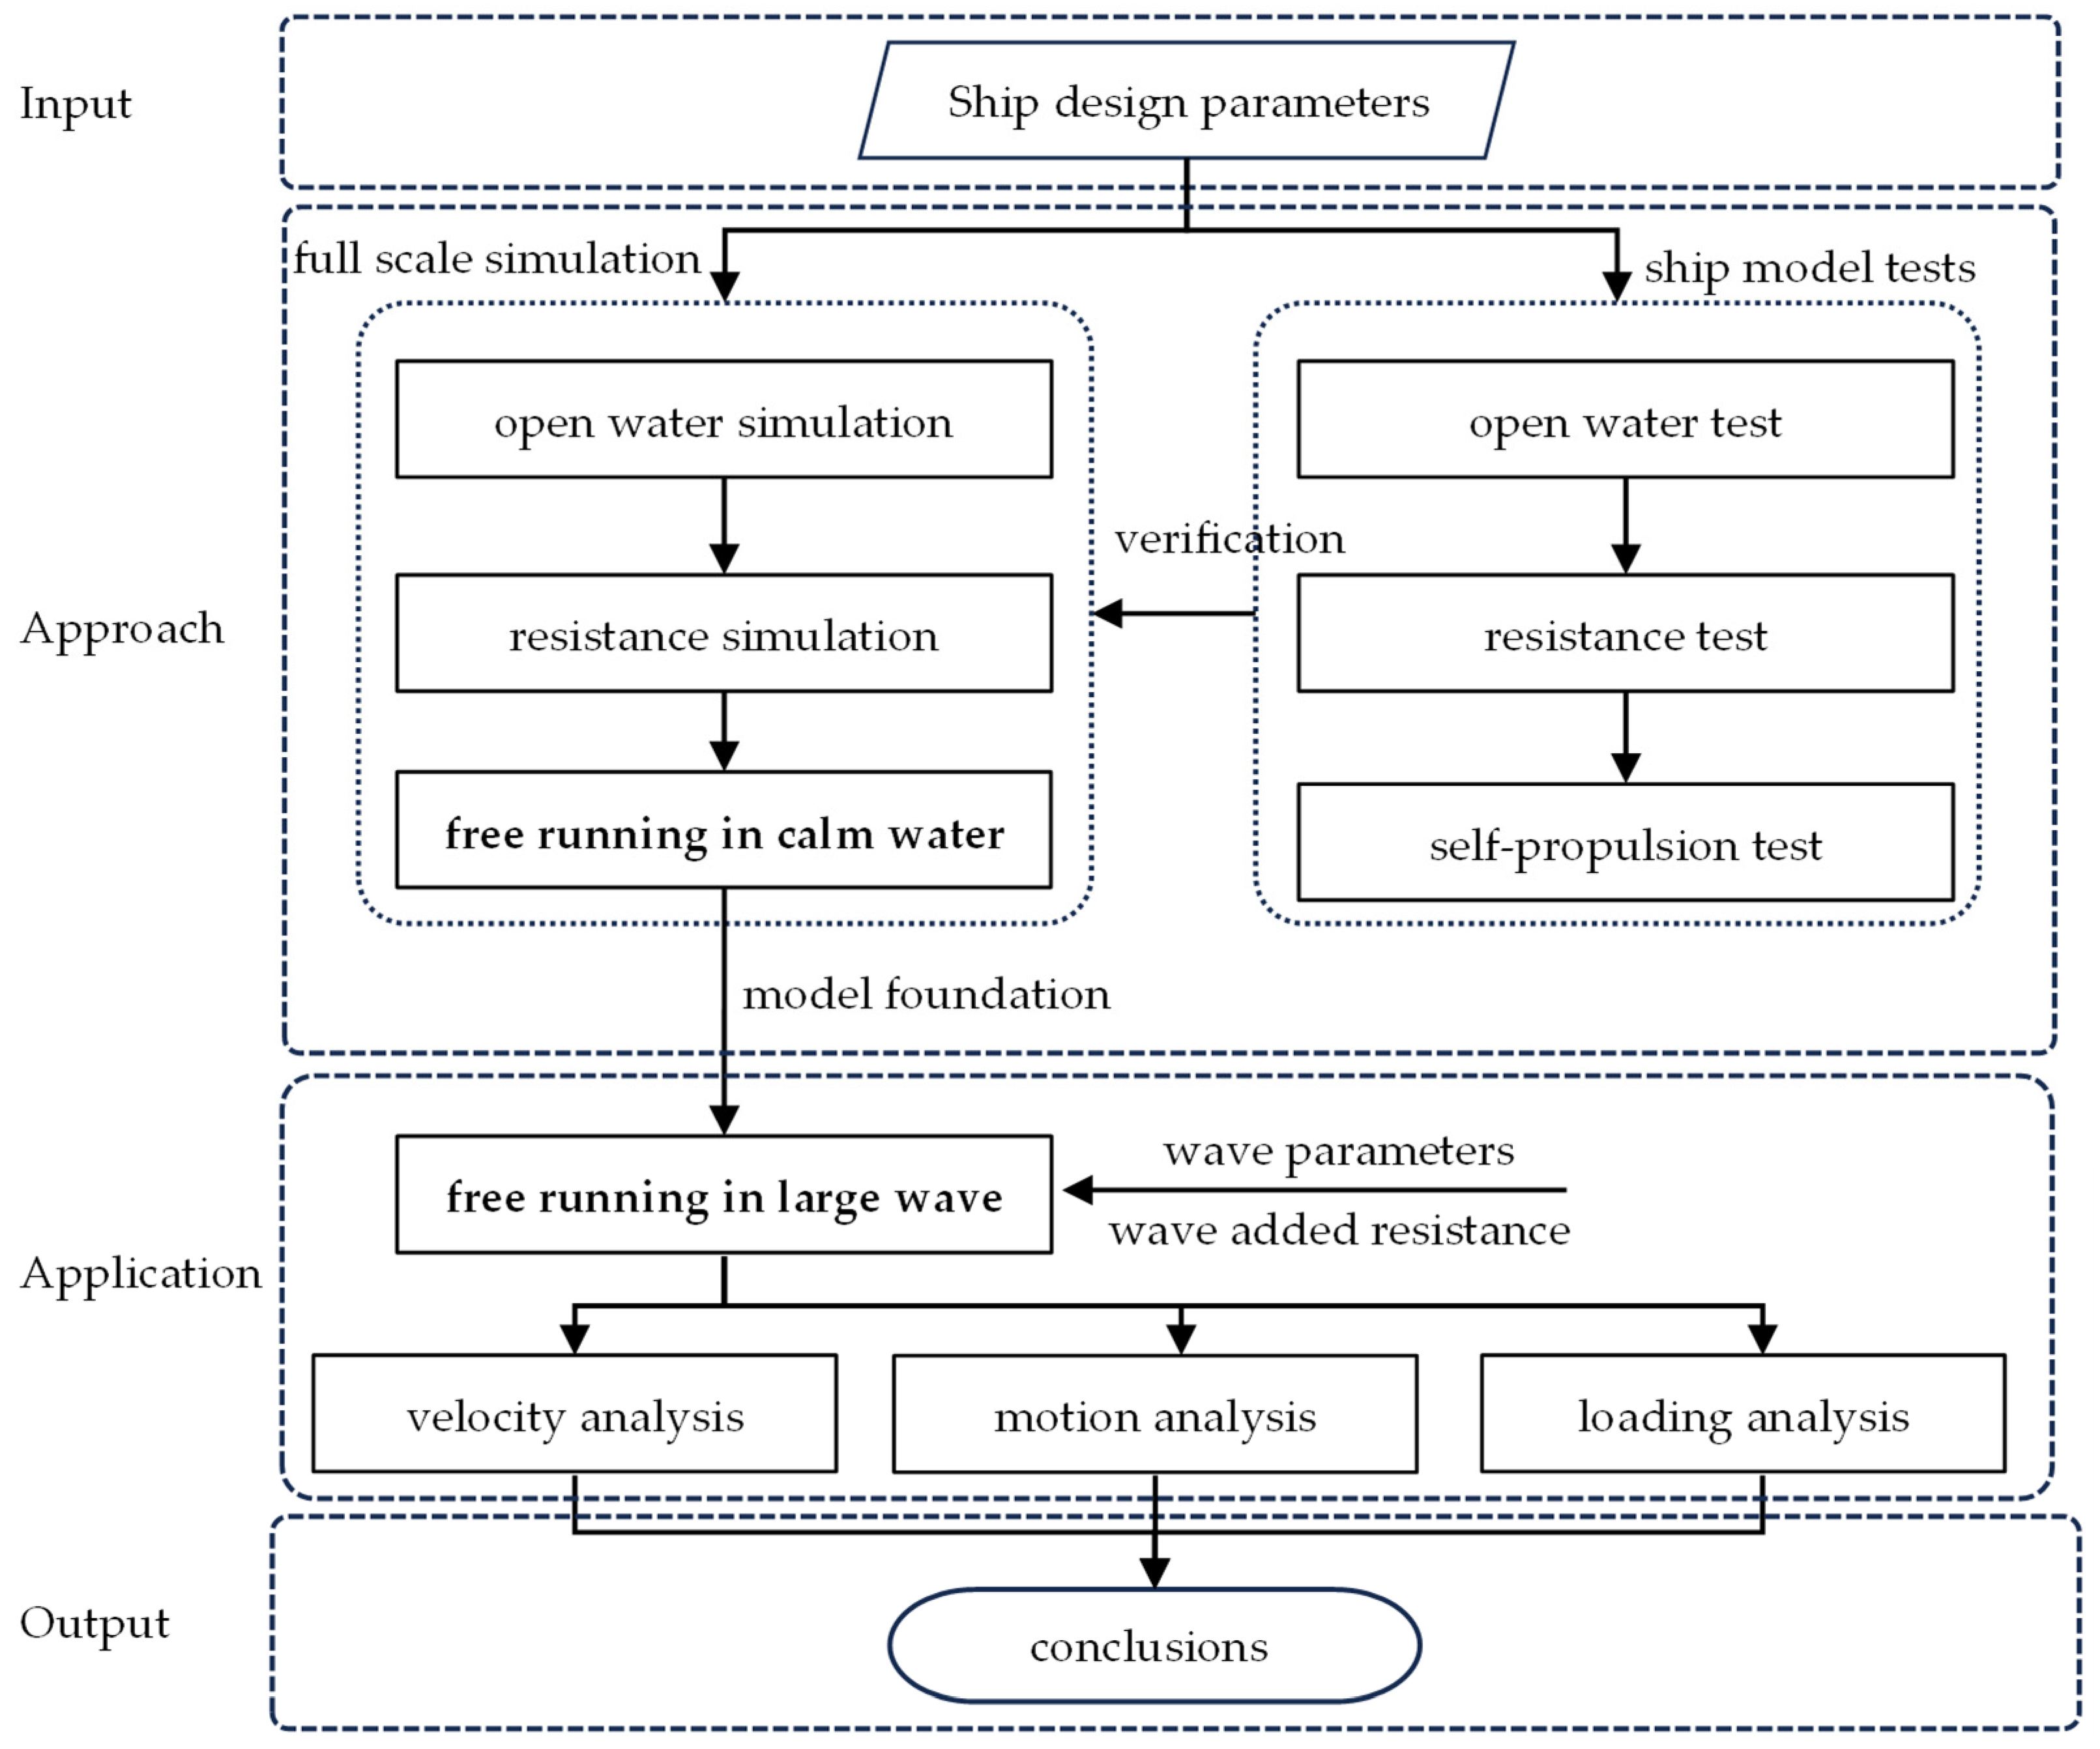
Figure 1. Approach procedure used in this study.
Jmse 13 00626 g001
Figure 2. The model of the ship for tank experiment: (a) bow and (b) stern.
Jmse 13 00626 g002
Figure 3. Geometric model used in the numerical simulation: (a) side view and (b) aft view.
Jmse 13 00626 g003
Figure 4. Computational domain and boundary conditions.
Jmse 13 00626 g004
Figure 5. Forcing zone of the simulations.
Jmse 13 00626 g005
Figure 6. Mesh distributions of the (a) resistance computational domain, (b) ship hull through the centerline, (c) Kelvin wave system, (d) free surface of the stern, (e) free surface of the bow, (g) rudder, and (f) ship hull at the rudder’s location.
Jmse 13 00626 g006
Figure 7. Calculated and experimental values of the open-water characteristics of the full-scale propeller.
Jmse 13 00626 g007
Figure 8. Mesh distributions of the (a) overset mesh region, (b) propeller mesh rotation region, and (c) magnified propeller mesh region.
Jmse 13 00626 g008
Figure 9. Moving background settings.
Jmse 13 00626 g009
Figure 10. Comparison of the free surface between the (a) traditional self-propulsion simulation and (b) free-running simulation.
Jmse 13 00626 g010
Figure 11. Comparison ship’s motion between the traditional self-propulsion and free-running simulation methods: (a) sinkage and (b) trim.
Jmse 13 00626 g011
Figure 12. Wave simulation methods.
Jmse 13 00626 g012
Figure 13. Free surface elevation of the waves generated via wave forcing.
Jmse 13 00626 g013
Figure 14. Wave surfaces for six cases of wave conditions.
Jmse 13 00626 g014
Figure 15. Propeller surface pressures for the six cases of wave conditions.
Jmse 13 00626 g015
Figure 16. Ship speed curves.
Jmse 13 00626 g016
Figure 17. Ship speed fluctuation curves.
Jmse 13 00626 g017
Figure 18. Propeller thrust curves.
Jmse 13 00626 g018
Figure 19. Maximum pressure difference curves.
Jmse 13 00626 g019
Figure 20. Speed convergence curves.
Jmse 13 00626 g020
Figure 21. Time-domain curve of the ship’s sinkage.
Jmse 13 00626 g021
Figure 22. Time-domain curve of the ship’s trim.
Jmse 13 00626 g022
Figure 23. Time-domain curve of the ship’s thrust.
Jmse 13 00626 g023
Figure 24. Resistance of different waves.
Jmse 13 00626 g024
Figure 25. Fnt for different waves.
Jmse 13 00626 g025
Figure 26. Load coefficient curves.
Jmse 13 00626 g026
Figure 27. Curve as a function of Fn.
Jmse 13 00626 g027
Figure 28. Wake of the propeller.
Jmse 13 00626 g028
Table 1. Parameters of the full- and model-scale cruise ships.
Main ParameterSymbolFull-ScaleModel-Scale
DisplacementΔ (t)5190.0 1.661
Length (overall)Loa (m)104.11 7.180
Length (waterline)Lwl (m)100.03 6.899
BeamB (m)18.40 1.269
DepthD (m)7.25 0.500
Design draughtd (m)5.10 0.352
Design velocityV (kn)15.001.034
Center of gravity (rel. to AP)LCG (m) 41.502.862
Center of gravity (rel. to BL)VCG (m) 8.00.552
Propeller diameterDp (m)3.190.22
Number of bladesZ44
Pitch ratioP/D (0.75R)0.900.90
Area ratioAe/A00.600.60
Propeller rotation direction/InwardInward
Rudder type/SpadeSpade
Table 2. Calculated results for the three sets of grids.
Grid No.Grid SizeHalf-Ship Resistance (kN)
ExperimentCFDError (%)
G16.21 M112.645115.0862.17%
G23.58 M115.5652.59%
G32.07 M118.2194.95%
Table 3. Calculated results for the grid convergence verification.
RGPGUG (%)
Resistance0.18054.56195.825
Table 4. Comparison between the free-running and traditional self-propulsion simulation of the full-scale ship under hull–propeller–rudder coupling conditions (185 rpm).
T (kN)V (m/s)Trim (°)Sinkage (m)
Free running153.247.6600.067−0.203
Traditional self-propulsion149.357.7160.066−0.181
Experiments149.507.7160.07−0.19
Error (%)+2.50%−0.73%−4.28%+6.84%
Table 5. Comparison between amplitude errors (free surface elevation).
Time (s)255075100
CFD1.161−1.563−2.476−1.217
Theory1.130−1.549−2.496−1.237
Error (%)3.12%0.86%−0.82%−1.61%
Table 6. Wave simulation conditions for the full-scale ship.
CaseWind LevelWave ConditionsV0 (m/s)Fn0
H/Lwlλ/Lwl
150.0250.86.300.20
260.0300.86.050.19
370.0400.85.300.17
450.0251.24.900.16
560.0301.24.710.15
670.0401.23.200.10
Table 7. Free-running simulation results under the six wave conditions and calm water.
CaseWind
Level
Vt
(m/s)
FntVt-crestVt-trough
(m/s)
t
(s)
T (half)
(kN)
Pmax
(kPa)
Pmin
(kPa)
ΔP
(kPa)
StaticStatic7.660.245//153.24191−319510
156.830.2180.1085125180.40198−373571
266.450.2060.1104112194.94198−388586
375.190.1660.119888226.85201−419620
455.290.1690.3467101223.80200−424624
564.590.1470.504050235.75204−449653
673.330.1060.850072269.53203−481684
Table 8. Design variables at their respective levels.
Levelλ/LwlH/Lwl
10.80.025
21.20.03
3-0.04
Table 9. Extreme difference analysis of the influence of the wave parameters on the ship speed.
Itemλ/LwlH/Lwl
K10.3390.455
K21.7010.614
K3-0.97
K10.1130.228
K20.5670.307
K3-0.485
R0.4540.257
Primary and secondary orderλ/Lwl –> H/Lwl
Table 10. Added resistance of different waves in the free-running approach (185 rpm).
CaseWind
Level
Vt
(m/s)
FntT (Half)
(kN)
R (Half)
(kN)
ΔR
(kN)
η T R η Δ R
StaticStatic7.660.245153.24153.15/0.06%/
156.830.218180.40179.7726.620.35%17.38%
266.450.206194.94193.0439.890.97%26.05%
375.190.166226.85225.1271.970.76%46.99%
455.290.169223.80223.3270.170.21%45.82%
564.590.147235.75234.8781.720.37%53.36%
673.330.106269.53268.81115.660.27%75.52%
Table 11. Load coefficients of the propeller.
CaseWind Level σ T w a v e σ T s t a t i c η σ
StaticStatic/0.64/
150.94/1.48
261.14/1.79
372.06/3.22
451.95/3.06
562.73/4.28
675.94/9.31
Disclaimer/Publisher’s Note: The statements, opinions and data contained in all publications are solely those of the individual author(s) and contributor(s) and not of MDPI and/or the editor(s). MDPI and/or the editor(s) disclaim responsibility for any injury to people or property resulting from any ideas, methods, instructions or products referred to in the content.