Abstract
The systematic morphometric analyses of submarine mud volcanoes are widespread yet still poorly understood geological features. Our study reveals that submarine mud volcanoes show significant variability in size and geometry, independent of water depth. Specifically, the mean height-to-radius (H/R) ratio is ~0.14 ± 0.08 (±1σ). This study focuses primarily on submarine mud volcanoes in the Mediterranean, which account for approximately 58% of the dataset and include structures reaching heights of up to ~500 m with mean diameters of up to 8000 m. These edifices display a range of basal geometries, from sub-elliptical (e.g., North Alex, off the coast of Egypt) to super-elliptical (e.g., Alberto da Ottaviano in the Mediterranean Ridge Accretionary Complex). A comparative analysis of morphometric parameters distinguishes mud cones from mud pies globally, with the latter generally lacking large examples (mean diameter >10 km). The results suggest distinct evolutionary pathways, beginning with small simple cones (~100 m3 in volume), analogous to arc volcanoes in other geological settings. This study integrates fundamental marine geology with applied geohazard considerations, serving as an initial step toward enhancing shared knowledge of submarine mud volcanoes. By improving the understanding of their formation, morphometric variability, and spatial distribution, this research supports better-informed decisions regarding submarine geohazards.
1. Introduction
Fluid leakage from the seabed is a common process that occurs worldwide from coastal to abyssal plain environments [1,2]. It can give rise to a wide range of morphologies, classified as “Fluid Escape Structures” or more recently as ‘’Seabed Fluid Flow Morphologies” [2], whose morphological characteristics are believed to be strictly dependent on the type of fluid involved and the geological setting where they are found [3]. The main superficial expressions of seabed fluid flow are represented by pockmarks and mud volcanoes, respectively [4,5], which comprise engineering challenges and hazards for seabed infrastructure and exploration drilling [6]. Mud volcanoes (MVs) are positive reliefs formed by the vertical migration of overpressured fluids (e.g., CH4, CO2, and water) mixed with fine sediments named mud breccia (i.e., structureless pebbly mud containing predominantly angular, semi-indurated clasts) [7,8]. They occur globally in various geological settings, particularly in compressional tectonic zones and regions with high sedimentation rates, such as deltas, sedimentary basins, and accretionary prisms. Submarine MVs are identified by their subcircular shape and gas plumes escaping from the seabed [9] and can be found across a wide range of water depths [10] (Figure 1).
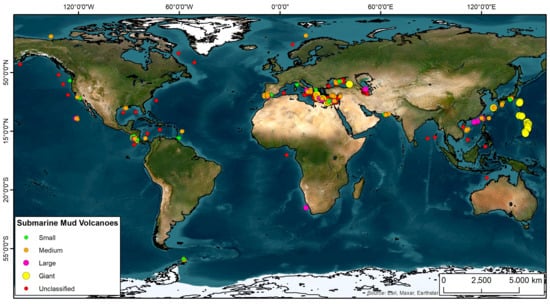
Figure 1.
Location and size of submarine mud volcanoes (N = 1003) divided by size (small, medium, large, or giant). Unclassified submarine MVs, i.e., those without morphometric parameters are shown as red points (data from Napoli et al., 2025 [11]).
MVs morphologically vary depending on factors such as the viscosity of mud breccia, eruption frequency, and conduit size [8,12]. Conical MVs, for example, are generated through successive mud flow deposits, whereas mud pies (i.e., low cone slope < 5%) or plateau-like MVs result from high water content in the mud breccia [13,14]. In both cases, the mud shows plastic behavior, with the yield strength decreasing as porosity increases [15]. The genesis of MVs is driven by pore-fluid pressure, buoyancy contrasts, and tectonic forces, with two primary models proposed: (1) the “solid model”, where MVs develop on mud diapirs, and (2) the “fluid model”, where fluidized mud arise along faults and fractures [10,16]. Recent studies indicate that MV morphology may serve as a potential indicator of regional tectonic stress [17]. Moreover, submarine MVs play a significative role in seafloor methane release, contributing between 2.2 and 6 Tg yr−1 of methane to the atmosphere, with deep-water MVs potentially emitting up to 27 Tg yr−1 [10], which requires further investigation taking into account episodic mud emissions and variability in the state of activity (quiescent versus eruptive) [18]. In addition to their environmental impact, MVs pose significant geohazards, including seafloor instability, slope failure, and occasional explosive eruptions [19].
Given the global importance of submarine MVs and their direct links to geological processes (e.g., tectonic deformations, subduction), as well as their potential but poorly understood impacts on marine ecosystems, this study seeks to better understand their variability and evolutionary trends. Through morphometric analysis of a wide range of morphologies, valuable insights are provided into the dynamic processes governing their formation, development, and associated geohazard implications.
This study aims to conduct a systematic morphometric analysis of submarine mud volcanoes to enhance understanding of their size, geometry, and distribution. Using a large, publicly available dataset [11], we investigate the intrinsic variability of submarine mud volcanoes, with a particular focus on those in the Mediterranean, which represent a significant portion of the dataset. Additionally, this study aims to distinguish morphometric differences between mud cones and mud pies, exploring their evolutionary trends.
2. Materials and Methods
In this study, we use the “Global inventory of submarine mud volcanoes” available in Zenodo (https://zenodo.org/records/13120956, accessed on 10 March 2025) [11]. The input database includes data (e.g., location, height, diameter, and, when available, water depth and mean slope) obtained from the scientific articles published in the last 30 years [20,21,22,23] as well as derived data (e.g., perimeter, area, volume, aspect ratio, and height/radius ratio).
Submarine MVs have been classified according to morphological types [8] (i.e., mud cones and mud pies) and based on size [24] (i.e., small, medium, large, and giant), allowing their analysis and comparison. The plan shapes of the basic areas were distinguished according to recent literature [25] (i.e., circular, sub-elliptical, elliptical, elliptical elongated, and super elliptical). In addition, MV classifications [26,27] were applied to identify potential matches with terrestrial onshore and Martian mud volcanoes. In the Global inventory of submarine mud volcanoes [28], tabulated submarine MVs without previous designations are labeled as “unnamed” and carry sequential identification numbers. Finally, for cases where different authors report submarine MVs with the same name, there are distinctive acronyms. A semi-automatic method has recently been adopted to extract key parameters [11,28], following recent literature on submarine volcanic settings [29,30,31]. Morphometric characterization (e.g., size, slope, shape, and morphological type) of submarine MVs may provide clues into the mechanisms and factors that drive their growth and evolution [32,33,34]. In the following section, we provide a brief description of this approach (Figure 2).
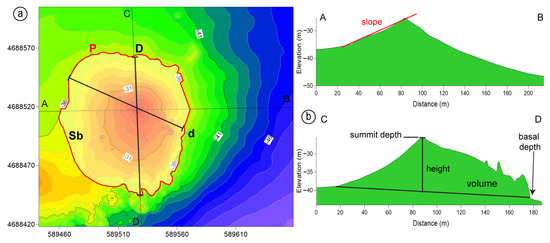
Figure 2.
(a) Bathymetric map of a submarine mud volcano. (b) Bathymetric profiles (A–B and C–D) showing some parameters used in the quantitative analysis of the submarine MVs. Note: The heights of the MVs are calculated as the difference between summit and basal depth. Note. Figure 2a is in UTM 33 North.
Submarine Mud Volcanoes. A total of 782 submarine MVs were analyzed morphometrically. For each submarine mud volcano, the following morphometric parameters were extracted:
- i.
- Size parameters: maximum (Dmax), minimum (Dmin), mean diameter (Dmean), basic area, basal perimeter, height, and volume. The basic perimeters are respectively calculated as 2π(√(Dmax2 + Dmin2)/2) or 2πR, the basic areas as πDmaxDmin/4 or πDmean2/4, and the volumes as πDmaxDminH/12 or πDmean2H/12 (Figure 2).
- ii.
- Shape parameters: basal ratio (bsr, d/D), axis ratio (Dmax/ Dmin), height versus radius of the mud volcano’s body (H/R ratio), vertical relief to area ratio (Height/Area), compactness factor (comf = Perimeter/(√4*π*Area)), ellipticity index (ei = (π*(Dmax /2)2)/Area), dissection index (di = (Perimeter/2*Area)*(√(Area/π)), and eccentricity (e = (√(Dmax/2)2 − (Dmin/2)2/Dmax/2).
- iii.
- Slope parameters: mean slope (arctan(H/R)).
3. Results and Discussion
3.1. Global Morphometric Characters of Submarine MVs
In this study, we conduct a morphometric analysis of 782 submarine mud volcanoes (MVs) selected from those listed in Tables S1 and S2 [28]. The submarine MVs are extremely variable in size and shape regardless of the water depth, such as for the mean H/R ratio ranging around 0.14 ± 0.08 (±1σ). Heights of submarine MVs vary from only 2 m to over 2 km (e.g., Honza in Izu-Ogasawara Trench [35]), with a mean (median) value of 174 m (130 m) (Table 1 and Figure 3). The radii range from very few meters to ∼21 km (e.g., Big Blue in the Mariana Forearc region [36]), with a mean (median) value of 1447 m (1210 m). Their mean slopes are also highly variable (Figure 3), from much less than 1° on extremely flattened forms (e.g., Atlante and Cyclops offshore Barbados [37]) to a max value usually of ~27° on purely conical forms (e.g., Chueca and Demetrio de Armas in the Gulf of Cadiz [34]; Figure 3) with a mean value of ~7.8°± 4.5° (±1σ) (Table 1).

Table 1.
Summary of main morphometric parameters of 782 submarine MVs (i.e., 570 mud cones and 212 mud pies) scattered around the world. H/R is the shape parameter corresponding to the ratio of height to radius of the submarine mud volcano. The minimum (min), maximum (max), mean (mean), median (median), standard deviation (std), variance (var), skewness (skew), and kurtosis (kurt) values are reported as shown.
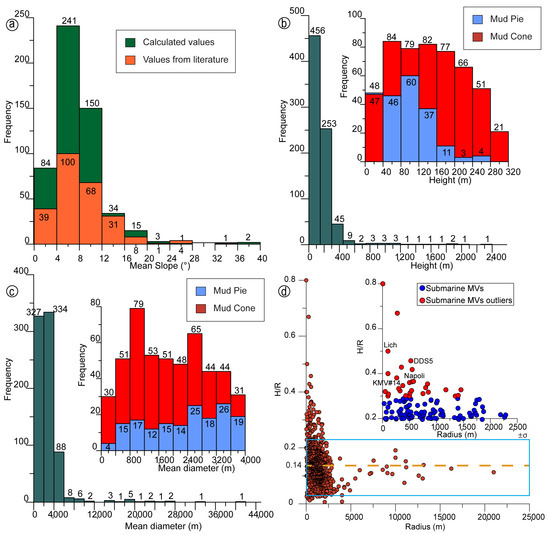
Figure 3.
(a) Frequency Histogram (N = 782) of the Mean slope (°) (a unimodal distribution with modal values between 4 and 8°). (b) Height (m) (overall peak between 70 and 170 m and asymmetrical tail towards higher values). (c) Mean diameter Dmean (m) with zoom in light blue. (d) Radius (m) versus H/R ratio (i.e., the ratio of the height to the radius) of the submarine mud volcano’s body (N = 782). The dashed orange line identifies the H/R mean value reported. The standard deviation range (σ) is highlighted in light blue. This graph shows the relationship between the size of mud volcanoes and their H/R ratio, providing an indication of the typical geometry and proportions of these structures. H/R values ≥ 0.3 are outliers for submarine MVs (e.g., Napoli and Lich in the Eastern Mediterranean Sea, DDS5 in the South China Sea, and KMV#14 in the Pacific Ocean).
Size Classification:
- Small mud volcanoes (N = 94; area < 0.5 km2), bound to a weak driving force, show a mean height of ~41 m (range = 2–183 m), a mean diameter of ~472 m (range = 10–800 m), a mean volume of ~0.004 km3 (range = 100 m3–0.02 km3), and a mean slope of ~10.8° (range = 0.7–38.7°). Note that some documented cases can reach heights up to ~340 m (e.g., El Cid in the Gulf of Cadiz was excluded from the analysis as complete morphometric values are not available).
- Medium mud volcanoes (N = 486; area 0.5–9 km2) show a mean height of ~138 m (range = 10–477 m), a mean diameter of ~2069 m (range = 800–3380 m), a mean volume of ∼0.21 km3 (range = 0.002–1.06 km3), and a mean slope of ∼8° (range = 1–26.5°).
- Large to giant mud volcanoes (N = 202; area > 9 km2), related to massive upwellings of mud breccia, show a mean height of ∼ 325 m (range = 14–2364 m), a mean diameter of ∼6006 m (3990–42,000 m), a mean volume of ∼20 km3 (range = 0.06–1092 km3), and a mean slope of ∼6.1° (range = 0.4–15.9°).
Giant mud volcanoes, unlike the globally widely distributed small and medium-sized ones, are mostly found in the Mariana region, in the south Caspian Sea, in the Mediterranean region (Calabrian accretionary wedge, Mediterranean Ridge accretionary complex, and west Nile deep-sea fan), in the Gulf of Cadiz, and off the Antarctic Peninsula (Figure 1). In this significant group are the best-known active mud volcanoes, among which are Conical and South Chamorro serpentinite mud volcanoes (resulting from the extrusion of serpentinite-rich mud) in the Mariana forearc [36] or unnamed mud volcanoes with recurrent eruptions from the south Caspian Sea [38].
Type classification:
- The mud cones (N = 570; mean slope > 5°) show extremely variable heights from 4 m up to 2364 m, with a mean height of ~203 m. Their mean diameters are between 10 m and ~42 km, with a mean diameter equal to ~2804 m. The mean slope value is ~9.5°. The mud cones are characterized by an H/D ratio between 0.02 and 0.4 and a vertical relief to an area up to 0.05 m−1. Of these, 153 mud cones show an ellipticity index (ei) between 1 and 2.74 and a dissection index (di) included between 1 and 1.25. Their basal ratio (bsr) ranges from 0.37 to 1.
- The mud pies (N = 212; mean slope < 5°) show lower heights from only 2 m up to 828 m, with a mean height of ~97 m. Their diameters range between hundreds of meters and ~22 km and the mean diameter is ~3136 m. The mean slope value is ~3.5°. The mud pies are characterized by an H/D ratio between 0.003 and 0.07 and a vertical relief to an area up to 0.00017 m−1. Of these, 78 mud pies show an ellipticity index (ei) between 1 and 5.82 and a dissection index (di) between 1 and 1.73. Their basal ratio (bsr) ranges from 0.17 to 1.
3.2. Geomorphometric Comparison and Evolutionary Trends
According to the “Global inventory of submarine mud volcanoes” [11], mud pies appear to be smaller than mud cones or at least lack very large cases (Dmean > 10 km; only Blue Moon in the Marianas in Figure 4). Scatterplots a and b in Figure 5 show how mud pies are generally more elongated in plan than mud cones (i.e., smaller bsr and greater deformability resulting from mud breccia with usually higher water content). Alberto da Ottaviano in the Mediterranean Ridge Accretionary Complex and MV69 in the south Caspian Basin offshore Azerbaijan are examples of irregular mud pies, characterized by super-elliptical plan shape, with high dissection index (di) and ellipticity index (ei). Mud breccia viscosity, pressure, conduit resistance versus edifice resistance, and the presence of fluid migration pathways such as local faults and/or fractures play a crucial role in influencing these distinct evolutionary trends [8,33,39]. As visible in Figure 4, the smaller steep mud cones (volume ~100 m3) represent the morphometric starting points (two overlapping submarine MVs named MSPs); the associated steepness could depend on the eruptive style and the composition of the mud breccia. These features align geometrically (i.e., simple conical shapes) with the morphometric starting points of the arc volcanoes described. In fact, we applied the classical morphological approach traditionally used for these features [33]. Although there are evident differences, the processes that regulate mud and magmatic volcano systems are thought to be dynamically similar [17,40].
Following the morphometric evolutionary trend and the corresponding type (mud cone or mud pie) (Figure 4), significant height gaps are identified within submarine MVs, such as 258–329 m and 511–611 m. These gaps become particularly evident in the transition from submarine MVs to the Mariana serpentinite MVs (i.e., 350–828 m; 611–720 m). The internal gaps may reflect critical thresholds beyond which two distinct evolutionary paths are possible: very large mud cones and mud pies continue to grow upward delineating steeper-sided morphologies (e.g., in the mud pie transition 329–350 m, from MV74 to Phytagoras; in the serpentinite mud cone transition 1461–1645 m, from Pacman to Fujin), or they grow laterally in diameter delineating gentler morphologies with even greater volumes (e.g., in the mud pie transition 258–329 m, from MV65 to MV74; in the mud cone transition 511–611 m, from unnamed 94 to MV55).
The morphometric evolutionary trend shown in Figure 4 displays that the giant mud cones (i.e., MV55) and mud pies (i.e., MV74) from sub elliptical to elliptical elongated of the south Caspian Sea (offshore Azerbaijan)—“the land of eternal fire” [41] with high density of submarine MVs [12]—represent the closest terms in size to the serpentinite mud volcanoes of the Marianas (Figure 4).
The Mariana serpentinite MVs (grouped in Figure 4; the lower end is Sumisu, the upper one is Big Blue), among which Quaker, Conical, Celestial, Honza, and Big Blue with calculated volumes, respectively, ranging from ∼ 212 km3 to ∼ 1092 km3 are the largest mud volcanoes on Earth [42]. They represent dimensional outliers compared to the others.
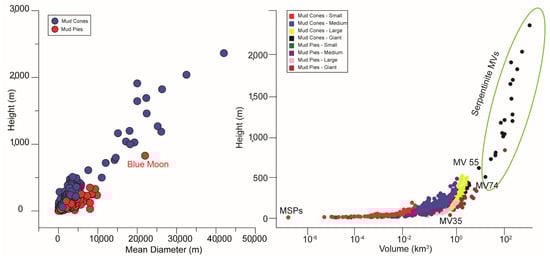
Figure 4.
On the left scatter plot, Height (m) vs. Mean diameter Dmean (m) of submarine MVs (N = 782). The data shows upper limits and internal gaps for the two different morphological classes, suggesting potential critical maximum heights and diameters of development. The associated equations corresponding to the best-fitting second-degree polynomial model of each category are as follows: Mud cones y = 0.0016x2 + 12.251x + 154.56 (R2 = 0.91), Mud pies y = 0.0017x2 + 24.195x + 769.65 (R2 = 0.78), and Submarine MVs y = 0.0019x2 + 11.326x + 769.49 (R2 = 0.82) (Modified from Kioka and Ashi (2015)) [43]. On the right scatter plot, Height (m) versus Volume (km3) (N = 782) shows submarine mud cones and mud pies divided according to their sizes. MSPs are two morphometric starting points from which the different trends depart. Some data points definable as outliers (e.g., MV35 in the Caspian Sea) deviate from the corresponding associated trends.
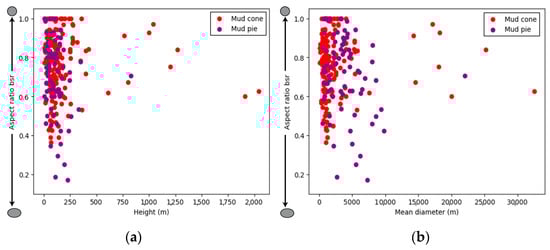
Figure 5.
(a) Scatter plot of Height (m) versus Aspect ratio bsr (Dmin/Dmax) of submarine MVs (N = 231), subdivided into Mud cones (red dots) and Mud pies (purple dots). (b) Scatter plot of Mean diameter Dmean (m) versus Aspect ratio bsr (Dmin/Dmax) of submarine mud volcanoes (N = 231), where Dmean = (Dmin + Dmax)/2. A smaller bsr indicates that the submarine mud volcano is more elongated in plain view, while a larger bsr indicates a sub-circular plan view shape. Modified from Kioka and Ashi (2015) [43].
3.3. Submarine MVs in the Mediterranean Sea
The Mediterranean Sea, likely due to extensive research in a scientifically and economically advanced region, hosts ~58% of the submarine mud volcanoes reported in the global MVs database [11]. Submarine MVs are clustered in several areas across a wide range of water depths (5–3600 m). The highest density occurs within the western Nile deep-sea fan [22] with eight submarine MVs per 100 km2 (Figure 6). The density of submarine MVs decreases considerably up to 0.3 per 100 km2 in the northern or southeastern Tyrrhenian Sea [44].
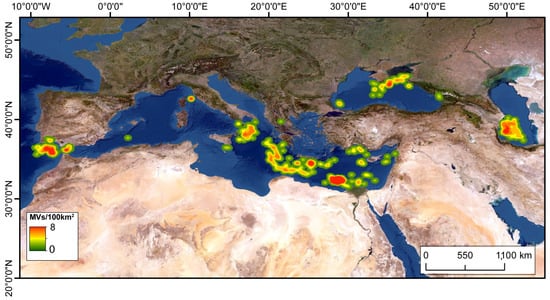
Figure 6.
Density map of submarine mud volcanoes in the Mediterranean.
Submarine MVs in the Mediterranean Sea (N = 459) have heights up to 511 m (i.e., unnamed 94 in the western Nile deep-sea fan, offshore Egypt [22]) with a mean (median) value of ~169 m (150 m) and mean diameters up to 8000 m (i.e., Pythagoras in the Calabrian accretionary prism, Ionian Sea, one of the largest submarine mud volcanoes in the entire Mediterranean Sea [45]) with a mean (median) value of ~2750 m (2710 m). They cover surfaces ranging between ~80 m2 and ~49.5 km2 (mean value of ~7 km2) and have volumes between 10–7 km3 and ~5.8 km3 (mean value of ~0.48 km3) (Figure 7).
Submarine MVs, as highlighted by their axis ratio, generally have sub elliptical (1–1.5; e.g., Amon and North Alex in the central Nile deep-sea fan, off the coast of Egypt [46]) or elliptical base (1.5–2; e.g., Luigi and Sorrento in Mediterranean Ridge Accretionary Complex [23]), although in some cases elliptical elongated (2–2.5, e.g., Pan di Zucchero-2 and Procida in Mediterranean Ridge Accretionary Complex [23]), or super elliptical (>2.5; e.g., Pan di Zucchero and Alberto da Ottaviano in Mediterranean Ridge Accretionary Complex [23]).
Submarine MVs have a great morphological variability as they can be defined as flat-topped (e.g., Amsterdam, Giza, and Novorossiysk in the Eastern Mediterranean [47]), dome-shaped (Lich and Napoli in the Eastern Mediterranean [48,49]), slightly conical (e.g., Kazan in the Anaximander Mountains, Eastern Mediterranean [50]), and conical mud volcanic edifices (e.g., unnamed 207 in the western Nile deep-sea fan, offshore Egypt [22]).
The most common submarine MVs in the Mediterranean are represented by medium-sized mud cones (slice in blue in Figure 7). Examples of these are, respectively, Saint Ouen l’Aumône and Kula [51] in the Eastern Mediterranean and Giunone [52] in the Calabrian accretionary prism in the Ionian Sea.
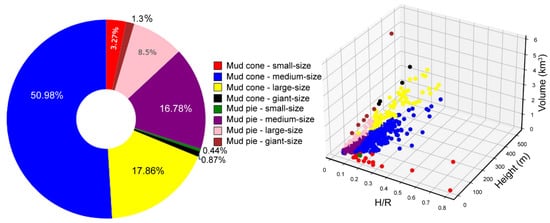
Figure 7.
Pie chart and 3D scatter plot relative to submarine MVs of the Mediterranean Sea (N = 459), differentiated by morphological type and size. In the 3D scatter plot, each data point represents a specific submarine mud volcano, characterized by H/R ratio (i.e., the ratio of the height to the radius) on the x-axis, Height (m) on the y-axis, and Volume (km3) on the z-axis. Within each category, different trends are visible and the range of values of the morphometric parameters is circumscribed (e.g., large mud cones with H/R ratio up to 0.29, heights up to 511 m, and volumes up to 2.69 km³; small mud cones with the widest range of H/R ratio values, i.e., up to 0.8, heights up to 183 m, and volumes up to 0.014 km3). Note that there are very few examples of small mud pies mentioned in scientific literature in the Mediterranean (e.g., Marrakech from the Alborán Sea [53]). This spatial distribution may be influenced by technological bias, as the resolution of vessel-mounted multibeam echo sounders decreases exponentially with increasing water depth. Additionally, it may reflect the limited availability of high-resolution bathymetric data in deep-sea environments.
3.4. Submarine MVs Frequency–Area Distribution
Scale-invariant size statistics have been documented for various natural phenomena [54]. They describe a statistical property in which size distributions follow the same pattern across different scales, indicating the absence of a characteristic or preferred size. This often appears as a power-law distribution, where smaller and larger structures maintain a consistent ratio regardless of the scale of observation. A prominent example is the frequency–magnitude relationship of earthquakes [55]. This approach has been crucial for estimating the recurrence time of earthquakes and for characterizing different seismotectonic regions based on the power-law exponent (β), which refers to the slope of the heavy tail seismicity distribution [56]. Consequently, this has direct implications for seismic hazard assessment. There has been growing interest in modeling other natural phenomena using similar statistical approaches, particularly in cases where collecting extensive samples is challenging [57]. This idea was further explored and consolidated in the context of geomorphology [58], including landslides, wildfires, and floods [59]. All these processes appear to follow a power-law behavior, which can also be fitted using a number of univariate statistical distributions. Their power-law exponents mark the decay trend of the given phenomenon, with larger values indicating a more rapid decrease in the number of observed processes, given their large spatial extent.
To the best of our knowledge, scale-invariant size statistics have not been tested yet on mud volcanoes. Therefore, characterizing the power-law exponent of mud volcanoes remains a task to be undertaken to match standard applications so common in other scientific branches. Here, we address this by fitting a double-Pareto simplified distribution separately for mud cones and pies. The choice of the double-Pareto simplified distribution is due to the dataset exhibiting heavy variability in both directions, meaning it contains both very small and very large values. Figure 8 demonstrates that a β value of approximately −2 is diagnostic of a distribution where the bulk is concentrated around small to very small submarine MVs, and only few extremely large ones occupy the right tail. Both mud cones and pies behave quite similarly, with the latter being characterized by a slightly larger power-law exponent. As no frequency–area distributions (FADs) appeared so far in marine geological literature, we opted to offer this as a reference analysis for future comparisons. Being a fractal diagnostic tool for magnitude, its value becomes evident in a comparative manner, as it may contextually inform on the state of development of MVs according to their spatial extent and numbers across any geographic scale.
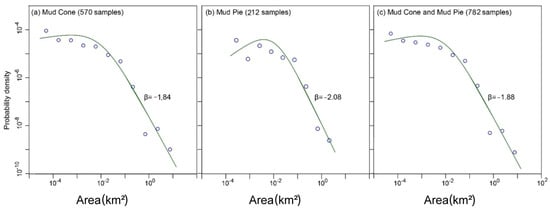
Figure 8.
Frequency–area distribution (FAD) curves for mud cones, mud pies, and for both. Scaling parameters β are reported respectively.
3.5. Geohazard Implications
Mud volcanoes can be a threat to submarine infrastructures, as they may affect drilling operations, stability pipeline routings, and the anchoring of wind farms [10]. A well-documented historical example of an explosive (earthquake-triggered) eruption of a submarine mud volcano was reported on the western Mediterranean Ridge in the Ionian Sea in August 1886 [60]. Another example of violent gas emissions is provided by the deep-sea subcircular Haakon Mosby mud volcano, located in the western Barents Sea. Here, a colossal methane plume, reaching 600 m in height, was visible on echo sounder systems during several cruises. Furthermore, methane jets emitted from the seafloor were systematically observed during diving with submarines [9].
In shallow water, gas eruptions from submarine mud volcanoes may threaten navigation [61]. Strong single-gas explosions are very dangerous because they can cause changes in water density and ship buoyancy [62]. In September 1952, a gas outburst from a submarine mud volcano sank the Kayo Maru 5, a Japanese science vessel, killing all 31 crew members [63]. More recent eruptions from very shallow mud volcanoes in the northern Tyrrhenian Sea (M1 Sp and M2 Sp [11]) have been documented by concerned local fishermen [64]. Therefore, shallow water mud volcanoes, such as Amfilochia Bay MV (Figure 9) with the top only 5 m deep in the water column [65], deserve special attention.
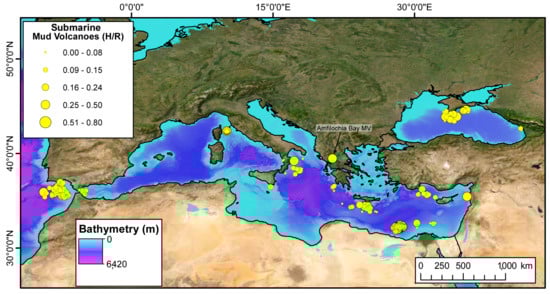
Figure 9.
Geographical distribution of submarine MVs in the Mediterranean divided according to the H/R ratio (i.e., the ratio of the height to the radius). High H/R ratios can indicate particularly recurrent emission activity.
In the scientific literature, it is reported how the summit crater diameter/basal diameter ratio can be a proxy of the magnitude of explosive activity [66]. High values suggest a more intense eruption and vice versa [67]. Unfortunately, the available scientific literature lacks systematic measurements at the summit part of submarine MVs. Nonetheless, considering the main outcomes coming out from Napoli et al. (2025) [11], we highlight some individual key points that should be considered in the geohazard assessment. A high and narrow submarine mud volcano (i.e., high H/R ratio >> 0.14; e.g., unnamed 185 in the western Nile deep-sea fan) is gravitationally more unstable than a short and wide one (i.e., low H/R ratio << 0.14; e.g., MV31 in the Caspian Sea) for very different reasons (e.g., higher center of mass, possible over steepening, significant hydrostatic pressure differences, differential erosion) representing a geohazard for the infrastructures (e.g., platforms, wind farms, pipelines) and human activities. Indeed, mass failures of submarine MVs can often act as tsunami triggers [19]. Furthermore, a high H/R ratio (i.e., H/R mud cones > 0.14 and H/R mud pies > 0.06; values calculated excluding the Mariana serpentinite MVs and not to be taken into account for them) (e.g., Napoli and Jessica in the eastern Mediterranean Sea, MV74 and MV88 in the Caspian Sea, DDS13 and DDS19 on the northeastern continental slope of the South China Sea [11]), while for small volumes may mainly reflect the viscosity of the extruded mud breccia [15], for larger volumes it may primarily indicate particularly recurrent emission activity over time (e.g., mud flows and/or aqueous fluid seepage) that affect surrounding areas and the marine ecosystem [13,16,68].
4. Conclusions
The main outcomes of this study can be an important baseline for understanding the formation and growth of submarine mud volcanoes (MVs) and their geohazard potential. The morphometric analysis of 782 MVs revealed significant variability in size and shape, independent of water depth. Heights range from 2 m to over 2 km, with radii up to ~21 km and slopes varying from <1° to ~27° (mean ~7.8°). MVs are categorized by size: small (N = 94, <0.5 km2), medium (N = 486, 0.5–9 km2), and large to giant (N = 202, >9 km2). Small MVs are steeper (~10.8°) and ~41 m high, while medium MVs reach ~138 m with gentler slopes (~8°). Large to giant MVs, linked to massive mud breccia upwellings, have an average height of ~325 m with slopes of ~6.1°. Giants MVs are concentrated in regions like the Mariana forearc, Caspian Sea, and Mediterranean Ridge. Two primary MV types emerge: mud cones (N = 570) and mud pies (N = 212). Mud cones are steeper (~9.5°) and taller (up to 2364 m), while mud pies have lower slopes (~3.5°), broader diameters, and more deformable elliptical shapes due to differences in viscosity, pressure, and fluid migration. Morphometric trends highlight distinct growth patterns that originate from very small mud cones. Internal gaps suggest key critical thresholds in MV evolution. The largest known MVs, such as Mariana serpentinite MVs, are dimensional outliers, reaching volumes up to ~1092 km3. In the Mediterranean (N = 459), MVs cluster in specific areas, with the highest density in the western Nile deep-sea fan (eight submarine MVs per 100 km2). They show varied morphologies, including flat-topped, dome-shaped, and conical forms. Medium-sized cones dominate, while smaller mud pies may be underrepresented due to mapping limitations. A frequency–area distribution (FAD) analysis shows power-law behavior (β ~−2), suggesting most MVs are small, with a few exceptionally large ones.
Furthermore, our findings contribute to both fundamental marine geology and applied geohazard assessment, ultimately supporting informed decision-making regarding submarine geohazards. Historical events, such as the 1886 Ionian Sea eruption and methane emissions from Haakon Mosby MV, highlight the significant geohazards posed by submarine MVs. Their eruptions can disrupt drilling, submarine infrastructure, and offshore wind farms. In shallow water, sudden gas expulsions may also endanger navigation. Finally, this study advances our understanding of MV morphology, classification, and hazards. Future research should employ high-resolution mapping and geophysical monitoring to refine hazard assessments and predictive models.
Author Contributions
S.N.: Writing—review and editing, Writing—original draft, Methodology, Investigation, Data curation, Conceptualization. D.S.: Writing—review and editing, Writing—original draft, Supervision, Methodology, Investigation, Data curation, Conceptualization. D.C.: Review and editing. F.L.C.: Review and editing. All authors have read and agreed to the published version of the manuscript.
Funding
This research received no external funding.
Data Availability Statement
The data used to support the findings of this study are available from D.S. daniele.spatola@uniroma1.it and from the corresponding author upon request or they can be downloaded from https://zenodo.org/records/13120956, accessed on 10 March 2025.
Acknowledgments
We would like to acknowledge our colleagues from the Department of Earth Sciences of Sapienza University for their valuable contributions to this research.
Conflicts of Interest
The authors declare no conflicts of interest.
References
- Loncke, L.; Mascle, J. Mud volcanoes, gas chimneys, pockmarks and mounds in the Nile deep-sea fan (Eastern Mediterranean): Geophysical evidences. Mar. Pet. Geol. 2004, 21, 669–689. [Google Scholar] [CrossRef]
- Judd, A.; Hovland, M. Seabed Fluid Flow: The Impact on Geology, Biology and the Marine Environment; Cambridge University Press: Cambridge, UK, 2007. [Google Scholar]
- Ma, G.; Zhan, L.; Lu, H.; Hou, G. Structures in Shallow Marine Sediments Associated with Gas and Fluid Migration. J. Mar. Sci. Eng. 2021, 9, 396. [Google Scholar] [CrossRef]
- Hovland, M.; Gardner, J.V.; Judd, A.G. The significance of pockmarks to understanding fluid flow processes and geohazards. Geofluids 2002, 2, 127–136. [Google Scholar] [CrossRef]
- Picard, K.; Radke, L.C.; Williams, D.K.; Nicholas, W.A.; Siwabessy, P.J.; Howard, F.J.F.; Gafeira, J.; Przeslawski, R.; Huang, Z.; Nichol, S. Origin of high density seabed pockmark fields and their use in inferring bottom currents. Geosciences 2018, 8, 195. [Google Scholar] [CrossRef]
- Spatola, D.; Dahal, A.; Lombardo, L.; Casalbore, D.; Chiocci, F.L. First Pockmark susceptibility map of the Italian continental margins. Mar. Pet. Geol. 2025, 176, 107337. [Google Scholar] [CrossRef]
- Cita, M.B.; Ryan, W.B.F.; Paggi, L. Prometheus mud breccia: An example of shale diapirism in the western Mediterranean ridge. Ann. Geol. Pays Hell. 1981, 30, 543–570. [Google Scholar]
- Kopf, A.J. Significance of mud volcanism. Rev. Geophys. 2002, 40, 2-1–2-52. [Google Scholar] [CrossRef]
- Sauter, E.J.; Muyakshin, S.I.; Charlou, J.L.; Schlüter, M.; Boetius, A.; Jerosch, K.; Damm, E.; Foucher, J.P.; Klages, M. Methane discharge from a deep-sea submarine mud volcano into the upper water column by gas hydrate-coated methane bubbles. Earth Planet. Sci. Lett. 2006, 243, 354–365. [Google Scholar] [CrossRef]
- Milkov, A.V. Worldwide distribution of submarine mud volcanoes and associated gas hydrates. Mar. Geol. 2000, 167, 29–42. [Google Scholar] [CrossRef]
- Napoli, S.; Spatola, D.; Casalbore, D.; Chiocci, F.L. Global Inventory of Submarine Mud Volcanoes [Data Set]; Zenodo: Geneva, Switzerland, 2025. [Google Scholar] [CrossRef]
- Mazzini, A.; Etiope, G. Mud volcanism: An updated review. Earth-Sci. Rev. 2017, 168, 81–112. [Google Scholar] [CrossRef]
- Dimitrov, L. Mud volcanoes—The most important pathways for degassing deeply buried sediments. Earth Sci. Rev. 2002, 59, 49–76. [Google Scholar] [CrossRef]
- Niemann, H.; Boetius, A. Mud Volcanoes. In Handbook of Hydrocarbon and Lipid Microbiology; Springer: Berlin/Heidelberg, Germany, 2010; pp. 205–214. [Google Scholar]
- Murton, B.J.; Biggs, J. Numerical modelling of mud volcanoes and their flows using constraints from the Gulf of Cadiz. Mar. Geol. 2003, 195, 223–236. [Google Scholar] [CrossRef]
- Menapace, W.; Kopf, A.; Zabel, M.; de Beer, D. 3. Mud volcanoes as dynamic sedimentary phenomena that host marine ecosystems. In Life at Vents Seeps; De Gruyter: Berlin, Germany, 2017; pp. 53–84. [Google Scholar]
- Bonini, M. Mud volcanoes: Indicators of stress orientation and tectonic controls. Earth-Sci. Rev. 2012, 115, 121–152. [Google Scholar]
- Kioka, A.; Tsuji, T.; Otsuka, H.; Ashi, J. Methane concentration in mud conduits of submarine mud volcanoes: A coupled geochemical and geophysical approach. Geochem. Geophys. Geosystems 2019, 20, 792–813. [Google Scholar]
- Asada, M.; Moore, G.F.; Kawamura, K.; Noguchi, T. Mud volcano possibly linked to seismogenic faults in the Kumano Basin, Nankai Trough, Japan. Mar. Geophys. Res. 2021, 42, 4. [Google Scholar] [CrossRef]
- Camerlenghi, A.; Pini, G.A. Mud volcanoes, olistostromes and Argille scagliose in the Mediterranean region. Sedimentology 2009, 56, 319–365. [Google Scholar] [CrossRef]
- León, R.; Somoza, L.; Medialdea, T.; Vázquez, J.T.; González, F.J.; López-González, N.; Casas, D.; del Pilar Mata, M.; del Fernández-Puga, M.C.; Giménez-Moreno, C.J.; et al. New discoveries of mud volcanoes on the Moroccan Atlantic continental margin (Gulf of Cádiz): Morpho-structural characterization. Geo-Mar. Lett. 2012, 32, 473–488. [Google Scholar] [CrossRef]
- Kirkham, C.; Cartwright, J.; Hermanrud, C.; Jebsen, C. The spatial, temporal and volumetric analysis of a large mud volcano province within the Eastern Mediterranean. Mar. Pet. Geol. 2017, 81, 1–16. [Google Scholar]
- Camerlenghi, A.; Cita, M.; Vedova, B.D.; Fusi, N.; Mirabile, L.; Pellis, G. Geophysical evidence of mud diapirism on the Mediterranean Ridge accretionary complex. Mar. Geophys. Res. 1995, 17, 115–141. [Google Scholar] [CrossRef]
- Etiope, G.; Milkov, A.V. A new estimate of global methane flux from onshore and shallow submarine mud volcanoes to the atmosphere. Environ. Geol. 2004, 46, 997–1002. [Google Scholar] [CrossRef]
- Dóniz-Páez, J. Volcanic geomorphological classification of the cinder cones of Tenerife (Canary Islands, Spain). Geomorphology 2015, 228, 432–447. [Google Scholar] [CrossRef]
- Bonini, M.; Mazzarini, F. Mud volcanoes as potential indicators of regional stress and pressurized layer depth. Tectonophysics 2010, 494, 32–47. [Google Scholar]
- Komatsu, G.; Okubo, C.H.; Wray, J.J.; Ojha, L.; Cardinale, M.; Murana, A.; Orosei, R.; Chan, M.A.; Ormö, J.; Gallagher, R. Small edifice features in Chryse Planitia, Mars: Assessment of a mud volcano hypothesis. Icarus 2016, 268, 56–75. [Google Scholar]
- Napoli, S.; Spatola, D.; Casalbore, D.; Lombardo, L.; Tanyas, H.; Chiocci, F.L. Comprehensive global inventory of submarine mud volcanoes. Sci. Data 2025, 12, 382. [Google Scholar] [CrossRef]
- Sulli, A.; Zizzo, E.; Spatola, D.; Morticelli, M.G.; Agate, M.; Iacono, C.L.; Gargano, F.; Pepe, F.; Ciaccio, G. Growth and geomorphic evolution of the Ustica volcanic complex at the Africa-Europe plate margin (Tyrrhenian Sea). Geomorphology 2020, 374, 107526. [Google Scholar] [CrossRef]
- Spatola, D.; Sulli, A.; Basilone, L.; Casalbore, D.; Napoli, S.; Basilone, G.; Chiocci, F.L. Morphology of the submerged Ferdinandea Island, the ‘Neverland’ of the Sicily Channel (central Mediterranean Sea). J. Maps 2023, 19, 2243305. [Google Scholar] [CrossRef]
- Rappaport, Y.; Naar, D.F.; Barton, C.C.; Liu, Z.J.; Hey, R.N. Morphology and distribution of seamounts surrounding Easter Island. J. Geophys. Res. 1997, 102, 24713–24728. [Google Scholar] [CrossRef]
- Grosse, P.; van Wyk de Vries, B.; Euillades, P.A.; Kervyn, M.; Petrinovic, I.A. Systematic morphometric characterization of volcanic edifices using digital elevation models. Geomorphology 2012, 136, 114–131. [Google Scholar] [CrossRef]
- Grosse, P.; van Wyk de Vries, B.; Petrinovic, I.A.; Euillades, P.A.; Alvarado, G.E. Morphometry and evolution of arc volcanoes. Geology 2009, 37, 651–654. [Google Scholar] [CrossRef]
- Sánchez-Guillamón, O.; Palomino, D.; Vázquez, J.T.; León, R.; Fernández-Puga, M.d.C.; López-González, N.; Medialdea, T.; Fernández-Salas, L.M.; Somoza, L. Morpho-sedimentary structure of new mud volcanoes on the Moroccan Atlantic continental margin (Gulf of Cadiz). Mar. Pet. Geol. 2023, 148, 106031. [Google Scholar]
- Fujioka, K. Serpentinite seamounts in the Izu-Bonin-Mariana Trenches and serpentinite bodies in the Outer zone of the Southwest Japan. Res. Rep. Kanagawa Pref. Mus. Nat. Hist 2012, 14, 181–192. [Google Scholar]
- Fryer, P.; Wheat, C.; Mottl, M. Mariana blueschist mud volcanism: Implications for conditions within the subduction zone. Geology 1999, 27, 103–106. [Google Scholar]
- Lance, S.; Henry, P.; Le Pichon, X.; Lallemant, S.; Chamley, H.; Rostek, F.; Faugères, J.-C.; Gonthier, E.; Olu, K. Submersible study of mud volcanoes seaward of the Barbados accretionary wedge: Sedimentology, structure and rheology. Mar. Geol. 1998, 145, 255–292. [Google Scholar] [CrossRef]
- Feyzullayev, A.A. Mud volcanoes in the South Caspian basin: Nature and estimated depth of its products. Nat. Sci. 2012, 4, 445–453. [Google Scholar] [CrossRef]
- Odonne, F.; Imbert, P.; Dupuis, M.; Aliyev, A.A.; Abbasov, O.R.; Baloglanov, E.E.; Vendeville, B.C.; Gabalda, G.; Remy, D.; Bichaud, V. Mud volcano growth by radial expansion: Examples from onshore Azerbaijan. Mar. Pet. Geol. 2020, 112, 104051. [Google Scholar]
- Wang, C.Y.; Manga, M. Hydrologic responses to earthquakes and a general metric. Geofluids 2010, 10, 206–216. [Google Scholar]
- Yergin, D. The Prize: The Epic Quest for Oil, Money & Power; Simon and Schuster: New York, NY, USA, 2011. [Google Scholar]
- Wheat, C.G.; Seewald, J.S.; Takai, K. Fluid transport and reaction processes within a serpentinite mud volcano: South Chamorro Seamount. Geochim. Cosmochim. Acta 2020, 269, 413–428. [Google Scholar]
- Kioka, A.; Ashi, J. Episodic massive mud eruptions from submarine mud volcanoes examined through topographical signatures. Geophys. Res. Lett. 2015, 42, 8406–8414. [Google Scholar] [CrossRef]
- Zhong, S.; Zhang, J.; Luo, J.; Yuan, Y.; Su, P. Geological characteristics of mud volcanoes and diapirs in the Northern Continental Margin of the South China Sea: Implications for the mechanisms controlling the genesis of fluid leakage structures. Geofluids 2021, 2021, 5519264. [Google Scholar]
- Praeg, D.; Ceramicola, S.; Barbieri, R.; Unnithan, V.; Wardell, N. Tectonically-driven mud volcanism since the late Pliocene on the Calabrian accretionary prism, central Mediterranean Sea. Mar. Pet. Geol. 2009, 26, 1849–1865. [Google Scholar]
- Dupré, S.; Woodside, J.; Foucher, J.-P.; de Lange, G.; Mascle, J.; Boetius, A.; Mastalerz, V.; Stadnitskaia, A.; Ondréas, H.; Huguen, C.; et al. Seafloor geological studies above active gas chimneys off Egypt (Central Nile Deep Sea Fan). Deep Sea Res. Part I Oceanogr. Res. Pap. 2007, 54, 1146–1172. [Google Scholar] [CrossRef]
- Limonov, A.F.; Woodside, J.M.; Cita, M.B.; Ivanov, M.K. The Mediterranean Ridge and related mud diapirism: A background. Mar. Geol. 1996, 132, 7–19. [Google Scholar] [CrossRef]
- Kopf, A.; Behrmann, J.H. Extrusion dynamics of mud volcanoes on the Mediterranean Ridge accretionary complex. Geol. Soc. Lond. Spec. Publ. 2000, 174, 169–204. [Google Scholar]
- Kioka, A.; Ashi, J.; Sakaguchi, A.; Sato, T.; Muraoka, S.; Yamaguchi, A.; Hamamoto, H.; Wang, K.; Tokuyama, H. Possible mechanism of mud volcanism at the prism-backstop contact in the western Mediterranean Ridge Accretionary Complex. Mar. Geol. 2015, 363, 52–64. [Google Scholar]
- Miramontes, E.; Pellegrini, C.; Casalbore, D.; Dupré, S. Active geological processes in the Mediterranean Sea. In Oceanography of the Mediterranean Sea; Schroeder, K., Chiggiato, J., Eds.; Elsevier: Amsterdam, The Netherlands, 2023; pp. 453–499. [Google Scholar]
- Lykousis, V.; Alexandri, S.; Woodside, J.; De Lange, G.; Dählmann, A.; Perissoratis, C.; Heeschen, K.; Ioakim, C.; Sakellariou, D.; Nomikou, P. Mud volcanoes and gas hydrates in the Anaximander mountains (Eastern Mediterranean Sea). Mar. Pet. Geol. 2009, 26, 854–872. [Google Scholar] [CrossRef]
- Ceramicola, S.; Praeg, D.; Cova, A.; Accettella, D.; Zecchin, M. Seafloor distribution and last glacial to postglacial activity of mud volcanoes on the Calabrian accretionary prism, Ionian Sea. Geo-Mar. Lett. 2014, 34, 111–129. [Google Scholar]
- Somoza, L.; Medialdea, T.; León, R.; Ercilla, G.; Vázquez, J.T.; Hernández-Molina, J.; González, J.; Juan, C.; Fernández-Puga, M.C. Structure of mud volcano systems and pockmarks in the region of the Ceuta Contourite Depositional System (Western Alborán Sea). Mar. Geol. 2012, 332, 4–26. [Google Scholar]
- White, E.P.; Enquist, B.J.; Green, J.L. On estimating the exponent of power-law frequency distributions. Ecology 2008, 89, 905–912. [Google Scholar]
- Gutenberg, B.; Richter, C.F. Frequency of earthquakes in California. Bull. Seismol. Soc. Am. 1944, 34, 185–188. [Google Scholar]
- McGuire, J.B.; Schneeweis, T.; Branch, B. Perceptions of firm quality: A cause or result of firm performance. J. Manag. 1990, 16, 167–180. [Google Scholar]
- Corral, Á.; González, Á. Power law size distributions in geoscience revisited. Earth Space Sci. 2019, 6, 673–697. [Google Scholar]
- Turcotte, D.L. How does Venus lose heat? J. Geophys. Res. Planets 1995, 100, 16931–16940. [Google Scholar]
- Casas, D.; Chiocci, F.L.; Casalbore, D.; Ercilla, G.; De Urbina, J.O. Magnitude-frequency distribution of submarine landslides in the Gioia Basin (southern Tyrrhenian Sea). Geo-Mar. Lett. 2016, 36, 405–414. [Google Scholar]
- Hieke, W. The August 27, 1886 earthquake in Messenia (Peloponnesus) and reported flames over the Ionian Sea a Mediterranean Ridge gas escape event? Mar. Geol. 2004, 207, 259–265. [Google Scholar] [CrossRef]
- Casalbore, D.; Ingrassia, M.; Pierdomenico, M.; Beaubien, S.E.; Martorelli, E.; Bigi, S.; Ivaldi, R.; DeMarte, M.; Chiocci, F.L. Morpho-acoustic characterization of a shallow-water mud volcano offshore Scoglio d’Affrica (Northern Tyrrhenian Sea) responsible for a violent gas outburst in 2017. Mar. Geol. 2020, 428, 106277. [Google Scholar] [CrossRef]
- Ustyugov, G.; Ershov, V. Mud volcanism as a dangerous phenomenon for oil and gas facilities. In Proceedings of the IOP Conference Series: Earth and Environmental Science, Jakarta, Indonesia, 23–25 March 2021; p. 012030. [Google Scholar]
- Bogoyavlensky, V.; Bogoyavlensky, I.; Nikonov, R.; Kishankov, A. Complex of geophysical studies of the Seyakha catastrophic gas blowout crater on the Yamal Peninsula, Russian Arctic. Geosciences 2020, 10, 215. [Google Scholar] [CrossRef]
- Spatola, D.; Casalbore, D.; Pierdomenico, M.; Conti, A.; Bigi, S.; Ingrassia, M.; Ivaldi, R.; Demarte, M.; Napoli, S.; Chiocci, F. Seafloor characterisation of the offshore sector around Scoglio d’Affrica islet (Tuscan Archipelago, northern Tyrrhenian Sea). J. Maps 2023, 19, 2120836. [Google Scholar]
- Kordella, S.; Christodoulou, D.; Fakiris, E.; Geraga, M.; Kokkalas, S.; Marinaro, G.; Iatrou, M.; Ferentinos, G.; Papatheodorou, G. Gas seepage-induced features in the hypoxic/anoxic, shallow, marine environment of amfilochia bay, amvrakikos gulf (Western Greece). Geosciences 2021, 11, 27. [Google Scholar] [CrossRef]
- Fagents, S.A.; Lanagan, P.; Greeley, R. Rootless cones on Mars: A consequence of lava-ground ice interaction. In Volcano–Ice Interaction on Earth and Mars; Geological Society of London: London, UK, 2002; Volume 202, pp. 295–317. [Google Scholar]
- Wang, L.; Zhao, J.; Huang, J.; Xiao, L. An explosive mud volcano origin for the pitted cones in southern Utopia Planitia, Mars. Sci. China Earth Sci. 2023, 66, 2045–2056. [Google Scholar]
- Di Bella, L.; Pierdomenico, M.; Conte, A.M.; Cornacchia, I.; Ruspandini, T.; Spatola, D.; Beaubien, S.E.; Bigi, S.; Conti, A.; Gaglianone, G.; et al. The influence of shallow-water methane emissions on foraminiferal assemblages: The case of Scoglio d’Affrica (Northern Tyrrhenian Sea, Mediterranean Sea). Mar. Pet. Geol. 2024, 170, 107130. [Google Scholar]
Disclaimer/Publisher’s Note: The statements, opinions and data contained in all publications are solely those of the individual author(s) and contributor(s) and not of MDPI and/or the editor(s). MDPI and/or the editor(s) disclaim responsibility for any injury to people or property resulting from any ideas, methods, instructions or products referred to in the content. |
© 2025 by the authors. Licensee MDPI, Basel, Switzerland. This article is an open access article distributed under the terms and conditions of the Creative Commons Attribution (CC BY) license (https://creativecommons.org/licenses/by/4.0/).