Article

Using 14 Years of Satellite Data to Describe the Hydrodynamic Circulation of the Patras and Corinth Gulfs

by
Basile Caterina
* and
Aurélia Hubert-Ferrari
SPHERES, Department of Geography, University of Liège, 4000 Liège, Belgium
*
Author to whom correspondence should be addressed.
J. Mar. Sci. Eng. 2025, 13(3), 623; https://doi.org/10.3390/jmse13030623
Submission received: 28 February 2025 / Revised: 17 March 2025 / Accepted: 19 March 2025 / Published: 20 March 2025
(This article belongs to the Section Physical Oceanography)

Abstract

:
In the absence of in situ data, remote sensing becomes one of the most effective methods for analyzing the hydrodynamics of a basin. In the Gulf of Corinth, the lack of in situ information was addressed using 14 years of satellite data from the Copernicus database to investigate the water circulation dynamics of the Gulfs of Patras and Corinth. The combination of satellite observations and Data Interpolating Empirical Orthogonal Function (DINEOF) methods produced comprehensive maps detailing the hydrodynamic patterns in both gulfs. Despite the paucity of some parts of the datasets, the remaining data revealed key hydrodynamic features through their observations. From the western Patras Gulf to the eastern Corinth Gulf, gyres were the dominant features. The Patras Gulf is primarily characterized by a cyclonic gyre, while the Rio–Antirio Strait, which connects the two gulfs, exhibits unique dynamics due to internal wave activity and upwelling events. Currents generated near the strait flow toward the Corinth Gulf, where they are mostly trapped in an anticyclonic gyre near Itea Bay and a cyclonic gyre near Antikyra Bay. Our analysis highlights the unique dynamics of enclosed gulfs connected to the open sea via a strait. In this case, the Corinth Gulf acts as a smaller-scale analog to the Mediterranean Sea, offering insights into similar hydrodynamic behaviors. The updated hydrodynamic data also improve our understanding of sediment transport pathways and the chlorophyll distribution under present and past conditions.

1. Introduction

Understanding the hydrodynamics of a coastal area is crucial for several applications. It is, for example, essential for unraveling the sedimentary deposit distribution, including general pollutants and nutrient availability, such as chlorophyll, which forms the base of the marine food chain. Nowadays, the oceanography of most regions around the world is quite well understood, particularly thanks to oceanographic databases such as the World Ocean Database (WOD), and Copernicus, as well as satellite data [1,2]. However, there remain several important but poorly understood regions, such as the Patras and Corinth Gulfs, where significant oceanographic phenomena occur but are not well comprehended.
Since the last comprehensive oceanographic study of the Corinth and Patras Gulfs by Lascaratos et al. in 1989 [3], there has been a significant gap in published information on the oceanography of these regions. This previous general study lacked some of the technologies we have today. Also, in their study, Lascaratos et al. (1989) used only 12 images over 152 available at the time, covering only 1 year and 5 month (June 1981 to November 1982; [3]). Having access to a higher-resolution dataset over 14 years will allow us to observe events that were maybe missing from the study by Lascaratos et al. [3]. Over the past 35 years, advancements in methods and knowledge have greatly enhanced our ability to characterize hydrodynamic phenomena. Despite these improvements, the availability of oceanographic data remains limited. In situ databases from the Gulf of Corinth are often scarce and insufficient to infer general hydrodynamic patterns. While modeling efforts, such as those by Fourniotis and Horsh (2010, 2015) [4,5], have been conducted for the Patras Gulf, the Gulf of Corinth remains largely unstudied. Hence, like Lascaratos’s approach in the 1980s, leveraging available satellite data presents a valuable method for studying the general hydrodynamics of the Corinth Gulf. Present-time satellite data offer a better resolution and better coverage than in the 1980s while computer can also manage bigger datasets with ease.
Despite the lack of oceanographic knowledge over the main processes in the Gulf of Corinth, this area has been studied from a geological point of view. Regarding the sediment dynamics, it is still unclear what are the origins of all the patterns that are observed. Even determining which configuration caused which sediment deposition, allowing us to have an idea of the actual hydrodynamic conditions, will help to limit the hypotheses [6,7]. Indeed, information over the hydrodynamics can be expected from the geological data such as the orientation of the depositional currents in some areas [6,8], the strength of some currents depending on the location [7] or even the paucity in chlorophyll (CHL) in some regions, informing about potential poor CHL currents [9,10]. But these hints alone can never fully explain what is happening at the scale of the Corinth Gulf in terms of hydrodynamics.
Therefore, the goal of this study is to better assess the major hydrodynamic processes occurring in the Patras and Corinth Gulfs. This will primarily be achieved by analyzing sea surface temperature (SST) maps derived from satellite data over a 14-year period. Additionally, chlorophyll (CHL) satellite data will be utilized to complement the information obtained from SST observations. Once the hydrodynamic structures are identified and described, the observed phenomena will be contextualized within the general hydrodynamic framework of the Patras and Corinth Gulfs. Subsequently, a Data Interpolating Empirical Orthogonal Function (DINEOF) analysis will be conducted as defined in [11,12]. This analysis, which involves interpolating missing data in a manner similar to principal component analysis (PCA), will provide insights into the temporal and spatial variations in the identified phenomena. Through this comprehensive analysis, an overview of the entire dataset will be achieved, enhancing our understanding of the hydrodynamic processes in these regions.

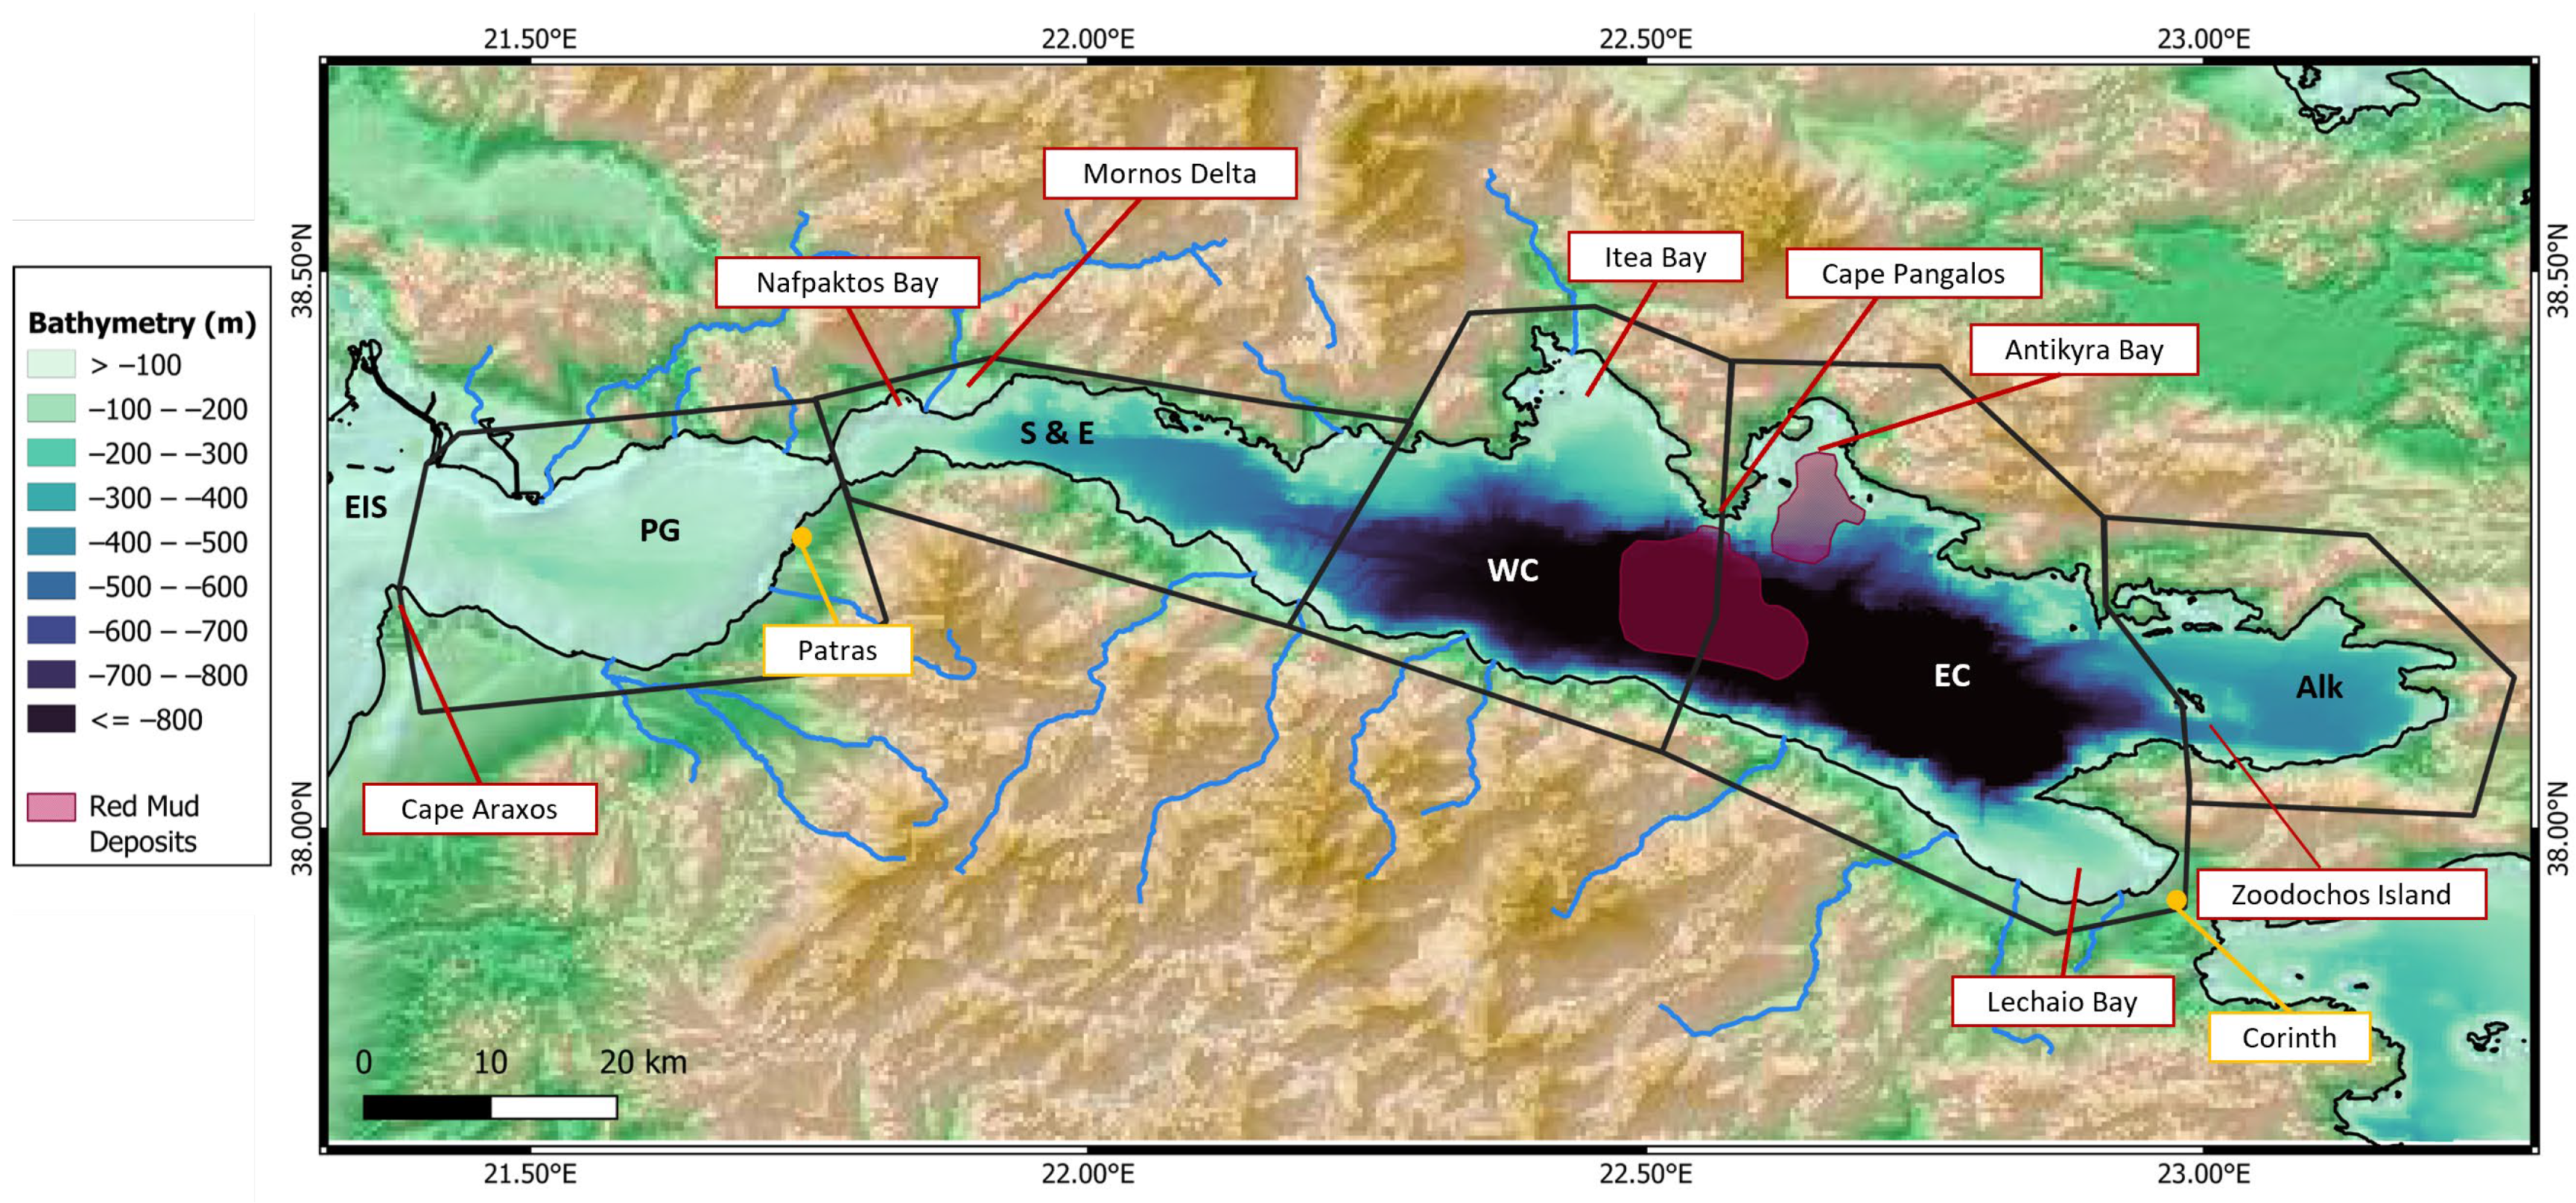
2. Physiography and Oceanography of the Gulfs

The Gulf of Corinth is the active rift basin separating mainland Greece from the Peloponnesus. This basin, approximately ~900 m deep, 130 km long and 40 km wide, is connected to the smaller, almost circular, shallow Gulf of Patras, which is only 120 m deep and 20–25 km wide. The Patras basin is connected to the Ionian Sea in the west. The connection between the two gulfs is made by the Rio–Antirio Strait, which plays an important role in the hydrodynamic circulation of the water masses [7]. This strait is about 2 km wide and 70 m deep. At the eastern end of the Corinth Gulf, the connection with the Aegean Sea is made by the Corinth Canal. This 6.5 km long and 21 m wide man-made canal, with an average depth of only 8 m, cannot be considered as an actual substantial oceanic connection [13].

2.1. Physiography of the Studied Regions

The study area extends from 21.3° E to 23.3° E and comprises the Patras and Corinth Gulfs, which are separated by a 12 km long Rio–Antirio strait area. The Rion strait sensu-stricto is defined by the narrowest 2 km wide opening at the location of the Rio–Antirio bridge, near the ~70 m deep Rion Sill [7].
We have divided the study area into six different regions based on their distinct physiographic characteristics (Figure 1). From west to east, there are the Ionian Sea, the Patras Gulf, the Strait and Corinth Entrance, the West Corinth, the East Corinth and the Alkyonides Gulf Regions. The difference in physiography of these regions is strongly related to varying tectonic deformations, sediment supply and hydrodynamics processes which have shaped the seafloor morphology [6].
We designated the shallow waters west of Cape Araxos as the Ionian Sea Region. This area is a 6 km wide shallow water zone and is where the large Achelos River discharges.
The Patras Gulf Region is an extensional and slowly subsiding tectonic basin, with an opening rate of 7 mm/yr [14], and is filled with Plio–Quaternary sediments [15]. This wide, round-shaped basin has a mean depth of 56 m and a ~138 m deep central depocenter controlled by normal faulting [16]. On its northeastern side, the deformation pattern changes with a dominant right-lateral deformation along its southeast coastline (Rion–Patras strike-slip fault [14]). The gulf narrows sharply and ends at the Rion Strait sensu stricto. The first ~50 m deep Patras Sill occurs 3 km west of the Rion Strait and marks the eastern boundary of our defined Patras Gulf Region. Several relatively large rivers flow to the Patras Gulf, namely the Evinos River (from the north) and the Glafkos and the Piros (from the south).
Figure 1. Bathymetry (in meters) map [17] of the 6 different regions of the study area: Eastern Ionian Sea (EIS), Patras Gulf (PG), Strait and Entrance (S and E), West Corinth (WC), East Corinth (EC) and Alkyonides (Alk) (from west to east). The smaller locations are in red, and the cities of Patras and Corinth are represented in yellow. The red mud deposit locations are positioned according to Iatrou et al., 2010 [18].
Jmse 13 00623 g001
Located to the east of the Patras Gulf, the Strait and Corinth Entrance Region is a complex physiographic zone characterized by an eastward deepening of its seafloor, which is the fastest present-day deforming area (11 mm/yr [14]). The western part includes the Rio–Antirio Strait area that comprises in its center the ~115 m deep fault-bounded Nafpaktos Bay. The eastern part shows first a widening and a deepening to ~430 m over a length of ~3 km and then the occurrence of a plateau. This part of the Corinth Gulf is bordered to the south by steep slopes with an absent or a very narrow shelf and active normal faults near the coastline, while the northern subsiding side has a much wider shelf with bays. The boundary between the Strait and Corinth Entrance and the West Corinth Regions is marked on the seafloor by a ~600 m deep tectonic horst bounded to the east by a canyon (Figure 1).
The West Corinth Region is characterized by an eastward seafloor widening and deepening to ~870 m depth. The central part of the West Corinth Region is a 9 km wide, ~850 m deep, WNW-ESW elongated flat area. Like in the eastern part of the Strait and Corinth Entrance, the southern coastline is straight and faulted; it is immediately followed by a steep slope without a shelf, ending in the ~850 m deep flat bottom basin. The northern subsiding shoreline is more convoluted and marked by the SSE-oriented, ~10 km wide, ~20 km long, 0–300 m deep Itea Bay, hanging above the ~850 m deep basin bottom to the south. Its eastern boundary with the Eastern Corinth Region is marked by a north–south-oriented, 15 km long Cape Pangalos.
East Corinth exhibits many similarities with West Corinth. It features the same 12 km wide, ~850 m deep flat central area and similar southern steep slopes and faulted coastlines without shelves. Its northern shore shows the gently southward-sloping, 7.5 km wide, 15 km long, 0–300 m deep Antikyra bay hanging above the ~850 m deep flat depocenter and is bordered to the east by a canyon. At the southeastern extremity of this region lies the Lechaio bay, ending with the Corinth Canal. East Corinth is limited to the east by an abrupt shallowing of the bathymetry, marked by Zoodochos Island and by the shallow bay of Lechaio in the south-east.
The Alkyonides Gulf Region, east of Zoodochos Island, is 13 km wide and 22 km long and has a maximum depth of 360 m. Its northern edge is convoluted and marked by small bays, whereas its southern edge is fault bounded, straight and steep.

2.2. Oceanography of Patras and Corinth Gulfs

The hydrological properties of both gulfs exhibit typical seasonal stratification in summer and mixing in winter [19,20]. In the Corinth Gulf, the SST is approximately 25 °C in summer and 13.6 °C in winter [20]. At a depth of 200 m, temperatures are around 13.3 °C in summer and 12.8 °C in winter, based on the 1970 dataset [21]. In the Patras Gulf, central waters reach around 25 °C in summer, while waters near the Rio–Antirio Strait are cooler, about 23 °C [19]. The salinity in the Patras Gulf is slightly higher due to the mixing between the salty waters from the Ionian Sea (38.6–38.7) and the less salty waters from the Gulf of Corinth (38.3–38.5) [19,21].
Two major hydrodynamic processes have already been identified in the two gulfs. The first type is gyres, and they are mainly driven by the winds that were described in the two gulfs. The prevailing winds are mostly E or WSW oriented and are funneled by the surrounding mountain ranges [20,22]. Cyclonic gyres have been observed in surface waters in the eastern Corinth Gulf in front of Antikyra Bay and in the Patras Gulf using satellites data [3]. In Patras, the hydrodynamic models show [4,5] that the wind-induced cyclonic gyre affects the entire gulf, with colder waters in its center. The second type of hydrodynamic processes is wind-induced upwellings. These have been evidenced on the northern shoreline of the Corinth Gulf and in the northeast part of Nafpaktos Bay between the two gulfs by using satellite data [3]. An upwelling was evidenced by modeling in front of the city of Patras [23].
Between the two gulfs, the hydrodynamic circulation is controlled by the tides [7]. Even if the Corinth and Patras Gulfs are characterized by a microtidal environment with an average tidal amplitude variation of 15 cm, the constriction at the location of the Rion–Antirion strait area generates a strong amplification of the tidal currents. Surface current velocity can reach up to 1 m/s and bottom currents up to 3 m/s to 6 m/s, as evidenced by ADCP data [7]. High-velocity surface currents in the Rio–Antirio Strait area have also been observed in a hydrodynamic model [4] that focused on the Patras Gulf. This model highlights the funneling of waters at the Rio–Antirio strait sensu stricto. The effects of the tides are the following: During flood tide, the surface waters are rising from Corinth (considered as the open basin) towards Patras (closed basin). During ebb tide, the surface waters flow from Patras to Corinth [7]. The very-high-velocity bottom currents are associated with a strong internal tide. The Corinth internal tide operates differently from the surface oceanic tides. Since the internal tide frequency is twice the one from the oceanic tide, during flood tide, if the phases of both tides align with the deep water from Corinth, it can overflow the bathymetric step of the strait and cross it to reach the Patras Gulf from the bottom. In other situations, the bottom water flow should be reflected back to the Corinth basin, not crossing the strait.

3. Materials and Methods

3.1. Data Aquisition

All the SST data (Table 1) were downloaded from the CMEMS catalog [2] as NETCDF datasets [24]. The L3-level sea surface temperature data in high resolution (0.01 × 0.01 degree) were used since the studied area is quite small (120 km × 40 km). Data from 1 January 2008 to 20 January 2022 were downloaded and utilized for this study.

3.2. Data Preprocessing and Filtering

After downloading and reading the data, they were pre-processed by creating a mask for SST outliers and land pixels. This step eliminated the days with excessive missing data (>95%) over the studied period. With this step, the number of available days went from 5127 to 3838, which represents a loss of 25% of the initial dataset. Despite this basic treatment, the quality of the dataset often remains poor depending on the days. The filter was set to 95% in order to keep a good amount of data but also to eliminate the days with only a few pixels of information.
In addition to the SST, chlorophyll (CHL; Table 1; [25]) data from satellite datasets over the same 2008–2022 period were observed. The selection and refinement process for CHL data was the same as for the SST data. For this dataset, the restriction of the 95% maximum missing data made us go from 5154 days to 3093 days.

3.3. Selection of Key Hydrodynamic Events

The mean SST was then calculated across the entire region, first by longitude, then by latitude, to obtain an overview over its temporal evolution. Regional SST means and standard deviations were calculated to compare each region (Figure 1). A temporal examination of SST maps was conducted, and 64 daily maps showing significant spatial changes in SST related to major and regional hydrodynamic processes in the Patras and Corinth Gulfs were manually selected. This initial review allowed us to visually identify days with notable oceanographic events. We also examined SST maps 2 days before and 2 days after the 64 selected dates to understand the temporal evolution of the observed SST variations and confirm the hydrodynamics processes responsible for the changes. Manual selection of these dates allowed us to identify images where spatially continuous events occurred, even if the map was not totally covered by the data.
Only L3 CHL data maps were analyzed to confirm hydrodynamics processes in the selected SST maps and to identify other possible hydrodynamics phenomena. Some of the selected maps were kept to illustrate key hydrodynamics features.

3.4. DINEOF Reconstruction and Statistical Analysis

To complement this initial analysis based on selected SST and CHL maps, a statistical analysis of the entire SST dataset was performed. No statistical analysis was conducted on the CHL data due to their poor quality, despite the valuable information provided by the raw maps. The statistical analysis of the pre-processed SST data was conducted using the Data Interpolating Empirical Orthogonal Function (DINEOF [11,12]). DINEOF is a data analysis technique used to reconstruct missing satellite data and perform statistical analysis. It is especially suited for oceanographic datasets. Here, it was used to fill in missing data caused by clouds and other factors in the pre-processed data and to quantify the spatial and temporal variability of the SST.
There are four steps in DINEOF analysis. It begins by decomposing the signal into Empirical Orthogonal Functions (EOFs) that represent the dominant modes of variability in the dataset. These modes capture the most significant spatial structures and variations in the data. Then, using the determined EOFs, the missing data are reconstructed. To reduce noise in the EOFs, a Laplacian filter was applied within the iterations of the DINEOF analysis. The strength of this filter ensures a realistic calculation of the SST while reducing gradient and some local information loss [11]. The third step of DINEOF analysis is an iterative process to adjust the EOFs and the estimated missing data values until the reconstruction converges to a stable solution. This process results in an optimized reconstruction that preserves the statistical properties and variability of the original dataset as closely as possible [11,12].
For the DINEOF analysis performed, the parameters were set as follows: α (strength of the filter) is set to 0.1; the number of iterations (“numit”) for the filter is 3, and at most 50 EOF modes are asked. Other parameters were set by default. Since the studied area is quite small, DINEOF was able to run successfully for the entire 14-year period, rather than requiring year-by-year interpolation, as used in larger oceanic areas [11]. The results of the DINEOF analysis were exported as a new NETCDF file and read by using the Julia programming language [26]. From this newly interpolated dataset, the same dates as in the initial SST dataset were saved as maps to examine the same phenomena and their SST variations with fully filled maps.

4. Results

4.1. SST and CHL Data in the Patras and Corinth Gulfs

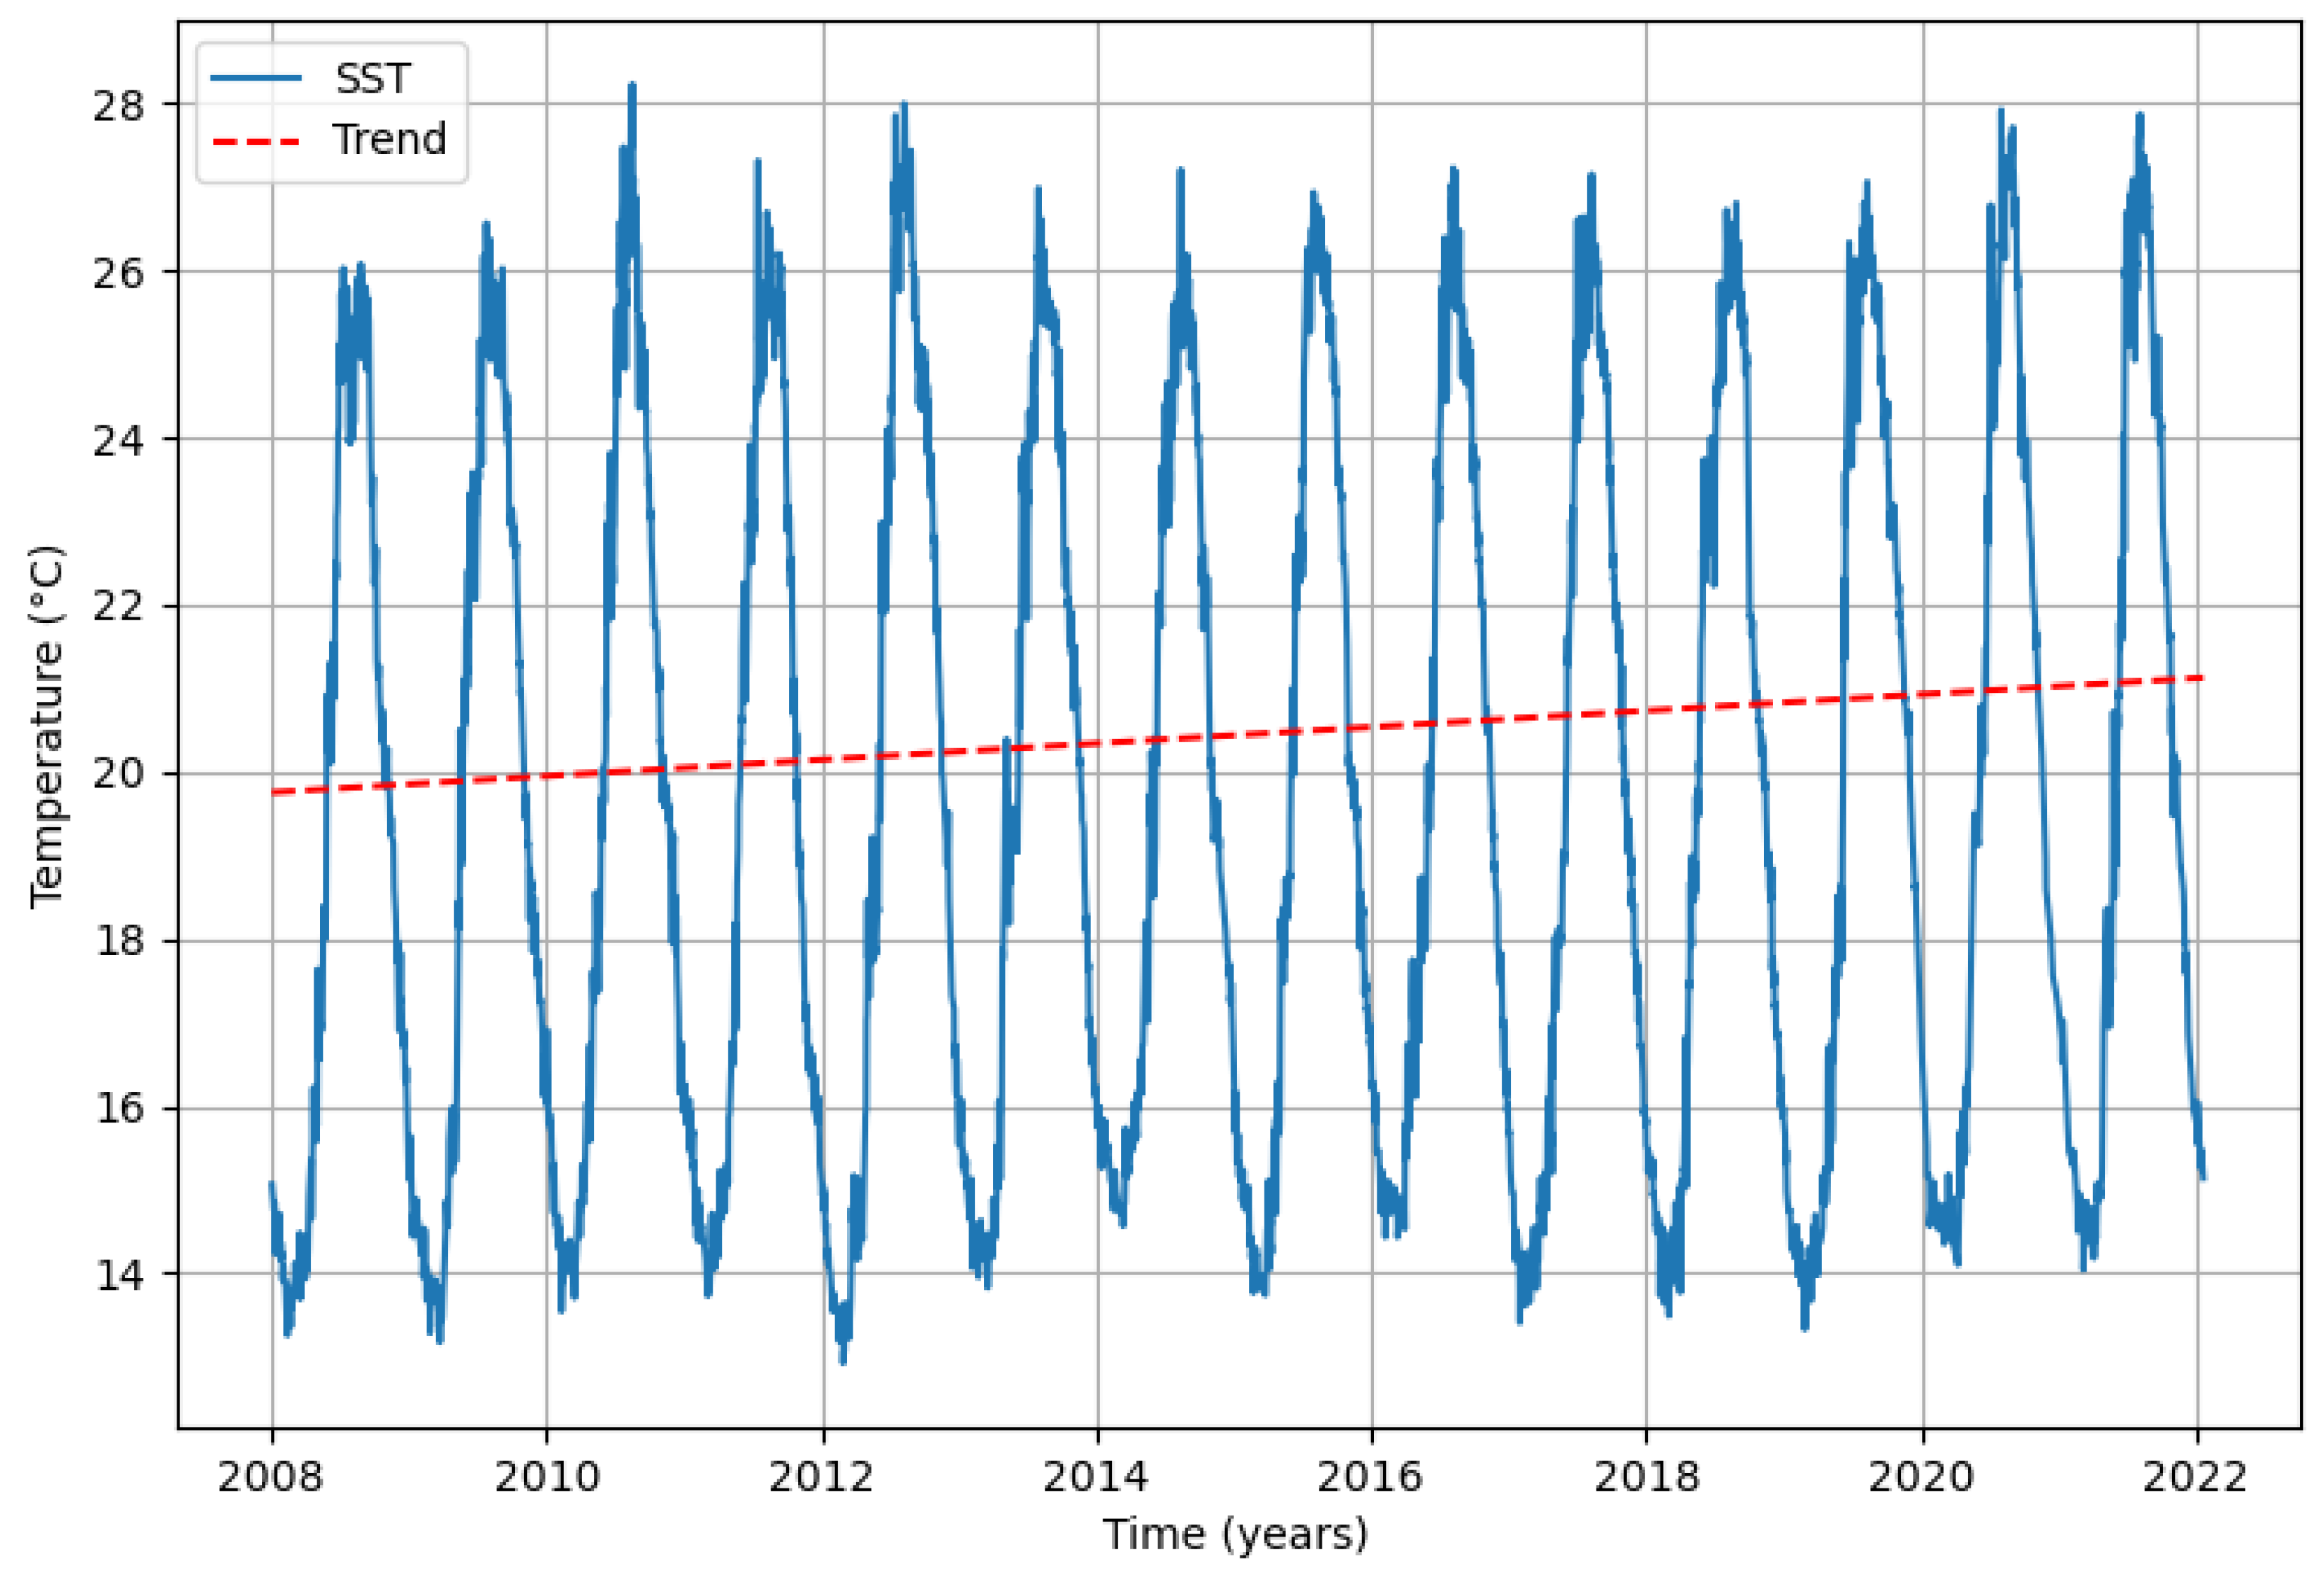
4.1.1. Mean SST Changes

Over the 14 years covered by the SST data (Figure 2), mean SSTs ranged between 13.1 °C and 28.2 °C. A major seasonal variability was evidenced with a temperature drop of around 12 °C between summer and winter. Examining the different regions defined in Figure 1, the Ionian Sea Region is consistently warmer than the Patras Gulf, particularly in winter and slightly less so in summer. This pattern was previously noted by Lascaratos et al. (1989) [3]. Between the Patras and Corinth Gulfs, the differences in temperatures are minimal if the Strait and Entrance Region is not considered. The most significant difference between regions is that the Strait and Entrance Region is always the coldest (Table 2). This was also observed by Rubi et al. (2022) [7] for the entire year of 2019. The temperature difference is more pronounced in summer, with a 0.9 °C of difference in the mean SST compared to the far east of the Corinth Gulf and the Alkyonides Gulf Region (Table 2). When both gulfs are observed as a whole, clear evidence of the increase in the SST is observed, showing a ~1.4 °C increase in the mean in 14 years (0.0977 °C/year). This increase in temperature is two to three times higher than what is commonly observed for the Mediterranean Sea [27,28,29].

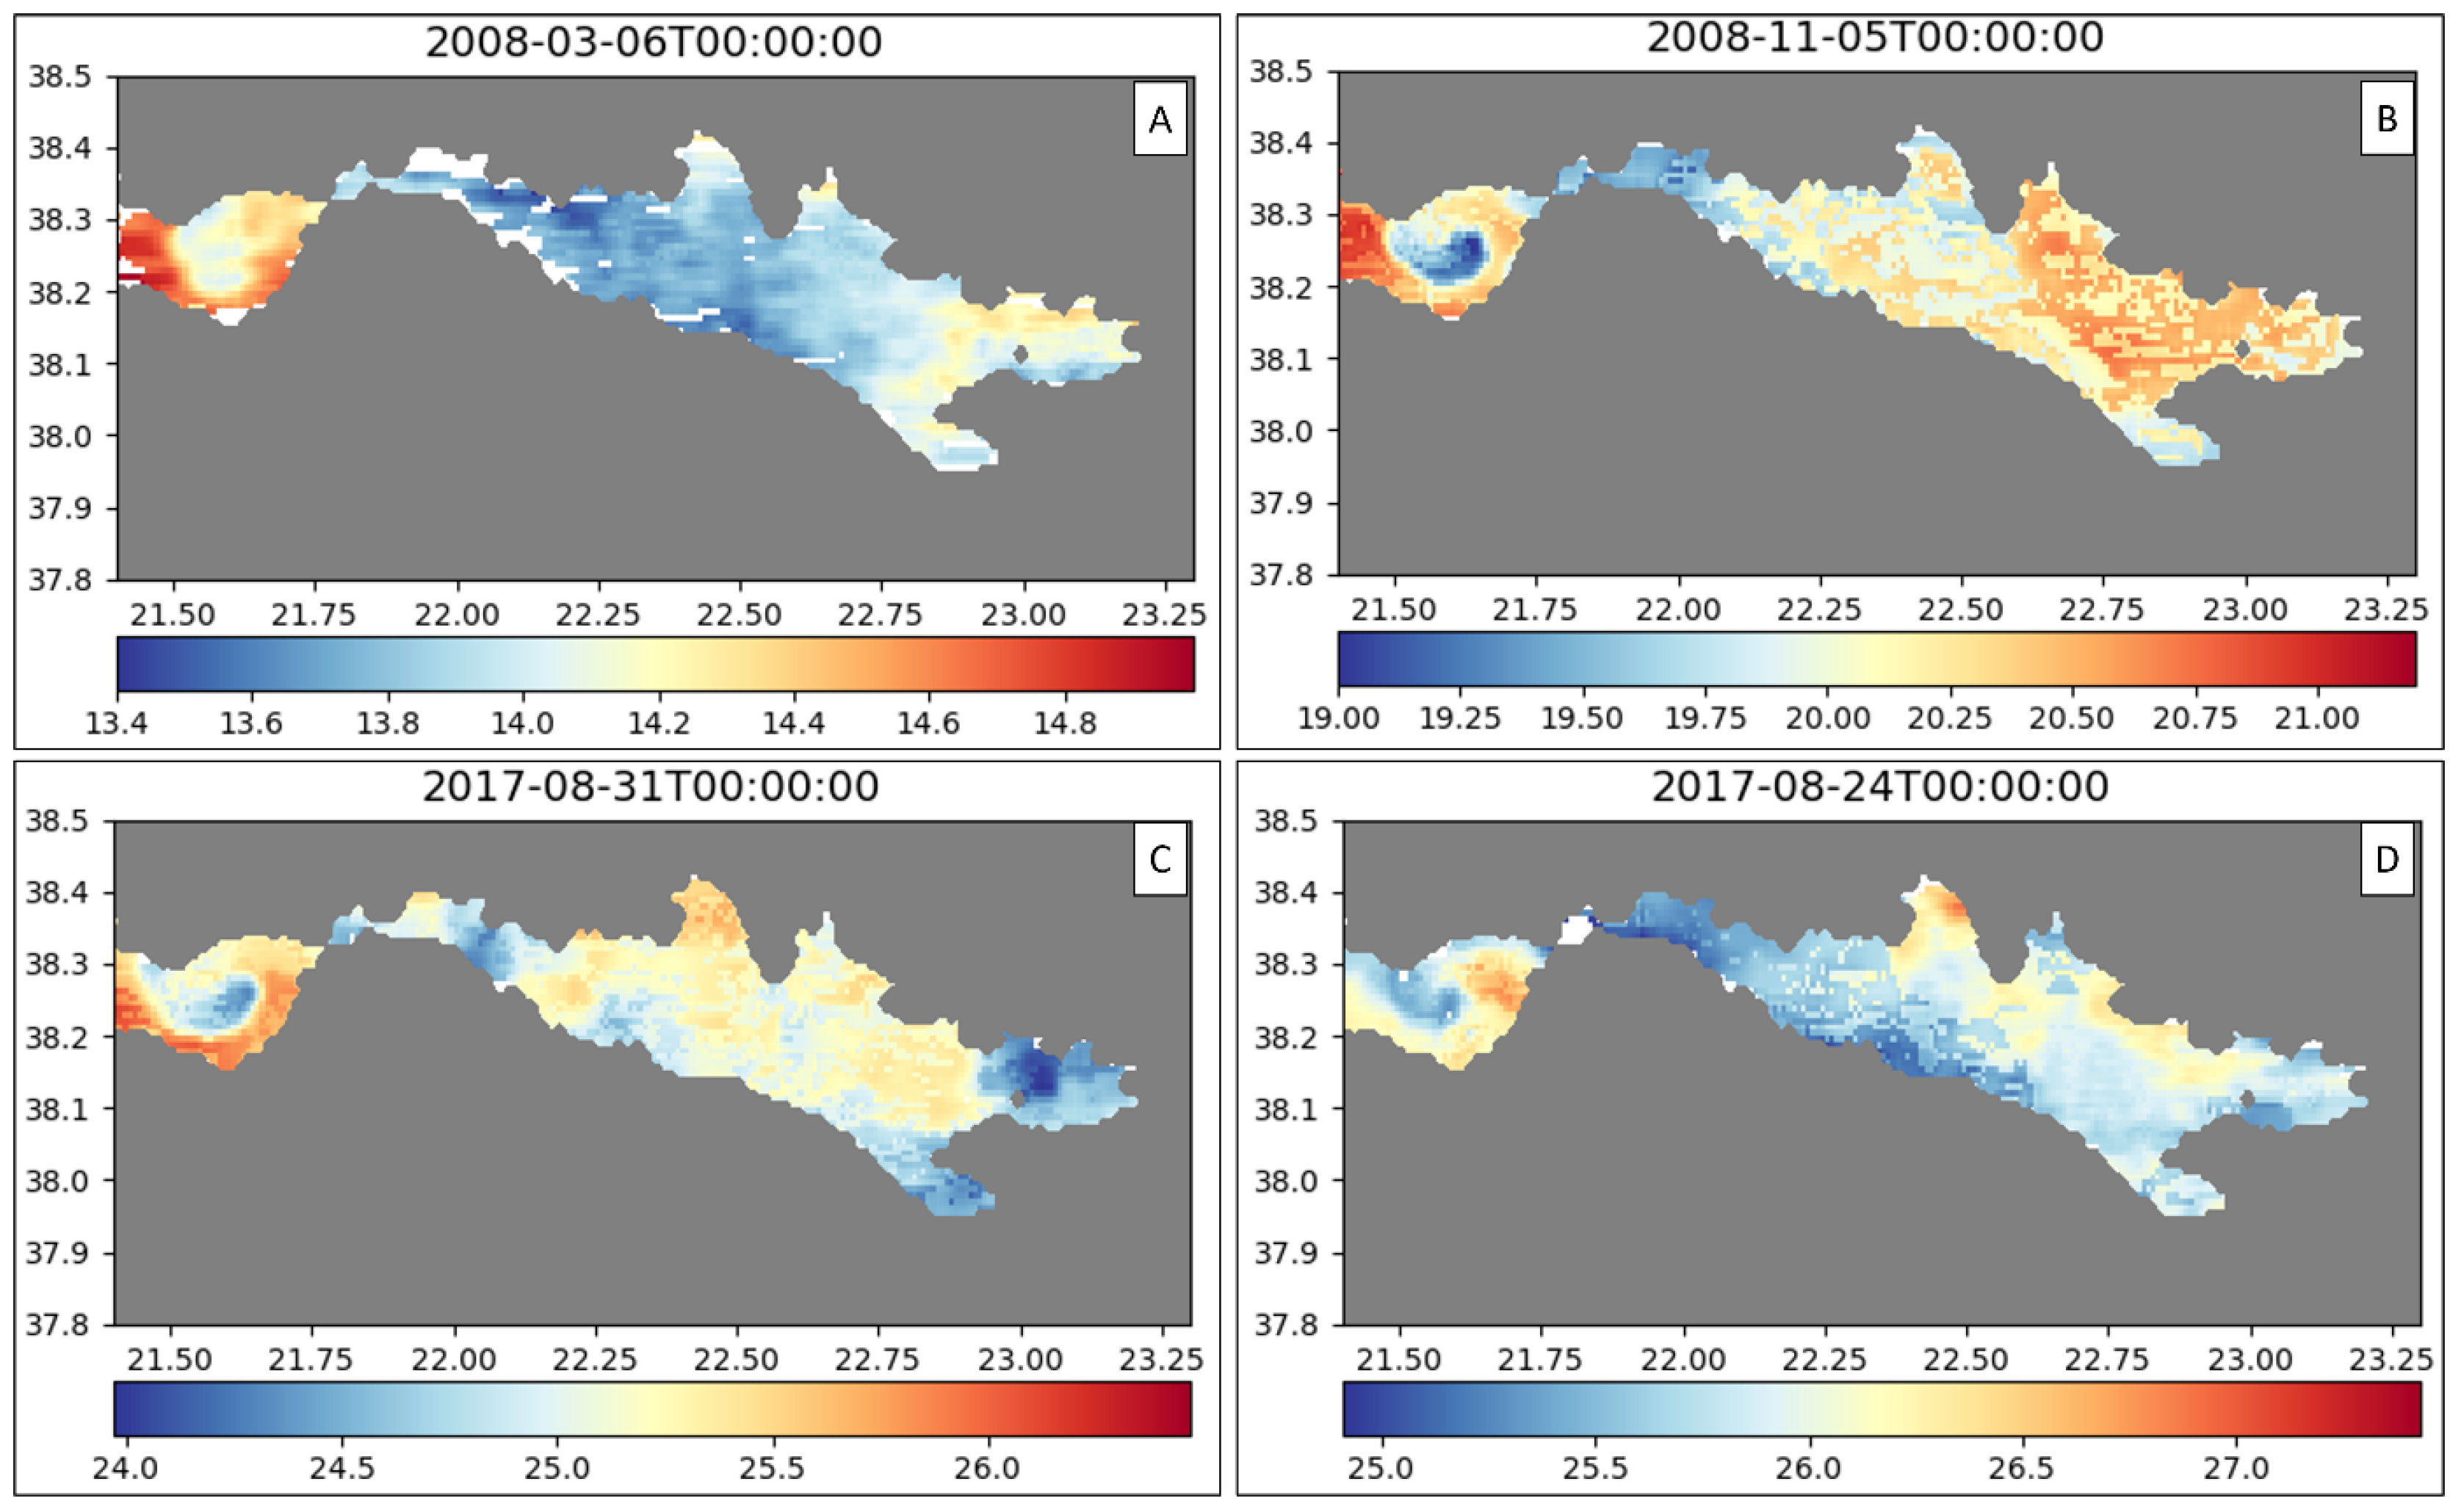
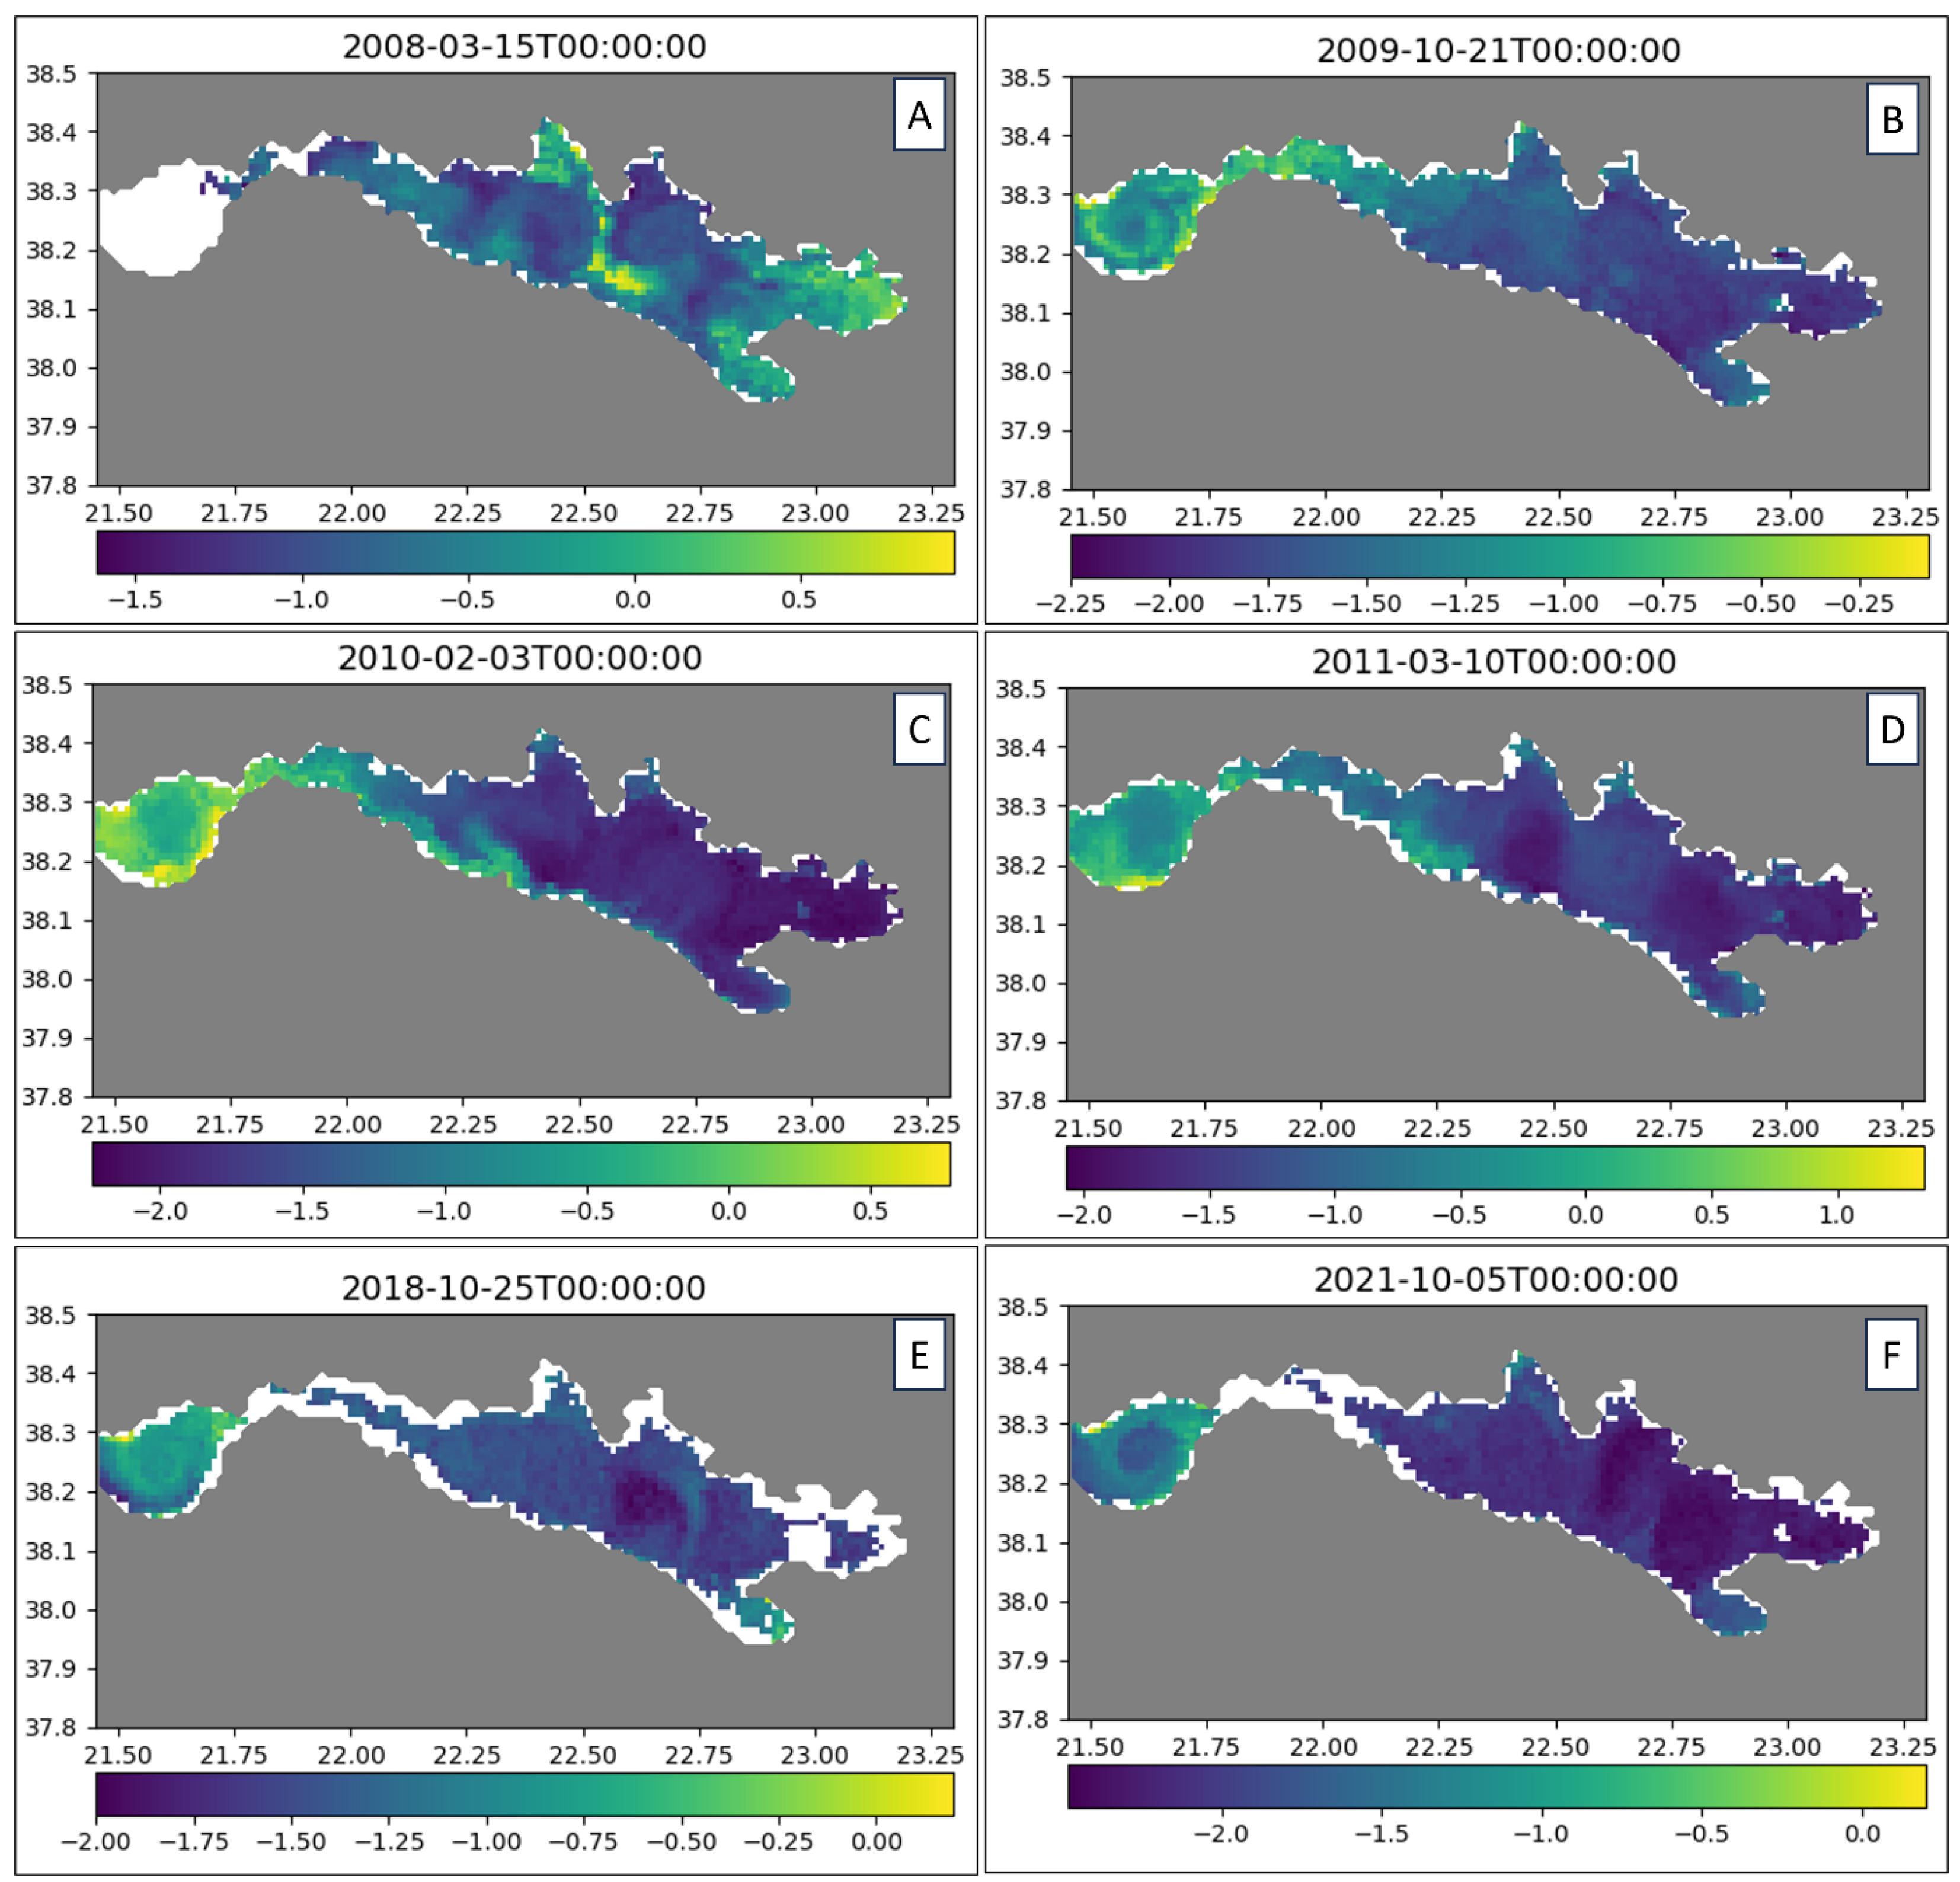
4.1.2. General Circulation Patterns

Our examination of the selected 64 daily SST maps evidenced varied patterns. First, a gradient exists in the Corinth Gulf, with the warmest waters in the East Corinth Region. The temperature gradient can reach up to 3 °C between the two ends of the Corinth Gulf, leading to the formation of an oceanic front between the East and West Corinth Regions. Second, SST variations in the Corinth and Patras Gulfs are significantly different, suggesting dissimilar circulation patterns in the two gulfs. In the Patras Gulf, the main observed SST phenomenon is a cyclonic gyre affecting the entire Patras water mass. In Corinth, hydrodynamics is more complex, particularly the cold temperature anomaly in the Strait and Entrance Region.
The occurrence of the cold spot (a 0.6 °C difference on average with the East Corinth Region over a whole year) in Rio–Antirio (already evidenced in Table 2) is also displayed in SST maps. This lower surface temperature can be explained by an upwelling. This upwelling involved dense and cold Corinth bottom waters reaching the surface in Rio–Antirio due to bathymetric shallowing. Another mechanism responsible for the local cold spot in the SST in the Strait and Entrance Region could be the strong internal tides dominating the strait hydrodynamics and Corinth waters not always reaching the Patras Gulf at each tide [7]. When the internal tides do not rise simultaneously with the surface tides, the upwelled Corinth waters seem to not cross the strait and are trapped in the Strait and Entrance Region. Consequently, this flow restriction contributes to the local cold spot in the SST in the Rio–Antirio Strait. Finally, upwelled deep waters from Corinth that manage to cross the sill of the strait contribute to lowering the SST in the Patras Gulf compared to the Eastern Ionian Sea (a 0.6 °C difference on average over a whole year; Table 2) and to its gyre’s strong contrast in SST.

4.2. Patras Gulf

Details about the Patras hydrodynamic circulation were uncovered through some of the 64 daily SST maps and complementary CHL maps (Figure 3 and Figure 4). The Patras cyclonic gyre is observable year-round in the SST and CHL maps. In this cyclonic circulation, affecting the entire Patras Gulf, warmer waters are located along the southern border of the gulf (Figure 3), and the temperature difference between colder waters at the gyre center and along its external borders can reach up to 2 °C (Figure 3B).
In this eddy, warm water comes from the Eastern Ionian Sea Region. Two hypotheses exist regarding the source of colder waters within the eddy. One hypothesis is that the observed colder waters correspond to the general Patras waters, and the warm waters are from the incoming Eastern Ionian waters. This hypothesis is not supported by the water temperature difference within the eddy, as the SST variation is generally larger than the mean water temperature difference between the Ionian Sea and the Patras Gulf Regions (Table 2). Additionally, the Ionian/Patras temperature difference is smallest in summer (Table 2), whereas the SST gradient in the gyre is the lowest in winter (compare Figure 3A with Figure 3B–D). Therefore, we infer that the cold waters are deep Corinth waters upwelled in the Strait and Entrance Region that cross the sill and reach the Patras Gulf. The cold waters likely do not come from the Patras Gulf, as the pool of cold water in Patras is too restricted. In Patras, the thermocline is around 60 m, with deep waters at ~14 °C, covering only 190 km2, whereas the deep Corinth water pool covers 1960 km2 and is at ~13 °C. The arrival of the upwelled Corinth deep water in Patras is well evidenced on the 24 August 2017 map, showing a cold SST spot at the extreme east of the Patras gyre, which exits the strait and is included in the gyre (Figure 3D). This map, along with others (Figure 3B,C), also shows a slight decrease in the hot SST of the Patras gyre near the strait, interpreted as dilution with colder Strait and Entrance waters. Fourniotis and Horsh (2015) [5] identified another upwelling in front of the Patras harbor that is not evidenced in the SST data, possibly due to the resolution of the satellite data or the non-inclusion of the internal wave from the Corinth Gulf in their model.
The CHL maps show that the shallow Gulf of Patras (Figure 4B–D) has one of the highest chlorophyll concentrations in the study area. Various factors can explain these high CHL concentrations. Firstly, the tributaries of large rivers in both areas can bring diverse nutrients that support phytoplankton growth. Figure 4 B–D illustrate strong CHL concentrations along the southern coast of Patras, suggesting that the riverine flows through these locations (Figure 1). Secondly, the waters of Patras being shallower compared to the ones of the Corinth Gulf may affect the dilution of the CHL content due to less space available for dilution. However, these two factors alone cannot explain the higher CHL concentration in the Patras Gulf compared to the Eastern Ionian Sea Region, which is also shallow compared to the site of the Achelos River delta, the largest in the study area. We infer that the high concentrations in the Patras gyre result from a combination of in situ CHL production and CHL-rich Ionian waters. This also explains why the central part of the Patras eddy has the lowest CHL concentration in the Patras Gulf Region.

4.3. Rion Strait, the Nafpaktos Bay and the Westernmost Corinth Gulf

In the Strait and Entrance Region, we can track surface water flows with two methods. First, the 64 SST daily maps and observations over 5 days provide insights, and these findings are confirmed with CHL daily maps. This is feasible because the strait waters have the coldest SSTs. CHL maps can also help in tracking water flow, as the Patras Gulf Region and the western part of the Strait and Entrance Region are CHL-rich, while the Corinth Gulf is mostly depleted. The high CHL content in this region is linked to the high nutrient supply brought mostly by the Mornos River (i.e., annual suspended sediment flux: 160–325 × 103 m3/yr; [30]) and its low dilution in the Nafpaktos Bay, west of the Mornos Delta.
The daily images provide detailed patterns of cold SST in the region and the associated hydrodynamics. The first pattern is associated with the upwelled deep cold water flow in this region. The coldest water hotspot is found in front of the Mornos Delta (Figure 5, right), where a bathymetry steeply rises in direct continuity with the 900 m deep cold-water pool, ~50 km further SSE. This cold spot is related to wind-induced upwellings [3] and the shallowing of the internal wave [7]. The surface arrival of the deep cold Corinth waters can be observed year around. Other relatively cold hotspots appear in the daily maps, always near the northern side of the Corinth Gulf, indicating that the deep water flow follows this margin. The CHL maps confirm the inferred water flow direction. The Mornos River, the largest one flowing into the Patras and Corinth Gulfs, supplies nutrients to the Nafpaktos Bay to the west. Just east of the Mornos Delta, the northern margin of the Corinth Gulf is often less rich in CHL, indicating the lack of eastward surface water flow along this margin.
In the daily map, another anomaly is the eastward-moving cold SST anomaly along the southern margin of the Corinth Gulf. The hydrodynamic evidence suggests a surface water flow from the Rio–Antirio strait sensu stricto towards the Corinth Gulf, following the southern margin (Figure 5). Occasionally, this incoming cold water volume is too large to follow the south coast only, filling nearly the entire 50 km long Strait and Entrance Region. This cold flow typically dissipates itself at the beginning of the West Corinth Region, rarely reaching the East Corinth Region. This hydrodynamic feature is also evidenced in the CHL daily maps. Although most of the high CHL area is confined to the Nafpaktos area, west of the Mornos Delta, a trail of high CHL can be found in the Corinth southern margin, evidencing the surface flow. Again, this hydrodynamic feature can be interpreted in relation to the internal waves from the Corinth Gulf and the restricted flow through the Rio–Antirio Strait [7]. Because the strait acts as a barrier for the tidal currents, some of the upwelled cold waters coming from Corinth cannot cross the strait and therefore return towards Corinth as colder surface waters. This backwash of cold water occurs regardless of the season. In conclusion, the daily maps reveal the following hydrodynamics along the Corinth margins: an eastward surface water flow along the southern margin and a deep water flow along the northern margin in the opposite direction.

4.4. Itea Bay and West Corinth

In the West Corinth Region, Itea Bay plays an important role. This N-S bay, covering a 51 km2 area and shallower than 300 m deep, is protected from winds and has warmer waters than the waters of the central part of the gulf. This temperature difference can be linked to the bay’s enclosure and shallowing, allowing a more significant stratification. Stratification is enhanced by the reduced effects of the dominant winds, as the dominant west winds cannot reach the bay, as it is protected by the 2500 m high N-S-oriented Hellenides range. Rivers draining these mountain ranges provide high levels of nutrients to the bay, resulting in high CHL concentrations.
The hydrodynamics of this region can be evidenced by the subtle SST contrast between the warm Itea waters and the cool surface waters coming from the Strait and Entrance Region following the southern coast. These cool waters are pushed into the West Corinth Region by the wind. As the gulf widens, the SST anomaly extends along the southern coast and then makes a subtle clockwise trail in front of Itea Bay (Figure 6A–F). We infer that the eastward surface water flowing along the southern coast is mobilized into a wind-induced anticyclonic gyre (Figure 6). This is coherent with the fact that waters in the central part of the gyre, being the West Corinth waters, are warmer than the surrounding waters from the Strait and Entrance Region, which are remobilized by the gyre. Itea’s warmer waters are mobilized southward by the anticyclonic eddy and bought to the central part of the Western Corinth Region. In the SST maps, the gyre has a radius of ~10 km and can occupy the entire West Corinth Region. It is often limited to the east by a ~N-S trending oceanic front that bounds the West Corinth Region; it is generally aligned with the Cape Pangalos located between the Itea and Antikyra Bays (Figure 1).
The chlorophyll data (Figure 4A,F) provide additional information about the hydrodynamics in the West Corinth Region. High CHL concentrations are found along the southern coast, where the CHL-rich flow from the Strait and Entrance Region is trapped in the anticyclonic gyre and where further nutrient supply is provided by rivers draining the mountainous southern part of the Corinth basin. The highest CHL concentrations are still found in Itea Bay. This hotspot for CHL is due to the bay’s shallow bathymetry and the high amount of riverine nutrients. The depleted central part of the gyre is related to anticyclonic movement, which mobilizes the two CHL sources at its borders. The maps indicate that Itea’s CHL- rich waters can be driven southward by the eddy and reach the deep basin in the central part of the Gulf. This flux of CHL-rich water can even reach the East Corinth Region when the eddy waters reach the southern margin of the Corinth Gulf.

4.5. Antikyra Bay and East Corinth

The East Corinth Region can be separated from the West Corinth Region by a sharp SST gradient, creating an oceanic front. This front can display a ~1 °C change in SST over ~5 km (Figure 7A,E,F) and is most often located in front of the Pangalos Cape between Itea Bay and Antikyra Bay. This marks the boundary separating the West Corinth water body from the East Corinth water body. We infer that this front is nearly stable because the East Corinth waters are consistently the warmest in the Corinth Gulf, except in summer, where the waters from the Alkyonides Gulf are hotter. In winter, there is no significant SST difference between the West and East Corinth Regions (Table 1), and the occurrence of an oceanic front is less likely to be observed (Figure 3A).
The presence of the oceanic front between the West and East Corinth Regions limits surface water exchange between the two regions and explains the low standard deviation of the SSTs in East Corinth (Table 2). The temporal examination of SST maps shows that the oceanic front does not completely impede surface water exchange between the two regions. Warm, chlorophyll-rich waters from Itea Bay, mobilized by the anticyclonic gyre, flow southeastward and can enter the East Corinth Region (Figure 4A). When they reach the southern margin of the gulf, CHL-rich waters are carried by the eastward coastal current, likely driven by the dominant winds coming from the W to NW (Figure 8 [22]).
In the East Corinth Region, the hydrodynamic features are more diverse than in the West Corinth Region. Most of the time, a large cyclonic gyre with a radius of ~10 km is observed, and colder waters are usually located on its southern edge (Figure 7A,D,E,F). Even though CHL concentrations are low in this region, their geographical disposition supports the presence of a cyclonic gyre. Occasionally, smaller structures such as smaller anti-cyclonic and cyclonic eddies are observed, for example, on 15 August 2008 or on 9 September 2008 (Figure 7B,C).
The impact of Antikyra Bay over the hydrodynamic circulation of the Corinth Gulf is not as strong as Itea Bay. Antikyra Bay is half the size of Itea Bay, less protected from winds by mountains, and lacks large mountainous river outlets. This results in lower CHL content in Antikyra Bay compared to Itea Bay. Across the entire Eastern Corinth Region, the only CHL-rich waters are found in Antikyra Bay (Figure 3C,D). However, daily images evidence that Antikyra Bay does not supply CHL to the central deep basin of the Corinth Gulf; instead, CHL presence in the central part of the Eastern Corinth Region is due to Itea waters exported from the West Corinth Region by its gyre and caught by the Eastern Corinth Gyre (Figure 3A).
Also in this region, Lechaios Bay (in the south) exhibits a high SST (Figure 7A,E). CHL concentrations are higher here than in the rest of the East Corinth Region (Figure 3A,E), likely due to stronger riverine nutrient inputs and shallow bathymetry (100 m to 200 m deep; Figure 1), which reduce CHL dilution.

4.6. Alkyonides Gulf
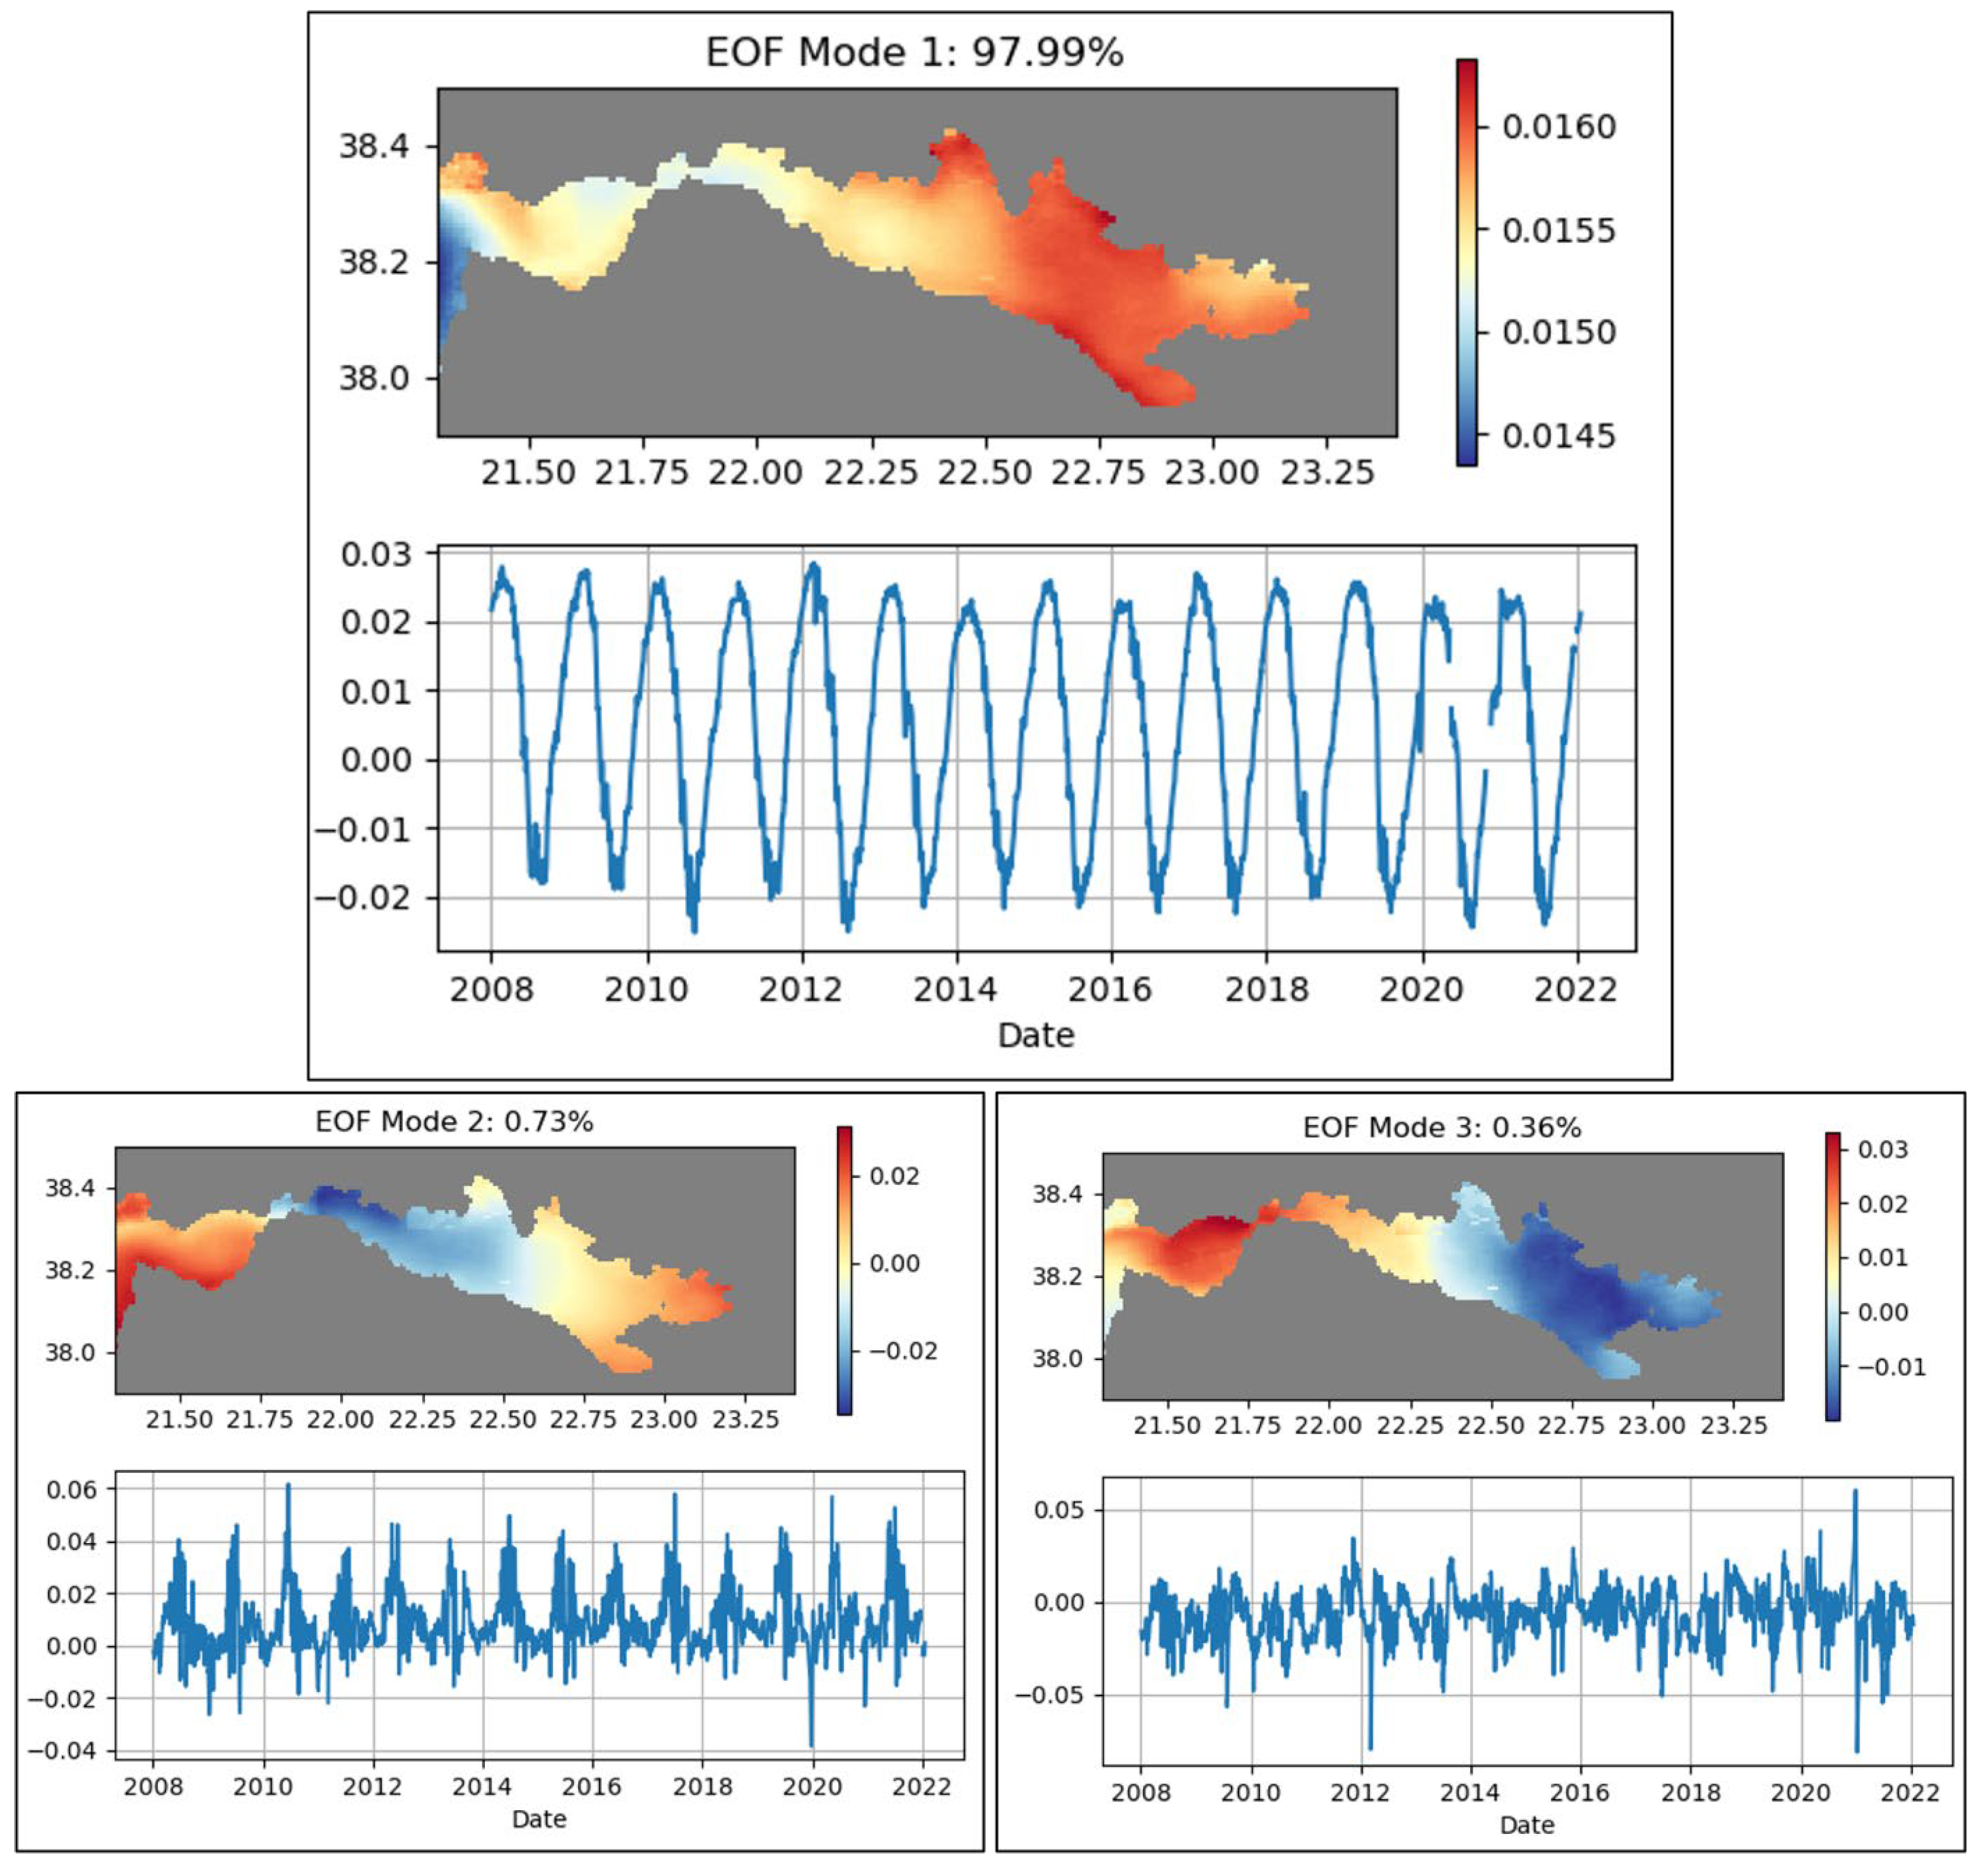
The Alkyonides Gulf is located at the eastern end of the Corinth Gulf. This 13 km wide and 22 km long small gulf is separated from the East Corinth Region by the Zoodochos island constriction and is characterized by the steep decrease in bathymetry, from ~800 m deep west of the island to 300 m deep to the east. The island and the associated constriction (geographical and bathymetrical wise) likely disrupt hydrodynamic circulation and partially block the connection with the East Corinth waters. This region is observed to be the hottest in the whole Corinth Gulf in summer. The high SST in this area can be explained by its location at the extremity of the Corinth Gulf, where hot surface waters of the East Corinth Region are pushed by the westerly winds (Figure 8). This difference in temperature can also be linked to the shallowing of the Alkyonides Gulf and the reducing of water circulation linked to Zoodochos Island, which allows for greater stratification. This stratification is further enhanced by the reduced impact of the dominant winds.
In the Alkyonides Gulf, the most interesting phenomenon is related to SST values that are sometimes smaller than the local average near the northern coast (Figure 9), interpreted as an upwelling. The occurrence of upwelling would explain the high standard deviation of the SST in this region, which is usually warm (Table 2). When an upwelling happens, there is a ~1 °C to ~2 °C difference between these waters and the East Corinth Region waters. Since there are no major rivers found in the area, an upwelling that brings to the surface the cold deep waters from the Corinth Basin is an explanation for these SST reductions. Like the Strait and Entrance Region, the strong bathymetric rise from the deep Corinth basin to the shallower Alkyonides Gulf can facilitate upwelling. Also, this upwelling might be an expression of the internal tide observed in the strait, which would be mirrored here due to the closure of the basin and the rising bathymetry. This phenomenon occurs mainly in the northern part of the Alkyonides due to the presence in the south of the Zoodochos island, which acts as a barrier to most high-dimension hydrodynamic events. Furthermore, the bathymetric shallowing between the northern Alkyonides Gulf and Eastern Corinth is more pronounced than in the south, where there is a faulted sub-marine canyon separating the Zoodochos island from the Perachora peninsula.
In terms of CHL concentrations, the Alkyonides Gulf appears depleted unless upwelling events allow for an increase in the concentrations (Figure 3C,D). This low CHL concentration can be attributed to the absence of major rivers supplying nutrients to the sea, while upwellings can bring nutrients from the deep Corinth basin.

4.7. EOF Modes

The DINEOF interpolation identified three major modes to explain the SST variation over the study period. The first and dominant one explains 98% of the SST variability, while modes 2 and 3 explain 1.1% (0.73% and 0.37%, respectively). Since there are no field measurements, the EOF spatial patterns are not cross validated.
The first EOF mode is the dominant one, representing seasonality. Figure 10 (graph in top-panel) shows the temporal variability of this mode, indicating that the seasonal factor is dominant, with one positive peak during winter and one negative peak during summer. The spatial variability of this mode, depicted in the corresponding maps, indicates that the strait area is less prone to variability due to the seasonal changes, whereas Itea Bay, Antikyra Bay and East Corinth are the most sensitive to the winter and summer cycles. Due to the dominant winds towards the E-SE [22], waters accumulate in the eastern part of Corinth, and since the basin is closed, the waters can “stagnate” there and become more sensitive to seasonal temperature variations. In addition, East Corinth is separated from West Corinth by an oceanic front, which limits surface water exchanges, particularly the cool waters coming from the Strait and Entrance Region. The EOF map also evidences the upwelling zone in the Alkyonides Gulf as a small reduction in the seasonal variability. The Strait and Entrance Region is the least sensitive to the seasonal dominant mode. In this region, the dynamics are higher in relation with the narrowing and shallowing of the gulf and the internal tides, which causes greater water motion and mixing with less time to “adapt” to the atmosphere temperature. Additionally, the year-round upwelling near the Mornos Delta or on the Patras side of the Rio Strait sensu stricto makes these areas less sensitive to seasonal variability compared to the northern Alkyonides Gulf.
When looking at the second EOF mode, the spatial and temporal variability are both interesting. First, spatially, the variation in the SST is stronger in the Strait and Entrance Region (in the negative values), especially in the upwelling area in front of Nafpaktos. The variability is also strong (in the positive values) in the Patras Gulf. There is thus a strong difference in variability between these two areas, suggesting an impact of the upwelling and the strait action over the variability of the SST. Looking at the temporal disposition of the second mode, the variability seems to be stronger in summer. This would suggest that the stratification may play an important role in the area. Combining these two observations allows evidence that the Rio–Antirio Strait dynamics play an important role. Indeed, when there is a stratification, in summer, in the Strait sensu stricto, the internal waves might be stronger; therefore, the upwelling they induce might occur more often, leading to a more relevant cooling of the surface waters of the Strait and Entrance Region. Since the temporal peak over winter indicates less variability, we can deduce that upwellings occur also during winter but are less strongly represented in the SST variations. The lower variability of time can also be associated with a complete mixing of the water column, leading to no stratification, whereas stratification should enhance the internal waves and the upwellings around the strait.
The third EOF mode shows less consistency in its temporal variation, with an enhancement of the variability in winter. The geographical repartition for this mode indicates that the variability is linked to a W-E phenomenon. We thus interpret this mode in relation to the dominant winds coming from the west to northwest and pushing the waters towards the enclosure of the basin. The temporal variation supports this interpretation; similarly, in winter, the wind strength is enhanced.

5. Discussion

5.1. Circulation from the Ionian Sea to the Alkyonides Gulf

Regarding regional dynamics of the regions, a west-to-east continuity is observed (Figure 11). In the Patras Gulf, the cyclonic gyre appears due to the winds and the inflow of the upwelled deep cold Corinth waters over the strait. This gyre is restricted to the Patras Gulf since it is too big to cross the 2 km wide Rio–Antirio strait, and it does not seem to extend towards the Ionian Sea, probably due to the circular shape of the Patras Gulf and the presence of the Araxos Cape, forming a shallow sill (−50 m) and separating the Patras Gulf from the Ionian Sea. In the Strait and Entrance Region, when the deep waters from the Corinth Basin reach the surface and do not cross the strait, they flow back into the Corinth Gulf along the steep-fault-bounded southern coast. Most of the time, these cold and nutrient-rich waters continue along the southern coast up to the oceanic front in the middle of the gulf. These waters can then be trapped in the West Corinth anticyclonic gyre, but the coastal flow path can sometimes continue to the East Corinth Region. There, these waters can be influenced by the East Corinth cyclonic gyre in front of Antikyra Bay. The two opposite eddies are more likely to appear in front of Itea Bay and Antikyra Bay. This is because the most available space exists in front of these two bays, and the water flow can be influenced by winds [22].
Compared to the previous overview study on the general hydrodynamic circulation of the Corinth Gulf proposed by Lascaratos et al. (1989) [3], this study provides more detailed information (Figure 11). While the positions of the cyclonic gyres in the Patras Gulf and in front of Antikyra Bay were already identified, more precision is now provided on their dynamics and origins. The upwellings along the northern coast of the Strait and Entrance Region were also evidenced by Lascaratos et al. in 1989 [3]. However, their impacts and dynamics are detailed only in this work, with a potential link to the internal wave at the Rio–Antirio Strait influencing the redistribution of the currents [7]. Other differences seen this study include the observation of an anticyclonic gyre in front of Itea Bay; the cool surface current along the southern coast; details about the gyres in front of Antikyra Bay, which are sometimes cyclonic and sometimes anticyclonic; and the presence of upwelling in the Alkyonides Gulf.
In terms of general circulation, the Corinth Gulf can be compared to the Mediterranean Sea on a smaller scale due to the presence of the Rio–Antirio Strait, which acts like the Gibraltar strait. Like the larger scale in the Mediterranean Sea, there is a strong temperature gradient from west to east in the Gulf of Corinth. Another similarity is that the dominant north-westerly winds [22,31] push surface waters towards the closed eastern end of the basin (Figure 9), while its bottom waters would flow in the opposite direction [7,31]. The straits (Gibraltar and Rio–Antirio) both regulate exchanges between an open basin and a closed one. Due to their shape and specific bathymetric settings, combined with water stratification, internal tides would be created, amplifying the currents and the exchanges in both straits [7,32].

5.2. Impacts of the Circulation on Sediment Routing

Several studies have shown that certain areas of the Corinth Gulf exhibit diverse dynamics in terms of sediment transport [6,7,8]. Our study, which exploits satellite data, allows us to directly infer water motion at the sea–ocean interface using contrast in SST between water masses. Although only surface components are observed, we can still infer dynamics extending to the sea bottom, particularly in shallow or coastal areas where coupling with the surface is stronger. Therefore, we propose the following new insights about the sediment routing and deposition in the Gulf of Corinth.
The Strait and Entrance Region is the most dynamic region of the gulf. Strong currents in the region result in a distinctive pattern of sediment disposition. This was already evidenced by A. Beckers et al. (2016) and supported by Rubi et al. (2022) [6,7]. A. Beckers et al. (2016) [6] show the near absence of sediments in the central part of the strait sensu stricto and Nafpaktos Bay, sediment-plastered drifts on the slopes at the eastern exit of the strait in Nafpaktos Bay and thicker sediment plastering on the southern slopes of the Strait and Entrance Region east of the Mornos Delta. Such plastered drift on slopes occurs in the presence of a strong bottom current [33]. This kind of current has been evidenced through the satellite data of our study using the observation of the upwellings happening near the Rio–Antirio strait. Moreover, the surface currents following the southern coast indicate that the bottom currents might follow the northern coast of the Strait and Entrance Region. This disposition of the currents would explain the sedimentary pattern already evidenced [6]. A strong surface current also facilitates the discharge of sediments eroded from the strait [7] towards the center of the Corinth Gulf, where they could be deposited or could be trapped in other hydrodynamic patterns.
Another area impacted by sediment discharge is Antikyra Bay. There is an aluminum processing plant treating bauxite for more than 50 years. The red muds rejected by the plant are discharged on the shelf and sink up to a depth of 120 m [8,18]. During their descent, the mud flow can be trapped in the cyclonic eddy that can reach the center of Antikyra Bay. In that way, some bauxite muds could be routed towards the center of the Corinth Gulf to the southwest of Antikyra Bay. This is confirmed by the mapping of the red mud deposits (Figure 1) [8,18,34,35] that reach the 850 m deep basin floor, which is mainly in front of the Pangalos Cape to the west of Antikyra Bay. The red mud deposits do not extend farther west, evidencing the importance of the oceanic front separating the two main eddies of the Western and Eastern Corinth Regions. The hydrodynamics at that depth can be inferred to be like the surface one. The relatively limited spreading [8,18] of the red mud in the deep basin is also probably linked to the low velocity of the flow at that location.
Obtaining information about the general circulation patterns in the Corinth/Patras Gulfs might also help with the actual concerns about the dispersion of plastic pollution [36]. Since Patras is the third-most populated city of Greece, the Strait and Entrance area can be a spot for the redistribution of anthropogenic pollutants over both gulfs. The Patras Gulf seems to be sensitive to land-based plastics being degraded and sinking with the sediments [37]. These plastics can be remobilized by the strong currents and leave the Strait and Entrance area towards the Gulf of Corinth. Due to its geographical disposition and its current patterns, the Strait and Entrance Region might be the most sensitive area in terms of land-based pollution going to the sea.

5.3. Chlorophyll in the Corinth Gulf

The paucity of the CHL concentration in the center of the Corinth Gulf has been evidenced in the present study. The CHL pattern displayed in Figure 4 shows that the CHL-rich waters are present in the Patras Gulf, the Strait and Entrance Region, and Itea Bay. In the three cases, this is due to the local enrichment and nutrient input from rivers in shallower areas, which results in a less diluted CHL concentration. In the Patras Gulf and mostly in the Strait and Entrance area, upwellings play an important role for CHL concentrations. One main reason might be that, before Nafpaktos Bay and in front of the Mornos area, the internal wave and the upwelling are the strongest [7]. This would create strong bottom currents that will resuspend the sedimentary litter. Therefore, the upwelled waters will be enriched in clastic particles that might serve as nutrients for algal blooms and therefore increase the CHL concentrations in this area.
Occasional local enrichment of the center of the Corinth Gulf in CHL may have two origins. First, CHL-rich waters from the Strait and Entrance Region can reach the center of the Corinth Gulf by following the southern coast and then getting trapped in the gyres in front of Itea Bay. Second, the gyre in the West Corinth Region can affect CHL-rich waters from Itea Bay and export some towards the center of the Corinth Gulf. These patterns were already observed with the positive trend in the CHL concentration along the southern coast of the Corinth Gulf, while the northern parts appear with a negative trend, except for Itea Bay [38]. This trend of decreasing CHL from west to east in the Corinth Gulf can be similar to the trend of the increasing oligotrophy in the Mediterranean Sea, where eastern waters are poorer in CHL than the western ones [39,40,41,42].
These CHL concentrations seem to influence the movements of dolphins present in the Gulf of Corinth [43]. The mapping by Bearzi et al. (2016) [34] evidenced the presence of Tursiops truncates remaining mostly in Itea Bay, even if they used to occupy the whole northern coastal waters. While this dolphin species is commonly found in coastal water areas, its presence is usually seen at a depth of 0–300 m in Itea Bay [34,44], which is probably related to its high CHL concentrations or the presence of an aquacultural farm at the south-west edge of Itea Bay. Phytoplankton is the base of the marine food chain, and their abundance can significantly influence the entire trophic chain, leading to the occurrence of higher trophic level species like Tursiops truncates. The other dolphin species Stenella coeruleoalba is found mostly in the deeper environment [34] in the center of the Gulf at the location where the anticyclonic eddy would export CHL from Itea Bay towards the center of the Gulf (Figure 4A). It suggests again an influence of the bay over the gulf.
The low CHL concentration levels at the center of the Corinth Gulf are recurrent through geological times. In the sedimentary cores retrieved during the IODP expedition n°381 [9,45,46], few sedimentary units were found to be rich in planktonic foraminifera. Theses cores were drilled in the East Corinth Region. The latest occurrence of foraminifera-rich levels date from 70 ka at the location of the IODP core n°M0078 [9], when the sea-level was lower than the present one and was close to a lake setting. A well-developed deep chlorophyll maximum was identified in the Corinth basin (IODP Core n°M0079) dating from 106 to 104 ka [10,46]. The pattern of the actual ocean dynamics explaining the paucity of CHL in the center of the Corinth Gulf could have, sometimes, been similar since the last 100 ka. If, during the last 100 ka, the oceanic configuration of the Corinth Gulf was similar to the present one [10], the proposed hydrodynamism would explain the low CHL concentration of planktonic species found in the cores [9,10,46]. Concerning the rare foraminifera-rich level, they may be related to other oceanographic configurations of the Gulf of Corinth with different connections or due to increased riverine inputs [10]. Due to the oligotrophy of the surrounding waters (Mediterranean Sea; [39,40,41,42]), it is indeed expected to have low CHL concentrations in the Corinth Gulf, and it should not be surprising that it was the case for the last 100 ka, even with minor changes in the gulf’s paleogeography [10].

6. Conclusions

While no relevant in situ data exist to study the overall dynamics over the Corinth and Patras Gulfs, satellite data proved to be extremely relevant in describing the oceanography of these gulfs. We were able to identify several gyres, one in Patras and two major ones in the Corinth Gulf, while also evidencing diverse upwelling areas and steady currents along the south coast of the Strait and Entrance Region. Using a dataset with 14 years of records allowed us to observe seasonal variations in SST and in CHL concentrations. With this amount of data, we were able to obtain a rough idea of the evolution of the SST over more than a decade, and the computed SST means evidenced the key regions regarding the evolution and the disparity of the temperatures in the gulfs.
Advances in remote sensing technologies have enabled us to delve deeper and analyze a comprehensive dataset spanning 14 years of data. The datasets we used were limited by their resolution (0.01° × 0.01°) and by the cloud cover. Removing the days in which more than 95% of the data were missing due to clouds eliminated 25% of the initial dataset. Nonetheless, we were able to sort this dataset to evidence key events for the hydrodynamics of the gulfs. To strengthen this, the use of DINEOF was effective in gaining insights into the variability of the phenomena and filling in gaps where data pixels were missing. This statistical approach has led to a better understanding of an overall unstudied oceanographic region. Thus, we were able to interpolate missing pixels in the maps and obtain an overview of the main patterns that are dictating the variability of the SST in the gulfs. To further this analysis, modeling could be used to gain a more comprehensive understanding of the entire water column dynamics, as satellite data can only provide information about surface behavior.
Nonetheless, satellite data are very useful for this kind of study, where the goal is to observe large-scale phenomena, both spatially and temporally. Consequently, with its description of the oceanographic dynamics, this work could serve as an up-to-date reference for future studies. By redefining the key features of the hydrodynamic circulation of the Gulfs of Patras and Corinth, further studies will have a strong basis to analyze any data linked to this oceanographic circulation. Understanding the currents and the main SST variations inside a basin is important for any ocean-related study. Also, understanding the sedimentary dynamics or chlorophyll patterns of the Corinth Gulf will be easier when considering the various features presented by the oceanography of this gulf. The general dynamics of the Corinth Gulf appear to be driven in a west-to-east pattern, with the Strait and Entrance Region playing a major role in the distribution of the variability of the studied patterns. Due to the importance of this region, understanding the dynamics of the Rio–Antirio Strait seems to be crucial for the understanding of the ocean dynamics of the Corinth Gulf.

Author Contributions

Conceptualization, B.C. and A.H.-F.; methodology, B.C.; software, B.C.; validation, B.C. and A.H.-F.; formal analysis, B.C.; investigation, B.C.; resources, A.H.-F.; data curation, B.C.; writing—original draft preparation, B.C.; writing—review and editing, B.C. and A.H-F.; visualization, B.C.; supervision, A.H.-F.; funding acquisition, B.C. and A.H.-F. All authors have read and agreed to the published version of the manuscript.

Funding

This publication is funded within the support of the French Community of Belgium with the FRIA/FNRS grant PDR R.FNRS.5472.

Data Availability Statement

Data used in this study are publicly available on the CMEMS portal from Copernicus: https://doi.org/10.48670/moi-00171; https://doi.org/10.48670/moi-00297.

Acknowledgments

First, the author would like to acknowledge Romain Rubi for the help on the original idea. Then, the acknowledgments go to Alexander Barth and Jean-Marie Beckers for their help with the writing reviews.

Conflicts of Interest

The authors declare no conflicts of interest.

References

  1. Boyer, T.P.; Baranova, O.K.; Coleman, C.; Garcia, H.E.; Grodsky, A.; Locarnini, R.A.; Mishonov, A.V.; Paver, C.R.; Reagan, J.R.; Seidov, D.; et al. NOAA Atlas NESDIS 97. World Ocean Database 2018; pp. 1–207. Available online: https://repository.library.noaa.gov/view/noaa/66204 (accessed on 18 March 2025).
  2. Buongiorno Nardelli, B.; Tronconi, C.; Pisano, A.; Santoleri, R. High and Ultra-High Resolution Processing of Satellite Sea Surface Temperature Data over Southern European Seas in the Framework of MyOcean Project. Remote Sens. Environ. 2013, 129, 1–16. [Google Scholar] [CrossRef]
  3. Lascaratos, A.; Salusti, E.; Papageorgaki, G. Wind-Induced Upwellings and Currents in the Gulfs of Patras, Nafpaktos and Korinthos, Western Greece. Oceanol. Acta 1989, 12, 159–164. [Google Scholar]
  4. Fourniotis, N.T.; Horsch, G.M. Three-Dimensional Numerical Simulation of Wind-Induced Barotropic Circulation in the Gulf of Patras. Ocean Eng. 2010, 37, 355–364. [Google Scholar] [CrossRef]
  5. Fourniotis, N.T.; Horsch, G.M. Baroclinic Circulation in the Gulf of Patras (Greece). Ocean Eng. 2015, 104, 238–248. [Google Scholar] [CrossRef]
  6. Beckers, A.; Beck, C.; Hubert-Ferrari, A.; Tripsanas, E.; Crouzet, C.; Sakellariou, D.; Papatheodorou, G.; De Batist, M. Influence of Bottom Currents on the Sedimentary Processes at the Western Tip of the Gulf of Corinth, Greece. Mar. Geol. 2016, 378, 312–332. [Google Scholar] [CrossRef]
  7. Rubi, R.; Hubert-Ferrari, A.; Fakiris, E.; Christodoulou, D.; Dimas, X.; Geraga, M.; Papatheodorou, G.; Caterina, B. Hydrodynamics and Sedimentary Processes in the Modern Rion Strait (Greece): Interplay between Tidal Currents and Internal Tides. Mar. Geol. 2022, 446, 106771. [Google Scholar] [CrossRef]
  8. Iatrou, M. The Study of the Dispersion of the Red Mud Slurry in the Central Corinth Gulf Using Geophysical, Sedimentological and Geochemical Approaches; University of Patras: Patras, Greece, 2013. [Google Scholar]
  9. McNeill, L.C.; Shillington, D.J.; Carter, G.D.O.; Everest, J.D.; Le Ber, E.; Collier, R.E.; Cvetkoska, A.; De Gelder, G.; Diz, P.; Doan, M.L.; et al. Site M0078. Proc. Int. Ocean Discov. Progr. 2019, 381, 104. [Google Scholar] [CrossRef]
  10. Sergiou, S.; Geraga, M.; Pechlivanidou, S.; Gawthorpe, R.L.; Ninnemann, U.; Meckler, A.-N.; Modestou, S.; Angelopoulou, D.; Antoniou, D.; Diz, P.; et al. Stratigraphic and Paleoceanographic Alternations within a Mediterranean Semi-Enclosed, Syn-Rift Basin during Marine Isotope Stage 5: The Gulf of Corinth, Greece. Mar. Geol. 2024, 474, 107340. [Google Scholar] [CrossRef]
  11. Alvera-Azcárate, A.; Barth, A.; Sirjacobs, D.; Beckers, J.-M. Enhancing Temporal Correlations in EOF Expansions for the Reconstruction of Missing Data Using DINEOF. Ocean Sci. 2009, 5, 475–485. [Google Scholar] [CrossRef]
  12. Beckers, J.-M.; Barth, A.; Alvera-Azcárate, A. DINEOF Reconstruction of Clouded Images Including Error Maps—Application to the Sea-Surface Temperature around Corsican Island. Ocean Sci. 2006, 2, 183–199. [Google Scholar] [CrossRef]
  13. Caterina, B.; Rubi, R.; Hubert-Ferrari, A. Stratigraphic Architecture, Sedimentology and Structure of the Middle Pleistocene Corinth Canal (Greece). Geol. Soc. Lond. Spec. Publ. 2022, 523, 279–304. [Google Scholar] [CrossRef]
  14. Briole, P.; Ganas, A.; Elias, P.; Dimitrov, D. The GPS Velocity Field of the Aegean. New Observations, Contribution of the Earthquakes, Crustal Blocks Model. Geophys. J. Int. 2021, 226, 468–492. [Google Scholar] [CrossRef]
  15. Stathopoulou, A.; Papatheodorou, G.; Tripsanas, E.; Hubert Ferrari, A.; Rubi, R.; Geraga, M.; Kokkalas, S.; Stefatos, A. Evolution of the Low-Stand Acheloos Fluvial-Dominated Delta Complex in Western Greece, through 3D Seismic Stratigraphy. In Proceedings of the Fourth EAGE Eastern Mediterranean Workshop; European Association of Geoscientists & Engineers: Utrecht, The Netherlands, 2023; pp. 1–3. [Google Scholar]
  16. Ferentinos, G.; Brooks, M.; Doutsos, T. Quaternary Tectonics in the Gulf of Patras, Western Greece. J. Struct. Geol. 1985, 7, 713–717. [Google Scholar] [CrossRef]
  17. GEBCO. GEBCO Gridded Bathymetry Data Download. Available online: https://download.gebco.net/ (accessed on 11 March 2025).
  18. Iatrou, M.; Papatheodorou, G.; Geraga, M.; Ferentinos, G. The study of heavy metal concentrations in the red mud deposits at the gulf of corinth, using multivariate techniques. Bull. Geol. Soc. Greece 2010, 43, 1018. [Google Scholar] [CrossRef]
  19. Friglios, N.; Theocharis, A.; Georgopoulos, D. Preliminary Chemical and Physical Observations during Summer 1980 on a Silled Embayment in the Ionian Sea. Vie Milieu 1985, 35, 115–125. [Google Scholar]
  20. Poulos, S.E.; Collins, M.B.; Pattiaratchi, C.; Cramp, A.; Gull, W.; Tsimplis, M.; Papatheodorou, G. Oceanography and Sedimentation in the Semi-Enclosed, Deep-Water Gulf of Corinth (Greece). Mar. Geol. 1996, 134, 213–235. [Google Scholar] [CrossRef]
  21. Anderson, J.J.; Carmack, E.C. Some Physical and Chemical Properties of the Gulf of Corinth. Estuar. Coast. Mar. Sci. 1973, 1, 195–202. [Google Scholar] [CrossRef]
  22. Koletsis, I.; Kotroni, V.; Lagouvardos, K. A Model-Based Study of the Wind Regime over the Corinthian Gulf. Nat. Hazards Earth Syst. Sci. 2014, 14, 459–472. [Google Scholar] [CrossRef]
  23. Horsch, G.M.; Fourniotis, N.T. Wintertime Tidal Hydrodynamics in the Gulf of Patras, Greece. J. Coast. Res. 2017, 33, 1305–1314. [Google Scholar] [CrossRef]
  24. Copernicus Marine Service Mediterranean Sea—High Resolution and Ultra High Resolution L3S Sea Surface Temperature. Available online: https://data.marine.copernicus.eu/product/SST_MED_SST_L3S_NRT_OBSERVATIONS_010_012/description (accessed on 11 March 2025).
  25. Copernicus Marine Service Mediterranean Sea, Bio-Geo-Chemical, L3, Daily Satellite Observations (1997-Ongoing). Available online: https://data.marine.copernicus.eu/product/OCEANCOLOUR_MED_BGC_L3_MY_009_143/description (accessed on 11 March 2025).
  26. Barth, A. NCDatasets.Jl: A Julia Package for Manipulating NetCDF Data Sets. J. Open Source Softw. 2024, 9, 6504. [Google Scholar] [CrossRef]
  27. Androulidakis, Y.; Kolovoyiannis, V.; Makris, C.; Krestenitis, Y. Evidence of 2024 Summer as the Warmest During the Last Four Decades in the Aegean, Ionian, and Cretan Seas. J. Mar. Sci. Eng. 2024, 12, 2020. [Google Scholar] [CrossRef]
  28. Kubin, E.; Menna, M.; Mauri, E.; Notarstefano, G.; Mieruch, S.; Poulain, P.-M. Heat Content and Temperature Trends in the Mediterranean Sea as Derived from Argo Float Data. Front. Mar. Sci. 2023, 10, 1271638. [Google Scholar] [CrossRef]
  29. García-Monteiro, S.; Sobrino, J.A.; Julien, Y.; Sòria, G.; Skokovic, D. Surface Temperature Trends in the Mediterranean Sea from MODIS Data during Years 2003–2019. Reg. Stud. Mar. Sci. 2022, 49, 102086. [Google Scholar] [CrossRef]
  30. Watkins, S.E.; Whittaker, A.C.; Bell, R.E.; McNeill, L.C.; Gawthorpe, R.L.; Brooke, S.A.S.; Nixon, C.W. Are Landscapes Buffered to High-Frequency Climate Change? A Comparison of Sediment Fluxes and Depositional Volumes in the Corinth Rift, Central Greece, over the Past 130 k.Y. GSA Bull. 2019, 131, 372–388. [Google Scholar] [CrossRef]
  31. Pinardi, N.; Masetti, E. Variability of the Large Scale General Circulation of the Mediterranean Sea from Observations and Modelling: A Review. Palaeogeogr. Palaeoclimatol. Palaeoecol. 2000, 158, 153–173. [Google Scholar] [CrossRef]
  32. Morozov, E.G.; Trulsen, K.; Velarde, M.G.; Vlasenko, V.I. Internal Tides in the Strait of Gibraltar. J. Phys. Oceanogr. 2002, 32, 3193–3206. [Google Scholar] [CrossRef]
  33. Faugères, J.-C.; Stow, D.A.V. Contourite Drifts: Nature, Evolution and Controls. Dev. Sedimentol. 2008, 60, 257–288. [Google Scholar]
  34. Bearzi, G.; Bonizzoni, S.; Santostasi, N.L.; Furey, N.B.; Eddy, L.; Valavanis, V.D.; Gimenez, O. Dolphins in a Scaled-Down Mediterranean: The Gulf of Corinth’s Odontocetes. In Advances in Marine Biology; Academic Press: Cambridge, MA, USA, 2016; pp. 297–331. [Google Scholar]
  35. Papatheodorou, G.; Lyberis, E.; Ferentinos, G. Use of Factor Analysis to Study the Distribution of Metalliferous Bauxitic Tailings in the Seabed of the Gulf of Corinth, Greece. Nat. Resour. Res. 1999, 8, 277–286. [Google Scholar] [CrossRef]
  36. Stefatos, A.; Charalampakis, M.; Papatheodorou, G.; Ferentinos, G. Marine Debris on the Seafloor of the Mediterranean Sea: Examples from Two Enclosed Gulfs in Western Greece. Mar. Pollut. Bull. 1999, 38, 389–393. [Google Scholar] [CrossRef]
  37. Koutsodendris, A.; Papatheodorou, G.; Kougiourouki, O.; Georgiadis, M. Benthic Marine Litter in Four Gulfs in Greece, Eastern Mediterranean; Abundance, Composition and Source Identification. Estuar. Coast. Shelf Sci. 2008, 77, 501–512. [Google Scholar] [CrossRef]
  38. Colella, S.; Falcini, F.; Rinaldi, E.; Sammartino, M.; Santoleri, R. Mediterranean Ocean Colour Chlorophyll Trends. PLoS ONE 2016, 11, e0155756. [Google Scholar] [CrossRef] [PubMed]
  39. Belgacem, M.; Schroeder, K.; Barth, A.; Troupin, C.; Pavoni, B.; Raimbault, P.; Garcia, N.; Borghini, M.; Chiggiato, J. Climatological Distribution of Dissolved Inorganic Nutrients in the Western Mediterranean Sea (1981–2017). Earth Syst. Sci. Data 2021, 13, 5915–5949. [Google Scholar] [CrossRef]
  40. Turley, C.; Bianchi, M.; Christaki, U.; Conan, P.; Harris, J.; Psarra, S.; Ruddy, G.; Stutt, E.; Tselepides, A.; Van Wambeke, F. Relationship between Primary Producers and Bacteria in an Oligotrophic Sea-the Mediterranean and Biogeochemical Implications. Mar. Ecol. Prog. Ser. 2000, 193, 11–18. [Google Scholar] [CrossRef]
  41. D’Ortenzio, F.; Ribera d’Alcalà, M. On the Trophic Regimes of the Mediterranean Sea: A Satellite Analysis. Biogeosciences 2009, 6, 139–148. [Google Scholar] [CrossRef]
  42. Siokou-Frangou, I.; Bianchi, M.; Christaki, U.; Christou, E.; Giannakourou, A.; Gotsis, O.; Ignatiades, L.; Pagou, K.; Pitta, P.; Psarra, S.; et al. Carbon Flow in the Planktonic Food Web along a Gradient of Oligotrophy in the Aegean Sea (Mediterranean Sea). J. Mar. Syst. 2002, 33–34, 335–353. [Google Scholar] [CrossRef]
  43. Issaris, Y.; Katsanevakis, S.; Pantazi, M.; Vassilopoulou, V.; Panayotidis, P.; Kavadas, S.; Kokkali, A.; Salomidi, M.; Frantzis, A.; Panou, A.; et al. Ecological Mapping and Data Quality Assessment for the Needs of Ecosystem-Based Marine Spatial Management: Case Study Greek Ionian Sea and the Adjacent Gulfs. Mediterr. Mar. Sci. 2012, 13, 297. [Google Scholar] [CrossRef]
  44. Bearzi, G.; Bonizzoni, S.; Gonzalvo, J. Mid-Distance Movements of Common Bottlenose Dolphins in the Coastal Waters of Greece. J. Ethol. 2011, 29, 369–374. [Google Scholar] [CrossRef]
  45. Shillington, D.J.; McNeill, L.C.; Carter, G.D.O. Expedition 381 Preliminary Report: Corinth Active Rift Development; International Ocean Discovery Program Preliminary Report; International Ocean Discovery Program: College Station, TX, USA, 2019; Volume 381. [Google Scholar]
  46. McNeill, L.C.; Shillington, D.J.; Carter, G.D.O.; Everest, J.D.; Le Ber, E.; Collier, R.E.; Cvetkoska, A.; De Gelder, G.; Diz, P.; Doan, M.L.; et al. Site M0079. Proc. Int. Ocean Discov. Progr. 2019, 381, 105. [Google Scholar] [CrossRef]
Figure 2. Mean SST evolution over the Patras and Corinth Gulfs between 2008 and 2022. The temperature is in °C.
Jmse 13 00623 g002
Figure 3. SST maps evidencing the phenomenon in the Patras Gulf. The color scales are in °C. (A) 6 March 2008 (B) 5 November 2008 (C) 31 August 2017 (D) 24 August 2017.
Jmse 13 00623 g003
Figure 4. CHL concentration over several days in the study area. The scale is a logarithmic scale (log10 mg/m3), providing a better view of the concentrations. (A) 15 March 2008 (B) 21 October 2009 (C) 3 February 2010 (D) 10 March 2011 (E) 25 October 2018 (F) 5 October 2021.
Jmse 13 00623 g004
Figure 5. SST maps of cold waters entering the Corinth Strait through the Rio–Antirio strait. The color scales are in °C.
Jmse 13 00623 g005
Figure 6. Evidence through SST data of the hydrodynamic circulation that takes place in front of Itea Bay. The color scales are in °C. (A) 17 May 2014 (B) 28 August 2014 (C) 20 August 2018 (D) 8 May 2019 (E) 22 August 2020 (F) 23 August 2020.
Jmse 13 00623 g006
Figure 7. SST maps of the Corinth Gulf evidencing the phenomena located in front of Antikyra Bay. The color scales are in °C. (A) 17 September 2008 (B) 15 August 2008 (C) 9 September 2008 (D) 14 July 2012 (E) 5 September 2014 (F) 1 August 2021.
Jmse 13 00623 g007
Figure 8. Flow direction and velocity of the mean winds over the month of May 2019 based on the ECMWF dataset.
Jmse 13 00623 g008
Figure 9. SST maps of the Corinth Gulf evidencing the relatively cold waters of the Alkyonides Gulf in the warmer waters from the East Corinth Region. The color scales are in °C.
Jmse 13 00623 g009
Figure 10. Display of the spatial and temporal variability given by the EOF analysis. The color scale indicates a variability factor, and the graph displays the temporal evolution of this variability.
Jmse 13 00623 g010
Figure 11. Synthetic map of the main dynamics in the Gulfs of Patras and Corinth. The surface phenomena are in blue, and the inferred bottom dynamics are in red. “Up.” stands for upwelling and “O.F.” for oceanic front.
Jmse 13 00623 g011
Table 1. Datasets information and treatments used in this study.
NameResolutionTime CoverageSourceTreatment
SST0.01° × 0.01°From 1 January 2008, to 20 January 2022CMEMS [24]- Elimination of days with >95% missing data
- Manual selection of maps showing key events
- DINEOF Analysis
CHL1 × 1 kmFrom 1 January 2008, to 20 January 2022CMEMS [25]- Elimination of days with >95% missing data
- Manual selection of maps showing key events
Table 2. Mean SST and standard deviation (STD) for the six regions over the 2008–2022 period, with differences between winter (November to April) and summer (May to November). Region boundaries are according to Figure 1.
SST °CMeanSTD
YearWinterSummerYearWinterSummer
Eastern Ionian Sea21.1116.7723.877.216.295.55
Patras Gulf20.5516.0123.427.616.306.34
Strait and Entrance20.0315.8622.817.035.566.28
West Corinth 20.3016.0323.177.195.566.54
East Corinth 20.5616.0823.576.434.935.07
Alkyonides Gulf20.8516.0623.708.477.037.14
Disclaimer/Publisher’s Note: The statements, opinions and data contained in all publications are solely those of the individual author(s) and contributor(s) and not of MDPI and/or the editor(s). MDPI and/or the editor(s) disclaim responsibility for any injury to people or property resulting from any ideas, methods, instructions or products referred to in the content.

