Article

Delay Propagation at U-Shaped Automated Terminals for Multilevel Handlings Based on Multivariate Transfer Entropy

1
Institute of Logistics Science & Engineering, Shanghai Maritime University, Shanghai 201306, China
2
Merchant Marine College, Shanghai Maritime University, Shanghai 201306, China
*
Author to whom correspondence should be addressed.
J. Mar. Sci. Eng. 2025, 13(3), 581; https://doi.org/10.3390/jmse13030581
Submission received: 25 February 2025 / Revised: 13 March 2025 / Accepted: 14 March 2025 / Published: 16 March 2025
(This article belongs to the Section Coastal Engineering)

Abstract

:
Port congestion leads to frequent delays in multilevel handlings at automated terminals (ATMH). These delays propagate throughout the terminal, intensified by the interdependencies among equipment, which severely undermines the overall efficiency of the port. To elucidate the characteristics of ATMH and to investigate the dynamics of delay propagation, this study employs causal analysis methods applied to a U-shaped automated terminal multilevel handling system. By integrating the Minimum Redundancy Maximum Relevance (mRMR) algorithm with multivariate transfer entropy, we propose a novel approach to develop an interactive influence network for a U-shaped automated container terminal. Furthermore, this research develops a delay propagation model that accounts for equipment withdrawal mechanisms. The simulation results indicate that the multilevel handling system exhibits a certain degree of randomness, with close interaction between Automated Guided Vehicles and yard cranes. Measures that involve the withdrawal of propagating equipment and the implementation of immunity control on critical equipment can significantly mitigate the spread of delays. This study broadens the methodological framework for existing research on multilevel handling systems at automated terminals, exploring the operational characteristics and propagation patterns of delays. Such insights will assist terminals in implementing effective governance strategies when confronted with delays induced by uncertain factors, thereby reducing the risk of delay propagation and enhancing overall operational efficiency.

1. Introduction

Ports are a critical component of the logistics chain [1], and their safety and stability significantly affect maritime transport efficiency and the overall stability of supply chains. In recent years, unforeseen events and political conflicts have frequently triggered port congestion, escalating shipping costs and posing significant challenges to terminal operations. For instance, the Red Sea crisis [2] and attacks by Houthi forces compelled many shipping companies to divert their routes around the Cape of Good Hope, which resulted in the loss of opportunities for refueling and unloading at Middle Eastern ports. This diversion has led to severe congestion at the Port of Singapore within the Central European shipping route. Such congestion has resulted in the accumulation of vessels, pushing the utilization rate of terminal yard spaces to nearly 90% [3], which has sharply increased the workload of loading, storage, and transfer handlings in the short term. This not only intensifies the operational pressure on equipment and complicates scheduling but it also heightens the likelihood of operational delays due to conflicting time windows, further exacerbating the congestion problem. As a vital component of the port, automated container terminals encompass various handling processes [4], including loading and unloading handlings by Quay Cranes (QC), transfer handlings performed by Automated Guided Vehicles (AGV), activities of Yard Cranes (YC) operating within the yard, and the retrieval and delivery of containers on the land side. These processes form an intricately interconnected and mutually influential system. When any segment experiences delay due to malfunctions or scheduling conflicts, the resulting delays tend to propagate throughout the terminal and impact the operational processes.
Most researchers addressing the uncertainties in terminal handlings primarily focus on solutions from the perspectives of scheduling and optimization [5,6]. Tan et al. [7] investigated the optimization of berth and crane configurations under the influences of vessel arrival time deviations and fluctuations in unloading capacity. Jian et al. [8] explored the scheduling of AGVs and issues related to container storage in the context of AGV congestion risks. He et al. [9] developed scheduling plans for container terminal yard templates in the face of uncertain risks and traffic congestion. However, the aforementioned studies mainly involve the optimization of individual or dual-handling phases. Given that automated container terminals are complex systems with tightly interlinked handling phases, optimizing individual components poses challenges in comprehensively exploring delay issues within the system.
In recent years, advances in topological mathematics have led to a surge in research on complex networks [10,11]. As a key tool for describing complex systems, complex network theory has been applied in the field of automated terminal handlings. Xu et al. [12] were the first to apply complex network theory to the process of terminal handlings. They used hypernetwork theory to construct a network model for the propagation of uncertain events in the multilevel loading and unloading process at container terminals. Li et al. [13] abstracted the equipment and relationships in the primary functional areas of the terminal into nodes and edges, thereby establishing a multilevel risk entity network for automated container terminals. By employing the Gillespie algorithm, they simulated the dynamics of risk propagation and identified the chains of risk transmission within the multilevel handling framework.
However, the dynamic characteristics of multilevel terminal handlings pose significant challenges in accurately capturing the complex interactions among equipment by solely constructing networks based on handling tasks or entity associations as edges. To address this limitation, research methodologies grounded in information flow theory have gained increasing prominence. As an effective tool, transfer entropy serves to identify the coupling relationships among multilevel handling equipment. Thus, unlike traditional network methods that use handling tasks or equipment associations as edges, this study adopts an information flow perspective to construct the multilevel handling network for terminals. By incorporating transfer entropy theory into the terminal handling process, a more comprehensive understanding of the coupling relationships among equipment within the system is achieved, resulting in enhanced insight into their interactions. Additionally, based on the SEIR model, a multilevel handling delay propagation model that considers equipment withdrawal is proposed. This model constructs an interactive influence network through the calculation of multivariate transfer entropy between equipment and conducts simulation analyses of delay propagation under various regulatory strategies and delay magnitudes to explore the patterns of delay propagation.
The main innovations of this study are outlined as follows:
(1)
This paper proposes an innovative method for constructing the interaction network of multilevel handlings in U-shaped automated container terminals utilizing multivariate transfer entropy. In contrast to previous studies that construct multilevel handling networks using handling tasks or entity associations as edges, this study employs causal analysis techniques within multilevel handling systems. This study utilizes data-driven computations of multivariate transfer entropy between pieces of equipment to delineate the interactive influence relationships among handling equipment.
(2)
Based on the SEIR model and considering the practical characteristics of multilevel handling delays, a multilevel handling delay propagation model that incorporates the equipment withdrawal rate is proposed. Additionally, a method for identifying node criticality is introduced, which comprehensively considers the network structure characteristics and the task volume of equipment, along with implementing immunity control for critical equipment.
This paper is structured as follows: The Section 1 provides an overview of the research background. Section 2 presents a review of the relevant literature. Section 3 identifies the research problem and introduces the methodology employed for constructing the network. Section 4 formulates the multilevel handling delay propagation model for the terminal. Section 5 presents a practical case study that involves network construction and delay propagation simulation analysis. Section 6 discusses the experimental results, research limitations, and suggestions for future research. Finally, Section 7 summarizes the conclusions derived from this study.

2. Literature Review

2.1. Multilevel Handlings in Automated Terminals

Automated container terminals, as key hubs in sea-to-land container transportation, are typically divided into three main areas within the operational zone: the quay crane operation area, the AGV transfer area, and the yard operation area.
Naeem D et al. [14] presented an overview of the research on multilevel handlings at automated terminals in recent years, providing a comprehensive review of the integrated scheduling of quay cranes, Automated Guided Vehicles (AGVs), and yard cranes at automated container terminals. Currently, research on multilevel handlings at automated terminals mainly focuses on the scheduling optimization between local equipment. The primary approaches involve formulating the problem as a queueing problem or a hybrid flow shop problem through mathematical modeling, or using heuristic algorithms, such as Genetic Algorithms (GA) [15], Particle Swarm Optimization, and Simulated Annealing, to efficiently obtain a good solution. For example, Yue et al. [16] proposed a method for optimizing the configuration and scheduling of QCs and AGVs to improve the service at automated container terminals. Xu et al. [17] proposed an integrated scheduling optimization model based on mixed integer programming for the U-shaped automated container terminal layout, with the aim of minimizing task completion time. Tang et al. [18] proposed a scheduling model based on deep reinforcement learning to improve the operational efficiency of U-shaped automated container terminals.
A few experts and scholars have begun to study multilevel handlings at automated container terminals from a global perspective. Li et al. [19], considering the strong correlation and integrated nature of equipment operations, proposed a comprehensive problem that simultaneously addresses resource allocation and scheduling for QC, YC, and AGV. Additionally, some researchers have utilized digital twin technology to optimize and assess the safety of overall loading and unloading operations in real-time. For instance, Yang et al. [20] conducted a comprehensive analysis of the challenges and requirements of automated terminal operations from both equipment and operational management perspectives. They proposed and discussed the advantages of digital twin technology in operation optimization at automated terminals, along with relevant implementation methods. Li et al. [21] proposed a framework that combines digital twin technology with the AdaBoost algorithm to achieve real-time optimization and safety monitoring at automated terminals.
Recent developments in topology have led to a rapid surge in the study of complex networks. Complex network theory has found wide applications across various fields, including power systems [22,23], public transportation [24,25], maritime logistics [26,27], and social networks [28]. The rise of complex network research has provided a rich theoretical foundation and new insights for analyzing multilevel handling systems at automated container terminals. For example, Li et al. [13] abstracted the equipment and relationships within the main functional areas of the terminal as nodes and edges, constructing an entity network for multilevel handlings at automated terminals. Additionally, Xu et al. [12] were the first to apply hypernetwork theory to terminal operations, using equipment resources as nodes and operational tasks as hyperedges, thereby constructing a hypernetwork for multilevel handlings.
However, due to the nonlinearity, time-varying nature, and complex interactions between equipment in multilevel handlings, constructing a network with tasks or physical connections as edges makes it difficult to fully and accurately capture the intricate interactions between the equipment in the operational system. In other fields, some scholars have introduced information flow methods to construct network models. As a purely data-driven theoretical approach, transfer entropy can effectively identify potential relationships between time series. For example, Gong et al. [29] employed transfer entropy to develop a stock market network and investigated the dynamics of market changes during crises. In the field of rainfall forecasting, Hakan et al. [30] were the first to combine the concept of transfer entropy with complex network analysis, using transfer entropy to identify nonlinear causal relationships between sites for rainfall prediction. However, these methods do not account for the potential influence of other variables when evaluating the relationships between variables.
Although there has been extensive research on multilevel operation systems in automated terminals, existing studies mostly focus on the optimization modeling of local equipment scheduling. A few scholars have analyzed the system from a network perspective, but they primarily model the edges based on physical connections or operational tasks of equipment, lacking systematic modeling methods that account for the potential impacts between all equipment.

2.2. Delays on Automation Terminal Handlings

Terminal safety and continuous operations are fundamental prerequisites for ensuring high-quality maritime transport services. Various risk factors may arise during operations, potentially leading to disruptions and frequent delays, which directly constrain the efficiency of multilevel handlings at automated terminals.
Some scholars concentrate on identifying the factors that cause operational delays; for example, Pallis et al. [31] employed a risk matrix methodology to assess port handling risks. Khan et al. [32] conducted an in-depth analysis of the diverse risks in handling activities, considering aspects such as technology, facilities, human factors, and organizational management, and subsequently created a multidimensional risk assessment checklist. Xing et al. [33] integrated DEMATEL and gray theory to investigate the causal relationships among terminal operation delay factors, aiming to reduce the subjectivity of expert reviews. Other scholars have conducted research on local delays in multilevel handlings. For example, Kim et al. [34] devised data-driven approaches to forecast ship delays by integrating historical and real-time data sources. Li et al. [35] have examined strategies to restore ship schedules following delays, considering options like speeding up, port skipping, and port swapping to balance various costs. Meanwhile, other researchers focused on optimizing port scheduling in the context of ship delays. For example, Xu et al. [36] accounted for the uncertainty in ship arrival delays and operational times. In addition, some scholars have also addressed the issue of delays by exploring scheduling optimization to mitigate their impacts. For example, Tan et al. [7] proposed an optimization method to allocate berths and quay cranes under the risks of deviations in ship arrival times and fluctuations in loading/unloading volumes. Jian et al. [8] focused on the scheduling of automated guided vehicles and container storage under the risk of road congestion. He et al. [9] developed a scheduling plan for container yard templates, considering uncertainties and traffic congestion. Xiang et al. [37] examined the disruptions to baseline plans for discrete berth and crane allocation caused by risks such as chaotic ship berthing schedules and quay crane failures.
The majority of scholars have focused their research on terminal operations delays primarily on analyzing delay factors and the impacts of delays in specific operational segments. However, in actual operations, delays in one segment can propagate to another through the interconnections of equipment, thereby causing more extensive delays across a broader range of operations, known as the “knock-on”. Few scholars have considered the temporal characteristics of multilevel handling networks and employed network-based approaches to study the propagation process of delays.
Existing studies demonstrate that although extensive research has been conducted on the modeling and delay analysis of multilevel handling systems in automated terminals, significant gaps persist. First, the majority of these investigations predominantly focus on scheduling optimization models for individual equipment. While a limited number of scholars have adopted network-based approaches, their methodologies rely solely on physical connections or task associations as network edges, failing to systematically characterize the nonlinear and time-varying interactions inherent in multilevel handling processes. Second, current research on terminal delays primarily emphasizes localized delay factors and their impacts on specific operational phases, while the propagation mechanisms of delays across integrated handling systems have received limited attention.
Therefore, addressing the nonlinear and time-varying interactions among multilevel handling processes in automated terminal systems, developing holistic models from a global perspective, and systematically investigating delay propagation mechanisms through network-based methodologies remain an urgent issue in this field.

3. Problem Description and Methodology

Figure 1 presents the layout of the U-shaped automated terminal [17]. The operational stages include quay crane unloading, AGV transfer, yard crane operations in the stacking area, and container extraction and delivery on the landside, among others. The U-shaped configuration offers an innovative approach to terminal yard layout. Compared to traditional vertical and parallel layouts, it allows for AGV and external trucks to operate without interference during loading and unloading operations. In contrast to the vertical layout, where AGVs typically interact with yard cranes only at the yard’s end, thus having limited interaction points, the U-shaped layout enables AGVs and external trucks to directly enter the yard. The loading and unloading operations occur under the cantilever of the yard cranes on both sides, which increases the number of interaction points. This design effectively improves terminal operational efficiency while reducing energy consumption. Considering the characteristic that AGVs and external trucks do not interfere with each other, which effectively reduces the impact of external disturbances on the interaction impact network modeling, the model in this study mainly focuses on U-shaped automated container terminals.
Upon vessel arrival, quay cranes discharge containers, which are then transported by AGVs to the yard area and lifted by yard cranes to the appropriate bay positions for stacking. The containers are subsequently transported away from the terminal by trucks. The loading operation follows a reverse process. It is noteworthy that the multilevel handling processes at automated container terminals exhibit significant dynamic complexity: events such as equipment failures, AGV path conflicts, and timing conflicts between quay and yard cranes can lead to cascading effects. Traditional static network models based on task dependencies are insufficient to represent such dynamic interactions. From a system topology perspective, the various equipment at the terminal do not function in isolation; instead, they are coupled through information and task flows, forming a complex interaction network. To address the aforementioned challenges, we propose a multilevel handling interaction network modeling method that combines multivariate transfer entropy with Minimum Redundancy Maximum Relevance (mRMR) feature selection.

3.1. Multivariate Transfer Entropy

In information theory, the concept of mutual information I ( X ; Y ) between two discrete random variables X and Y is defined as shown in Equation (1), which quantifies the reduction in uncertainty of one random variable, given the knowledge of the other. Here, P x denotes the probability distribution of X , while P x , y represents the joint probability distribution of X and Y .
I ( X ; Y ) = H ( X ) H ( X Y ) = x X , y Y P ( x , y ) log ( P ( x , y ) P ( x ) P ( y ) )
By introducing the conditioning variable Z based on mutual information, we obtain the conditional mutual information as shown in Equation (2):
I ( X ; Y Z ) = H ( X Z ) H ( X Y , Z ) = z Z P ( z ) x X y Y P ( x y z ) log P ( x y z ) P ( x z ) P ( y z )
Transfer entropy [38] can reveal the interrelationships between different variables without necessitating any specific functional form. It describes the directed information transfer between the handling time series of two pieces of equipment, thereby effectively quantifying the mutual influences between the two variables. The bivariate transfer entropy is derived by calculating the conditional mutual information of the time series variables. For instance, the transfer entropy between the time series X of a quay crane and the time series Y of an AGV is computed as shown in Equation (3):
T E X Y = I Y t ; X t l a g Y t l a g = H Y t Y t l a g H Y t X t l a g , Y t l a g = y t Y t x t l a g X t l a g y t l a g Y t l a g P ( y t , x t l a g , y t l a g ) log P ( y t x t l a g , y t l a g ) P ( y t y t l a g )
Here, X and Y represent the discrete time series variables of the handling equipment, while X t = x 1 , x 2 , x t l a g x t and Y t = y 1 , y 2 , y t l a g y t are the time lags of the time series, which determine the historical time series length of variables X and Y . Variables X t l a g = x 1 , x 2 , x t l a g and Y t l a g = y 1 , y 2 , y t l a g correspond to the historical information of variable X , Y at time t 1 , t l a g . The transfer entropy T E X Y indicates the information transfer from X to Y , which can be understood as the reduction in uncertainty of Y after knowing the historical information X t l a g of the quay crane variable X , given the historical information Y t l a g of the AGV variable Y .
Due to the interdependent nature of equipment handling, it is essential to consider the influence of other equipment when calculating the transfer entropy between any two pieces of equipment. For example, during the process in which an AGV transfers containers to a storage yard, it is necessary to account for the dynamic effects of other AGVs along its path, as well as the scheduling and coordination involving the quay crane. To address this, a multivariate transfer entropy method is proposed that incorporates the time series of other handling equipment as a set of conditioning variables within the bivariate framework. Here, the set of conditioning variables is denoted as Z = Z 1 , Z 2 , Z 3 Z m , with each time series variable represented as Z m = z 1 , z 2 , z t l a g z t . The expression for multivariate transfer entropy is given as shown in Equation (4):
T E X Y | Z = I Y t ; X t l a g Y t l a g , Z t l a g = H Y t Y t l a g , Z t l a g H Y t X t l a g , Y t l a g , Z t l a g = y t Y t x t l a g X t l a g y t l a g Y t l a g z t l a g Z t l a g P ( y t , x t l a g , y t l a g , z t l a g ) log P ( y t x t l a g , y t l a g , z t l a g ) P ( y t y t l a g , z t l a g )
Due to the biases inherent in the calculation of transfer entropy using small sample data, some studies have introduced the concept of effective transfer entropy to mitigate these biases. This concept has been extended to multivariate transfer entropy [39], as expressed in Equation (5):
E T E X Y | Z = T E X Y | Z T E X s h u f f l e d Y Z
Here, T E X s h u f f l e d Y | Z represents the multivariate transfer entropy after disrupting the order of the time series variable X . After shuffling the time order, as the sample size increases, T E X s h u f f l e d Y | Z approaches zero. All non-zero values of T E X s h u f f l e d Y | Z are errors caused by small sample effects. By subtracting these errors, the effective multivariate transfer entropy E T E X Y | Z can be obtained.

3.2. mRMR Feature Selection Algorithm

When calculating the multivariate transfer entropy between handling equipment, it is essential to account for the influences of other equipment and the historical timing of the equipment in question. As the dimensionality of the conditioning variable set increases, the computational process may encounter the “curse of dimensionality”, which significantly increases the required memory and computation time. Consequently, dimensionality reduction becomes imperative prior to computing multivariate transfer entropy. This reduction process is akin to feature selection and can be achieved using the mRMR feature selection algorithm [40]. The objective function for feature selection is represented as shown in Equation (8):
max R ( S , Y t ) , R = 1 | S | X i S I ( X i , Y t )
min Q ( S ) , Q = 1 S 2 X i , X j S I ( X i , X j )
max Φ ( R , Q ) , Φ = R Q
Equation (6) represents the correlation between the candidate variables and the target variable, while Equation (7) denotes the redundancy among the candidate variables; let Y t be the target variable, X i be the selected candidate variables, S be the set of candidate variables, and X j be an individual variable within the candidate variable set.
During the feature selection process, a complete set of candidate conditioning variables is first obtained, with each variable assigned a maximum time lag, resulting in the candidate conditioning variable set C = X t 1 , , X t m l a g , Y t 1 , , Y t m l a g , Z 1 ( t 1 ) , , Z 1 ( t m l a g ) , , Z m ( t 1 ) , , Z m ( t m l a g ) .
The specific algorithmic process is as follows:
Step 1: Initialize an empty set of selected conditioning variables ( 0 ) = .
Step 2: In the first iteration, k = 1 compute the correlation R between each variable in the candidate conditioning variable set C and the target variable Y t . Select the conditioning variable ( 1 ) = c = arg max c C   R ( S , Y t ) with the highest correlation and add it to the selected conditioning variable set V .
Step 3: When k > 1 , ( i ) = c = arg max c C   Φ ( R , Q ) , add the new variable c to the selected conditioning variable set V .
Step 4: The loop terminates when the significance test for c is not satisfied. At this point, the selected conditioning variable set = { X , Y , Z } is obtained.
Step 5: Calculate the multivariate transfer entropy T E X Y | Z = H Y t Y , Z H Y t X , Y , Z between the variables.

3.3. Data Processing and Network Construction

To address the issue of sensitivity to data stationarity in the calculation of transfer entropy, this study first analyzes the known handling time series. To ensure the stationarity of the data, we employed Z-score normalization, the Augmented Dickey–Fuller (ADF) test, and a first-order differencing method for data preprocessing. Z-score normalization is a method used to eliminate data trends and mean biases, effectively enhancing data stationarity. Specifically, the definition of Z-score normalization can be referenced in Equation (9).
W i = W i W , i σ W , i
In this equation, W i represents the data at time i within the entire time series, W , i and σ W , i denote the mean and standard deviation of the entire time series, respectively, and W i is the data at time i after the Z-score normalization process.
ADF test is a statistical method used to assess the stationarity of a time series by determining the presence of a unit root, which indicates non-stationarity. Since some datasets may still exhibit non-stationary behavior even after Z-score normalization, it is essential to conduct the ADF test after the normalization process. If the test is passed, it indicates that the time series is stationary. If the test is not passed, further adjustments to achieve stationarity are required for the time series, utilizing a first-order differencing method, as shown in Equation (10).
W i = W i + 1 W i
The specific methodology for constructing the multilevel handling interaction impact (MHII) network proposed in this paper is illustrated in Figure 2. First, the raw equipment handling time series undergoes data preprocessing, where Z-score normalization is applied for detrending and mean adjustment. Subsequently, the data are subjected to the ADF test. If the test is passed, dimensionality reduction is performed on the time series, followed by the calculation of effective multivariate transfer entropy among the time series. If the result of the multivariate transfer entropy calculation is E T E X Y | Z > 0 , it indicates a causal relationship between the two variables. Finally, a multilevel handling interaction impact network is constructed with equipment as nodes and the relationships between them as edges.

4. Delay Propagation Model

4.1. Adaptive Analysis of the SEIR Model

The propagation of delays among multilevel handling equipment occurs as a point-to-area diffusion process, akin to the spread of diseases within a network. The SEIR model has been extensively applied across various fields, including network information dissemination [41] and risk communication [42]. Due to the time windows between equipment operations, a delayed equipment does not immediately impact the equipment it interacts with. This characteristic makes the SEIR model more suitable than the SIS and SIR models for this scenario. A comparative analysis of the SEIR model and the multilevel handling delay propagation process reveals the following:
(1)
Delayed equipment can propagate their delay status to associated handling equipment through inter-stage connections, analogous to how infected individuals in the SEIR model propagate the virus to susceptible individuals.
(2)
For equipment nodes exhibiting a delay status, there exists a certain time window between handling stages, during which the delay status is not immediately propagated to other equipment. This is comparable to how susceptible individuals in the SEIR model become infected by virus carriers, initially propagating to non-infectious latent individuals before ultimately becoming infectious.
(3)
When delays occur, interventions by terminal management lead to the eventual dissipation of the delay status in affected equipment nodes, transforming them back into non-delayed equipment. This process is analogous to recovered individuals returning to normalcy and becoming immune after overcoming an infection.
From the above analysis, it is evident that the delay propagation process between stages of multilevel handlings exhibits similarities to the propagation process of infectious diseases. This indicates the applicability of the SEIR model in studying delay propagation among handling stages within the terminal, demonstrating greater relevance compared to the SIS and SIR models.

4.2. Multilevel Handling Delay Propagation Model

This paper is based on the SEIR model and, considering the actual characteristics of terminal handlings and the withdrawal of equipment nodes, it constructs a dynamically evolving multilevel SEIR delay propagation model. The conversion relationships between various types of nodes are illustrated in Figure 3, while the types of equipment and parameters used in the model are outlined in Table 1.
The model is based on the following assumptions:
(1)
When a node in a normal handling state comes into contact with a delay propagation node, it converts to a delay node with probability α .
(2)
Due to the presence of time windows between handling phases, there are situations in which quay cranes, yard cranes, and AGVs may need to wait for one another. Consequently, equipment experiencing delays does not immediately propagate these delays to connected equipment. Delay nodes will convert to delay propagation nodes with probability β , while delayed equipment will automatically propagate to a recovery state at a rate of θ .
(3)
Under the immediate control of the terminal management, delay propagation nodes will convert to recovery nodes with probability γ ; additionally, some delay propagation nodes that cannot be restored to normal status due to equipment failure will withdraw the handling process with probability ρ .
(4)
Unlike nodes in infectious diseases that are immune and can no longer be infected, equipment in an immune state can still be affected by delays from other equipment during handling, leading to a renewed delay. Immune nodes will convert to susceptible nodes with probability δ .
Based on the above assumptions, the basic SEIR model has been improved to derive the multilevel handling delay propagation model, as expressed in Equation (11):
d S t m , n d t = δ R t m , n α ϖ m S t m , n I t m , n N d E t m , n d t = α ϖ m S t m , n I t m , n N β E t m , n θ E t m , n d I t m , n d t = β E t m , n ρ I t m , n γ I t m , n d R t m , n d t = γ I t m , n + θ E t m , n δ R t m , n
At time t , the normal handling equipment S t m , n with in-degree m and out-degree n has a probability of ϖ = i , j P i , j | m , n ) I i , j t in being directed by the delay propagation equipment, while P i , j | m , n represents the connection probability between nodes i and j . At time t , the quantities of normal handling equipment, delayed state equipment, delay propagation equipment, and recovery equipment are denoted as S t , E t , I t , R t , satisfying the following conditions:
S t + E t + I t + R t = N t
d N t d t = d S t m , n d t + d E t m , n d t + d I t m , n d t + d R t m , n d t = ρ I t m , n
When the various types of equipment nodes stop changing, and the number of delay propagation equipment is I t = 0 , it is possible to determine the no-delay equilibrium point χ 0 = ( S 0 , 0 , 0 , 0 ) , with S 0 representing the initial number of normal handling equipment. Setting the rate of change of each type of equipment node in Equation (11) to zero, the equilibrium point of the multilevel handling network delay propagation is denoted as χ * = ( S * , E * , I * , R * ) , as expressed in Equation (14):
S * = N ( β + θ ) ( ρ + γ ) α ϖ m β E * = α ϖ m ( β + θ ) ( ρ + γ ) δ ( β + θ ) α ϖ m ( β + θ ) I * = β E * ρ + γ R * = α ϖ m β 2 E * δ ( β + θ ) ( ρ + γ ) 2
In the propagation dynamics model, the basic reproduction number R 0 is an indicator of the propagation trend within the network. When R 0 > 1 , it indicates that delay propagation will continually expand; when R 0 < 1 , it suggests that delay propagation will gradually dissipate over time. The basic reproduction number R 0 can be solved using the next-generation matrix method. Let χ = ( E , I , R , S ) T ; thus, Equation (11) can be expressed as χ = Ψ ( χ ) Φ ( χ ) , simplified to Equation (15):
Ψ ( χ ) = α ϖ m S I N 0 0 0 , Φ ( χ ) = β E + θ E β E + ρ I + γ I γ I θ E + δ R δ R + α ϖ m S I N
The Jacobian matrix corresponding to the no-delay equilibrium point χ 0 = ( S 0 , 0 , 0 , 0 ) for Ψ ( χ ) , Φ ( χ ) is given as Equation (16):
J ( Ψ χ 0 ) = F 0 0 0 , J ( Φ χ 0 ) = V 0 V 1 V 2
F = 0 α ϖ m S 0 N 0 0 , V = β + θ 0 β ρ + γ
F V 1 = 0 α ϖ m S 0 N 0 0 β + θ 0 β ρ + γ 1 = α ϖ m S 0 β N ( β + θ ) ( ρ + γ ) α ϖ m S 0 N ( ρ + γ ) 0 0
The calculation formula for the basic reproduction number R 0 is as follows:
R 0 = ρ ( F V 1 ) = α ϖ m β S 0 N ( β + θ ) ( ρ + γ )

5. Instance Analysis

5.1. Construction of a Multilevel Handling Interaction Impact Network

This study develops a multilevel handling interaction impact (MHII) network based on the unloading and loading handling data of container ships docking at a U-shaped automated terminal in China between 8:00 on 12 May 2023, and 16:00 on 13 May 2023. The data include six quay cranes, thirty-six AGVs, and twelve-yard cranes, totaling fifty-four units of equipment, and record the handling start and end times for each piece of equipment. After processing to identify outliers, the data format is presented in Table 2.
Based on the handling time data of the terminal’s internal equipment, a time series is constructed for each piece of handling equipment. The data are segmented into 20 min intervals, and the average handling time for each equipment within each interval is calculated to generate time series data. This results in the average handling time series Q e = W 1 T , W 2 T , W 3 T , , W i T for each piece of equipment during the container loading and unloading period I = [ 1 , 2 , 3 i ] , where W i T represents the average time of equipment e in the i time interval, T S T A and T E N D denote the start and end times of the handling, respectively, and F indicates the number of containers loaded and unloaded within the i time interval.
W i T = m F ( T E N D T S T A ) F
Based on Equation (20), the average handling time for each piece of equipment within the defined time intervals is calculated, resulting in a collection Q = [ Q e 1 , Q e 2 , Q e 3 , , Q e N ] of average handling time series for the selected time period. The average handling time series in Q are combined two by two, and then there are A N 2 groups. Drawing on handling experience from the terminal, m l a g = 3 is established to focus solely on the interactions between equipment within a one-hour timeframe, thereby constructing a candidate variable set for maximum lag. Conditional variables are selected using the feature selection Formula (8), and the multivariate transfer entropy between equipment is subsequently computed.
According to the results of the multivariate transfer entropy calculation, when E T E X Y | Z > 0 is satisfied, an edge exists between the equipment nodes i and j ; let this be denoted as e i j = 1 , otherwise denote it as e i j = 0 . A multilevel handling interaction impact network G = ( V , E ) is constructed, where the node set V represents the equipment, and the edge set E represents the interactions between equipment. Explanation of related variables and pseudocode as shown in Table 3. For the detailed algorithm process, refer to Algorithm 1.
Algorithm 1: Multivariate Transfer Entropy Flow
1:Input:  Q = Q e 1 , Q e 2 , , Q e N ; m l a g ; α ; m R M R _ k
2:Output:  Ω i j c : The causal matrix;  G : MHII network
3:Phase1: Standardize Time Series Data
4:for each time series  Q e i  in  Q  do
5:      Perform Z-Score standardization
6:      Perform ADF stationarity test on the data
7:end for
8:Phase2: Multivariate Transfer Entropy Computation
9:Initialize the causal matrix  Ω c  of size  N × N , and N × N 0
10:for each pair of time series ( Q e i , Q e j )  in A N 2
11:     if  i j  do
12:      Initialize  E T E ( Q e i Q e j ) 0
13:      Select conditional variables  m R M R _ k  and maximum time lag m l a g
14:      Calculate the  E T E ( Q e i Q e j )
15:      Update  E T E ( Q e i Q e j ) , Ω i j c E T E ( Q e i Q e j )
16:      if  Ω i j c > α then there is a causal relationship from  Q e i  to  Q e j
17:end for
18:return the causal matrix Ω c
19:Phase3: The Construction of MHII Network
20:Initialize network  G = ( V , E )
21:for  Ω i j c in Ω c  do
22:if  Ω i j c > 0  then  e i j = 1
23:Add edge from  Q e i  to Q e j  in  G
24:return MHII network  G

5.2. Network Characteristics Analysis

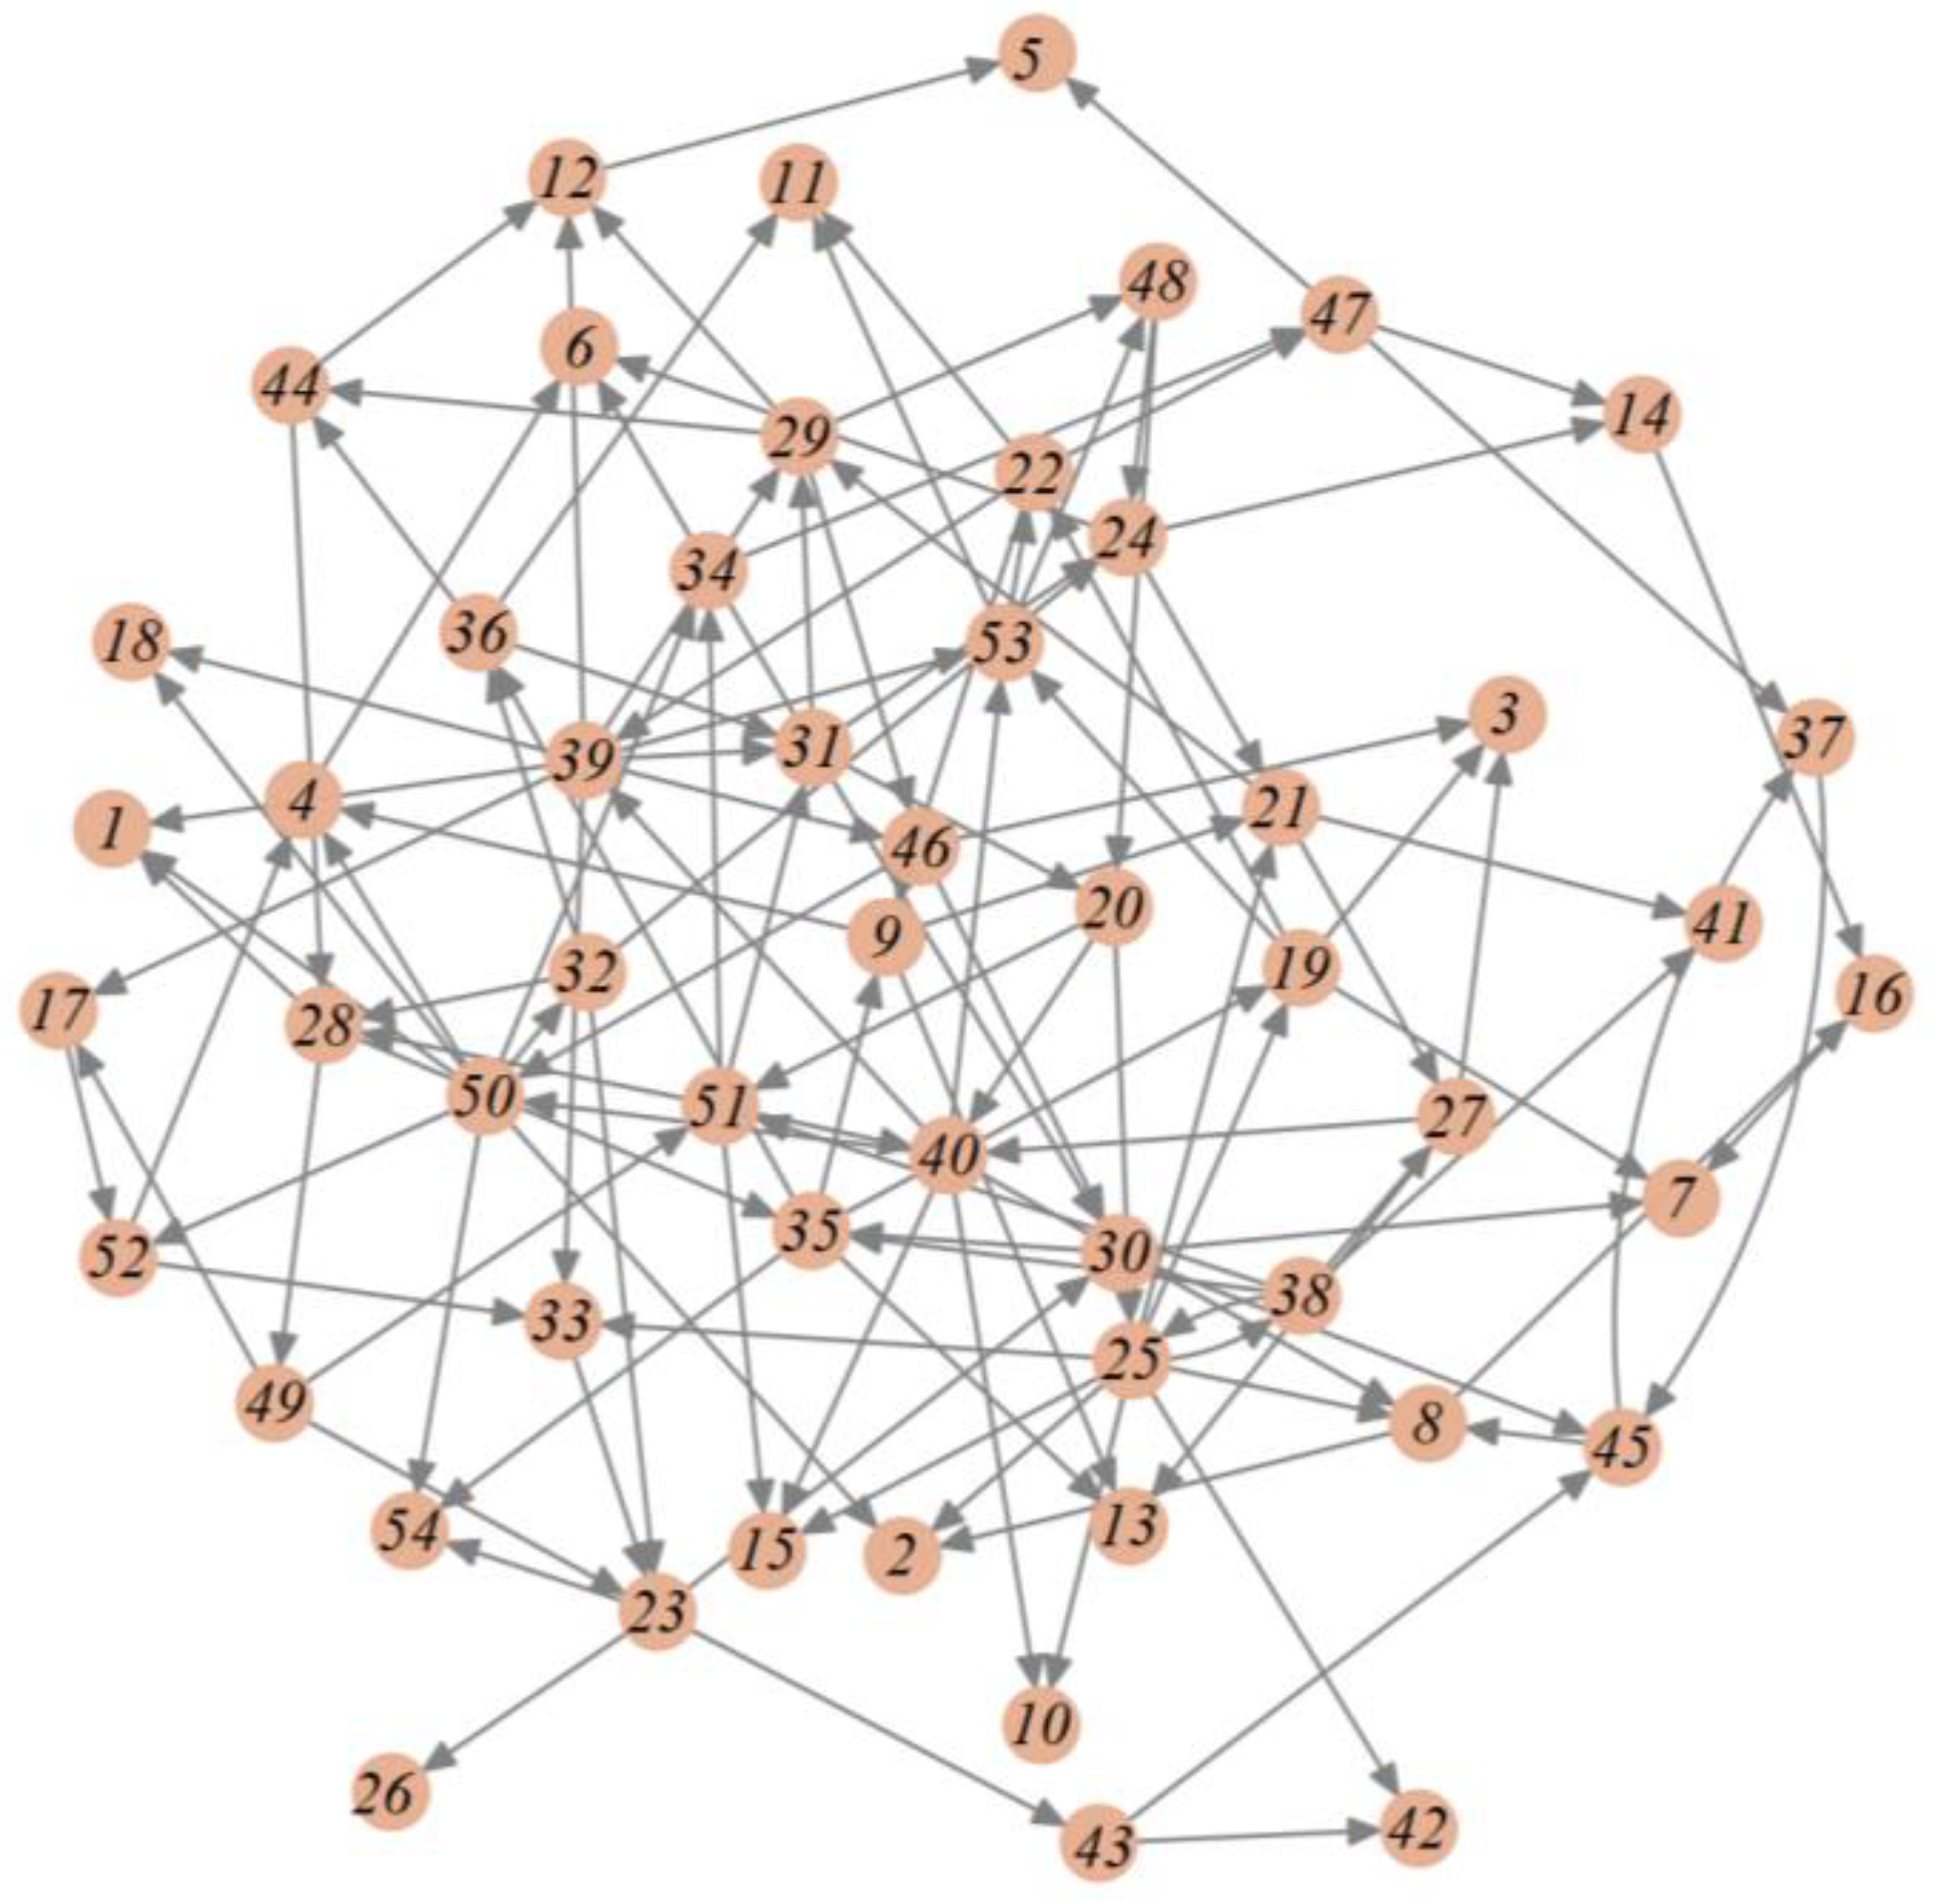
The equipment involved is assigned identifiers, with the set of yard cranes denoted as V Y C = [ v 1 , v 2 , v 3 , , v 12 ] , the set of quay cranes as V Q C = [ v 13 , v 14 , v 15 , , v 18 ] , and the set of AGVs as V A G V = [ v 19 , v 20 , v 21 , , v 54 ] . The multilevel handling interaction impact network is illustrated in Figure 4, while the structural characteristics of the network are presented in Table 4.
Overall, the 54 pieces of equipment exhibit 128 direct interaction relationships, with no isolated nodes present in the network, indicating a relatively low network density. The average degree is 4.741, suggesting that each piece of equipment directly interacts with an average of 4.741 other pieces of equipment. The average path length of the network is 2.656, indicating that the influence relationships between pieces of equipment can be established through an average of 2.656 other pieces of equipment, demonstrating that the interactions among pieces of equipment are not limited to those with direct task relationships. Furthermore, the network clustering coefficient is 0.042. This low level of clustering suggests that the handlings among pieces of equipment are relatively independent, with no significant clustering characteristics arising from changes in the handling demand and states among the pieces of equipment. A comparative analysis with random networks having the same number of nodes and edges reveals that the MHII network exhibits certain random characteristics.
To assess the influence of various equipment in the network from different perspectives, Figure 5 illustrates three common centrality indicators in the MHII network, including closeness centrality, betweenness centrality, and eigenvector centrality.
Closeness centrality [43] measures the average distance from a node to all other nodes in the network. A node with a higher closeness centrality can reach other nodes more quickly or has a higher efficiency in information dissemination. As shown in Figure 5, the distribution of closeness centrality for the equipment nodes is relatively balanced, primarily falling within the range of [0.1, 0.2], reflecting the tight interconnection between different types of equipment in the overall operational network.
Betweenness centrality [44], as a crucial indicator of a node’s role as a “bridge” in information transfer or connectivity within the network, shows significant variation across different types of equipment nodes. From Figure 5, it can be observed that the betweenness centrality values for equipment 1–18 are notably lower than those for equipment 19–54. This pattern aligns with the practical scenario where Automated Guided Vehicles (AGVs) play a key role in transferring containers between the yard cranes and quay cranes during container loading and unloading operations.
Eigenvector centrality [45] measures the importance of a node in the network, taking into account not only the direct connections of the node but also the centrality of its neighbors. In Figure 5, the average eigenvector centrality for equipment 1–18 is higher than that for equipment 19–54, indicating that the yard cranes and quay cranes occupy relatively important positions in the entire operational process.
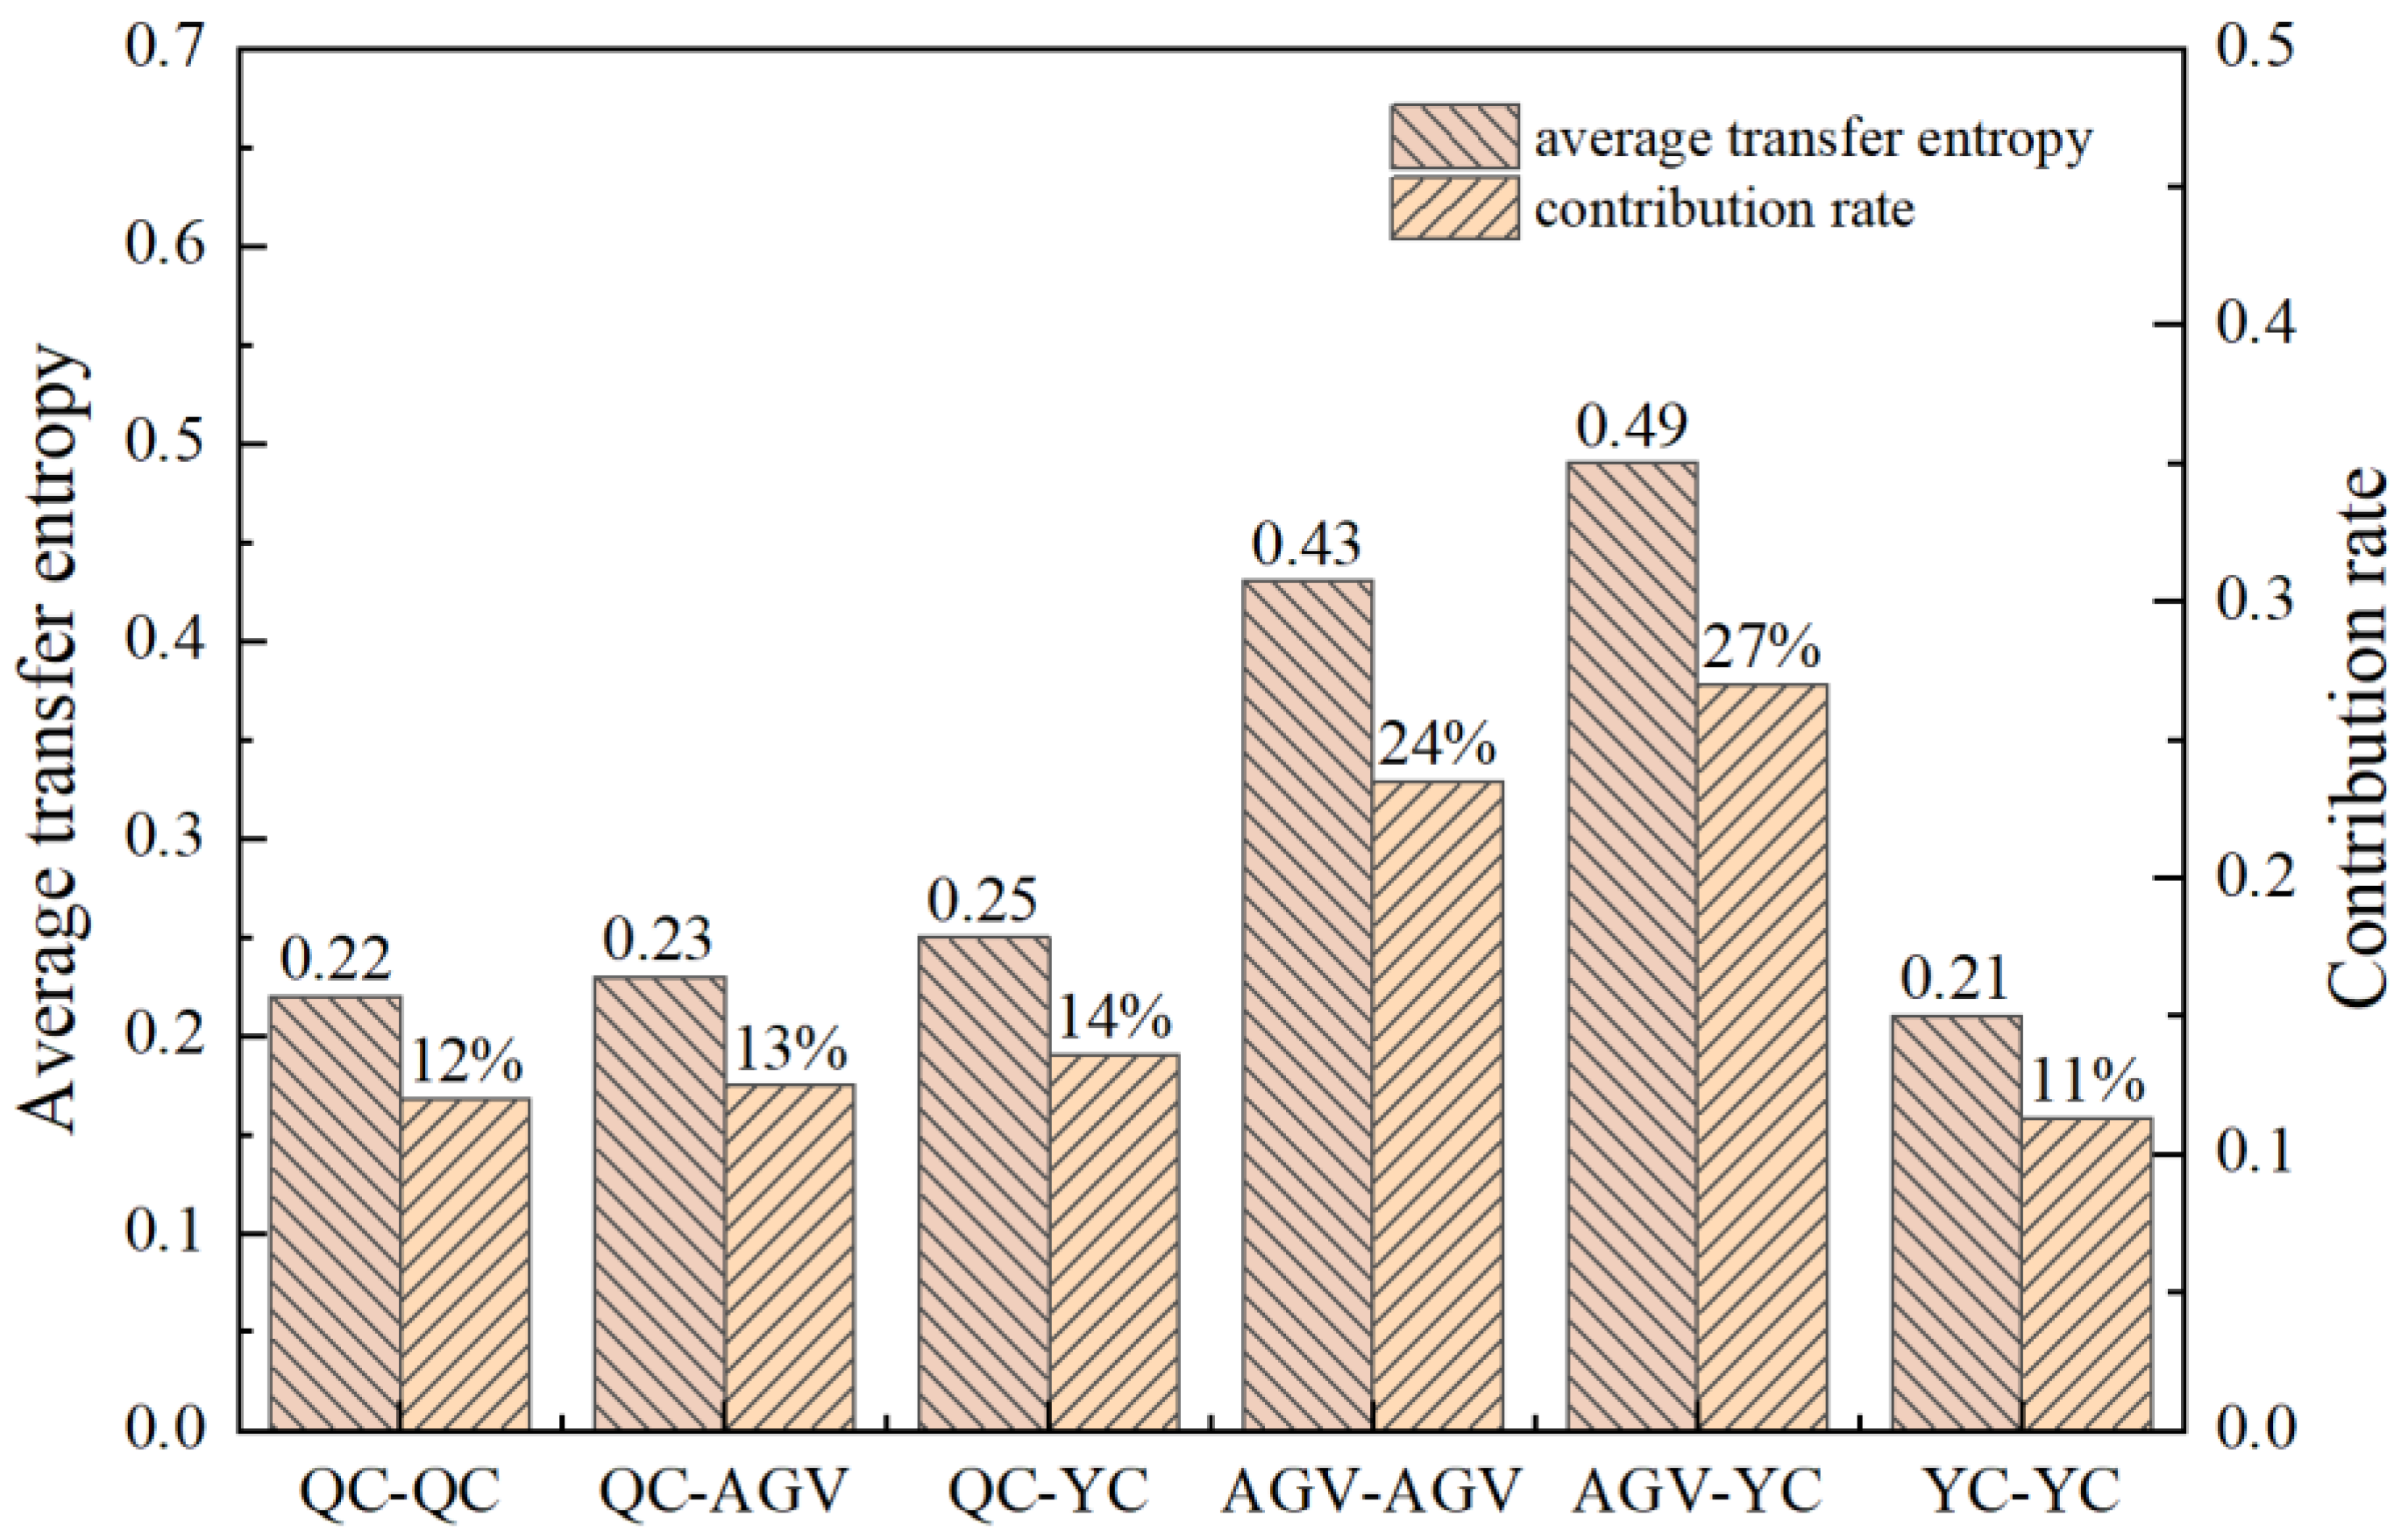
To analyze the interrelations among quay cranes, AGVs, and yard cranes, the multivariate transfer entropy method was employed to quantify the strength of influence between equipment. Figure 6 presents the average transfer entropy values and their contribution rates among these types of equipment. Specifically, the average transfer entropy values among quay cranes, between quay cranes and AGVs, between quay cranes and yard cranes, and among yard cranes are approximately in the range of 0.21 to 0.25. In contrast, the average transfer entropy values among AGVs and between AGVs and yard cranes are notably higher, falling within the range of 0.43 to 0.5. Additionally, the interactions among AGVs and the interactions between AGVs and yard cranes contribute 24% and 27% to the overall average transfer entropy, respectively. This indicates that the transshipment processes involving AGVs and their interactions with yard cranes significantly impact the overall handlings within the multilevel workflow.

5.3. Delay Propagation Simulation

Based on the MHII network constructed at m l a g = 3 , a simulation of the delay propagation process within the terminal was conducted using Python 3.12 to analyze the temporal variation trends of the four types of nodes. Incorporating field research and the relevant parameter settings from [12,13], the initial number of pieces of equipment was set to S 0 = 51 , E 0 = R 0 = 0 , I 0 = 3 , with the parameters defined as α = 0.5 , β = 0.3 , γ = 0.1 , ρ = 0.03 , δ = 0.2 , θ = 0.1 .

5.3.1. Analysis of Delay Propagation Under Different Control Strategies

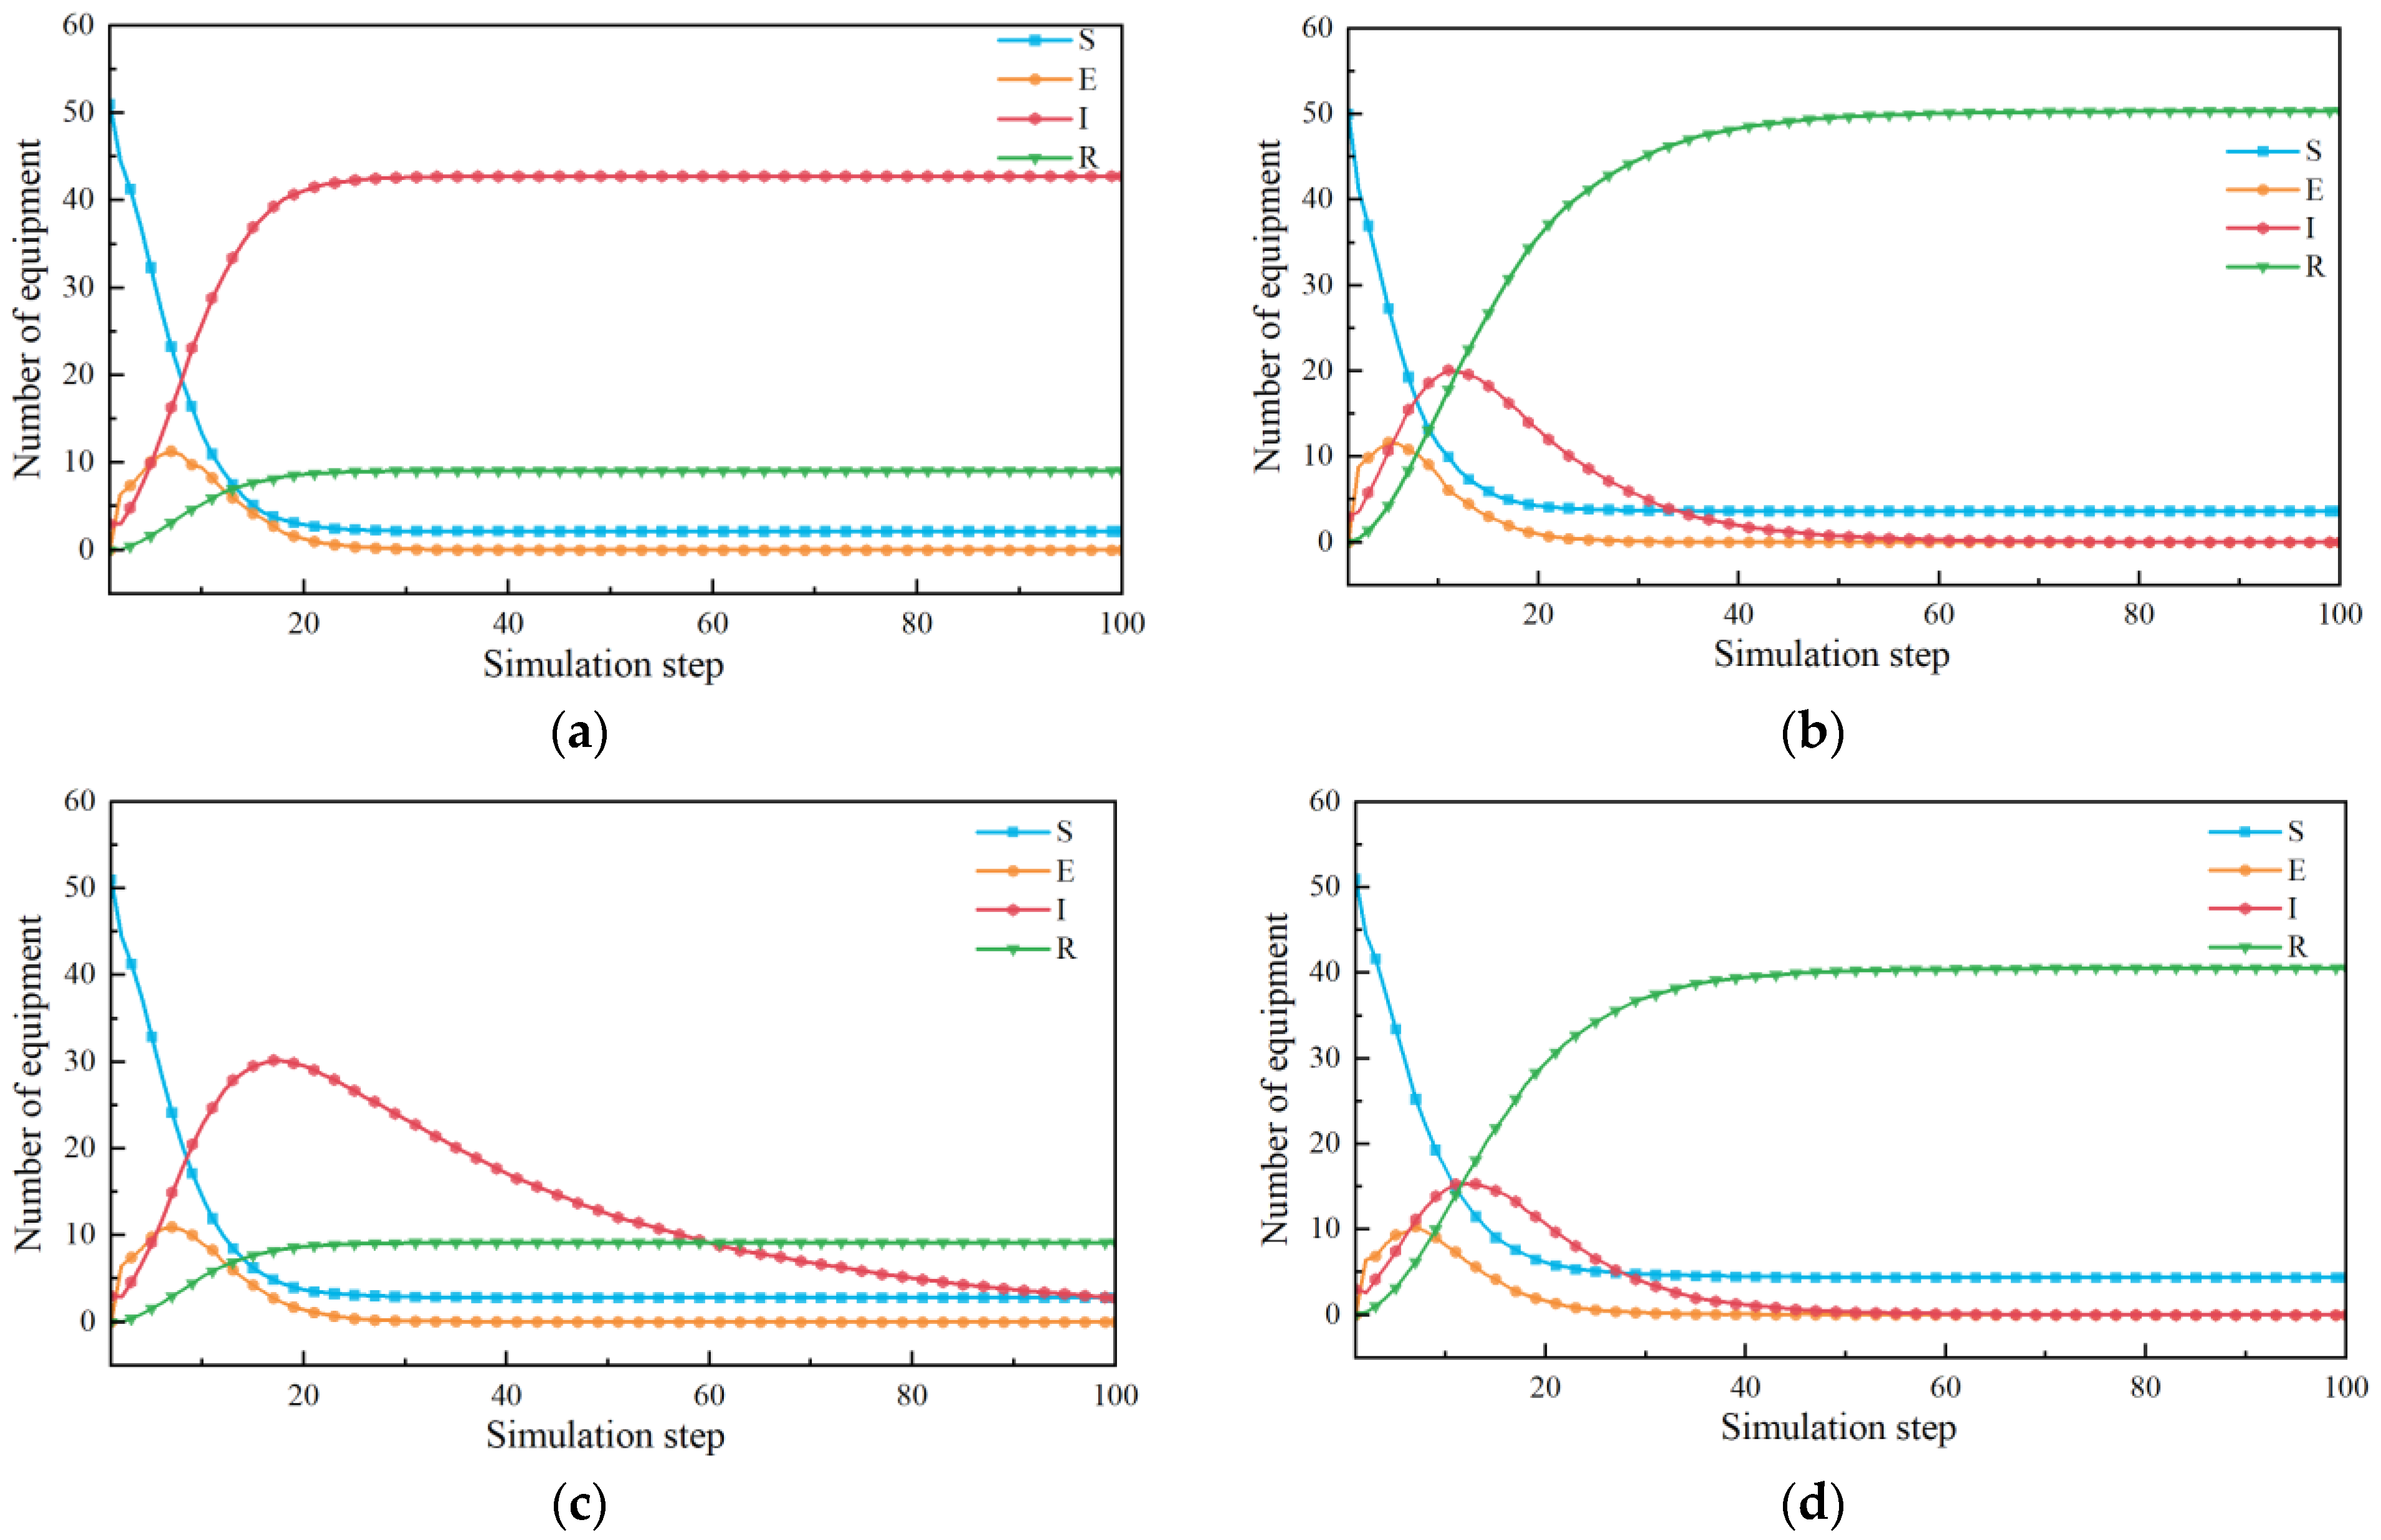
To investigate the propagation of delays among multilevel handling phases under different control strategies, simulations were conducted while keeping other delay propagation parameters constant. Four distinct control strategies were analyzed: no control measures ρ = 0 , γ = 0 ; dynamic control only ρ = 0 , γ = 0.1 ; equipment withdrawal for delay propagation ρ = 0.03 , γ = 0 ; and a combination of both control and equipment withdrawal ρ = 0.03 , γ = 0.1 .
Figure 7 illustrates the temporal variations of the four types of state nodes under these control strategies. As shown in Figure 7a, when no control measures are implemented, handling equipment quickly succumbs to the influence of delayed equipment, resulting in widespread and persistent delays. In contrast, Figure 7b–d indicate that with appropriate dynamic delay control, the peak proportion of delayed equipment decreases by 42.6%, and the delays do not lead to extensive propagation; rather, they stabilize within a limited scope. When only the withdrawal of delay-propagating equipment is implemented, the peak proportion of delayed equipment is reduced by 23.7%. Under the dual control strategy, the peak proportion of delayed equipment decreases by 51.3%, and delays dissipate more rapidly compared to single strategies. Overall, the measures involving the withdrawal of equipment play a positive role in suppressing the spread of delays.

5.3.2. Analysis of Delay Propagation Under Different Initial Delay Scales

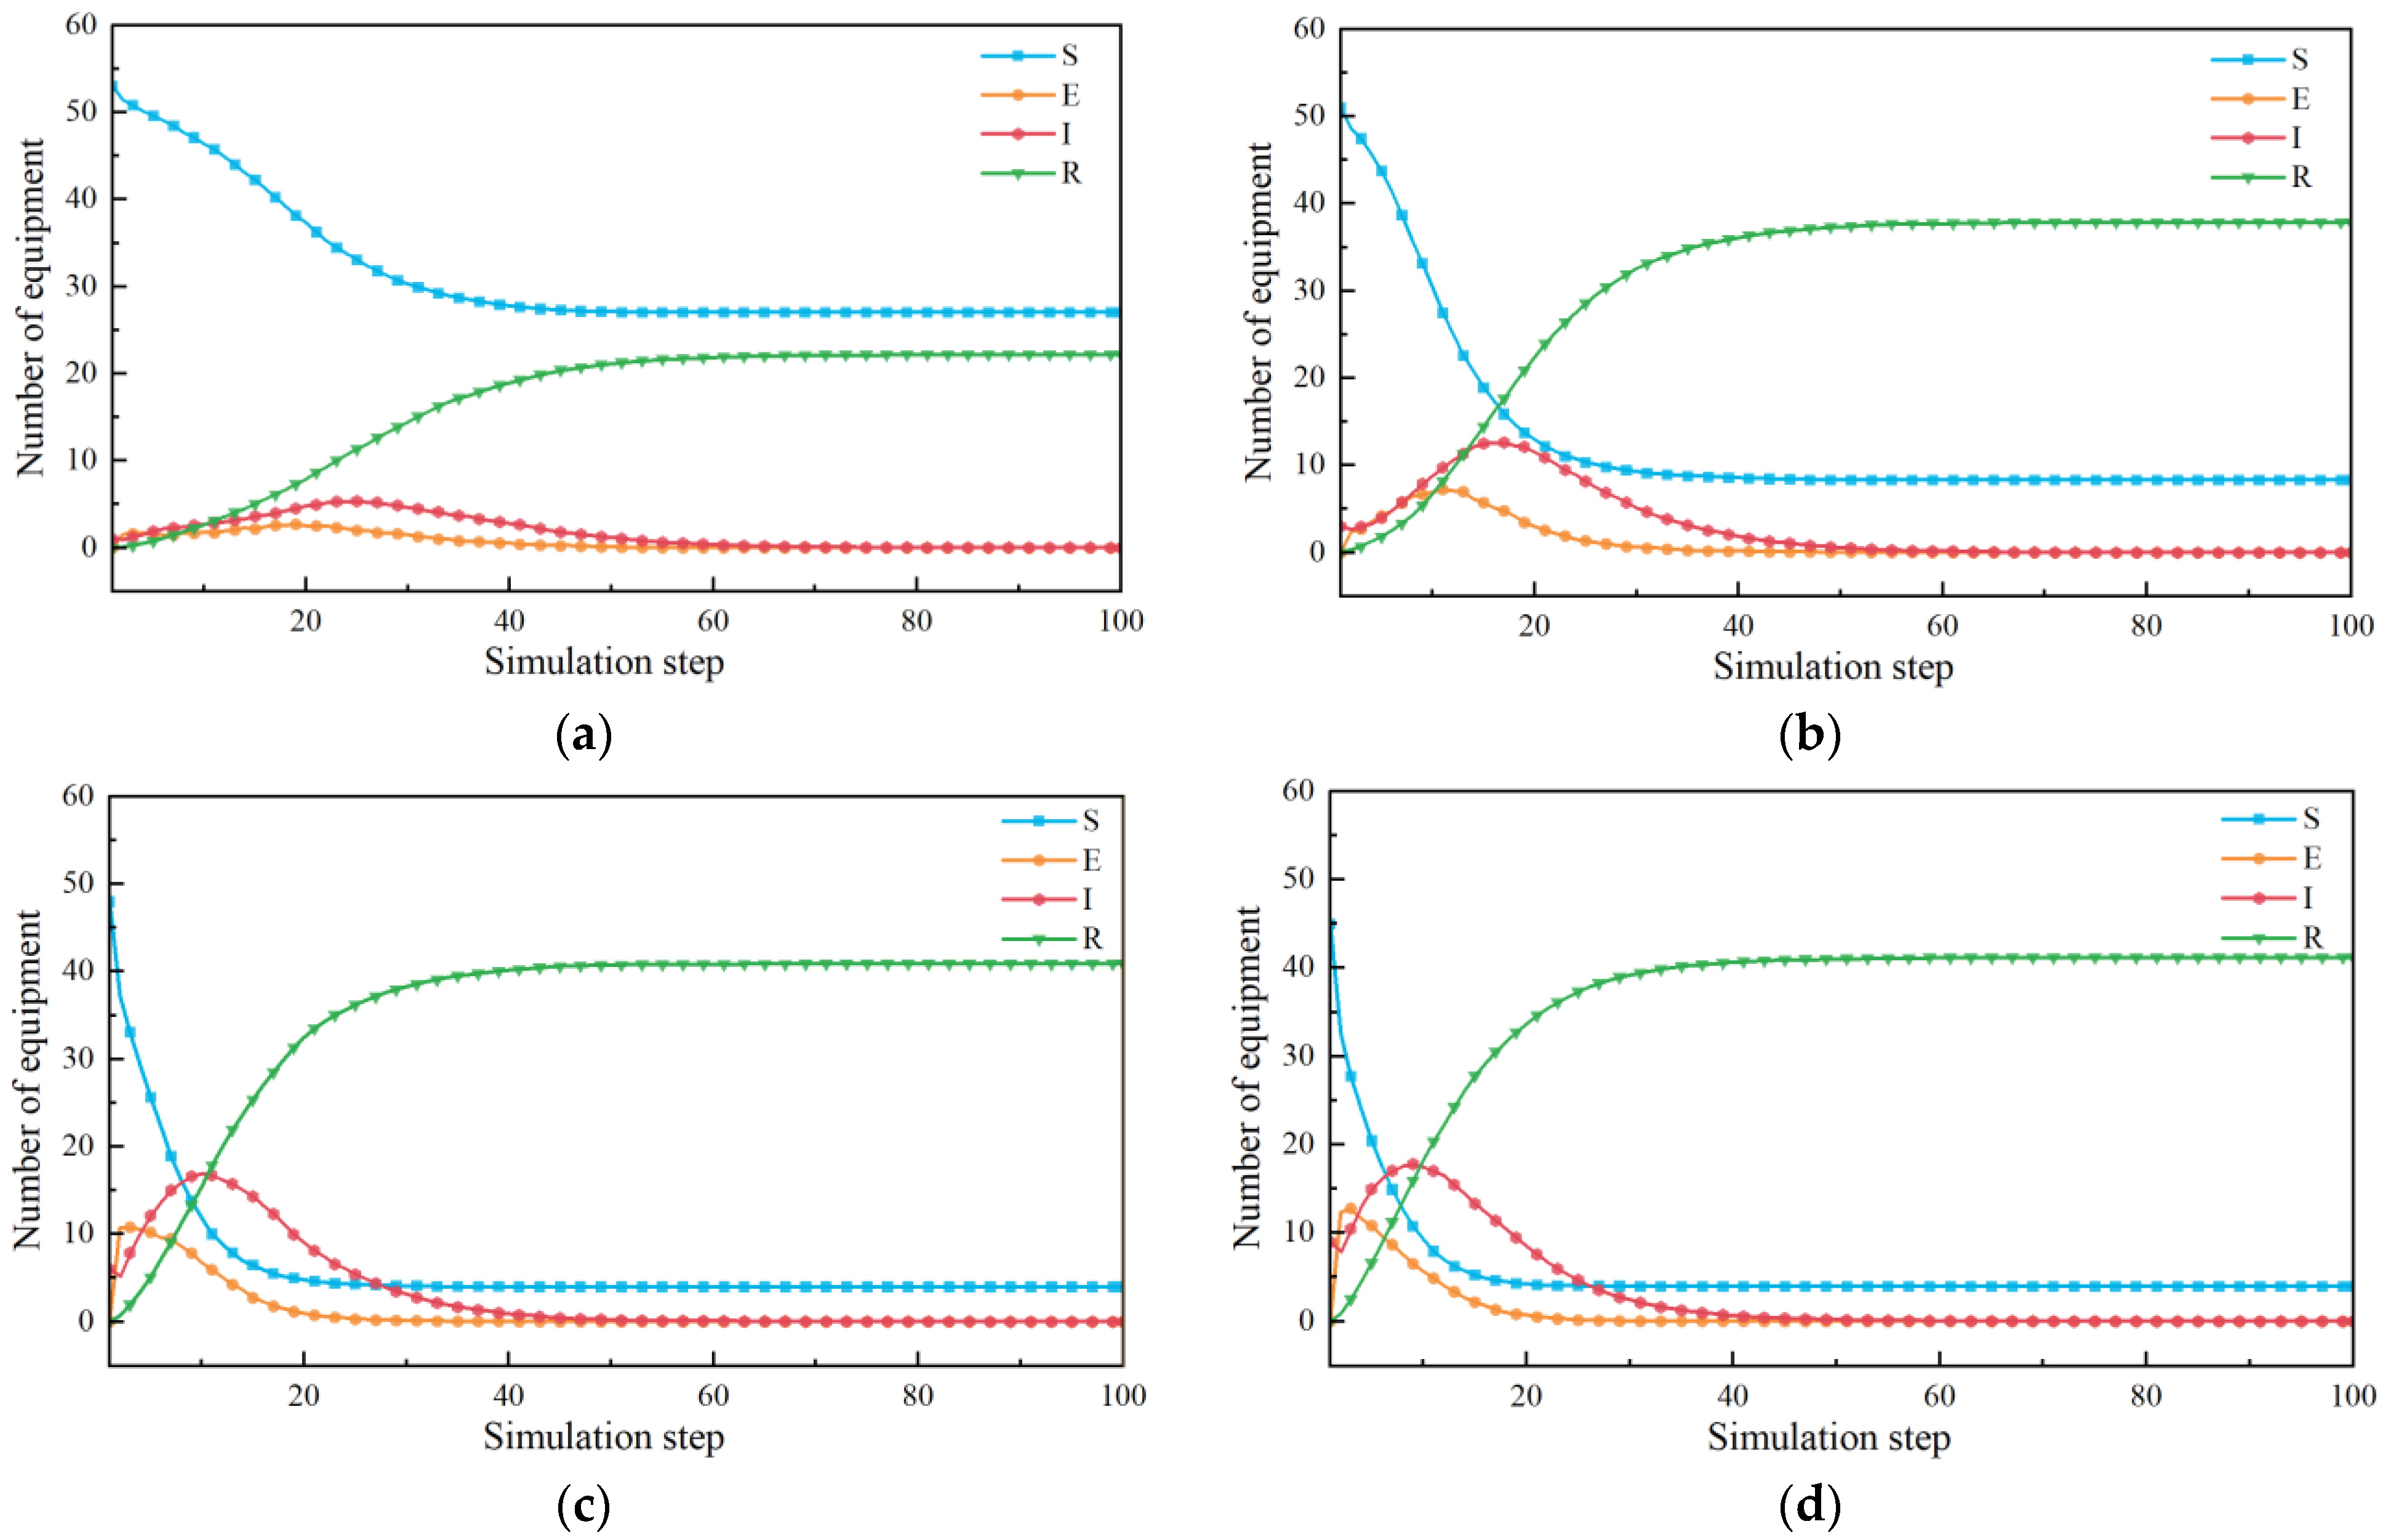
To further investigate the propagation of delays under different initial proportions of delay propagation equipment, the initial number of delay propagation nodes was set to one, three, six, and nine while implementing the same equipment withdrawal and control measures. The changes in the four types of state nodes corresponding to different initial delay scales are illustrated in Figure 8.
As shown in Figure 8, an increased initial number of delay propagation equipment results in a faster propagation speed of delays and a greater number of affected equipment. In Figure 8a, when the initial delay scale is small, delays do not propagate extensively among multilevel handling phases and dissipate rapidly. Figure 8b–d illustrate that as the proportion of initial delays increases, the time required to reach peak delays decreases. Once the number of initial delay equipment reaches 6 out of a total of 54 units, further increases in the initial delay equipment result in diminishing returns regarding the peak value of delay propagation.
Overall, Figure 8 indicates that the number of equipment gradually decreases over time, while the quantities of delay equipment and delay propagation equipment rise swiftly during the initial phase, reaching their peak values before gradually declining to zero. This suggests that equipment experience delays due to the influence of delays and transition into a state of delay propagation, which subsequently dissipates over time according to the applied control strategies.

5.3.3. Sensitivity Analysis of Parameters

To investigate the impact of different parameter values on delay propagation, a sensitivity analysis of the model’s delay infection rate α , delay transfer rate β , equipment withdrawal rate ρ , and recovery rate γ was conducted based on the basic reproduction number R 0 . As shown in Figure 9, the number of delay propagation equipment is directly proportional to the propagation probability and the delay transfer rate. Higher values of the delay infection rate and delay transfer rate result in a greater number of normal equipment experiencing delays due to their influence. Conversely, these parameters are inversely related to the equipment withdrawal rate ρ and recovery rate γ ; more effective management controls and a higher rate of equipment withdrawal can better contain the scale of delay propagation.
In Figure 9d, when γ is relatively small, the proportion of delay propagation nodes is significant. As γ increases, the number of delay propagation nodes decreases, with a more pronounced effect on propagation nodes within the interval [0.1, 0.3]. As γ gradually increases, the delay propagation process becomes less sensitive.

5.4. Targeted Immunization Strategy Based on Critical Equipment

5.4.1. Identification of Critical Equipment

Traditional methods for assessing node importance typically focus on either local node attributes [46,47,48] or global attributes [49,50], often overlooking the broader global characteristics of the network as a whole. To address this limitation, we introduce a novel approach that integrates both local and global structural information while accounting for the actual number of containers handled by the equipment to assess its importance [51,52].
In terms of network structure characteristics, structural indicators such as node degree, betweenness centrality, closeness centrality, and eigenvector centrality are selected, and a node indicator matrix [53] is constructed as shown in Equation (21). Where Y i j represents the j indicator of the i node, with i = 1 , 2 , 3 , , n and j = 1 , 2 , 3 , , m .
Y = ( Y i j ) = Y 11 Y 12 Y 1 m Y 21 Y 22 Y 2 m Y n 1 Y n 2 Y n m
Since the dimensions of the data are different, the indicator data are normalized as follows:
z i j = Y i j Y i j , min / Y i j , max Y i j , min
The normalized matrix is denoted as Z , with equal weights assigned to each network indicator. The importance of each node in the network is then calculated as shown in Equation (24):
Z = z i j = z 11 z 12 z 1 m z 21 z 22 z 2 m z n 1 z n 2 z n m
k i = d i d i + d i + , 0 k i 1
In the equation d i + = j = 1 m z i j z j max 2 1 / 2 , d i = j = 1 m z i j z j min 2 1 / 2 , z j min is the minimum value of each column in matrix Z and z j max is the maximum value of each column in matrix Z . Since d i + and d i are all non-negative, if the denominator of Equation (24) equals zero, then both d i + and d i should be zero. In practical applications, it is unlikely for each node to simultaneously achieve both the maximum and minimum values across all indicators; therefore, when calculating the centrality k i of each node, there is d i + + d i > 0 .
During the equipment operation process, different pieces of equipment handle varying numbers of container tasks. Within a given time frame, the greater the number of containers processed by a piece of equipment, the more critical its role in the operational network. A malfunction in the equipment that leads to delays can significantly impact the entire process. Therefore, an equipment influence indicator is introduced, defined as the ratio of the number of containers processed by the equipment over the entire operational period to the total number of containers processed.
S i = f i i N f i
The node comprehensive evaluation model, obtained by combining the two indicators after normalization, is shown in Equation (26), where k i represents the comprehensive score of the equipment node’s structural characteristics, and S i represents the proportion of containers processed by the equipment.
G i = μ k i + ( 1 μ ) S i
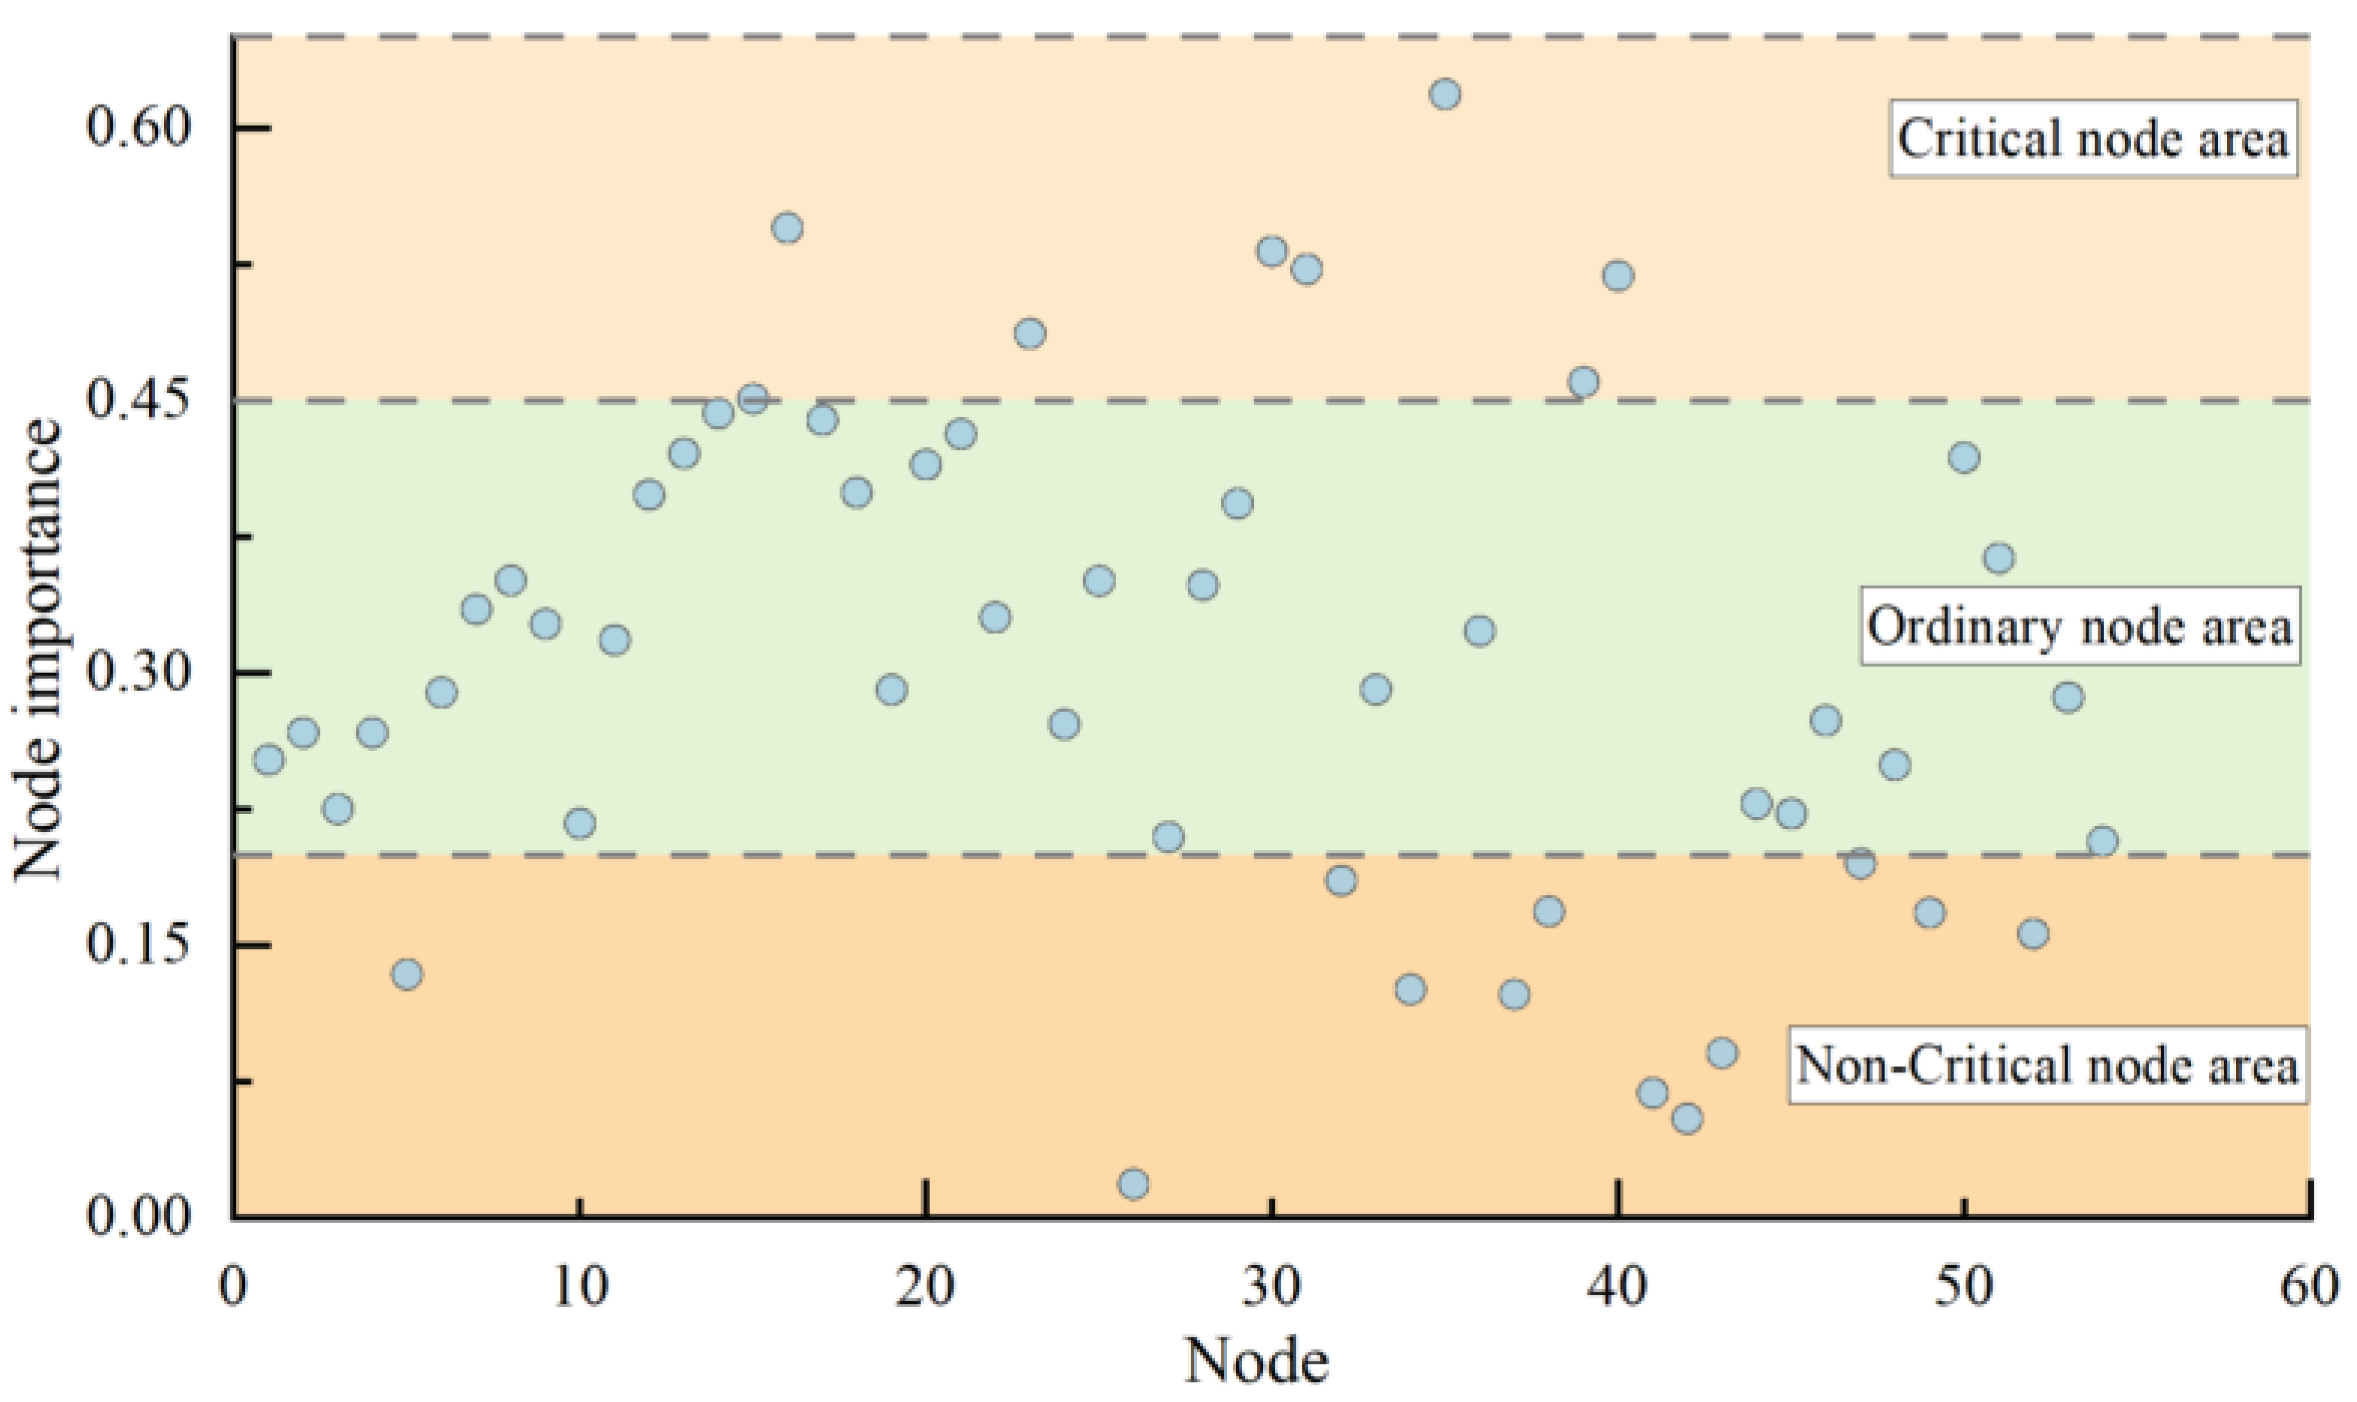
The comprehensive score of the equipment nodes under different weight coefficients is calculated according to Equations (21)–(26) and as shown in Table 5. When μ = 0.4 , the importance results of the equipment nodes are shown in Figure 10.
Based on the node importance results, the equipment is classified into three categories: the first category consists of critical equipment with the greatest influence in the MHII network, the second category includes ordinary equipment, and the third category comprises non-critical equipment with minimal impact on delay propagation.

5.4.2. Simulation of Delay Propagation in Controlling Critical Equipment

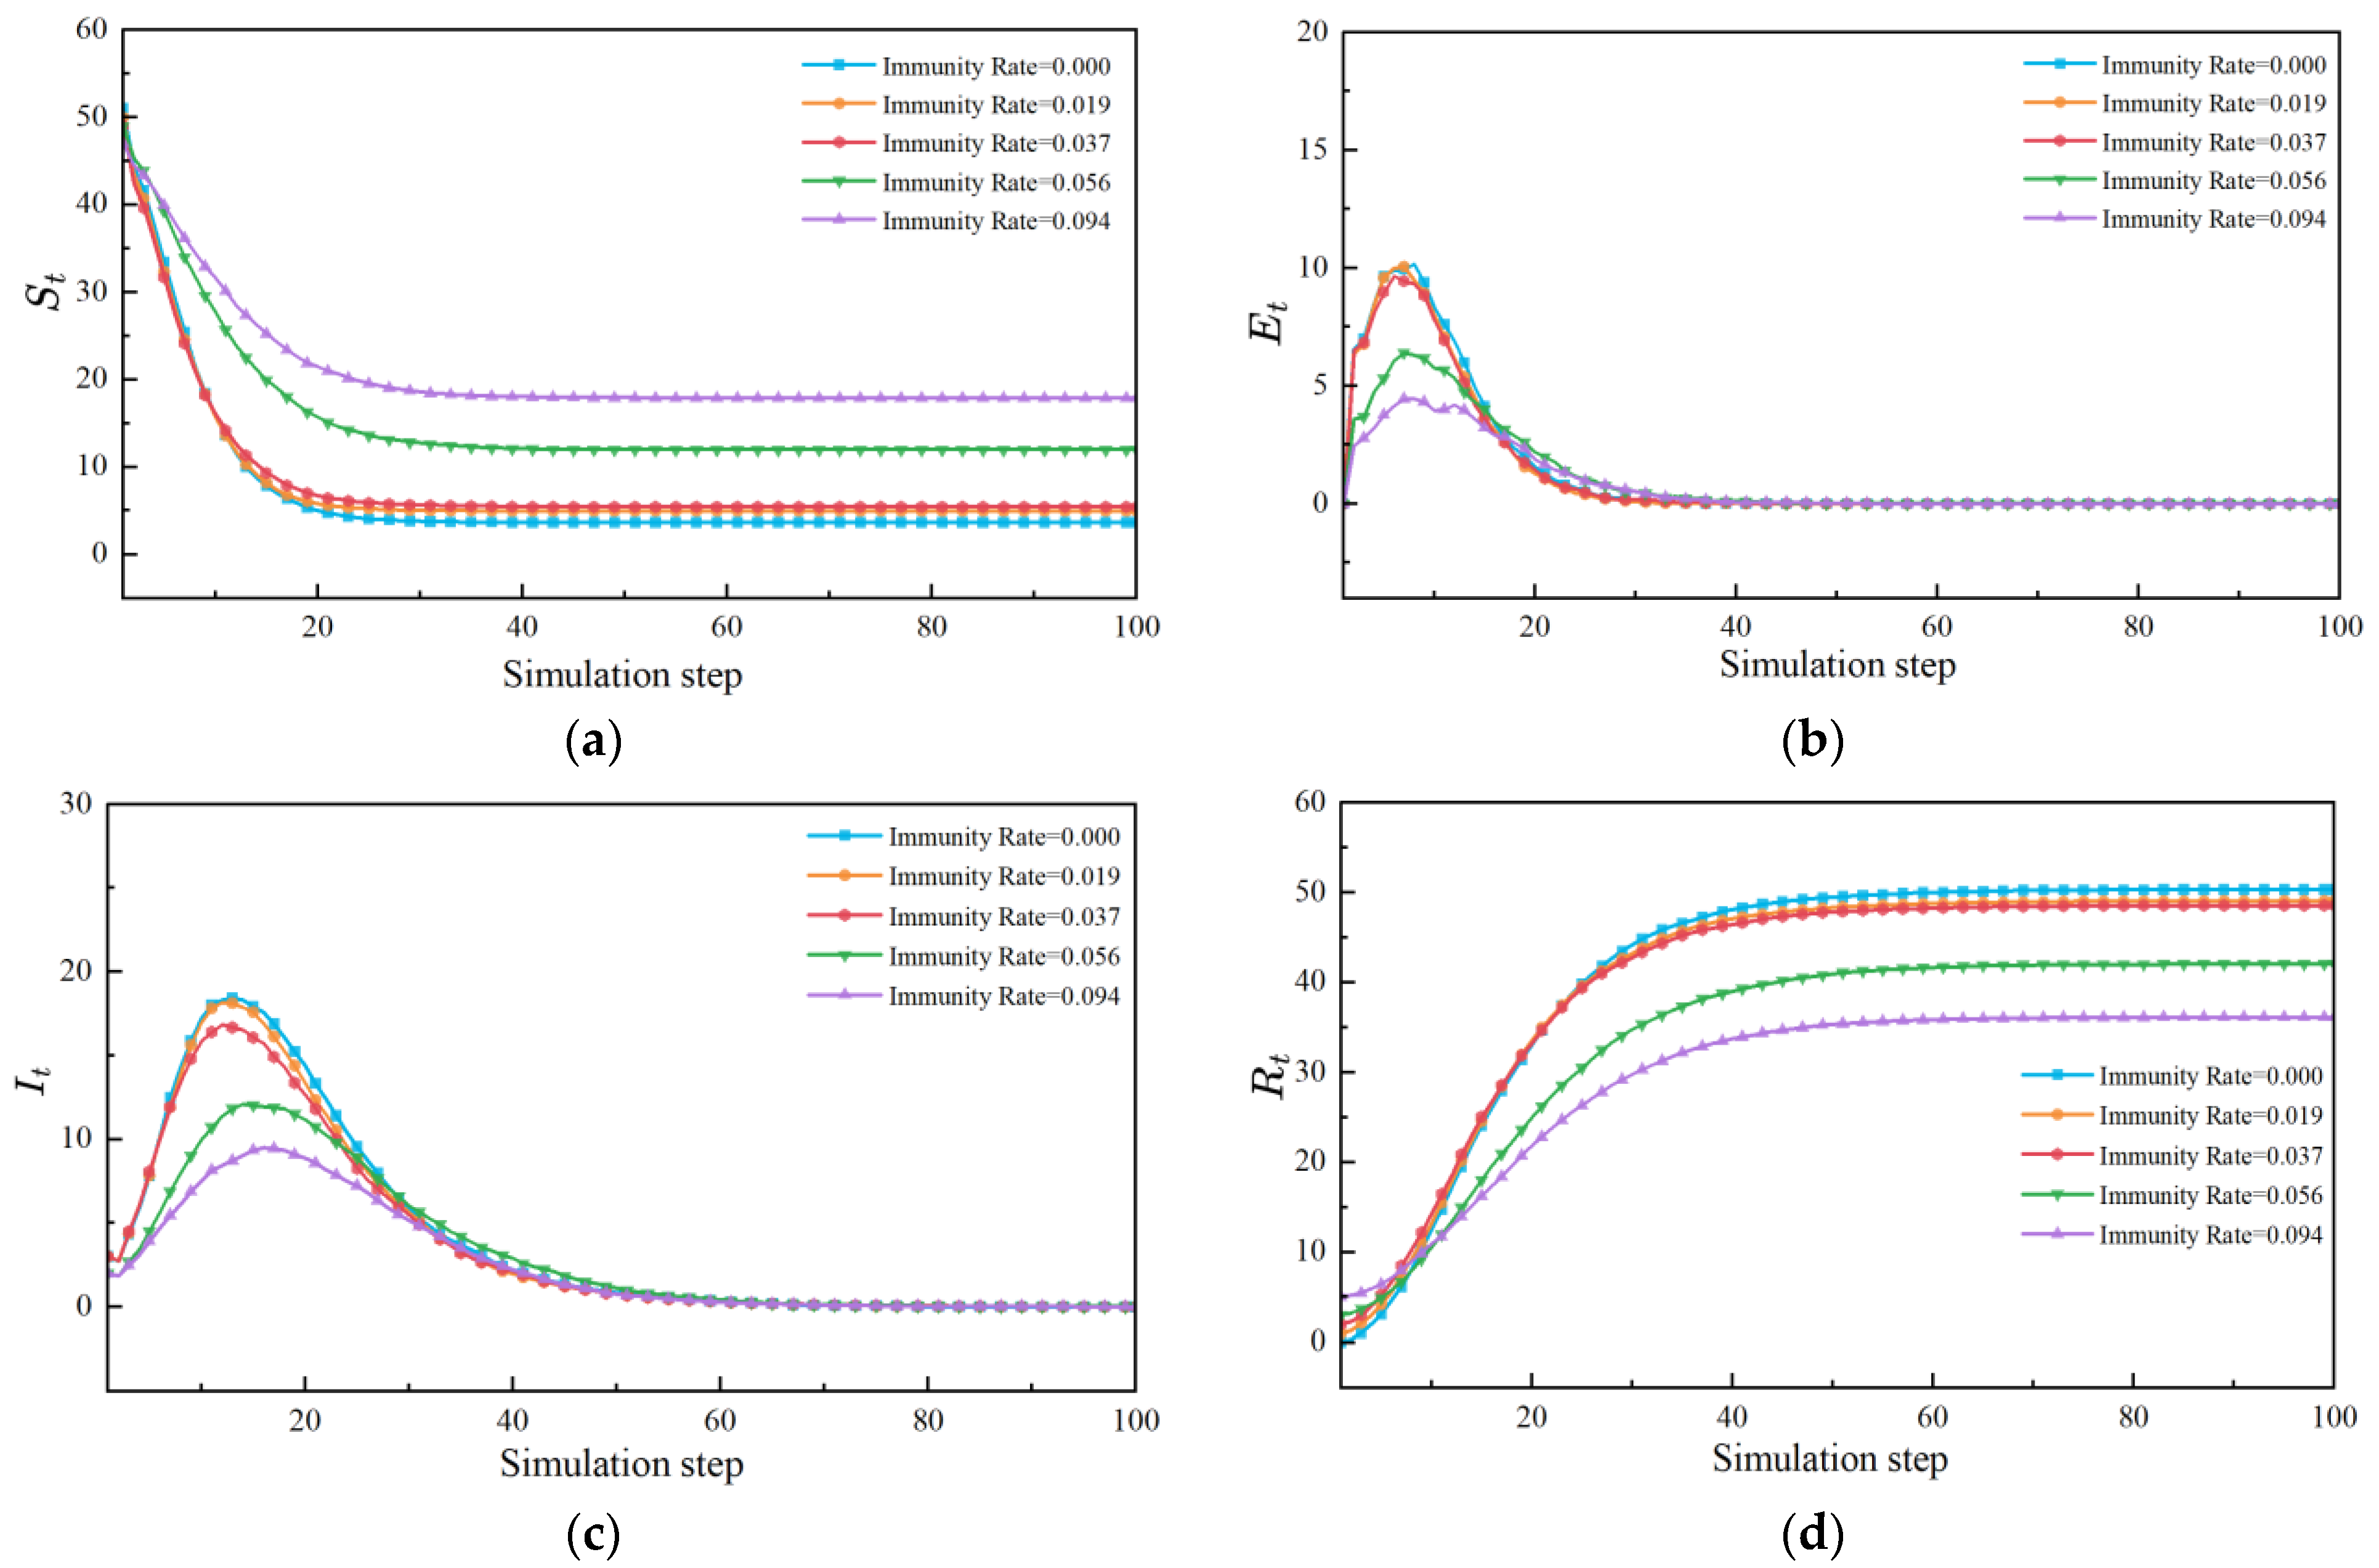
According to the parameter settings for equipment withdraw and dynamic control strategies in Section 5.3, target immunization is performed based on the critical nodes identified by μ = 0.4 . The equipment information is shown in Table 6. Starting with the AGV44 equipment, ranked first among the nodes, additional nodes are incrementally added in order of importance, until all eight core nodes are immunized. Propagation analysis is conducted for target immunization rates of 0.019, 0.037, 0.056, and 0.093, with the simulation results shown in Figure 11.
An analysis of Figure 11 shows that, compared to the scenario without the immune control of core equipment, when the immunity rate is 0.019, the proportion of delayed equipment peak is reduced by 1.9%; when the immunity rate is 0.037, the proportion of delayed equipment peak is reduced by 5.6%; when the immunity rate is 0.056, the proportion of delayed equipment peak is reduced by 13.0%; and when the immunity rate is 0.093, the proportion of delayed equipment peak is reduced by 18.5%, with a delayed peak time shifted to a later point. The immunity rate is generally inversely proportional to the proportion of delayed equipment peak. The simulation results indicate that by selecting and directly applying immune control to critical equipment in the network, the risk of delay propagation is effectively reduced.

6. Discussion

This study reveals that the U-shaped terminal’s multilevel handling network exhibits inherent stochastic characteristics in its interactive dynamics. Significantly, the timely implementation of critical equipment control strategies and the proactive withdrawal of delayed equipment demonstrate substantial efficacy in containing large-scale delay propagation across interconnected operational tiers. Compared to previous studies, our research provides a modeling framework to identify the potential relationships between multilevel handling equipment that are otherwise difficult to detect. It reveals the strong interactive characteristics between the AGVs and the quay crane operations, as well as the diffusion patterns of delays across the multilevel handling equipment.
This study holds significant implications for monitoring U-shaped terminal’s multilevel handling systems in automated terminals and controlling delay propagation. Terminal managers can implement delay control measures from the following two perspectives:
(a)
Considering that withdrawing delay-conducting equipment effectively reduces the impact scope of delays, equipment experiencing operational delays due to malfunctions should be promptly removed from the operational system. Simultaneously, equipment resource allocation can be optimized by designating specific quay cranes, AGVs, and other equipment as standby emergency resources to compensate for withdrawn units. Meanwhile, the configuration of backup equipment clusters should be adjusted according to real-time operational status monitoring to maintain system robustness.
(b)
Based on the constructed multilevel handling interaction network and critical equipment identification methodology, dynamic real-time monitoring should be implemented for critical equipment exhibiting critical influence, with timely optimization adjustments applied to abnormal units. For critical quay cranes and yard cranes, technical enhancements should include the installation of independent redundant power supplies, the deployment of dual Programmable Logic Controller (PLC) control modules, and dynamic maintenance cycle adjustments based on operational load rates. Regarding AGVs, comprehensive power monitoring systems should be established to automatically downgrade task priority for units with low battery levels while implementing adaptive scheduling strategies through intelligent task allocation mechanisms.
However, considering the disruptive nature of delays in automated terminal operations, the research in this paper is limited to simulation and modeling, and cannot be validated in real-world scenarios at this stage. Additionally, the model developed in this study is currently only applicable to a specific U-shaped automated terminal, and its applicability to other terminal layouts requires further discussion.
In the future, the model can be validated using a digital twin platform, where a digital replica of the physical equipment is constructed based on actual operational data. Real-time data collection and synchronization can then be performed to predict delays using the propagation model. Regarding the generalization of the multilevel handling interaction network construction method, for vertical stacking terminal layouts, since only half of the quay cranes interact with AGVs, the quay cranes interacting with AGVs should be selected when building the model. For horizontal stacking terminal layouts, the interference caused by conflicts between external trucks and AGVs may disrupt the identification of equipment interaction relationships. Therefore, the further removal of such interference is required. Future research could explore delay diffusion studies for other terminal layouts and integrate digital twin platforms for the quantitative analysis of delay impacts.

7. Conclusions

This study is based on actual handling data from the terminal, utilizing a multivariable transfer entropy method from the perspective of information flow to identify the coupling relationships between equipment. A multilevel handling interaction impact network is constructed to reveal the characteristics of multilevel handling from multiple perspectives, including overall structure and inter-equipment relationships. Additionally, the SEIR model is modified and refined to propose a multilevel handling delay propagation model. Simulation analyses of delay propagation are conducted under varying initial delay scales and distinct control strategies based on the multilevel handling interaction impact network. The findings reveal the following:
(1)
The multilevel handling interaction network demonstrates inherent randomness. AGVs serve a critical mediating function within the entire interaction network. The interaction relationships between the AGV transfer link and the AGVs with the yard cranes exhibit significant strength, thereby greatly influencing the overall interaction network. It is essential to enhance the coordination mechanism between AGVs and the yard cranes to facilitate the efficient operation of container transfer and storage processes.
(2)
Implementing comprehensive control measures for the withdrawal of propagation equipment can effectively mitigate the extent of delay propagation. In the absence of any control measures, the peak ratio of delay propagation equipment decreases by 51.3%. Additionally, compared to the implementation of a single strategy, delays dissipate more rapidly.
(3)
Under the same propagation probability and control strategy, an increased number of initially delayed equipment results in an accelerated delay propagation rate. The impact of large- and small-scale delays can dissipate promptly through the management controls implemented by terminal operators. When the proportion of initially delayed equipment exceeds 6 out of 54, further increases in initially delayed equipment do not significantly change the peak value of delay propagation.
(4)
The delay propagation process is directly proportional to both the delay propagation probability and the delay transfer rate, while it is inversely proportional to the equipment withdrawal and recovery rates. As these parameters increase, the delay propagation process exhibits reduced sensitivity. Implementing direct immunity control on core equipment nodes can effectively suppress the risk of delay propagation and prevent delays from causing large-scale impacts on container operations.
This study combines multivariable transfer entropy theory with terminal operational systems, expanding the existing methodologies for researching multilevel handling systems in automated terminals. By analyzing the delay propagation process, it establishes the rules of delay propagation in multilevel handling systems, offering a theoretical foundation and a managerial reference for preventing and controlling widespread delay propagation within terminal handling systems.

Author Contributions

Conceptualization, X.G. and J.L.; methodology, X.G. and J.L.; software. X.G.; validation, J.L. and B.X.; formal analysis, X.G.; investigation, X.G.; resources, B.X.; data curation, X.G.; writing—original draft preparation, X.G. and B.X.; writing—review and editing, J.L.; visualization, X.G.; supervision, B.X. and J.L.; funding acquisition, J.L. All authors have read and agreed to the published version of the manuscript.

Funding

This research was funded by the National Natural Science Foundation of China (Grant number 52102466).

Institutional Review Board Statement

Not applicable.

Informed Consent Statement

Not applicable.

Data Availability Statement

The data are available from the corresponding author on reasonable request.

Acknowledgments

The authors would like to thank the valuable comments from the reviewers for guiding the improvement of this work.

Conflicts of Interest

The authors declare that there are no conflicts of interest in this publication.

Abbreviations

The following abbreviations are used in this manuscript:
ATMHMultilevel handlings at automated terminals;
mRMRMinimum Redundancy Maximum Relevance;
MHIIMultilevel handling interaction impact;
QCQuay crane;
YCYard crane;
AGVAutomated Guided Vehicle

References

  1. United Nations Conference on Trade and Development. Review of Maritime Transport 2024: Navigating Maritime Chokepoints; United Nations: Geneva, Switzerland, 2024. [Google Scholar]
  2. Notteboom, T.; Haralambides, H.; Cullinane, K. The Red Sea Crisis: Ramifications for Vessel Operations, Shipping Networks, and Maritime Supply Chains. Marit. Econ. Logist. 2024, 26, 1–20. [Google Scholar] [CrossRef]
  3. Singapore Port Container Logjam Worsens as Ships Avoid Red Sea. Available online: https://themalaysianreserve.com/2024/06/13/singapore-port-container-logjam-worsens-as-ships-avoid-red-sea/ (accessed on 17 October 2024).
  4. Carlo, H.J.; Vis, I.F.A.; Roodbergen, K.J. Transport Operations in Container Terminals: Literature Overview, Trends, Research Directions and Classification Scheme. Eur. J. Oper. Res. 2014, 236, 1–13. [Google Scholar] [CrossRef]
  5. Wang, Z.; Guo, C. Minimizing the Risk of Seaport Operations Efficiency Reduction Affected by Vessel Arrival Delay. Ind. Manag. Data Syst. 2018, 118, 1498–1509. [Google Scholar] [CrossRef]
  6. He, J.; Tan, C.; Zhang, Y. Yard Crane Scheduling Problem in a Container Terminal Considering Risk Caused by Uncertainty. Adv. Eng. Inform. 2019, 39, 14–24. [Google Scholar] [CrossRef]
  7. Tan, C.; He, J. Integrated Proactive and Reactive Strategies for Sustainable Berth Allocation and Quay Crane As-signment under Uncertainty. Ann. Oper. Res. 2021, 1–32. [Google Scholar] [CrossRef]
  8. Jian, W.; Zhu, J.; Zeng, Q. An Optimization Model of Integrated AGVs Scheduling and Container Storage Problems for Automated Container Terminal Considering Uncertainty. Symmetry 2021, 13, 1904. [Google Scholar] [CrossRef]
  9. He, J.; Tan, C.; Yan, W.; Huang, W.; Liu, M.; Yu, H. Two-Stage Stochastic Programming Model for Generating Container Yard Template under Uncertainty and Traffic Congestion. Adv. Eng. Inform. 2020, 43, 101032. [Google Scholar] [CrossRef]
  10. Kenett, D.Y.; Perc, M.; Boccaletti, S. Networks of Networks—An Introduction. Chaos Solitons Fractals 2015, 80, 1–6. [Google Scholar] [CrossRef]
  11. Li, M.; Liu, R.-R.; Lü, L.; Hu, M.-B.; Xu, S.; Zhang, Y.-C. Percolation on Complex Networks: Theory and Application. Phys. Rep. 2021, 907, 1–68. [Google Scholar] [CrossRef]
  12. Xu, B.; Wang, L.; Li, J. Propagation of Uncertain Events in Multilevel Handlings at Container Terminals from the Perspective of Hypernetwork. Discret. Dyn. Nat. Soc. 2021, 2021, 6611181. [Google Scholar] [CrossRef]
  13. Li, J.; Yu, A.; Xu, B. Risk Propagation and Evolution Analysis of Multi-Level Handlings at Automated Terminals Based on Double-Layer Dynamic Network Model. Phys. A Stat. Mech. Its Appl. 2022, 605, 127963. [Google Scholar] [CrossRef]
  14. Naeem, D.; Gheith, M.; Eltawil, A. A Comprehensive Review and Directions for Future Research on the Integrated Scheduling of Quay Cranes and Automated Guided Vehicles and Yard Cranes in Automated Container Terminals. Comput. Ind. Eng. 2023, 179, 109149. [Google Scholar] [CrossRef]
  15. Han, Y.; Zheng, H.; Ma, W.; Yan, B.; Ma, D. Integrated Scheduling of Automated Rail-Mounted Gantries and Exter-nal Trucks in U-Shaped Container Terminals. IEEE Trans. Autom. Sci. Eng. 2024, 1–15. [Google Scholar] [CrossRef]
  16. Yue, L.; Fan, H.; Ma, M. Optimizing Configuration and Scheduling of Double 40 Ft Dual-Trolley Quay Cranes and AGVs for Improving Container Terminal Services. J. Clean. Prod. 2021, 292, 126019. [Google Scholar] [CrossRef]
  17. Xu, B.; Jie, D.; Li, J.; Yang, Y.; Wen, F.; Song, H. Integrated Scheduling Optimization of U-Shaped Automated Container Terminal under Loading and Unloading Mode. Comput. Ind. Eng. 2021, 162, 107695. [Google Scholar] [CrossRef]
  18. Tang, G.; Guo, Y.; Qi, Y.; Fang, Z.; Zhao, Z.; Li, M.; Zhen, Z. Real-Time Twin Automated Double Cantilever Rail Crane Scheduling Problem for the U-Shaped Automated Container Terminal Using Deep Reinforcement Learning. Adv. Eng. Inform. 2025, 65, 103193. [Google Scholar] [CrossRef]
  19. Li, H.; Peng, J.; Wang, X.; Wan, J. Integrated Resource Assignment and Scheduling Optimization with Limited Critical Equipment Constraints at an Automated Container Terminal. IEEE Trans. Intell. Transp. Syst. 2021, 22, 7607–7618. [Google Scholar] [CrossRef]
  20. Yang, A.; Liu, Y.; Xin, C.; Chen, Q.; Wang, L. Towards Intuitive Visualisation Goals for the Operation Optimisation of Automated Container Terminal Based on Digital Twin Technology. Marit. Policy Manag. 2024, 51, 631–652. [Google Scholar] [CrossRef]
  21. Li, Y.; Chang, D.; Gao, Y.; Zou, Y.; Bao, C. Automated Container Terminal Production Operation and Optimization via an AdaBoost-Based Digital Twin Framework. J. Adv. Transp. 2021, 2021, 1936764. [Google Scholar] [CrossRef]
  22. Ma, X.; Zhou, H.; Li, Z. On the Resilience of Modern Power Systems: A Complex Network Perspective. Renew. Sustain. Energy Rev. 2021, 152, 111646. [Google Scholar] [CrossRef]
  23. Saleh, M.; Esa, Y.; Mohamed, A. Applications of Complex Network Analysis in Electric Power Systems. Energies 2018, 11, 1381. [Google Scholar] [CrossRef]
  24. Zhang, M.; Huang, T.; Guo, Z.; He, Z. Complex-Network-Based Traffic Network Analysis and Dynamics: A Comprehensive Review. Phys. A Stat. Mech. Its Appl. 2022, 607, 128063. [Google Scholar] [CrossRef]
  25. Sano, H.H.; Berton, L. A Temporal Event Graph Approach and Robustness Analysis for Air Transport Network. IEEE Trans. Netw. Sci. Eng. 2021, 8, 3453–3464. [Google Scholar] [CrossRef]
  26. Liu, J.; Fu, Y.; Han, K.; Cui, Y. Resilience Analysis of the RCEP Shipping Network. Ocean Coast. Manag. 2024, 257, 107317. [Google Scholar] [CrossRef]
  27. Hearnshaw, E.J.S.; Wilson, M.M.J. A Complex Network Approach to Supply Chain Network Theory. Int. J. Oper. Prod. Manag. 2013, 33, 442–469. [Google Scholar] [CrossRef]
  28. Butts, C.T. The Complexity of Social Networks: Theoretical and Empirical Findings. Soc. Netw. 2001, 23, 31–72. [Google Scholar] [CrossRef]
  29. Gong, C.; Tang, P.; Wang, Y. Measuring the Network Connectedness of Global Stock Markets. Phys. A Stat. Mech. Its Appl. 2019, 535, 122351. [Google Scholar] [CrossRef]
  30. Tongal, H.; Sivakumar, B. Forecasting Rainfall Using Transfer Entropy Coupled Directed–Weighted Complex Networks. Atmos. Res. 2021, 255, 105531. [Google Scholar] [CrossRef]
  31. Pallis, P.L. Port Risk Management in Container Terminals. Transp. Res. Procedia 2017, 25, 4411–4421. [Google Scholar] [CrossRef]
  32. Khan, R.U.; Yin, J.; Mustafa, F.S.; Wang, S. Seaport Hazardous Cargo Loading and Unloading Risk Assessment Using Interval Type-2 Fuzzy Sets and Bayesian Networks. ASCE-ASME J. Risk Uncertain. Eng. Syst. Part A Civ. Eng. 2024, 10, 04023065. [Google Scholar] [CrossRef]
  33. Xing, M.; Luo, X.; Zan, Y.; Yang, L.; Jin, H.; Luo, J. Identification of Factors Affecting Hoisting Quality of Large Offshore Structures and Analysis of Their Coupling Relationship Based on Grey-DEMATEL-ISM-MICMAC. Ocean Eng. 2023, 280, 114805. [Google Scholar] [CrossRef]
  34. Kim, S.; Kim, H.; Park, Y. Early Detection of Vessel Delays Using Combined Historical and Real-Time Information. J. Oper. Res. Soc. 2017, 68, 182–191. [Google Scholar] [CrossRef]
  35. Li, C.; Qi, X.; Lee, C.-Y. Disruption Recovery for a Vessel in Liner Shipping. Transp. Sci. 2015, 49, 900–921. [Google Scholar] [CrossRef]
  36. Xu, Y.; Chen, Q.; Quan, X. Robust Berth Scheduling with Uncertain Vessel Delay and Handling Time. Ann. Oper. Res. 2012, 192, 123–140. [Google Scholar] [CrossRef]
  37. Xiang, X.; Liu, C.; Miao, L. Reactive Strategy for Discrete Berth Allocation and Quay Crane Assignment Problems under Uncertainty. Comput. Ind. Eng. 2018, 126, 196–216. [Google Scholar] [CrossRef]
  38. Schreiber, T. Measuring Information Transfer. Phys. Rev. Lett. 2000, 85, 461–464. [Google Scholar] [CrossRef]
  39. Marschinski, R.; Kantz, H. Analysing the Information Flow between Financial Time Series. Eur. Phys. J. B 2002, 30, 275–281. [Google Scholar] [CrossRef]
  40. Fan, X.; Li, X. Minimizing Probing CostWith mRMR Feature Selection in Network Monitoring. IEEE Commun. Lett. 2017, 21, 2400–2403. [Google Scholar] [CrossRef]
  41. Li, K.; Chen, Z.; Cong, R.; Zhang, J.; Wei, Z. Simulated Dynamics of Virus Spreading on Social Networks with Various Topologies. Appl. Math. Comput. 2024, 470, 128580. [Google Scholar] [CrossRef]
  42. Wang, J.; Zhou, H.; Jin, X. Risk Transmission in Complex Supply Chain Network with Multi-Drivers. Chaos Solitons Fractals 2021, 143, 110259. [Google Scholar] [CrossRef]
  43. Shahidinejad, A.; Ghobaei-Arani, M.; Masdari, M. Resource Provisioning Using Workload Clustering in Cloud Computing Environment: A Hybrid Approach. Clust. Comput. 2021, 24, 319–342. [Google Scholar] [CrossRef]
  44. Alsayed, A.; Higham, D.J. Betweenness in Time Dependent Networks. Chaos Solitons Fractals 2015, 72, 35–48. [Google Scholar] [CrossRef]
  45. Bonacich, P. Some Unique Properties of Eigenvector Centrality. Soc. Netw. 2007, 29, 555–564. [Google Scholar] [CrossRef]
  46. Wang, X.; Slamu, W.; Guo, W.; Wang, S.; Ren, Y. A Novel Semi Local Measure of Identifying Influential Nodes in Complex Networks. Chaos Solitons Fractals 2022, 158, 112037. [Google Scholar] [CrossRef]
  47. Zhong, S.; Zhang, H.; Deng, Y. Identification of Influential Nodes in Complex Networks: A Local Degree Dimension Approach. Inf. Sci. 2022, 610, 994–1009. [Google Scholar] [CrossRef]
  48. Xu, G.; Meng, L. A Novel Algorithm for Identifying Influential Nodes in Complex Networks Based on Local Propagation Probability Model. Chaos Solitons Fractals 2023, 168, 113155. [Google Scholar] [CrossRef]
  49. Yang, X.; Xiao, F. An Improved Gravity Model to Identify Influential Nodes in Complex Networks Based on K-Shell Method. Knowl.-Based Syst. 2021, 227, 107198. [Google Scholar] [CrossRef]
  50. Bian, T.; Hu, J.; Deng, Y. Identifying Influential Nodes in Complex Networks Based on AHP. Phys. A Stat. Mech. Its Appl. 2017, 479, 422–436. [Google Scholar] [CrossRef]
  51. Yuan, Y.; Au, F.T.K.; Yang, D.; Zhang, J. Large-Scale Baseline Model Exploration from Structural Monitoring Based on a Novel Information Entropy-Probability Learning Function. Comput. Struct. 2024, 292, 107239. [Google Scholar] [CrossRef]
  52. Nikougoftar, E. Strategic Node Identification in Complex Network Dynamics. Chaos Solitons Fractals 2024, 187, 115348. [Google Scholar] [CrossRef]
  53. de Farias Aires, R.F.; Ferreira, L. A New Approach to Avoid Rank Reversal Cases in the TOPSIS Method. Comput. Ind. Eng. 2019, 132, 84–97. [Google Scholar] [CrossRef]
Figure 1. Layout of U-shaped automated terminal.
Jmse 13 00581 g001
Figure 2. Flowchart of multilevel handling interaction impact network construction.
Jmse 13 00581 g002
Figure 3. Multilevel handling delay propagation model.
Jmse 13 00581 g003
Figure 4. Multilevel handling interaction impact network.
Jmse 13 00581 g004
Figure 5. Centrality metrics of the MHII network.
Jmse 13 00581 g005
Figure 6. Average transfer entropy and contribution rate between multilevel handling stages.
Jmse 13 00581 g006
Figure 7. Trends of equipment nodes in different states under various control strategies over time. (a) No control measures; (b) dynamic control only; (c) equipment withdrawal for delayed propagation; (d) a combination of both control and equipment withdrawal.
Jmse 13 00581 g007
Figure 8. Trends of equipment nodes in different states under different initial delay scales. (a) The initial delay propagation equipment ratio is 1/54; (b) the initial delay propagation equipment ratio is 3/54; (c) the initial delay propagation equipment ratio is 6/54; (d) the initial delay propagation equipment ratio is 9/54.
Jmse 13 00581 g008
Figure 9. Parameter sensitivity analysis. (a) The number of delay propagation equipment with parameter α ; (b) the number of delay propagation equipment with parameter β ; (c) the number of delay propagation equipment with parameter ρ ; (d) the number of delay propagation equipment with parameter γ .
Jmse 13 00581 g009
Figure 10. Comprehensive analysis of importance of MHII network nodes.
Jmse 13 00581 g010
Figure 11. Delay propagation diagram of immunity control. (a) The variation trend of S t status under different immunity rates.; (b) the variation trend of E t status under different immunity rates.; (c) the variation trend of I t status under different immunity rates.; (d) the variation trend of R t status under different immunity rates.
Jmse 13 00581 g011
Table 1. Parameter description of multilevel handling delay propagation model.
ParameterDefinitionExplanation
N t Total number of equipmentTotal number of equipment involved in loading and unloading handlings
S t Number of equipment in normal handlingNormal handling equipment easily
affected by delays
E t Number of equipment in delayed statusEquipment in delayed status affected
by delay-conducting equipment
I t Number of equipment causing delaysEquipment with delay propagation capability
R t Number of equipment in recovery statusEquipment that has recovered to a rehabilitated state after being affected by delays
α Delay impact rateProbability of normal equipment being impacted and transforming to a delayed state
β Delay propagate rateProbability of propagation from delayed status to delay-propagating status
γ Delay recovery rateProbability of converting from delay propagation status to recovery status through regulation
θ Automatic recovery rateProbability of equipment automatically restored to its normal state after a delay
ρ Equipment withdrawal rateProbability of delay-propagating equipment
withdrawing the handling process
δ Recurrence delay rateProbability of equipment in recovery status transforming to a susceptible state
Table 2. Multilevel handling data of automated terminal.
AGV IDQC&YC IDStart TimeEnd Time
AGV15QC09112 May 2023 8:0112 May 2023 8:09
AGV47QC07312 May 2023 8:0112 May 2023 8:11
AGV51QC08212 May 2023 8:0112 May 2023 8:10
AGV03YC00112 May 2023 8:0112 May 2023 8:20
AGV57QC07212 May 2023 8:0312 May 2023 8:09
AGV18YC00612 May 2023 8:0312 May 2023 8:20
AGV36QC08212 May 2023 8:0412 May 2023 8:17
AGV06QC09112 May 2023 8:0512 May 2023 8:13
Note: The data in Table 2 were collected from a commercial source under confidentiality agreements. The specific details of the data source cannot be disclosed due to commercial privacy restrictions. However, the data have been validated for accuracy and reliability through internal review processes.
Table 3. Variables in multivariate transfer entropy.
VariableVariable Explanation
Q = Q e 1 , Q e 2 , , Q e N A set of N time series data, where Q e i represents the i - t h time series
m l a g The maximum time lag considered when calculating multivariate transfer entropy
α The significance threshold for detecting causal relationships
m R M R _ k mRMR parameter for selecting conditional variables
The set of conditional variables
Ω c The causal matrix, with the elements is Ω i j c
G The MHII network
A N 2 The number of handling time series groups
Table 4. Structural characteristics of MHII network.
IndicatorsThe Values of Indicators in the MHII NetworkThe Values of Indictors in Random Network
Number of nodes5454
Number of edges128128
Density0.0450.089
Average degree4.7414.741
Average path length2.6562.719
Clustering coefficient0.0420.086
Table 5. Ranking of equipment criticality under different weights.
Rank μ = 0.4 μ = 0.5 μ = 0.6
Node IDEquipment IDNode IDEquipment IDNode IDEquipment ID
135AGV4416QC8216QC82
216QC8235AGV4417QC91
330AGV3617QC9115QC81
431AGV3815QC8114QC73
540AGV5214QC7318QC92
623AGV2518QC9213QC72
739AGV5113QC7235AGV44
815QC8130AGV3612YC8
Table 6. Detailed list of MHII network critical nodes.
Node IDEquipment IDDegreeCloseness
Centrality
Betweenness
Centrality
Eigenvector
Centrality
Task ProportionRank
35AGV4480.16810.11670.15552.8%1
16QC8230.19350.00410.13119.0%2
30AGV3660.18720.09410.17952.7%3
31AGV3880.16620.08100.14502.9%4
40AGV5290.14360.08370.14932.5%5
23AGV2570.15910.08480.11262.8%6
39AGV51110.14220.06390.12232.6%7
15QC8130.13110.00000.14897.7%8
Disclaimer/Publisher’s Note: The statements, opinions and data contained in all publications are solely those of the individual author(s) and contributor(s) and not of MDPI and/or the editor(s). MDPI and/or the editor(s) disclaim responsibility for any injury to people or property resulting from any ideas, methods, instructions or products referred to in the content.