Next Article in Journal
Sustainable Fuel Supply for Very Small Island Transportation: The Potential of Hybrid Renewable Energy and Green Hydrogen
Next Article in Special Issue
Correction: Zhu et al. Investigation on the Welding Residual Stress Distribution in Multi-Segment Conical Egg-Shaped Shell. J. Mar. Sci. Eng. 2025, 13, 578
Previous Article in Journal
Variability in Diurnal Internal Tides and Near-Inertial Waves in the Southern South China Sea Based on Mooring Observations
Previous Article in Special Issue
Geometric and Mechanical Analysis of Selenium-Enriched Eggs
 
 
Correction published on 27 March 2025, see J. Mar. Sci. Eng. 2025, 13(4), 678.
Article

Investigation on the Welding Residual Stress Distribution in Multi-Segment Conical Egg-Shaped Shell

1
School of Mechanical Engineering, Jiangsu University of Science and Technology, Zhenjiang 212003, China
2
College of Mechanical Engineering, Saitama Institute of Technology, Saitama 369-0293, Japan
*
Authors to whom correspondence should be addressed.
J. Mar. Sci. Eng. 2025, 13(3), 578; https://doi.org/10.3390/jmse13030578
Submission received: 18 February 2025 / Revised: 10 March 2025 / Accepted: 12 March 2025 / Published: 15 March 2025 / Corrected: 27 March 2025
(This article belongs to the Special Issue Advancements in Deep-Sea Equipment and Technology, 3rd Edition)

Abstract

:
The egg-shaped pressure shell, an essential component of manned submersibles, has garnered significant attention from researchers. However, the fabrication of such shells, particularly the welding process used to connect petals or frustums into a shell blank, has raised several concerns. This study investigates the distribution of welding residual stresses in a multi-segment frustum-assembled egg-shaped shell using a thermal–elastic–plastic method under an instantaneous heat source. A numerical model for a 12-segment frustum-welded egg-shaped shell is developed, and welding simulations are performed. The model’s boundary conditions are defined by cyclic symmetry, with a mesh element size of 2 mm to enhance computational efficiency. The results are validated through experimental tests. The findings indicate that the residual stress around the weld is tensile, while compressive stress is present on both sides of the weld. The length of the generatrix and the relative inclination angle significantly affect the distribution and overlap of circumferential residual stress, whereas axial residual stress primarily influences its magnitude. Finally, a simplified numerical model of the egg-shaped shell is proposed, with its simulation results showing good agreement with the distribution of welding residual stresses on the shell surface. This study provides valuable insights for optimizing the welding process of egg-shaped pressure shells in manned submersibles.

1. Introduction

Compared with spherical pressure shells, egg-shaped pressure shells exhibit significantly reduced sensitivity to initial geometric imperfections and material plasticity. Additionally, they outperform spherical shells in terms of buoyancy reserve and space utilization, making them a viable primary structure for manned submersible pressure shells [1,2,3,4]. Egg-shaped pressure shells are classified as multi-curvature positive Gaussian rotational shells and can be manufactured using die-free bulging techniques [5,6]. This process involves welding multiple conical frustums together to create a prefabricated structure, which is then subjected to internal pressure to induce plastic deformation, ultimately forming the desired egg-shaped pressure shell. Consequently, welding residual stress is an inevitable aspect of the fabrication process.
Welding residual stress can lead to several effects, including impacts on the service life and fatigue performance of welded components [7,8,9], crack propagation [10], and overall structural strength [11]. Therefore, extensive studies have been conducted to better understand the behavior and characteristics of welding residual stress. Li et al., through simulations of the welding process at the equatorial weld seam of a spherical shell, discovered distinct welding residual stress distributions on the inner and outer surfaces of the equatorial weld seam of a Ti80 pressure spherical shell [12]. The inner surface exhibited significant residual tensile stress, while the outer surface primarily displayed axial compressive stress and axial tensile stress. Lu et al. studied the axial welding residual stress on the upper surface of flat plates with “X” groove welds of varying thicknesses and found that the axial residual stress near the weld seam exhibited “M” and “Π” distribution patterns, which transitioned with changes in plate thickness [13]. Wang et al. observed that increasing the number of weld passes effectively reduced welding residual stress within a certain range by simulating multi-pass welding of flat plates [14]. Additionally, smaller groove angles resulted in greater residual compressive stress, thereby reducing the tendency for cracking. Yu et al. found that the welding residual stress in X80 pipelines exhibited a wavy distribution along the thickness direction, with an overall increasing trend as the thickness increased [15]. For simple structures or single weld seams, researchers often use the thermal–elastic–plastic method combined with a moving heat source to ensure the accuracy of welding simulations. However, for complex structures like the egg-shaped shell model, the use of a moving heat source significantly increases computational complexity and time. To address this, the instantaneous heat source has been proposed for the numerical simulation of large and complex welded structures.
The instantaneous heat source significantly reduces computational time and complexity in such cases. Wang et al. conducted numerical simulations of a ribbed cylindrical shell using both moving and instantaneous heat sources, finding that the residual stresses obtained with both methods matched the experimental results [16]. Zhang et al., based on a flat plate butt joint model, validated the effectiveness of the instantaneous heat source, showing that the residual stress field distributions under both heat sources were similar [17]. Pu et al. used a symmetric flat plate model to analyze results under different heat sources, concluding that the type of heat source had minimal influence on residual stress, and the results from instantaneous and moving heat sources were consistent with experimental data [18]. Currently, most of the research is focused on plates or cylinders, which have fewer welds. The egg-shaped shell, with its large curvature, is welded by 12 conical frustums, making it a more complex structure with numerous welds. Whether the instantaneous heat source can accurately analyze the distribution of welding residual stress in this case remains to be explored.
This study simulates the welding process of the egg-shaped shell structure using an instantaneous heat source. The egg-shaped shell is first divided into twelve conical frustums, which are then welded together to form a multi-segment egg-shaped shell. Numerical modeling of the welding process is conducted using ABAQUS2022 to investigate the residual stress distribution characteristics of the egg-shaped shell. Subsequently, an equivalent model for the egg-shaped shell is designed based on the residual stress distribution characteristics. Finally, the accuracy of the numerical results for the welding residual stress is validated through experimental testing.

2. Multi-Segment Egg-Shaped Shell

2.1. Design of the Segmented Egg-Shaped Shell

The egg-shaped shell design used in this study is based on the multi-segment conical frustum egg-shaped shell described in Reference [19], with specific parameters provided in Table 1. The N-R equations for the egg-shaped shell are represented by Equations (1) and (2), with an average similarity of up to 99.13%, as reported in Reference [20]. By substituting the geometric parameters of the egg-shaped shell employed in this study, the equation for the external contour curve of the shell is derived, as shown in Equation (3).
y x = ± 2 L n + 1 2 n x n + 1 x 2
n = 1.057 L B 2.372
r x = 83.32 x 1.436 x 2
The egg-shaped shell is divided into 12 prefabricated sections, with each conical frustum section joining at the apex of its cone. The equation for the generatrix of the conical frustum can be expressed as follows:
l i x i = y i + 1 y i x i + 1 x i + x i + 1 y i x i y i + 1 x i + 1 x i
where i denotes the identifier for the corresponding prefabricated conical frustum, and the coordinates of the major and minor axes of each prefabricated conical frustum are provided in Table 2.
The starting coordinates for the major and minor axes are (29.8, 100). By substituting these coordinate parameters into the conical frustum generatrix equation (Equation (3)), the generatrix equations for each segment of the conical frustum can be derived as follows:
{ l 1 = 1.84 x 1 + 45.13 29.8 x 1 95.7 l 2 = 1.26 x 2 + 100.00 95.7 x 2 < 227.5 l 3 = 0.88 x 3 + 187.74 227.5 x 3 < 425.3 l 4 = 0.60 x 4 + 307.14 425.36 x 4 < 689.0 l 5 = 0.36 x 5 + 471.80 689.0 x 5 < 1018.6 l 6 = 0.12 x 6 + 711.62 1018.6 x 6 < 1414.1 l 7 = 0.11 x 7 + 1038.00 1414.1 x 7 < 1735.1 l 8 = 0.34 x 8 + 1437.36 1735.1 x 8 < 2002.5 l 9 = 0.61 x 9 + 1897.62 2002.5 x 9 < 2261.5 l 10 = 1.00 x 10 + 2844.17 ( 2261.5 x 10 < 2376.9 ) l 11 = 1.68 x 11 + 4468.73 ( 2376.9 x 11 < 2483.9 ) l 12 = 3.56 x 12 + 9128.55 ( 2483.9 x 12 < 2537.4 )
As shown in Figure 1, the generatrix of the twelve conical frustums are connected, forming the external contour curve of the egg-shaped shell. The ends are sealed with frustum-shaped caps to facilitate post-welding bulging. The segmentation of the prefabricated conical frustums is determined by increasing the coordinate intervals of the major axis using the smallest interval multiples. The section is divided into front and rear halves, starting from the maximum radius. For the front half, the coordinates of the major axis range from the tip to the maximum radius, with interval multiples of 1, 2, 3, 4, 5, and 6, respectively. In the rear half, from the maximum radius to the blunt end, the interval multiples are 6, 5, 4, 3, 2, and 1, respectively.
Additionally, as shown in Figure 1, the conical frustum heights at both ends are relatively small, while the heights in the middle sections progressively increase. The primary consideration in this design is the steep curvature at both ends of the egg-shaped shell’s external contour. By reducing the deformation of the conical frustums at the ends and increasing the connection angle, stress concentration during the manufacturing process is minimized, resulting in a smoother connection between the conical frustums.

2.2. Egg-Shaped Shell Finite Element Model

The finite element model for the welding of the egg-shaped shell is developed based on the twelve prefabricated conical frustums, as shown in Figure 2. The egg-shaped shell in the finite element model has a thickness of 10 mm, and the thickness direction is discretized into five mesh layers. The remaining areas are globally meshed with a size of 5 mm, resulting in a total of 965,858 elements. For the welding thermal analysis, DC3D8 elements are used, while C3D8R elements are employed for the welding force analysis. Additionally, a cyclic symmetry constraint is applied, with one end fixed and the other end released (UX = UZ = 0), where the released degree of freedom is in the Y direction.

2.2.1. Material

The material properties of both the base material and the filler metal are identical. The high-temperature properties of the AH36 steel used in this experiment are provided in Table 3. Due to the coupling of multiple physical fields, the selection of the material constitutive model for finite element analysis is critical, as it directly impacts the accuracy of the numerical results, the complexity of the simulation process, and the computational difficulty. As a result, researchers often introduce simplifying assumptions [21] to streamline the model. These assumptions typically include treating the material as isotropic, neglecting plastic hardening, disregarding the flow behavior of the molten metal, applying the Von Mises yield criterion for the yield condition, and ignoring strain due to creep, as its effect on the total strain is negligible [22,23].

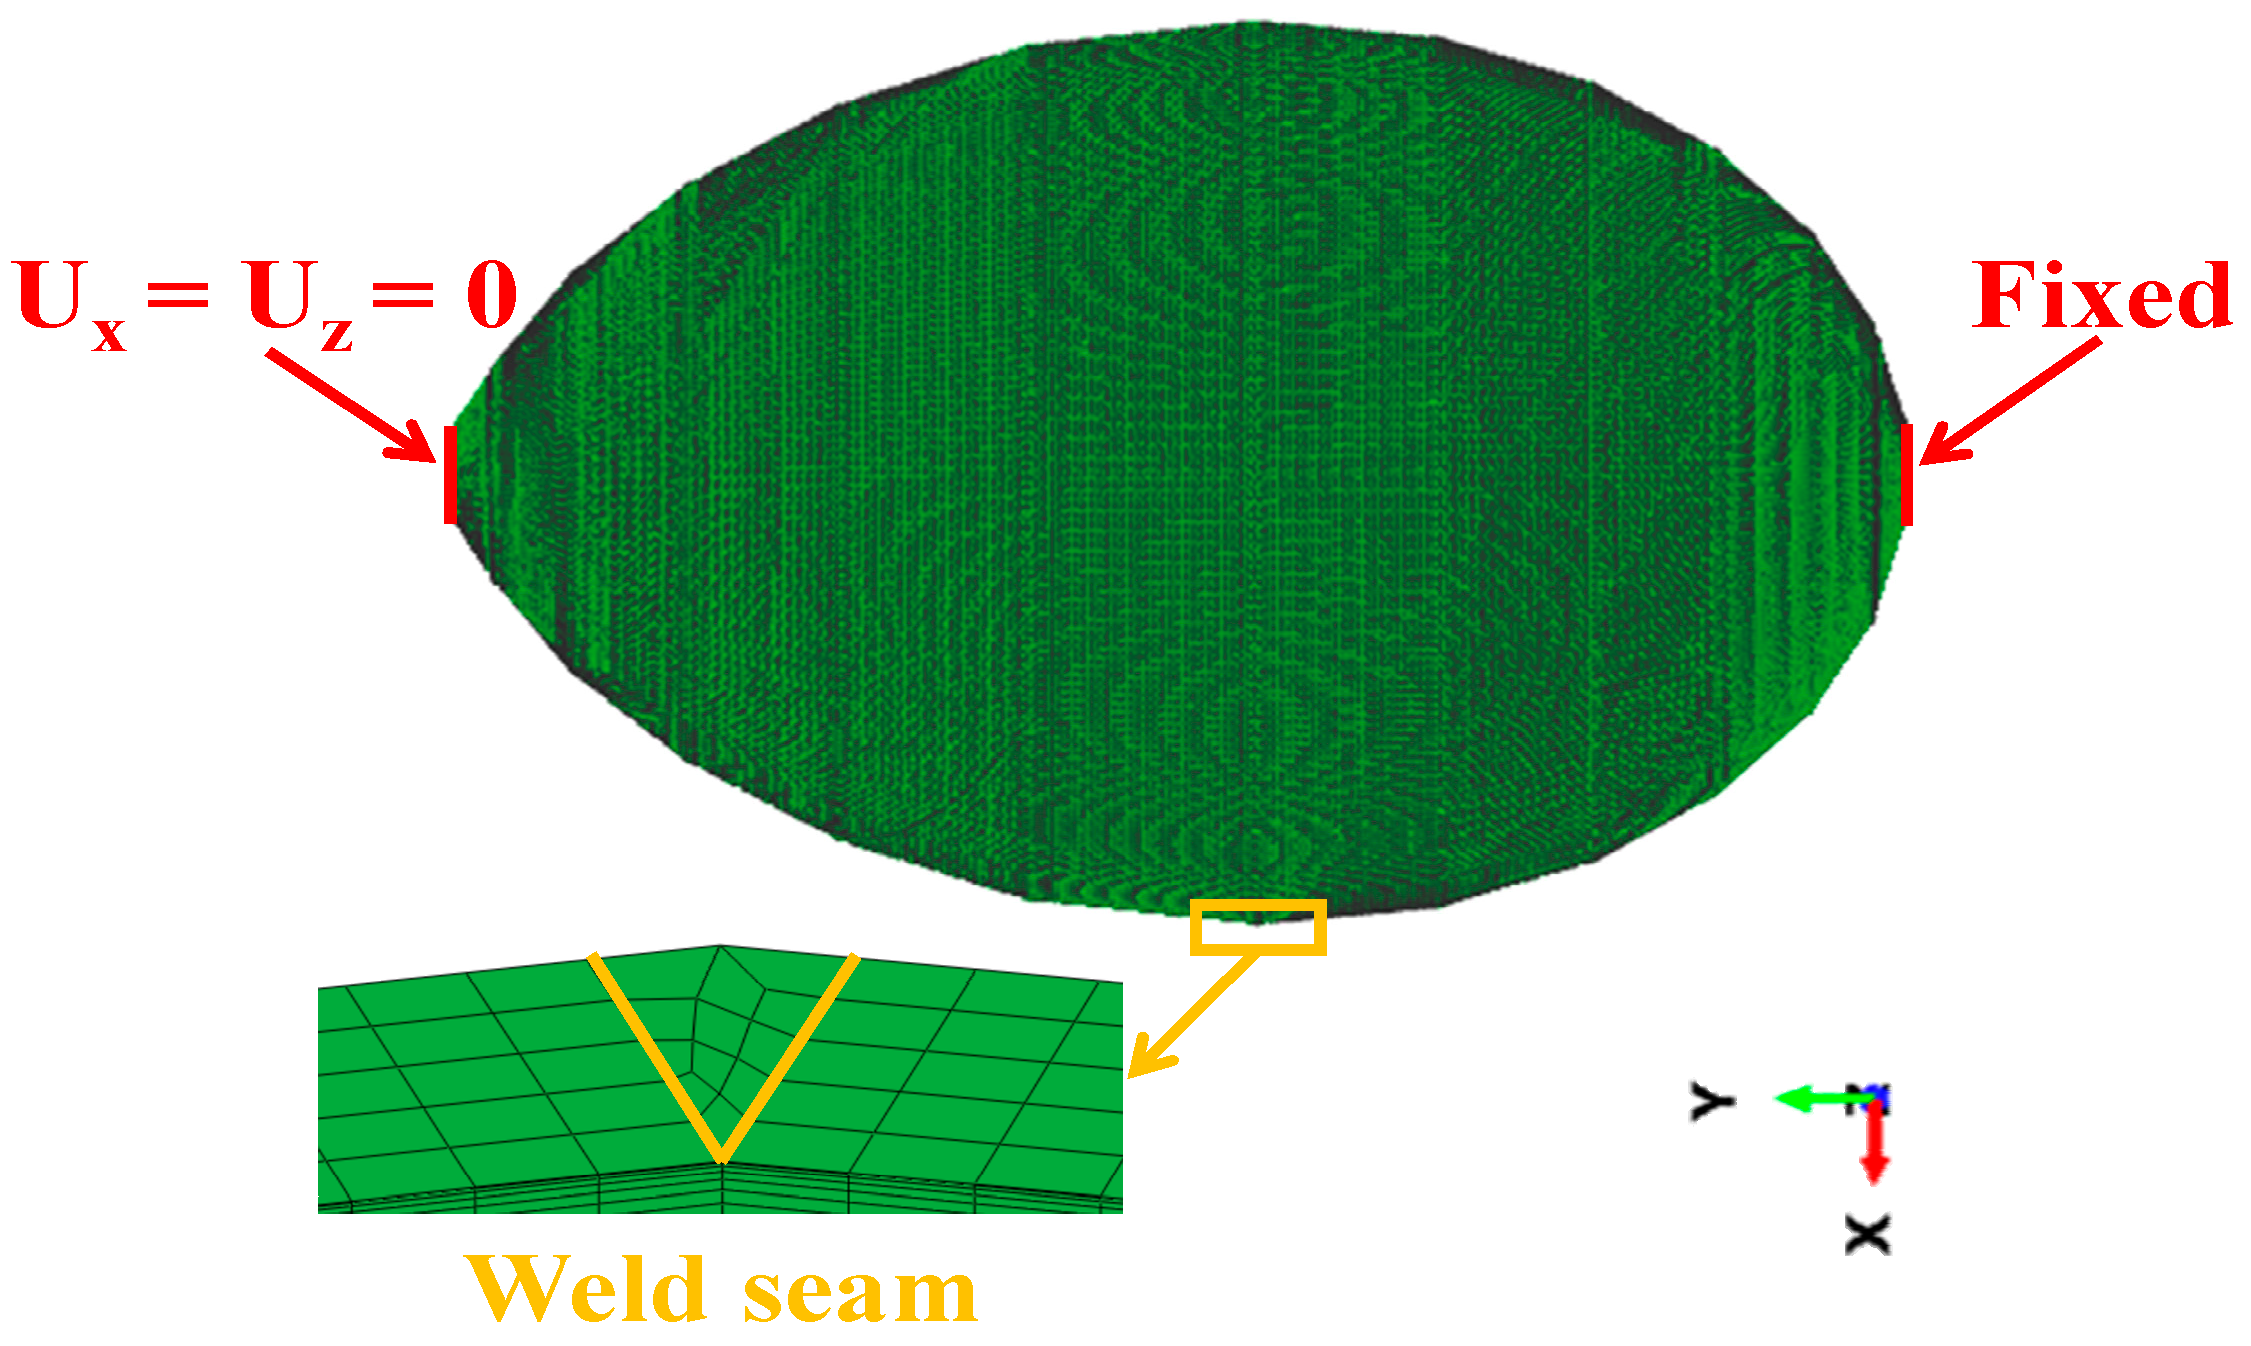
2.2.2. Boundary Conditions

In the welding thermal analysis, the Stefan–Boltzmann law and Newton’s law of cooling are applied to account for heat radiation and heat convection phenomena between the model and the environment [24,25], as shown below:
Heat convection refers to the heat exchange between the surface of a solid and the surrounding fluid due to a temperature difference. It can be classified into two types: natural convection and forced convection. Heat convection is governed by Newton’s law of cooling, as expressed by the following equation:
q = h T S T B
where q represents the heat flux, h is the convective heat transfer coefficient, TS is the convective heat transfer coefficient, and TB is the temperature of the surrounding fluid.
Heat radiation refers to the process of an object emitting electromagnetic energy, which is then absorbed and converted into thermal energy by other objects. In engineering, radiation is typically considered between two or more objects, where each object simultaneously radiates and absorbs heat. The net heat transfer between them can be calculated using the Stefan–Boltzmann equation:
Q = ε σ A 1 F 12 T 1 4 T 2 4
where Q is the radiative heat transfer; ε is the emissivity of the actual object, or called blackness, which is between 0 and 1; σ is the Stefan–Boltzmann constant, which is approximately 5.67 × 10⁻⁸ W/(m2 K4); A1 is the area of surface 1; F12 is the view factor from surface 1 to surface 2; T1 is the absolute temperature of the surface 1; and T2 is the absolute temperature of surface 2. The thermal analysis, including thermal radiation, is highly nonlinear.
The ambient temperature was set to 20 °C. After completing the thermal analysis, a static general analysis step is applied for the subsequent mechanical analysis, using the results of the thermal analysis as static loads. The DC3D8 mesh is replaced with the C3D8R mesh, and the boundary conditions are applied as shown in Figure 2, where one end is fully fixed, and the other end is constrained in the X and Z axes, with the Y axis released.

2.2.3. Heat Source Model

The use of an instantaneous heat source significantly reduces the computational difficulty and time required for the welding numerical simulation process. The distribution and magnitude of the simulated welding residual stress field are widely recognized by researchers. In this study, an instantaneous heat source was employed. The equation used to calculate the heat generation rate of the instantaneous heat source [26,27] is as follows:
q = η U I v t δ
where η is the thermal efficiency, U is the voltage, I is the current, v is the welding speed, t is the time of each load step, and δ is the weld cross-sectional area.

3. Welding Residual Stress of Egg-Shaped Shells

3.1. Residual Stress Distribution on the Outer Surface

3.1.1. Circumferential Residual Stress on the Outer Surface

Figure 3 shows the circumferential welding residual stress field on the outer surface of the twelve-segment conical shell. The circumferential residual stress near the weld on the outer surface of the egg-shaped shell shows a band-like distribution. The stress around the weld and in its immediate vicinity is primarily tensile, while farther from the weld, alternating bands of tensile and compressive stresses appear. For example, between welds 6 and 7, a distinct band of tensile stress is observed on the conical surface. When the cone generatrix is shorter, no clear tensile stress band forms, and the region between welds 1 and 2 instead exhibits compressive stress. The formation of these tensile stress bands may be influenced by the length and inclination angle of the cone generatrix. The relative inclination angle is defined as the angle between the generatrix and the projection of the welding direction. Additionally, for cones with a smaller axial distance between welds, the tensile stress on both sides of the weld becomes more concentrated near the weld, reducing the extent of the compressive stress region. For welds 8, 9, and 10, compared to welds 3, 4, and 5, the tensile stress on both sides of the weld is higher and more concentrated.
The circumferential welding residual stress on the outer surface of the egg-shaped shell is symmetrically distributed on either side of the weld. As the cone diameter increases, the regions of tensile and compressive stress maintain a relatively constant width, while the length of these regions gradually increases. The distribution of circumferential welding residual stress on the outer surface shows a weak dependence on changes in weld position. The residual stress distribution around each weld is similar, suggesting that the equatorial weld, which is relatively symmetric on both sides of the cone, can serve as a reference. Specifically, the circumferential residual stress distribution around weld 6 is illustrated in Figure 4. The stress on both sides of the weld is symmetrically distributed, with the regions in the following sequence: low compressive stress, high tensile stress, transition zone, high compressive stress, and low tensile stress. The stress distribution corresponding to each region is shown in the left-side diagram, following an approximately M-shaped pattern. Moreover, the width and length of the stress distribution regions are related to the generatrix length and the relative inclination angle of the cone on both sides of the weld. The stress within the banded regions varies based on the nature of the stress in the bands.

3.1.2. Axial Residual Stress on the Outer Surface

The axial distribution of the welding residual stress field on the outer surface of a cone–shell structure composed of twelve segments is shown in Figure 5. As illustrated in Figure 5a, residual compressive stress is present around the weld and in the surrounding area, while residual tensile stress appears in the regions between the welds. The stress distribution around each weld is independent of its position, as both sides of each weld exhibit a sequence of compressive stress followed by tensile stress. The axial residual compressive stress region takes on a strip shape, while the tensile stress region appears as a rectangular band.
The asymmetric distribution of tensile and compressive stress regions on either side of the weld is influenced by the length of the cone’s generatrix and the relative inclination angle. Although the form of the stress distribution around each weld is unaffected by its position, the magnitude and distribution of residual stress in each region, as shown in Figure 5b, exhibit a V-shape. The distribution and magnitude of axial welding residual stress are highly dependent on the welding position. The further the weld is from the center of the shell, the lower the axial residual stress, irrespective of stress type. Changes in the generatrix length and relative inclination angle significantly impact the magnitude of axial welding residual stress on both sides of the weld, thereby leading to changes in the stress concentration zones. The stress distribution around the welds at the ends of the egg-shaped shell is more dispersed than that around the welds in the middle of the shell, with no obvious high-stress zones, as observed in welds 2, 3, 9, and 10.

3.2. Residual Stress Distribution on the Inner Surface

3.2.1. Circumferential Residual Stress on the Inner Surface

The circumferential welding residual stress distribution on the inner surface of the egg-shaped shell is shown in Figure 6. For the inner surface, the circumferential residual stress distribution is characterized by residual tensile stress around the welds and residual compressive stress between the welds. Within the residual compressive stress region between the welds, the stress at both ends is higher than in the middle. Compared to the residual stress on the outer surface, the residual stress on the inner surface is higher, and stress merging occurs. For instance, between welds 5 and 6, the stress value exhibits a distinct V-shape, while no obvious V-shape is observed between welds 8 and 9 and between welds 1 and 2. This phenomenon suggests that when the conical shell’s generatrices on both sides of the weld are within a certain length, stress merging occurs on the inner surface. Similarly, the weld position does not affect the stress distribution pattern around the welds. Therefore, for analyzing the circumferential welding residual stress distribution on the inner surface, the equatorial weld, specifically weld 6, is selected.
As shown in Figure 7, the region slightly farther from the weld center is primarily dominated by high compressive stress, while the weld center and its surrounding heat-affected zone exhibit high tensile stress. A distinct transition zone forms between the compressive and tensile stress regions, with the stress distribution resembling a Π-shape. In areas where the stress merging phenomenon is not prominent, such as between welds 5 and 6, a low compressive stress zone appears due to the longer generatrix of the conical shell between these welds. In contrast, between welds 6 and 7, a clear compressive stress merging zone exists. This indicates that within a certain length range of the conical shell’s generatrix, the stress values and distributions around the weld center and its vicinity are not directly influenced; instead, the region between the two welds is affected.
The observed stress distribution is primarily governed by the welding process, which entails rapid heating followed by cooling. The substantial circumferential tensile stress on both the inner and outer surfaces of the eggshell welding model arises from the rapid melting of the welding material and the thermal expansion of the adjacent base metal. As the temperature increases, thermal stresses escalate beyond the material’s yield strength, inducing plastic deformation. During the cooling phase, the weld and the surrounding base metal experience significant circumferential tensile stress, attributed to the constraints imposed by the solidified weld and the adjacent material.

3.2.2. Axial Residual Stress on the Inner Surface

The axial residual stress field inside the 12-segment spliced egg-shaped shell is shown in Figure 8. As seen in the figure, the stress distribution area is similar to that on the outer surface, but the nature of the stress has changed. The axial residual stress at both ends of the egg-shaped shell is characterized by a low-stress zone, with the residual stress concentrated in the middle portion of the shell. Additionally, a distinct distribution of axial residual tensile and compressive stresses is observed on the inner surface. The weld and its surrounding area exhibit residual tensile stress, while the region between the welds experiences residual compressive stress. The position of the weld does not affect the distribution of axial welding residual stress around the weld and between the welds. However, the magnitude of the axial residual stress is sensitive to the weld position, particularly in response to changes in the relative inclination angle of the welding. The figure also shows that the width of the residual compressive stress region changes with the position of the weld, primarily due to differences in the length of the conical shell’s generatrix on either side of the weld. In contrast, the width of the residual tensile stress region remains largely unchanged, regardless of the weld position. Along the circumferential path, the relative position of the residual stress remains consistent.
Since the stress nature on the inner and outer surfaces of the shell at the same weld position is completely opposite, weld 6, which shows distinct stress distribution characteristics, is selected for further investigation of the transition of axial welding residual stress from the outer surface to the inner surface of the egg-shaped shell. As shown in Figure 9, it can be observed that, in the thickness direction, the distribution of residual stress varies with the distance from the weld. However, the residual stress distribution on both sides of the weld is symmetric about the weld. The outer surface of the weld and its surrounding area exhibits residual compressive stress, while the inner surface shows residual tensile stress. A stress transition region with lower stress values exists in the middle, and the stress gradient layers are clearly defined, each occupying approximately one-third of the shell’s thickness. At the middle of the conical shell on both sides of the weld, a residual stress distribution opposite that at the weld is observed: the outer surface has residual tensile stress, while the inner surface has residual compressive stress. The distribution of stress magnitude is similar to that at the weld, with a low-stress region located between the weld and the middle of the conical shell.
The axial residual stress distribution exhibits notable discrepancies between the inner and outer surfaces, predominantly due to variations in cooling rates, differential thermal contraction, and geometric effects. The outer surface cools at a faster rate, leading to greater contraction, inward bending, and the development of axial compressive stress. Conversely, the inner surface undergoes slower cooling, reduced contraction, outward bending, and the formation of axial tensile stress. Furthermore, the geometric characteristics of the weld exacerbate the non-uniformity of the cooling process, further influencing the residual stress distribution.

4. Experiments

For large-scale or complex structures, proportional scaled models are commonly used to study welding residual stresses, providing more reliable data [28]. However, this approach involves considerable material and time consumption. Therefore, experiments are often conducted using equivalent sample models. For revolutionary structures, the weld cross-section shares a high degree of similarity with that of a flat plate structure. Therefore, the simplified model is based on the weld cross-section, converting the circumferential weld into a linear weld for simplification while maintaining consistency in the weld cross-section. As a result, since the heat-affected conditions within a single weld cross-section remain relatively uniform across the entire model, the stress distribution within the cross-section can be accurately simulated.

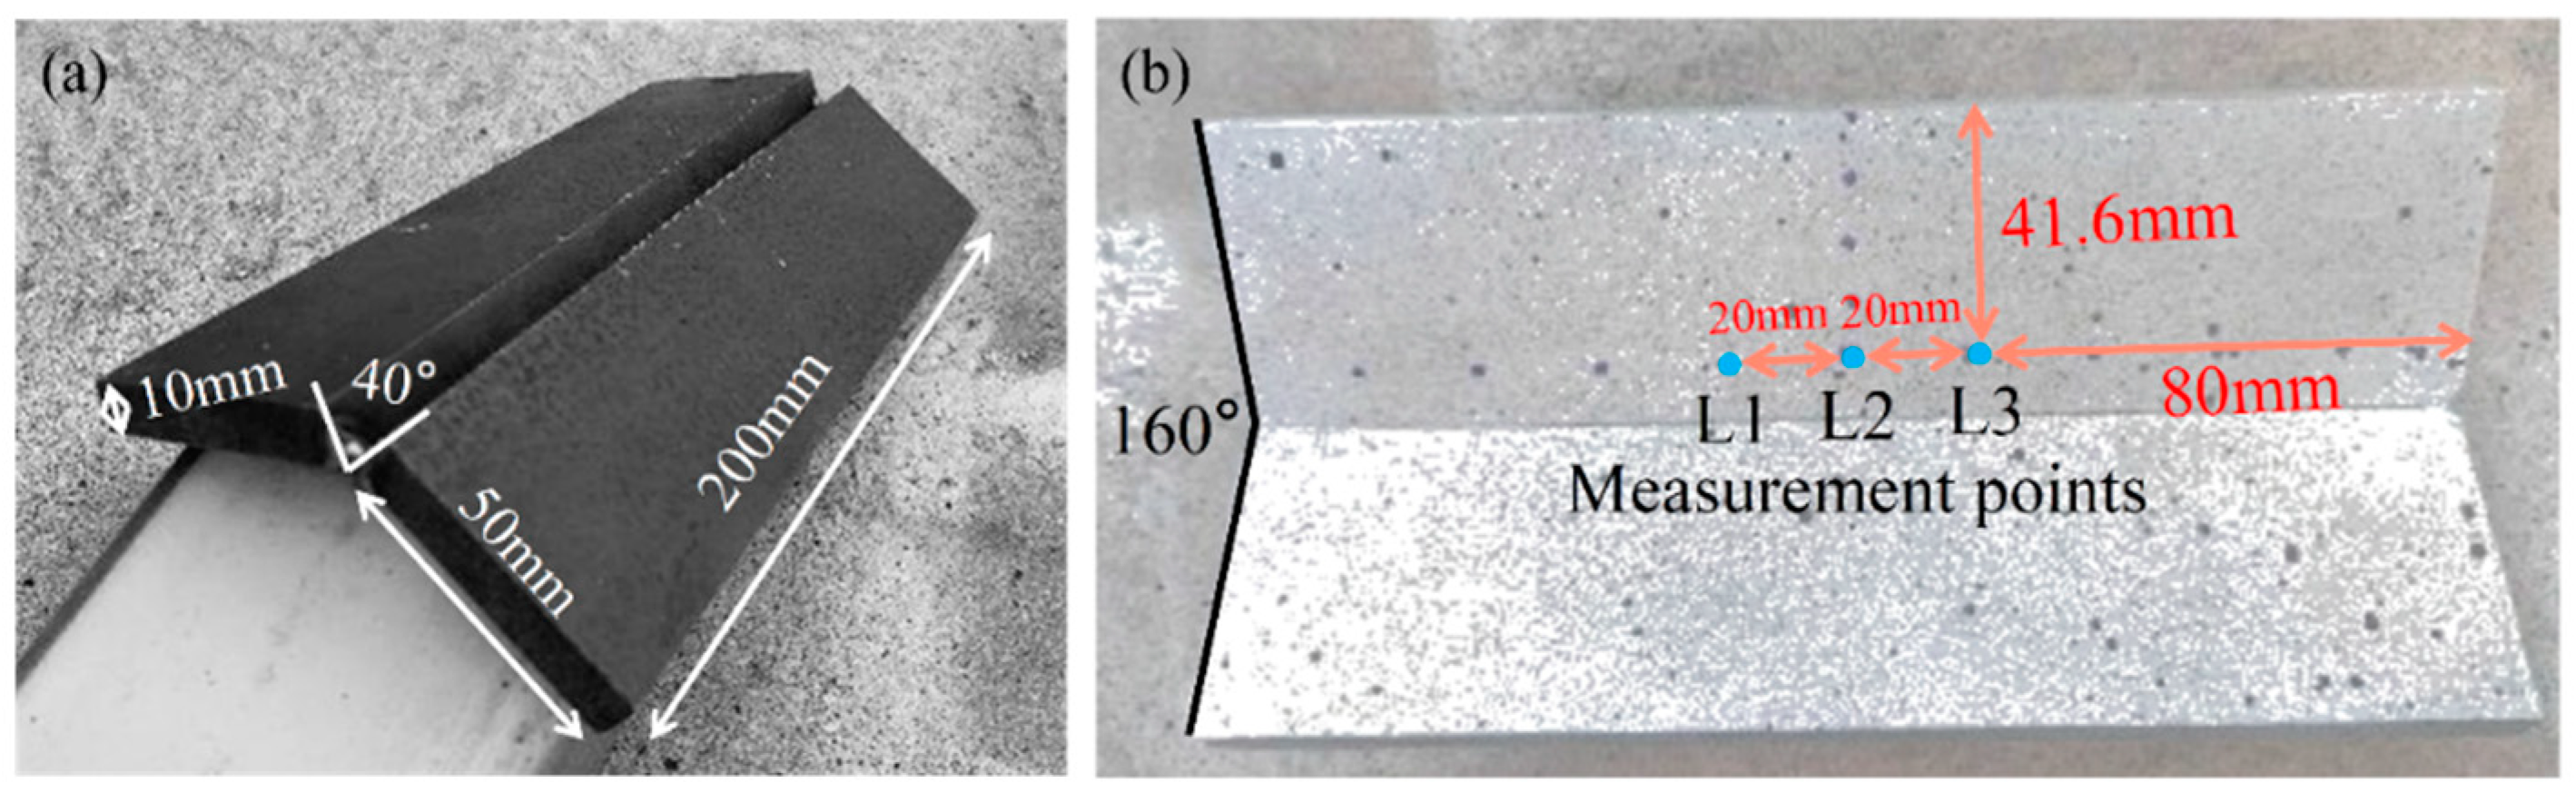
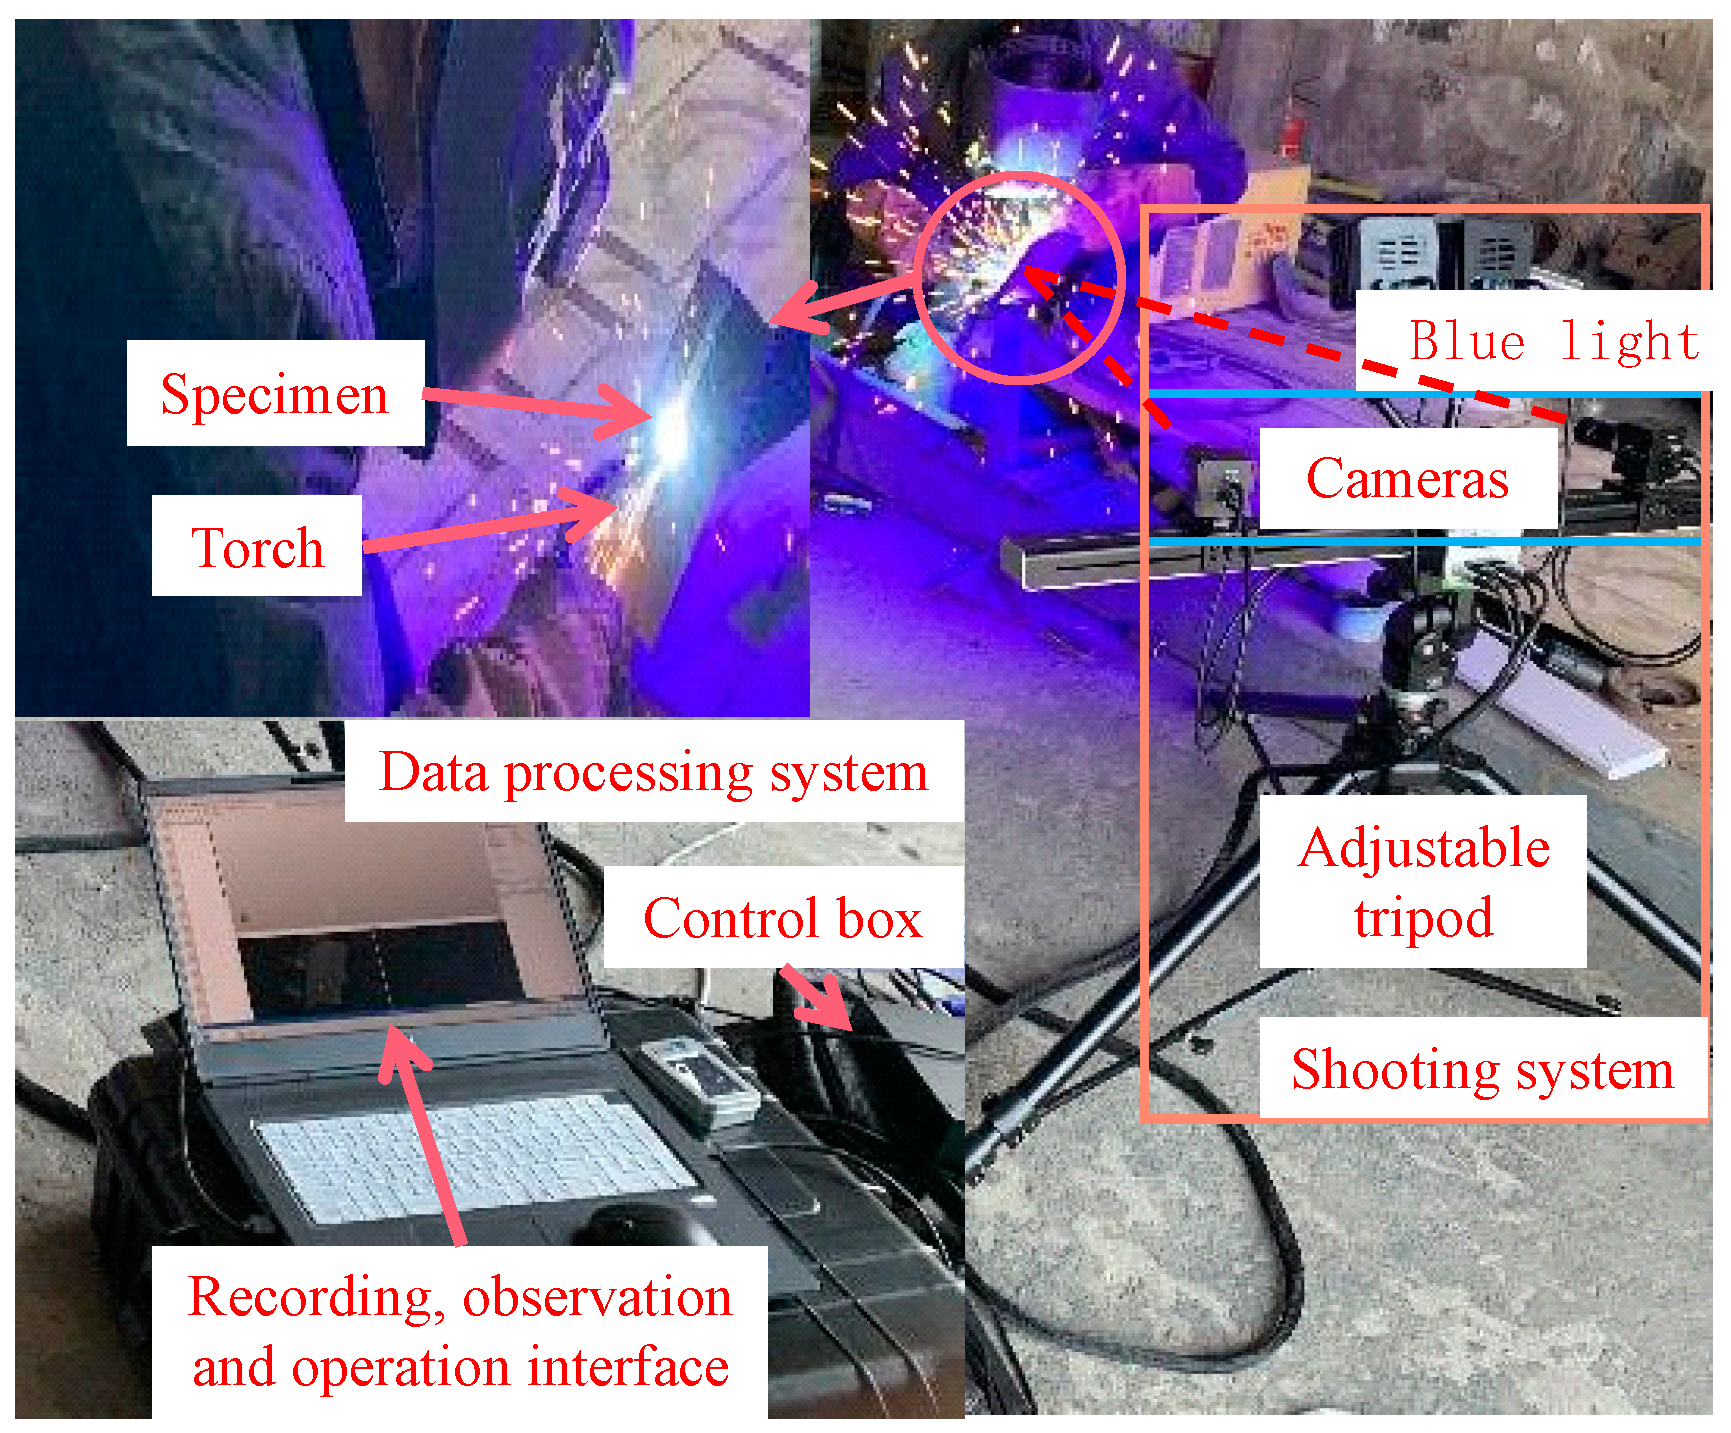
4.1. Equivalent Sample Experiment

Two AH36 flat plates, with dimensions of 200 mm × 50 mm × 10 mm, were fabricated using wire electrical discharge machining (EDM). The butt joint angle was set at 160°, and a 40° V-shaped groove was adopted according to the national standard GB/T 985.1-2008 [19], as shown in Figure 10a. To ensure the performance requirements of the welded joint, the joint was divided into three layers of welds with thicknesses of 3 mm, 3 mm, and 3.5 mm, respectively. The welding process used in this experiment is CO2 gas shielded welding (MIG), with welding wire FRM-56, 1.2 mm in diameter, and a wire feeding speed of 6 mm/min. The preheat temperature was set to 90 °C, and the plates were allowed to cool to room temperature after welding. The welding parameters are shown in Table 4.
A three-dimensional full-field strain measurement analysis system was utilized to capture the dynamic variations in welding stress and strain. This system operates on the principle of Digital Image Correlation (DIC), enabling the measurement of strain and deformation on the object’s surface. To facilitate accurate strain measurements, a speckle pattern with a random grayscale distribution was applied to the specimen’s surface, as shown in Figure 10b. The bottom surface was sprayed with white paint, and after the paint dried, black dots were applied to mark the measurement points with a spacing of 20 mm. The DIC recording process is shown in Figure 11, where a pair of high-definition cameras captured images at the set frame rate. The data obtained were then processed during post-processing.

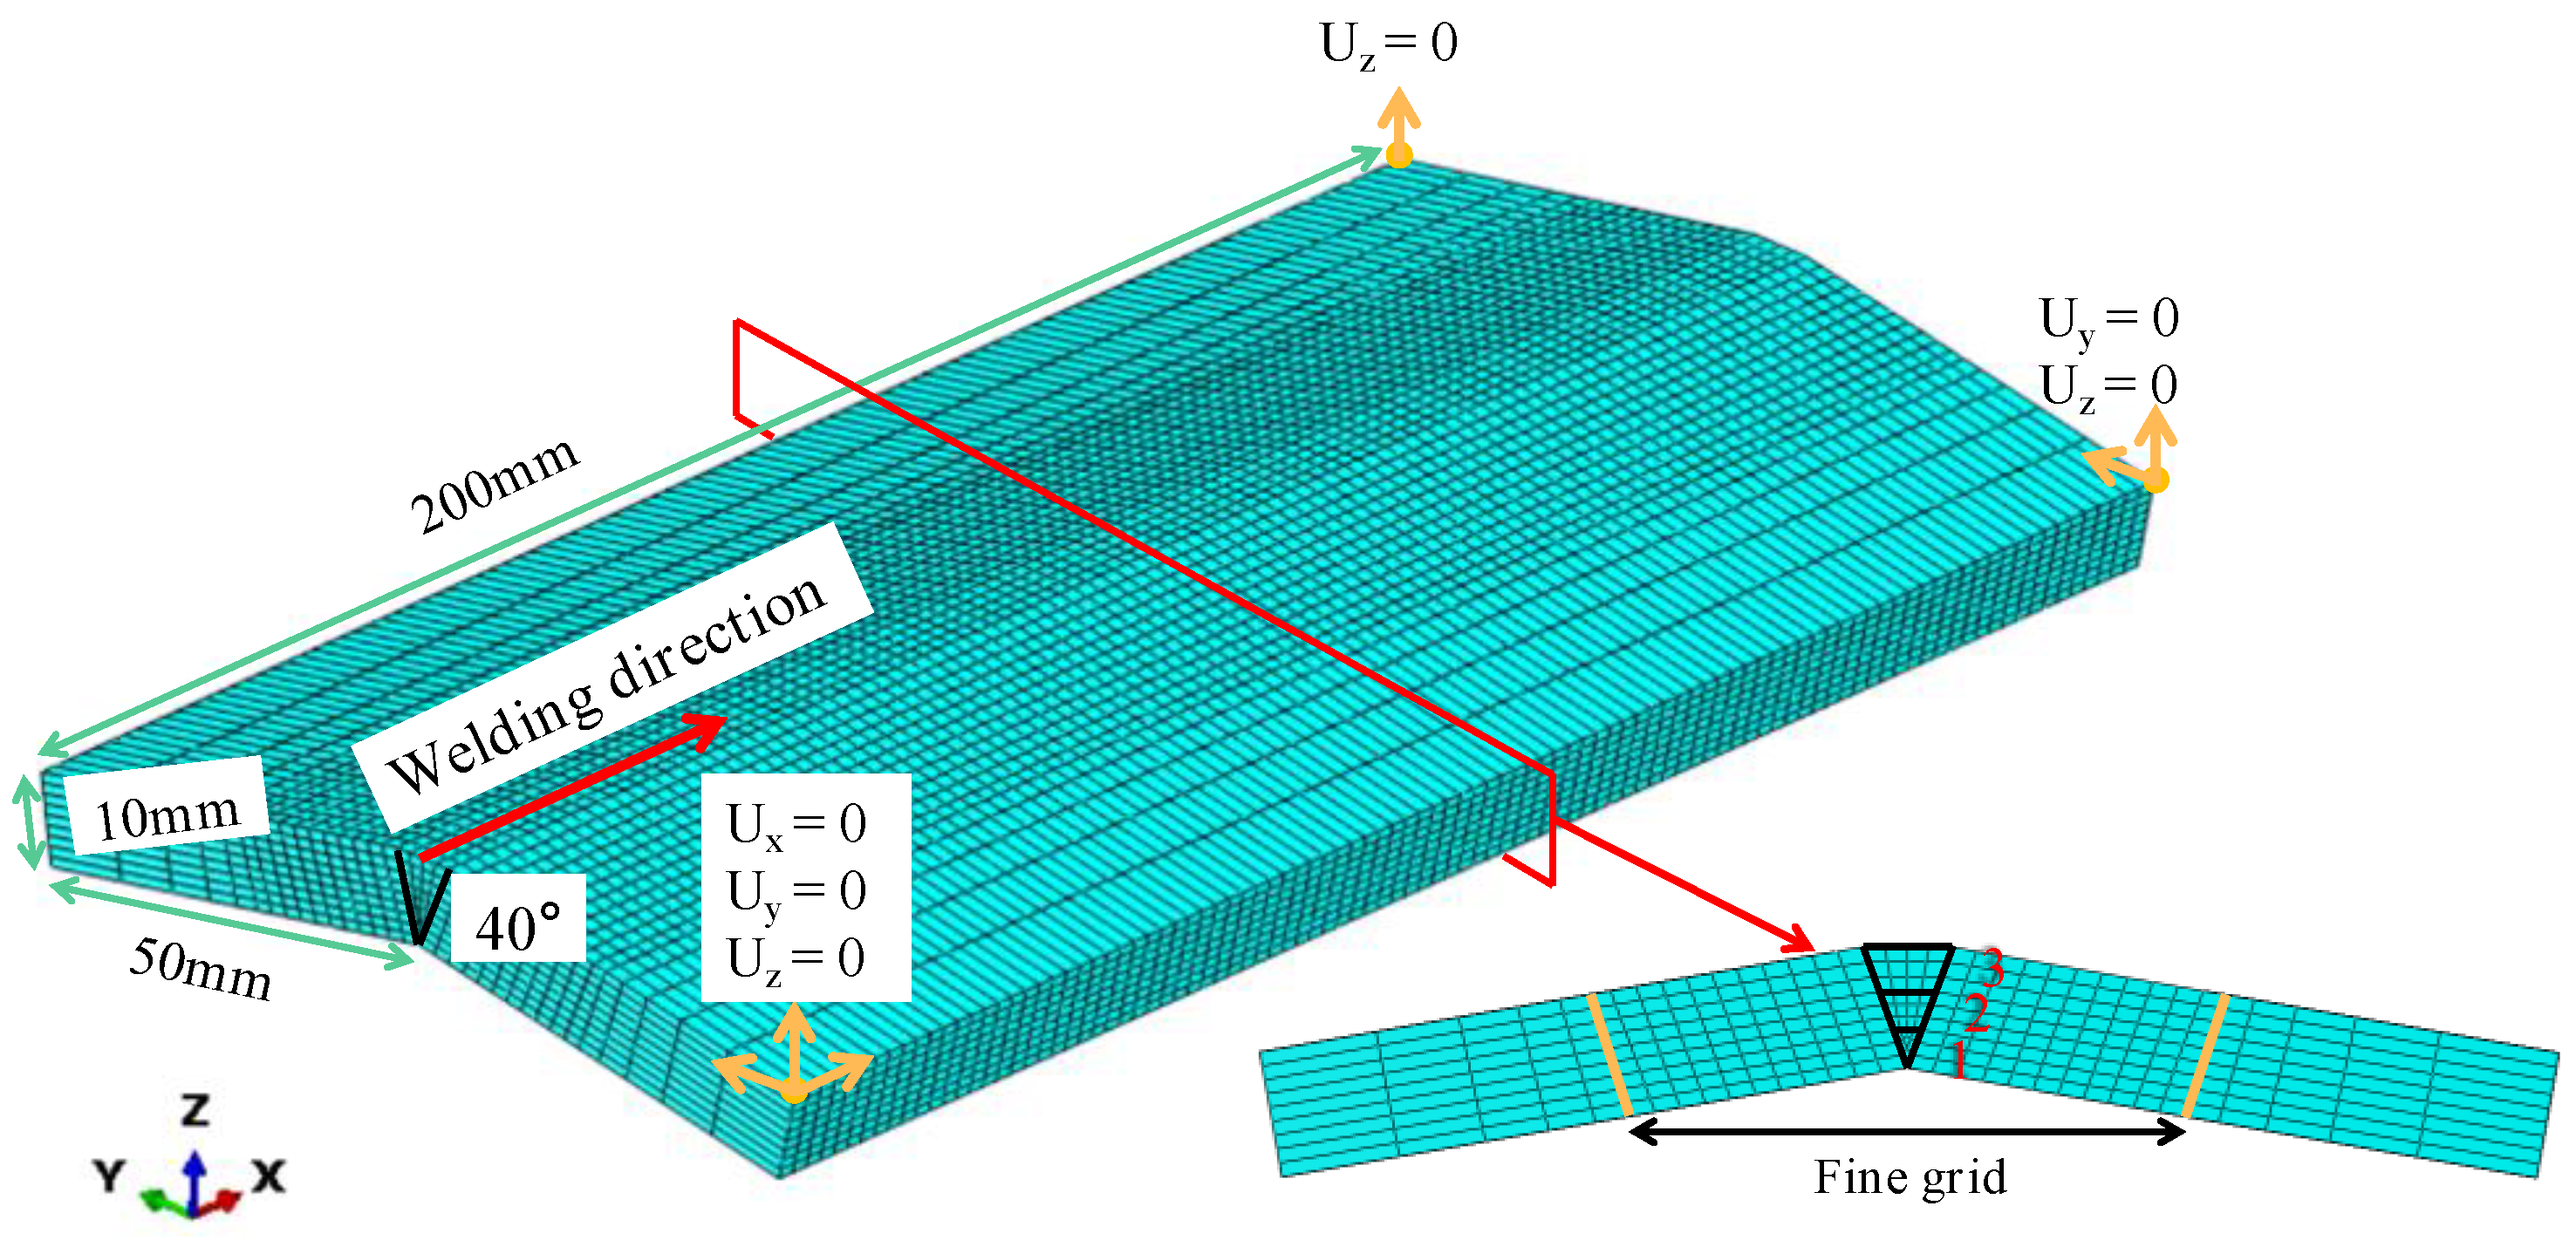
4.2. The Numerical Model of the Equivalent Specimen

The numerical model of the equivalent specimen is shown in Figure 12. A refined mesh with a grid size of approximately 2 mm was applied around the weld and heat-affected zone. In the welding thermal analysis, DC3D8 element meshes were used, while C3D8R elements were employed for the subsequent welding mechanics analysis. The boundary conditions are illustrated in Figure 12, where the right boundary at the start of welding is constrained in the x, y, and z directions, and the right boundary at the welding end is constrained in the y and z directions, with the left boundary constrained in the z direction. Here, the x direction corresponds to the welding direction, the y direction represents the transverse direction of the plate, and the z direction indicates the plate thickness direction. The thermal–elastic–plastic finite element method was used to simulate the dynamic stress–strain process of the equivalent specimen.

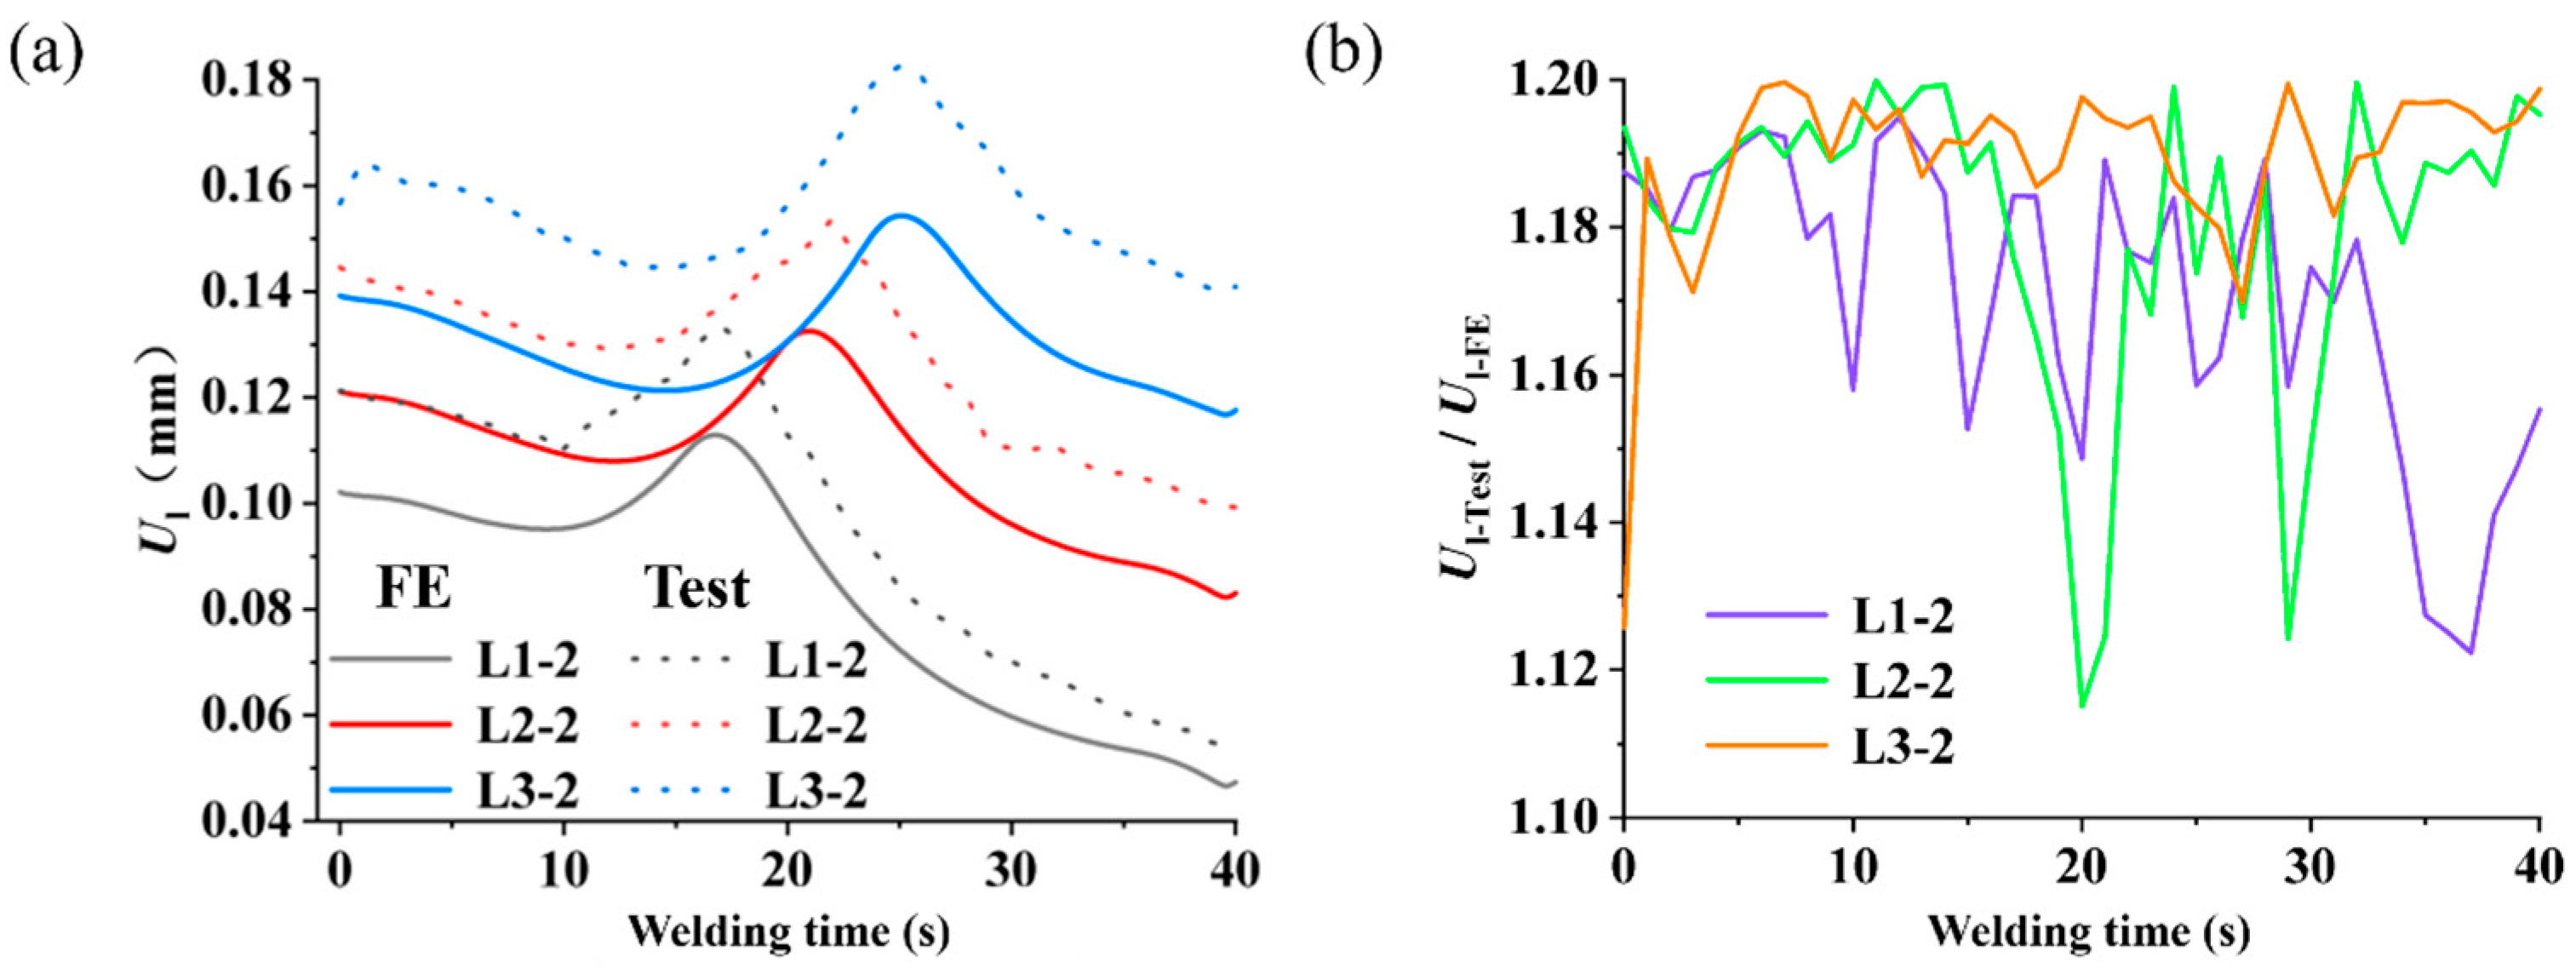
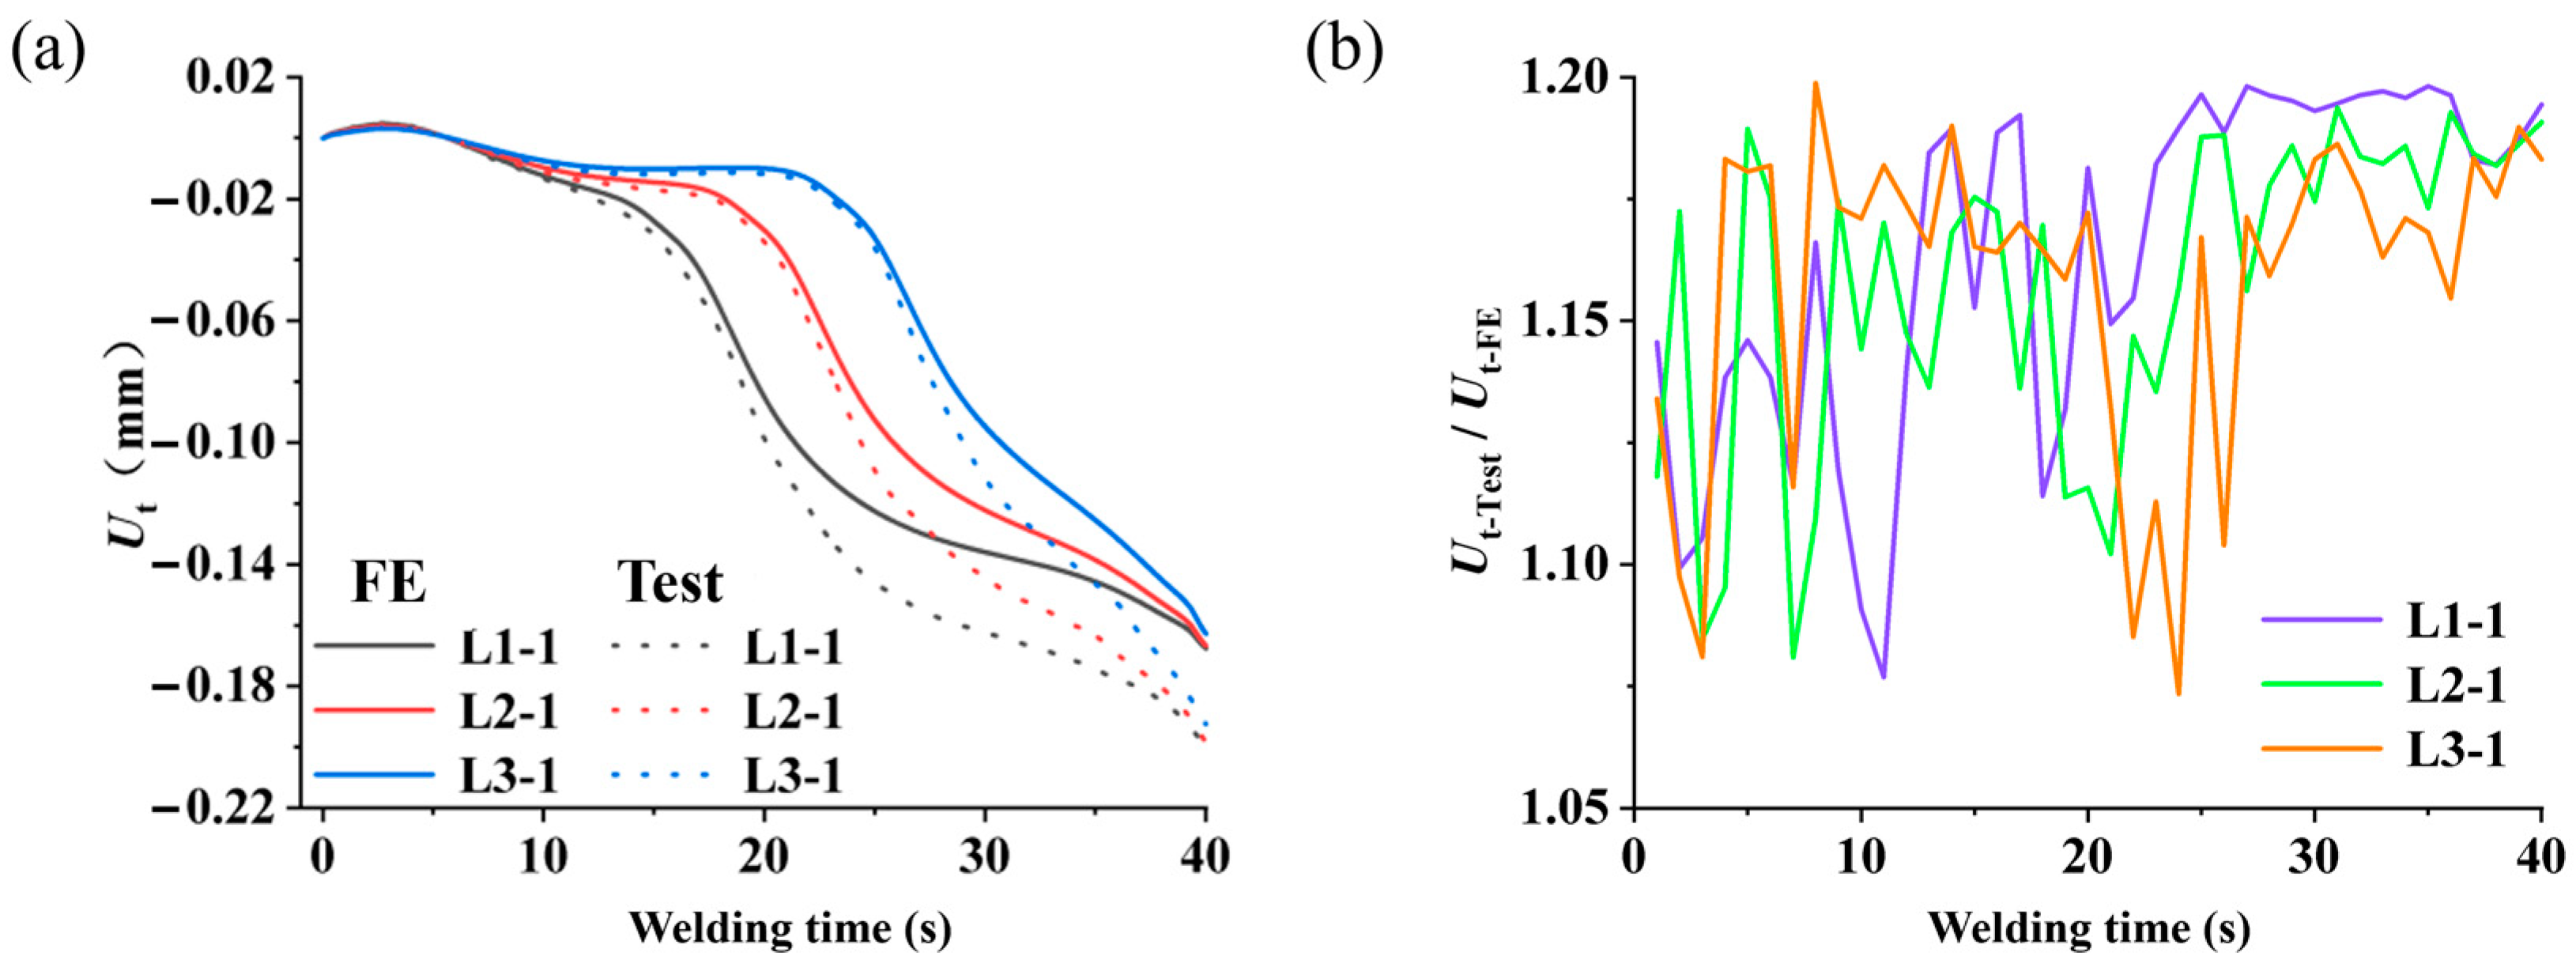
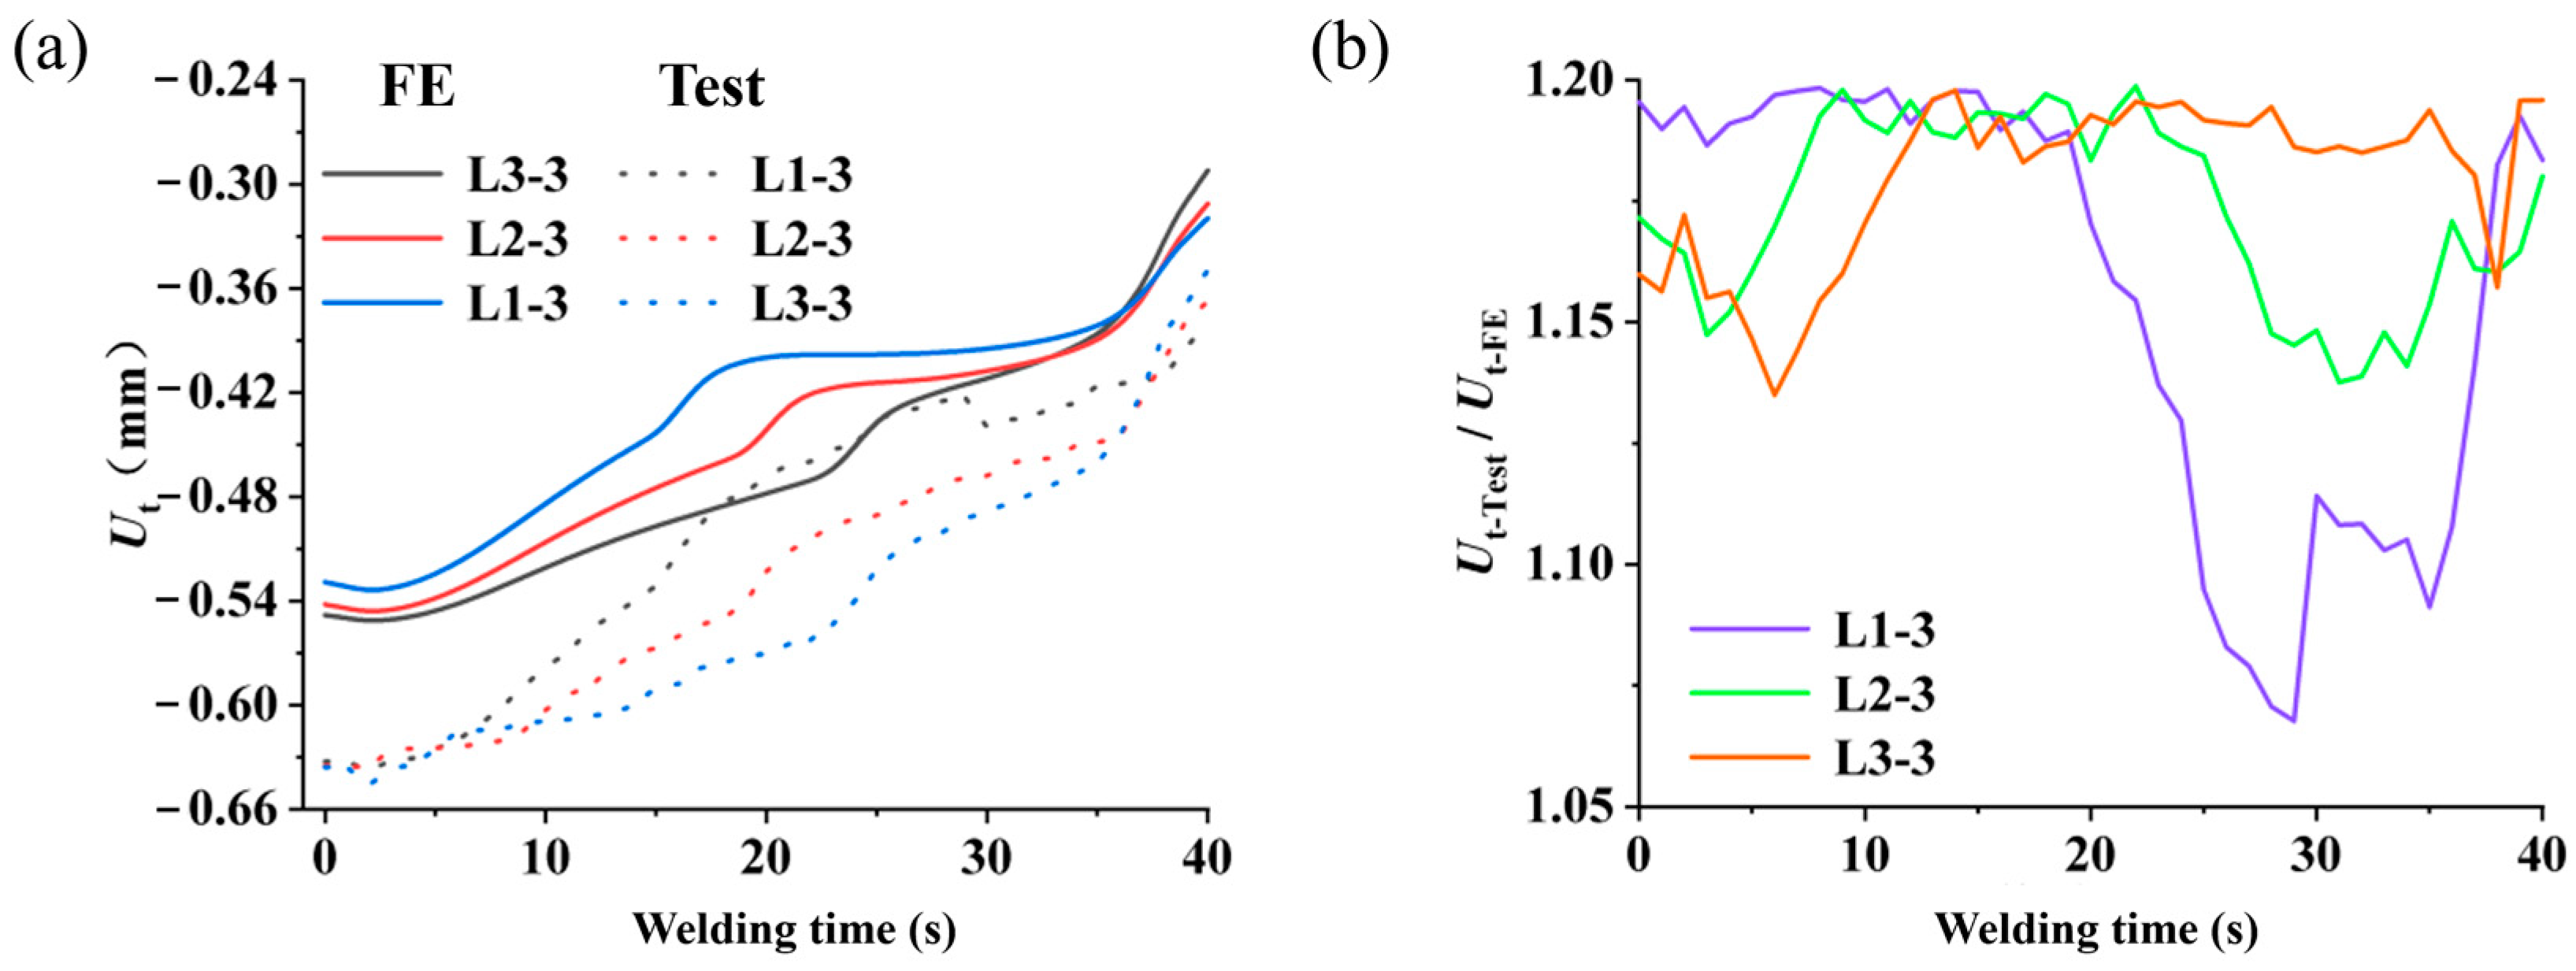
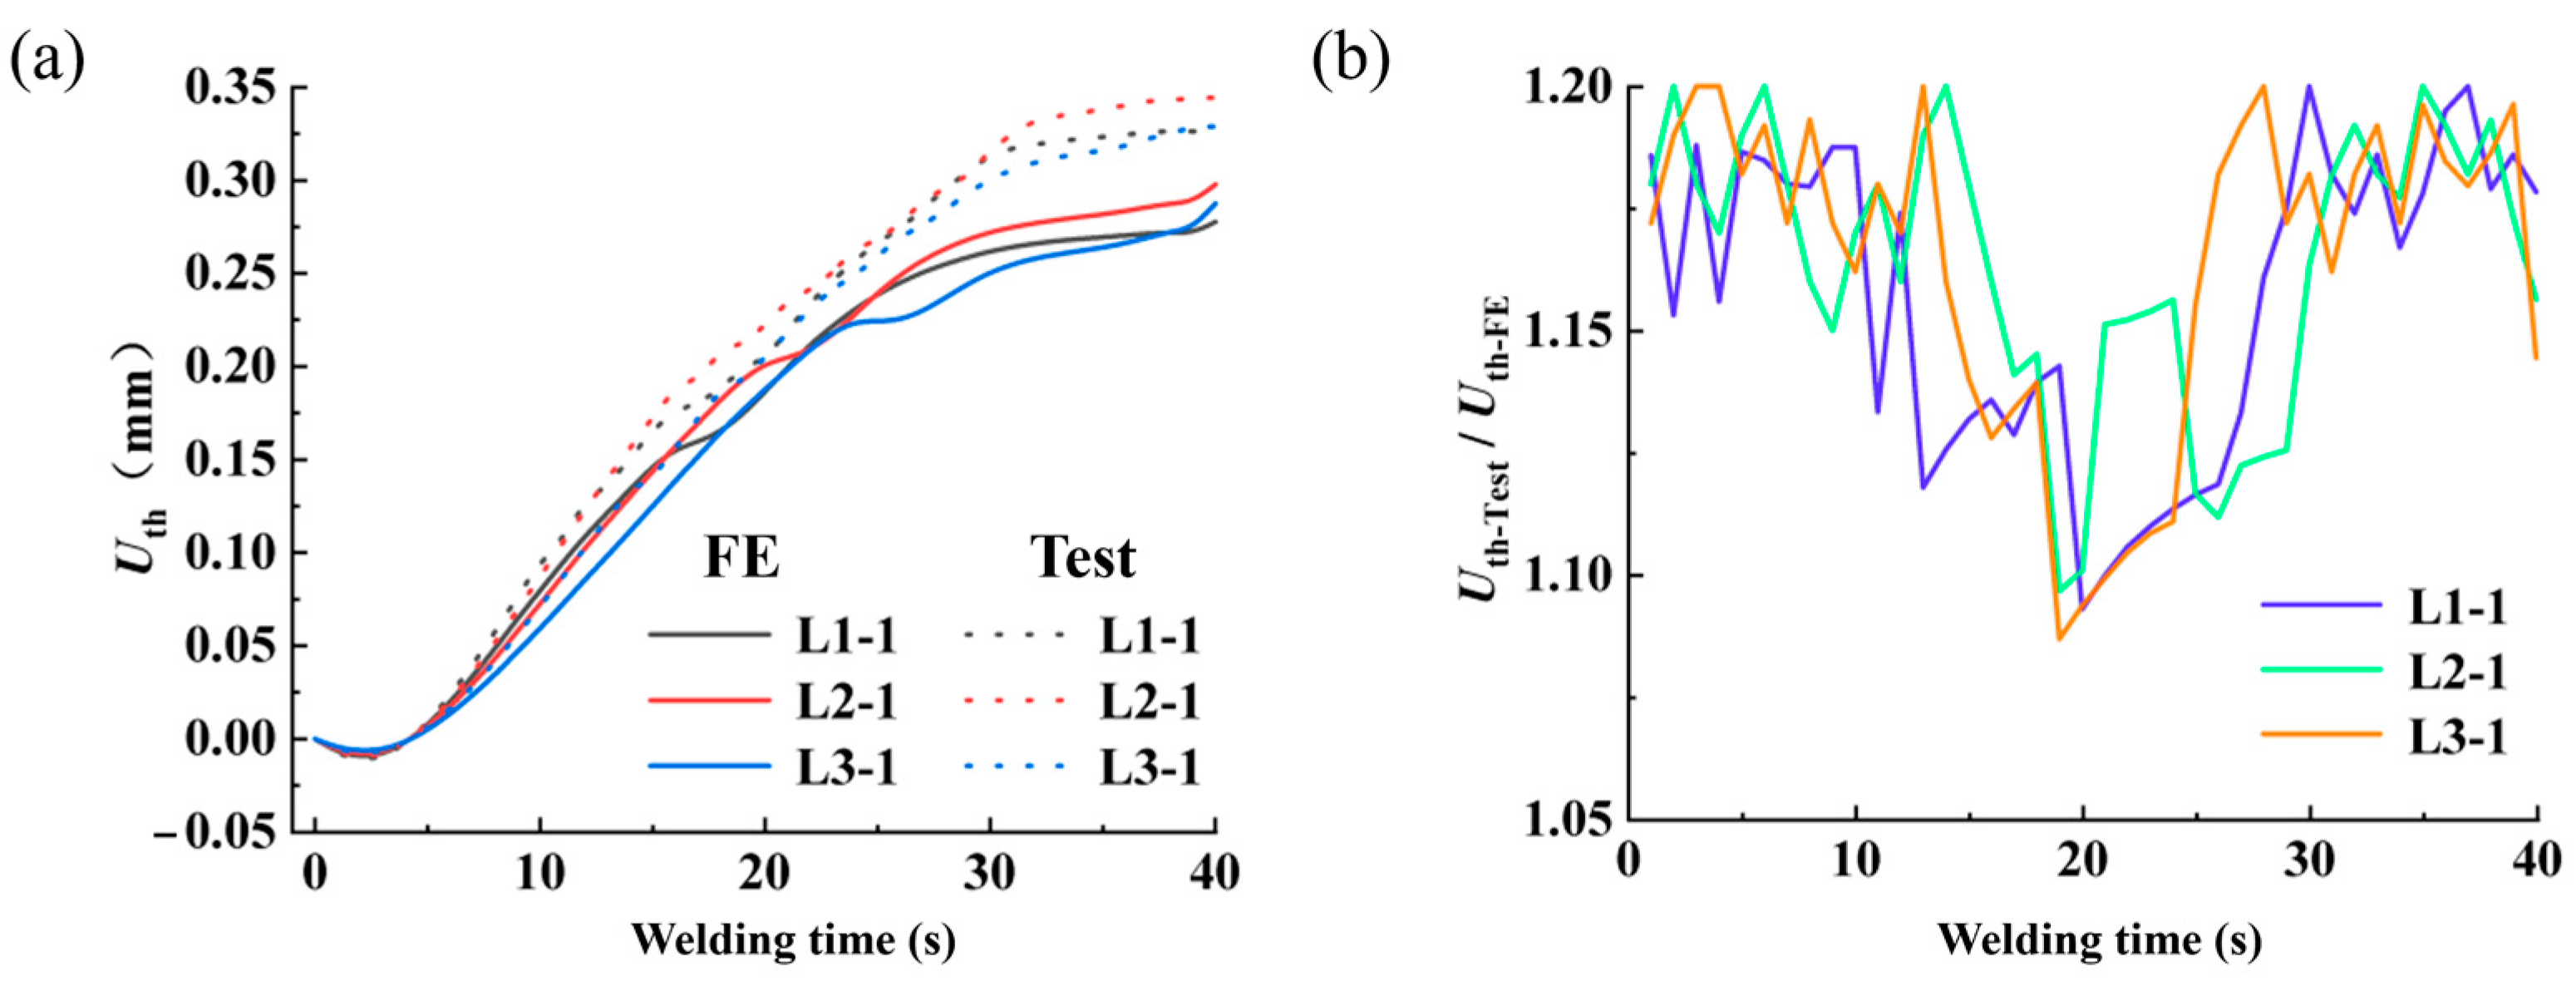
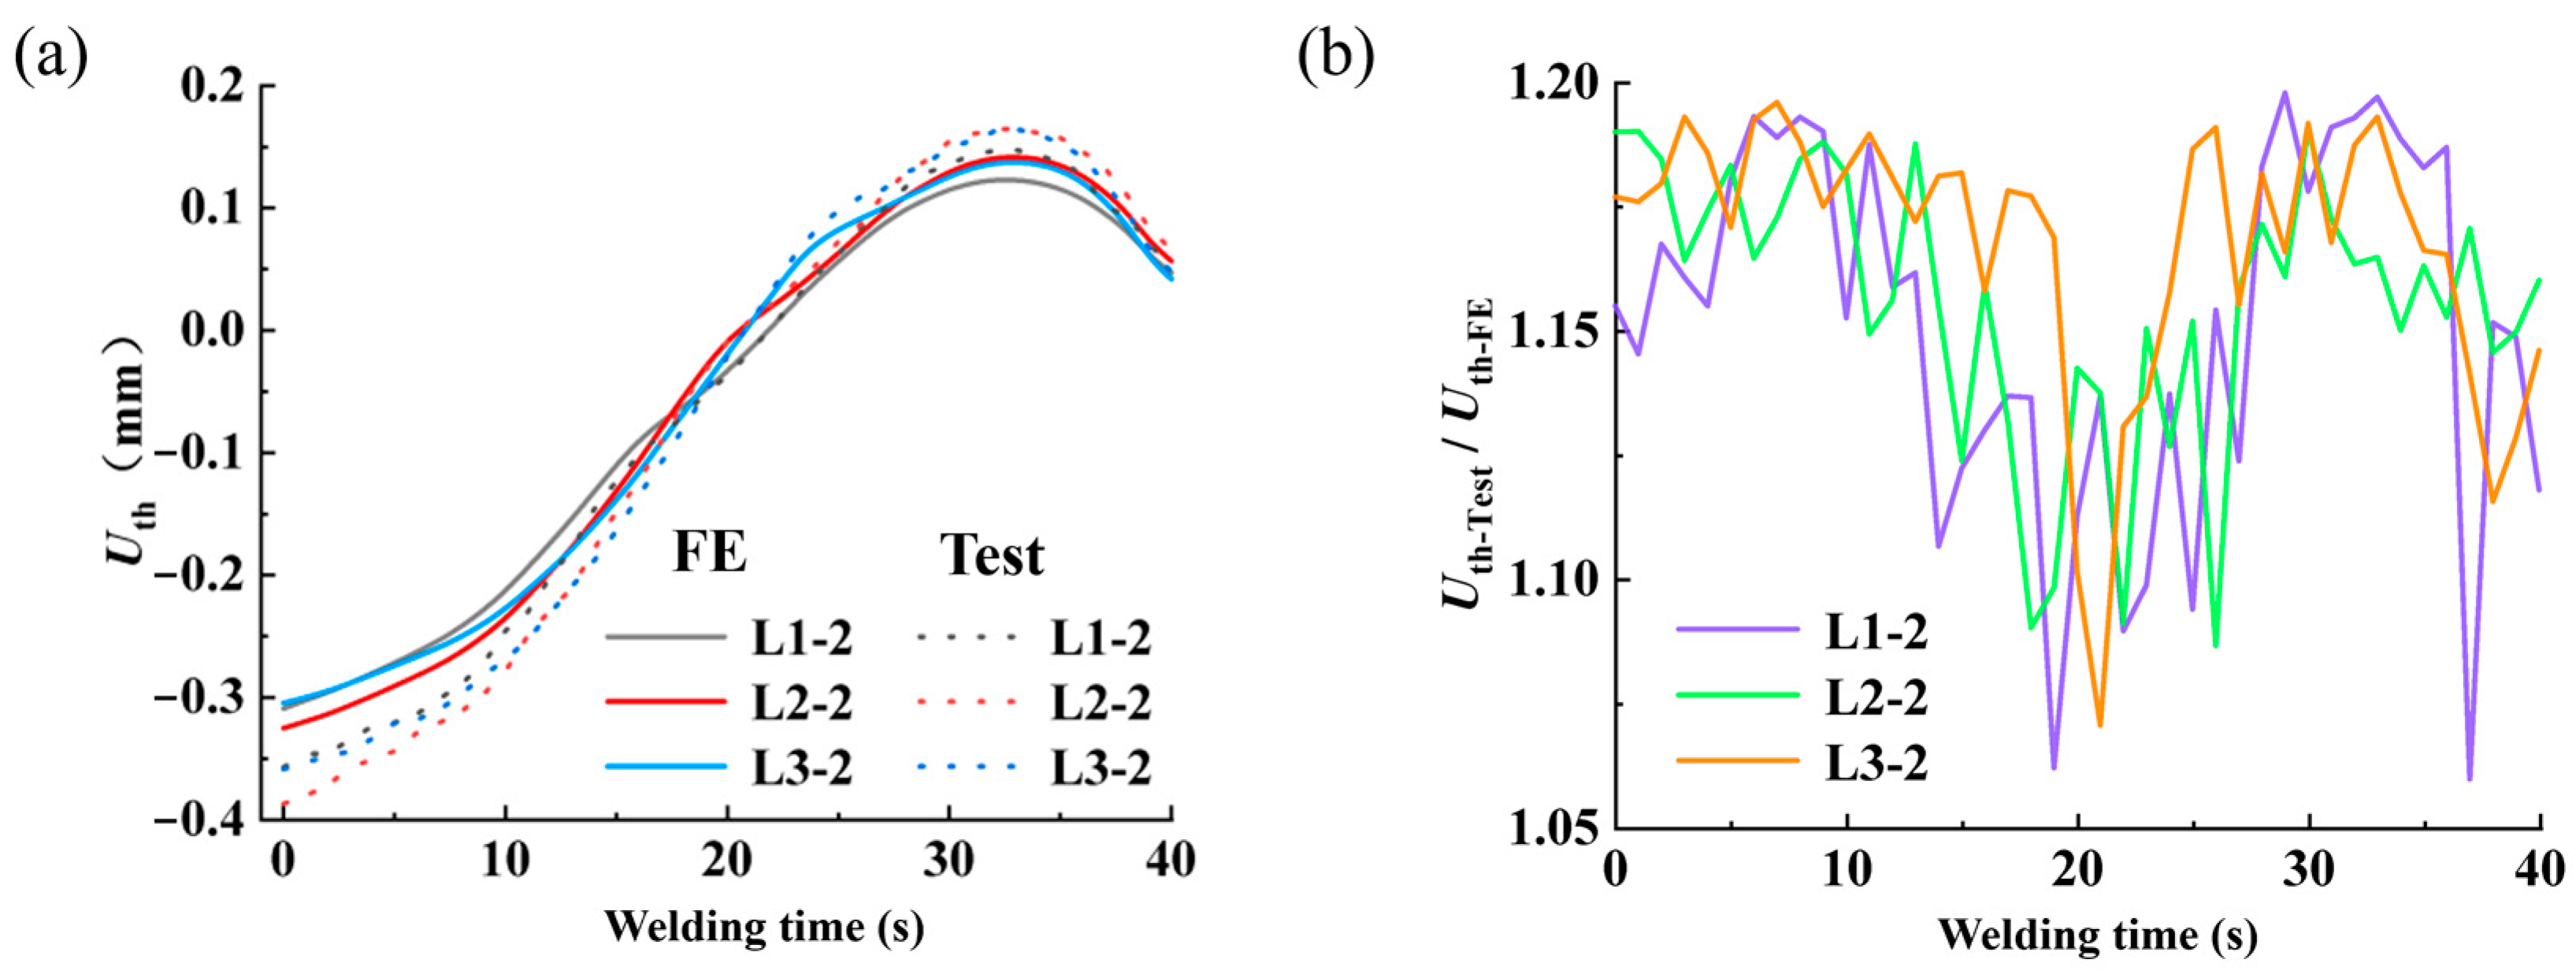
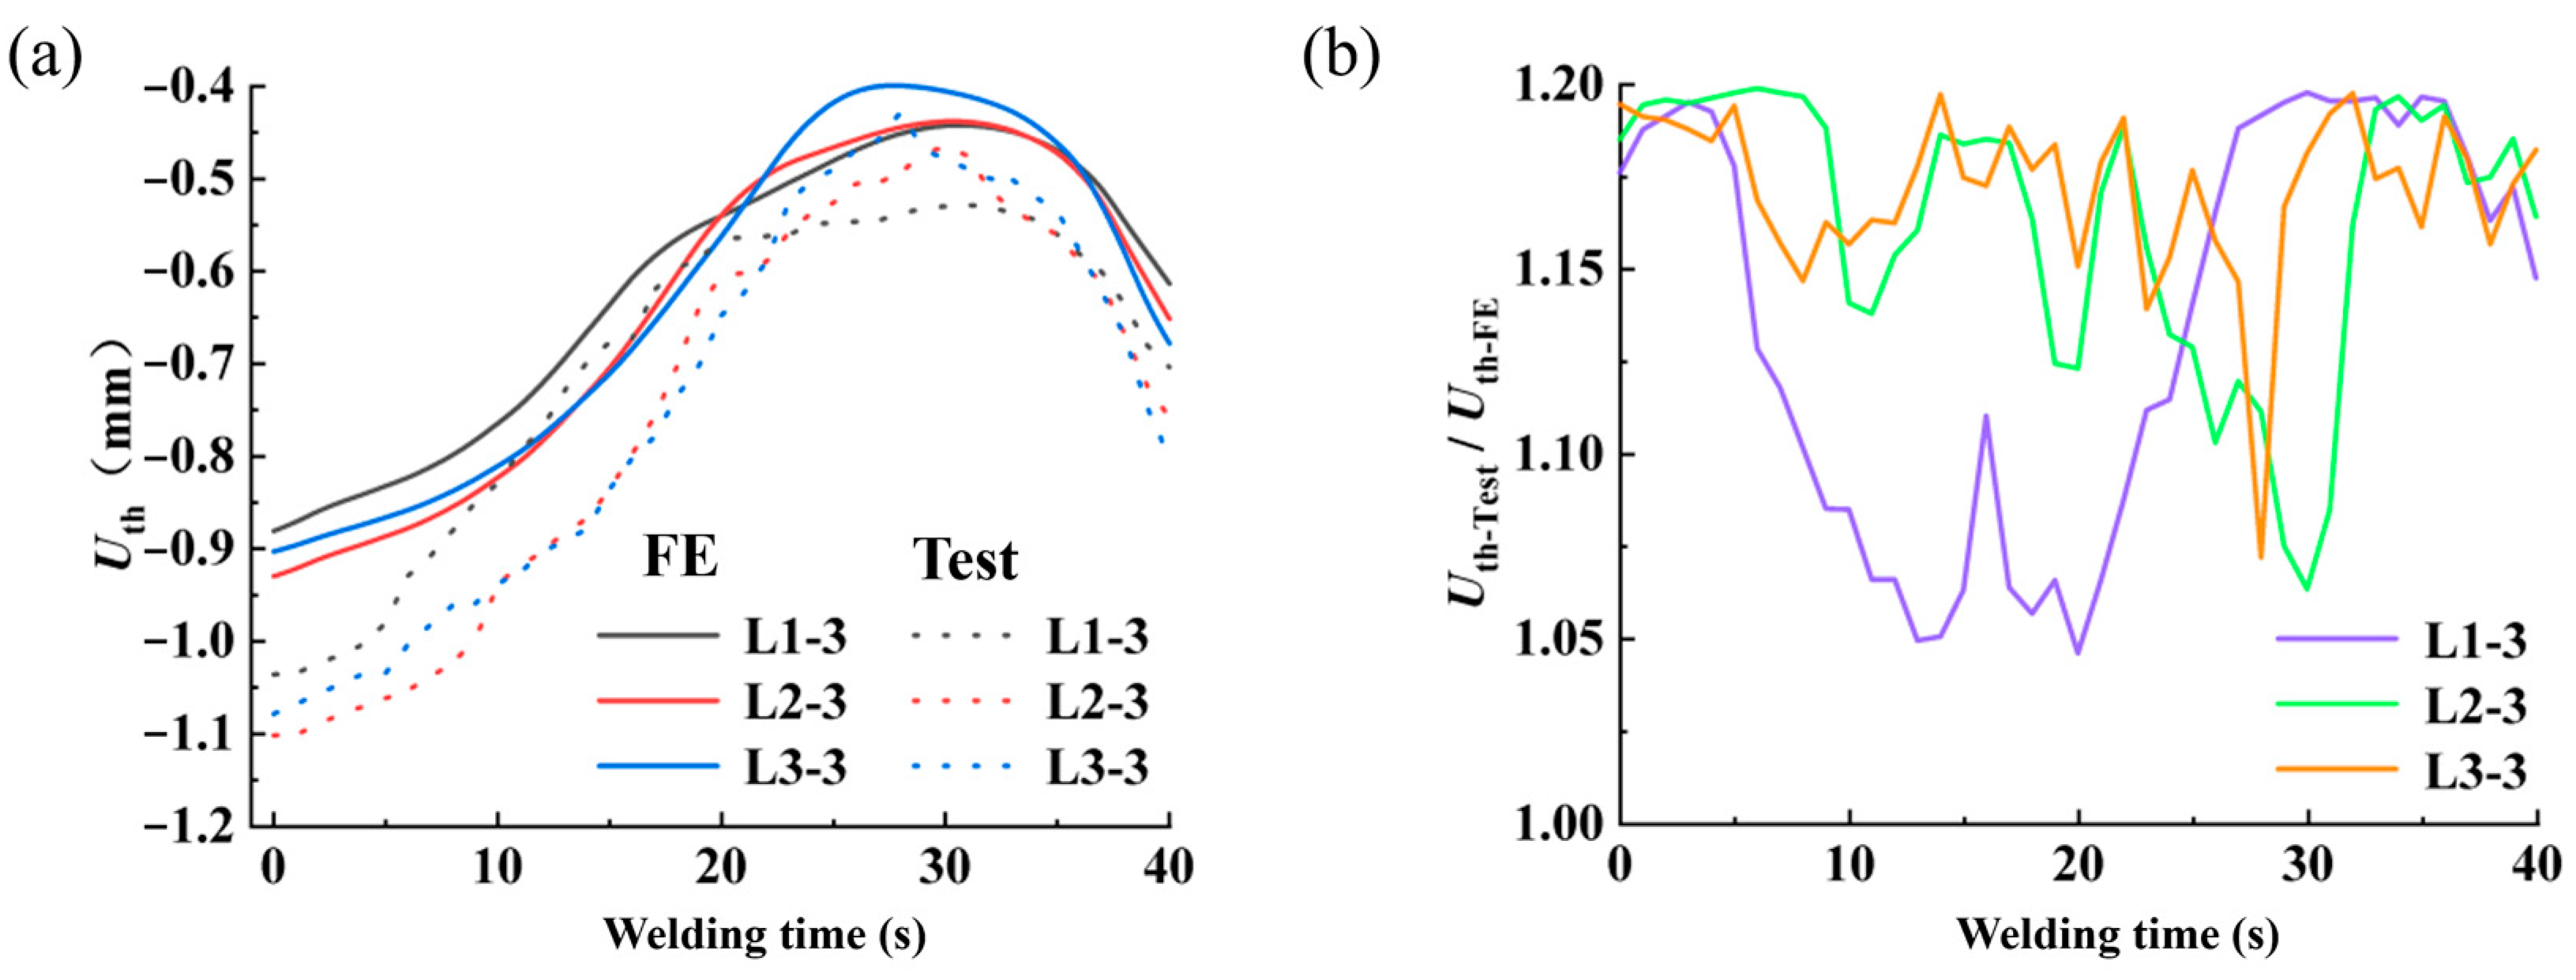
4.3. Comparison of Experimental Results

The temperature-cycling curves of the central nodes A, B, and C in the thickness direction of each weld layer are shown in Figure 13. These nodes are located at the middle cross-section of the weld (x = 100 mm), where the node temperature reaches approximately 2500 °C. Due to the use of dead and alive element technology, the number of thermal cycles experienced by each weld layer differs. Figure 14a presents the weld cross-section and fusion line of the welding sample obtained after cutting, cleaning, and marking, while Figure 14b shows the weld cross-section and fusion line derived from finite element analysis. From the fusion lines in the figures, it is evident that the finite element calculation results are reliable, as they closely resemble the experimental results, and the morphology of the fusion zone is comparable.
The longitudinal deformation during the first-layer welding thermal process is shown in Figure 15. Measurement points L1, L2, and L3 all display a deformation pattern that first increases, then decreases, increases again, and finally decreases. This behavior is attributed to the uniform stress distribution around the molten pool. The experimental and numerical results exhibit a consistent trend, with the ratio ranging from 1.001 to 1.200. On average, the experimental results are 14.4% higher than the numerical results.
The longitudinal deformation in the second-layer welding thermal process is shown in Figure 16. Compared to the first-layer thermal process, the deformation in the final stage of the second layer does not decrease. This is because the measurement points at the bottom are farther from the welding heat source, resulting in a more significant temperature drop. The deformation curve shows that the experimental results are generally higher than the numerical results, with the ratio ranging between 1.115 and 1.200. On average, the experimental results are 18.1% higher than the numerical results.
The longitudinal deformation during the third-layer welding thermal process is shown in Figure 17. The deformation curve exhibits a pattern similar to that of the second layer, as the third-layer welding process follows a similar thermal cycle, resulting in temperatures above the measurement points that are lower. Consistent with previous layers, the experimental deformation values are higher than the numerical ones, with a ratio ranging from 1.109 to 1.200. On average, the experimental results exceed the numerical ones by 18.0%.
The transverse deformation during the first-layer welding thermal process is shown in Figure 18. The deformation curves for measurement points L1, L2, and L3 exhibit similar trends, with the deformation amounts being relatively close. However, the points at which the sharp decline occurs in the curves differ, owing to the sequential movement of the heat source. The ratio between the experimental and numerical results ranges from 1.073 to 1.199, with the average experimental result being 16.0% higher than the numerical result.
The transverse deformation during the second-layer welding thermal process is shown in Figure 19. Before and after the heat source passes, the deformation first decreases, then increases, and finally decreases again. This behavior is due to the expansion of the upper metal layer when heated, and during cooling and contraction, the metal material near the measurement points in the lower layer is affected. Additionally, the temperature reached during heating is significantly lower compared to the first layer. Both the experimental and numerical results exhibit the same trend, but the average experimental result is 17.5% higher than the numerical result.
The transverse deformation during the third-layer welding thermal process is shown in Figure 20. The transverse deformation gradually decreases, which may be attributed to the angular deformation during welding. In the third-layer welding process, the base metal undergoes bending deformation, contracting transversely toward the weld. Meanwhile, both ends in the longitudinal direction bend upward, causing the metal material near the bottom measurement points to shrink. The numerical results exhibit a similar trend to the experimental results, but the average experimental result is 17.0% higher than the numerical result.
The deformation in the plate thickness direction during the first-layer welding process is shown in Figure 21. Both the experimental and numerical results exhibit the same trend, with an increase in deformation during the process. The ratio between the experimental and numerical results ranges from 1.093 to 1.200, with the average experimental result being 16.1% higher than the numerical result.
The deformation in the thickness direction during the second-layer welding process is shown in Figure 22. Prior to 33 s, the deformation curve follows a similar pattern to that of the first layer, with a continuous deformation increase. After 33 s, the deformation decreases, likely due to the cooling of the upper weld, which causes the metal to contract, resulting in welding angular distortion. This contraction near the measurement points leads to the observed decrease in deformation. The trend of the finite element results aligns with the experimental curve, although some discrepancy is present. The average experimental result is 15.8% higher than the numerical result.
The deformation in the thickness direction during the third-layer welding process is shown in Figure 23. The thermal deformation curve for the third layer exhibits a pattern similar to that of the second layer, accompanied by a corresponding longitudinal deformation phenomenon. The average experimental result is 15.6% higher than the numerical result.
The deformation curves in three directions were compared between the experiment and finite element analysis, with the ratio of the experimental and numerical results presented in Table 5. As shown in Table 5, the average ratio ranges from 1.144 to 1.181, indicating some deviation between the numerical and experimental results, with an average deviation of approximately 16.6%. However, both results display the same trend of variation.
To investigate the accuracy of the transient heat source model in welding residual stress simulation, residual stress measurements were conducted at three designated points using the hole-drilling method [29]. The measurement equipment employed was the BMB120-3CA(11)-P150-W type, manufactured by Chengdu Electrical Measurement Sensor Technology. The measured welding residual stress results are presented in Figure 24 and Table 6. From Figure 24, it is evident that the numerical results for welding residual stress follow a trend similar to the experimental results, with the residual stress at L2 being lower than that at L1 and L3. According to Table 6, the ratio of the experimental to numerical results for longitudinal residual stress at each measurement point ranges from 1.07 to 1.09, while the ratio for axial residual stress ranges from 0.92 to 1.07. The deviations for both are within 10%. Overall, the transient heat source model demonstrates high accuracy in simulating welding residual stress, with an error below 10%. However, it exhibits a relatively larger deviation of approximately 16% in predicting post-weld deformation. Therefore, for applications where high precision in welding deformation is not a critical requirement, the transient heat source model remains a viable and effective approach.

5. Conclusions

Based on the shell contour curve, the dimensions of a twelve-section conical shell were designed, and a welding model was established. The welding process was simulated using the thermal–elastic–plastic method to investigate the distribution characteristics of residual stress within the shell. The effectiveness of the transient heat source was verified, and an equivalent model was proposed accordingly. The results indicate that the transient heat source can accurately simulate the distribution of welding residual stress while significantly improving computational efficiency. Additionally, the equivalent model can to some extent reflect the residual stress distribution in revolution structures, providing a reference for future process optimization. The following conclusions were drawn:
(1)
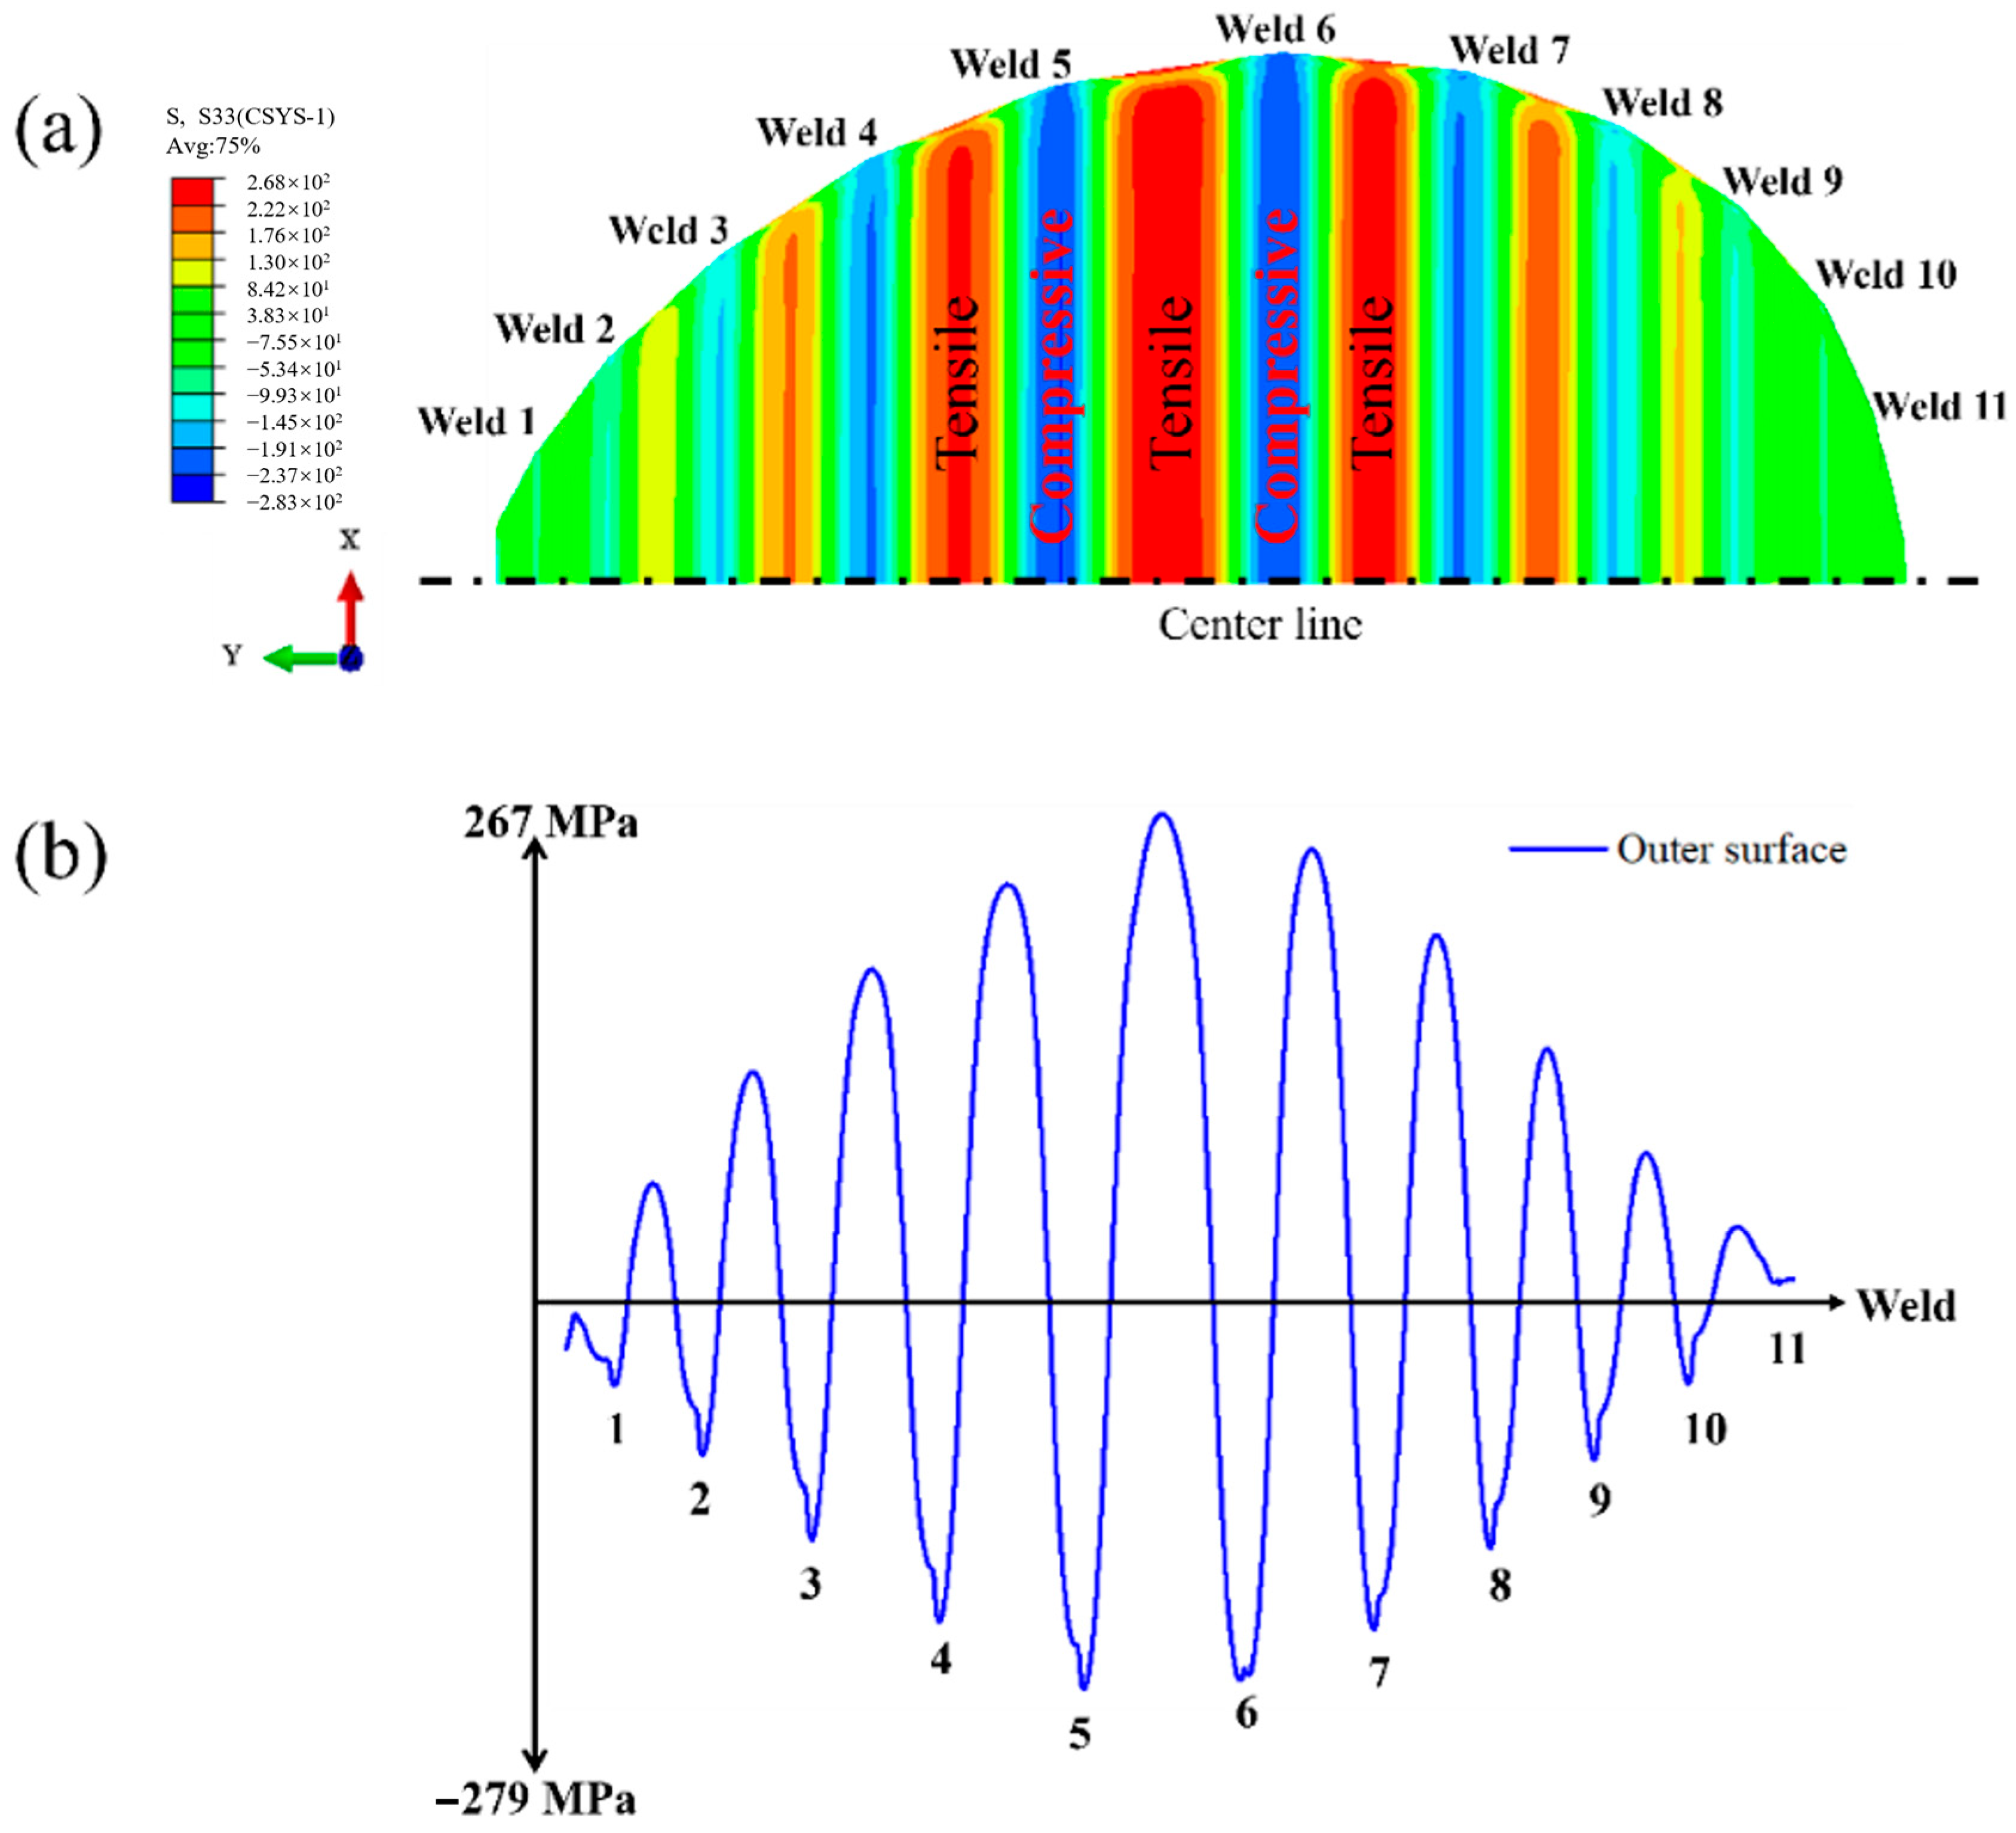
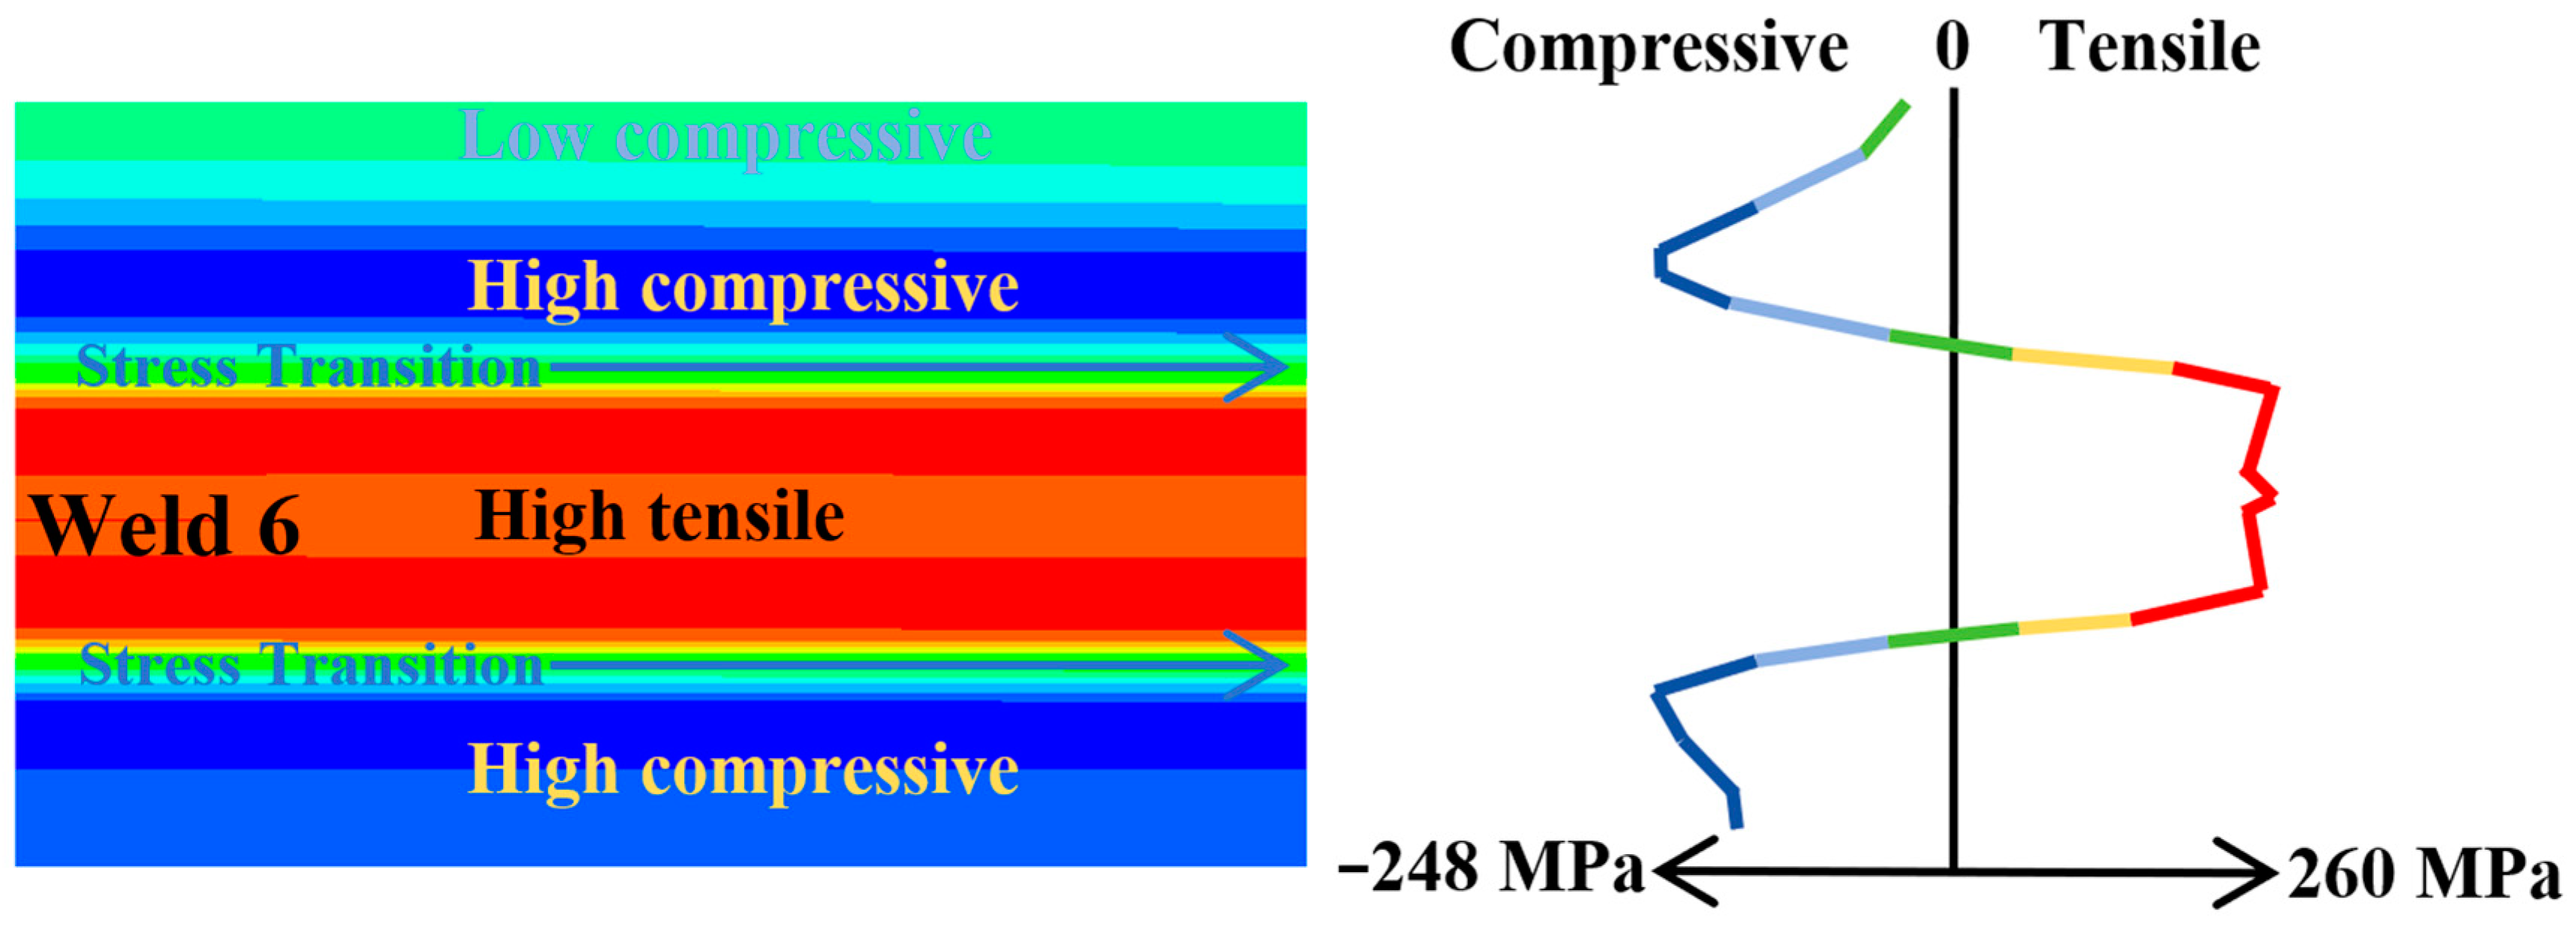
On the outer surface of the shell, the circumferential residual stresses around the welds and their adjacent areas follow a distinct pattern: compressive stress is followed by tensile stress. The axial residual stresses are tensile, and their distribution near the welds and adjacent regions is not influenced by the length of the cone’s generator line. As we move from the welds toward the adjacent cone segments, the circumferential residual stresses form a striped pattern of compressive–tensile–compressive stresses, with the stress magnitudes resembling a W-shape. In contrast, the axial residual stresses exhibit a compressive–tensile striped pattern, with stress magnitudes resembling a V-shape.
(2)
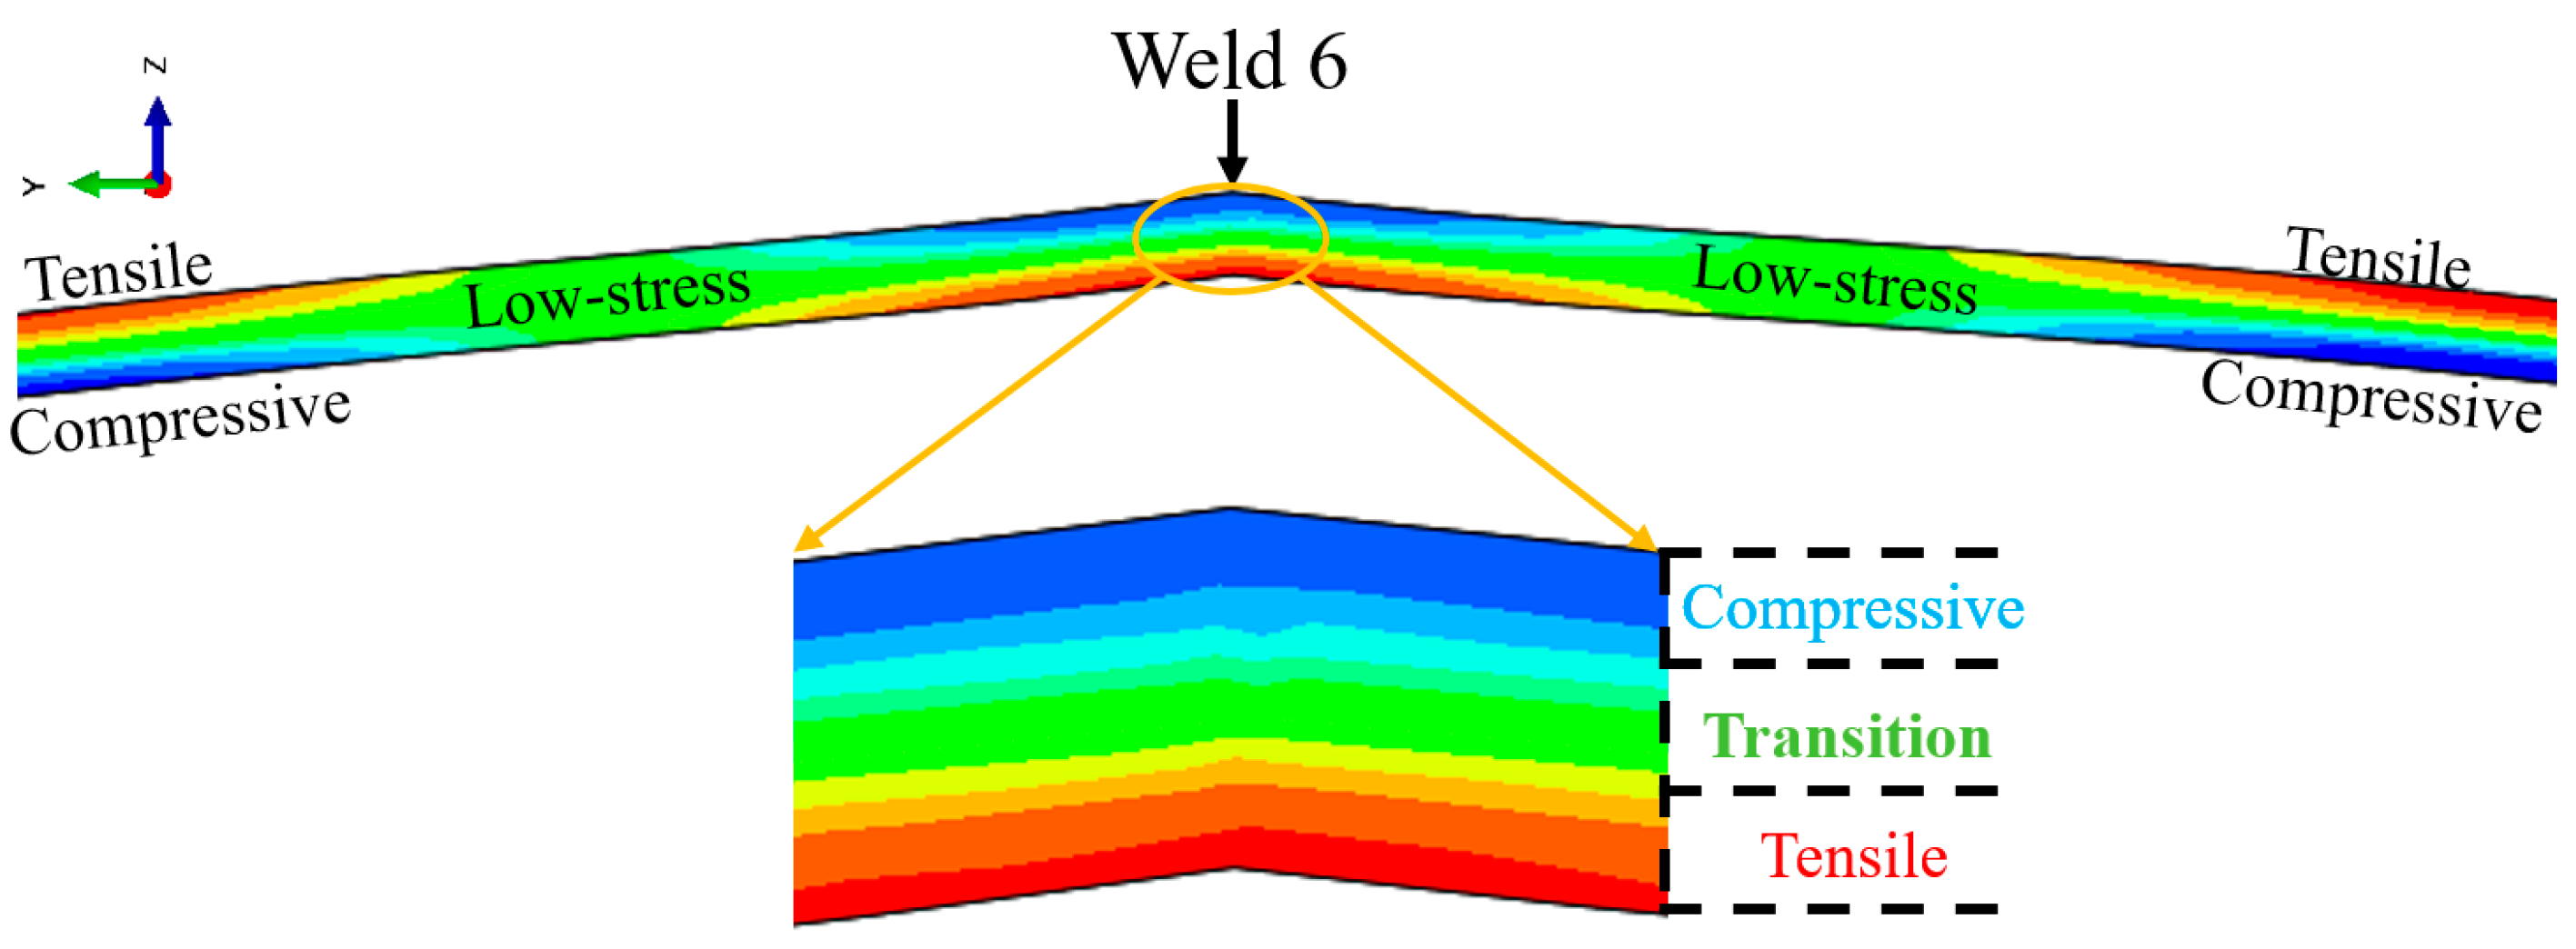
On the inner surface of the shell, the residual stresses around the welds and adjacent areas are tensile, while those on both sides are compressive. The length of the cone’s generator line and the relative welding angle influence both the magnitude and the merging effect of the circumferential residual stress distribution region. As for the axial residual stresses, these factors primarily affect the stress magnitude. Notably, the residual stresses in the middle section of the shell are higher than those at the ends.
(3)
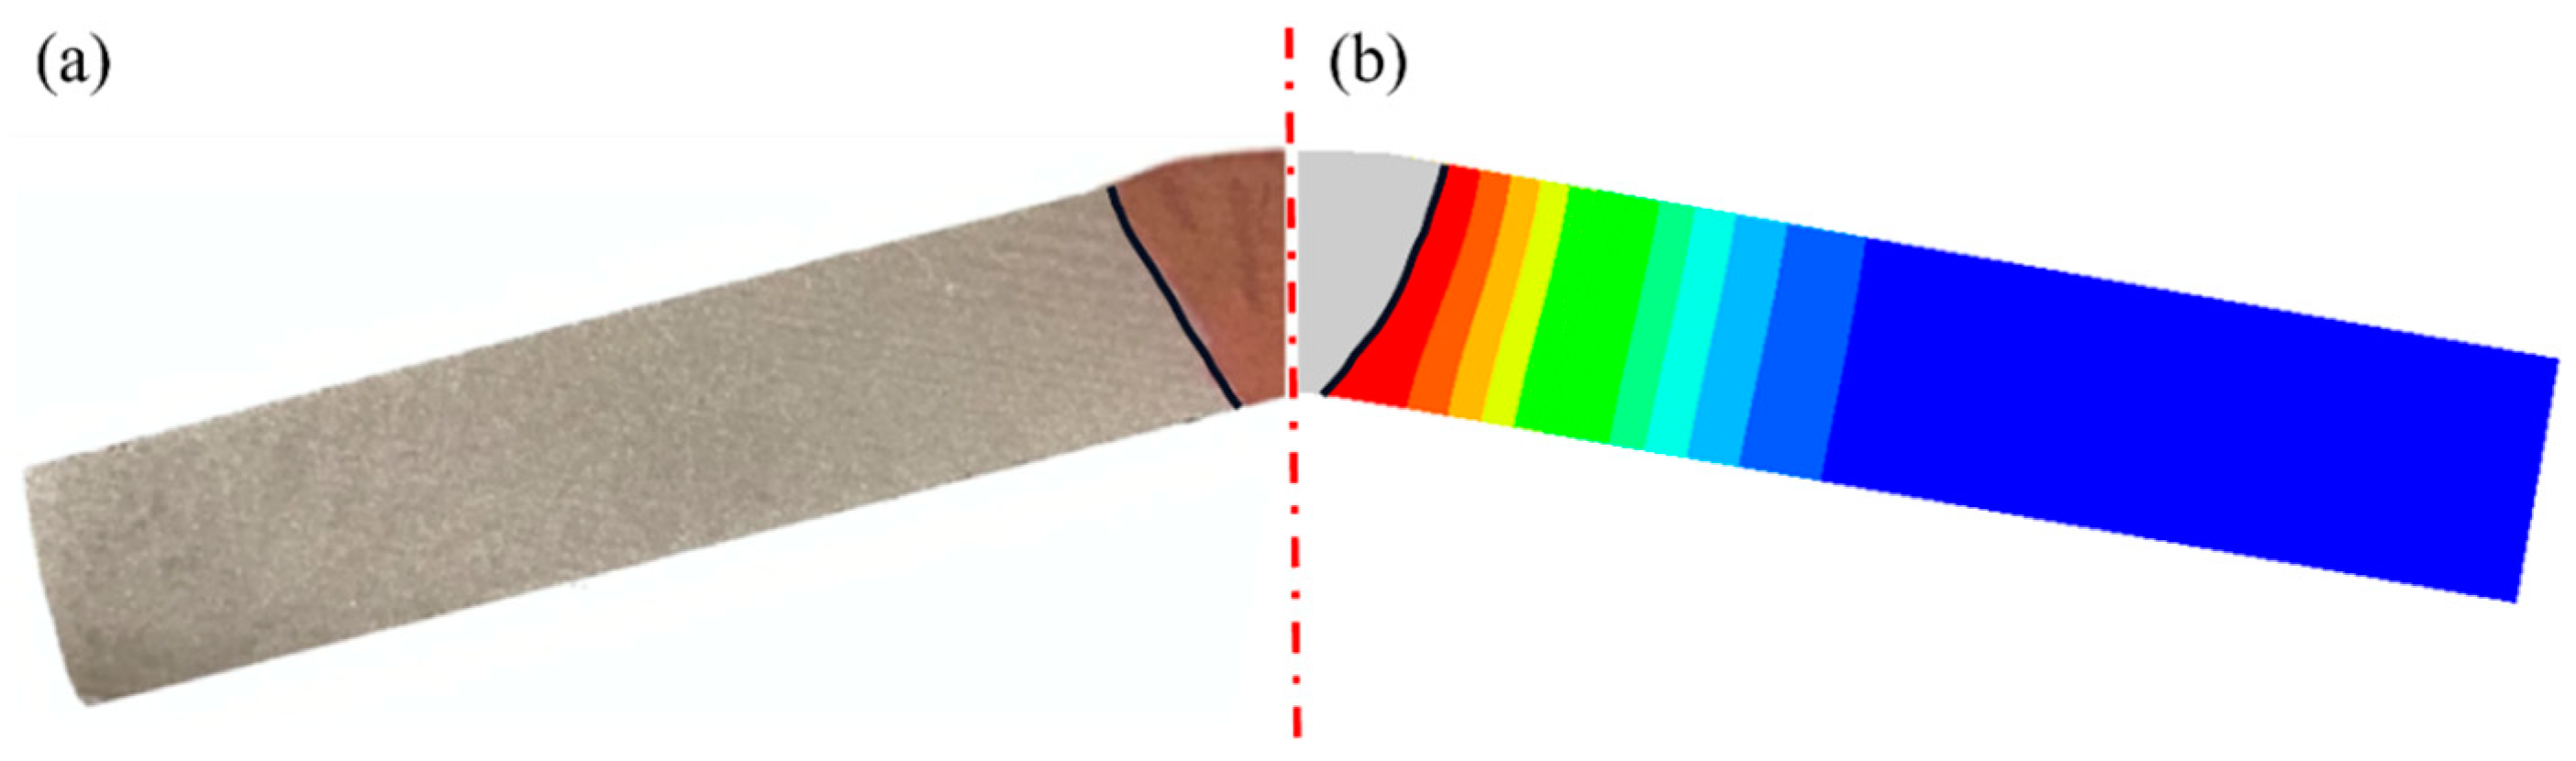
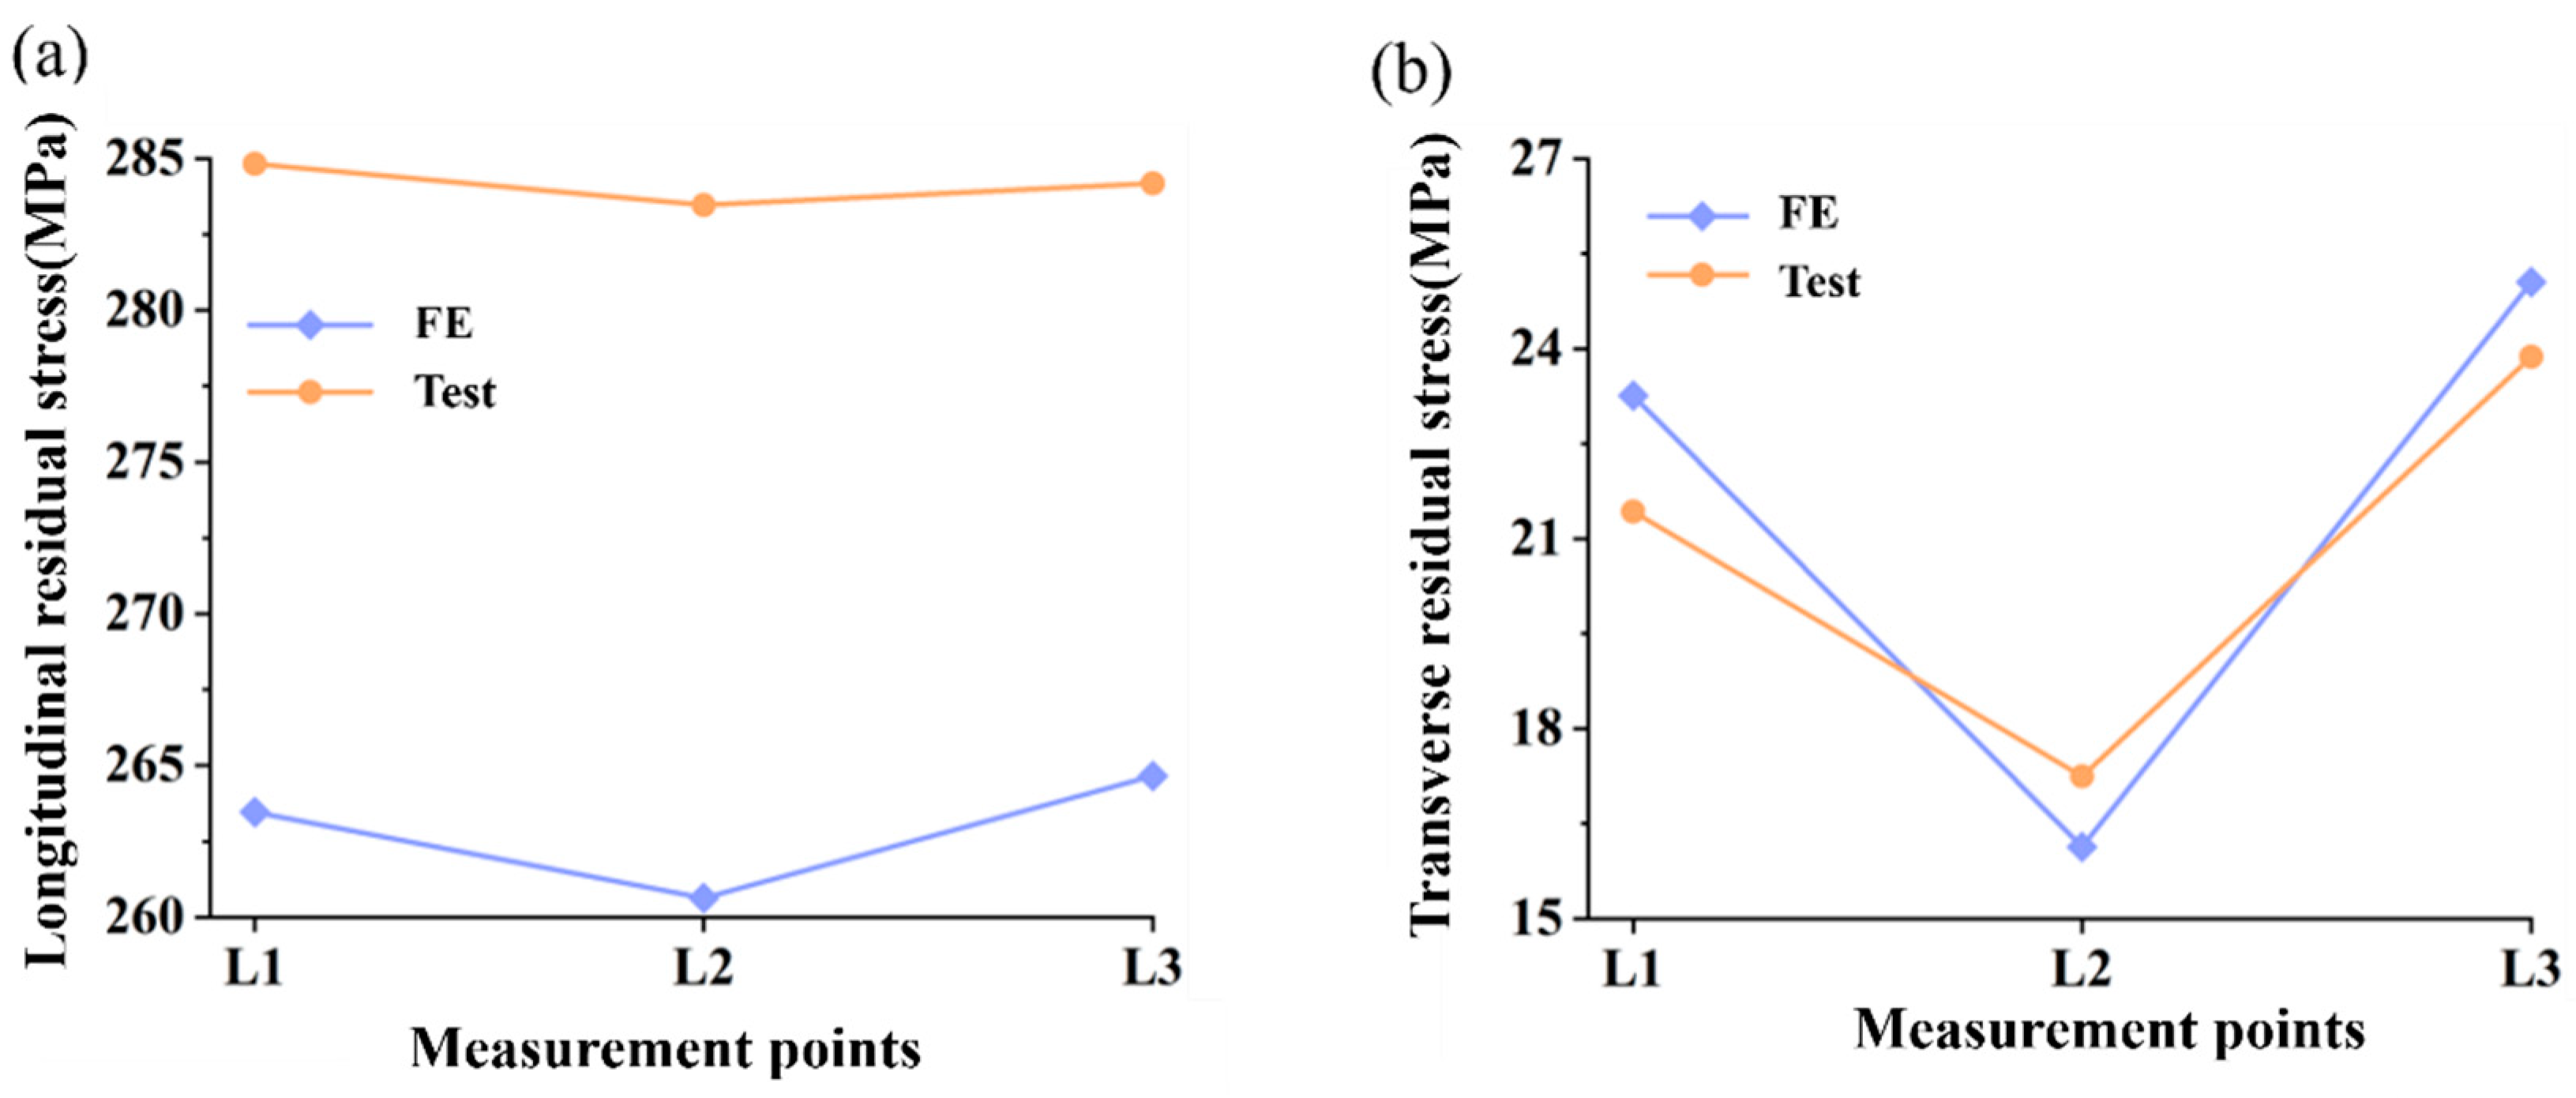
The numerical simulation of the fused region morphology for the equivalent sample closely matches the experimental results, with an average deformation deviation of approximately 16.6%. The numerical results for residual stress show deviations of less than 10% when compared to the experimental data, and both exhibit consistent trends. Additionally, the residual stress distribution around the weld in the stable welding sections of the equivalent model is similar to that of the shell’s welding residual stress distribution.

Author Contributions

Y.Z., Conceptualization, Methodology, Software, Investigation, Formal Analysis, Writing—Original Draft, Funding Acquisition; L.Z., Data Curation, Writing—Original Draft, Writing—Review and Editing, and Software; A.S., Visualization, Investigation, Validation, and Writing—Review and Editing; L.W., Conceptualization, Resources, Supervision, and Writing—Review and Editing; X.Z., Methodology, Visualization, Resources, and Writing—Review and Editing. All authors have read and agreed to the published version of the manuscript.

Funding

This work was supported by the National Natural Science Foundation of China (grant number: 52271277) and the Natural Science Foundation of Jiangsu Province (grant no. BK20211343). We have received these grants to cover publication costs.

Institutional Review Board Statement

Not applicable.

Informed Consent Statement

Not applicable.

Data Availability Statement

The raw data supporting the conclusions of this article will be made available by the authors upon request.

Conflicts of Interest

We declare that we have no financial and personal relationships with other people or organizations that can inappropriately influence our work; there is no professional or other personal interest of any nature or kind in any product, service, and/or company that could be construed as influencing the position presented in, or the review of, the manuscript entitled.

References

  1. Hauber, M.E. The Book of Eggs: A Life-Size Guide to the Eggs of Six Hundred of the World’s Bird Species; University of Chicago Press: Chicago, IL, USA, 2014; ISBN 978-0-226-05781-1. [Google Scholar]
  2. Imran, M.; Shi, D.; Tong, L.; Waqas, H.M.; Uddin, M. Design Optimization of Composite Egg-Shaped Submersible Pressure Hull for Minimum Buoyancy Factor. Def. Technol. 2021, 17, 1817–1832. [Google Scholar] [CrossRef]
  3. Zhang, J.; Tan, J.; Tang, W.; Zhao, X.; Zhu, Y. Experimental and Numerical Collapse Properties of Externally Pressurized Egg-Shaped Shells under Local Geometrical Imperfections. Int. J. Press. Vessel. Pip. 2019, 175, 103893. [Google Scholar] [CrossRef]
  4. Zhang, J.; Wang, M.; Wang, W.; Tang, W. Buckling of Egg-Shaped Shells Subjected to External Pressure. Thin-Walled Struct. 2017, 113, 122–128. [Google Scholar] [CrossRef]
  5. Yuan, S.J.; Teng, B.G.; Dong, X.Y.; Wang, R.W. Progress in Large Vessel Forming: Introduction of Some Innovations of Prof. Z.R. Wang. J. Mater. Process. Technol. 2004, 151, 12–17. [Google Scholar] [CrossRef]
  6. Zhang, J.; Dai, M.; Wang, F.; Tang, W.; Zhao, X.; Zhu, Y. Theoretical and Experimental Study of the Free Hydroforming of Egg-Shaped Shell. Ships Offshore Struct. 2022, 17, 257–267. [Google Scholar] [CrossRef]
  7. Barsoum, Z.; Barsoum, I. Residual Stress Effects on Fatigue Life of Welded Structures Using LEFM. Eng. Fail. Anal. 2009, 16, 449–467. [Google Scholar] [CrossRef]
  8. Cui, C.; Zhang, Q.; Bao, Y.; Bu, Y.; Luo, Y. Fatigue Life Evaluation of Welded Joints in Steel Bridge Considering Residual Stress. J. Constr. Steel Res. 2019, 153, 509–518. [Google Scholar] [CrossRef]
  9. Jiang, W.; Xie, X.; Wang, T.; Zhang, X.; Tu, S.-T.; Wang, J.; Zhao, X. Fatigue Life Prediction of 316L Stainless Steel Weld Joint Including the Role of Residual Stress and Its Evolution: Experimental and Modelling. Int. J. Fatigue 2021, 143, 105997. [Google Scholar] [CrossRef]
  10. Ngoula, D.T.; Beie, H.T.; Vormwald, M. Fatigue Crack Growth in Cruciform Welded Joints: Influence of Residual Stresses and of the Weld Toe Geometry. Int. J. Fatigue 2017, 101, 253–262. [Google Scholar] [CrossRef]
  11. Deng, D. FEM Prediction of Welding Residual Stress and Distortion in Carbon Steel Considering Phase Transformation Effects. Mater. Des. 2009, 30, 359–366. [Google Scholar] [CrossRef]
  12. Li, L.; Bao, H.; Wan, Z.; Li, Y.; Sun, K.; Luo, G. Influence of Residual Stress Due to the Equatorial Weld on the Ultimate Strength of a Ti80 Spherical Pressure Shell. Int. J. Adv. Manuf. Technol. 2021, 116, 1831–1841. [Google Scholar] [CrossRef]
  13. Lu, W.-L.; Sun, J.-L.; Su, H.; Chen, L.-J.; Zhou, Y.-Z. Experimental Research and Numerical Analysis of Welding Residual Stress of Butt Welded Joint of Thick Steel Plate. Case Stud. Constr. Mater. 2023, 18, e01991. [Google Scholar] [CrossRef]
  14. Wang, B.; Zhou, L.; Du, J.; Cao, Y. Analysis of Residual Stresses in Electron Beam Welding with Filler Wire of Ti62A Alloy. J. Mater. Res. Technol. 2023, 23, 985–997. [Google Scholar] [CrossRef]
  15. Yu, D.; Yang, C.; Sun, Q.; Dai, L.; Wang, A.; Xuan, H. Impact of Process Parameters on Temperature and Residual Stress Distribution of X80 Pipe Girth Welds. Int. J. Press. Vessel. Pip. 2023, 203, 104939. [Google Scholar] [CrossRef]
  16. Wang, J.; Chen, X.; Niu, Y.; Du, S.; Shen, C. Investigation on Welding Residual Stress and Vibration Characteristics of Ring-Stiffened Cylindrical Shell. Chin. J. Ship Res. 2023, 18, 208–215. [Google Scholar] [CrossRef]
  17. Yuelai, Z.; Zhangzhu, P.; Maochun, C.; Long, H.U.; Guochang, P.N.; Bo, X.U. Numerical simulation of residual stress in complex aluminum alloy welded structure. HJXB 2021, 42, 91–96. [Google Scholar] [CrossRef]
  18. Pu, X.; Zhang, C.; Li, S.; Deng, D. Simulating Welding Residual Stress and Deformation in a Multi-Pass Butt-Welded Joint Considering Balance between Computing Time and Prediction Accuracy. Int. J. Adv. Manuf. Technol. 2017, 93, 2215–2226. [Google Scholar] [CrossRef]
  19. GB/T 985.1-2008; Recommended Joint Preparation for Gas Welding, Manual Metal Arc. Standards Press of China: Beijing, China, 2008. Available online: https://www.codeofchina.com/standard/GBT985.1-2008.html (accessed on 30 November 2024).
  20. Dai, M. Study on the Free Hydroforming and Buckling Analysis of Egg-Shaped Pressure Shells. Ph.D. Thesis, Jiangsu University of Science and Technology, Zhenjiang, China, 2021. [Google Scholar]
  21. Nedomova, S.; Severa, L.; Buchar, J. Influence of hen egg shape on egg-shaped shell compressive strength. Int. Agrophysics 2009, 23, 249–256. [Google Scholar]
  22. Sun, J.; Liu, X.; Tong, Y.; Deng, D. A comparative study on welding temperature fields, residual stress distributions and deformations induced by laser beam welding and CO2 gas arc welding. Mater. Des. 2014, 63, 519–530. [Google Scholar] [CrossRef]
  23. Ahn, J.; He, E.; Chen, L.; Wimpory, R.C.; Dear, J.P.; Davies, C.M. Prediction and measurement of residual stresses and distortions in fibre laser welded Ti-6Al-4V considering phase transformation. Mater. Des. 2017, 115, 441–457. [Google Scholar] [CrossRef]
  24. Wang, Y.; Feng, G.; Pu, X.; Deng, D. Influence of welding sequence on residual stress distribution and deformation in Q345 steel H-section butt-welded joint. JMR T 2021, 13, 144–153. [Google Scholar] [CrossRef]
  25. Wang, Y. Investigation and Application on the Analysis Methods of Welding Distortion in Large-Scale and Complex Marine Structures. Ph.D. Thesis, Shanghai Jiao Tong University, Shanghai, China, 2015. [Google Scholar]
  26. Xiong, X.; Lu, M.; Lu, Y. Numerical simulation of longitudinal residual stress distribution in welded T—Section of Q690 high strength steel. J. Taiyuan Univ. Technol. 2023, 54, 107–116. [Google Scholar]
  27. Yang, J.; Li, Y.; Peng, Y. Numerical analysis on welding residual stress in Q690 high—Strength steel pipe. Eng. Mech. 2014, 31, 108–115. [Google Scholar] [CrossRef]
  28. Huang, X.; Shi, D. Experiment on Fatigue Behavior of Surface Cracks at Weld Toe under Combination Stresses of Compressing and Bending. J. Ship Mech. 2002, 6, 37–43. [Google Scholar]
  29. Shajan, N.; Kumar, R.; Manik, R.; Asati, B.; Dhagde, S.; Dhangi, D.; Kumar, S.; Mohan Mahapartra, M.; Singh Arora, K. Role of residual stress in the failure of HF-ERW welded tubes. Eng. Fail. Anal. 2024, 161, 108342. [Google Scholar] [CrossRef]
Figure 1. Segmented egg-shaped pressure shell.
Jmse 13 00578 g001
Figure 2. FE model of egg-shaped pressure shell.
Jmse 13 00578 g002
Figure 3. Circumferential residual stress distribution on the outer surface.
Jmse 13 00578 g003
Figure 4. Circumferential residual stress contour of weld 6.
Jmse 13 00578 g004
Figure 5. Axial residual stress distribution on the outer surface: (a) distribution contour map and (b) numerical representation of axial residual stress along the centerline.
Jmse 13 00578 g005
Figure 6. Circumferential residual stress distribution on the inner surface.
Jmse 13 00578 g006
Figure 7. Circumferential residual stress distribution on the inner surface of weld 6.
Jmse 13 00578 g007
Figure 8. Axial residual stress distribution on the inner surface.
Jmse 13 00578 g008
Figure 9. Axial residual stress distribution in weld 6.
Jmse 13 00578 g009
Figure 10. Welding specimen: (a) size of welding specimen and (b) specimen marking.
Jmse 13 00578 g010
Figure 11. Recording procedure of DIC.
Jmse 13 00578 g011
Figure 12. Finite element model and constraint conditions.
Jmse 13 00578 g012
Figure 13. Temperature-cycling curve of weld cross-section.
Jmse 13 00578 g013
Figure 14. Fusion line comparison: (a) experiment fusion line and (b) FE fusion line.
Jmse 13 00578 g014
Figure 15. Longitudinal direction deformation of the first welding layer: (a) longitudinal direction deformation and (b) ratio of experimental results to numerical results.
Jmse 13 00578 g015
Figure 16. Longitudinal Direction Deformation of the Second Welding Layer: (a) Longitudinal Direction Deformation; (b) Ratio of Experimental Results to Numerical Results.
Jmse 13 00578 g016
Figure 17. Longitudinal direction deformation of the third welding layer: (a) longitudinal direction deformation and (b) ratio of experimental results to numerical results.
Jmse 13 00578 g017
Figure 18. Transverse direction deformation of the first welding layer: (a) transverse direction deformation and (b) ratio of experimental results to numerical results.
Jmse 13 00578 g018
Figure 19. Transverse direction deformation of the second welding layer: (a) transverse direction deformation and (b) ratio of experimental results to numerical results.
Jmse 13 00578 g019
Figure 20. Transverse direction deformation of the third welding layer: (a) transverse direction deformation and (b) ratio of experimental results to numerical results.
Jmse 13 00578 g020
Figure 21. Thickness Direction Deformation of the First Welding Layer: (a) Thickness Direction Deformation; (b) Ratio of Experimental Results to Numerical Results.
Jmse 13 00578 g021
Figure 22. Thickness direction deformation of the second welding layer: (a) thickness direction deformation and (b) ratio of experimental results to numerical results.
Jmse 13 00578 g022
Figure 23. Thickness direction deformation of the third welding layer: (a) thickness direction deformation and (b) ratio of experimental results to numerical results.
Jmse 13 00578 g023
Figure 24. Welding residual stress: (a) longitudinal and (b) transverse.
Jmse 13 00578 g024
Table 1. Geometric parameters of egg-shaped pressure shell.
ParametersValue
Major axis, L (mm)2561
Minor axis, B (mm)1767
Egg-shaped coefficient, SI0.69
Thickness, t (mm)10
Table 2. Major and minor of each cone.
Segment123456
Major (mm)95.7227.5425.3689.01018.61414.1
Minor (mm)221.6387.7561.4719.1837.4886.2
Segment789101112
Major (mm)1735.12002.52216.52376.92483.92537.4
Minor (mm)851.8761.5630.5470.3290.3100.0
Table 3. High-temperature properties of AH36 steel.
Temperature,
T (°C)
Expansion Coefficient,
α (10−5/K)
Yield Strength,
σs (MPa)
Elastic Modulus,
E (GPa)
Poisson’s Ratio,
Ν
Density,
ρ
(g/cm3)
Specific Heat, C (J·kg−1·K−1)Conductivity,
λ (W·m−1·K−1)
201.672652000.297.8046515.0
1001.702371900.307.7950015.1
3001.831701680.317.7551218.0
5001.951421570.327.6554620.4
7002.001221510.337.5758922.9
9002.02681200.337.5061525.5
11002.0336760.337.4764729.5
13002.1017200.347.3569733.0
15002.138100.397.3370432.0
Table 4. Welding parameters.
WeldVoltage (V)Current (A)Thermal EfficiencyWelding Speed (mm/s)Heat Input (J/mm)
118800.85230.4
2211100.85369.6
3231300.85478.4
Table 5. Ratio between experiment and FE.
DirectionsUth-test/Uth-FEAverage
LongitudinalFirst layer1.001–1.2001.144
Second layer1.115–1.2001.181
Third layer1.109–1.2001.180
TransverseFirst layer1.073–1.1991.160
Second layer1.107–1.1991.175
Third layer1.068–1.1991.170
ThicknessFirst layer1.093–1.2001.161
Second layer1.060–1.1981.158
Third layer1.046–1.1991.156
Table 6. Welding residual stress of each point.
Measurement PointLongitudinalTransverse
Numerical Results
(MPa)
Test Results
(MPa)
RatioNumerical Results
(MPa)
Test Results
(MPa)
Ratio
L1263.5 284.81.0823.3 MPa21.40.92
L2260.6283.51.0916.1 MPa17.21.07
L3264.7284.21.0725.1 MPa23.90.95
Disclaimer/Publisher’s Note: The statements, opinions and data contained in all publications are solely those of the individual author(s) and contributor(s) and not of MDPI and/or the editor(s). MDPI and/or the editor(s) disclaim responsibility for any injury to people or property resulting from any ideas, methods, instructions or products referred to in the content.

