Abstract
The vortex-induced motion response of semi-submersible platforms can result in fatigue damage to the mooring and riser systems, thereby compromising production safety. Consequently, investigating the characteristics and mechanisms of vortex-induced motion response under complex marine environments holds significant importance in the field of offshore engineering. This study utilizes the SA-DES numerical simulation method to establish a fluid-structure coupling model that simulates the vortex-induced motion of semi-submersible platforms under uniform flow and wave-current interactions, with a focus on key parameters such as response amplitude, frequency, and fluid forces. To ensure the accuracy of the simulations, the numerical model aligns with the physical model tests in terms of dimensions and environmental conditions. The numerical results demonstrate a strong correlation with experimental data under both uniform flow and wave-current coupling conditions, confirming the model’s validity. The results reveal a significant “LOCK-IN” phenomenon occurring within reduced velocity (dimensionless velocity, the ratio of velocity to characteristic length) range of 6 to 8 under uniform flow conditions, with the response amplitude at an incoming flow angle of 45° exceeding that at 0°. In wave-current coupling conditions, the response amplitude is generally lower than that observed under uniform flow, indicating that the presence of waves attenuates the vortex-induced motion. Furthermore, the frequency of the vortex-induced motion is found to be similar to the natural frequency of the platform’s transverse motion, suggesting that the vortex-induced motion may be attributed to a resonance phenomenon induced by pulsating lift force from vortex shedding. These findings validate the effectiveness and accuracy of the SA-DES numerical simulation method in predicting the vortex-induced motion of semi-submersible platform.
1. Introduction
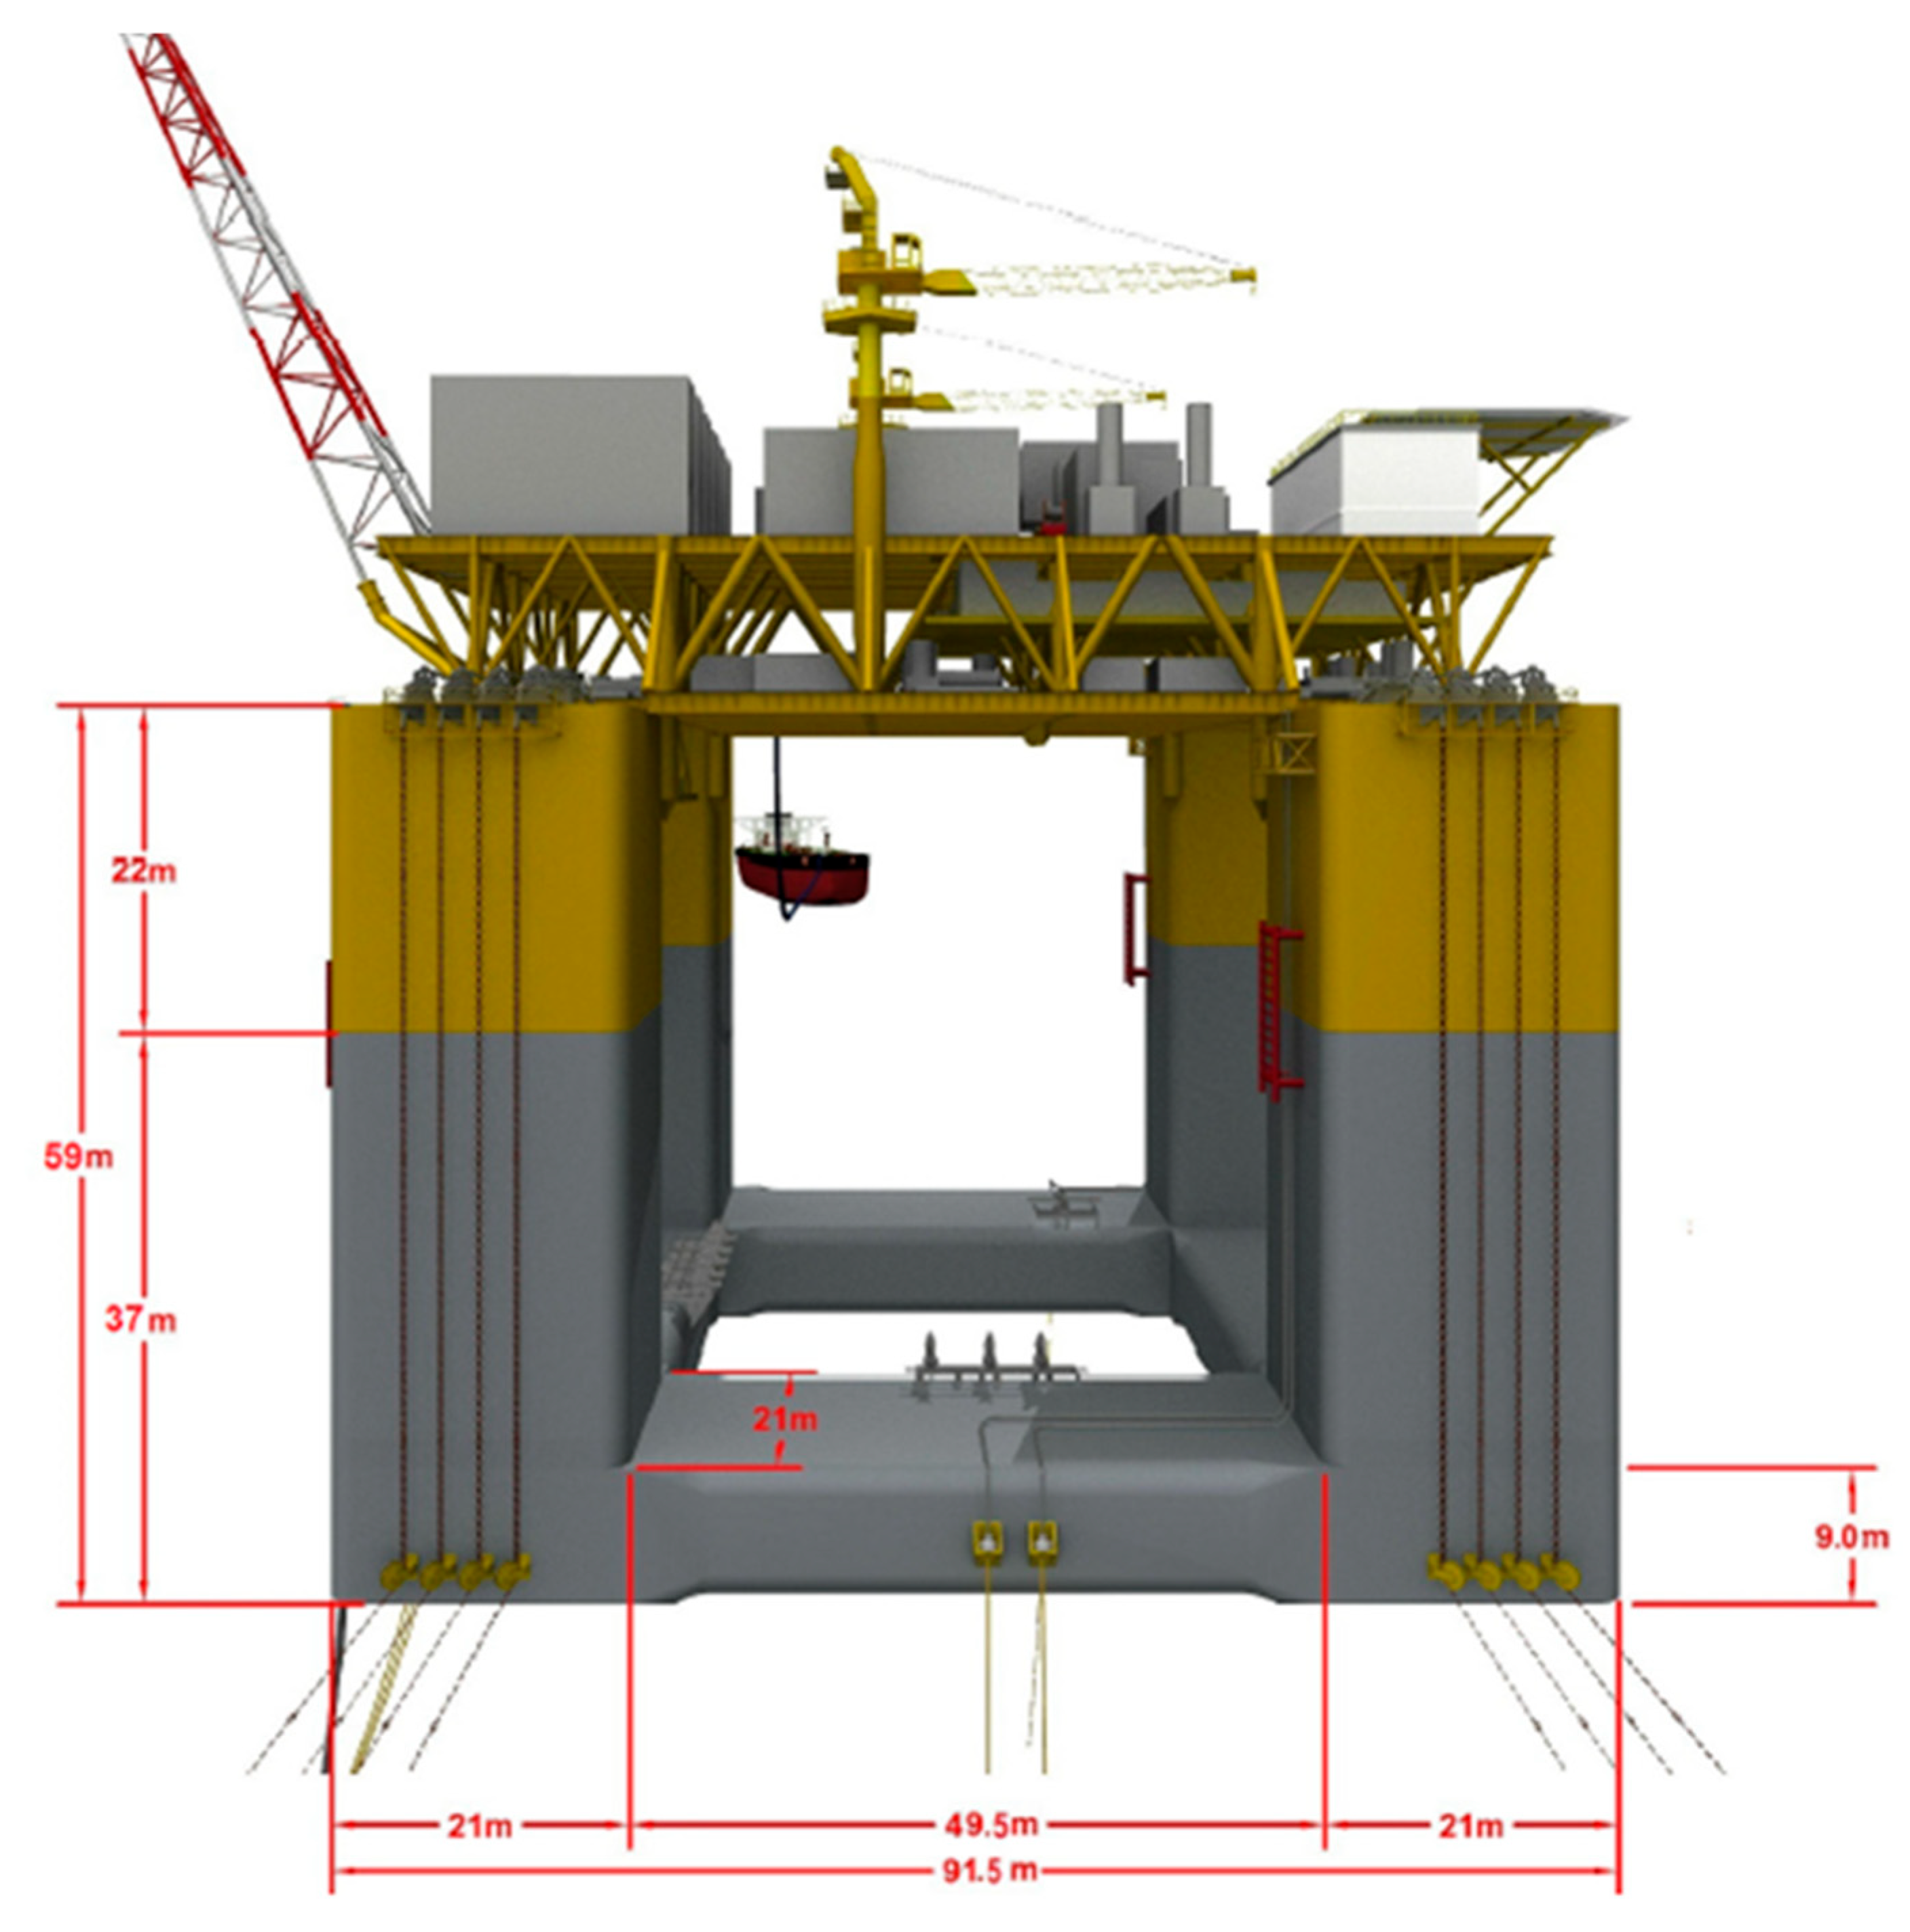
The column type floating platform will be subjected to periodic pulsating fluid forces in a stable flow field, which will generate periodic motion under the action of this excitation force, namely, Vortex-Induced Motion (VIM) phenomenon, which is a self-excited and self-limited response. The “Deep Sea No. 1” (Figure 1), located in the South China Sea, is a deep-draft, semi-submersible production platform. Its vortex-induced motion may cause fatigue damage to mooring lines and risers. The hull is composed of four columns and four buoys. Compared with the simple structure of a single spar platform (SPAR), its complex structural characteristics make it difficult to accurately predict the vortex-induced motion of the platform, requiring the use of model tests and advanced numerical simulation techniques.
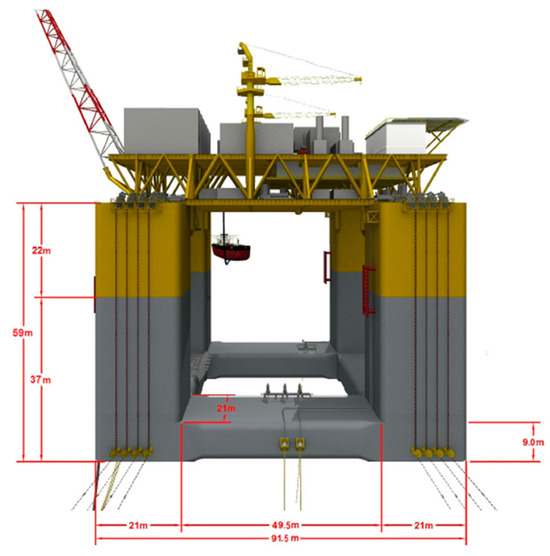
Figure 1.
Main dimensions of “Deep Sea No. 1” semi-submersible platform.
Numerous scholars have conducted model experiments and Computational Fluid Dynamics (CFDs) numerical simulations to investigate the Vortex-Induced Motion (VIM) characteristics of semi-submersible platforms. Waals et al. [1] conducted a comparative analysis of VIM between deep-draft, semi-submersible platforms with dual and quadruple pontoons and conventional semi-submersible platforms through model experiments. Hong et al. [2] performed seakeeping experiments on deep-draft, semi-submersible platforms and found that the amplitude of VIM is not only related to current velocity but also influenced by wave conditions. Gonçalves et al. [3] studied the effects of current incidence angles and appendages on the VIM of deep-draft, semi-submersible platforms via model testing.
Computational Fluid Dynamics (CFDs) is often used to solve the fluid structure coupling of floating bodies and predict the vortex-induced motion [4,5,6]. The numerical simulation method has the advantages of convenient parameter adjustment and low cost and has gradually become an important research tool outside of model tests. The common CFDs numerical models mainly include Discrete Vortex Method (DVM) [7,8], Reynolds-Averaged Navier–Stokes (RANS) [9,10], Large-Eddy Simulation Method (LES) [11,12], Detached-Eddy Simulation (DES), and Direct Simulation Method.
The Discrete Vortex Method (DVM) is adept at capturing vortex structures in flow and is particularly suitable for simulating turbulent or high-strain flows with significant vortices [13]. Kumar et al. [14] used the Discrete Vortex Method (DVM) to study the aerodynamic performance and flow mechanism of a three-dimensional flapping wing, and analyzed the aerodynamic performance of the wing under different motion modes through numerical simulations. Oliveira et al. [15] used a hybrid control technique of vortex shedding to implement the discrete vortex method in order to solve the two-dimensional flow problem through a slightly rough cylinder near a moving wall. Faure et al. [16] used the Leading-edge suction parameter Discrete Vortex Method (LDVM) to study the unsteady flow around a biplane arrangement, and analyzed the lift coefficients with different clearances and intersections through numerical simulations. Masdari et al. [17] used the discrete vortex method to model the Savonius wind turbine and developed and validated the unsteady DVM method for the Savonius wind turbine. The Reynolds-Averaged Navier–Stokes method (RANS) effectively reduces computational complexity by averaging turbulence. Carrasco et al. [18] discussed how to accurately predict the interaction between waves and the seabed, as well as the flow patterns around structures, using the RANS model in marine engineering, and proposed an improved model approach. Large- Eddy Simulation (LES) can accurately simulate large-scale turbulent eddies and has a high ability to capture detailed flows such as vortex structures and shedding. Chen et al. [19] used Large Eddy Simulation (LES) to study the tip leakage flow around a hydrofoil. Heinz [20,21] proposed a theoretical framework to improve the limitations of RANS models in simulating complex turbulence by introducing the ability of LES, enabling them to more accurately capture vortex and turbulence characteristics.
Detached-Eddy Simulation (DES) is a hybrid modeling approach that combines the characteristics of Reynolds-Average Navier–Stokes (RANS) and Large-Eddy Simulation (LES). In this method, the RANS model is used to solve the problem in the near-wall region, and the LES model is switched to the LES model in the separated flow region away from the wall. Li et al. [22] proposed an Improved Detached-Eddy Simulation (IDES) method based on a single-equation eddy-viscosity model to improve the resolution of small-scale cavitation flows. Jianxiang et al. [23] used an improved Delayed Detached-Eddy Simulation (DDES) method and a shear-stress transport model to analyze the evolution of the vortex structure, velocity, and pressure field of the swirl jet. Zhai et al. [24] developed a novel turbulence model based on Delayed Detached-Eddy Simulation (DDES) and the Nonlinear Eddy Viscosity Model (NLEVM) to predict complex turbulence. Qian et al. [25] used Modified Delayed Detached-Eddy Simulation (MDDES) to study the wake of wind turbines in complex terrain sites and proposed a hybrid framework to predict the wake effect of wind turbines in real wind farms. He et al. [13] applied the Detached-Eddy Simulation (DES) method to the study of compressor blade tip leakage, and revealed the advantages of the DES method in capturing the three-dimensional vortex structure and predicting the flow characteristics through high-precision simulation of complex flows. Mukha et al. [26] built a new open-source library for Wall-Modelled Large-Eddy Simulation (WMLES) based on OpenFOAM, and implemented a set of wall stress models based on algebraic and ordinary differential equations. Ren et al. [27] used OpenFOAM to study the Wall-Modelled Large-Eddy Simulation (WMLES) and Detached-Eddy Simulation (DES) of the wall-detached flow. By comparing the performance of the two methods in the wall-detached flow field, the advantages and disadvantages of the two methods in predicting the characteristics of flow detached and eddy dynamic behavior are analyzed. The results show that WMLES has more advantages in capturing detailed flow characteristics, while DES shows a good balance between computational efficiency and accuracy, which provides an important reference for the simulation of complex detached flows. Zhou et al. [28] used the Detached-Eddy Simulation (DES) method to study the characteristics of turbulent flow fields on steep hilly terrain. The simulation results reveal the significant influence of complex terrain on turbulent separation, reattachment, and eddy dynamics, and the results show that the DES method can accurately capture the flow field characteristics on steep terrain, which provides an important reference for evaluating topographic wind energy resources and structural wind loads. Li et al. [29,30] used the Direct Simulation BGK (DSBGK) method to simulate the low-velocity thermal transpiration gas flow through the microchannel, showing that the DSBGK method can effectively simulate the rarefied gas flow of real 3D problems, while the traditional deterministic method based on kinetic theory is expensive.
In the previous investigations, the detached-eddy simulation method is suitable for dealing with flow problems with obvious detached flow regions, especially in complex engineering problems that need to consider both near-wall flow and large-scale structures such as detached eddy [31,32,33]. The Spalart–Allmaras (SA) turbulence model [31] describes the vortex viscosity of turbulent flows by solving a single equation, which is particularly suitable for wall-flow and low-Reynolds-number-flow. In recent years, Xue [34] has made several modifications and extensions to the SA model to improve its adaptability to complex flows. For example, for high Mach numbers and compressibility flows, compressibility corrections (e.g., eddy viscosity corrections in the SA model) have been introduced. In addition, Polewski and Cizmas [35] demonstrated the ability of the turbulent model to simulate separated flow, reattachment, and eddy structures, and to verify the model’s performance near the wall through wall turbulent flow, especially for boundary layer turbulence.
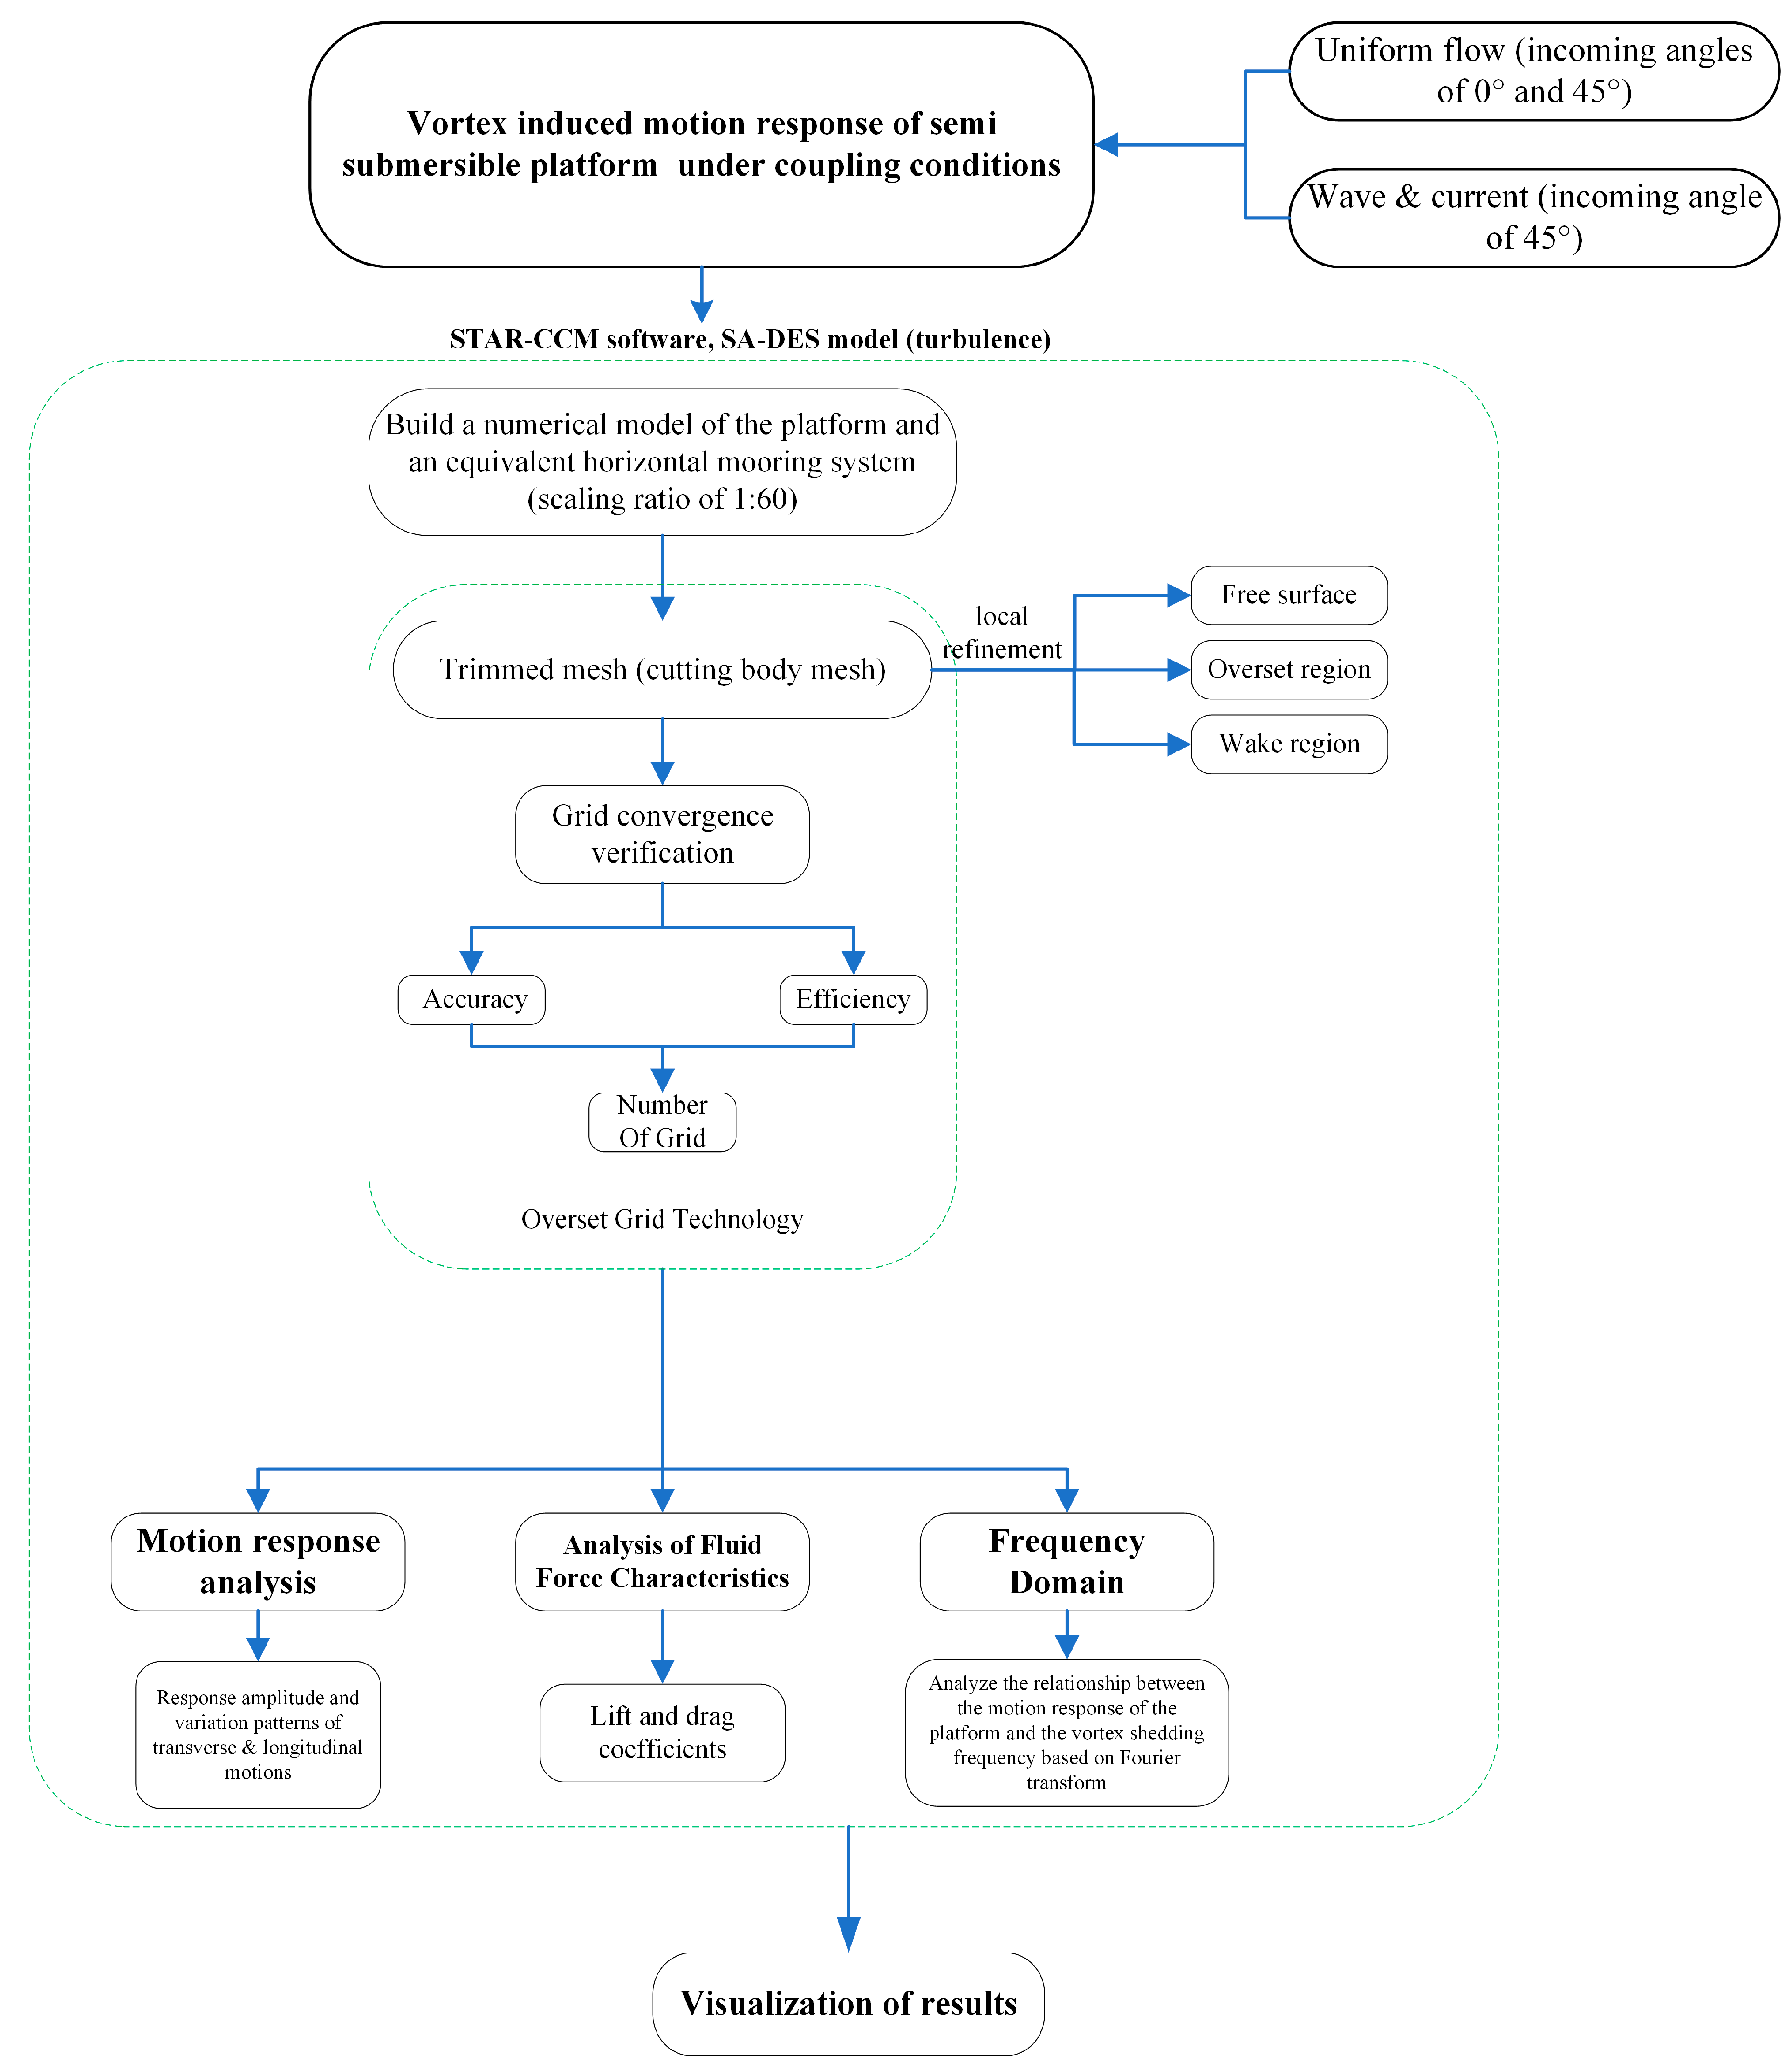
Although some progress has been made in the existing research, the study of vortex-induced motion is not systematic enough, especially the mechanism of motion under complex wave flow conditions. In view of the above, this paper further analyzes the vortex-induced motion characteristics and mechanism of the semi-submersible platform based on numerical model technology. The numerical model adopts the DES method of the SA turbulence model, and the basic idea is to use the Reynolds-Averaged Navier–Stokes method of the SA turbulence model to solve the flow in the boundary layer and the LES to solve the flow outside the boundary layer. In order to verify the reliability of the numerical model, the analysis results were compared with the model test results to achieve good consistency. The technical approach of the research is shown in Figure 2.
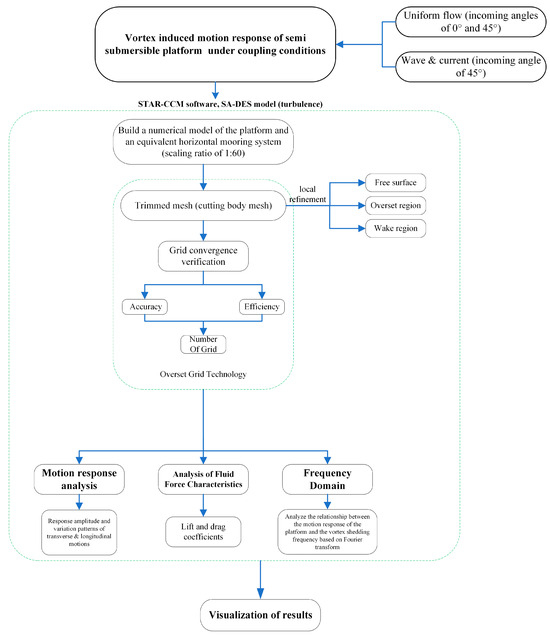
Figure 2.
Technical roadmap.
2. Overview of Platform and Model
“Deep Sea No. 1” is a four-column, semi-submersible platform, with a water depth of about 1500 m, a hull draft of about 37 m, oil and gas production and processing equipment on the upper deck, underwater suspended risers and umbilical cables, and a light mooring system for positioning; the main scale parameters and data are shown in Table 1. The cross-section of the column and the pontoon section is square, and the edges of the columns are rounded, with a radius of 1700 mm.

Table 1.
Main parameters of semi-submersible platform.
In view of the complexity of the platform structure and VIM itself, both physical model tests and a numerical model with a scale ratio of 1:60 were employed in the research. The model test maintains the equality of the Froude number and the Strouhal number between the entity and the model, that is, the gravitational similarity and inertia similarity satisfy the two [36]. It is worth noting that scaling effects induce Reynolds number disparities between the model and prototype, potentially causing deviations in viscous forces and VIM responses. In order to facilitate comparison and verification, the numerical calculation and the model test are consistent in terms of scale and analytical conditions.
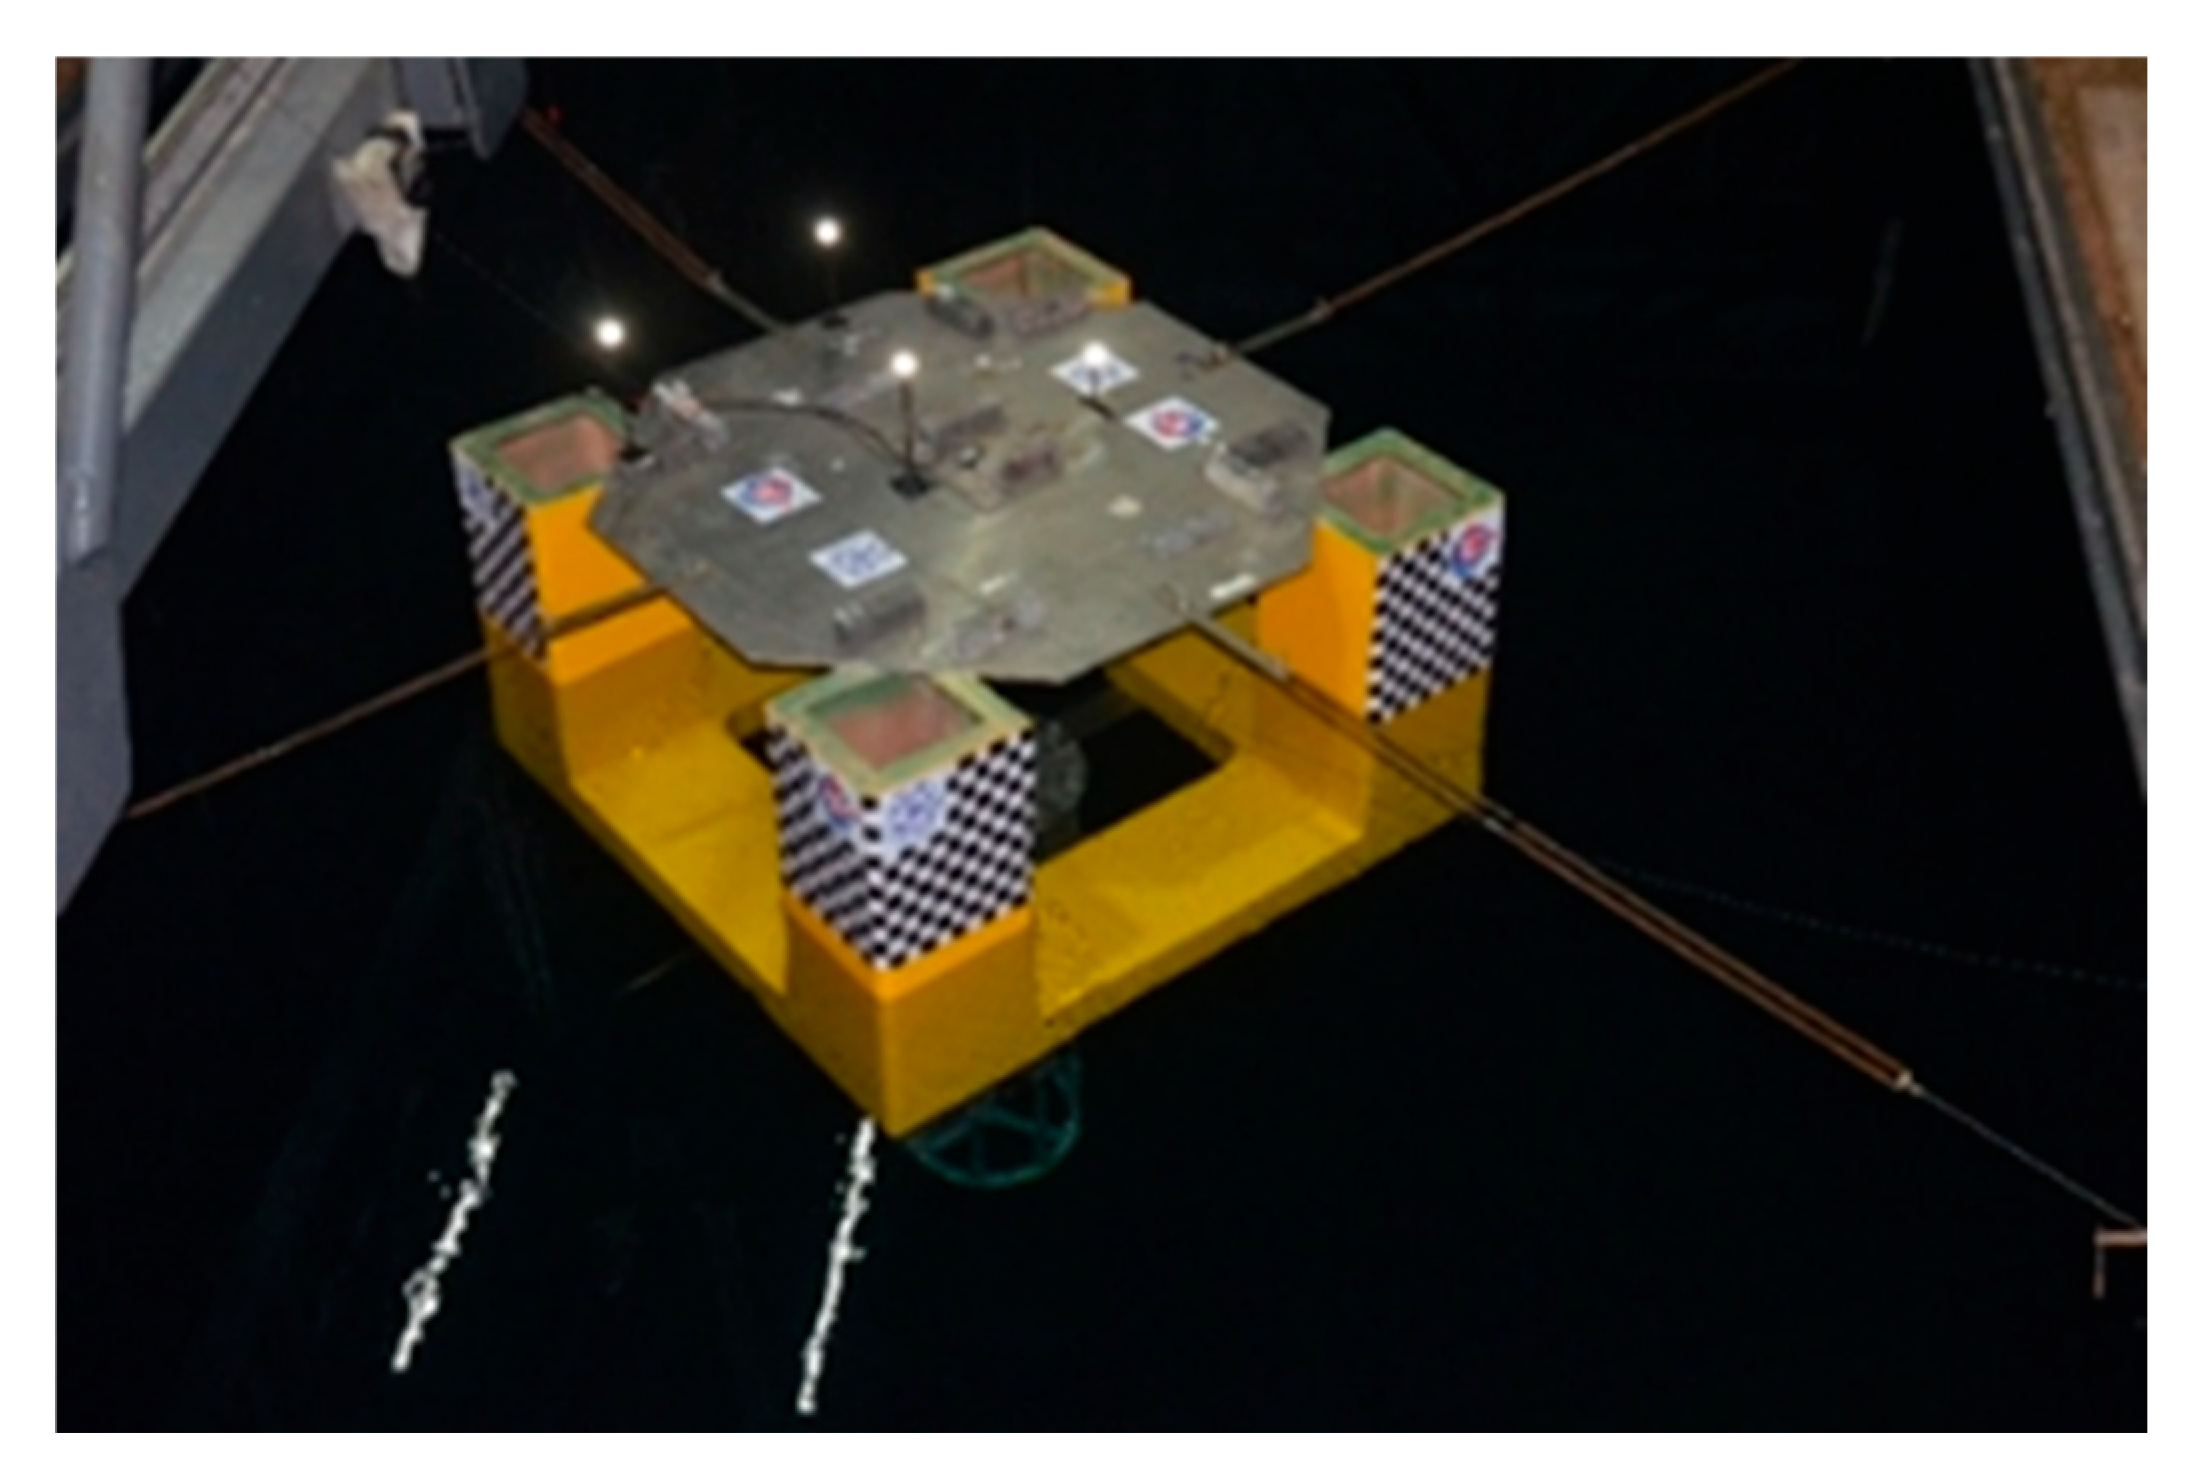
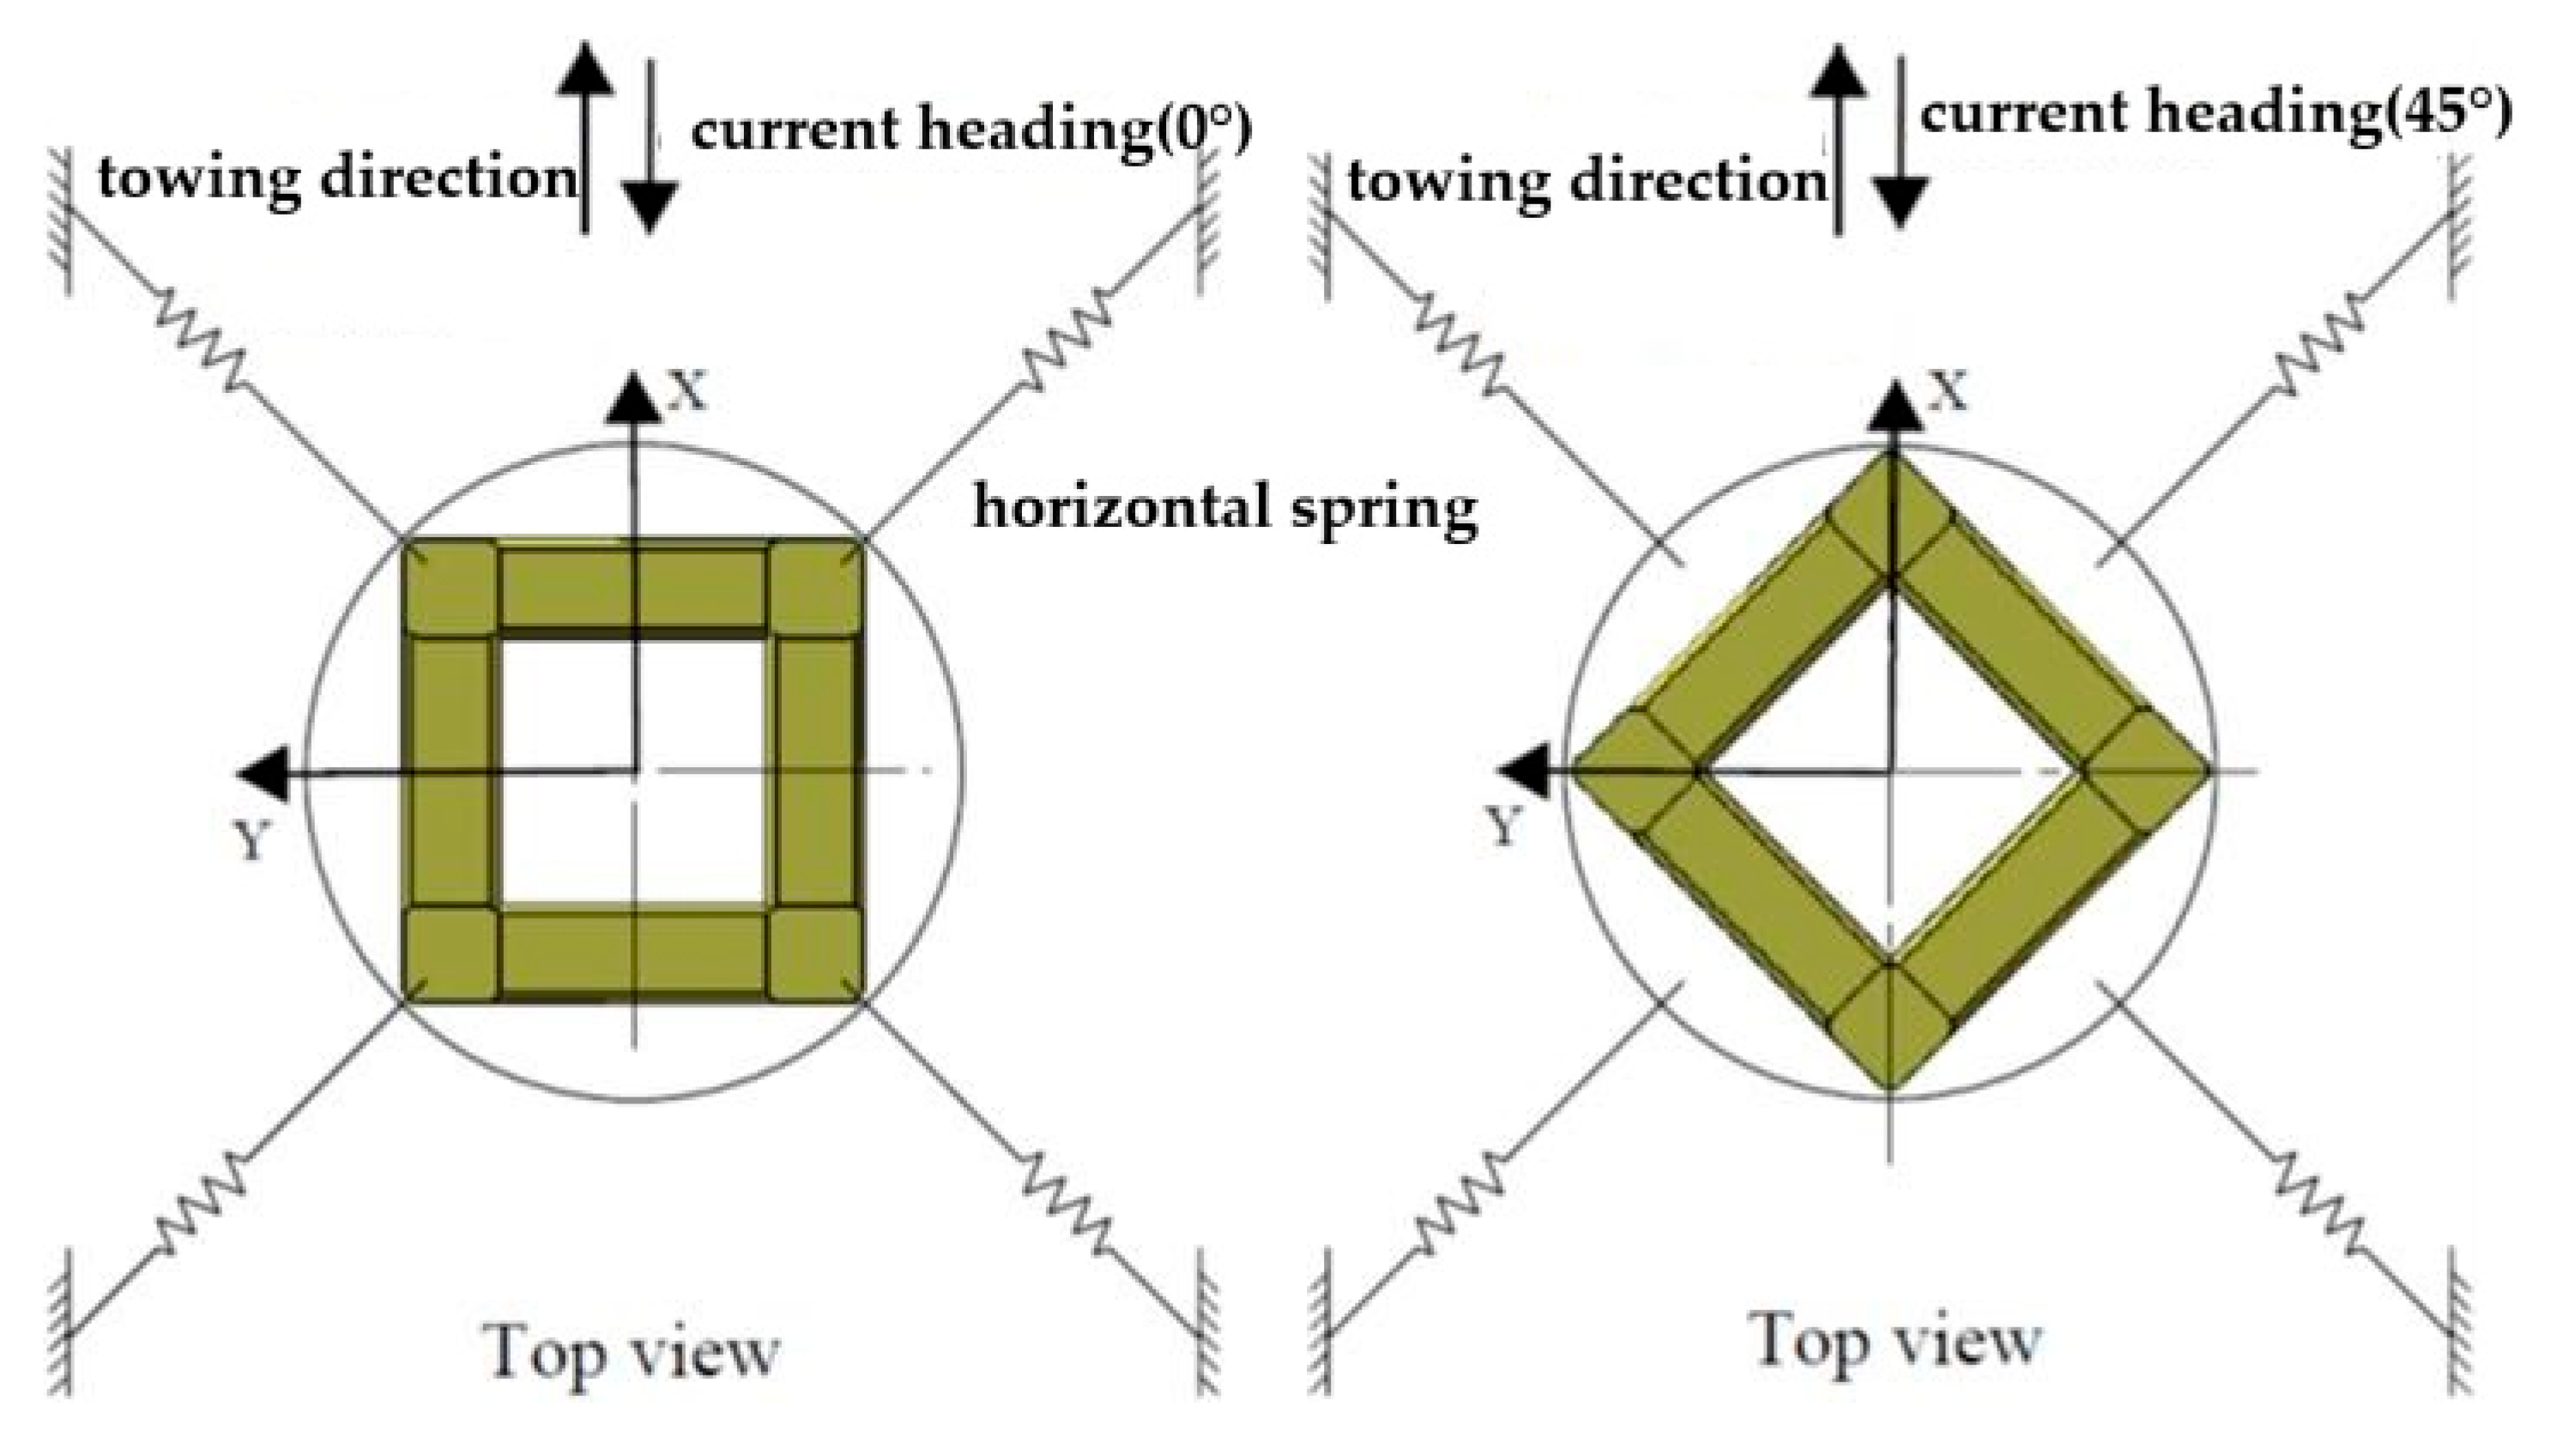
The experimental model (Figure 3) uses an equivalent horizontal mooring system (consisting of four wire ropes and springs) to provide the platform with a horizontal restoring force, so that the natural period of the model’s movement in the horizontal plane is consistent with that of the prototype platform (180 s). The numerical model (Figure 4) also uses an equivalent horizontal mooring stiffness.

Figure 3.
Scaled model of semi-submersible platform.
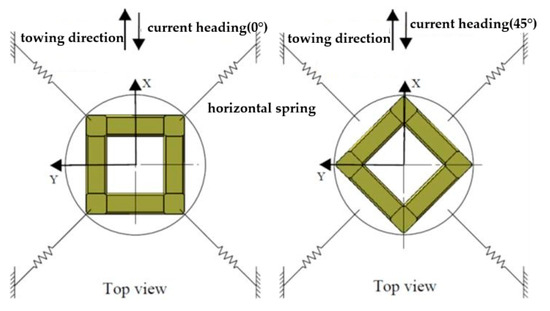
Figure 4.
Equivalent horizontal mooring system arrangement for semi-submersible platform.
3. Numerical Modeling Method
3.1. Numerical Theory
The numerical analysis software adopts the STAR-CCM+ of the CD-adapco company, and the method adopts the DES method of the SA turbulence model, and its basic idea is to use the Reynolds-Averaged Navier–Stokes method of the SA turbulence model to solve the flow in the boundary layer, and the LES to solve the flow outside the boundary layer. The LES method will “filter” the turbulent motion and only introduce the turbulence model for small-scale eddies, and directly perform numerical calculations for large-scale eddies to ensure that the resulting flow field information is more accurate than the RANS method. The governing equations of the large-eddy simulation consist of the continuity equation and the Navier–Stokes unsteady equation processed by the filter function:
where and (i, j = 1, 2, 3) are the directional coordinates of the three-dimensional Cartesian coordinate system; and are the time averaged values of velocity components; t is time; ρ is the fluid density; is the mean pressure on fluid microelements; μ is the dynamic viscosity coefficient of the fluid; is the Reynolds stress; and is subgrid stress, where the constant superscript “ˉ” indicates that the term has been filtered.
The dimensionless form of fluid force is represented by the drag coefficient, , and lift coefficient, , which are defined as follows:
where is the fluid force acting on the platform in the X direction; is the fluid force acting on the platform in the Y direction, measured in N; is the fluid density, measured in kg/m3; and is the projected area of the platform perpendicular to the incoming flow direction, measured in m2.
The amplitude of vortex-induced motion response is usually described by its dimensionless nominal value, i.e.,
where is the mean square deviation of motion .
One of the most important parameters in vortex-induced motion response is the reduced velocity, , which is expressed by:
where U is the incoming flow velocity, measured in m/s; D is the characteristic scale of the structure, which is the diameter of the column in m; and is the natural period of horizontal motion of the platform, measured in s.
The motion equation of a semi-submersible platform under drag and pulsating lift force can be expressed as:
where the constant m is the platform mass, C is the structural damping coefficient, and are the linear spring constants, represents the drag force acting on the platform, and represents the lift force acting on the platform.
In STAR CCM, the DFBI (Dynamic Fluid Body Interaction) model can be used to simulate the interaction between rigid bodies and fluids, analyze the forces and moments acting on rigid bodies, and simulate their motion. Studying the combined effects of waves and uniform flow involves specifying DFBI motion for individual overset grid domains. The basic idea of the overset mesh is to divide a separate overset domain around the structure and connect the overset mesh domain with the entire fluid domain through the overset mesh interface. In order to minimize errors caused by inserting variables between two grids and avoid coupling failures between the background and the overset domain, it is necessary to use the same order of grid density at the interface. When calculating, the grid of the entire computational domain remains unchanged, and the overset grid domain moves with the movement of the structure, providing great flexibility.
3.2. Computational Domain and Boundary Conditions
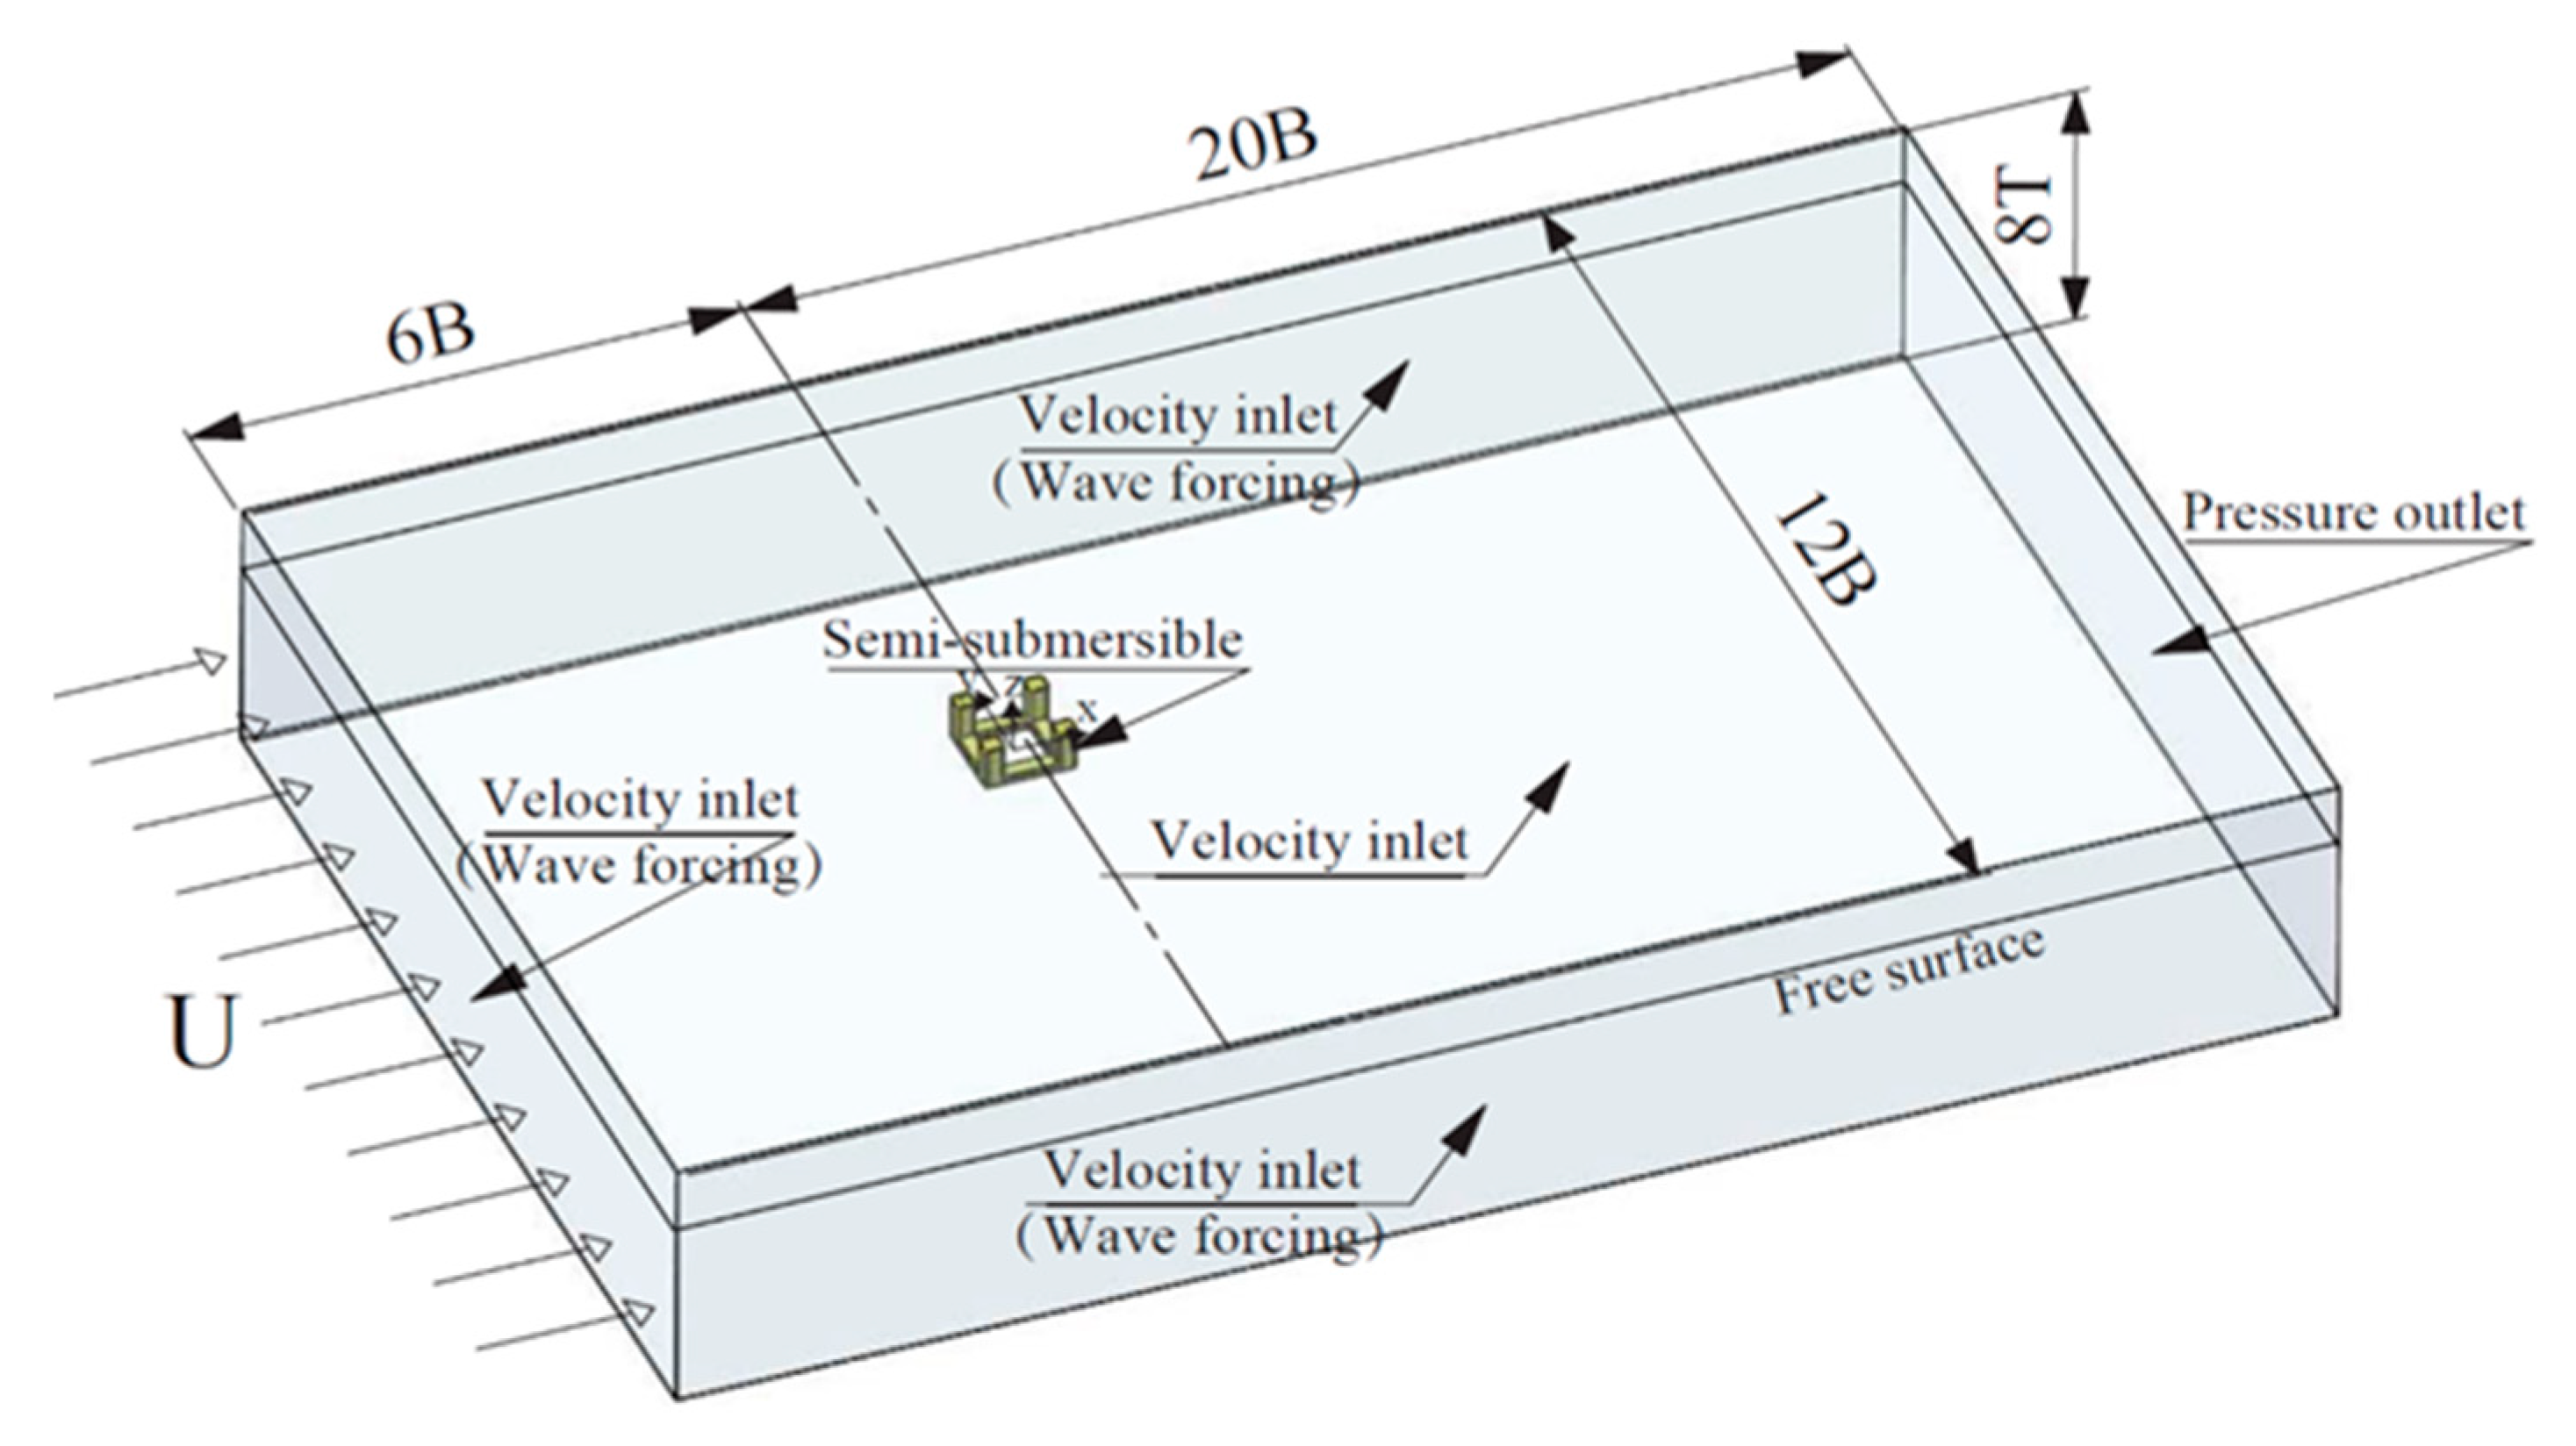
The computational domain of the numerical simulation of the semi-submersible platform is shown in Figure 5. In order to avoid sidewall effects, the entire computational domain is set to be 2.6 B × 12 B × 8 T, where B is the total width of the semi-submersible platform, T is the platform draft, the distance from the velocity inlet to the y-axis of the platform is 6 B, the distance from the pressure outlet to the y-axis is 20 B, and the distance from the platform bottom to the upper boundary of the computational domain is 3 T. The selected computational domain has been expanded based on previous studies by scholars, such as Kim et al.’s (2011) [37] study with a computational domain of 14 B × 12 B × 4.5 T, and Liu Mingyue’s (2016) [38] numerical simulation with a computational domain of 18 B × 12 B × 6 T.
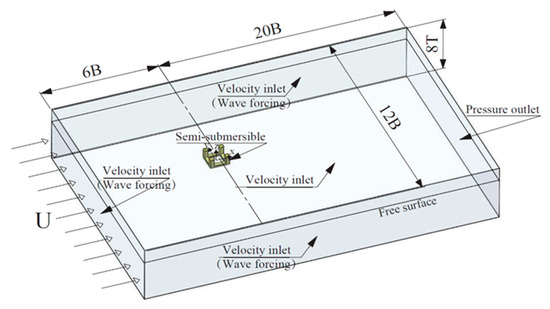
Figure 5.
Schematic diagram of the computational domain and boundary conditions.
There are three main boundary conditions for numerical simulation, as shown in Figure 5, including velocity inlet, pressure outlet, and non-slip wall boundary on the platform surface. On the right side of the incoming flow direction is the pressure outlet, where the normal gradient of the velocity component is 0, and the pressure p is constant. The surface of a semi-submersible platform is a non-slip wall boundary, where fluid cannot pass through the platform surface, i.e., , and the normal gradient of pressure, p, is constant at 0; all other boundaries are velocity imports. In addition, due to the application involving overset grids, there is a special boundary called the overset grid boundary, but no attributes need to be specified for it. In the velocity inlet and pressure outlet regions along the incoming flow direction, VOF (Volume of Fluid Model) waves are subjected to force dissipation, with a wave dissipation region of 1–2 wavelengths.
3.3. Overset Domain Generation and Grid Division
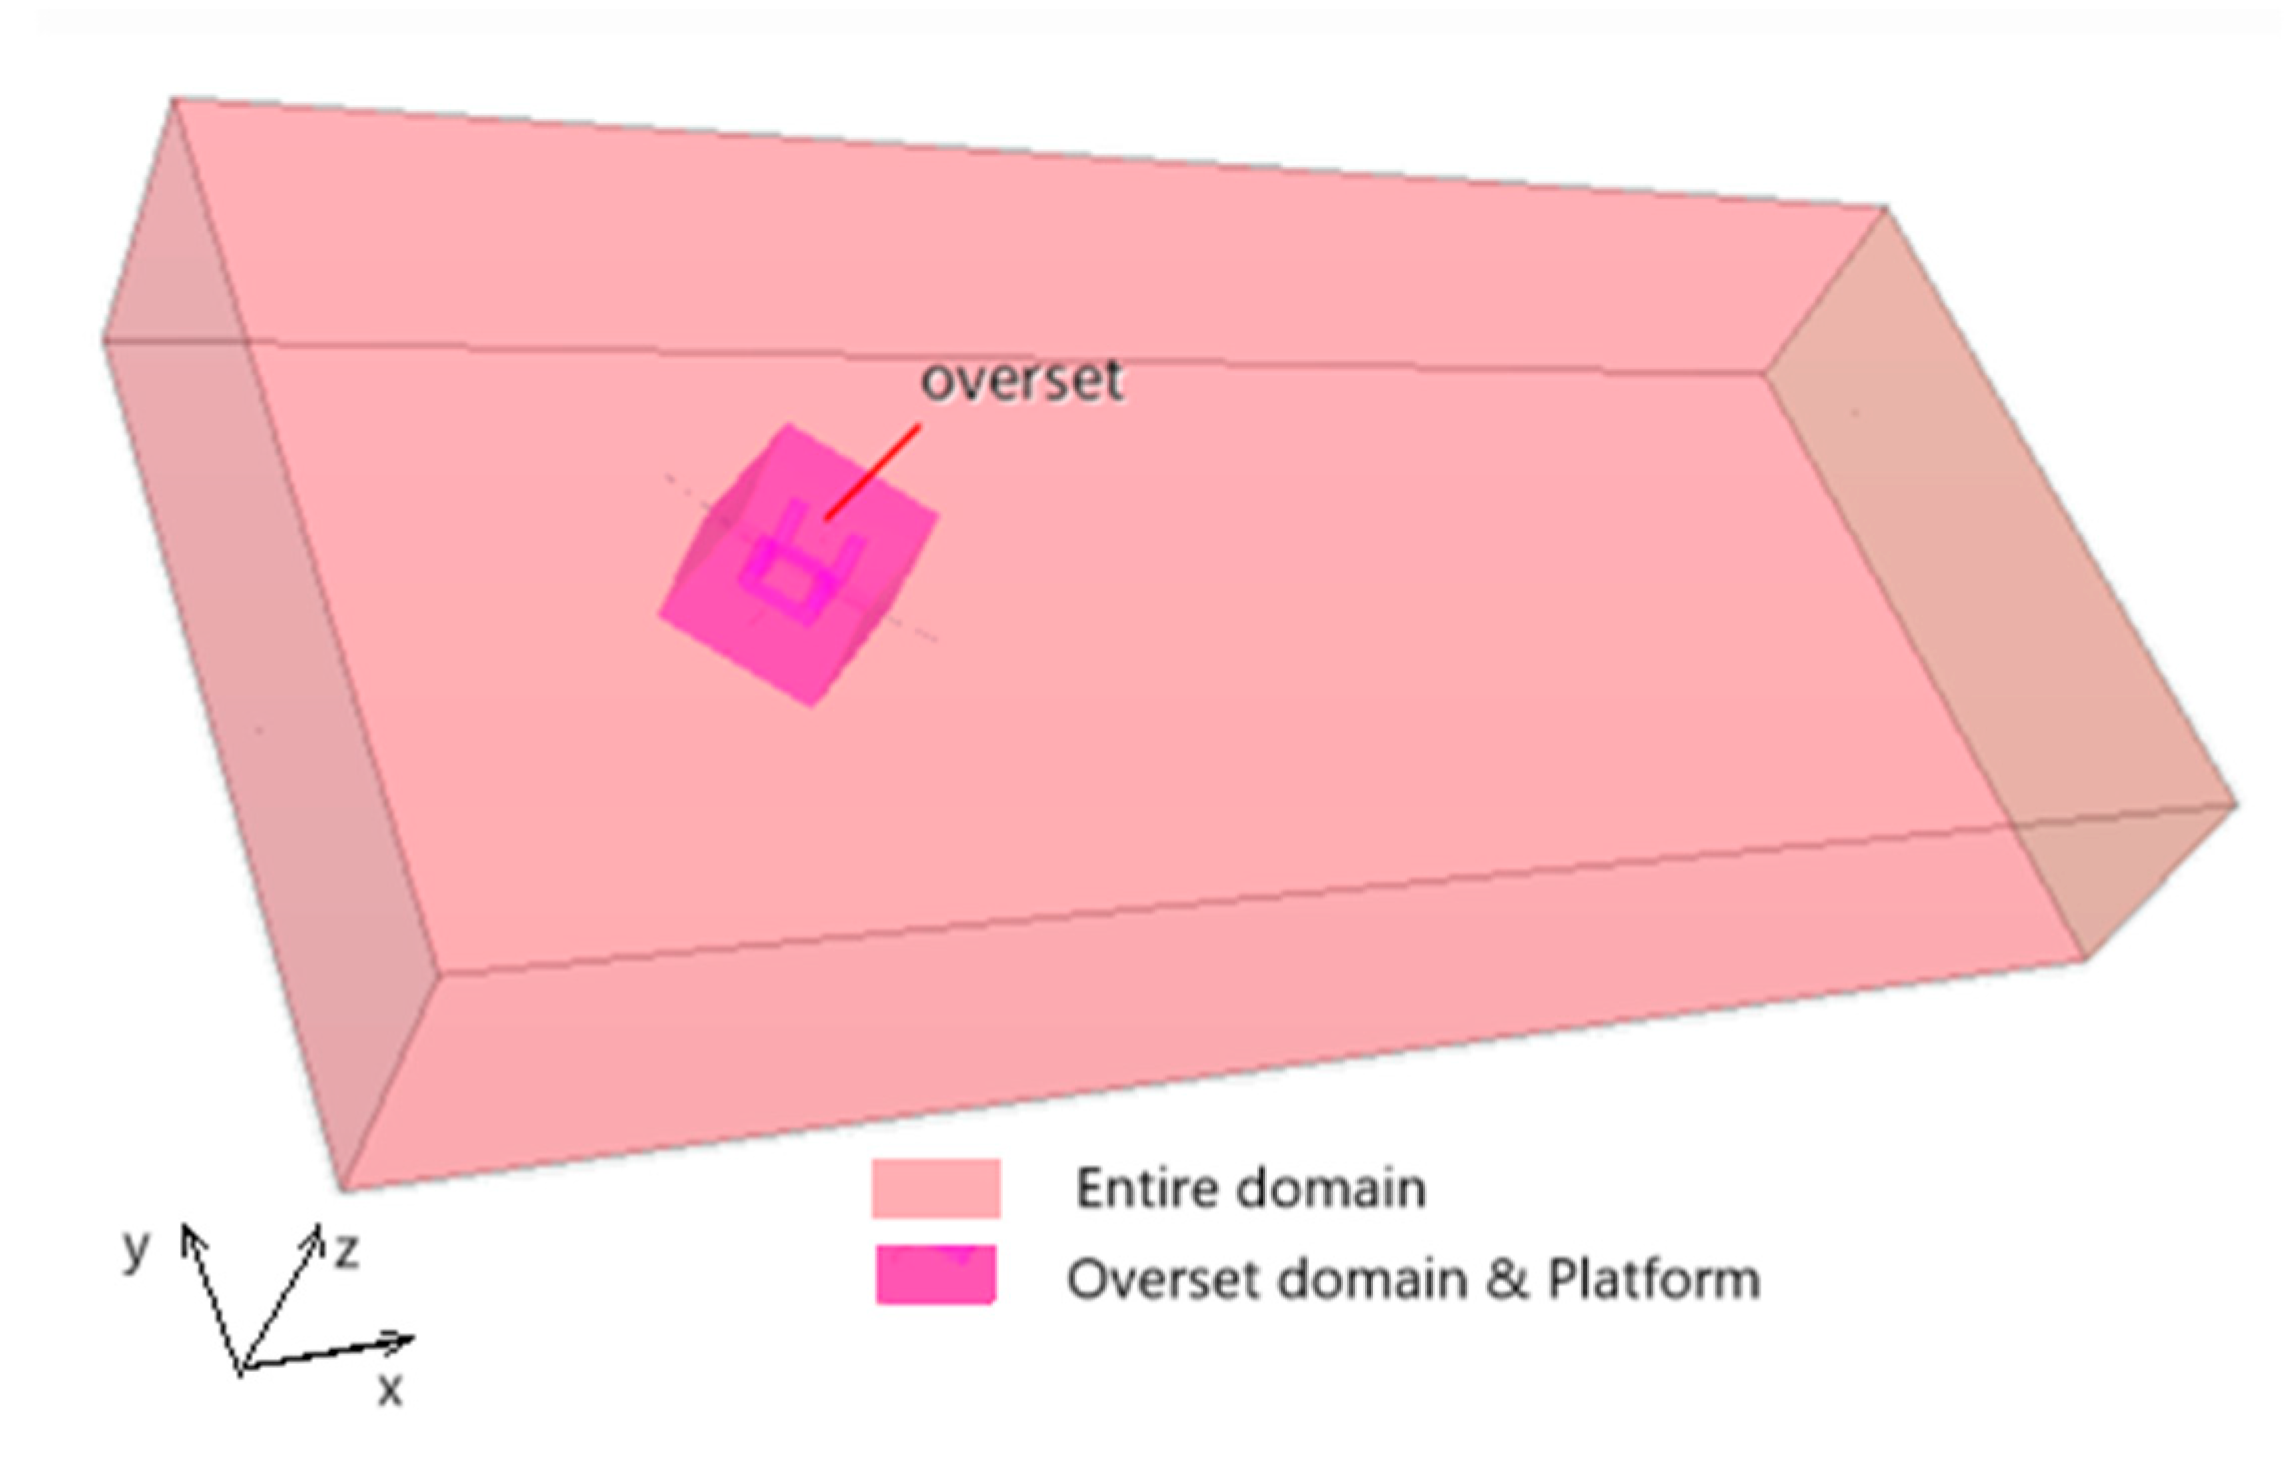
After importing the surface mesh parts into the STAR CCM software, a certain size of overset mesh domain is established near the platform, and then the entire computational domain around the periphery is established. The overset grid domain body and computational domain are assigned to the region, and finally the interface of the overset grid between the two is created, as shown in Figure 6. Subsequently, DFBI motion can be directly assigned to the overset grid domain to set the six degrees of freedom motion of the entire platform.

Figure 6.
Schematic diagram of the overset domain and the entire computational domain.
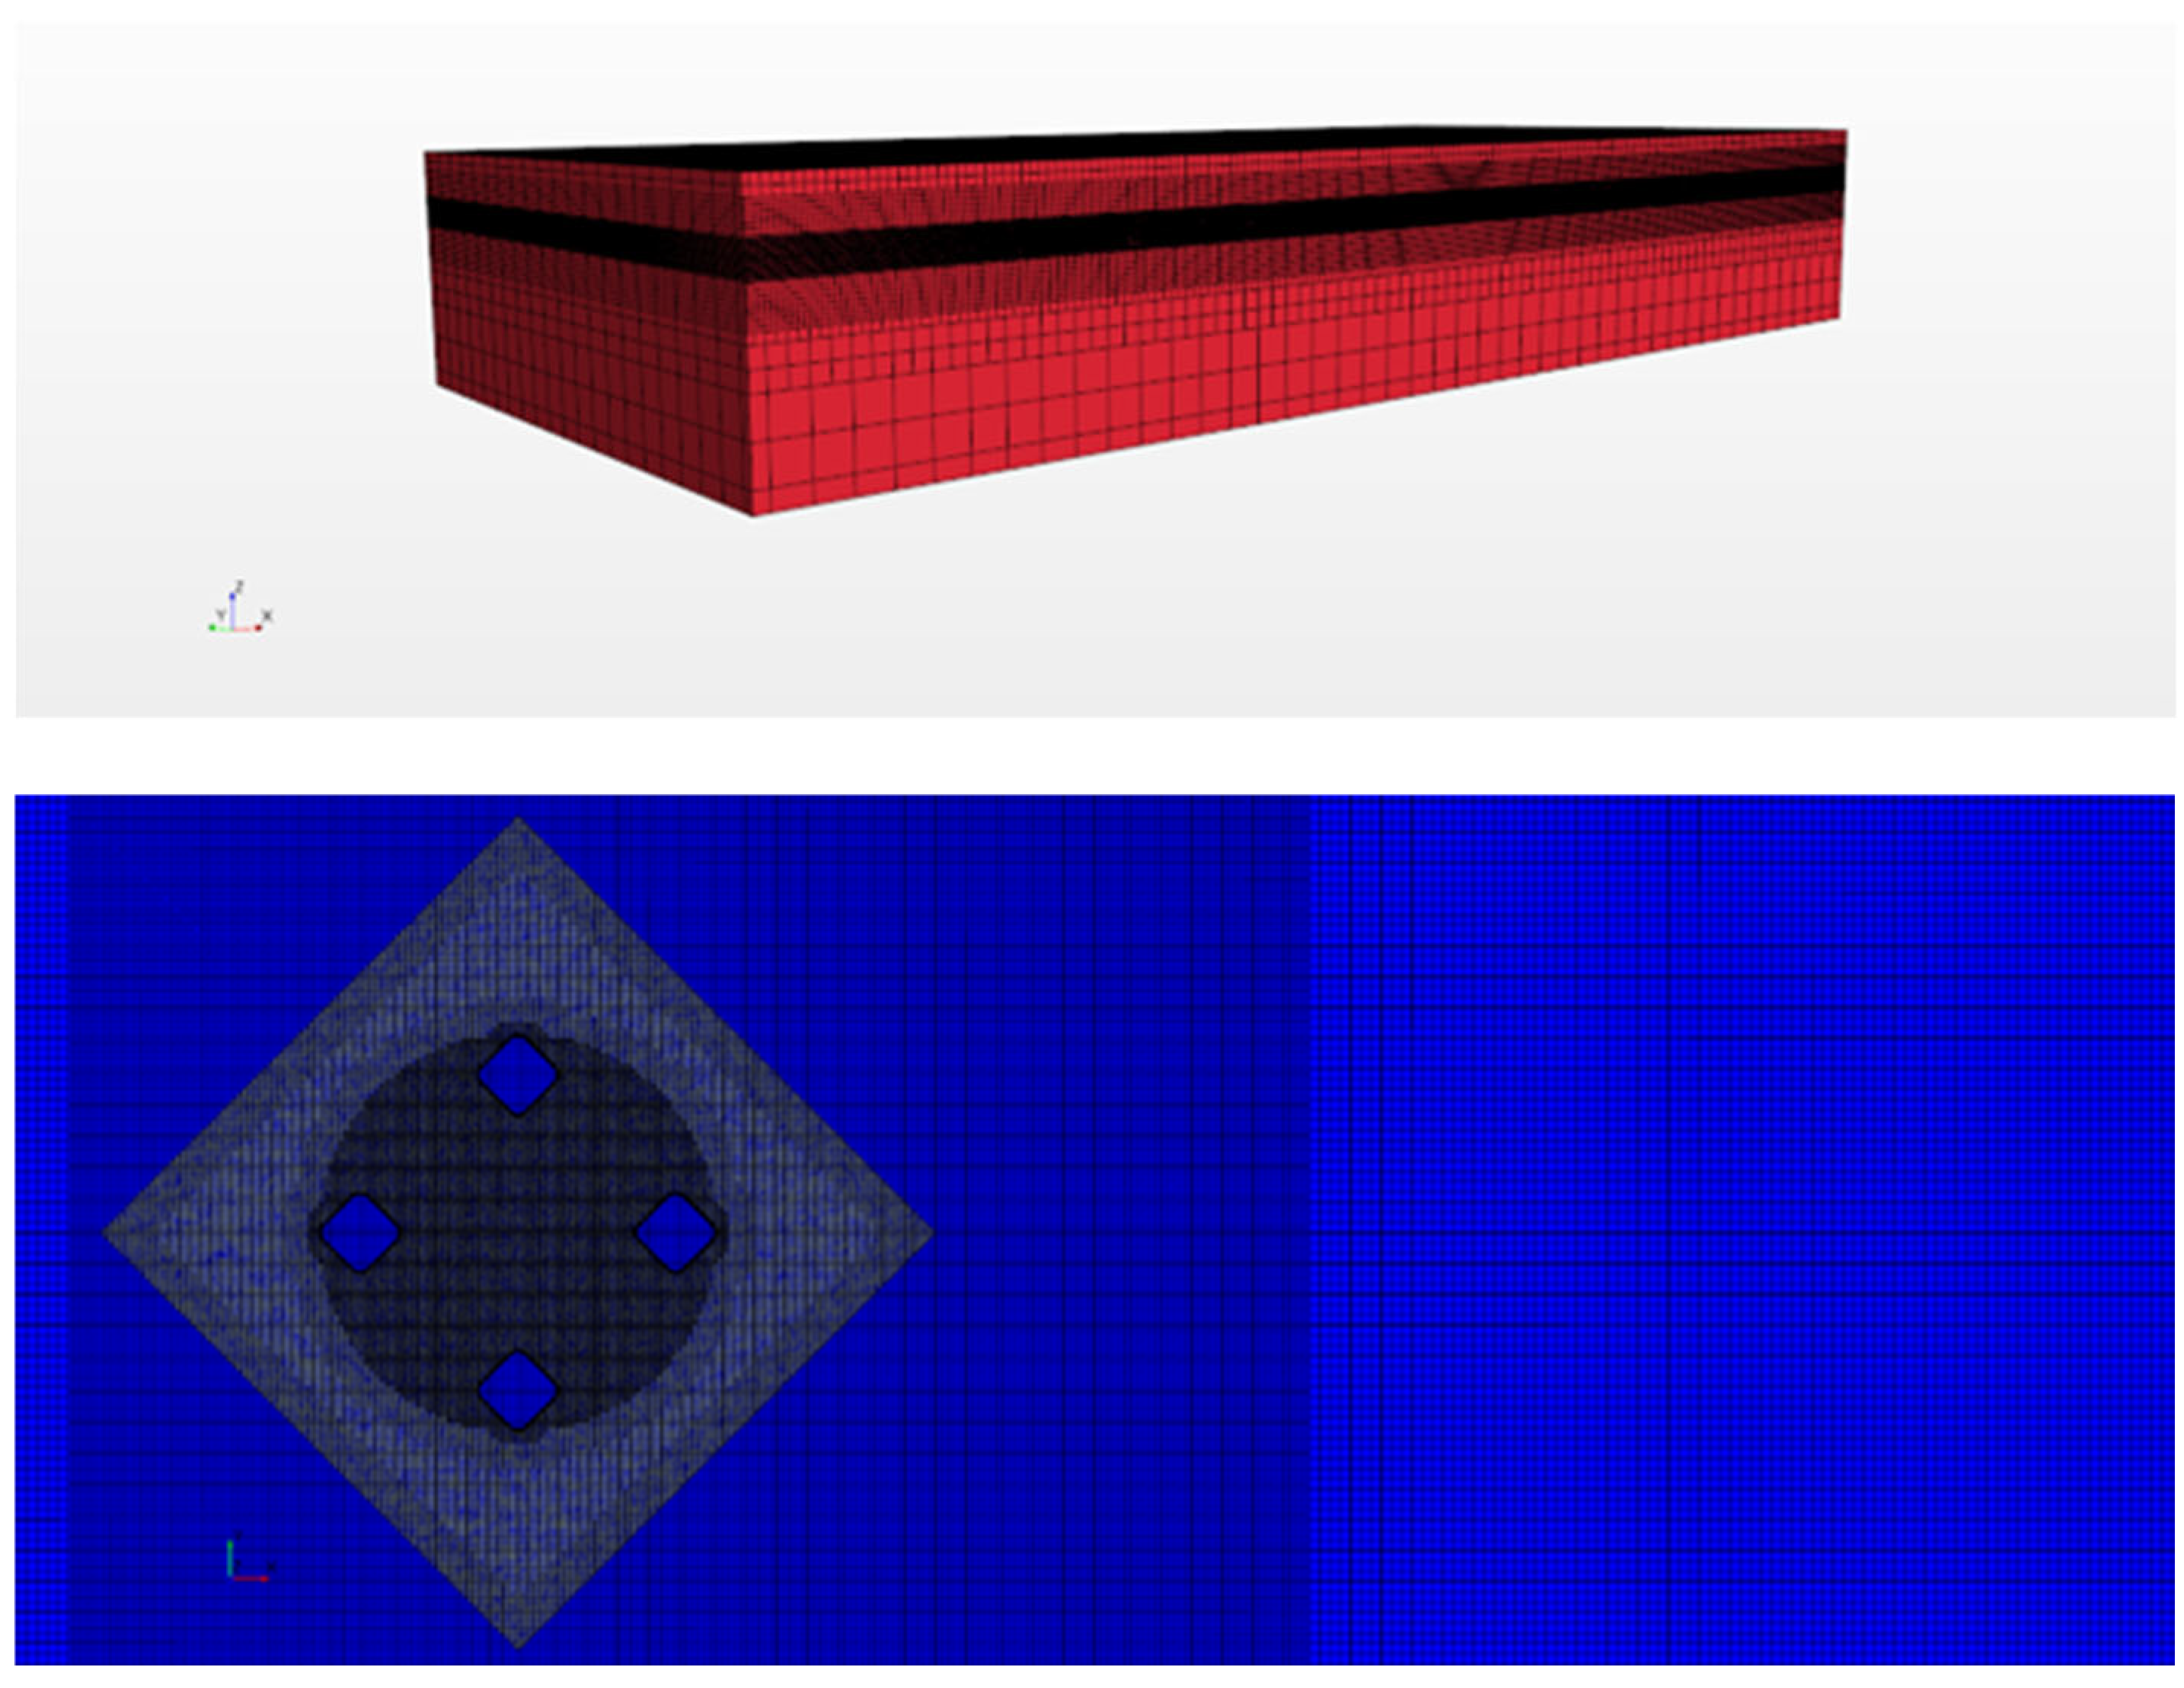
Due to the complexity of waves and free-surface flows, anisotropic settings for mesh refinement are required. Therefore, the trimmed mesh (i.e., cut-cell mesh) is employed. The primary areas requiring refinement are threefold: the free surface, overset domain, and wake regions. To meet wave simulation requirements, the refinement for the free surface is set anisotropically: (1) Along the x direction (wave propagation direction), mesh resolution is refined to 1/20th to 1/10th of the wavelength. (2) In the z direction (vertical), refinement is set to 1/20th to 1/10th of the wave height, with the refined zone extending vertically to 1.5 times the wave height. For the wake region, refinement follows settings for uniform flow conditions. However, to avoid excessive computational time due to overly dense grids, a coarsening strategy is applied. The final generated mesh is shown in Figure 7.

Figure 7.
Schematic diagram of mesh generation (entire computational domain & localized refinement in the vicinity of free liquid level) under wave-current coupling condition.
To enhance the precision of the numerical simulation outcomes, verifying the convergence of the grid is essential. Under the condition of a flow angle of 45° and a uniform flow velocity U = 0.14 m/s, four sets of grids were designed based on proportional scaling to verify the convergence of the nominal amplitude, Ay/D, of transverse motion and the pulsating lift coefficient, .
As shown in Table 2, changing the grid number results in alterations to both the nominal amplitude of transverse motion and the pulsating lift coefficient. Grid M3 was selected as the optimal compromise, balancing computational cost with acceptable accuracy (<5% deviation in peak VIM amplitudes compared to M4). The calculation results are relatively stable, indicating that the grid has essentially converged. Considering computational accuracy and applicability, all simulations were conducted using M3 grids.
Table 2.
Convergence validation results for four meshes at 45° incoming flow angle.
3.4. Two-Dimensional Numerical Simulation Verification of Waves
Before conducting numerical simulations of wave-current coupling, it is essential to validate the two-dimensional wave modeling by proving that SA-DES-generated waveforms match theoretical requirements.
A regular wave with a wave height of 0.1 m, period of 0.8 s, and wavelength of 1.075 m is selected. The computational domain is configured as follows: (1) x-axis: 5 times the wavelength; (2) z-axis: includes the water depth and a small air layer above the free surface (total height = water depth + 0.01 m); (3) y-axis: set to 0.01 m to approximate a quasi-2D simulation. The mesh is refined near the free surface with gradual coarsening toward outer regions. Boundary conditions are defined, and an appropriate model is applied to generate the volume mesh.
Iso surfaces and wave height gauges are created at the derived components, which are cut by two mutually perpendicular profiles, for subsequent creation of line integration reports. The volume fraction of water is calculated and integrated along the line to monitor changes in the wave surface. The scalar cloud map of the result is shown in Figure 8. It is evident that the two are basically consistent, proving that the simulation method is feasible.
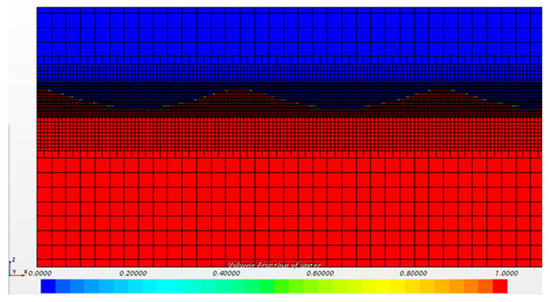
Figure 8.
Scalar cloud map of waveform.
4. Simulation Results and Analysis
By numerically simulating the vortex-induced motion response under uniform flow and wave current coupling, key parameters such as response amplitude, frequency, and fluid force characteristics are analyzed to obtain the vortex-induced motion characteristics of the platform. According to the research conclusion of Liu Mingyue et al. [39] on the vortex-induced motion response of deep-draft, semi-submersible platforms, the transverse oscillation dominates.
4.1. Simulated Conditions
The uniform flow numerical model selects two flow angles, namely 0° and 45°. The selected reduced velocity range is approximately , as shown in Table 3.
Table 3.
Numerical simulation conditions of uniform flow.
When studying wave current coupling, a uniform flow with a flow angle of 45° and a reduced velocity of = 7.5 was selected, which is also the most significant condition for vortex-induced motion under the action of uniform flow (Table 4). The influence of the coupling effect of the two on platform vortex-induced motion was explored.
Table 4.
Parameter design for four simulated conditions (wave and current).
4.2. Motion Response Under Uniform Flow
This section mainly studies the variation of motion response amplitude of semi-submersible platforms with incoming flow velocity at different flow angles. As shown in Figure 9, regardless of the inflow angle of 0° or 45°, the nominal response amplitude (Ay/D) of the transverse motion of the platform reaches a peak within the range of reduced velocity . In contrast, when the inflow angle is 45°, the amplitude of motion changes more dramatically. This is consistent with the result of the towing test done by Bai Zhining et al. (2014) [40]. When , the amplitude of the transverse motion response begins to decrease, but when the reduced velocity is too high (), the amplitude increases slightly again. This is because, when the flow angle is 0°, the entire platform is symmetrically arranged along the incoming flow direction, and the separation point is located at the circular chamfer of the right column, forming a recirculation zone behind the platform. Some of the transverse excitation force will be cancelled out, resulting in a slightly smaller nominal amplitude of transverse motion. When the angle of the incoming flow is 45°, the two columns arranged in the direction of the incoming flow are arranged in front and behind, and the entire inflow surface is equivalent to a diamond shape. The separation point is at the sharp corner of the diamond shape, and the recirculation area becomes larger, the vorticity increases, and the lift force generated is also greater, resulting in a larger amplitude of transverse motion. Within the range of reduced velocity, , the transverse motion amplitude significantly increases, which is known as the “LOCK-IN” phenomenon. Within this reduced velocity range, the frequency of the platform’s transverse motion response is similar to the natural frequency.
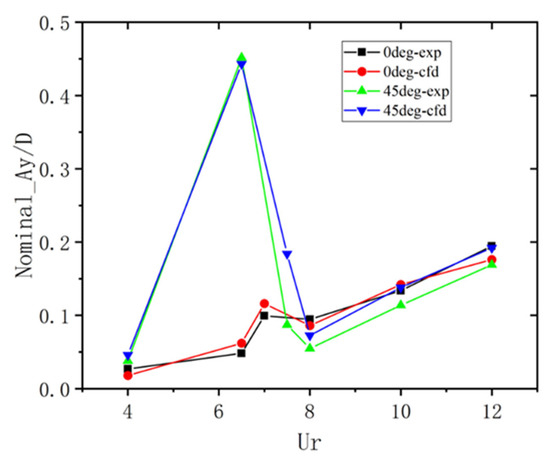
Figure 9.
Nominal amplitude of transverse motion response.
Figure 9 also shows that, under the action of uniform flow, the results obtained from the model test and numerical simulations are basically consistent. When the inflow angle is 45° and , the transverse motion response amplitude curve obtained from numerical simulations rises faster than the model test, and the response amplitude is ultimately greater than that of the inflow angle of 0°, which is consistent with the theoretical situation. The above proves the accuracy and reliability of the numerical simulation.
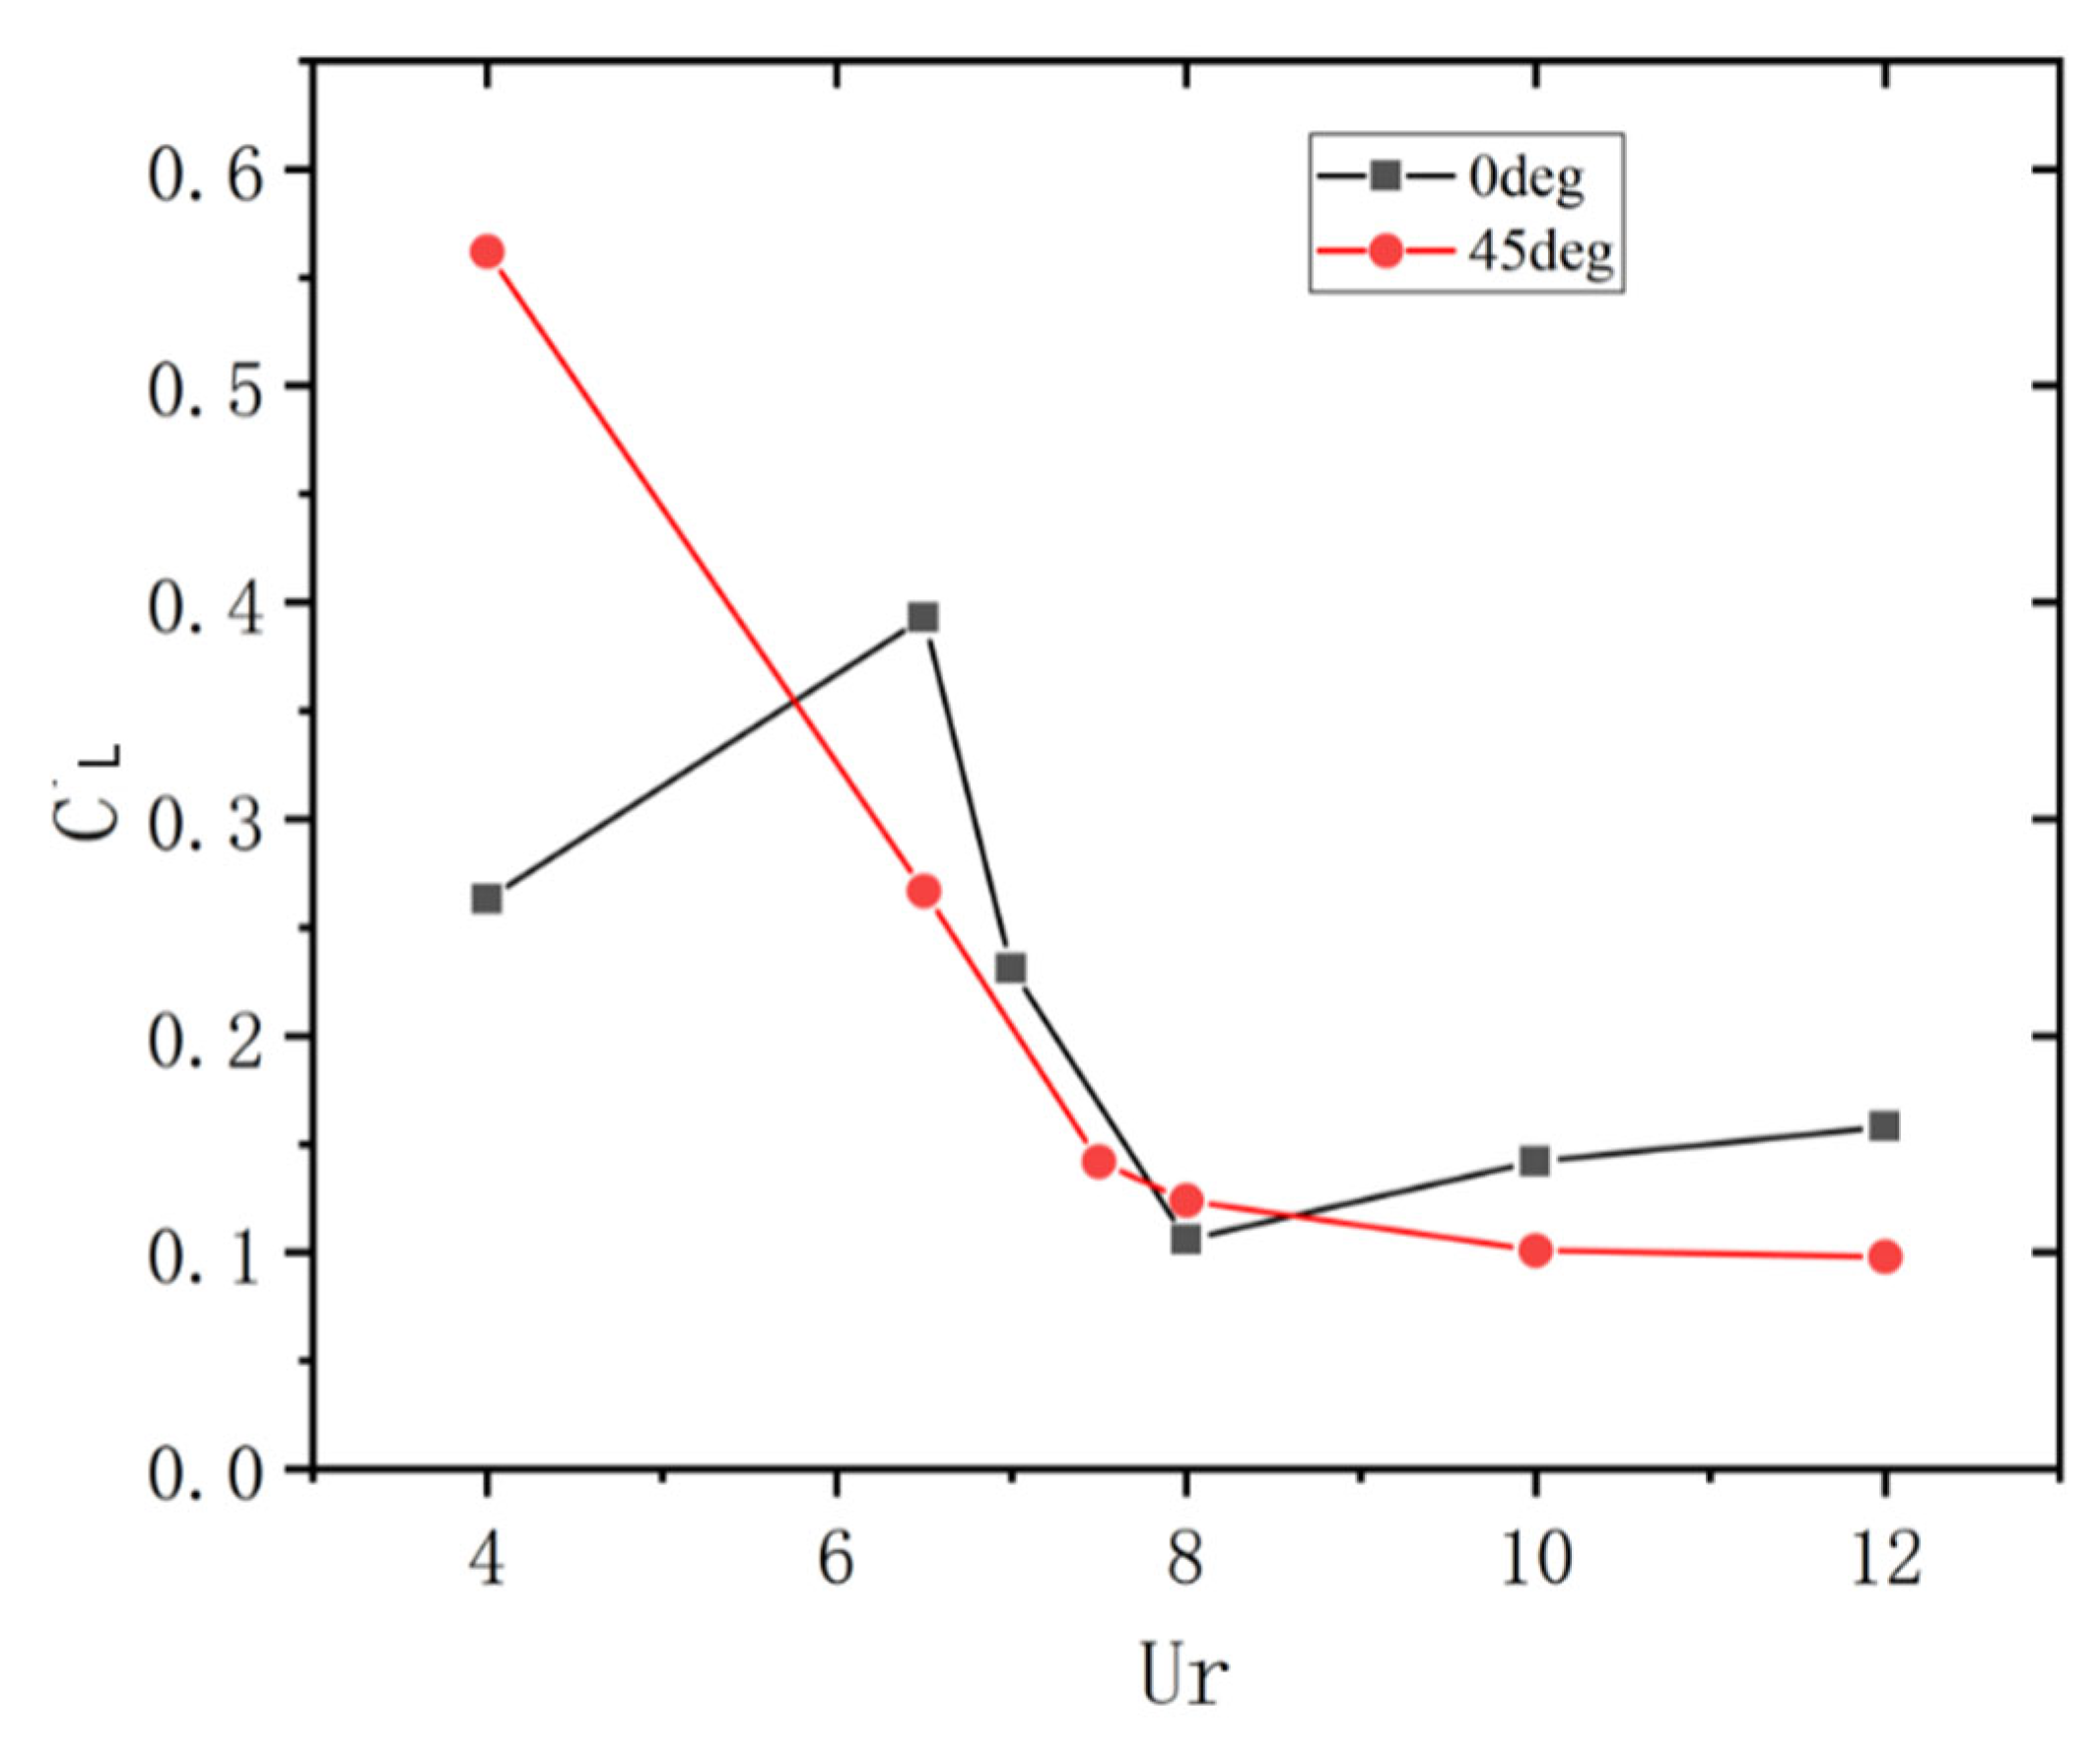
The lift force acting on the platform is generated by the periodic shedding of vortices on both sides of the platform column, resulting in a time-averaged value that is nearly zero. The pulsating lift coefficient, , is depicted in Figure 10. The pulsating lift coefficient curve in the 45° direction exhibits a pronounced downward trend. In contrast, at 0°, the change is relatively minor. However, within the reduced velocity range of , it shows a trend of initially increasing and then decreasing.
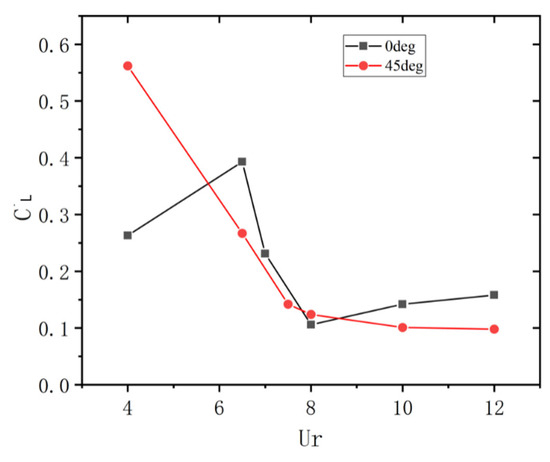
Figure 10.
Lift coefficient for platform.
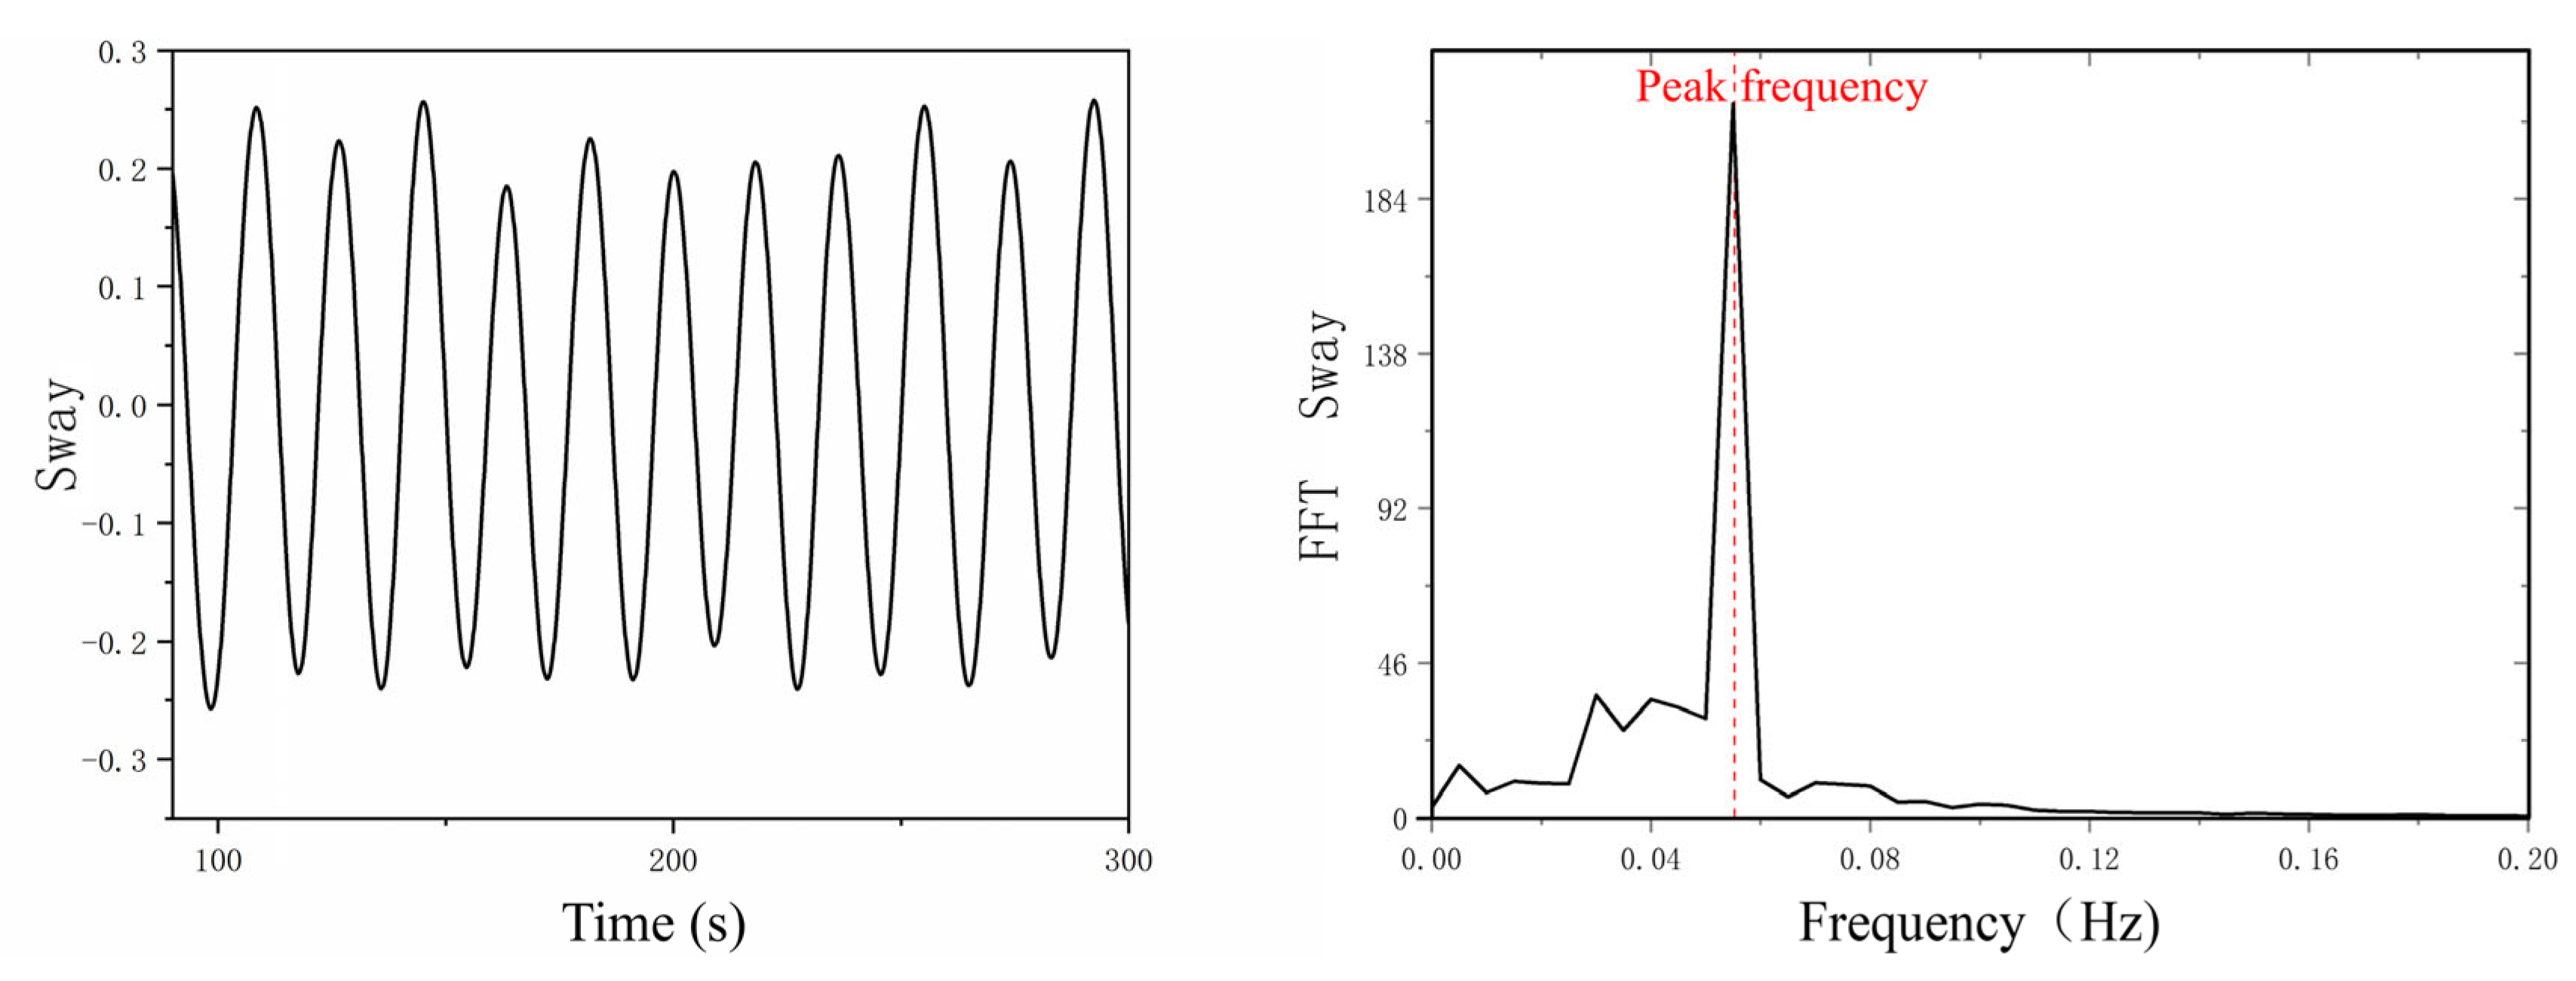
In order to further analyze the relationship between lift force and motion and clarify the mechanism of action, it is necessary to pay attention to the oscillation frequency of lift force. Taking a flow angle of 45° and reduced velocities of and 7.5, the time history curves of the platform’s transverse motion and lift force were subjected to fast Fourier transform after removing initial transient data, as shown in Figure 11 and Figure 12. The main frequency of the generated lift frequency domain graph is the vortex shedding frequency.

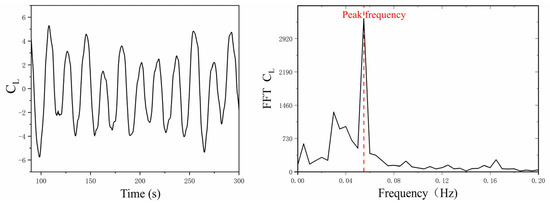
Figure 11.
Time history curves of platform transverse motion and lift coefficients () at reduced velocity = 4 and their frequency domain analysis.
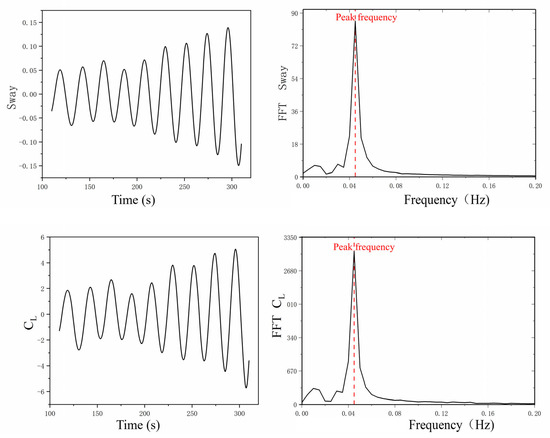
Figure 12.
Time history curves of platform transverse motion and lift coefficients () at reduced velocity = 7.5 and their frequency domain analysis.
It can be seen that the transverse motion response frequency perpendicular to the incoming flow direction at two reduced velocities is the same as the oscillation frequency of lift force (vortex shedding frequency), which indicates that the transverse motion response of the semi-submersible platform is dominated by pulsating lift force. Within the range of reduced velocity , the vortex shedding frequency of the platform is roughly the same as the natural period of transverse motion, which is the fundamental reason for the “LOCK-IN” phenomenon in the transverse motion.
The longitudinal motion trajectory of the platform is moved to a new dynamic equilibrium position under the action of uniform flow, which is mainly related to resistance and undergoes periodic reciprocating motion near the equilibrium position. Compared to the amplitude of transverse motion response, the amplitude of longitudinal motion is much smaller.
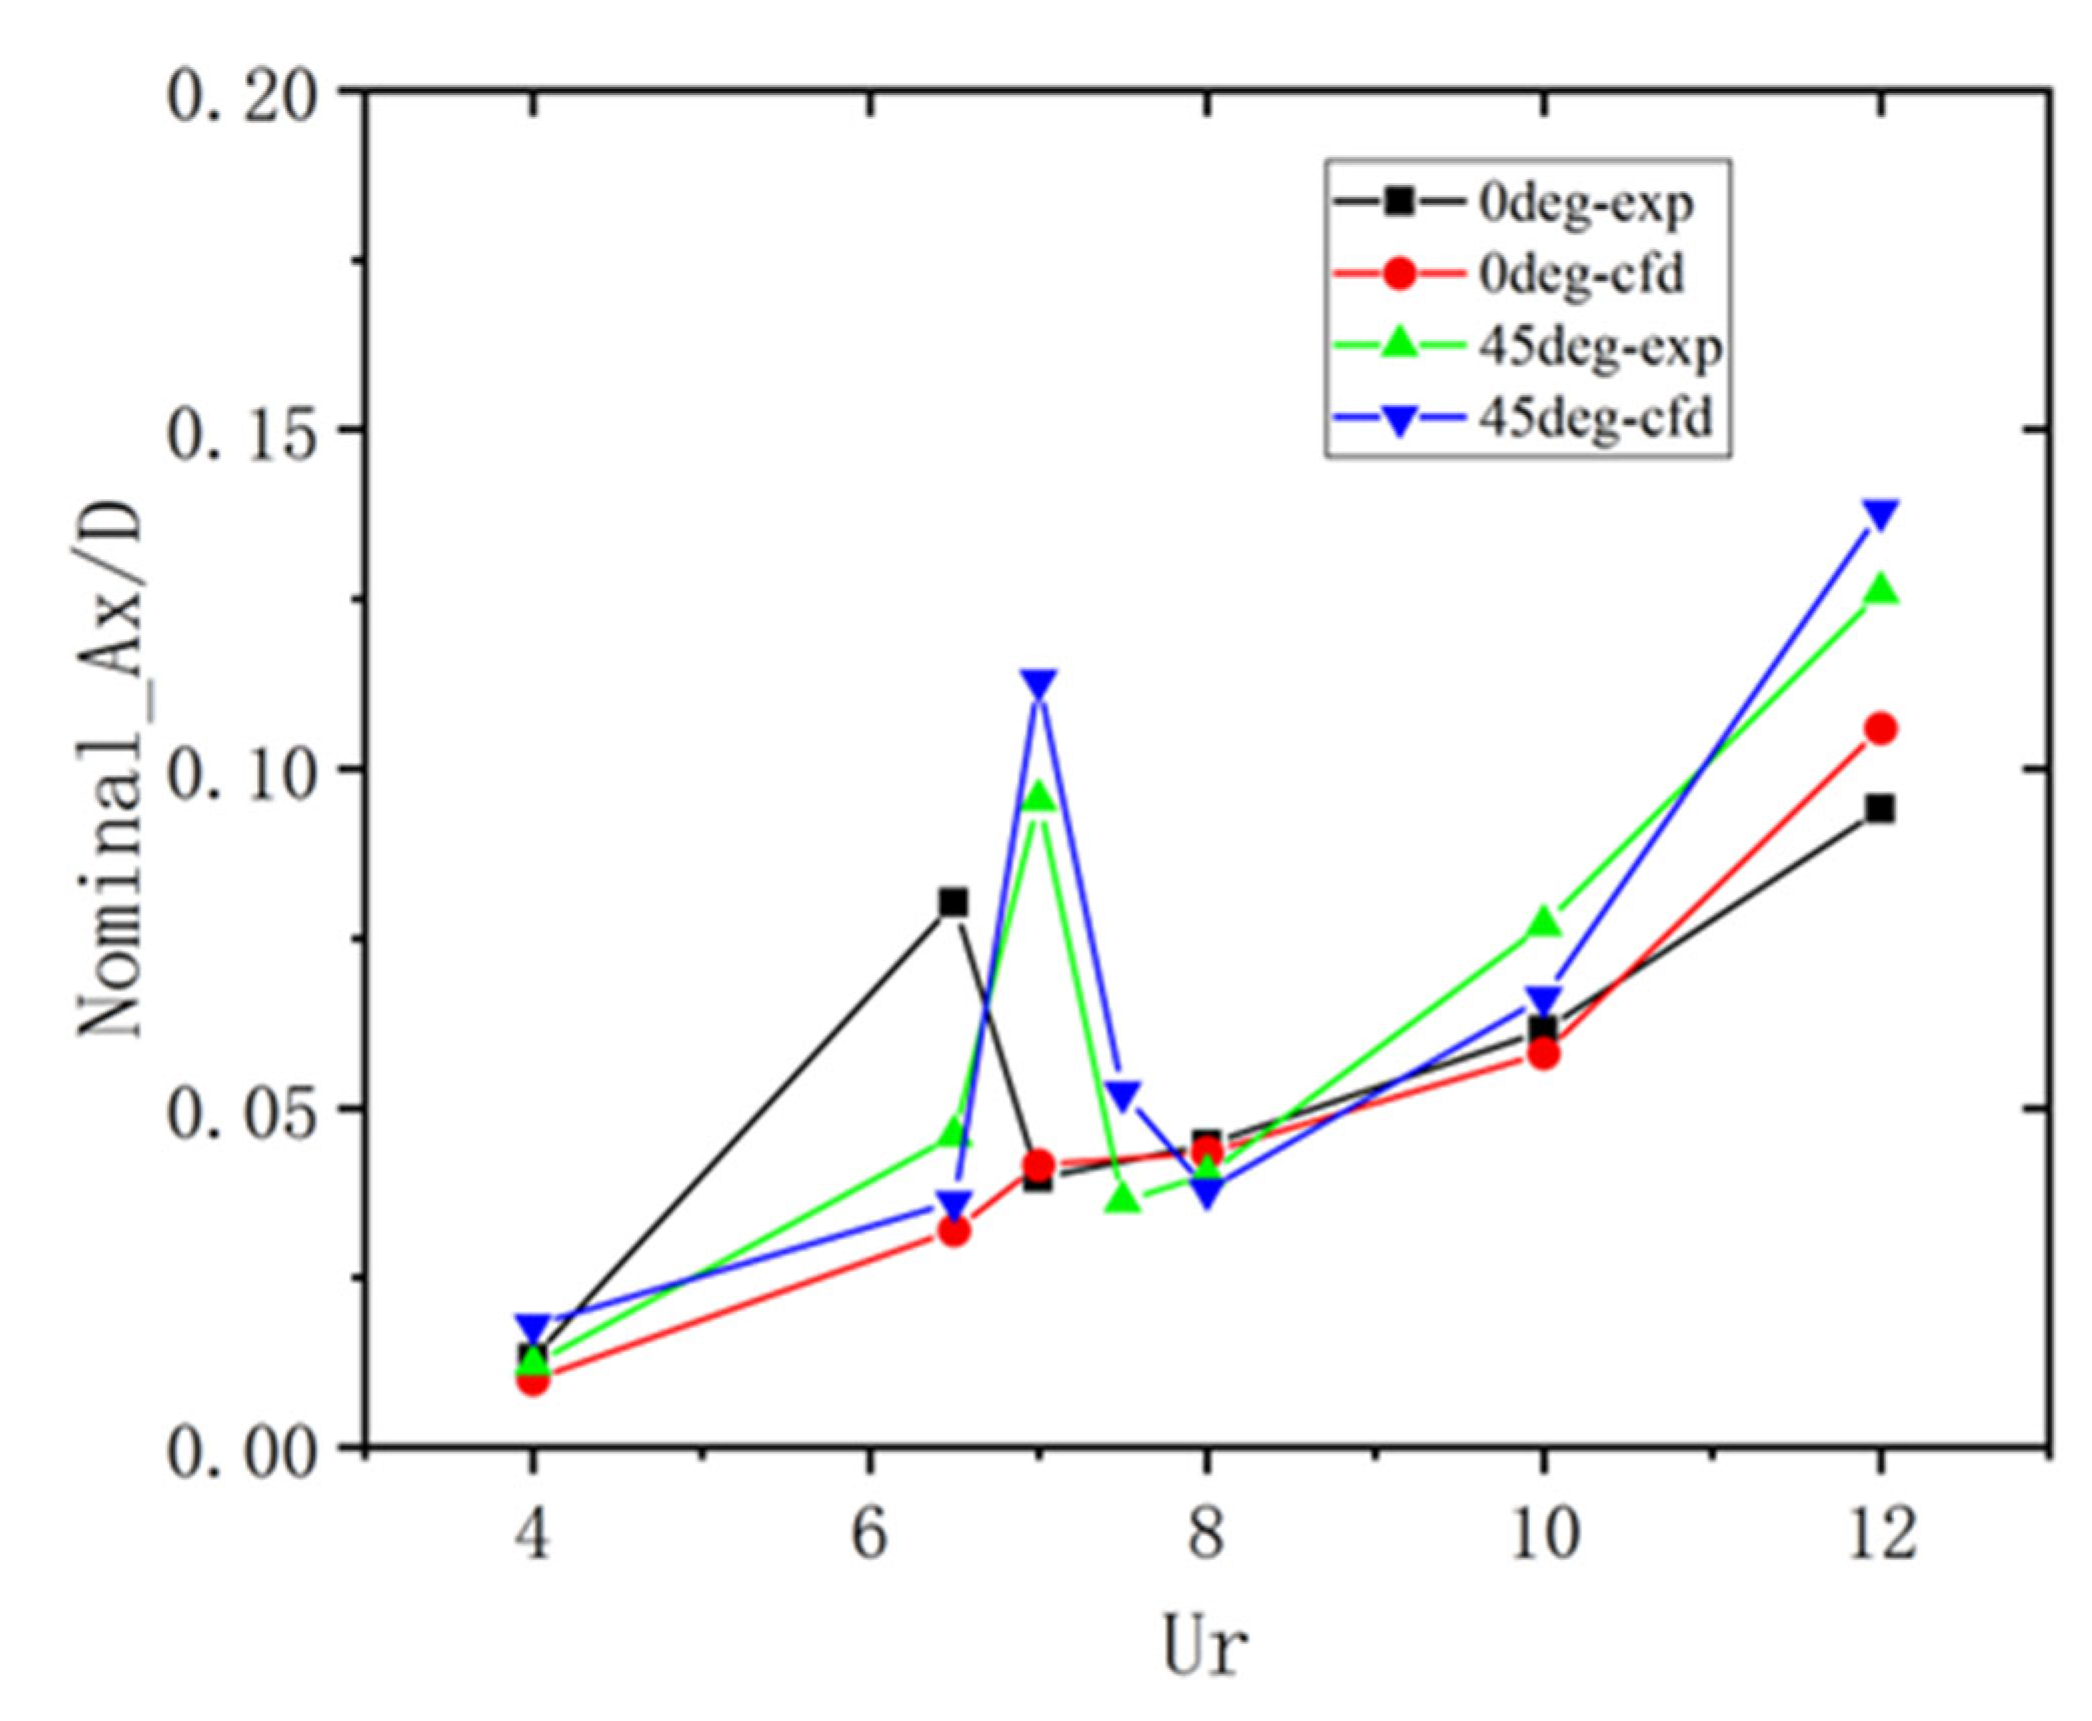
As Figure 13 also illustrates, as the reduced velocity, Ur, increases, the longitudinal response amplitude at an inflow angle of 0° exhibits a modest increase. In comparison to other angles, the longitudinal response amplitude at a flow angle of 45° is significantly larger. This is attributed to the relatively large transverse response amplitude at this angle. The transverse movement can guide the longitudinal movement within a certain range, leading to complex coupling between the two motions.

Figure 13.
Comparison of nominal response amplitude for longitudinal motion of platform.
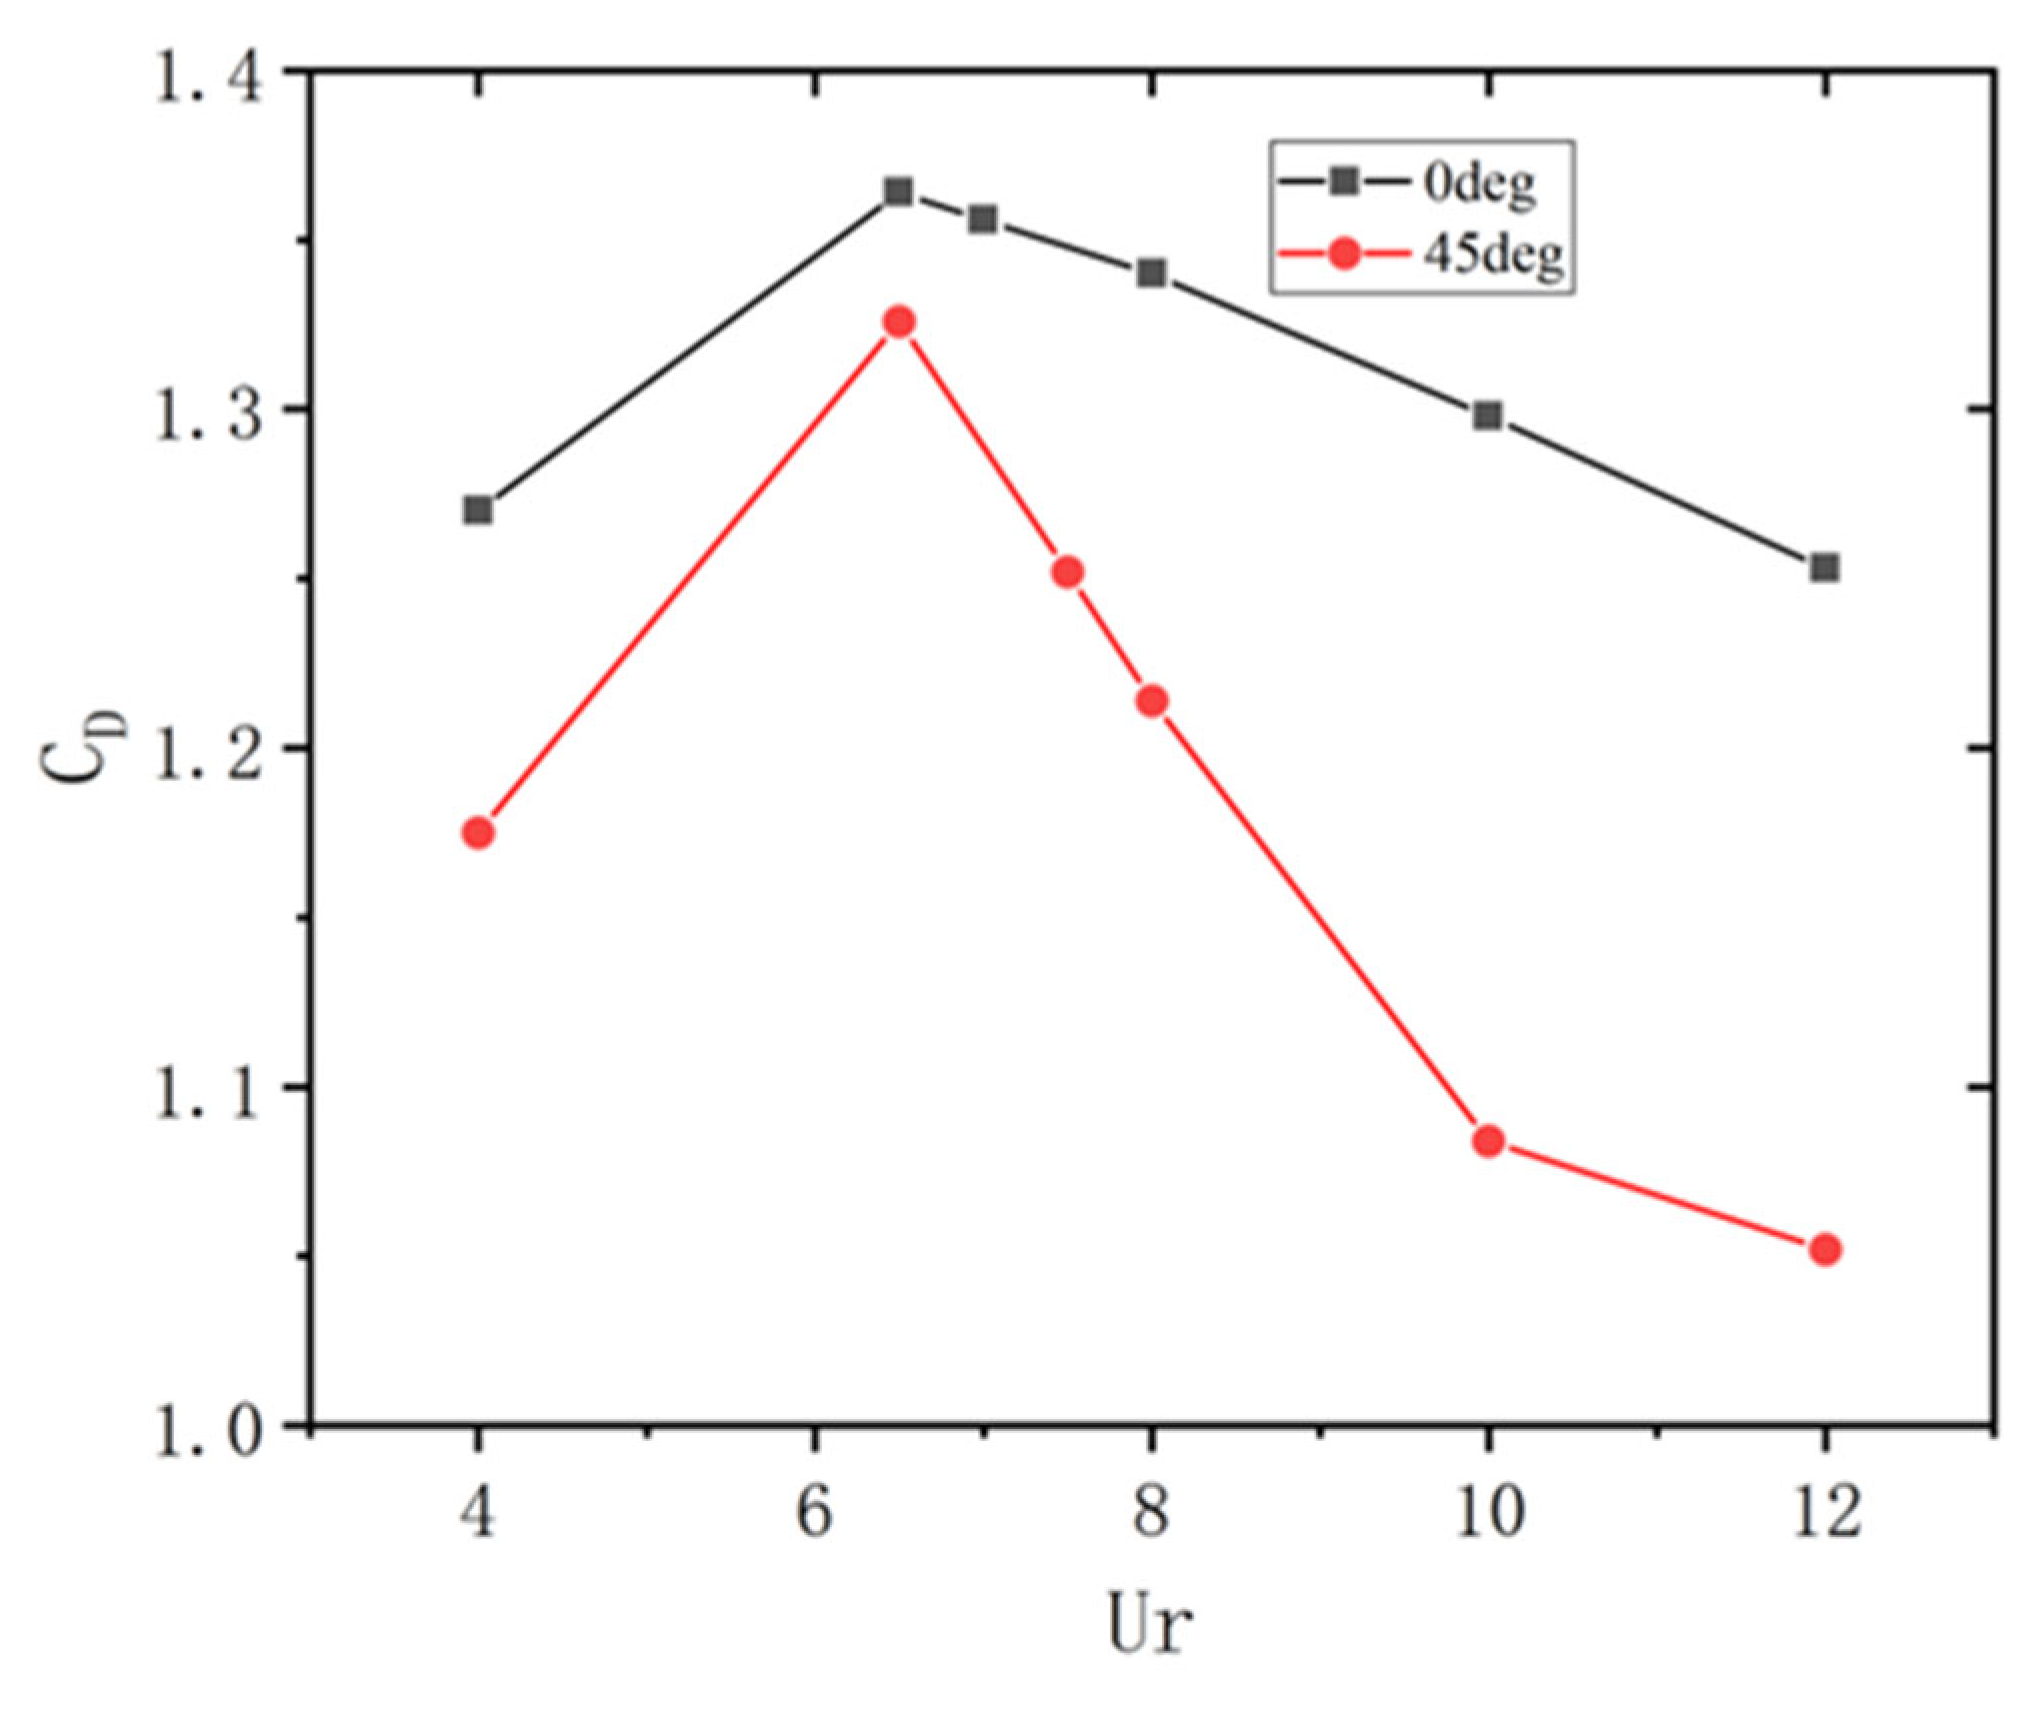
The variation of the average drag coefficient with reduced velocity is depicted in Figure 14. As can be seen from the figure, the average drag coefficient reaches its peak at the locked frequency. This is attributed to the fact that, at the locked frequency, larger transverse motion responses couple with longitudinal motion responses. Specifically, larger transverse motion responses increase their impact on the surrounding flow field, thereby altering the shedding shape of vortices and modifying the fluid force acting on the platform, including the drag force along the flow direction. Under the influence of the altered drag force, the amplitude of the longitudinal motion response is amplified.
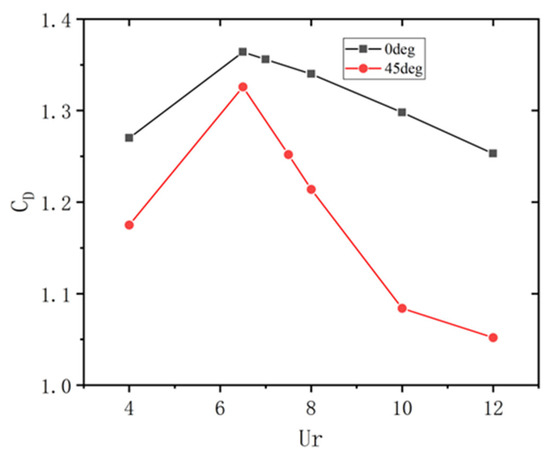
Figure 14.
Time-averaged drag coefficient for platform.
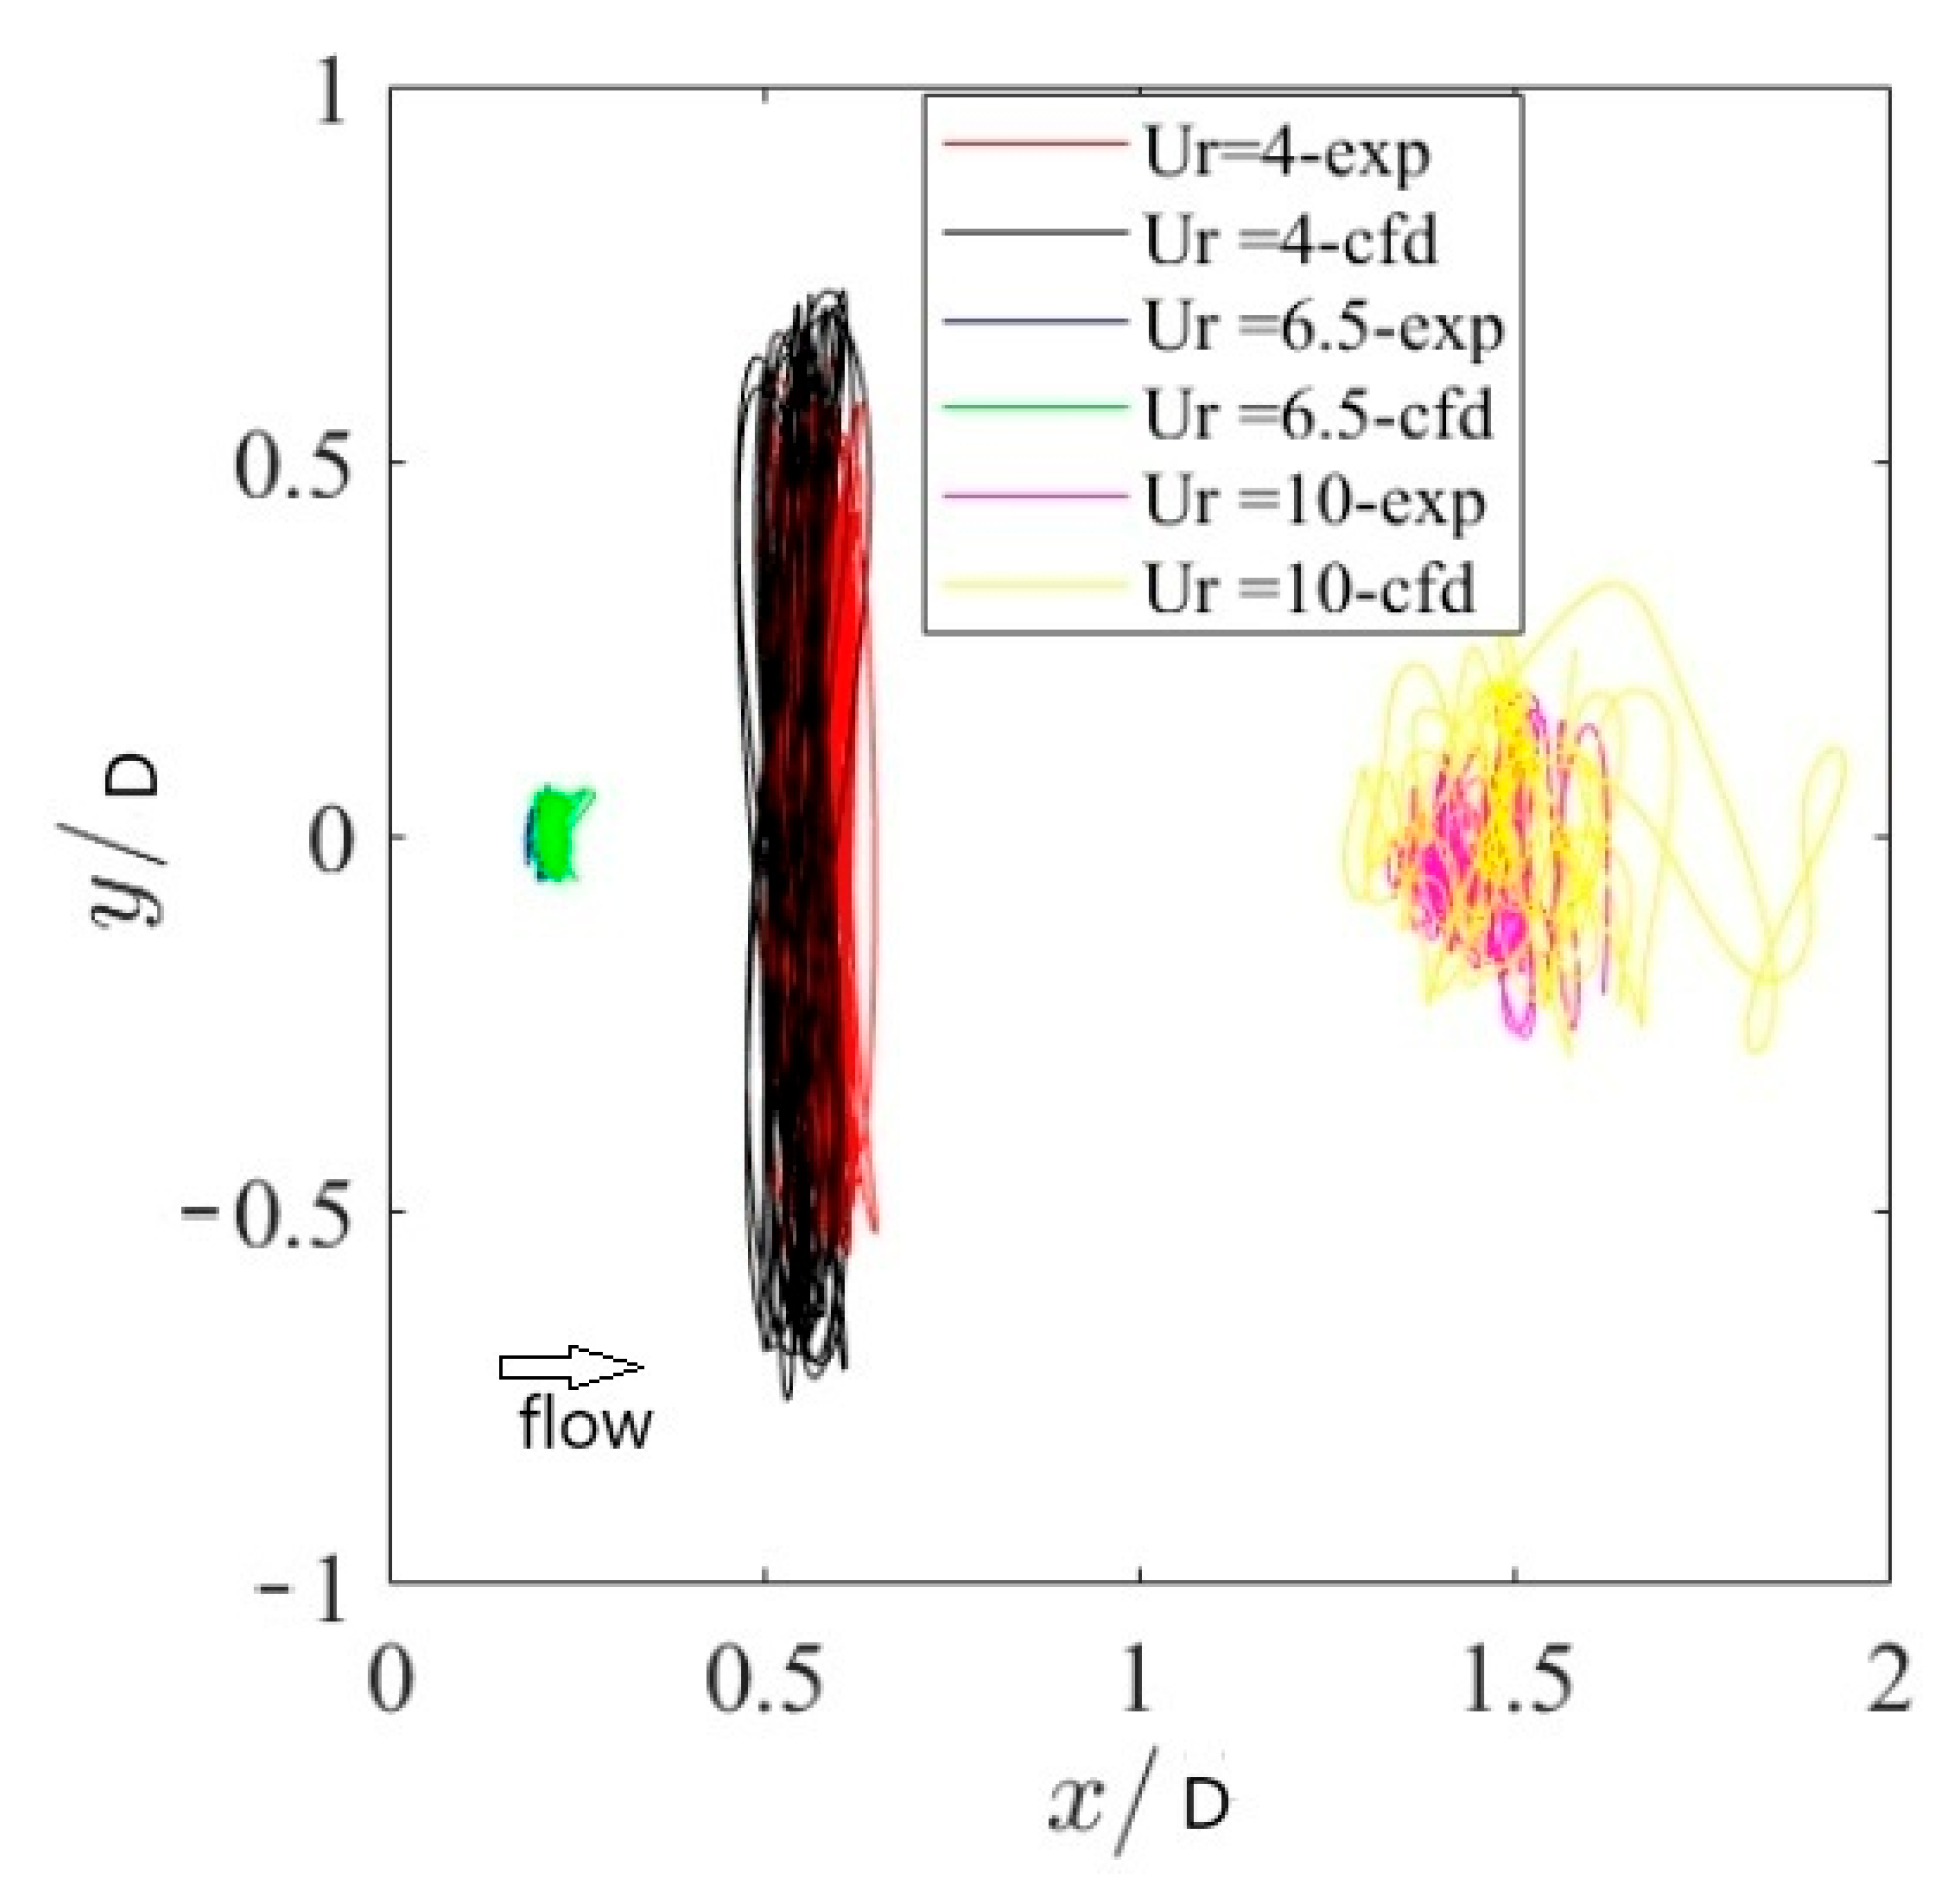
When the inflow angle is 45°, the motion trajectory of the platform in the horizontal plane (x-y) under three typical conditions is shown in Figure 15. The model test results and numerical simulation results show good consistency. The transverse motion has symmetry, and at all three reduced velocities the x-direction motion (longitudinal motion) is smaller than the y-direction motion (transverse motion). At the reduced velocity Ur = 6.5, the motion trajectory is closer to a straight line perpendicular to the flow direction. After the locking region, the transverse motion is slightly greater than the longitudinal motion, and the motion trajectory is chaotic; as the reduced velocity increases, the overall resistance of the structure increases, which leads to an increase in offset.

Figure 15.
Comparison of planimetric trajectories of platform under uniform flows.
4.3. Motion Response Under Wave Current Coupling
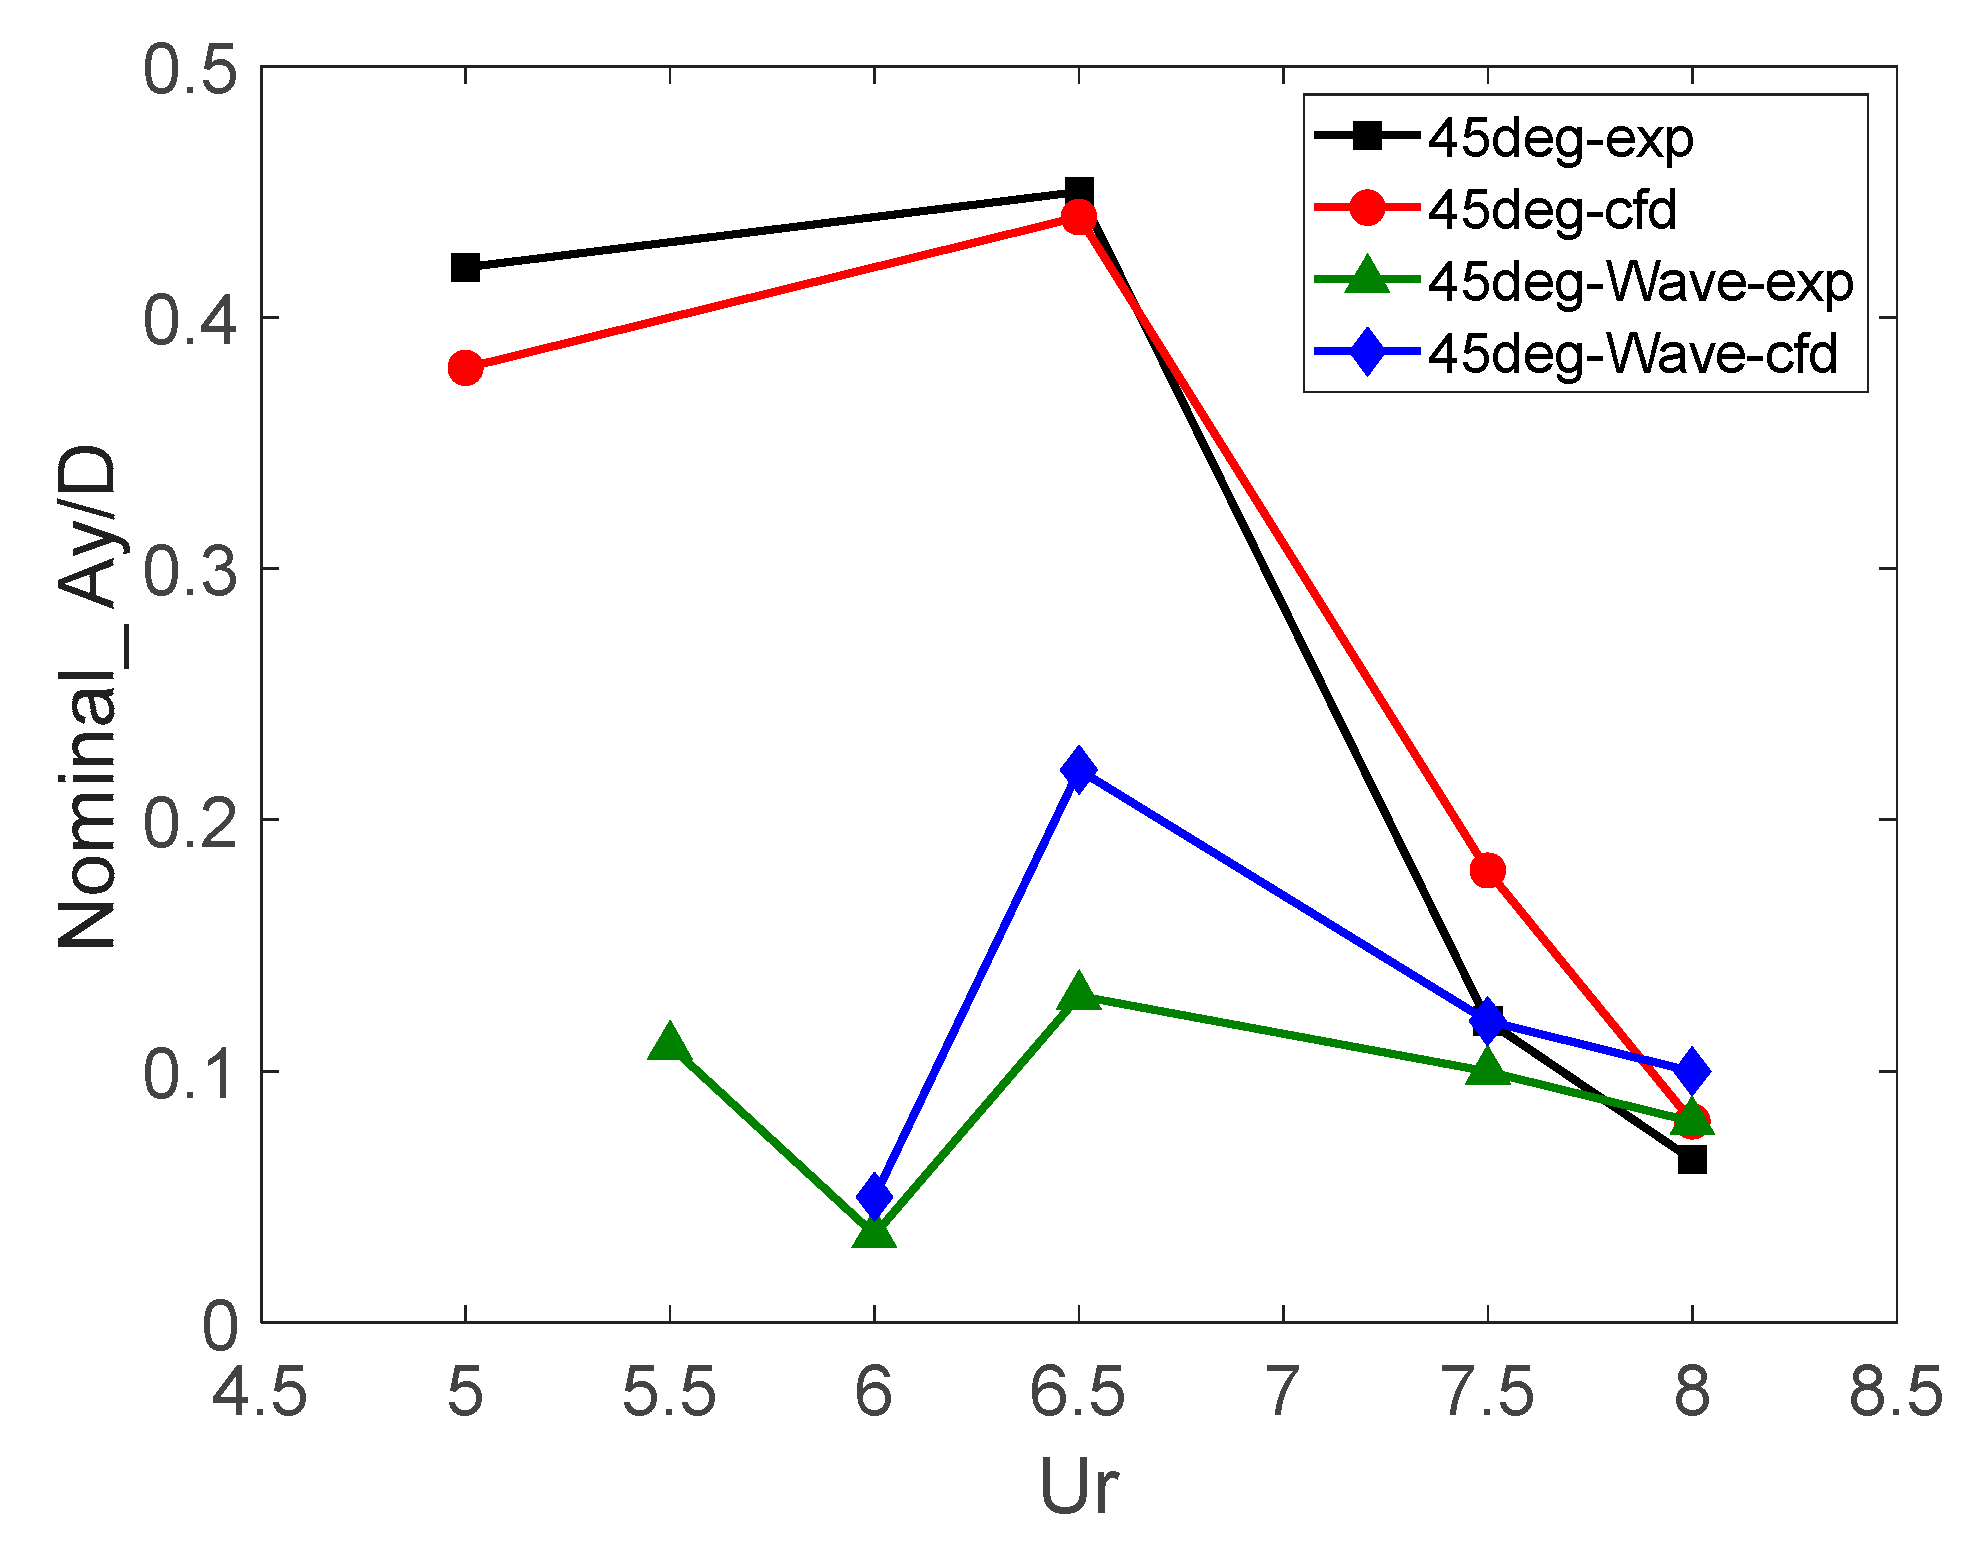
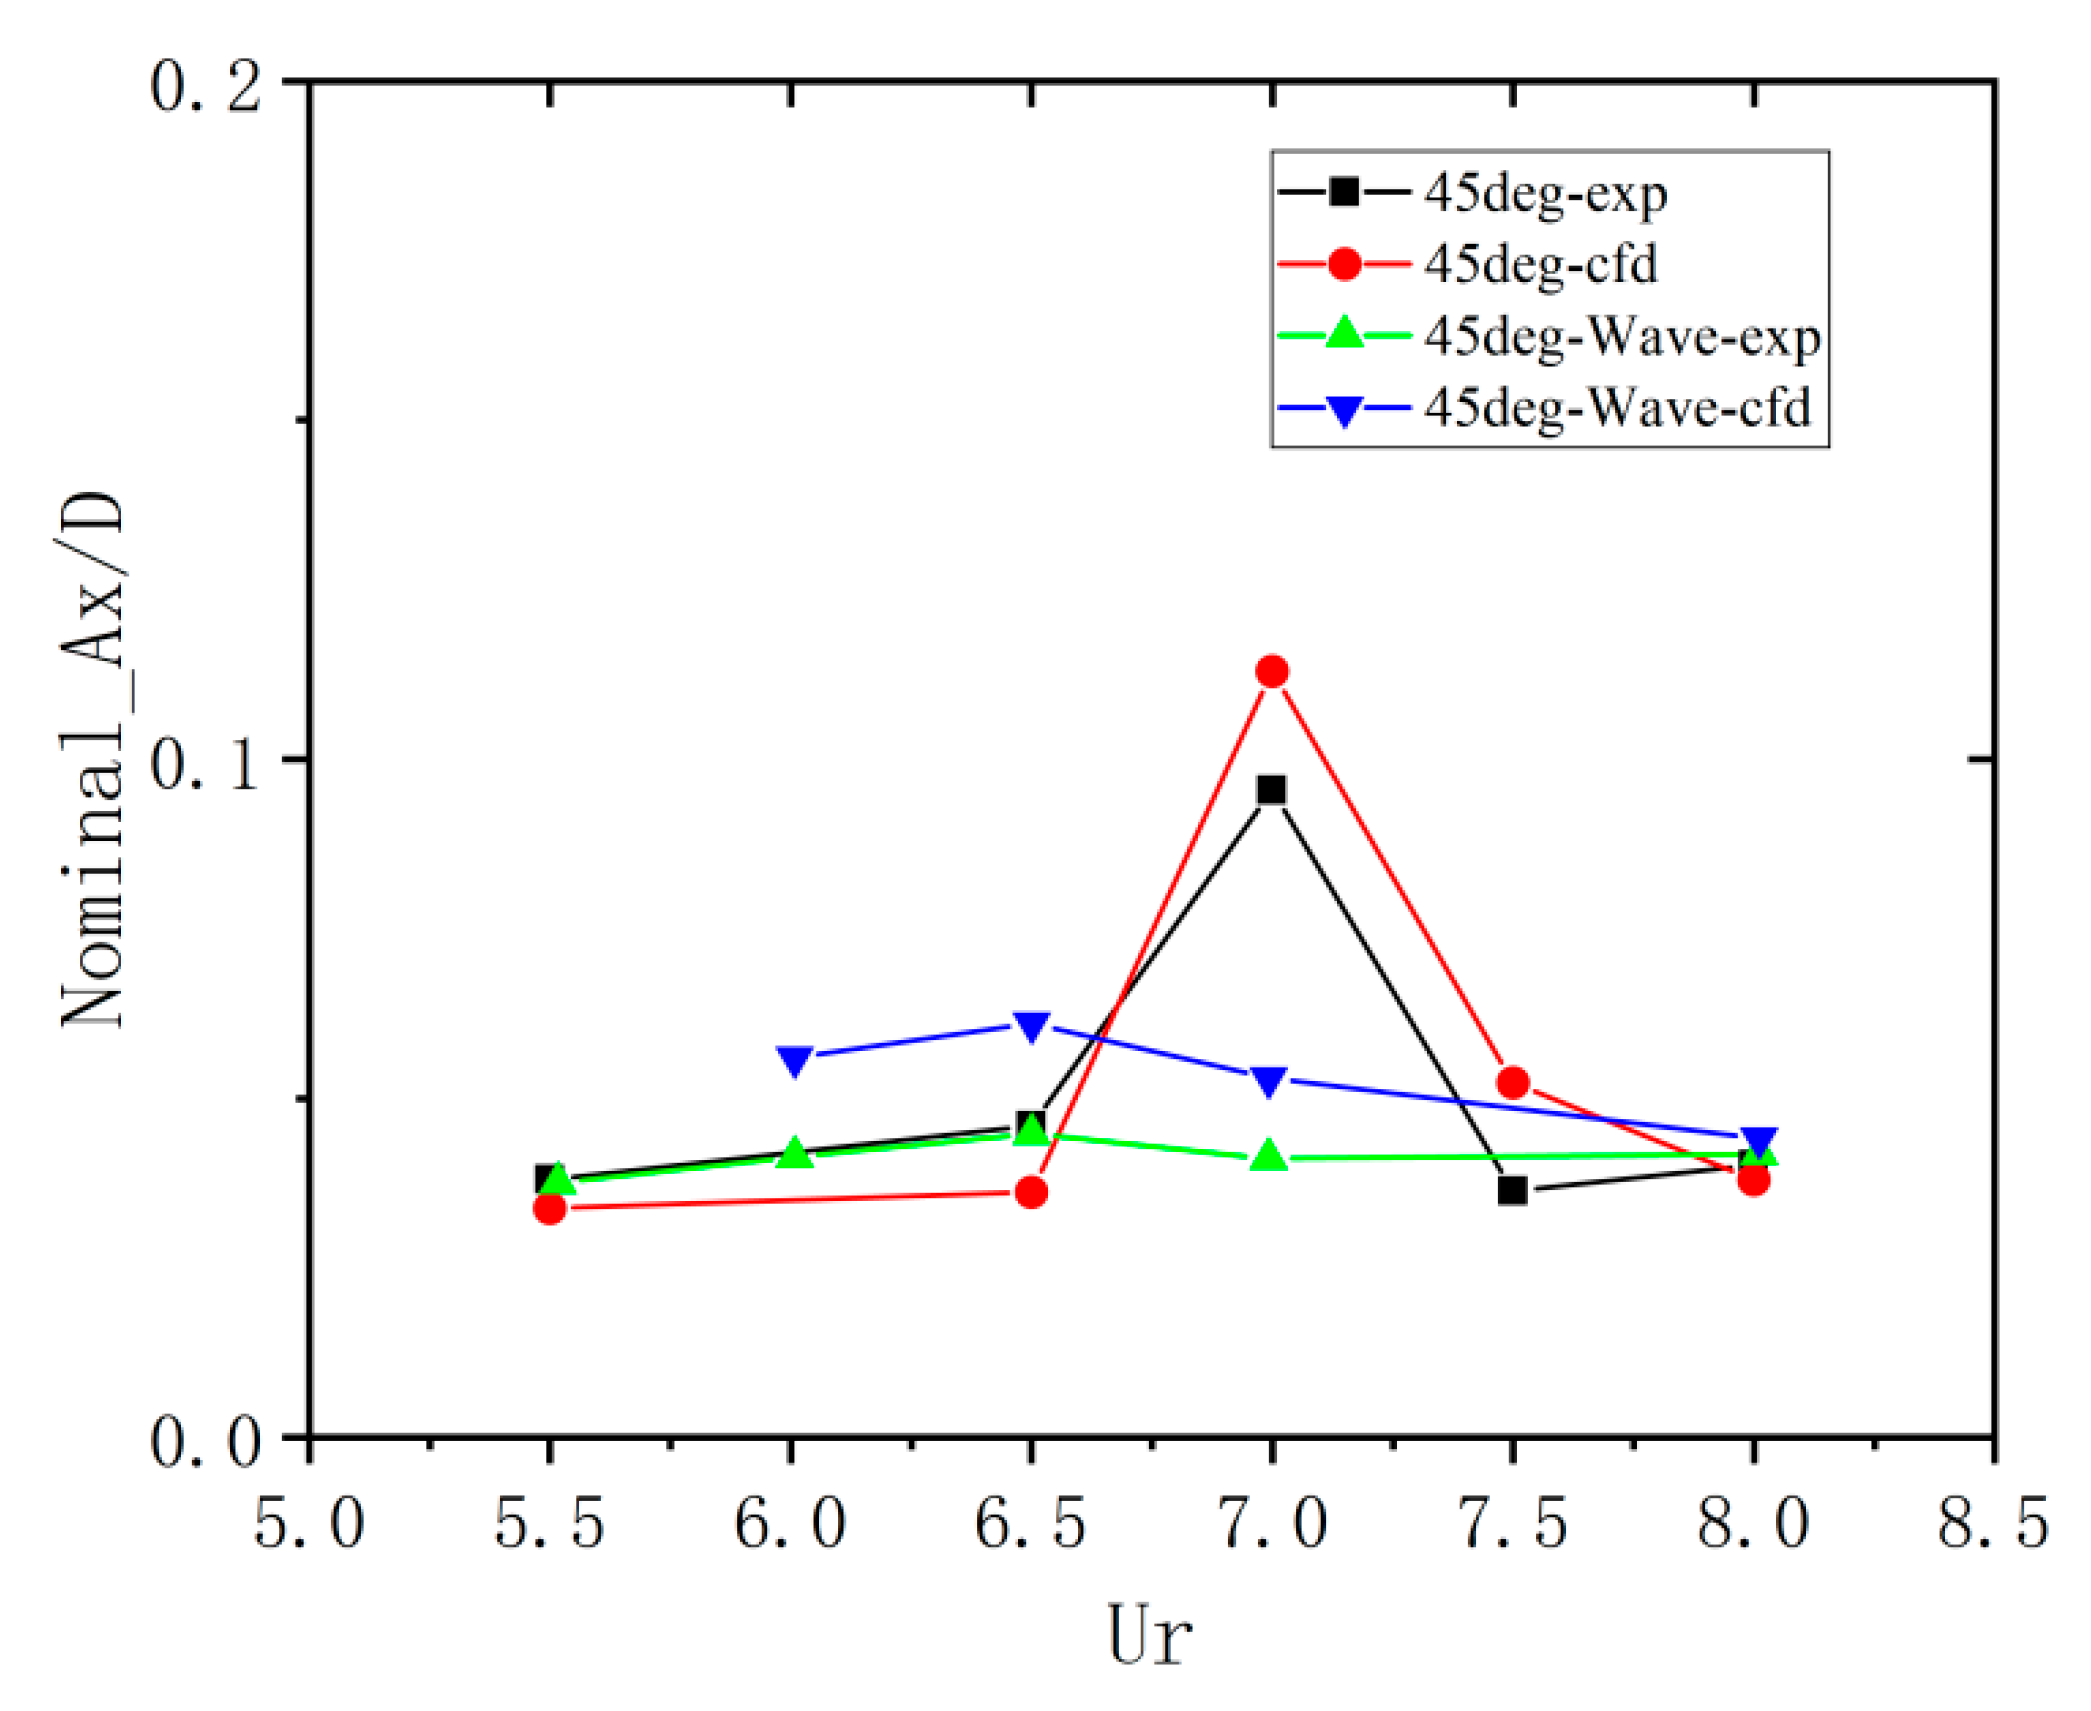
The motion response mechanism of the platform under wave current coupling is relatively complex. Firstly, the motion response under the same wave conditions (W1) and different reduced velocities is analyzed. Figure 16 shows the nominal response amplitude of transverse motion under the action of uniform flow and the coupling of incoming flow with regular waves at different reduced velocities. In the presence of regular waves, the response amplitude of vortex-induced motion decreases, especially under low reduced velocity conditions. It can also be clearly observed that the platform vortex-induced motion response is severe within the locked frequency. The results obtained from the numerical simulation of wave current coupling conditions are smaller than those under uniform flow, which is consistent with model test. However, compared to the results of the model test, which are generally larger, this may be due to some problems in the accurate simulation of waves in numerical simulations, which did not consider the influence of wave dissipation in the surrounding area.

Figure 16.
Comparison of transverse motion response amplitude under uniform flow condition and wave-current coupling condition (W1) of the platform.
The comparison of the nominal response amplitudes of longitudinal motion under uniform flow and different reduced velocities of incoming flow coupling with regular waves is shown in Figure 17. Compared with the transverse motion response, the longitudinal motion response is not significant. However, in the locked frequency of transverse motion, there is a peak in the nominal amplitude of longitudinal motion response. This phenomenon may be due to a significant coupling between longitudinal and transverse movements, resulting in a “LOCK-IN” phenomenon in the transverse motion response, which leads to a more significant longitudinal motion response. Unlike transverse motion, the results obtained under wave current coupling are not smaller than those under uniform flow.
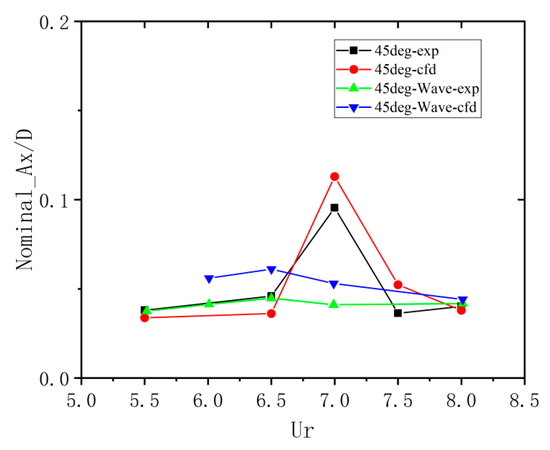
Figure 17.
Comparison of longitudinal motion response amplitude under uniform flow condition and wave-current coupling condition of the platform.
Next, considering the vortex-induced motion response characteristics of the platform under the coupling effect of four different waves and the same flow velocity, the nominal amplitude of transverse motion obtained is shown in Table 5. The table reveals that the transverse motion response under all four conditions is lower than that under uniform flow with the same reduced velocity. This indicates that the coupling of waves and uniform flow weakens the vortex-induced motion response, which is consistent with the model test results of Goncalves et al. [3]. The main reason for this is that, when uniform flows are coupled with waves, the platform experiences periodic changes in flow velocity, which creates a resistance effect.
Table 5.
Nominal response amplitude results of transverse motion under four conditions of wave-current coupling and uniform flow effects.
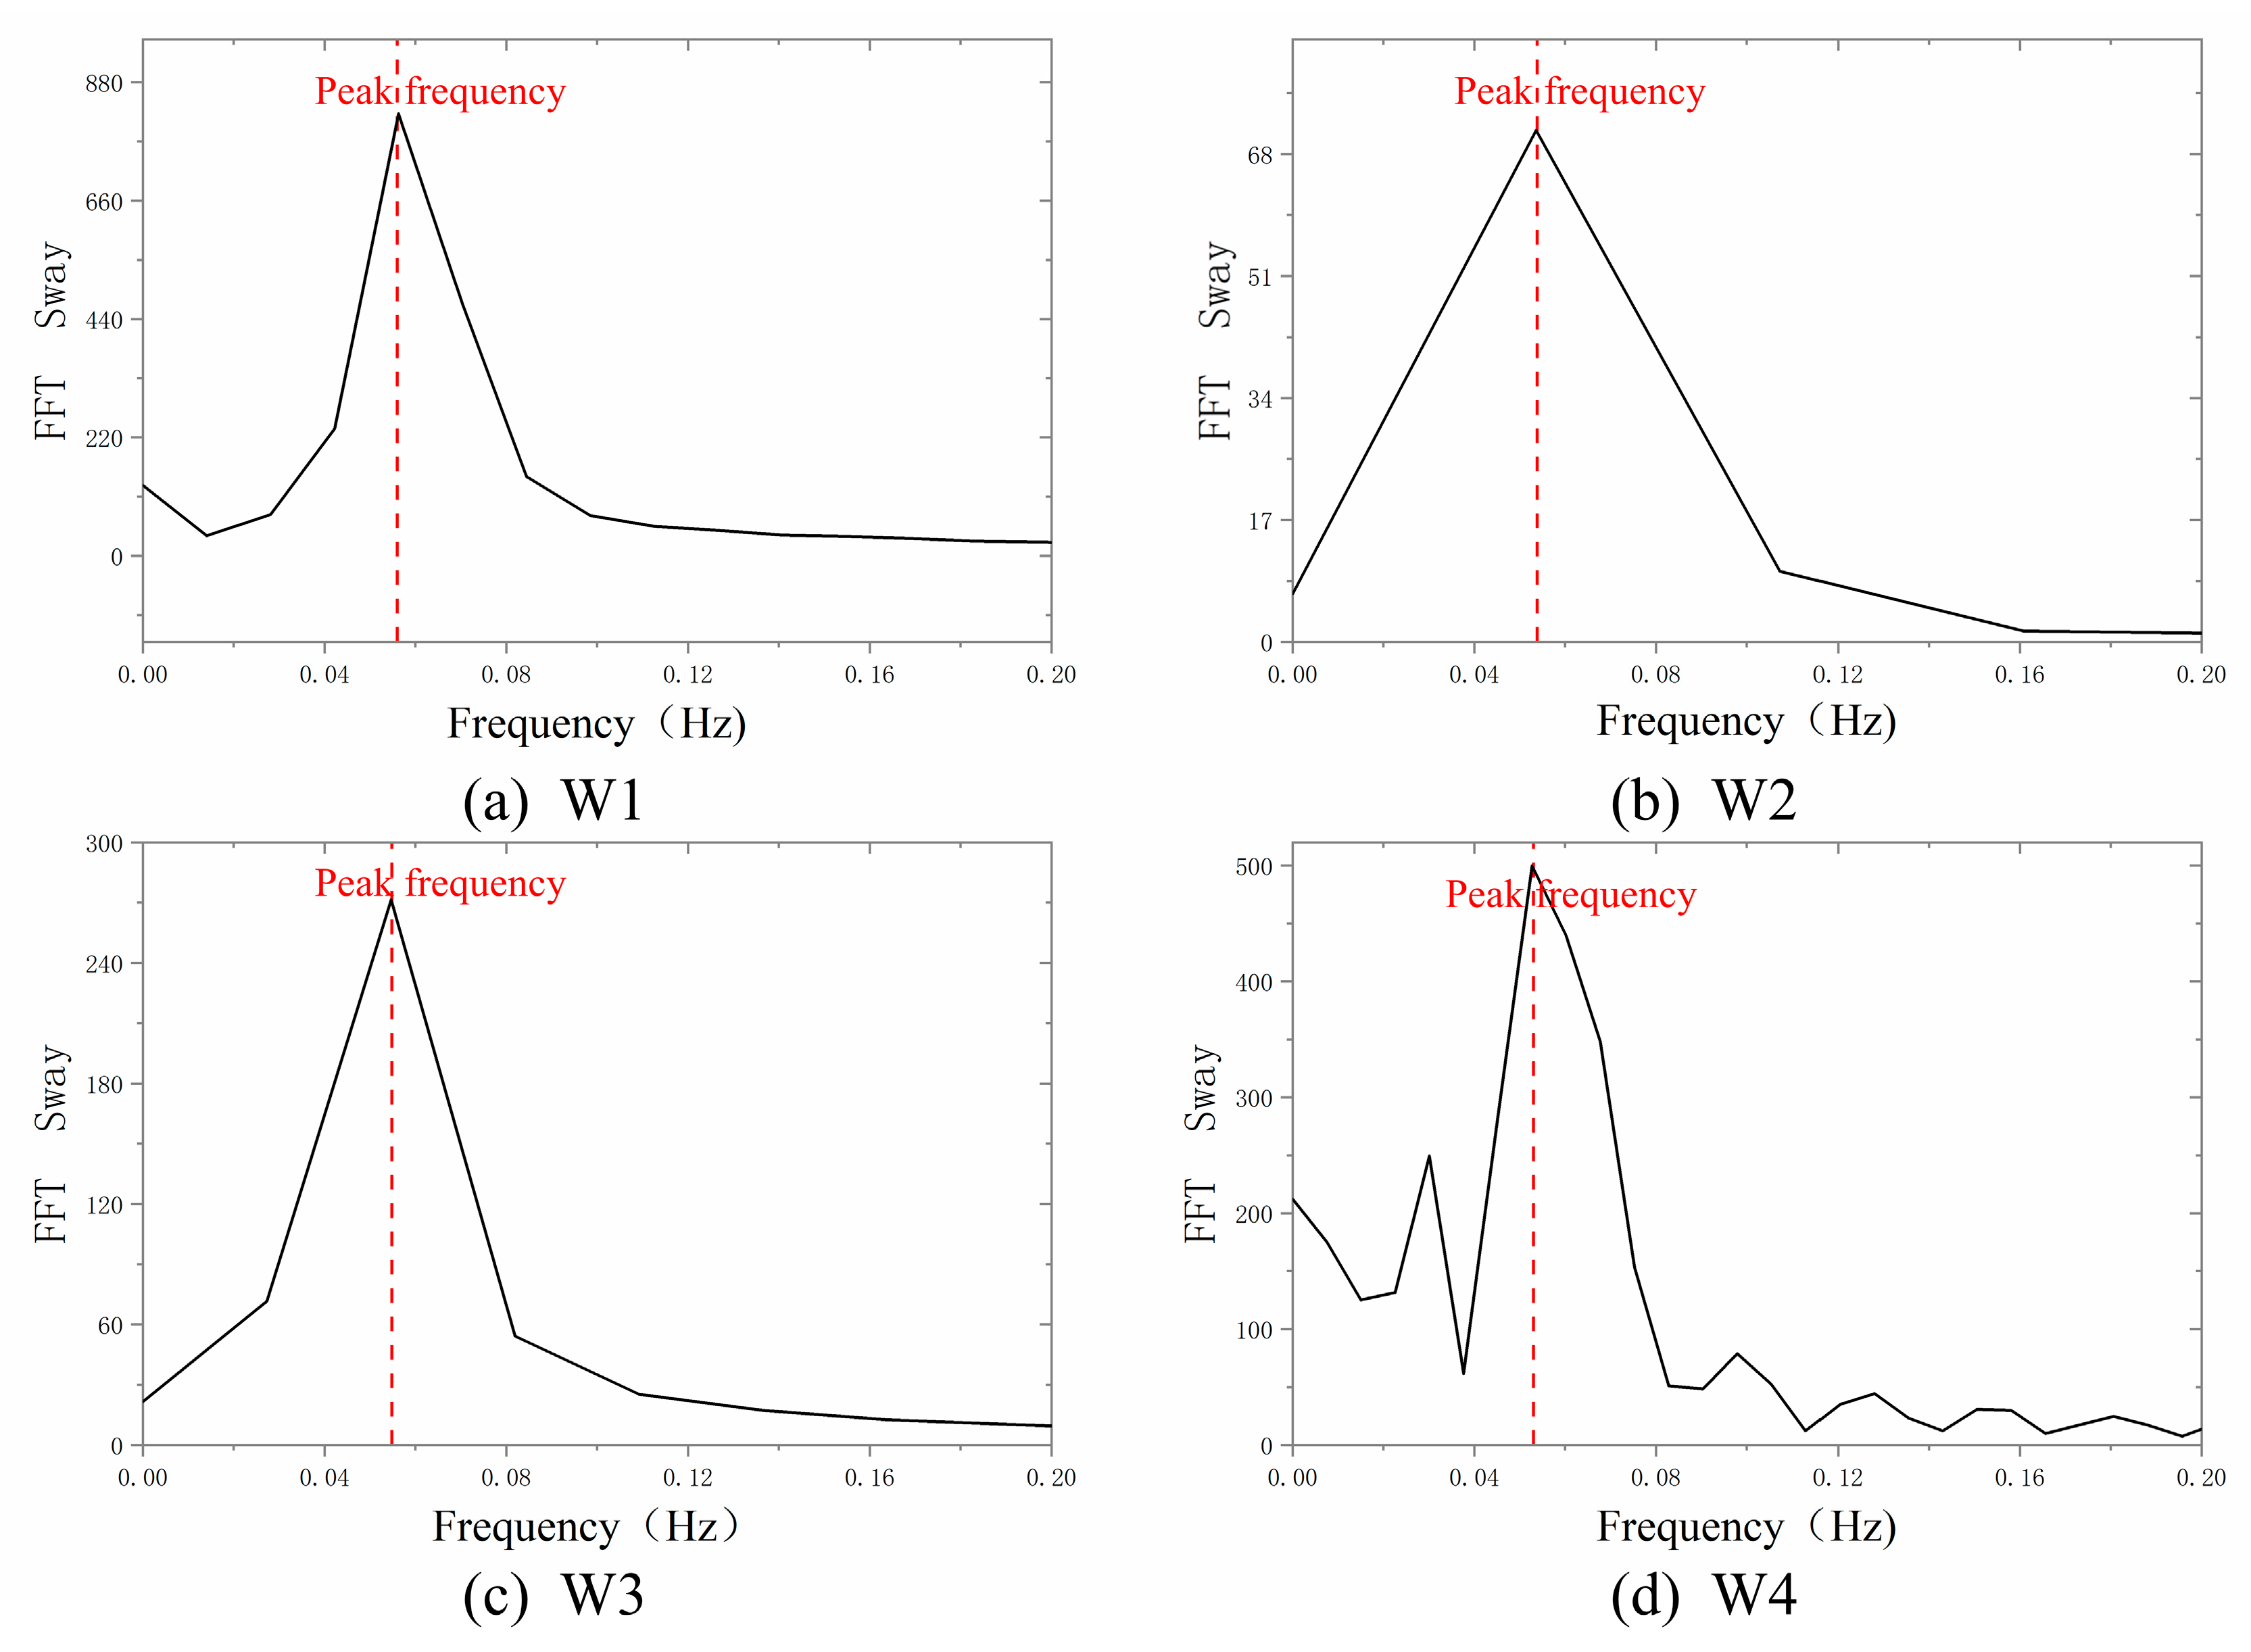
Fast Fourier transform was performed on the transverse motion time history curves of four conditions to obtain the response frequency (Figure 18). It was found that the transverse motion response frequency was close to the natural frequency of the platform.
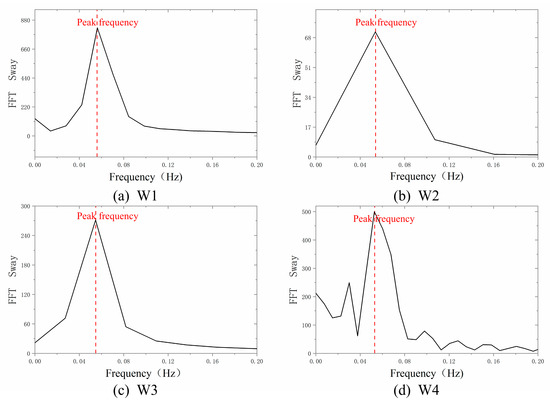
Figure 18.
Frequency domain analysis of the transverse motion under four conditions.
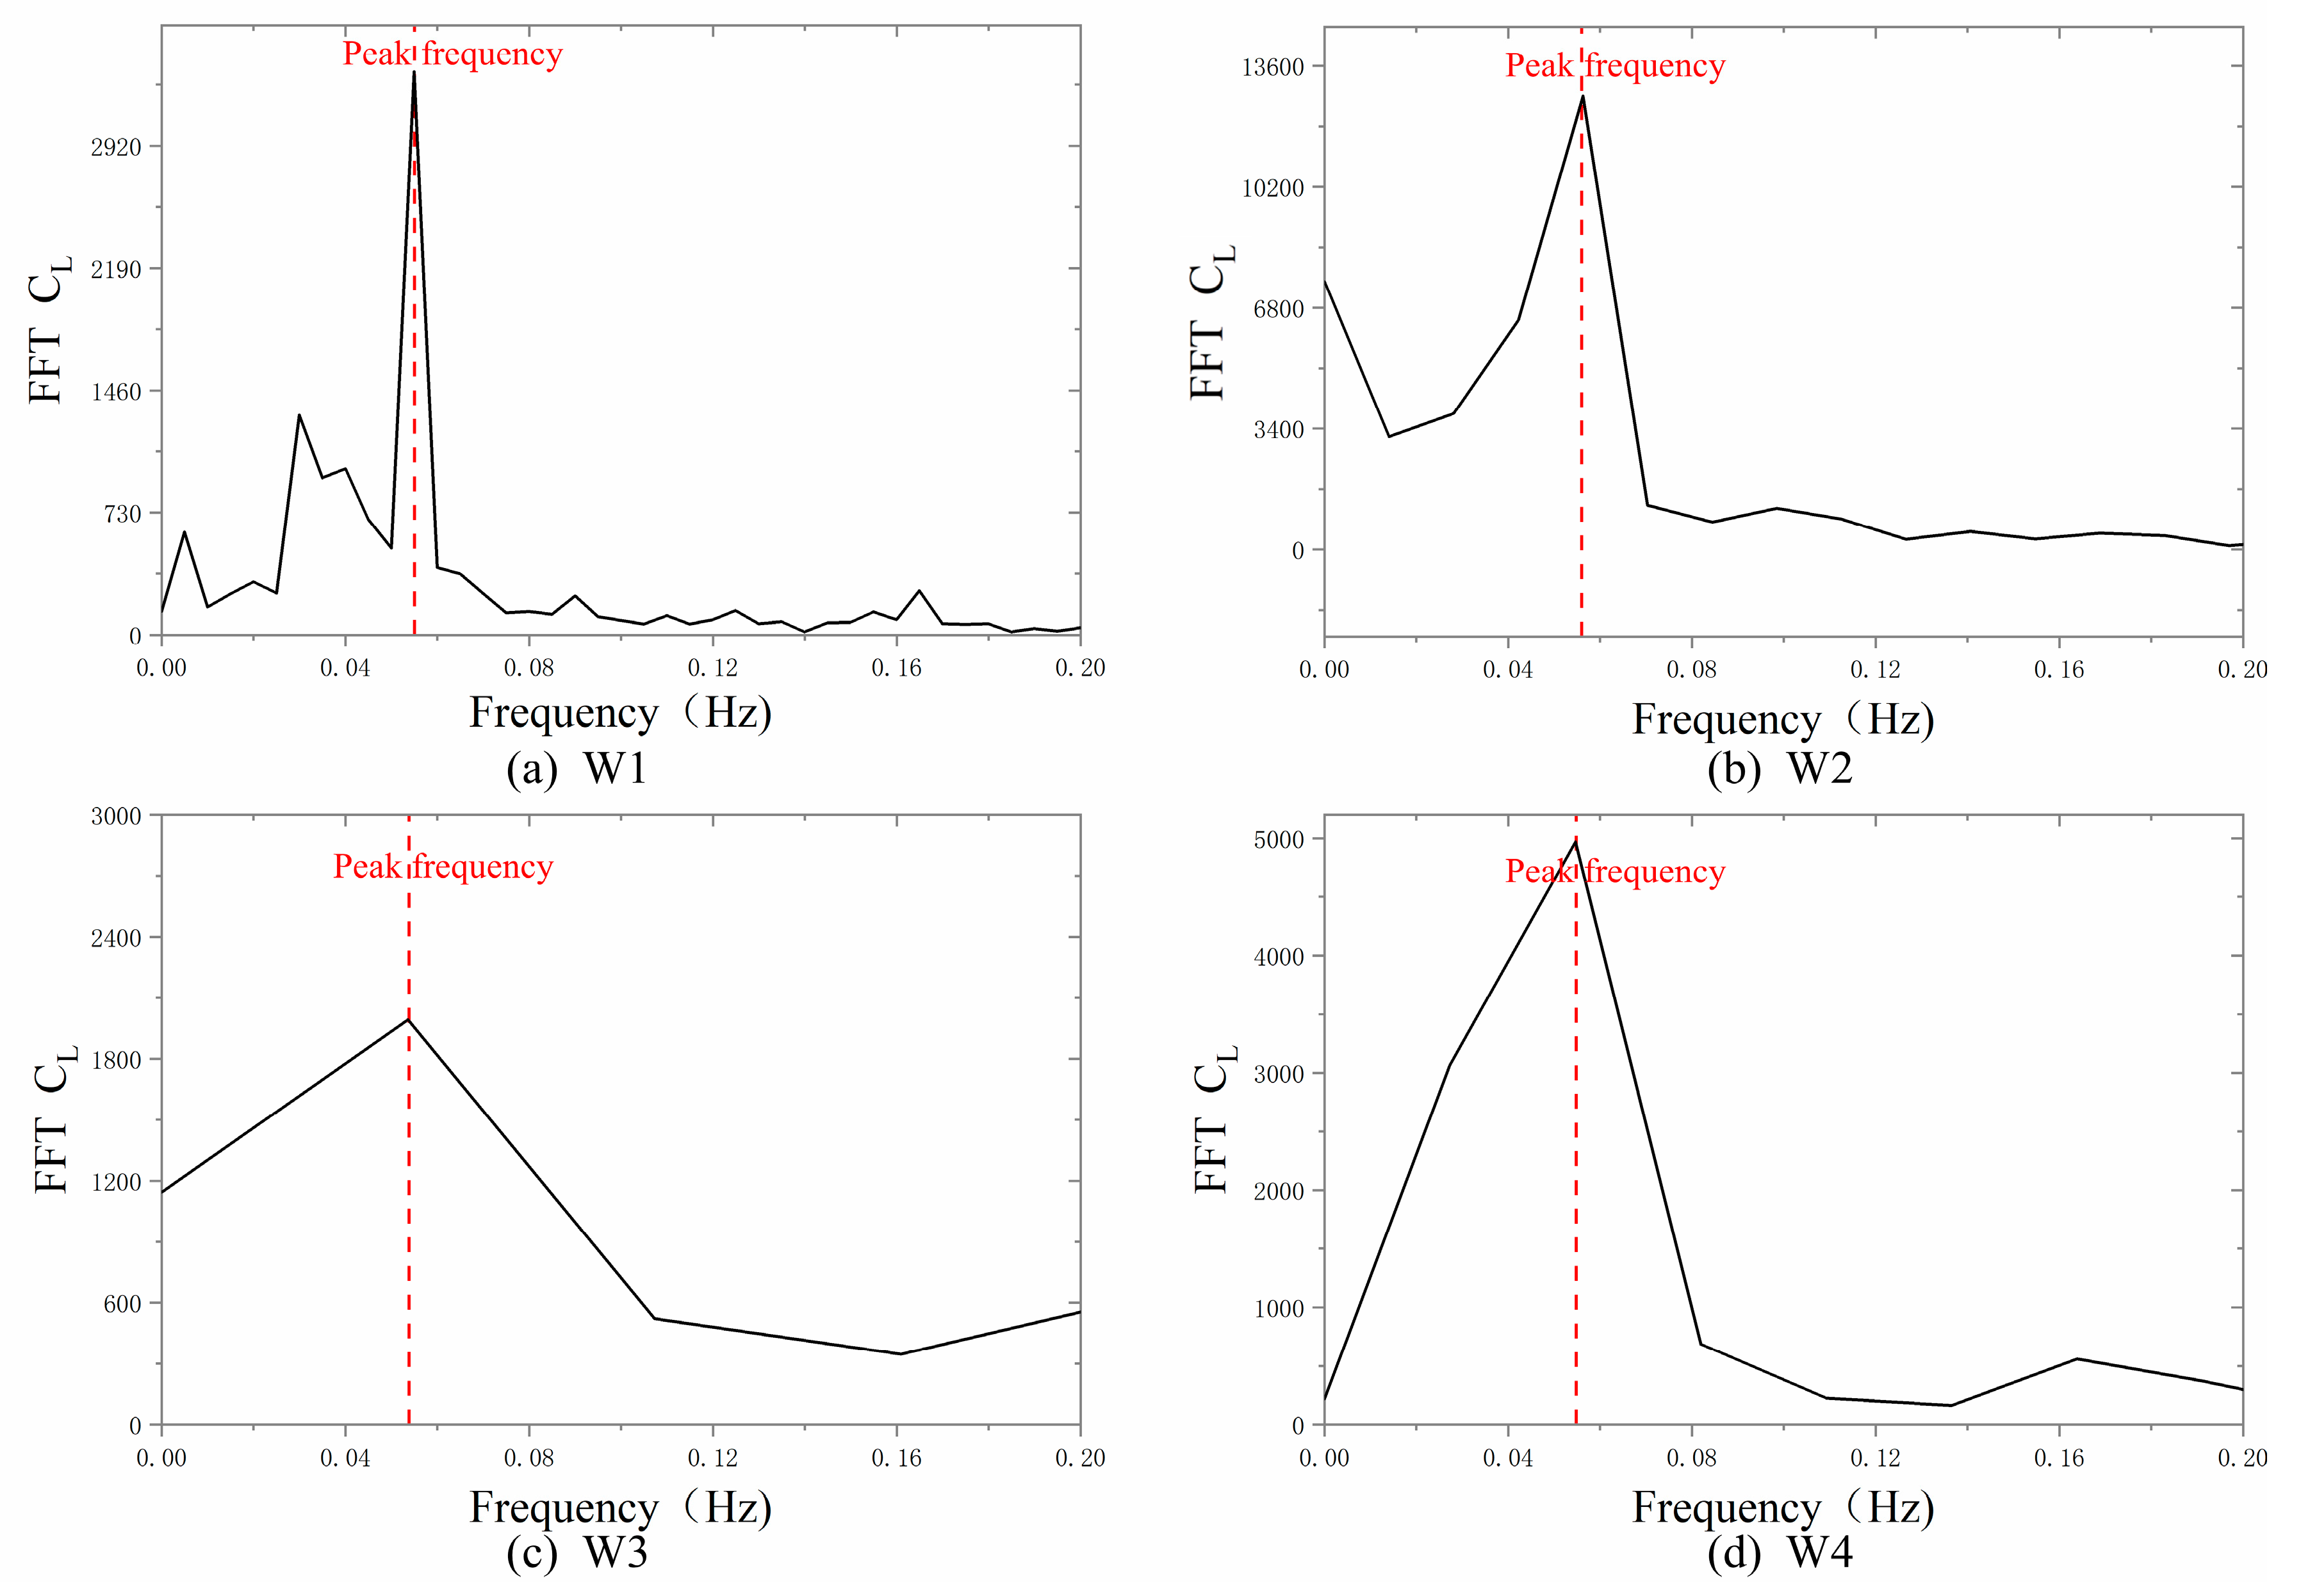
By performing a fast Fourier transform on the time history curve of lift force, the vortex shedding frequency was obtained, as shown in Figure 19. It can be clearly seen that the vortex shedding frequency of the platform is the same as the transverse motion response frequency in Figure 18, which further confirms that the transverse motion is dominated by lift force. At the same time, it is close to the natural frequency of the platform, and the vortex shedding frequency is basically not affected by regular waves. This indicates that the presence of regular waves has little effect on the frequency of vortex-induced motion on the platform, and vortex-induced motion is dominated by flow loads.
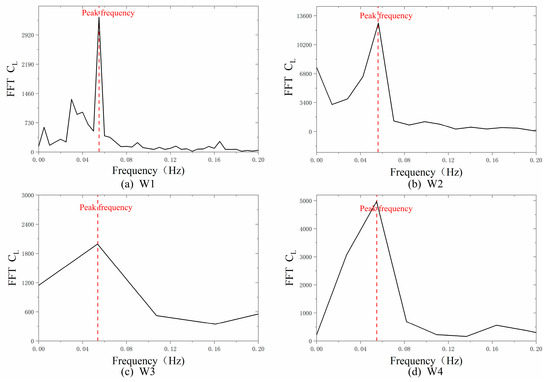
Figure 19.
Frequency domain analysis of platform lift force under four conditions.
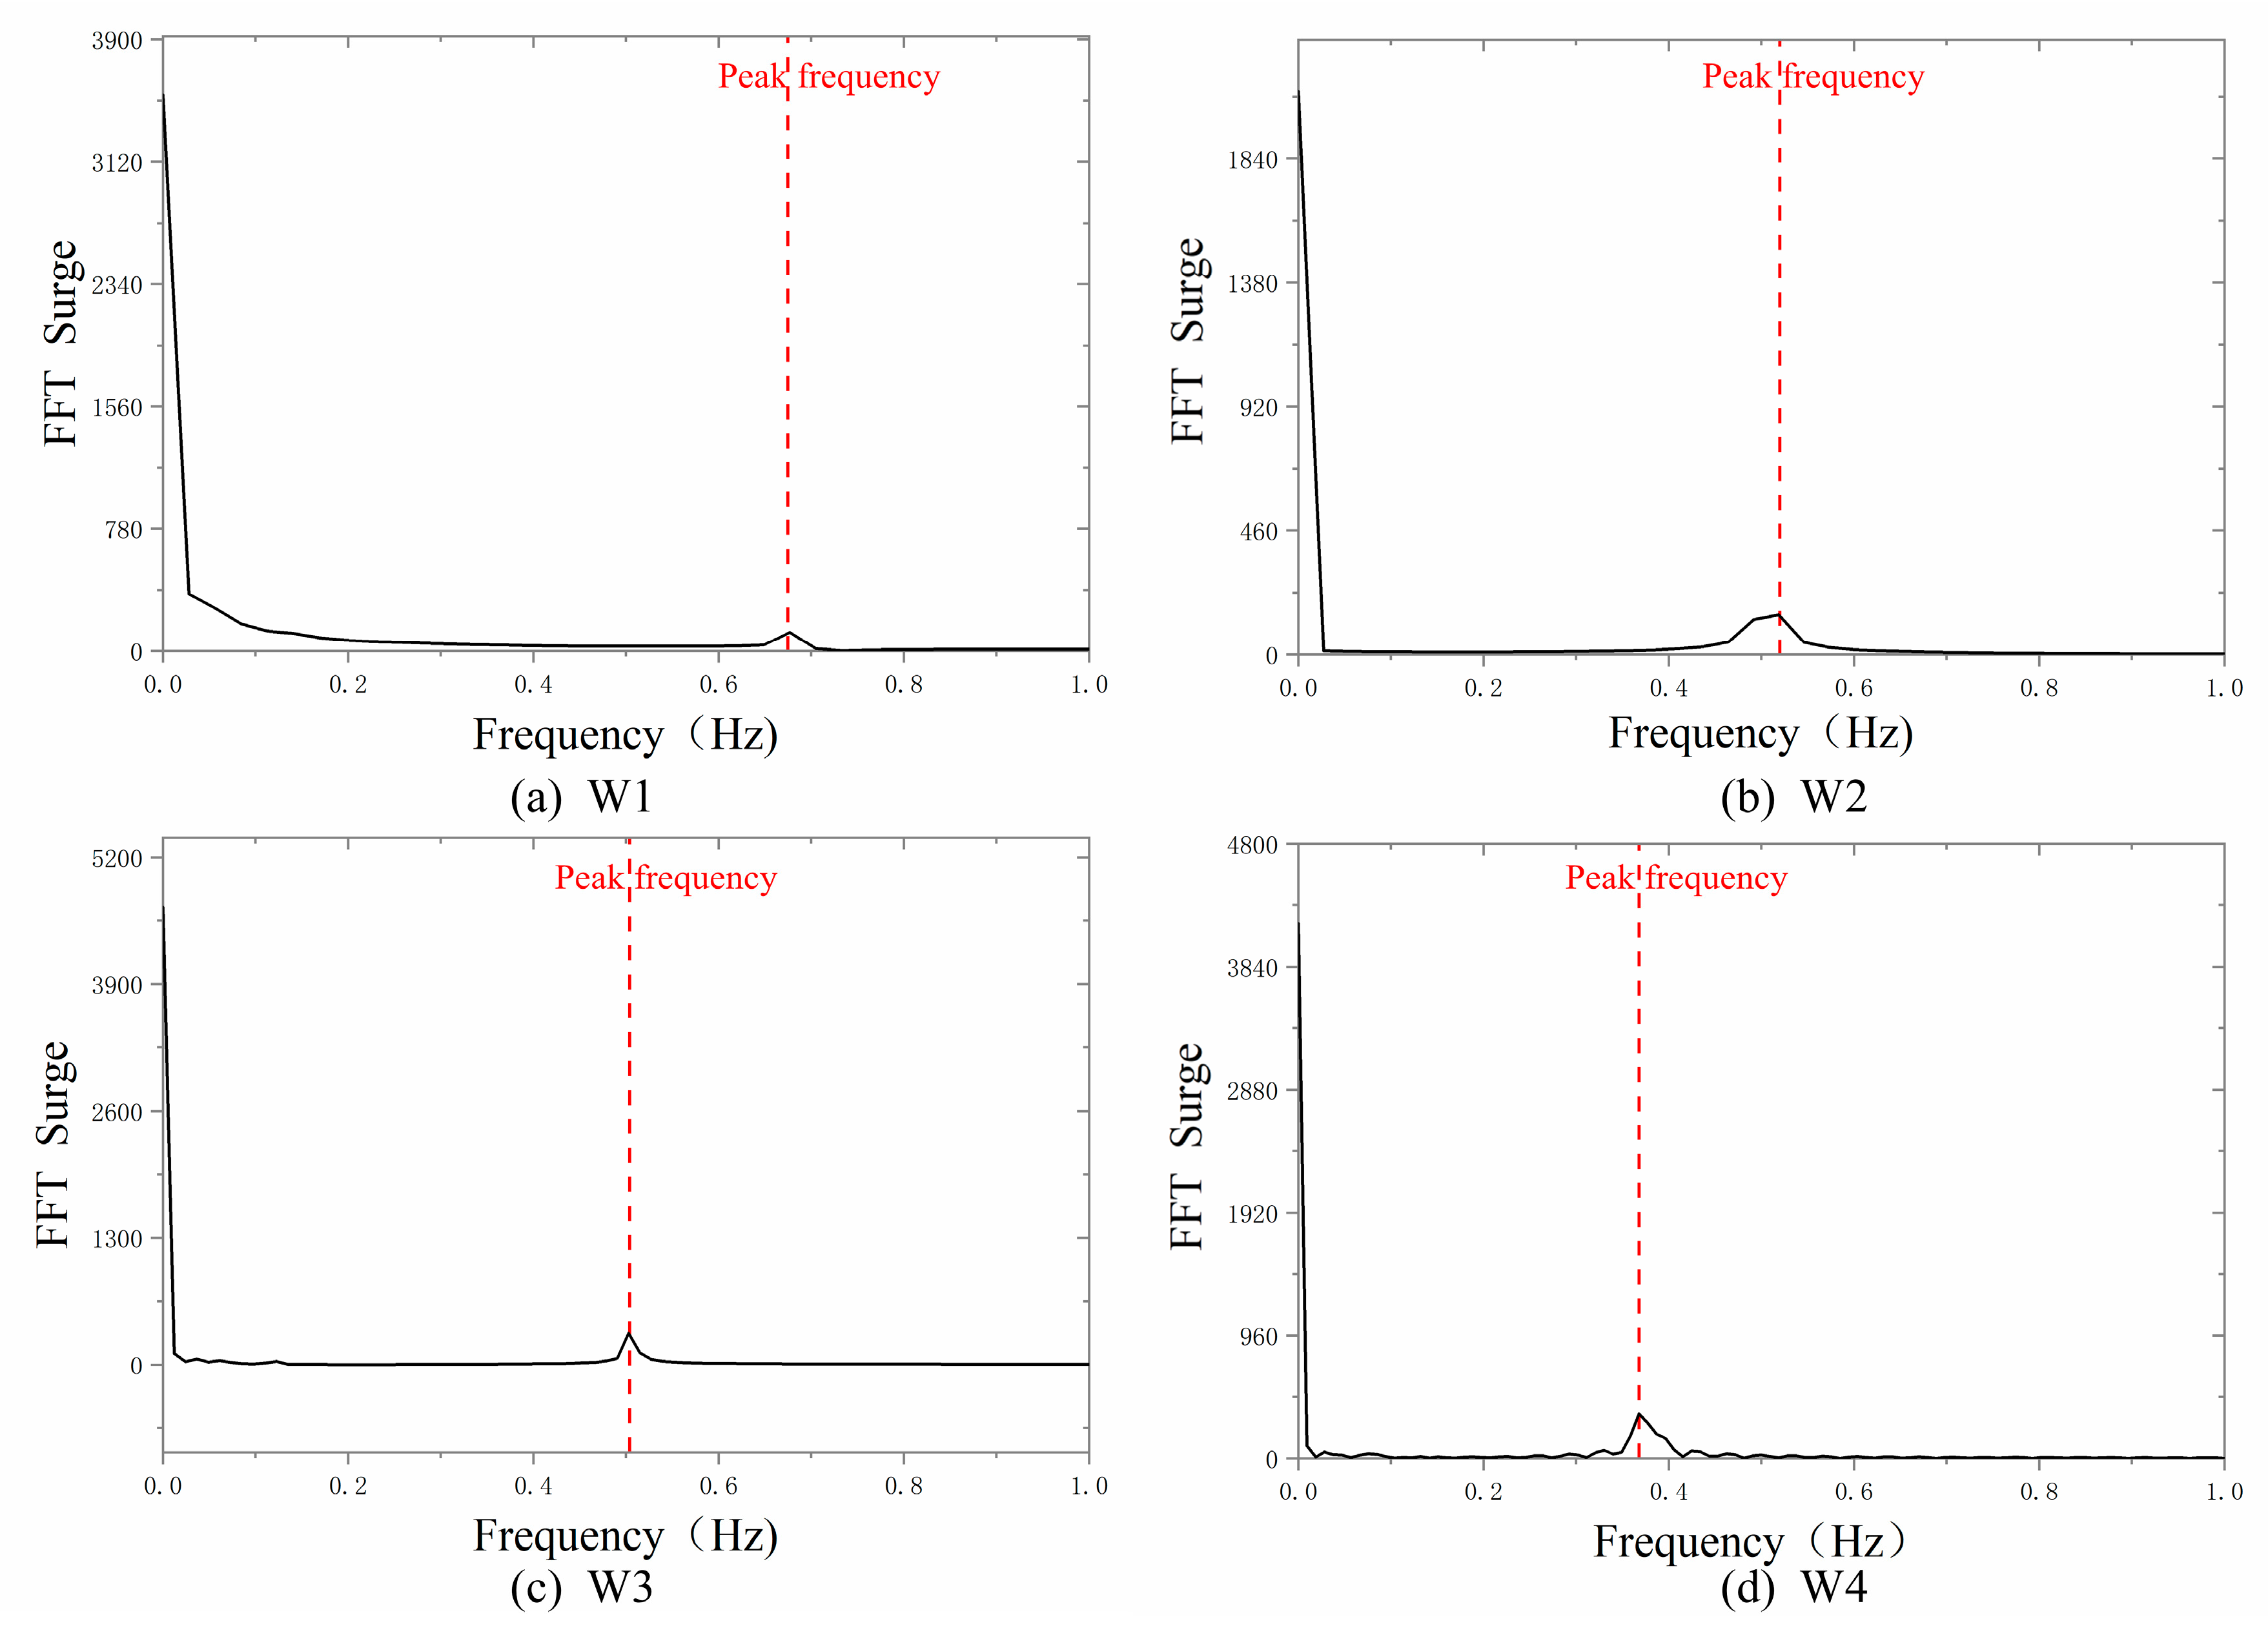
The main frequency of the frequency domain analysis graph obtained by performing fast Fourier transform on the time history curve of longitudinal motion is basically consistent with the frequencies of the four regular waves. This indicates that the longitudinal motion response frequency is greatly affected by wave frequency, as shown in Figure 20.
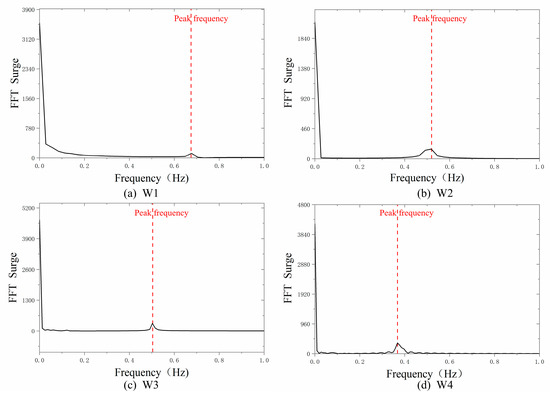
Figure 20.
Frequency domain analysis of the longitudinal motion under four conditions.
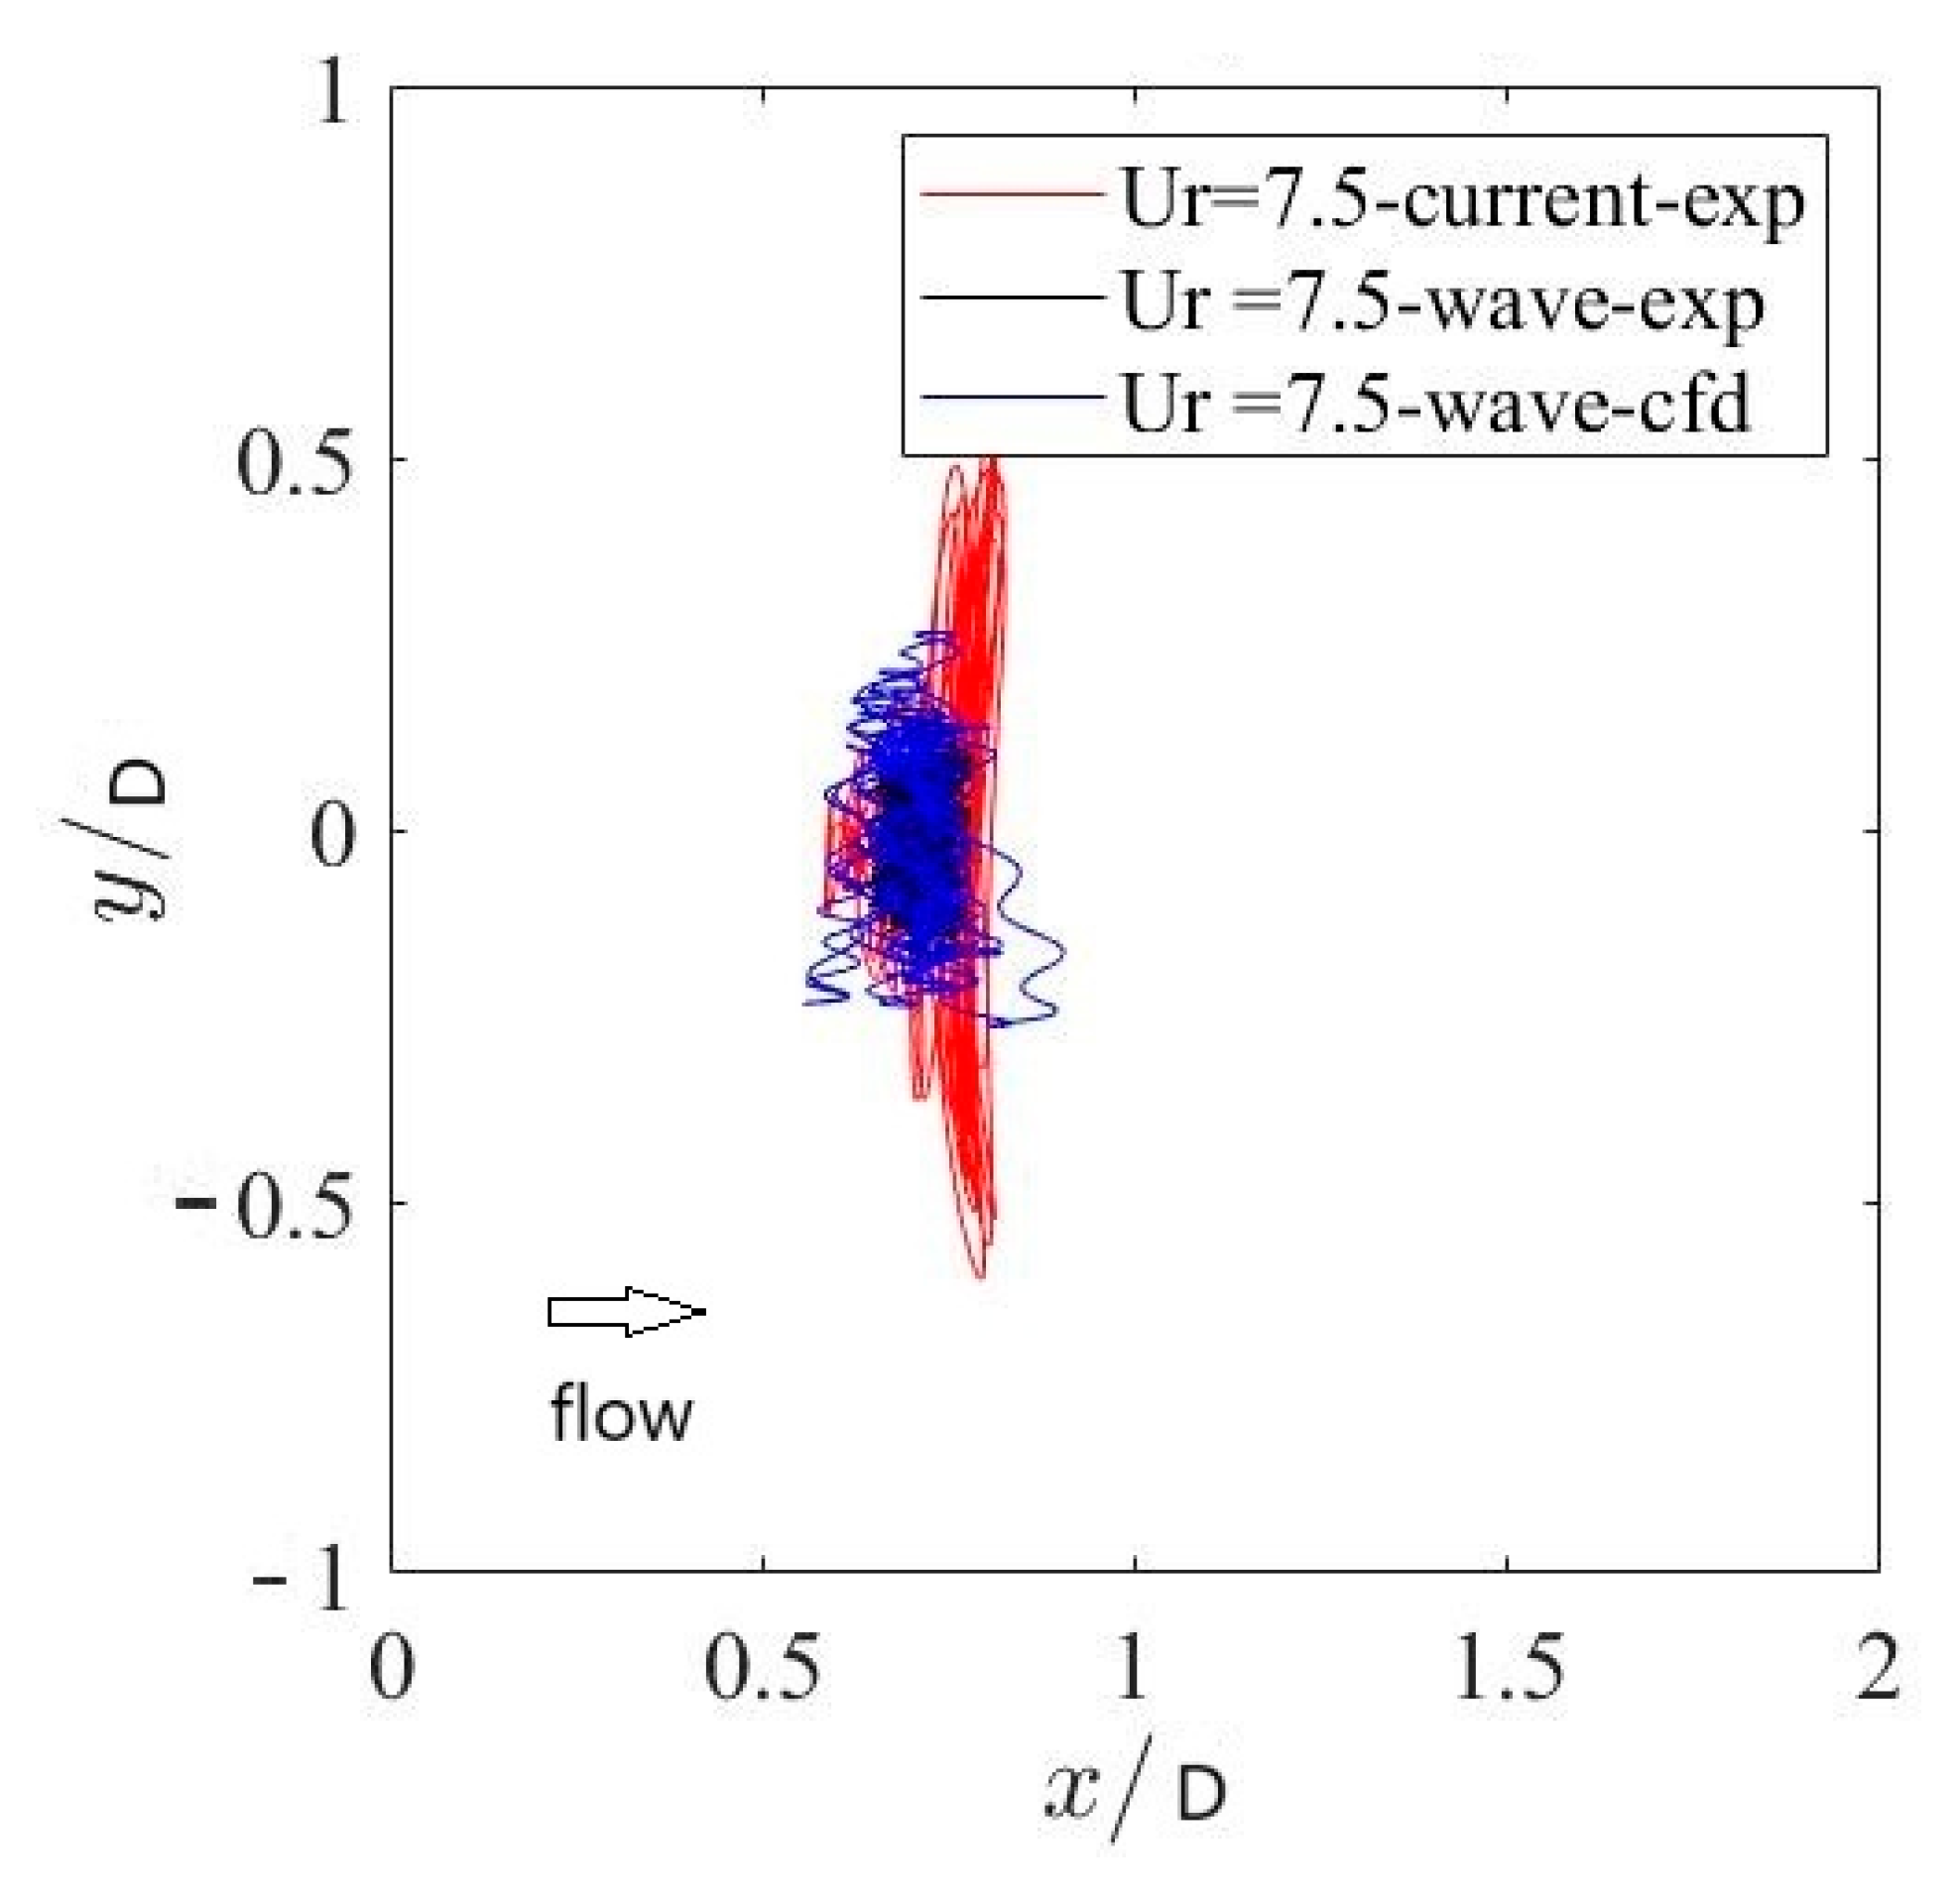
Under the combined effects of uniform flow and wave-current coupling (reduced velocity = 7.5, and incoming flow angle = 45°), the planar motion trajectory of the platform is depicted in Figure 21. The figure reveals that the presence of waves diminishes the platform’s transverse motion response, deviating from the band-like shape observed under uniform flow conditions and adopting a more square-like trajectory. The numerical simulation results align closely with the model experiment outcomes, although the trajectory exhibits a more pronounced wavy pattern and a broader planar motion range. These discrepancies highlight areas requiring further investigation.

Figure 21.
Comparison of planimetric trajectories of platform under uniform flow and wave-current conditions.
4.4. Instantaneous Flow Field
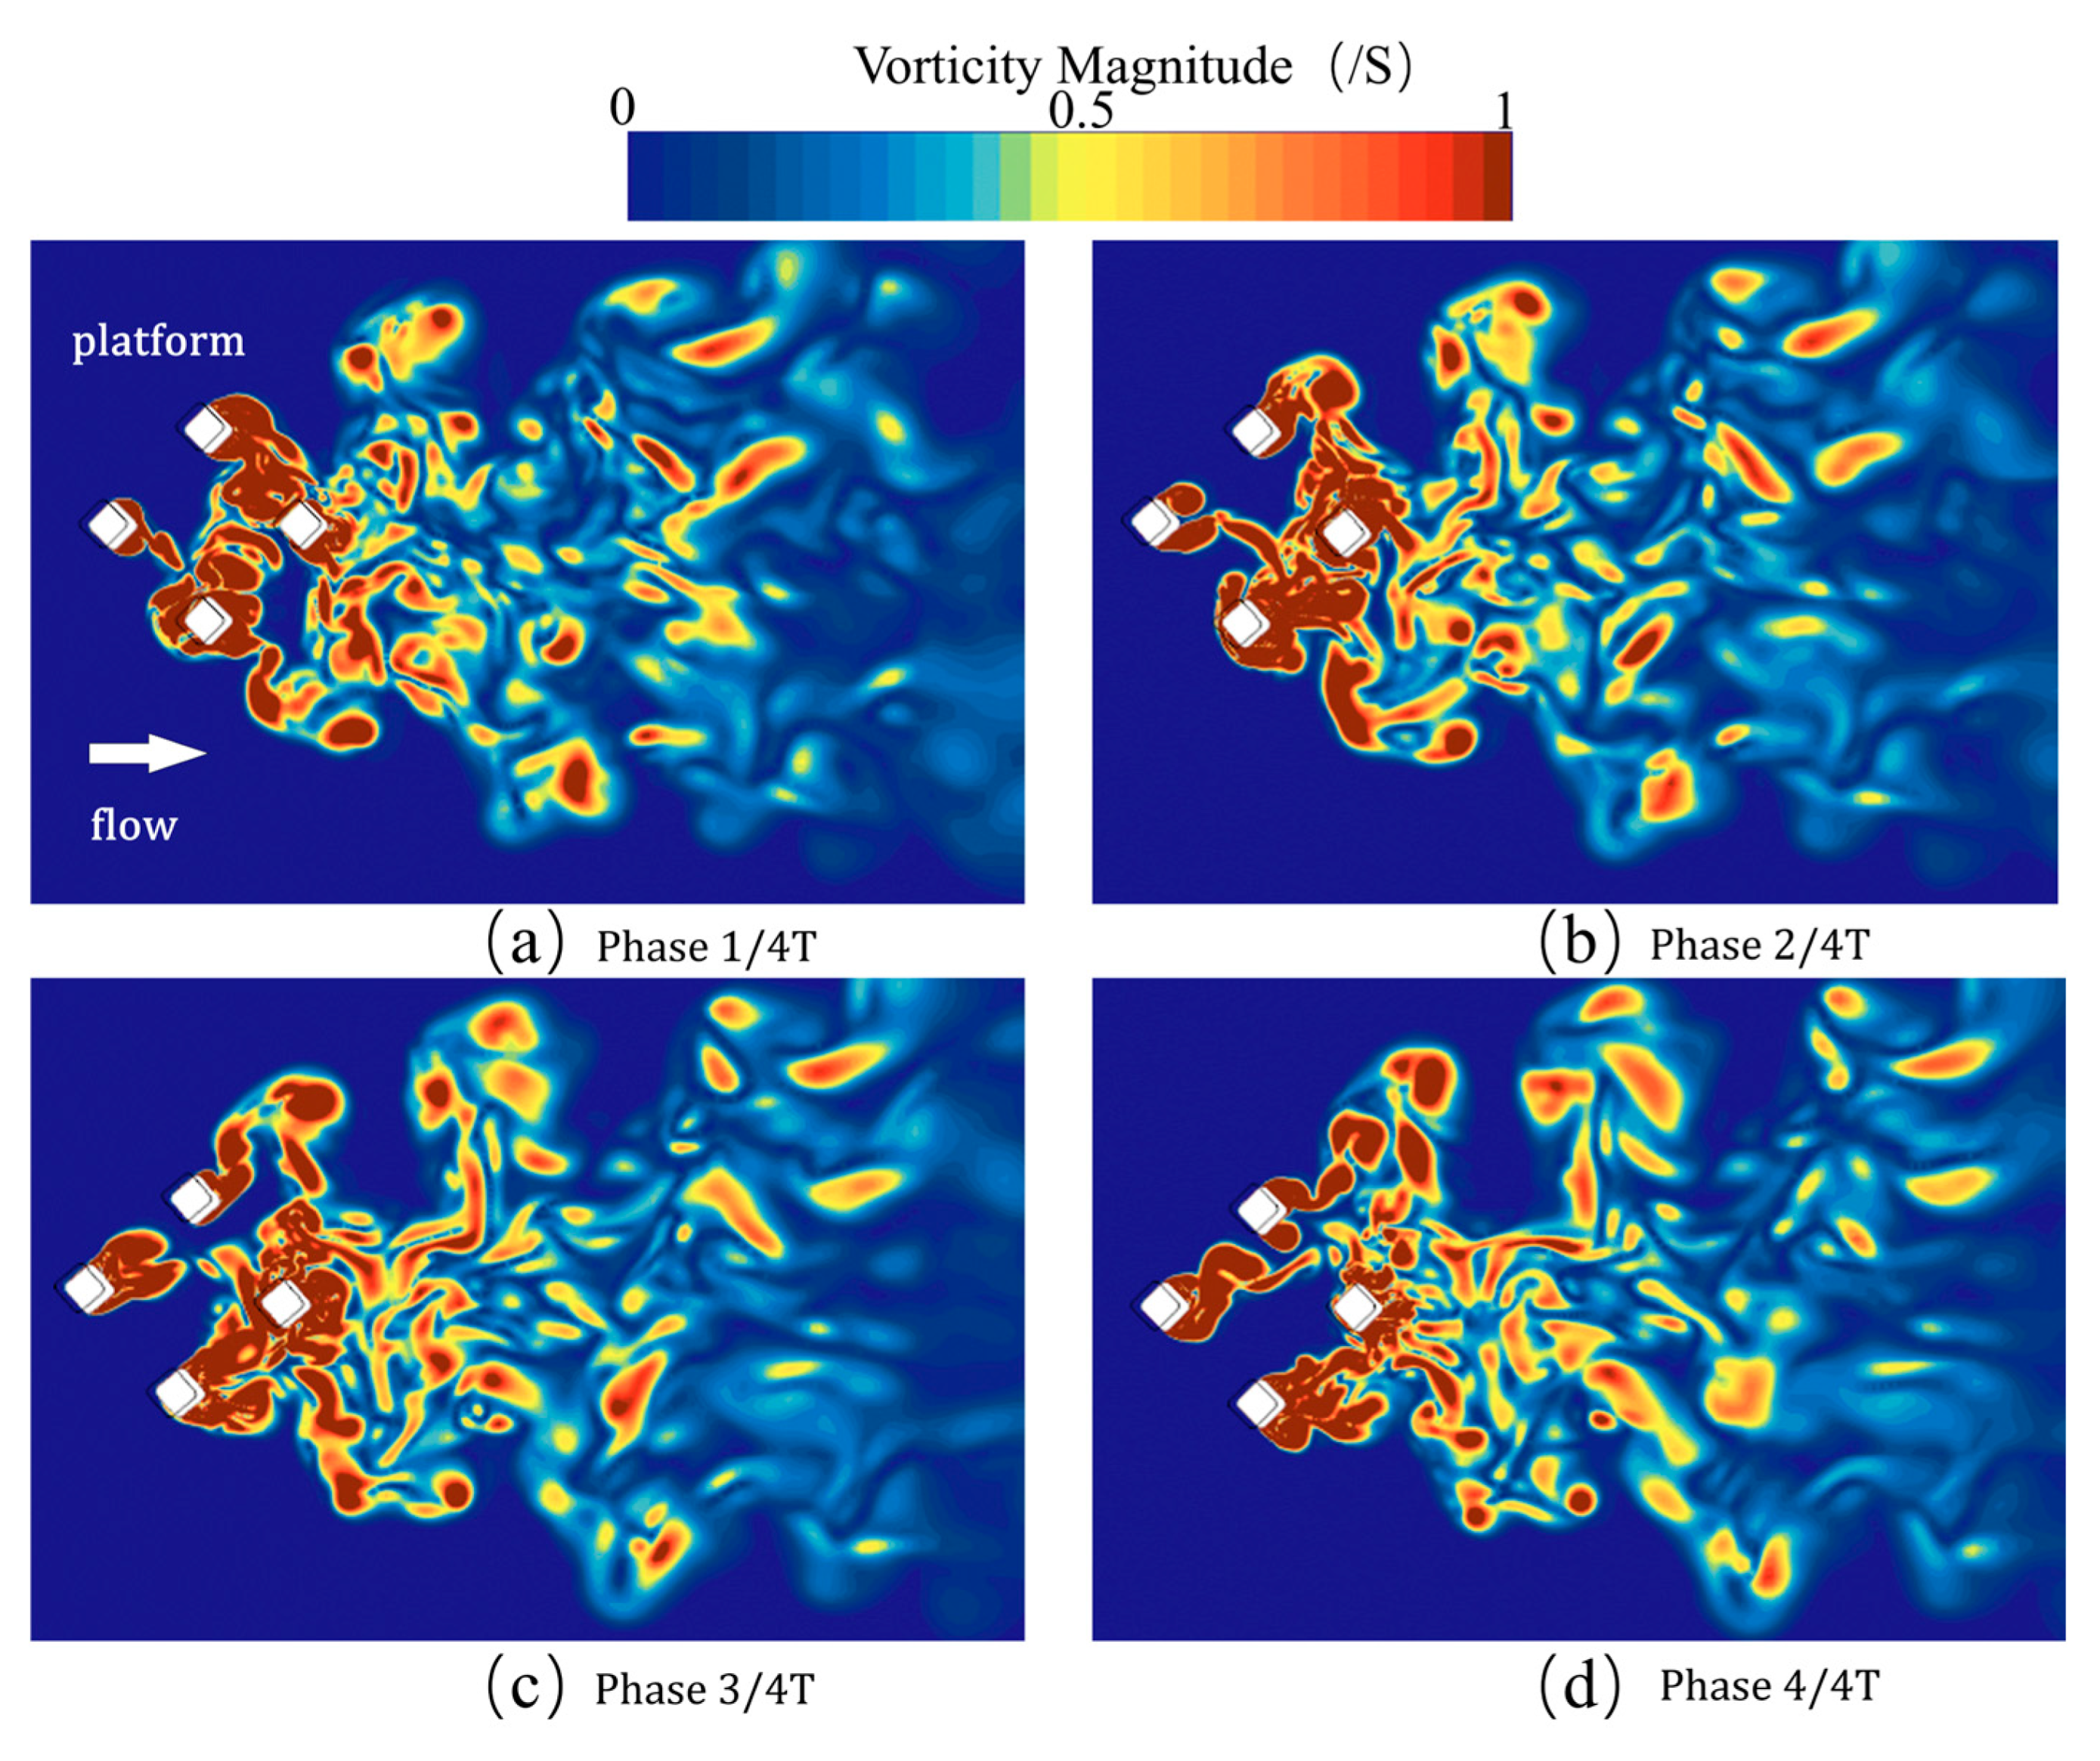
The instantaneous vorticity contour obtained from numerical simulation is shown in Figure 22, which allows for the observation of the physical morphology and fluid structure in the platform’s wake region. Within the flow field, alternating vortex shedding occurs on both sides of each platform column, creating a pulsating pressure difference that manifests as a horizontal lift force in the transverse direction. The platform responds to this lift force with a transverse motion response. Unlike a single cylinder, the vortex shedding on the columns of a semi-submersible platform, due to its four-column structure, does not occur in a straight-line direction and varies with the flow characteristics around the columns. Since the platform has a symmetrical structure, the vortex shedding also exhibits a certain degree of symmetry under the action of wave-current coupling.
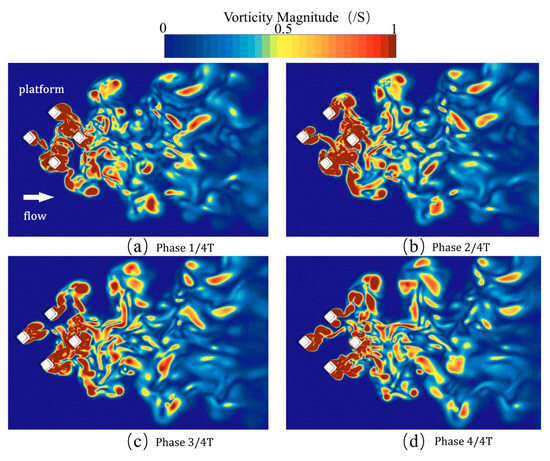
Figure 22.
Vortex cloud diagram for typical conditions.
5. Conclusions
By numerical simulation of the vortex-induced motion response of a semi-submersible platform, the vortex-induced motion characteristics were analyzed, providing a reference for theoretical research on vortex-induced motion of semi-submersible platforms. The main conclusions are as follows:
- Under the single action of uniform flow, the transverse motion perpendicular to the incoming flow direction dominates the vortex-induced motion. Regardless of the incoming flow angle of 0° or 45°, there is a significant “LOCK-IN” phenomenon in the range of reduced velocity , and a peak response amplitude appears near the reduced velocity = 7. When the inflow angle is 45°, the amplitude of the transverse motion response is larger than that at 0°. In terms of fluid force characteristics and response frequency, the transverse motion response frequency is the same as the vortex shedding frequency, which indicates that the transverse motion response of a semi-submersible platform is dominated by pulsating lift force. Within the range of reduced velocity , the vortex shedding frequency is roughly the same as the natural period of the platform, which is the fundamental reason for the “LOCK-IN” phenomenon in the transverse motion.
- Under identical wave-type coupling with varying reduced velocities (), the cross-flow motion response amplitude exhibits a characteristic rise to peak amplitude followed by gradual attenuation with increasing . For fixed with varying wave types, the response amplitude remains lower than the uniform flow condition. The vortex shedding frequency remains phase-locked to the platform’s natural frequency across all conditions, demonstrating wave-independent synchronization. However, the attenuated response amplitude reveals wave-induced suppression of vortex-induced motion through flow oscillation.
- Comparative analysis between numerical simulations and physical model tests demonstrates the following: Under uniform flow conditions, numerical results exhibit strong agreement with experimental measurements, validating the computational grid accuracy and physical model configurations. In wave-current coupling scenarios, while maintaining consistent dynamic trends, numerical models demonstrate notably higher response amplitudes, necessitating refinements in wave spectrum parametrization and grid convergence criteria. The complementary integration of numerical simulations (providing vorticity/velocity field visualization) and experimental benchmarks effectively mitigates individual limitations, enhancing result reliability and enabling in-depth investigation of vortex-induced motion mechanisms.
Author Contributions
Conceptualization, J.Y. and D.Z.; methodology, J.Y. and D.Z.; investigation, Y.Y.; data curation, Y.Y.; writing—original draft preparation, Y.Y.; writing—review and editing, D.Z. and C.D.; visualization, J.Y.; supervision, J.Y.; funding acquisition, J.Y. All authors have read and agreed to the published version of the manuscript.
Funding
The authors gratefully acknowledge the support provided for this research by the Natural Science Foundation of Guangdong Province (2022A1515011562) and Guangdong Provincial Special Fund for promoting high-quality economic development (Yuerong Office Letter [2020]161).
Institutional Review Board Statement
Not applicable.
Informed Consent Statement
Not applicable.
Data Availability Statement
The original contributions presented in this study are included in the article. Further inquiries can be directed to the corresponding author.
Conflicts of Interest
Author Yankun Yin was employed by the company CNOOC China Ltd. Zhanjiang. The remaining authors declare that the research was conducted in the absence of any commercial or financial relationships that could be construed as a potential conflict of interest.
References
- Waals, O.J.; Phadke, A.C.; Bultema, S. Flow induced motions on multi column floaters. In Proceedings of the 26th International Conference on Offshore Mechanics and Arctic Engineering, San Diego, CA, USA, 10–15 June 2007; pp. 669–678. [Google Scholar]
- Hong, Y.; Choi, Y.; Lee, J.; Kim, Y. Vortex-induced motion of a deep-draft semi-submersible in current and waves. In Proceedings of the Eighteenth (2008) International Offshore and Polar Engineering Conference, Vancouver, BC, Canada, 6–11 July 2008; pp. 453–459. [Google Scholar]
- Gonçalves, R.T.; Rosetti, G.F.; Fujarra, A.L.; Oliveira, A.C. Experimental study on vortex-induced motions of a semi-submersible platform with four columns, Part I: Effects of current incidence angle and hull appendages. Ocean. Eng. 2012, 54, 150–169. [Google Scholar] [CrossRef]
- Zheng, G.; Shi, J.; Li, L.; Li, Q.; Gu, Z.; Xu, W.; Lu, B.; Wang, C. Fluid-solid coupling-based vibration generation mechanism of the multiphase vortex. Processes 2023, 11, 568. [Google Scholar] [CrossRef]
- Gao, Z.; Wang, J.; Wang, J.; Mao, Y. Time-frequency analysis of the vortex motion in a cylindrical cyclone separator. Chem. Eng. J. 2019, 373, 1120–1131. [Google Scholar] [CrossRef]
- Pan, C.; Zhang, W. A comprehensive assessment on detached eddy simulation and delayed detached eddy simulation approaches in large-scale rotating separated flow in a centrifugal impeller under small flow rate. Phys. Fluids 2023, 35, 105111. [Google Scholar] [CrossRef]
- Li, J.; Ho, M.T.; Borg, M.K.; Cai, C.; Li, Z.H.; Zhang, Y. Pore-scale gas flow simulations by the DSBGK and DVM methods. Compute Fluids 2021, 226, 105017. [Google Scholar] [CrossRef]
- Ho, M.T.; Li, J.; Wu, L.; Reese, J.M.; Zhang, Y. A comparative study of the DSBGK and DVM methods for low-speed rarefied gas flows. Comput. Fluids 2019, 181, 143–159. [Google Scholar] [CrossRef]
- Heinz, S. A review of hybrid RANS-LES methods for turbulent flows: Concepts and applications. Prog. Aerosp. Sci. 2020, 114, 100597. [Google Scholar] [CrossRef]
- Menter, F.; Hüppe, A.; Matyushenko, A.; Kolmogorov, D. An overview of hybrid RANS–LES models developed for industrial CFD. Appl. Sci. 2021, 11, 2459. [Google Scholar] [CrossRef]
- Zheng, X.; Montazeri, H.; Blocken, B. CFD simulations of wind flow and mean surface pressure for buildings with balconies: Comparison of RANS and LES. Build. Environ. 2020, 173, 106747. [Google Scholar] [CrossRef]
- Shastri, R.; Brar, L.S. Numerical investigations of the flow-field inside cyclone separators with different cylinder-to-cone ratios using large-eddy simulation. Sep. Purif. Technol. 2020, 249, 117149. [Google Scholar] [CrossRef]
- He, X.; Zhao, F.; Vahdati, M. Detached eddy simulation: Recent development and application to compressor tip leakage flow. J. Turbomach. 2022, 144, 011009. [Google Scholar] [CrossRef]
- Kumar, R.; Padhee, S.S.; Samanta, D. Aerodynamic performance and flow mechanism of 3D flapping wing using discrete vortex method. J. Fluids Struct. 2024, 127, 104128. [Google Scholar] [CrossRef]
- Oliveira, M.A.d.; Moraes, P.G.d.; Andrade, C.L.d.; Bimbato, A.M.; Alcântara Pereira, L.A. Control and suppression of vortex shedding from a slightly rough circular cylinder by a discrete vortex method. Energies 2020, 13, 4481. [Google Scholar] [CrossRef]
- Faure, T.M.; Dumas, L.; Montagnier, O. Numerical study of two-airfoil arrangements by a discrete vortex method. Theor. Comput. Fluid Dyn. 2020, 34, 79–103. [Google Scholar] [CrossRef]
- Masdari, M.; Tahani, M.; Naderi, M.H.; Babayan, N. Optimization of airfoil Based Savonius wind turbine using coupled discrete vortex method and salp swarm algorithm. J. Clean. Prod. 2019, 222, 47–56. [Google Scholar] [CrossRef]
- Díaz-Carrasco, P.; Croquer, S.; Tamimi, V.; Lacey, J.; Poncet, S. Advances in numerical Reynolds-Averaged Navier–Stokes modelling of wave-structure-seabed interactions and scour. J. Mar. Sci. Eng. 2021, 9, 611. [Google Scholar] [CrossRef]
- Chen, W.; Xiang, Q.; Li, Y.; Liu, Z. On the mechanisms of pressure drop and viscous losses in hydrofoil tip-clearance flows. Energy 2023, 269, 126712. [Google Scholar] [CrossRef]
- Heinz, S. The large eddy simulation capability of Reynolds-averaged Navier-Stokes equations: Analytical results. Phys. Fluids 2019, 31, 021702. [Google Scholar] [CrossRef]
- Heinz, S.; Mokhtarpoor, R.; Stoellinger, M. Theory-based Reynolds-averaged Navier–Stokes equations with large eddy simulation capability for separated turbulent flow simulations. Phys. Fluids 2020, 32, 065102. [Google Scholar] [CrossRef]
- Li, X.; Zhang, J.; Lin, P.; Zhu, Z. An improved detached eddy simulation method for cavitation multiphase flow. Ocean. Eng. 2024, 313, 119359. [Google Scholar] [CrossRef]
- Chen, J.; Yang, R.; Huang, Z.; Li, G.; Qin, X.; Li, J.; Wu, X. Detached eddy simulation on the structure of swirling jet flow field. Pet. Explor. Dev. 2022, 49, 929–941. [Google Scholar] [CrossRef]
- Zhai, L.J.; Chen, H.X.; Ma, Z. A delayed detached eddy simulation model for the simulation of complex turbulent flow. J. Appl. Fluid Mech. 2022, 15, 1111–1124. [Google Scholar]
- Qian, G.W.; Ishihara, T. Numerical study of wind turbine wakes over escarpments by a modified delayed detached eddy simulation. J. Wind. Eng. Ind. Aerodyn. 2019, 191, 41–53. [Google Scholar] [CrossRef]
- Mukha, T.; Rezaeiravesh, S.; Liefvendahl, M. A library for wall-modelled large-eddy simulation based on OpenFOAM technology. Comput. Phys. Commun. 2019, 239, 204–224. [Google Scholar] [CrossRef]
- Ren, X.; Su, H.; Yu, H.-H.; Yan, Z. Wall-modeled large eddy simulation and detached eddy simulation of wall-mounted separated flow via OpenFOAM. Aerospace 2022, 9, 759. [Google Scholar] [CrossRef]
- Zhou, T.; Yang, Q.; Yan, B.; Deng, X.; Yuan, Y. Detached eddy simulation of turbulent flow fields over steep hilly terrain. J. Wind. Eng. Ind. Aerodyn. 2022, 221, 104906. [Google Scholar] [CrossRef]
- Li, J. Efficient prediction of gas permeability by hybrid DSBGK-LBM simulations. Fuel 2019, 250, 154–159. [Google Scholar] [CrossRef]
- Li, J.; Cai, C.; Li, Z.H. Efficient DSBGK simulations of the low speed thermal transpiration gas flows through micro-channels. Int. Commun. Heat Mass Transf. 2020, 119, 104924. [Google Scholar] [CrossRef]
- Spalart, P.R.; Jou, W.H.; Strelets, M.; Allmaras, S.R. Comments on the feasibility of LES for wings and on a hybrid RANS/LES approach. In Proceedings of the First AFOSR International Conference on DNS/LES, Ruston, LA, USA, 4–8 August 1997; pp. 137–147. [Google Scholar]
- Zhang, D.; Zhang, L.; Tang, H.; Yuan, S.; Wang, H.; Chen, S.N.; Zhao, Y. A novel fluid–solid coupling model for the oil–water flow in the natural fractured reservoirs. Phys. Fluids 2021, 33, 036601. [Google Scholar] [CrossRef]
- Zhu, Y.; Liu, C.; Liu, H.; Kou, Y.D.; Shi, B. A multi-field and fluid–solid coupling method for porous media based on DEM-PNM. Comput. Geotech. 2023, 154, 105118. [Google Scholar] [CrossRef]
- Xue, Y.; Feng, Y.; Zheng, X. Assessment of Compressibility Corrections on Spalart–Allmaras Turbulence Model for High-Mach-Number Flows. AIAA J. 2024, 62, 92–107. [Google Scholar] [CrossRef]
- Polewski, M.D.; Cizmas, P.G.A. Several cases for the validation of turbulence models implementation. Appl. Sci. 2021, 11, 3377. [Google Scholar] [CrossRef]
- Tang, Q. Experimental Study on Vortex-Induced Motion of a Platform Considering Wave-Current Coupling Effects. Ocean Eng. Equip. Technol. 2024, 11, 75–84. (In Chinese) [Google Scholar]
- Kim, J.W.; Magee, A.; Guan, K.Y.H. CFD simulation of flow-induced motions of a multi-column floating platform. In Proceedings of the ASME 2011 30th International Conference on Ocean, Off-Shore and Arctic Engineering, Rotterdam, The Netherlands, 19–24 June 2011; American Society of Mechanical Engineers (ASME): New York, NY, USA, 2011; pp. 319–326. [Google Scholar]
- Liu, M. Research on the Flow Characteristics and Vortex-Induced Motions of Deep-Draft Semi-Submersibles; Shanghai Jiao Tong Universuity: Shanghai, China, 2016. (In Chinese) [Google Scholar]
- Liu, M.; Xiao, L.; Yang, J.; Tian, X. Parametric study on the vortex-induced motions of semi-submersibles: Effect of rounded ratios of the column and pontoon. Phys. Fluids 2017, 29, 055101. [Google Scholar] [CrossRef]
- Bai, Z.N.; Xiao, L.F.; Cheng, Z.S.; Lai, Z.M. Experimental study on Vortex Induced Motion response of a deep draft semi-submersible platform. J. Ship Mech. 2014, 18, 377–384. (In Chinese) [Google Scholar]


Disclaimer/Publisher’s Note: The statements, opinions and data contained in all publications are solely those of the individual author(s) and contributor(s) and not of MDPI and/or the editor(s). MDPI and/or the editor(s) disclaim responsibility for any injury to people or property resulting from any ideas, methods, instructions or products referred to in the content. |
© 2025 by the authors. Licensee MDPI, Basel, Switzerland. This article is an open access article distributed under the terms and conditions of the Creative Commons Attribution (CC BY) license (https://creativecommons.org/licenses/by/4.0/).