Article

Prediction of Water Quality Index of Island Counties Under River Length System—A Case Study of Yuhuan City

1
School of Business, Taizhou University, Taizhou 318000, China
2
Yuhuan Ecological Environment Branch Bureau, Yuhuan 317600, China
3
School of Mechanical, Electrical and Information Engineering, Putian University, Putian 351100, China
4
Taizhou Environmental Science Design and Research Institute Co., Ltd., Taizhou 318000, China
*
Author to whom correspondence should be addressed.
J. Mar. Sci. Eng. 2025, 13(3), 539; https://doi.org/10.3390/jmse13030539
Submission received: 14 January 2025 / Revised: 13 February 2025 / Accepted: 7 March 2025 / Published: 11 March 2025
(This article belongs to the Section Marine Pollution)

Abstract

:
In order to cope with the extremely difficult challenges of water pollution control, China has widely implemented the river chief system. The water quality monitoring of surface water environment, as a solid defense line to safeguard human health and ecosystem balance, is of great importance in the river chief system. As a well-known island county in China, Yuhuan City holds even more precious water resources. Leveraging machine learning technology to develop water quality prediction models is of great significance for enhancing the monitoring and evaluation of surface water environment quality. This case study aims to evaluate the effectiveness of six machine learning models in predicting water quality index (CWQI) and uses SHAP (Shapley Additive exPlans) as an interpretability analysis method to deeply analyze the contribution of each variable to the model’s prediction results. The research results show that all models exhibited good performance in predicting CWQI, and as the number of significantly correlated variables in the input variables increased, the prediction accuracy of the models also showed a gradual improvement trend. Under the optimal input variable combination, the Extreme Gradient Boosting model demonstrated the best prediction performance, with a root mean square error (RMSE) of 0.7081, a mean absolute error (MAE) of 0.4702, and an adjusted coefficient of determination (Adj.R2) of 0.6400. Through SHAP analysis, we found that the concentrations of TP (total phosphorus), NH3-N (ammonia nitrogen), and CODCr (chemical oxygen demand) have a significant impact on the prediction of CWQI in Yuhuan City. The implementation of the river chief system not only enhances the pertinence and effectiveness of water quality management, but also provides richer and more accurate data support for machine learning models, further improving the accuracy and reliability of water quality prediction models.

1. Introduction

China is currently undergoing a crucial phase of modernization and transformation. Rapid socioeconomic development and profound institutional reforms have created unprecedented challenges for environmental governance, particularly in water management. Despite substantial governmental investments in water environment governance, the severity of water pollution remains a pressing concern [1,2,3]. While initial successes in air pollution control have shifted focus toward water pollution mitigation, the urgency of addressing aquatic environmental issues has become increasingly prominent. Under the national ecological civilization strategy, the Chinese government has outlined ambitious goals to build a “Beautiful China”. This initiative emphasizes deepening institutional reforms, optimizing territorial spatial planning, enhancing resource efficiency, and strengthening environmental protection mechanisms to foster harmonious coexistence between humanity and nature [4,5]. In this context, the River Chief System emerges as an innovative Chinese governance model [6], distinguished by its unique institutional design and demonstrable effectiveness in water environment management. Recognized as a pivotal mechanism for addressing environmental challenges and modernizing water governance practices [7,8,9,10], the system employs water quality monitoring as a key performance indicator for evaluating river health and administrative accountability, ensuring scientific and results-driven management approaches [11,12].
Recent analyses of China’s water quality reveal significant improvements, particularly following the implementation of the River Chief System (RCS). Pilot cities saw industrial wastewater discharge intensity drop by 10.25% [13] and enterprise COD emissions decline by 3.7% [14]. Concurrently, scholars emphasize that effective water protection requires systematic environmental assessments, driving a surge in surface water evaluations and pollution control research. Key studies include the following: Deb et al. [15] assessing the Damodar River’s Water Quality Index (WQI) using 14 parameters (e.g., pH, dissolved oxygen); Tong et al. [16] comparing surface and groundwater pollution via WQI, Hazard Quotient, and Cancer Risk metrics; Dandge and Patil [17] evaluating drinking water in Maharashtra using 15 parameters (e.g., fluoride, chloride); Hao et al. [18] analyzing COD, NH3-N, and heavy metals through pollution indices and principal component analysis; Hemachandra and Sewwandi [19] developing pollution indices for the San Sebastian Canal and proposing targeted remediation strategies. However, technological constraints hinder water quality research. First, traditional methods like chemical and spectral analysis, while accurate, lack real-time capabilities due to lengthy processing and high equipment costs [20,21]. Second, reliance on manual sampling and data processing increases labor expenses and error risks [22,23]. Third, emerging pollutants—endocrine disruptors, microplastics, pharmaceuticals—often evade detection by conventional technologies, which struggle to quantify trace concentrations critical to ecological and human health [24,25,26,27]. Addressing these gaps is vital for advancing water quality management. Therefore, it is necessary to find an efficient and scientific way to monitor and evaluate the quality of the surface water environment, and predict its changing trends.
As water quality monitoring data rapidly accumulate, traditional analytical methods struggle with challenges like high dimensionality, noise, and inconsistent formatting, hindering deeper insights into issues such as eutrophication and heavy metal pollution. Machine learning (ML) and deep learning have emerged as transformative tools, offering superior data integration, computational power, and predictive accuracy compared to conventional approaches. Techniques like neural networks, random forest, XGBoost, and LSTM have demonstrated exceptional performance in water quality classification, pollution prediction, and ecosystem management [28,29,30,31,32,33,34]. For instance, LSTM-based models achieved 99.7% accuracy in drinking water classification [35,36], while hybrid ANN frameworks outperformed empirical algorithms in nutrient analysis [37]. SVM and decision tree models also excelled in regional water quality assessments [38,39,40]. However, ML models face limitations, including heavy reliance on data quality and challenges in generalizing across diverse water systems, particularly in data-scarce or noisy scenarios [41,42,43]. Current research often focuses on localized studies, limiting broader applicability. Future advancements may lie in hybrid models that combine multiple algorithms, enhancing adaptability to dynamic water quality challenges. Such innovations could strengthen water safety strategies and ecological governance, bridging gaps between theoretical potential and real-world implementation.
Therefore, this paper proposes an interpretable hybrid model based on the combination of XGBoost and Shap in an attempt to improve the prediction accuracy of WQI in the case of small samples and to quantitatively explain the degree of contribution of water quality-related factors to good and bad water quality.

2. Materials and Methods
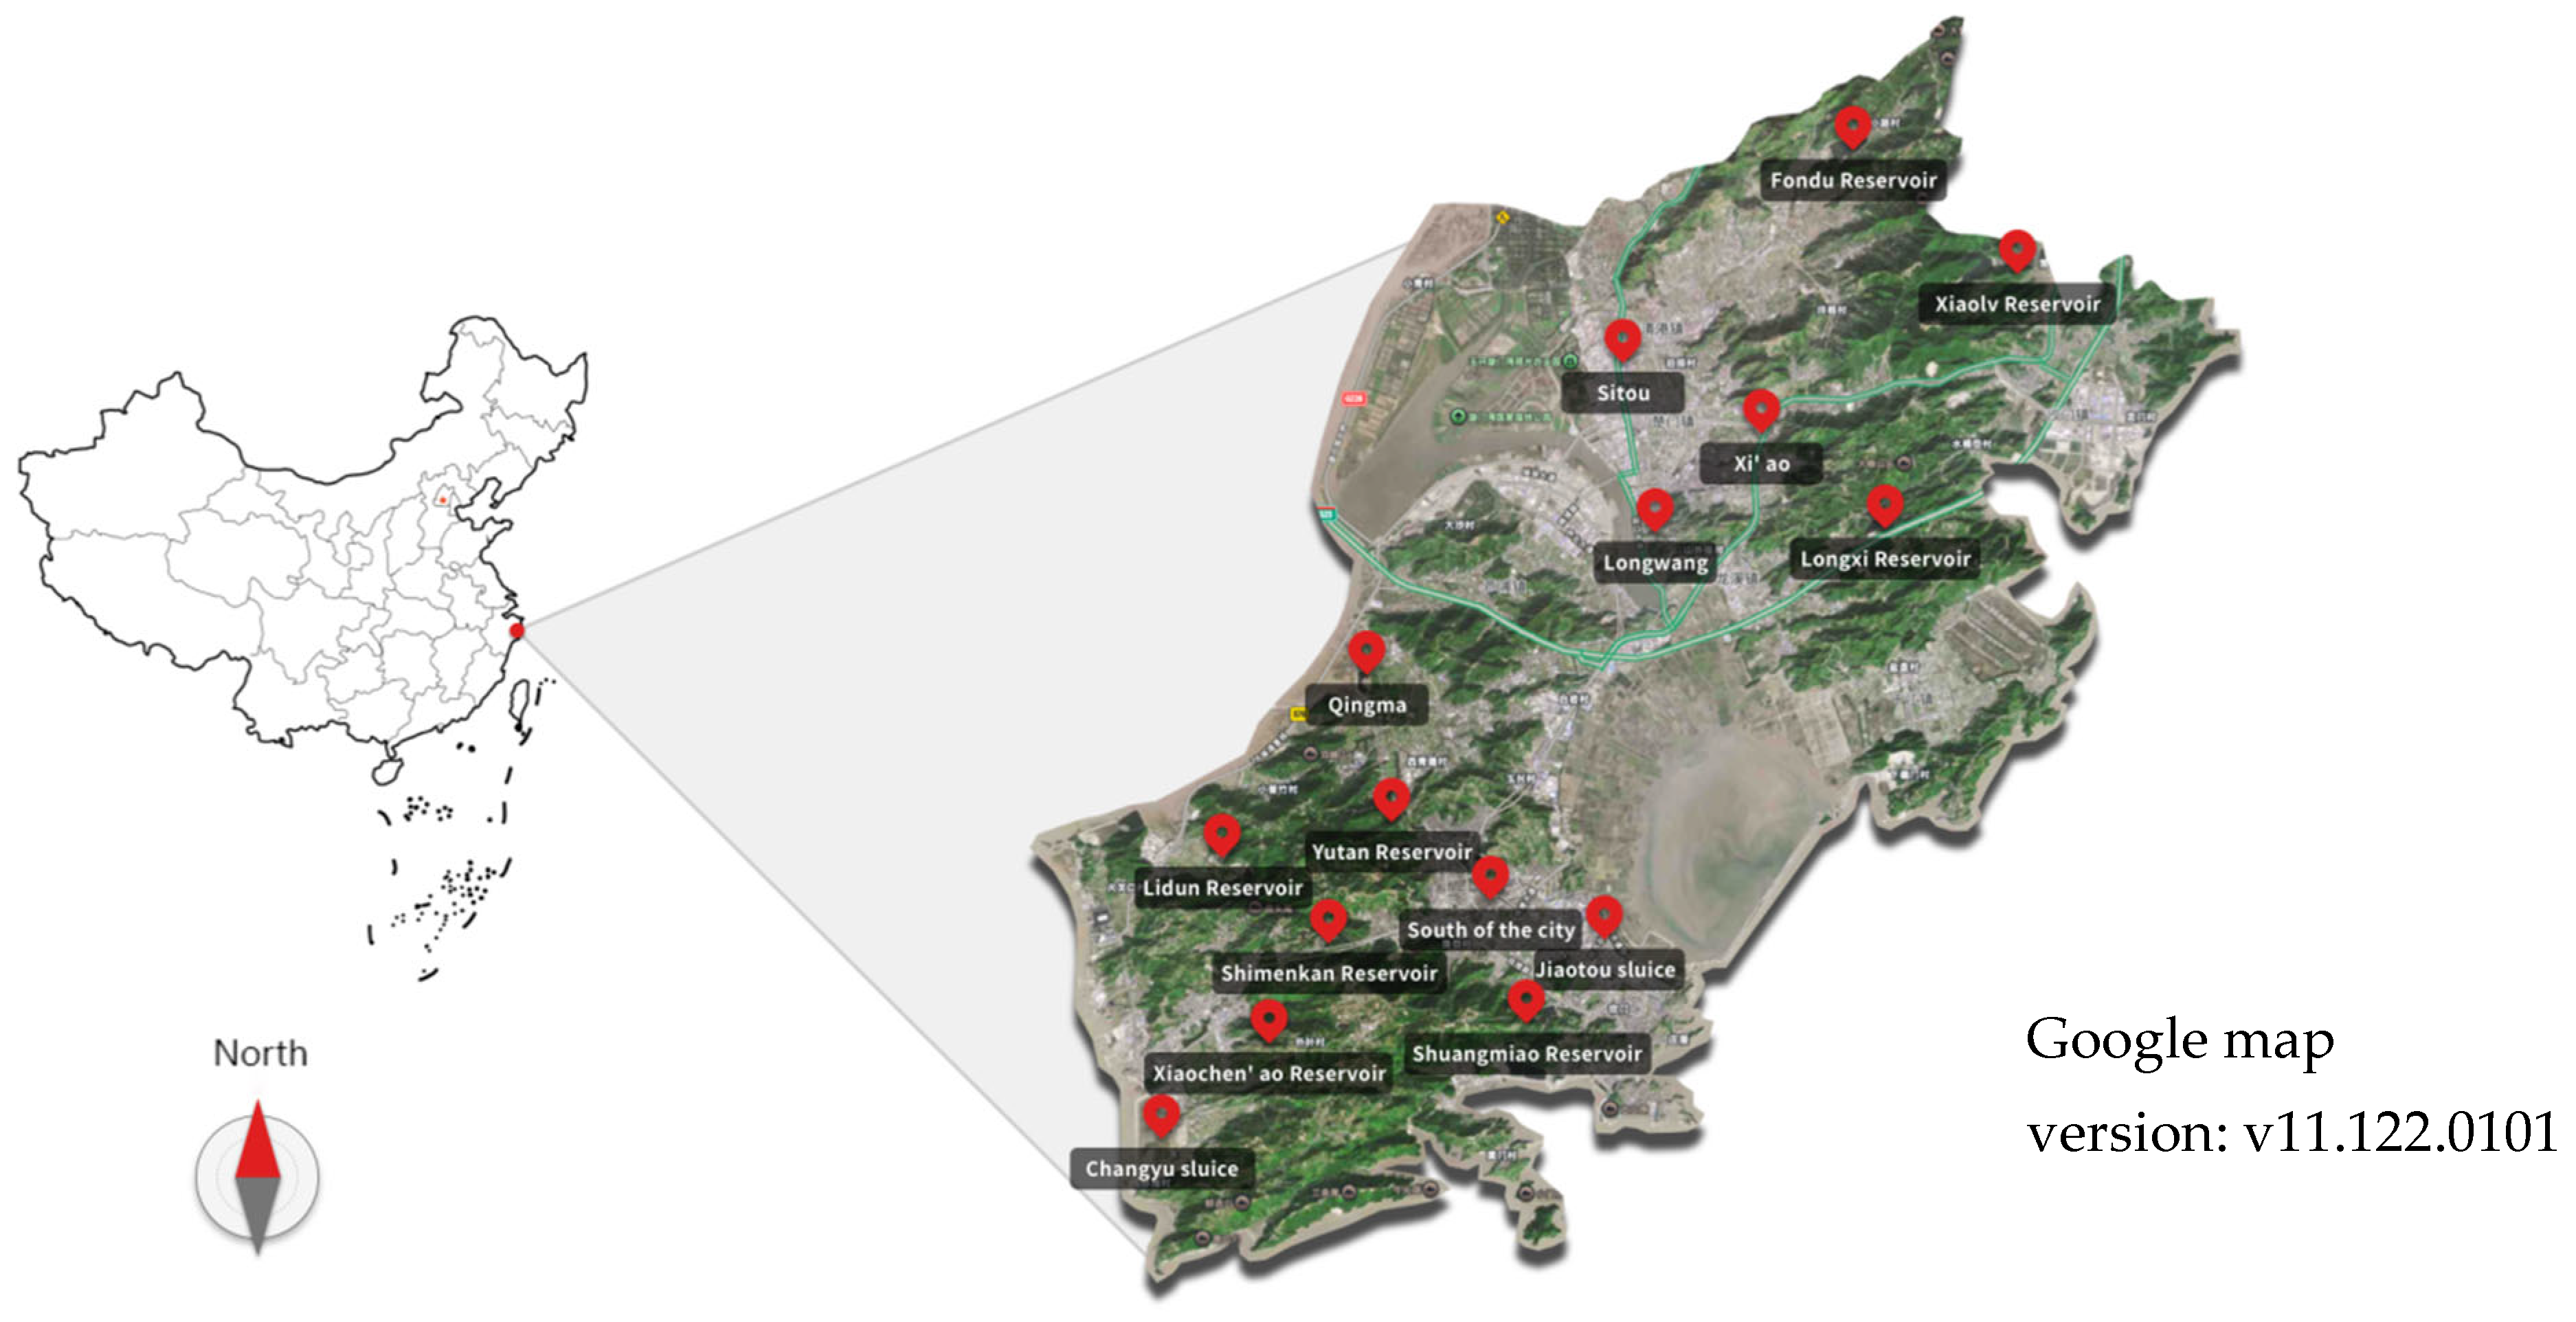
2.1. Data Sources

Yuhuan City, a renowned island county in China, is located in the middle section of the coastal area of Zhejiang Province, facing the East China Sea. It boasts abundant fishing resources and unique island scenery, with a relatively developed economy, but is exceptionally scarce in water resources. The specific orientation is shown in Figure 1. This article takes the monitoring data of urban control and above sections in Yuhuan City from 2020 to 2023 as the research object, and the monitoring indicators are 21 indicators specified of the Surface Water Environmental Quality Standards (GB 3838-2002), except for water temperature, fecal coliforms, and total nitrogen. After excluding months without data, a total of 11,275 basic water quality data were collected. The calculation method of water quality index CWQI refers to the Technical Regulations for Ranking of Urban Surface Water Environmental Quality (Trial) for calculation.

2.2. Construction of Machine Learning Models

Five algorithms including multiple linear regression, regression decision tree, support vector regression, random forest, and extreme gradient boosting were used to construct water quality index prediction models, all of which were built using the sklearn library in Python 3.8. After building the machine learning model, the dataset was split and 80% of the sample size was taken as the training set and the remaining 20% as the testing set, while ensuring that the distribution of the dependent variable CWQI in the stratified sampling dataset was consistent with its distribution across the entire dataset. Subsequently, a hyperparameter optimization grid was constructed, and the 10-fold cross-validation method (Table A1) was used to find the optimal hyperparameters for each machine learning model. The optimal hyperparameter combination was used to extract the final algorithm model, and then the model was trained using the training set and the test set in sequence. Evaluation indicators generated during the training process of the test set were collected to evaluate the performance of the model. The principles of five machine learning algorithms are summarized as follows.

2.2.1. Multiple Linear Regression

Assuming there is a linear correlation between the dependent variable y and the explanatory variables x1, x2, ..., xq, y can be represented as a linear combination of x1, x2, ..., xq i.e., a multiple linear regression model. The mathematical expression is
y k = α 0 + α 1 x k 1 + α 2 x k 2 + ... + α q x k q + β k , k = 1 , 2 , ... , N
In the formula, xkq is the observation data of the kth sample; αq is the parameter to be estimated; βk is the error term; q is the number of explanatory variables. N is the number of samples.

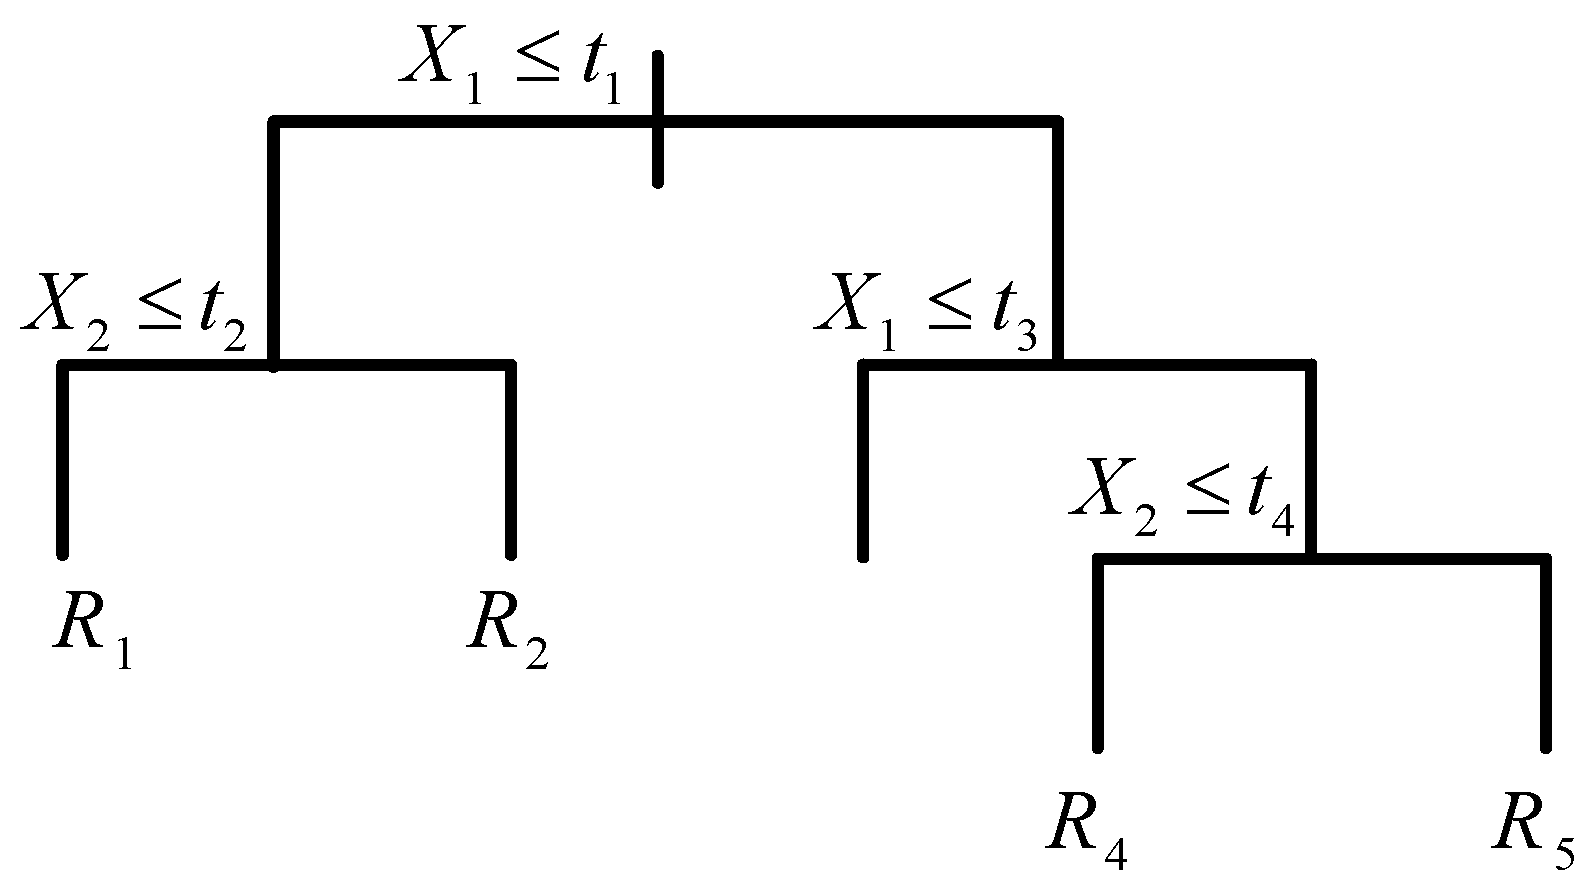
2.2.2. Regression Decision Tree (DT)

The regression decision tree algorithm is based on the criterion of minimizing the squared difference for feature selection and recursively constructs a binary decision tree. When dividing the input space, select all values of all features in the current region one by one, and use the criterion of minimizing squared error to select the optimal value (segmentation point) of the best feature for partitioning. After finding the optimal features and segmentation points, divide the input space into two regions in sequence. Then, repeat the above partitioning process for each region until the stopping condition is met. The schematic diagram is shown in Figure 2.

2.2.3. Support Vector Regression (SVR)

Support vector regression is a regression algorithm based on support vector machines, aiming to optimize regression prediction by finding a hyperplane that minimizes the distance between all data in the dataset and the hyperplane, maximizing the width of the interval band, and minimizing the total loss. In essence, it is to transform complex low-dimensional nonlinear problems into simple high-dimensional linear problems and find the regression function f(x). Taking a two-dimensional plane as an example, its schematic diagram is shown in Figure 3, where f(x) can be represented as follows:
f ( x ) = ω T ϕ ( x ) + b ,
In the formula, ω and b are the weight vector and bias value, respectively; ϕ ( x ) is for mapping relationships.

2.2.4. Random Forest (RF)

Random forest is an ensemble learning method that consists of multiple decision trees, each of which is a weak learner. In a random forest, each decision tree is generated based on training a random subset of training data. When making predictions, the random forest will average or vote on the prediction results of each tree to obtain the final prediction result. The schematic diagram is shown in Figure 4.

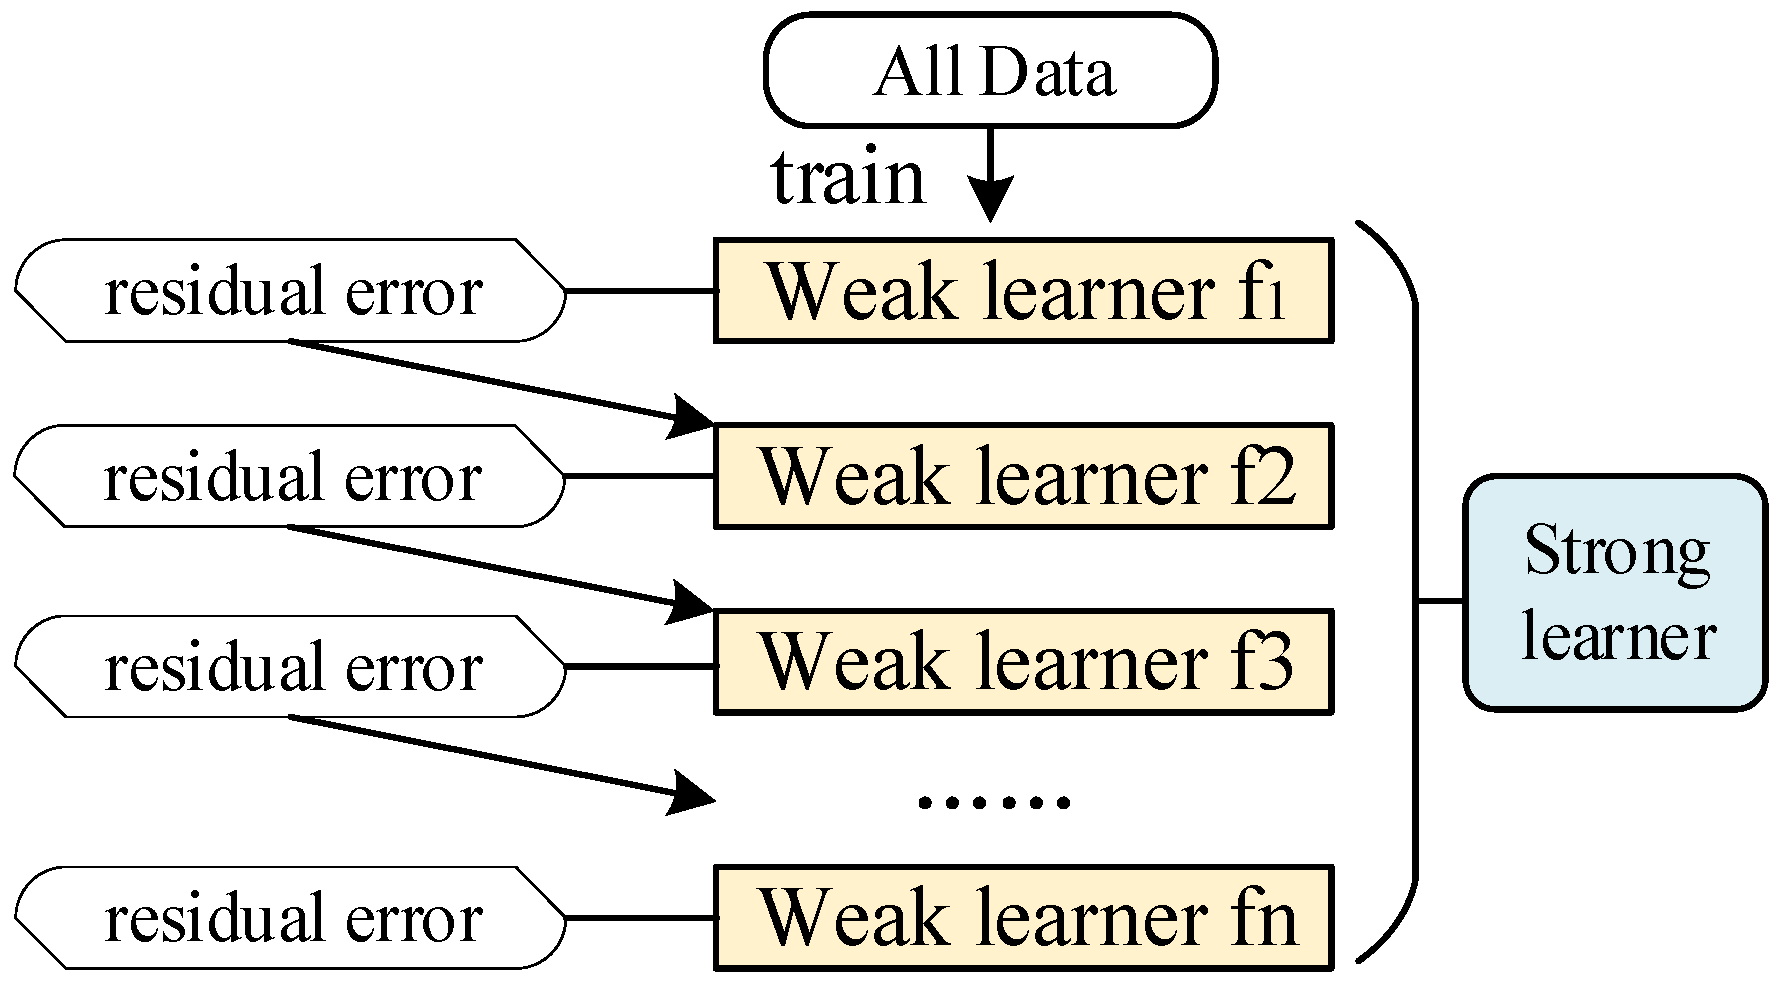
2.2.5. Extreme Gradient Boost (XGBoost)

The core idea of the XGBoost algorithm is to gradually train multiple decision tree models. Each iteration focuses on correcting the erroneous predictions of the previous model. Weighted learning and gradient descent are used to optimize the structure of each tree, thus constructing a powerful ensemble learning model. The schematic diagram is shown in Figure 5. Using the sum of predicted values from multiple decision trees to obtain the final prediction result:
y ^ i = k = 1 K f k ( x i ) , f k F ,
In the formula, y ^ i is the predicted value of the i-th sample; K is the number of decision trees; fk (xi) is the predicted value of sample xi on the kth tree; F is the set of all decision trees.

2.3. Model Evaluation Indicators

To evaluate the predictive regression performance of various machine learning models, RMSE, MAE, and Adj.R2 were selected as evaluation metrics. RMES and MAE are used to measure the deviation between model predictions and observations, with smaller values indicating smaller deviations; Adj.R2 is an adjustment to R2 (coefficient of determination) that takes into account the number of independent variables in the model. The mathematical expressions for the three evaluation indicators are as follows:
R M S E = 1 N i = 1 N ( y i y ^ i ) 2 ,
M A E = 1 N i = 1 N y i y ^ i ) ,
R S Q = 1 i = 1 N ( y i y ^ i ) 2 i = 1 N ( y i y ¯ i ) 2 A d j . R 2 = 1 ( ( 1 R S Q ) ( N 1 ) N k 1 )
In the formula, N is the total number of samples; yi is the actual observation value; k is the number of independent variables. ŷi is the predicted value; ӯi the mean of actual observations.

2.4. Variable Contribution Assessment

On the basis of the regression model, Shapley Additive exPlanation (SHAP) is used to explain the contribution of feature variables to the target variable (Shapley value) in the prediction process of the regression model, revealing the threshold and interactive synergy between the explanatory variable and the dependent variable. The calculation formula for Shapley value is as follows:
Φ j ( val ) = s ( x 1 , ... , x p ) \ x j S ! ( M S 1 ) ! M ! ( val ( S x j ) val ( S ) ) ,
g ( z ( i ) ) = Φ 0 ( i ) + j = 1 M Φ j ( i ) z j ( i ) ,
In the formula, Φ j is the contribution of the feature, Shapley value; S is the feature subset; M is the total number of features; val ( ) is the value function; Φ 0 is the predicted mean; z is the indicator vector of the sample; g(z) is a linear model or can be seen as an approximation of a linear function that represents the contribution of features to the prediction result [44].

3. Results

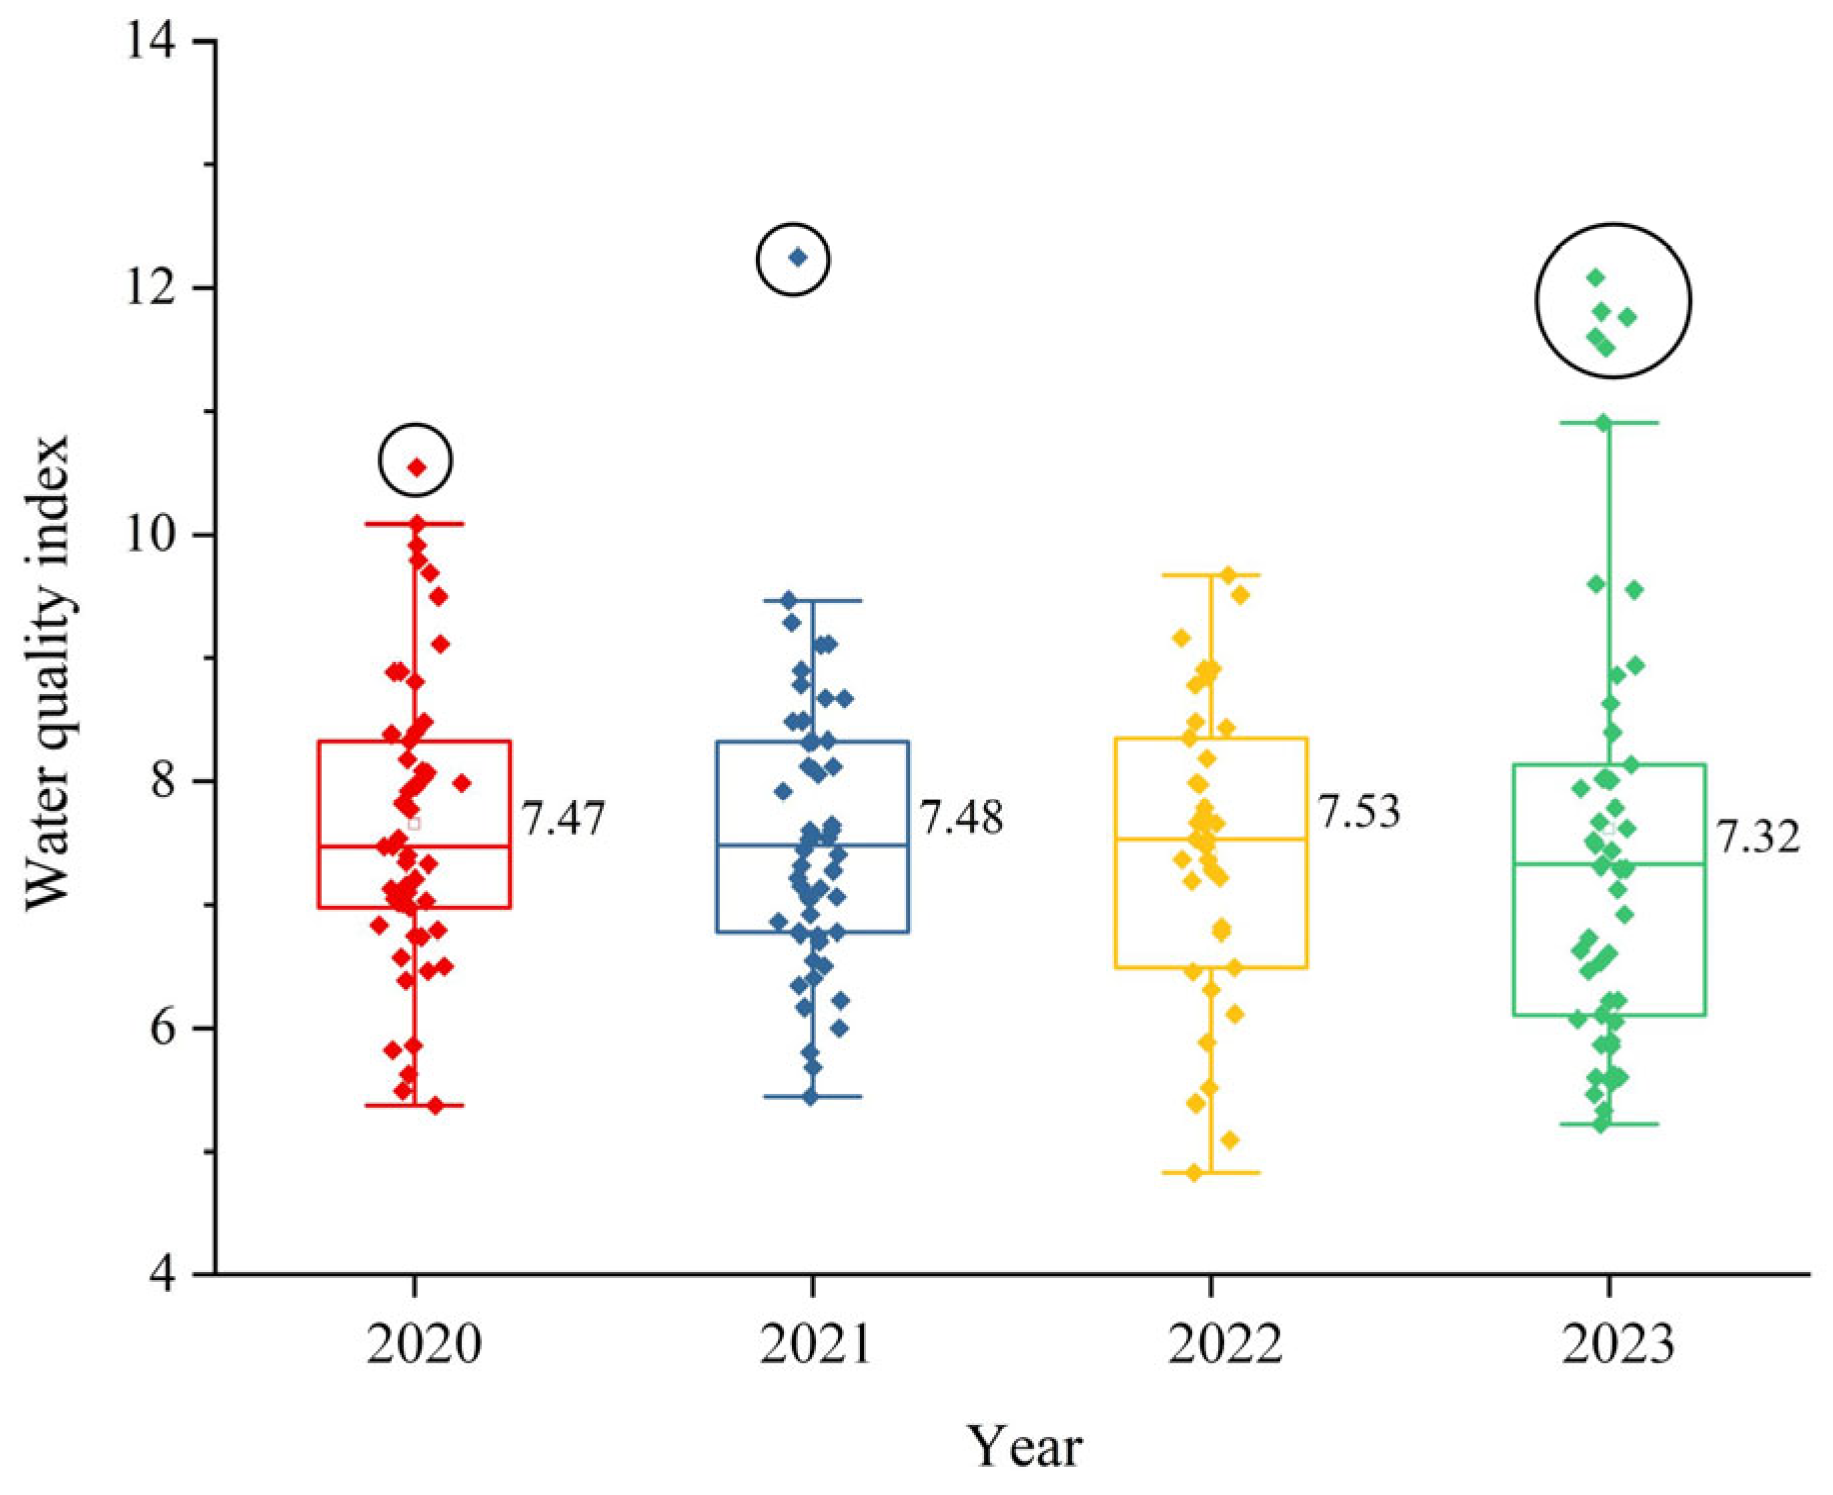
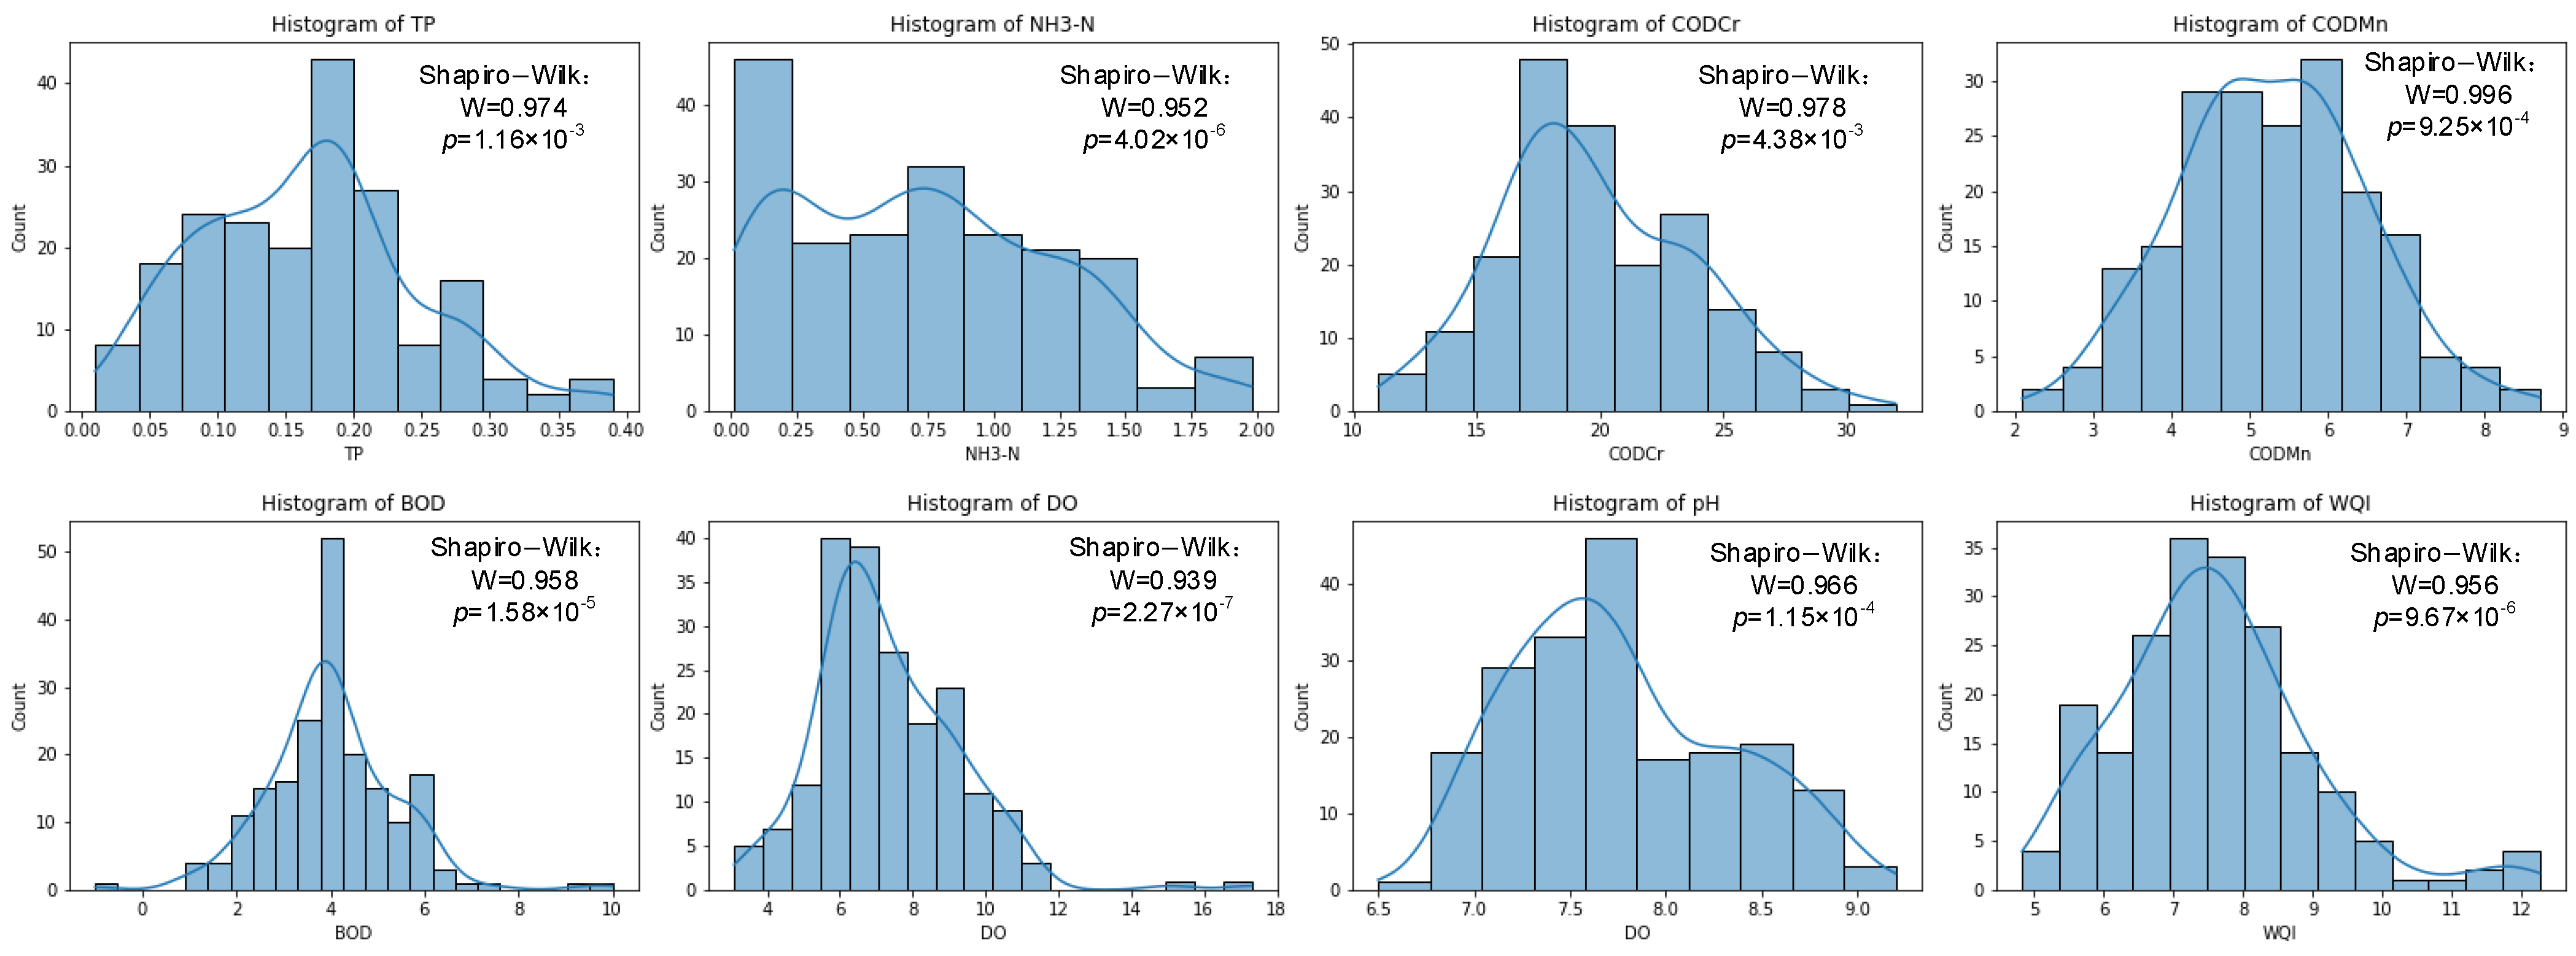
3.1. Health Status of Water Quality

The boxplot in Figure 6 contains 197 WQI values, of which seven outliers are eliminated using the boxplot (points circled in black in Figure 6). After removing the outliers, the median of water quality was calculated for each year. The changes in water quality index of Yuhuan City from 2020 to 2023 are shown in Figure 6. From 2020 to 2022, the water quality index of Yuhuan Water Functional Zone has been slowly increasing year by year, with median values of 7.47, 7.48, and 7.53, respectively. Thanks to government intervention in 2023, the water quality index has decreased to 7.32, indicating that the water pollution prevention and control work in Yuhuan City has been effective in 2023, and the water quality and health conditions in the water functional areas have improved.
The compliance status of various water quality parameters in Yuhuan City’s water functional zone is shown in Figure 7 and Table 1 (not illustrated as pH is within the range of 6–9). As shown in Figure 7, the proportion of annual water quality parameters categorized under different water quality standards can be observed. Table 1 provides a statistical overview of the proportions of water quality parameters under different water quality standards over a four-year period.
Taking DODCR as an example, as demonstrated in Figure 7, we can see that, in 2020, the majority (70.3%) of CODcr fell under Class IV water standards; in 2021, approximately two-thirds (59.3%) of CODcr samples were categorized under Class III water standards; similarly, CODcr accounted for around 50% of Class III water standards in the sample sizes of 2020 and 2023, respectively (52.2% and 49.2%). This indicates that CODcr has consistently been in relatively poor condition over the years.
From Table 1, we can also draw the following specific conclusions: Biochemical oxygen demand (BOD) reflects the degree of organic pollution in water. The proportion of samples in Yuhuan City that meet the Class III water standard for BOD is 58.37%, and the proportion that meets the Class IV standard is 25.88%. However, the proportion of samples that meet the Class I and II standards is relatively low, at 0% and 15.73%, respectively. This indicates that the content of organic pollutants in the water is relatively high, and further control of organic pollution sources is needed.
Chemical Oxygen Demand (CODcr) is an important indicator for measuring the degree of organic pollution in water bodies. The proportion of samples in Yuhuan City that meet the Class I and Class II water standards for CODcr is 10.09%, while the proportion of samples that meet the Class III and IV standards is relatively high, at 46.78% and 33.02%, respectively. Additionally, 0.45% of the samples meet the Class V standard. Overall, CODcr pollution is relatively serious, and the problem of organic matter pollution in water bodies is prominent.
CODmn (Chemical Oxygen Demand Manganese Method) is a key indicator for measuring the degree of organic pollution in water bodies. The proportion of CODmn samples in Yuhuan City that meet the Class III water standard is the highest, accounting for 58.38%, followed by the Class IV water standard, accounting for 25.88%. The combined proportion of these two types reaches 84.26%, indicating that the chemical oxygen demand of most water bodies is at a moderate to slightly high level of pollution. Nevertheless, 15.74% of the samples still met the relatively clean Class II water standard, and no samples reached the most severely polluted Class V standard, indicating to some extent that water pollution in Yuhuan City has not yet reached an uncontrollable level. It is worth noting that no samples met the Class I water standard, which means that no water bodies with extremely low chemical oxygen demand and excellent water quality have been found in the water functional areas of Yuhuan City.
Dissolved oxygen (DO) is an important indicator for evaluating the self-purification capacity and ecological health of water bodies. The proportion of samples in Yuhuan City that meet the Class I and Class II water standards for dissolved oxygen is 43.47% and 37.19%, respectively, accounting for a total of 80.66%. This indicates that most water bodies have high dissolved oxygen content and a relatively good water environment. Only 19.32% of the samples met the Class III or lower water standard, and no samples met the Class V standard, indicating that the overall dissolved oxygen status of the water is good.
Ammonia nitrogen (NH3-N) is an important indicator for measuring nitrogen pollution in water bodies. The proportion of samples in Yuhuan City that meet the Class I and Class II water standards for NH3-N is relatively low, at 2.11% and 34.39%, respectively, while the proportion of samples that meet the Class III and IV standards is relatively high, at 38.09% and 25.3%, respectively, with an additional 5.29% of samples meeting the Class V standard. The situation of ammonia nitrogen pollution is quite severe, and it is necessary to strengthen the control of nitrogen-containing pollutants.
Total phosphorus (TP) reflects the degree of phosphorus pollution in water bodies. The proportion of samples in Yuhuan City that meet the Class I and Class II water standards for TP is 1.52% and 23.85%, respectively. The proportion of samples that meet the Class III and IV standards is 51.77% and 18.78%, respectively. A total of 4.06% of the samples meet the Class V standard. The phenomenon of excessive total phosphorus indicates a certain risk of eutrophication in the water body.
As shown in Table 1, from 2020 to 2023, the overall water quality and health status of Yuhuan City were good, but there were still fluctuations. Although organic pollution has slightly eased in 2022, the pollution problems of CODcr, NH3-N, and TP remain prominent, indicating a high risk of eutrophication in water bodies. The dissolved oxygen (DO) situation is relatively stable and showing an improvement trend, while organic matter pollution (BOD and CODcr) and nutrient pollution (nitrogen, phosphorus) have worsened in some years, and overall management still needs to be strengthened.

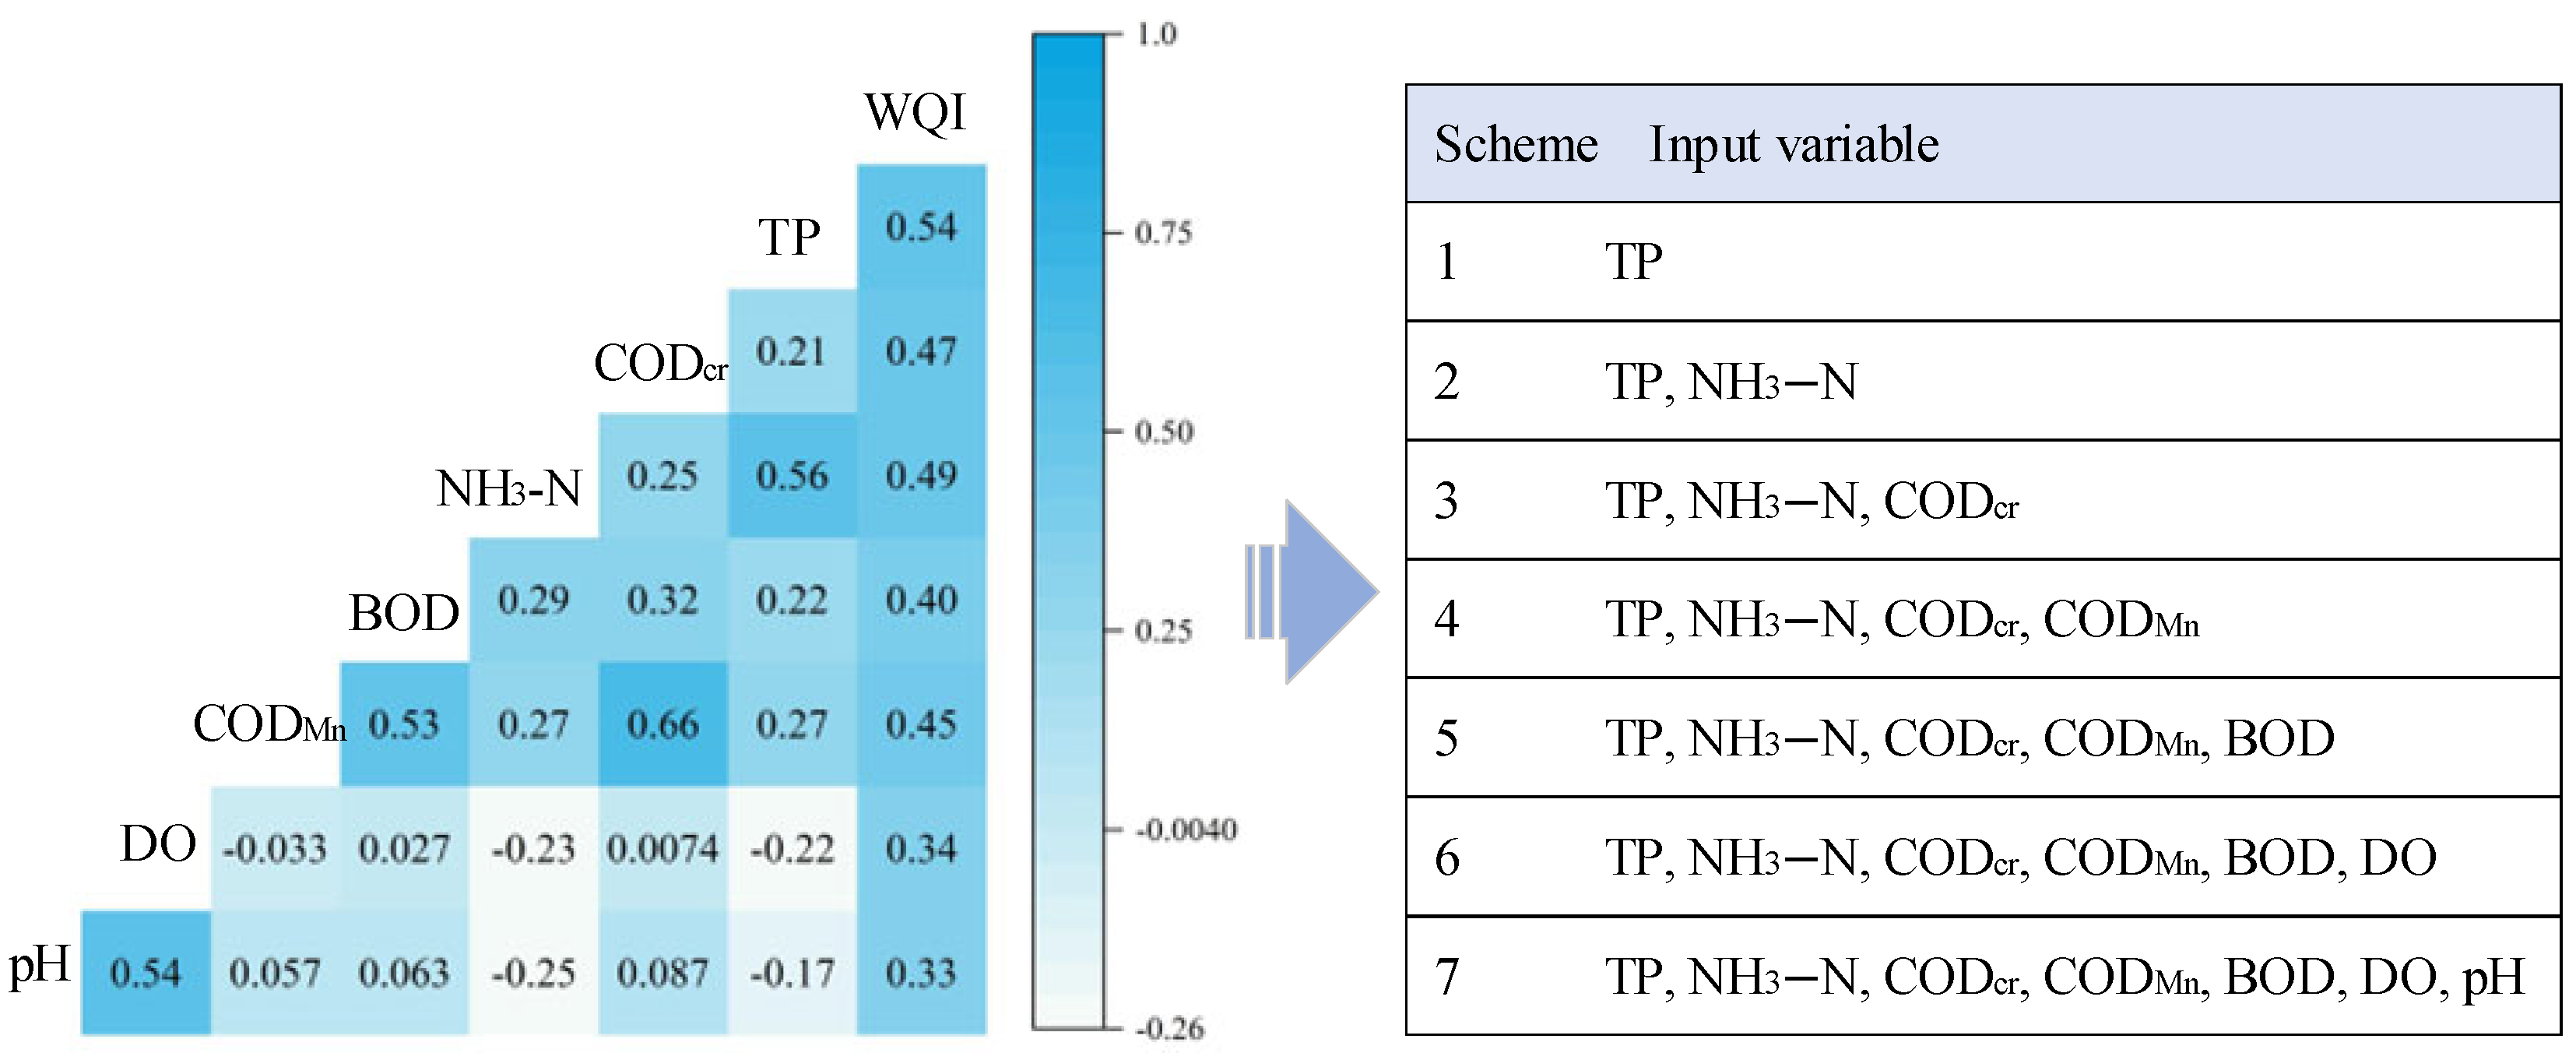
3.2. Exploration into the Correlation of Water Quality Related Factors

The dataset used in this paper includes information on seven predictors, namely TP, NH3-N, CODCR, CODMn, BOD, and pH and a target variable WQI from 2020 to 2023. Here, we perform descriptive analyses of the dataset, including analysis of normality and multicollinearity of the data.
We used histograms and Shapiro–Wilk normality tests for analysis, and the results are shown in Figure 8. From the histogram and Shapiro–Wilk normality tests, it can be seen that both the target variables and the predictors conform to normal distributions.
The Pearson correlation coefficient matrix between the CWQI and seven basic water quality parameters is shown in Figure 9. The right part Figure 9 is seven feature combination schemes. Seven water quality-related factors showed a moderate-to-weak correlation with CWQI. Among them, CWQI has the highest correlation with TP, reaching 0.54, followed by CODcr and NH3-N. Therefore, all seven water quality parameters can be used as input variables. Seven input variable schemes are arranged and set based on the correlation between seven water quality parameters and water quality index.

3.3. Construction and Evaluation of Machine Learning Models

Using five models including multiple linear regression, regression decision tree, support vector regression, random forest, and extreme gradient boosting, and seven input variable schemes, 35 sets of machine learning models were constructed for predicting water quality index. The training of the model is based on python 3.8.8, using the machine learning library sklearn 0.24.1. The data used to train the machine model are the normal dataset after outliers are eliminated by using the boxplot, as shown in Figure 6. The best parameters for models using the grid search approach are shown in Table 2. Figure 10 shows the performance evaluation results of 35 models constructed during the testing process. The results show that the RMSE and MAE of the different models show a decreasing trend as the number of input variables increases, which seems to indicate that the accuracy of the models gradually increases as the number of input variables increases. However, the results from Adj.R2 do not show the conclusion that the accuracy of the models gradually improves as the number of variables increases, indicating that the Adj.R2 evaluation index has a significant differential capture effect on the accuracy of different models. It is also clear from the results of Figure 10 that RF and xgboost can reach the highest Adj.R2 when scheme 7 is selected. The results of the three indicators also indicate that, under option 7, the XGBoost model has the best predictive performance (MAE = 0.4702, RMSE = 0.7081, Adj.R2 = 0.6400).
The comparison between the predicted and true values of the test set of five machine learning models under the optimal input variable combination is shown in Figure 11. Overall, the Extreme Gradient Boosting algorithm has the highest fitting effect between the predicted and true values (second to random forest), with the vast majority located within the 95% confidence interval on both sides of the y = x line. The extreme gradient boosting algorithm and random forest both belong to ensemble learning algorithms, indicating that ensemble learning algorithms have good performance in predicting water quality indices based on a small number of water quality parameters.

3.4. Exploration of the Contribution of Water Quality-Related Factors

Although the XGBoost model demonstrates excellent predictive ability, it is often considered a “black box” with limited interpretability due to the complexity of ensemble learning algorithms. Therefore, further analysis and research will be conducted on the contribution of the SHAP model to water quality influencing factors, revealing the threshold and interactive synergistic effects between water quality influencing factors and water quality indicators [45].
From Figure 12 (right), it can be seen that the water quality-related influencing factors among the seven input variables show a positive correlation with the water quality indicators; that is, the larger the value, the larger the water quality indicators (the more severe the pollution). As shown in Figure 12 (left), the concentration differences of TP, NH3-N, and CODcr have a significant impact on the prediction model. TP is the most important influencing factor, with a Shapley mean of 0.374 in the extreme gradient boosting model; NH3-N is the second most important influencing factor, with a Shapley mean of 0.368; CODcr is the third most important influencing factor, with a Shapley mean of 0.272. This result is very similar to the research findings of He et al. [46] and Cheng et al. [47].

4. Analysis and Suggestions on Governance Measures

4.1. Strengthen Agricultural-Related Governance

Based on the research results, especially considering that Yuhuan City is currently in the early stage of transforming from an agricultural county to an industrialized city, agricultural pollution remains the primary factor affecting water quality. Agricultural pollution still needs to be ranked first in its water quality control; therefore, priority should be given to developing control measures targeting agricultural pollution factors.
The first is to optimize the agricultural planting structure in Yuhuan City. Encourage the cultivation of crops with high economic benefits and environmental friendliness, and reduce dependence on fertilizers and pesticides. By developing modern agricultural technologies, promoting water-saving irrigation and efficient fertilization techniques, the loss of pollutants can be reduced [48].
The second is to vigorously promote ecological agriculture and organic agriculture in Yuhuan City. By reducing the use of fertilizers and pesticides, we can lower the environmental pollution caused by agricultural production. At the same time, promote traditional planting methods such as intercropping and crop rotation to improve soil fertility and pollution resistance [49].
The third is to strengthen the supervision of pesticide and fertilizer use in Yuhuan City. Strictly control the use of highly toxic and residual pesticides, promote biopesticides and organic fertilizers, and reduce the risk of chemical pollution to water bodies. At the same time, establish a traceability system for agricultural inputs and comprehensively supervise agricultural inputs such as pesticides and fertilizers.
The fourth is to improve the management of livestock and poultry breeding waste in Yuhuan City. Livestock and poultry breeding is one of the important sources of agricultural non-point source pollution, and the resource utilization of livestock and poultry breeding waste should be promoted, such as converting livestock and poultry manure into organic fertilizer through anaerobic fermentation technology to reduce water pollution. At the same time, we will strengthen the construction of pollution prevention and control facilities in livestock and poultry farms to ensure that breeding wastewater is discharged in compliance with standards after treatment.
The fifth is to establish and improve the agricultural waste recycling and comprehensive utilization system in Yuhuan City. Harmless treatment and reuse of agricultural waste such as crop straw and livestock manure to reduce the negative impact of agricultural production on the environment. For example, promoting measures such as returning straw to the field and generating electricity from livestock and poultry manure biogas to achieve the recycling of agricultural waste.

4.2. Strengthen the Governance of Key Pollution Factors

Based on research results, the key pollution factors of the WQI are TP, NH3-N, and CODCr, and effective treatment of these factors is crucial. Therefore, priority should be given to developing control measures for these pollution factors.
Domestic sewage is an important source of water pollution, so it is crucial to improve the urban and rural sewage treatment facilities in Yuhuan City. It is recommended to increase the construction efforts of sewage treatment plants and adopt advanced sewage treatment processes (such as membrane bioreactors and artificial wetland systems) to ensure that phosphorus in sewage is effectively treated before discharge. In addition, decentralized sewage treatment facilities should be implemented to solve the problem of centralized treatment of domestic sewage in remote rural areas [50].
Industrial wastewater usually contains a large amount of phosphorus, nitrogen, and other pollutants, so it is particularly important to strengthen the supervision of industrial wastewater discharge in Yuhuan City. Strictly implement emission standards, conduct regular inspections on enterprises involved in high phosphorus emissions, and ensure that their wastewater is effectively treated to meet emission standards. In addition, third-party monitoring agencies should be introduced for independent evaluation to ensure that wastewater is discharged in compliance with standards. For enterprises that fail to discharge in compliance with standards, fines should be imposed in accordance with the law, and rectification should be required within a specified period of time.
Optimize the rainwater and sewage diversion and drainage system in Yuhuan City. At present, the rainwater and sewage in the drainage system of Yuhuan City have not been completely diverted, resulting in pollutants directly entering the water body during rainfall and affecting water quality. Therefore, it is recommended to accelerate the implementation of rainwater and sewage diversion projects, optimize urban drainage systems, and reduce the pollution of water quality caused by initial rainwater. At the same time, maintenance and management of the drainage system should be increased to avoid sewage leakage caused by aging and damage to the pipeline network [51].

4.3. Promote the Digital Transformation of Water Quality Management

Research has shown that machine learning has great potential for application in water quality prediction. Therefore, promoting the digitization and intelligence of water quality management is an important direction for the future:
Using machine learning models such as random forest and extreme gradient boosting (XGBoost), establishing a water quality warning system to monitor water quality changes in real time, and detecting and preventing pollution risks in a timely manner. Multi-dimensional analysis should be combined with historical monitoring data and real-time data to achieve more accurate early warning. The system should also have visualization functions to facilitate the management of personnel and the public to understand the water quality status and enhance environmental awareness.
The ecological environment management department of Yuhuan City should establish a water quality big data platform based on Internet of Things technology, collect and analyze water quality data in real time, and provide strong support for scientific decision-making. The platform should integrate a water quality monitoring sensor network to achieve all-weather monitoring of multiple water quality indicators such as pH, dissolved oxygen, and ammonia nitrogen. Through data mining and machine learning techniques, it can analyze the trend of water quality changes and help formulate scientific governance measures. In addition, mobile applications should be developed to enable the public to view water quality information at any time and participate in water quality protection [52].
The ecological environment management department of Yuhuan City should build automated water quality monitoring stations in key water functional areas, equipped with advanced online analytical instruments, to achieve real-time monitoring of water quality. The construction of an automated monitoring network can not only reduce the cost of manual monitoring, but also improve the accuracy and timeliness of data, providing timely and reliable decision-making basis for management departments.
By integrating various water quality data, an intelligent decision support system is constructed. The system can automatically generate water quality improvement plans based on the prediction results of water quality models, and combine geographic information system (GIS) technology to optimize the treatment strategies of pollution sources, achieving precise pollution control.

4.4. Enhancing Public Awareness and Institutional Support

To effectively address water pollution control in Yuhuan City, a multifaceted approach encompassing public awareness and institutional support is essential. This strategy will ensure comprehensive measures are taken to protect and improve the city’s water environment.
The ecological environment management department of Yuhuan City should prioritize enhancing public awareness of environmental protection through diverse channels. Community activities, media campaigns, and educational programs in schools are effective platforms to disseminate information about the importance of water resource protection, particularly in areas with concentrated agricultural and industrial activities. Emphasis should be placed on the dangers of water pollution and practical preventive measures. Additionally, organizing environmental volunteer teams to conduct regular lectures, distribute informational brochures, and engage in outreach activities can significantly boost public responsibility and participation in water resource management [53].
The ecological environment management department must strengthen institutional frameworks to support water pollution control. This includes refining existing laws and regulations, clearly defining penalties for pollution offenses, and enforcing stricter emission standards in high-polluting industries. A robust accountability mechanism should also be implemented to ensure all stakeholders adhere to environmental responsibilities and to address violations effectively. By enhancing regulatory measures and ensuring compliance, Yuhuan City can achieve more effective water pollution control and sustainable environmental management [54].

5. Conclusions

This study aims to evaluate the performance of various machine learning algorithms in predicting CWQI, and conduct empirical analysis using Yuhuan City as an example. By constructing a water quality index prediction model based on five machine learning algorithms, namely multiple linear regression, regression decision tree, support vector regression, random forest, and extreme gradient boosting, and evaluating and comparing the performance of the model, this study has drawn the following conclusions:
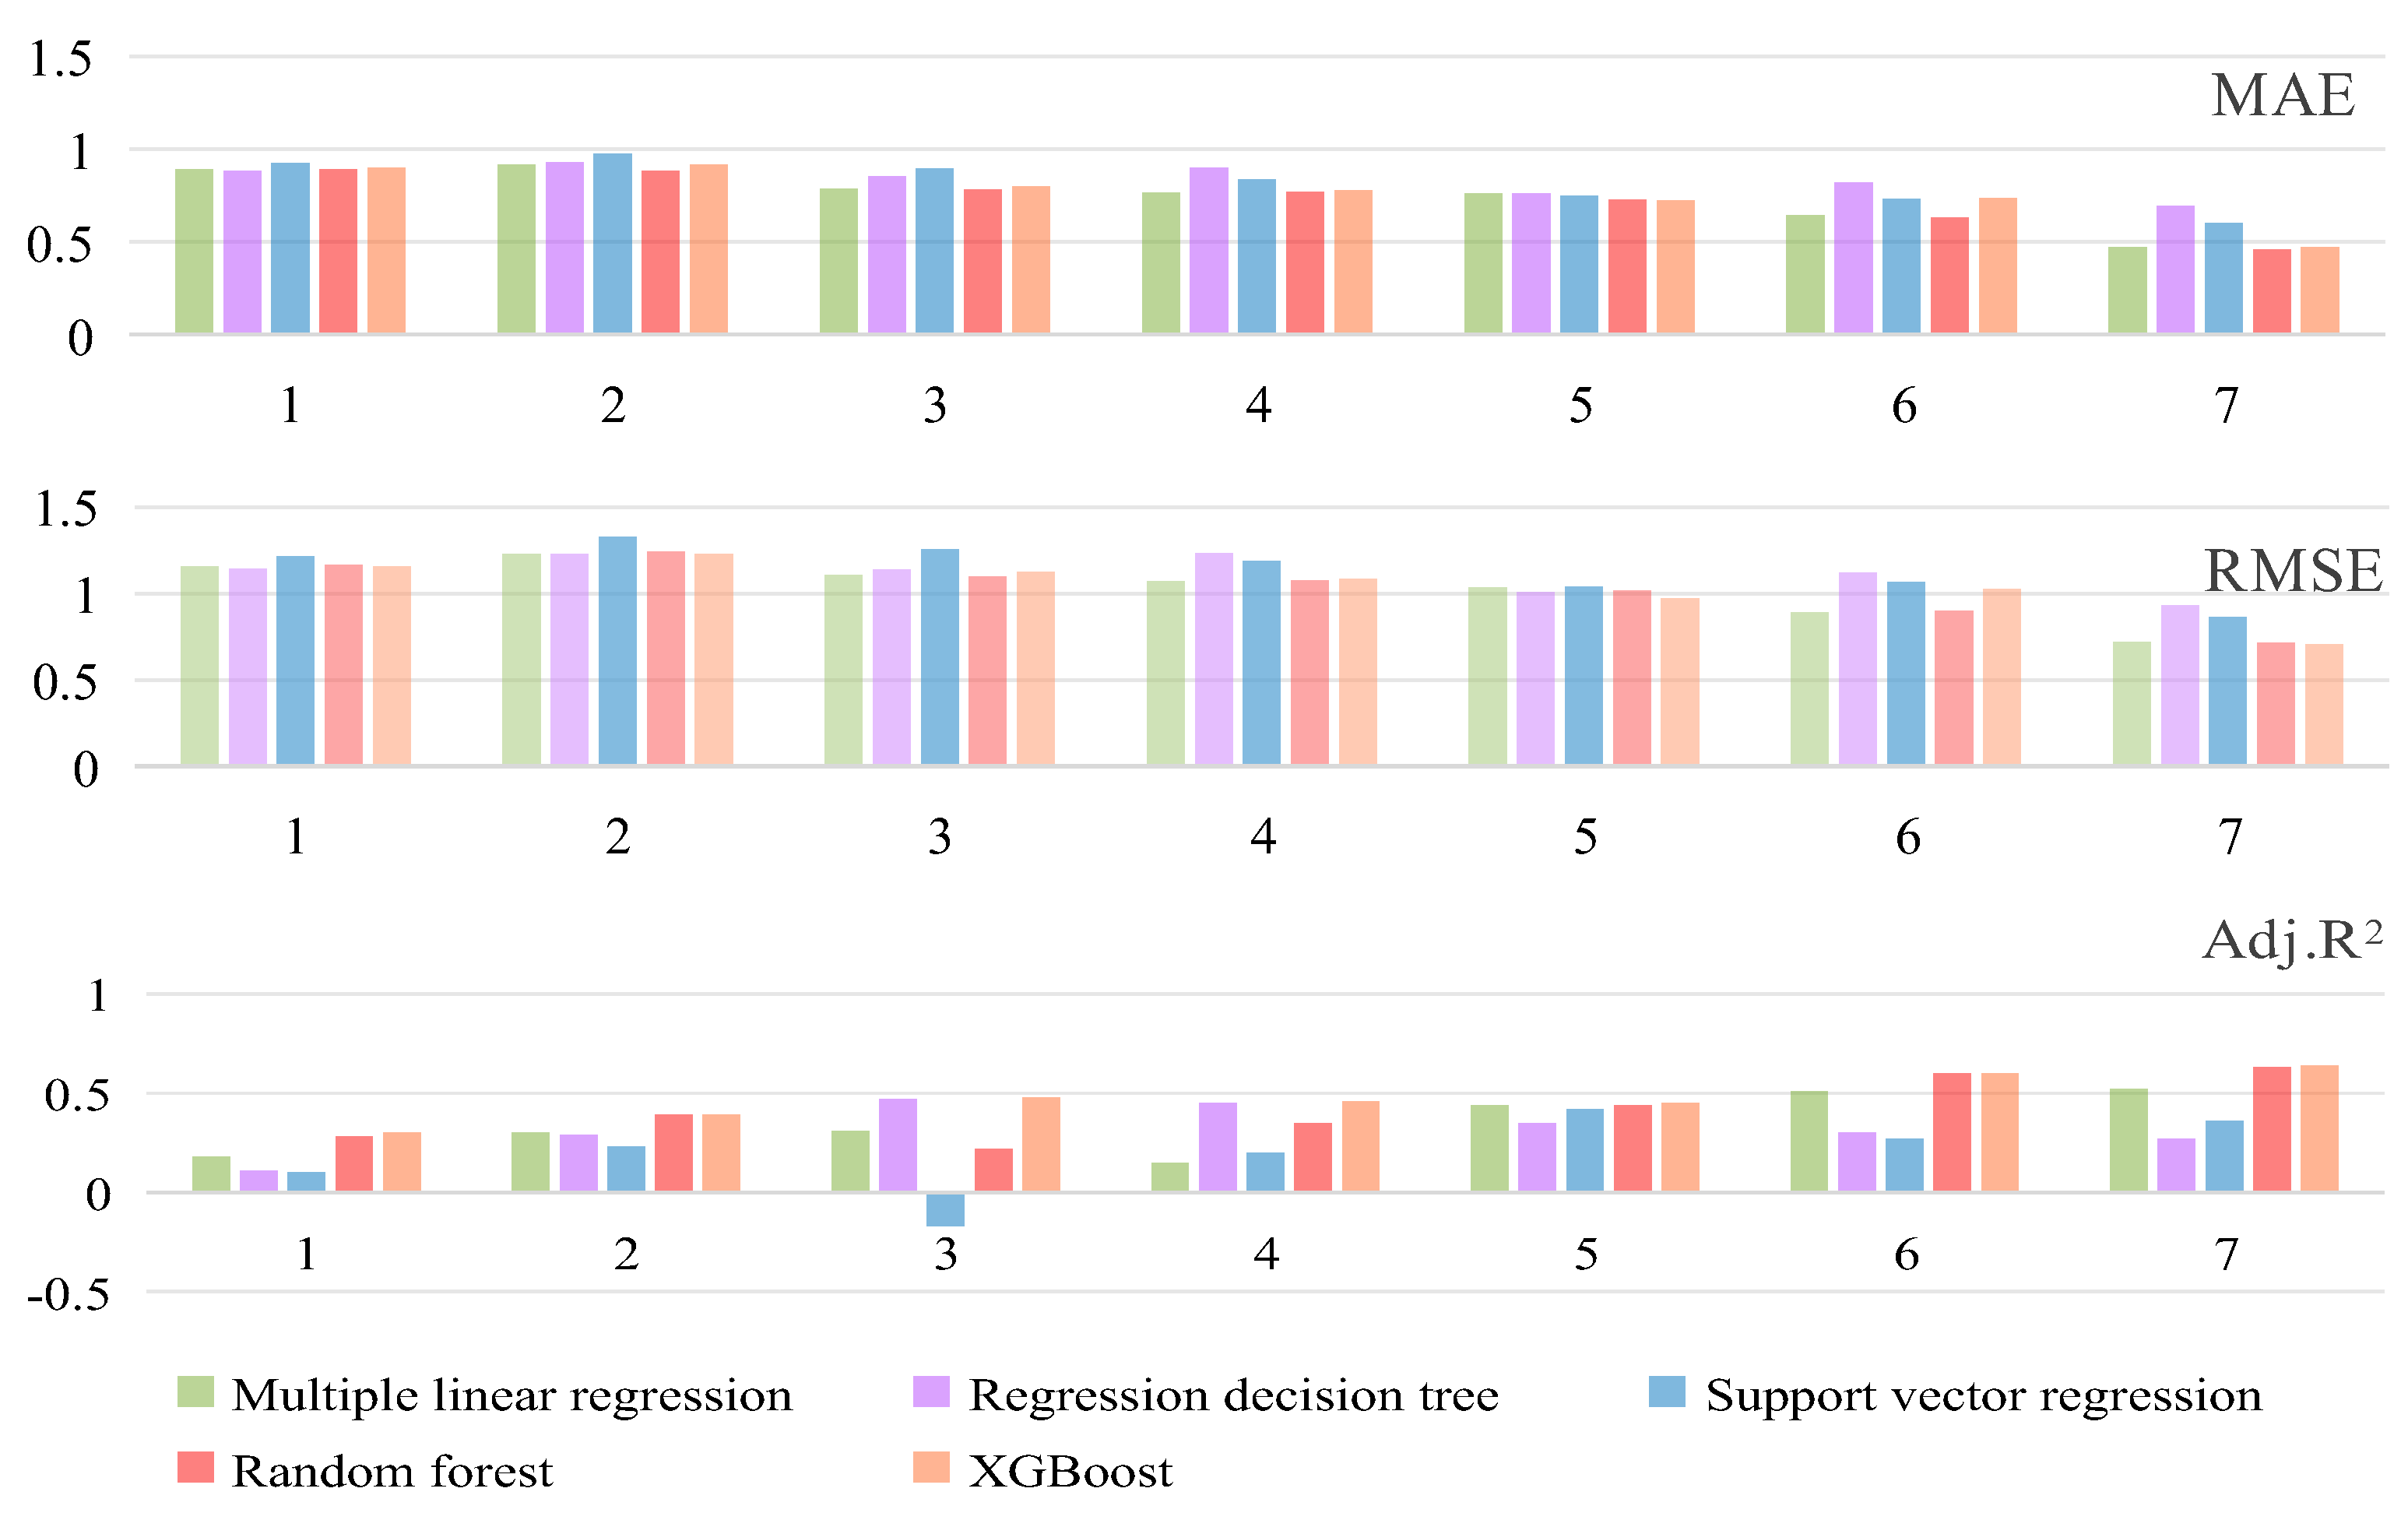
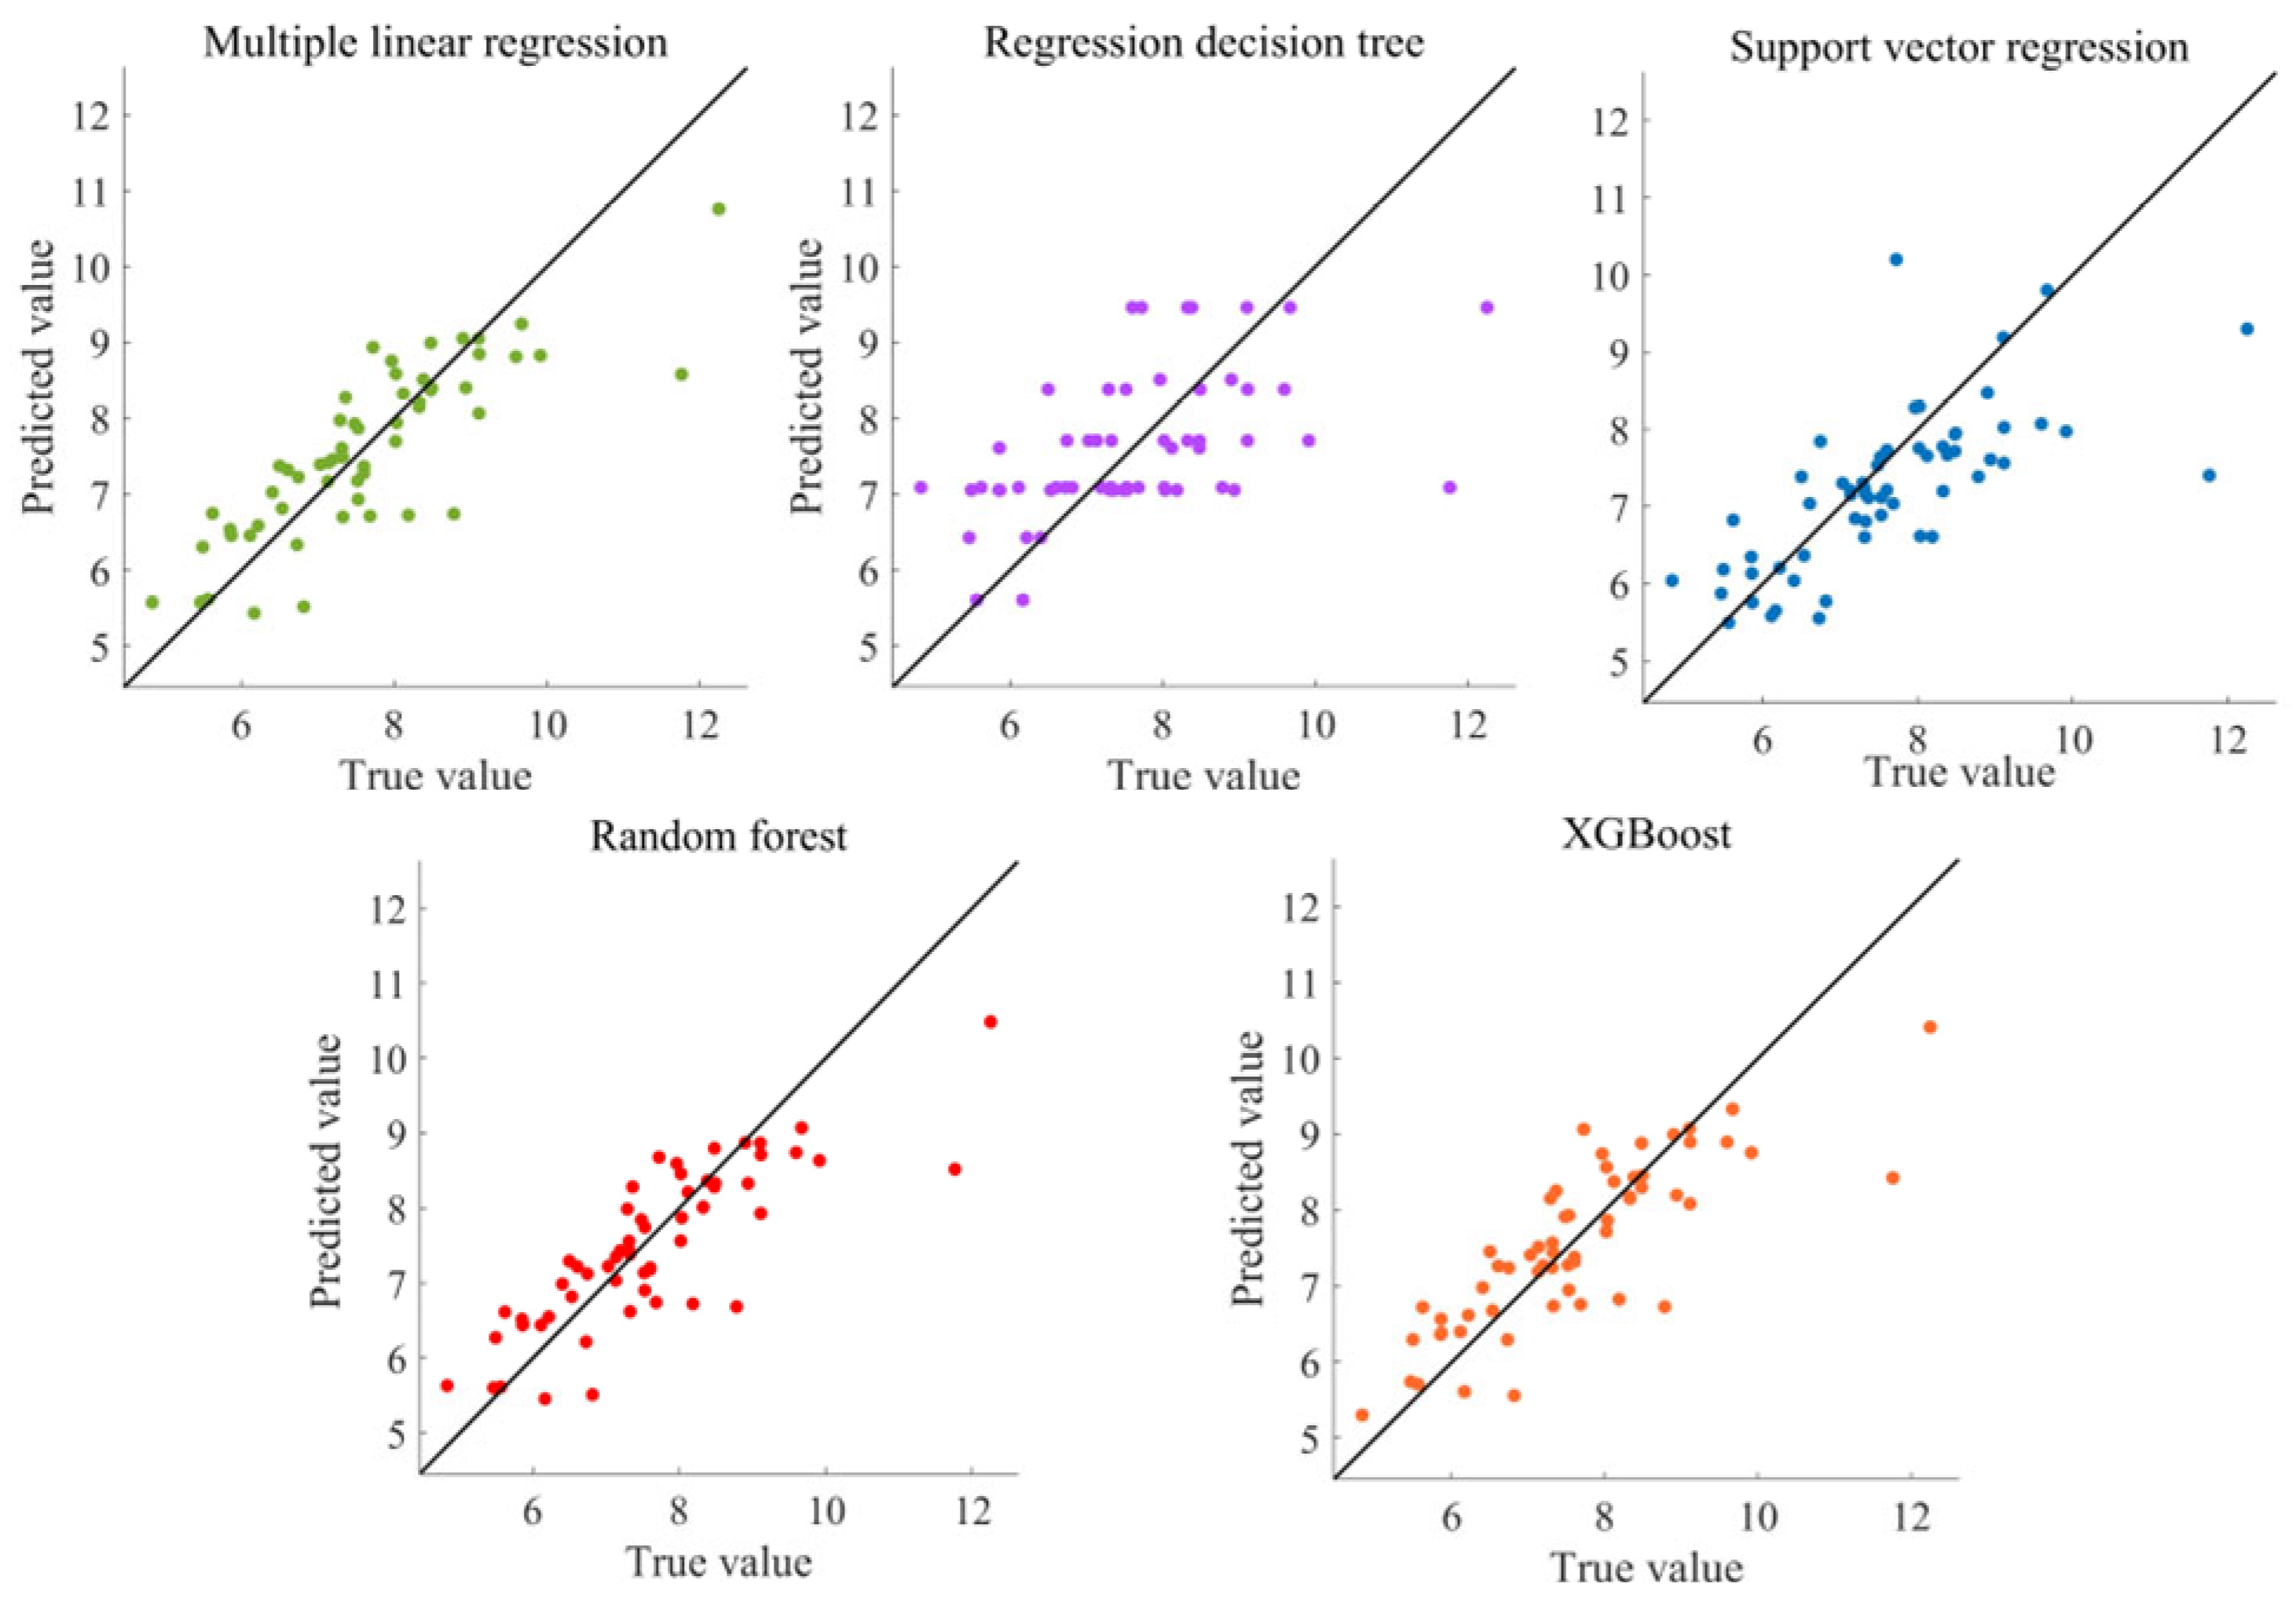
  • Machine learning algorithms perform well in predicting water quality indices. This study found that various machine learning algorithms have shown good performance in predicting water quality indices. As the number of significantly correlated variables in the input variables increases, the predictive performance of the model shows an upward trend. Under the optimal input variable scheme, XGBoost demonstrated the best predictive ability, with RMSE, MAE, and Adj.R2 metrics superior to other algorithms. This result indicates that machine learning algorithms have broad application prospects in predicting water quality indices and can provide scientific basis and technical support for water quality management work.
  • Ensemble learning algorithms have demonstrated exceptional performance in water quality prediction, particularly in handling complex water quality data and improving prediction accuracy and stability. This study highlights that algorithms such as random forest and extreme gradient boosting are particularly effective in this domain, likely due to their ability to construct strong learners by combining multiple weak learners, thereby capturing more intricate data features and patterns. Given these advantages, ensemble learning algorithms should be prioritized in future water quality prediction research. Furthermore, this study identifies TP, NH3-N, and CODCr as critical factors influencing the CWQI. Through SHAP analysis, it is evident that the concentrations of these parameters significantly impact water quality predictions in Yuhuan City, underscoring the importance of nitrogen and phosphorus pollution as key determinants of water environment quality. Consequently, effective water quality management strategies must prioritize the prevention and control of nitrogen and phosphorus pollution, through measures such as agricultural non-point source pollution control, industrial pollution source supervision, and urban sewage treatment plant operation management, to reduce pollution loads and enhance water environment quality. Additionally, the water quality prediction model developed in this study provides a robust scientific basis and technical support for water quality management. By analyzing relevant water quality parameters, the model enables the prediction of future trends in water quality index changes, offering valuable early warning and decision-making support for water quality management. Moreover, the model facilitates the evaluation of different governance measures, enabling the optimization of management plans and the enhancement of governance efficiency. The application of such models in water quality management holds significant practical significance and application value, underscoring their importance in advancing sustainable water resource management.
  • Future research directions and prospects. Although this study has achieved some meaningful results in predicting water quality indices, there are still some shortcomings and issues that need further research. For example, the data sample size used in this study is relatively small and may not fully reflect the water quality status of Yuhuan City. Meanwhile, this study only considered some water quality parameters as input variables, which may have overlooked other factors that have a significant impact on water quality. Therefore, in future research, measures such as expanding the data sample size and increasing the number of input variables can be considered to improve the predictive accuracy and generalization ability of the model. In addition, the application effects of other machine learning algorithms in water quality prediction and the potential of advanced technologies such as hybrid models and deep learning in water quality prediction can also be explored. Through these efforts, the research and application of water quality prediction models can be further improved, providing more scientific, accurate, and effective support for water quality management.
In summary, this study provides new ideas and methods for water quality management by constructing and evaluating water quality index prediction models using various machine learning algorithms. In future research, we will continue to deepen our research in this field and promote the application and development of water quality prediction models in water quality management. At the same time, we also hope that this study can attract more scholars and experts’ attention and importance to the issue of water quality prediction, and jointly promote the research progress and application practice in the field of water quality science.

Author Contributions

Writing—original draft preparation, C.Z.; Data curation, L.W.; writing—review and editing, C.L. Resources, M.L. All authors have read and agreed to the published version of the manuscript.

Funding

This research was funded by Zhejiang Philosophy and Social Science Fund, grant number “25NDJC129YB” and Startup Fund for Advanced Talents of Putian University (2023133).

Institutional Review Board Statement

Not applicable.

Informed Consent Statement

Not applicable.

Data Availability Statement

Data will be made available upon request.

Acknowledgments

We thank the editors and reviewers.

Conflicts of Interest

Author Minyuan Lu was employed by the company Taizhou Environmental Science Design and Research Institute Co., Ltd. The remaining authors declare that the research was conducted in the absence of any commercial or financial relationships that could be construed as a potential conflict of interest.

Appendix A

Table A1. 10-fold cross-validation results of XGBoost under the seventh scheme and optimal hyperparameters.
XGBoost12345678910MeanSD
RMSE0.871.020.580.500.340.660.381.080.660.870.700.24
MAE0.650.620.490.410.280.550.320.700.540.650.520.13
Adj.R20.580.500.650.680.870.640.790.620.670.580.660.10
Table A2. Figure 7-specific data table.
DO/CODMn/BOD/NH3-N/CODCR/TPIIIIIIIVV
20209/0/5/0/1/136/4/5/10/1/125/23/18/19/14/253/26/30/18/38/80/0/0/8/0/7
202128/0/6/0/5/112/6/6/21/5/1111/33/25/20/35/303/15/23/12/14/110/0/0/1/0/1
202220/0/9/3/7/111/8/9/13/7/143/26/13/15/24/175/5/16/8/8/70/0/1/0/0/0
202333/0/22/1/9/018/13/22/21/29/108/33/14/18/29/302/5/9/10/12/110/0/6/1/1/0

References

  1. Fu, G.; Jin, Y.; Sun, S.; Yuan, Z.; Butler, D. The role of deep learning in urban water management: A critical review. Water Res. 2022, 223, 118973. [Google Scholar] [CrossRef] [PubMed]
  2. Wang, M.; Janssen, A.B.G.; Bazin, J.; Strokal, M.; Ma, L.; Kroeze, C. Accounting for interactions between Sustainable Development Goals is essential for water pollution control in China. Nat. Commun. 2022, 13, 730. [Google Scholar] [CrossRef] [PubMed]
  3. Bao, R.; Liu, T. How does government attention matter in air pollution control? Evidence from government annual reports. Resour. Conserv. Recycl. 2022, 185, 106435. [Google Scholar] [CrossRef]
  4. Xie, Z. China’s historical evolution of environmental protection along with the forty years’ reform and opening-up. Environ. Sci. Ecotechnology 2020, 1, 100001. [Google Scholar] [CrossRef]
  5. Huan, X.; Huan, Q. The discourses of green modernization and eco-civilizational progress in contemporary China: Convergence, tension and mutual learning. Humanit. Soc. Sci. Commun. 2024, 11, 1041. [Google Scholar] [CrossRef]
  6. Liu, Y.; Cheng, Y.; Li, T.; Ni, J.; Norman, S. Information disclosure and public participation in environmental management: Evidence from the river chief system in China. China Econ. Rev. 2024, 85, 102168. [Google Scholar] [CrossRef]
  7. Ma, X.; Brookes, J.; Wang, X.; Han, Y.; Ma, J.; Li, G.; Chen, Q.; Zhou, S.; Qin, B. Water quality improvement and existing challenges in the Pearl River Basin, China. J. Water Process. Eng. 2023, 55, 104184. [Google Scholar] [CrossRef]
  8. Yan, X.; Xia, Y.; Ti, C.; Shan, J.; Wu, Y.; Yan, X. Thirty years of experience in water pollution control in Taihu Lake: A review. Sci. Total Environ. 2024, 914, 169821. [Google Scholar] [CrossRef]
  9. Lu, J. Can the central environmental protection inspection reduce transboundary pollution? Evidence from river water quality data in China. J. Clean. Prod. 2022, 332, 130030. [Google Scholar] [CrossRef]
  10. Behmel, S.; Damour, M.; Ludwig, R.; Rodriguez, M.J. Water quality monitoring strategies—A review and future perspectives. Sci. Total Environ. 2016, 571, 1312–1329. [Google Scholar] [CrossRef]
  11. Duan, T.; Feng, J.; Chang, X.; Li, Y. Evaluation of the effectiveness and effects of long-term ecological restoration on watershed water quality dynamics in two eutrophic river catchments in Lake Chaohu Basin, China. Ecol. Indic. 2022, 145, 109592. [Google Scholar] [CrossRef]
  12. Quan, T.; Zhang, H.; Li, J.; Lu, B. Horizontal ecological compensation mechanism and green low-carbon development in river basins: Evidence from Xin’an River Basin. Environ. Sci. Pollut. Res. 2023, 30, 88463–88480. [Google Scholar] [CrossRef] [PubMed]
  13. Mu, L.; Tan, Z.; Luo, C.; Qiao, N. Exploring the contribution of the river chief system on controlling industrial water pollution under quasi-natural experimental conditions. Environ. Sci. Pollut. Res. 2023, 30, 89415–89429. [Google Scholar] [CrossRef] [PubMed]
  14. Xu, X.; Cheng, Y.; Meng, X. River chief system, emission abatement, and firms’ profits: Evidence from China’s polluting firms. Sustainability 2022, 14, 3418. [Google Scholar] [CrossRef]
  15. Deb, A.; Bhattacharjee, I.; Das, T.; Mandal, B.; Chakravorty, P.P. Modelling of surface water quality parameters from Damodar River at slag disposal site: A case study. Int. J. Ecol. Dev. 2021, 36, 12–24. [Google Scholar]
  16. Tong, S.; Li, H.; Tudi, M.; Yuan, X.; Yang, L. Comparison of characteristics, water quality and health risk assessment of trace elements in surface water and groundwater in China. Ecotoxicol. Environ. Saf. 2021, 219, 112283. [Google Scholar] [CrossRef]
  17. Dandge, K.P.; Patil, S.S. Drinking water quality assessment using WQI in Bhokardan area of Jalna district, Maharashtra state. Appl. Ecol. Environ. Sci. 2021, 9, 800–805. [Google Scholar] [CrossRef]
  18. Hao, S.; Fu, Y.; Zhang, J.; Zou, Y.; Wei, J.; Zheng, H. Modeling and evaluating spatial variation of pollution characteristics in the Nyang River. Pol. J. Environ. Stud. 2022, 31, 75–83. [Google Scholar] [CrossRef]
  19. Hemachandra, S.C.S.M.; Sewwandi, B.G.N. Application of water pollution and heavy metal pollution indices to evaluate the water quality in St. Sebastian Canal, Colombo, Sri Lanka. Environ. Nanotechnol. Monit. Manag. 2023, 20, 100790. [Google Scholar] [CrossRef]
  20. Uddin, M.G.; Nash, S.; Olbert, A.I. A review of water quality index models and their use for assessing surface water quality. Ecol. Indic. 2021, 122, 107218. [Google Scholar] [CrossRef]
  21. Jayasiri, M.M.J.G.C.N.; Yadav, S.; Dayawansa, N.D.K.; Propper, C.R.; Kumar, V.; Singleton, G.R. Spatio-temporal analysis of water quality for pesticides and other agricultural pollutants in Deduru Oya river basin of Sri Lanka. J. Clean. Prod. 2022, 330, 129897. [Google Scholar] [CrossRef]
  22. Kinar, N.J.; Brinkmann, M. Development of a sensor and measurement platform for water quality observations: Design, sensor integration, 3D printing, and open-source hardware. Environ. Monit. Assess. 2022, 194, 207. [Google Scholar] [CrossRef]
  23. Arndt, J.; Kirchner, J.S.; Jewell, K.S.; Schluesener, M.P.; Wick, A.; Ternes, T.A.; Duester, L. Making waves: Time for chemical surface water quality monitoring to catch up with its technical potential. Water Res. 2022, 213, 118168. [Google Scholar] [CrossRef] [PubMed]
  24. Sharma, B.M.; Scheringer, M.; Chakraborty, P.; Bharat, G.K.; Steindal, E.H.; Trasande, L.; Nizzetto, L. Unlocking India’s potential in managing endocrine-disrupting chemicals (EDCs): Importance, challenges, and opportunities. Expo. Health 2023, 15, 841–855. [Google Scholar] [CrossRef] [PubMed]
  25. Sengar, A.; Vijayanandan, A. Human health and ecological risk assessment of 98 pharmaceuticals and personal care products (PPCPs) detected in Indian surface and wastewaters. Sci. Total Environ. 2022, 807, 150677. [Google Scholar] [CrossRef]
  26. Li, M.; Shi, Q.; Song, N.; Xiao, Y.; Wang, L.; Chen, Z.; James, T.D. Current trends in the detection and removal of heavy metal ions using functional materials. Chem. Soc. Rev. 2023, 52, 5827–5860. [Google Scholar] [CrossRef]
  27. Metcalfe, C.D.; Bayen, S.; Desrosiers, M.; Muñoz, G.; Sauvé, S.; Yargeau, V. Methods for the analysis of endocrine disrupting chemicals in selected environmental matrixes. Environ. Res. 2022, 206, 112616. [Google Scholar] [CrossRef]
  28. Shams, M.Y.; Elshewey, A.M.; El-Kenawy, E.-S.M.; Ibrahim, A.; Talaat, F.M.; Tarek, Z. Water quality prediction using machine learning models based on grid search method. Multimed. Tools Appl. 2024, 83, 35307–35334. [Google Scholar] [CrossRef]
  29. Niazkar, M.; Menapace, A.; Brentan, B.; Piraei, R.; Jimenez, D.; Dhawan, P.; Righetti, M. Applications of XGBoost in water resources engineering: A systematic literature review (Dec 2018–May 2023). Environ. Model. Softw. 2024, 174, 105971. [Google Scholar] [CrossRef]
  30. Ma, W.; Zhang, X.; Xie, J.; Zuo, G.; Luo, F.; Zhang, X.; Jin, T.; Yang, X. Prediction of non-stationary daily streamflow series based on ensemble learning: A case study of the Wei River Basin, China. Stoch. Environ. Res. Risk Assess. 2024, 39, 509–529. [Google Scholar] [CrossRef]
  31. Liu, L.; Silva, E.A.; Wu, C.; Wang, H. A machine learning-based method for the large-scale evaluation of the qualities of the urban environment. Comput. Environ. Urban Syst. 2017, 65, 113–125. [Google Scholar] [CrossRef]
  32. Zhu, M.; Wang, J.; Yang, X.; Zhang, Y.; Zhang, L.; Ren, H.; Wu, B.; Ye, L. A review of the application of machine learning in water quality evaluation. Eco Environ. Health 2022, 1, 107–116. [Google Scholar] [CrossRef] [PubMed]
  33. Nti, E.K.; Cobbina, S.J.; Attafuah, E.E.; Senanu, L.D.; Amenyeku, G.; Gyan, M.A.; Forson, D.; Safo, A.-R. Water pollution control and revitalization using advanced technologies: Uncovering artificial intelligence options towards environmental health protection, sustainability and water security. Heliyon 2023, 9, e18170. [Google Scholar] [CrossRef] [PubMed]
  34. Giri, S. Water quality prospective in Twenty First Century: Status of water quality in major river basins, contemporary strategies and impediments: A review. Environ. Pollut. 2021, 271, 116332. [Google Scholar] [CrossRef]
  35. Chen, K.; Chen, H.; Zhou, C.; Huang, Y.; Qi, X.; Shen, R.; Liu, F.; Zuo, M.; Zou, X.; Wang, J.; et al. Comparative analysis of surface water quality prediction performance and identification of key water parameters using different machine learning models based on big data. Water Res. 2020, 171, 115454. [Google Scholar] [CrossRef]
  36. Dilmi, S.; Ladjal, M. A novel approach for water quality classification based on the integration of deep learning and feature extraction techniques. Chemom. Intell. Lab. Syst. 2021, 214, 104329. [Google Scholar] [CrossRef]
  37. Ma, C.; Zhao, J.; Ai, B.; Sun, S.; Yang, Z. Machine learning based long-term water quality in the Turbid Pearl River Estuary, China. J. Geophys. Res. Oceans 2022, 127, e2021JC018017. [Google Scholar] [CrossRef]
  38. Kuthe, A.; Bhake, C.; Bhoyar, V.; Yenurkar, A.; Khandekar, V.; Gawale, K. Water quality analysis using machine learning. Int. J. Res. Appl. Sci. Eng. Technol. 2022, 10, 581–585. [Google Scholar] [CrossRef]
  39. Suwadi, N.A.; Derbali, M.; Sani, N.S.; Lam, M.C.; Arshad, H.; Khan, I.; Kim, K.I. An optimized approach for predicting water quality features based on machine learning. Wirel. Commun. Mob. Comput. 2022, 2022, 3397972. [Google Scholar] [CrossRef]
  40. Shamsuddin, I.I.S.; Othman, Z.; Sani, N.S. Water quality index classification based on machine learning: A case from the Langat River basin model. Water 2022, 14, 2939. [Google Scholar] [CrossRef]
  41. Arrighi, C.; Castelli, F. Prediction of ecological status of surface water bodies with supervised machine learning classifiers. Sci. Total Environ. 2023, 857, 159655. [Google Scholar] [CrossRef] [PubMed]
  42. Liu, X.; Lu, D.; Zhang, A.; Liu, Q.; Jiang, G. Data-driven machine learning in environmental pollution: Gains and problems. Environ. Sci. Technol. 2022, 56, 2124–2133. [Google Scholar] [CrossRef] [PubMed]
  43. Ahmed, A.N.; Othman, F.B.; Afan, H.A.; Ibrahim, R.K.; Fai, C.M.; Hossain, M.S.; Ehteram, M.; Elshafie, A. Machine learning methods for better water quality prediction. J. Hydrol. 2019, 578, 124084. [Google Scholar] [CrossRef]
  44. Zhang, J.; Ma, X.; Zhang, J.; Sun, D.; Zhou, X.; Mi, C.; Wen, H. Insights into geospatial heterogeneity of landslide susceptibility based on the SHAP-XGBoost model. J. Environ. Manag. 2023, 332, 117357. [Google Scholar] [CrossRef]
  45. Hutchins, M.G.; Hitt, O.E. Sensitivity of river eutrophication to multiple stressors illustrated using graphical summaries of physics-based river water quality model simulations. J. Hydrol. 2019, 577, 123917. [Google Scholar] [CrossRef]
  46. He, H.; Song, D.; Wang, Y. Construction of water quality evaluation model and identification of key features in Huzhou City based on machine learning method. Water Resour. Dev. Manag. 2023, 9, 57–64. [Google Scholar] [CrossRef]
  47. Cheng, W.; Yuan, D.; Xiong, P. Construction and evaluation of water quality index prediction model based on various machine learning algorithms. J. Environ. Sci. 2023, 43, 144–152. [Google Scholar] [CrossRef]
  48. Han, Y.; Tan, Q.; Zhang, T.; Wang, S.; Zhang, T.; Zhang, S. Development of an assessment-based planting structure optimization model for mitigating agricultural greenhouse gas emissions. J. Environ. Manag. 2024, 349, 119322. [Google Scholar] [CrossRef]
  49. Cao, M.; Narayanan, M.; Shi, X.; Chen, X.; Li, Z.; Ma, Y. Optimistic contributions of plant growth-promoting bacteria for sustainable agriculture and climate stress alleviation. Environ. Res. 2023, 217, 114924. [Google Scholar] [CrossRef]
  50. Chen, P.; Zhao, W.; Chen, D.; Huang, Z.; Zhang, C.; Zheng, X. Research progress on integrated treatment technologies of rural domestic sewage: A review. Water 2022, 14, 2439. [Google Scholar] [CrossRef]
  51. Maglia, N.; Raimondi, A. A new approach on design and verification of integrated sustainable urban drainage systems for stormwater management in urban areas. J. Environ. Manag. 2025, 373, 123882. [Google Scholar] [CrossRef] [PubMed]
  52. Whelan, M.; Linstead, C.; Worrall, F.; Ormerod, S.; Durance, I.; Johnson, A.; Johnson, D.; Owen, M.; Wiik, E.; Howden, N.; et al. Is water quality in British rivers “better than at any time since the end of the Industrial Revolution”? Sci. Total Environ. 2022, 843, 157014. [Google Scholar] [CrossRef] [PubMed]
  53. Altman, K.; Yelton, B.; Porter, D.E.; Kelsey, R.H.; Friedman, D.B. The role of understanding, trust, and access in public engagement with environmental activities and decision making: A qualitative study with water quality practitioners. Environ. Manag. 2023, 71, 1162–1175. [Google Scholar] [CrossRef] [PubMed]
  54. Zhao, Y.; Zheng, L.; Zhu, J. Could environmental courts reduce carbon intensity? Evidence from cities of China. J. Clean. Prod. 2022, 377, 134444. [Google Scholar] [CrossRef]
Figure 1. Schematic diagram of the geographical location and observation points of Yuhuan City.
Jmse 13 00539 g001
Figure 2. Principle of regression decision tree.
Jmse 13 00539 g002
Figure 3. Schematic diagram supporting phasor regression.
Jmse 13 00539 g003
Figure 4. Schematic diagram of random forest.
Jmse 13 00539 g004
Figure 5. Schematic diagram of XGBoost.
Jmse 13 00539 g005
Figure 6. Changes in water quality index of Yuhuan city from 2020 to 2023.
Jmse 13 00539 g006
Figure 7. Compliance status of water quality parameters in Yuhuan city’s water functional zone.
Jmse 13 00539 g007
Figure 8. Histograms and Shapiro–Wilk normality tests.
Jmse 13 00539 g008
Figure 9. Pearson correlation coefficient matrix between water quality index CWQI (left) and 7 basic water quality parameters (right).
Jmse 13 00539 g009
Figure 10. Performance evaluation results of 35 models.
Jmse 13 00539 g010
Figure 11. Comparison of predicted and true values in the test set.
Jmse 13 00539 g011
Figure 12. SHAP values of water quality parameters on water quality indicators.
Jmse 13 00539 g012
Table 1. Proportion of samples with water quality parameters at various water standards (%).
Water Quality ParametersIIIIIIIVV
BOD015.7358.3725.880
CODcr10.0910.0946.7833.020.45
CODMn015.7458.3825.880
DO43.4737.1913.046.280
NH3-N2.1134.3938.0925.35.29
TP1.5223.8551.7718.784.06
Table 2. The settings of the best parameters for the classification approaches using grid search.
ModelsParameters TuningThe Best Parameters
Multiple linear regression//
DTmax_depth = [None, 5, 10]max_depth = [None]
min_samples_split = [2, 10, 15, 20]min_samples_split = [15]
min_samples_leaf = [1, 2, 4]min_samples_leaf = [2]
SVRC = [1, 10, 100]C = [100]
gamma = [’scale’, ’auto’, 10, 100]gamma = [’scale’]
kernel = [’linear’, ’rbf’, ’poly’]kernel = [’linear’]
RFn_estimators = [30, 50, 100]n_estimators = [30]
min_samples_split = [2, 5, 10]min_samples_split = [2]
min_samples_leaf = [1, 2, 4]min_samples_leaf = [1]
XGBoostn_estimators = [100, 150, 200, 250]n_estimators = [200]
max_depth = [3, 5, 7, 9, 11]max_depth = [7]
learning_rate = [0.01, 0.1, 0.2, 0.3]learning_rate = [0.1]
“/”: indicates that no parameters need to be set.
Disclaimer/Publisher’s Note: The statements, opinions and data contained in all publications are solely those of the individual author(s) and contributor(s) and not of MDPI and/or the editor(s). MDPI and/or the editor(s) disclaim responsibility for any injury to people or property resulting from any ideas, methods, instructions or products referred to in the content.

