Abstract
Cyanobacterial blooms are a widespread phenomenon in aquatic ecosystems worldwide, causing significant harm to the ecological environment. Lake Taihu is the third-largest freshwater lake in China. The region has been increasingly affected by cyanobacterial blooms, drawing greater attention from people. Currently, numerous models have been developed for detecting algal bloom based on spectral characteristics. However, the intuitive basis of optical detection lies in water color. Therefore, constructing an algal bloom detecting model from the perspective of chromaticity is worth exploring. This study constructed an algal bloom detecting model based on chromatic parameters, DFLH, and IAVW by using hyperspectral data from Lake Taihu. It further applied the model to the ZY-1E hyperspectral satellite for large-scale algal bloom monitoring. The threshold for detecting cyanobacterial blooms is defined as DFLH > 0.013 sr−1 and Hue Angle > 170.58 degrees; the threshold for the normal water is defined as DFLH < 0.013 sr−1. The parameter thresholds for the floating leaf vegetation range were defined as DFLH > 0.013 sr−1, Saturation < 0.07, and IAVW > 598 nm. Through the validation, in the modeling dataset, the overall accuracy (OA) value is 0.81 and the F1-score is 0.86. In the validation dataset, the overall accuracy (OA) value is 0.83 and the F1-score is 0.89. The model demonstrates good detecting performance. Regarding its application on the ZY-1E satellite, we validated the detection results accuracy through matching synchronized in situ algal density data. The results are as follows: OA is 0.95, and the F1-score is 0.95. The results above indicate that the algal bloom detection method developed in this study had a good accuracy in detecting algal blooms in Lake Taihu on 6 September 2020. This study provided the algae bloom detecting model based on water color characteristics in Lake Taihu, which had high detecting accuracy.
1. Introduction
Cyanobacterial blooms are a global phenomenon, occurring across diverse aquatic environments, including tropical, polar, freshwater, and hypersaline systems [1,2]. The occurrence of harmful cyanobacterial blooms has been increasing worldwide, posing significant risks to human and animal health, degrading water quality, and disrupting aquatic ecosystems [3,4]. Some cyanobacterial blooms produce harmful compounds, including microcystins and potent hepatotoxins, which pose significant threats to the survival and development of various organisms [5,6]. Considering the spatial and temporal variability of cyanobacterial bloom outbreaks [7], accurately detecting the range of blooms is critical for decision-making in bloom mitigation and prevention. Satellite remote sensing technology has emerged as an effective tool for monitoring these blooms.
As the third-largest freshwater lake in China, it faces various ecological challenges, particularly eutrophication and cyanobacterial blooms [8]. Lake Taihu has become increasingly eutrophic in recent decades [9]. It has been more severely affected by cyanobacterial blooms, with the most severe outbreaks occurring in Meiliang Lake, Zhushan Lake, and the western shores of Lake Taihu [10], as well as the eastern part of the lake [11]. It is important to note that the lake has a history of cyanobacteria blooms, as observed and documented in previous studies [11,12,13]. These qualitative observations provide valuable background for understanding the ongoing water quality issues in Lake Taihu. Therefore, this study focuses on Lake Taihu.
Ahn et al. used SeaWiFS ocean color imagery to calculate chl-a and detect harmful algal bloom occurrences in Korean waters [14]. Shen et al. used MERIS data to calculate the divergence index (DI) to identify algal blooms [15]. Most of the current methods for algal bloom detection are based on spectral features. The spectral data were often served as the primary criterion for algal bloom detection [16,17]. The spectral data are influenced by various factors, including the satellite’s signal-to-noise ratio and sampling frequency. The intuitive basis of optical detection is inherently related to water color. Therefore, constructing an algal bloom detecting model from the perspective of chromaticity is worth exploring. Water color information can be obtained using various high-resolution imaging devices [18,19], further expanding the model’s applicability. Hyperspectroscopy is a technique that captures extensive continuous spectral information across a broad range of wavelengths, offering more detailed and comprehensive spectral data than conventional color images [20,21]. This enables more precise calculation of water chromatic parameters.
A number of hyperspectral payloads have become operational in recent years, including HICO, PACE OCI, PRISMA, EnMAP, DESIS, HIME, and others [22,23,24,25,26]. China has also launched several hyperspectral satellites, including HIS (HJ-2A), AHSI (GF-5B), AHSI (ZY-01D/E), and others [27,28]. These satellites have provided a new source of data for detecting algal blooms in China. Therefore, hyperspectral satellite data were selected to establish a method for detecting algal blooms in Lake Taihu.
The color of algal blooms in inland waters and coastal oceans can range from greenish to yellowish, brownish, or even reddish, depending on the composition of bloom species (such as diatoms or dinoflagellates) and the concentrations of various water constituents [29]. With the advancement of the comprehensive system for characterizing the color properties of water bodies, chromatic parameters have become key indicators for detecting algal blooms [30]. Liu et al. calculated the hue angle using multispectral satellite data from sources such as GF-1, HY-1D, and Sentinel-2, successfully identifying algal bloom areas in the water column [31]. However, they primarily used multispectral satellite data to calculate chromatic parameters; it is less accurate than using hyperspectral data.
Apparent Visual Wavelength (AVW) is defined as a one-dimensional geophysical metric that correlates with the intrinsic spectral shape. It is calculated using full-wavelength spectral data and is indicative of the spectral shape, primarily applied in water color analysis [32]. Numerous studies have confirmed the ability to perform AVW calculations using in situ measurements and hyperspectral data from sources such as HICO, LIS, and SeaWiFS. These studies also highlight the correlation between AVW and optical properties/biogeochemical parameters, such as chlorophyll-a and dissolved organic matter (DOC), in the water column [32,33,34]. In a water body classification study based on hyperspectral datasets such as PACE and GLORIA, Bi et al. found significant differences in the AVW of algal bloom and normal water bodies, demonstrating that AVW could be further applied for algal bloom identification [35]. AVW reflects the color characteristics of the water body. It also has the ability to detect the algal blooms. Therefore, we use it as one of the chromatic parameters to detect algal blooms in Lake Taihu.
Moreover, chlorophyll acts as a key indicator of plankton abundance in the water column and serves as an important indicator for detecting algal blooms. The accuracy of chlorophyll-a fluorescence remote sensing for estimating chlorophyll-a concentrations in Class II and red tide-affected water bodies has been significantly improved. The primary algorithms used to calculate fluorescence line height (FLH) include the fluorescence baseline method, initially proposed by Neville and Gower [36], the normalized fluorescence height (NFH), initially proposed by Vos and Kishino [37], and the ratio method, initially proposed by Dongzhi Zhao et al. [38]. Fluorescence height can also be used as an indicator for detecting algal blooms [39]. However, fluorescence-based methods for algal bloom detection fundamentally rely on spectral characteristics and do not adequately account for the chromatic features of algal bloom waters. For inland water bodies with complex color characteristics, such methods may still be insufficient in accurately describing the optical properties of algal bloom-affected waters. Therefore, we combined it with the chromatic parameter to detect the algal bloom in Lake Taihu.
The objective of this study is to establish a method for detecting algal blooms in Lake Taihu based on water color characteristics. Hyperspectral satellite data were used for detection to ensure the accuracy of water chromatic parameter calculations. In situ measured algal density from the same time period was used to evaluate and validate the detection effectiveness. In order to show the advantages of detecting algal blooms from the perspective of water color characteristics, we compared the detection accuracy of our results with that of other models.
2. Materials and Method
2.1. Study Area
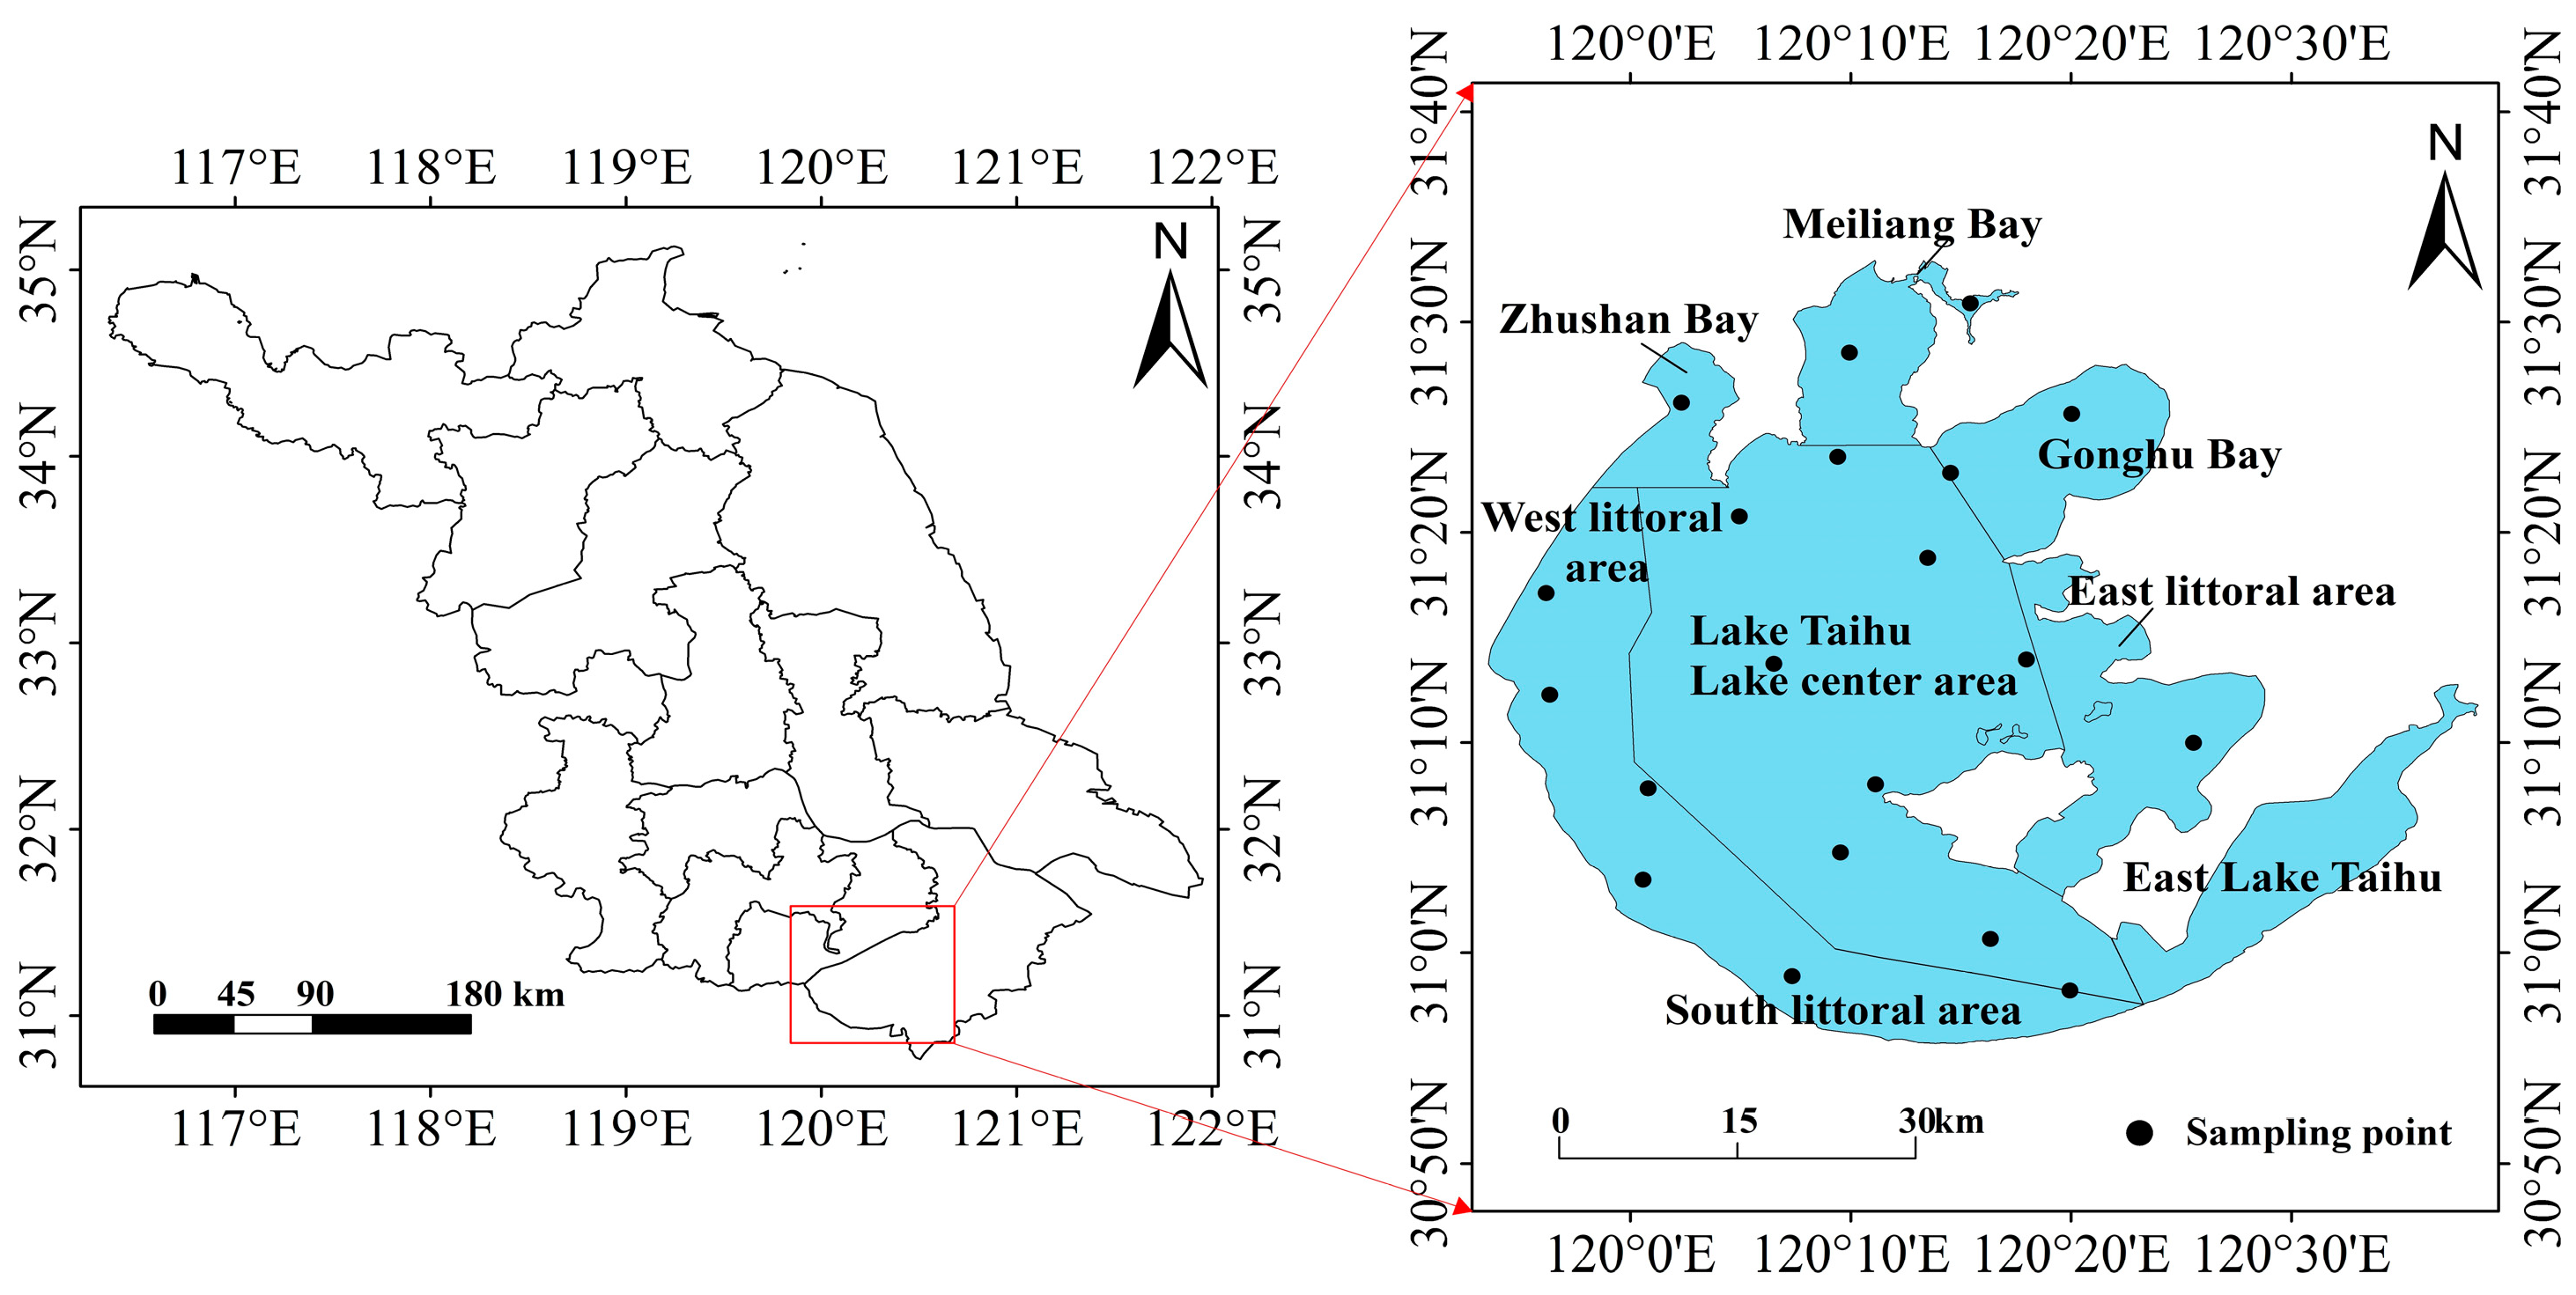
Lake Taihu is located between 30°5′ N 32°8′ N and 119°8′ E 121°55′ E [11], at the border of Jiangsu and Zhejiang provinces, China. Situated in the lower reaches of the Yangtze River, it covers an area of approximately 2420 km2. The terrain of Taihu is relatively flat, and the region has a subtropical monsoon climate with distinct seasons. Summers are hot and humid, while winters are relatively cold. The area experiences frequent rainfall in the summer. The specific geographic location and positions of the monitoring stations are shown in Figure 1.

Figure 1.
Study area of the Lake Taihu water body.
2.2. In Situ Measured Algal Bloom Data in Lake Taihu
In this study, we collected in situ measured data from 19 monitoring stations in Lake Taihu. The stations include No. 14 light beacon, Daling Mountain, Dapu Kou, Jiaoshan, Lanshanzui, Manshan, Meiliang Lake Center, Shazu South, and Tuoshan South, among others. The datasets were as follows:
The in situ algal density data were obtained from September 2014 to September 2020. The algal density data ranged from 44.6 to 3.35 × 10⁷ cells/L.
The aquatic vegetation characteristics on the lake surface were obtained from September 2014 to October 2018. It was determined through surveying and the collection of water samples from a depth of 1 to 2 m. We selected the measurement points in Lake Taihu and identified the algal bloom characteristics of the water bodies at these points using laboratory methods. The survey classified the water bodies into three categories: clear water, water with a small number of algal particles, and water with a large number of algal particles.
The corresponding Rrs were obtained from September 2014 to October 2018. We also collected it to make the development of the algal bloom water body detection method for Lake Taihu.
A total of 132 valid datasets on algal density, a total of 113 valid datasets on aquatic vegetation characteristics, and the Rrs data in Lake Taihu were obtained. The detailed information of the in situ measurement of Lake Taihu was shown in Table 1.

Table 1.
The detailed information about in situ measured data in Lake Taihu.
2.3. Hyperspectral Imager AHSI on Board ZY-1E
The ZY-1E was successfully launched on 12 September 2019 from China’s Taiyuan Satellite Launch Center, enabling all-weather Earth observation. One of the payloads is the Advanced HyperSpectral Imager (AHSI), which comprises 166 bands across the visible and shortwave infrared wavelength ranges. Further details can be found in Table 2.
Table 2.
Detailed information regarding AHSI on board ZY-1E.
In this paper, a hyperspectral cyanobacteria identification algorithm was first established based on in situ hyperspectral measurements. The algorithm was then applied to ZY-1E hyperspectral satellite data collected on 6 September 2020. This study also explores the feasibility of using hyperspectral satellite remote sensing for cyanobacteria detection.
2.4. Method
2.4.1. Atmospheric Correction
In this paper, atmospheric corrections are performed on AHSI Hyperspectral Imager data (rhot) from ZY-1E using the Dark Spectrum Fitting (DSF) method [40]. This method calculates the atmospheric path reflectance (ρpath) based on multiple dark targets in a scene or sub-scene with no a priori defined dark bands. For each band, the darkest objects were estimated from the ordinary least squares (OLS) fit to the offset of the first 1000 pixels in the histogram, and a “dark spectrum” was created. The continental or oceanic aerosol model is selected for the two closest fitting bands based on the lowest root-mean-square deviation (RMSD) between the observed ρ dark and the inverted ρpath, thereby yielding the remotely sensed reflectance (rhos) of the water body. The Dark Spectrum Fitting (DSF) algorithm is the default atmospheric correction algorithm employed by ACOLITE. It has been used in the inversion of the ρ darkness model for multi-spectral satellites, including the Landsat (OLI) satellite [41] and the Sentinel-2/3 (MLI/OLCI) [42] series of satellites, all of which exhibit excellent calibration accuracy. In this study, the ACOLITE atmospheric correction software (version 20250114.0) was used with the DSF method to perform atmospheric correction on the satellite image acquired on 6 September 2020, over Lake Taihu. We obtained the Rrs data of Lake Taihu within the spectral range of 396 to 2334 nm.
2.4.2. The Methods of Chromatic Parameters
In this paper, the spectrum was employed to calculate the corresponding tri-stimulus values (XYZ), and the hue angle was calculated using the method made by Wernand et al. [43]. Additionally, we used the method made by Bukata to calculate the saturation [44]. We present a wavelength range of 360–830 nm for the hue angle, with a clockwise direction of calculation, in Figure 2.
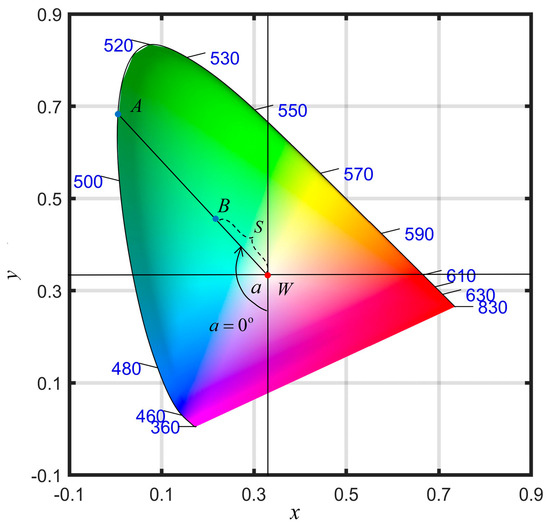
Figure 2.
Schematic diagram of chromatic coordinate.
The formula is presented below. (Chrx, Chry) represents the corresponding coordinate position of the spectral curve of the water body in the chromaticity coordinate system (point B). Additionally, (xw, yw) represents the position of the white point in the chromaticity coordinate system, with xw and yw both equal to 1/3 (point W). S in Equation (2) is represented as the saturation, which is the distance of BW.
2.4.3. Improved Apparent Visual Wavelength (IAVW)
The Apparent Visual Wavelength (AVW) is a one-dimensional geophysical metric that is inherently correlated with the spectral shape of Rrs. Furthermore, it has been applied as part of an optical water classification index. By using the full visible-range spectrum (400–700 nm) in the AVW calculation, this product guarantees the incorporation of any diagnostic signals present in the Rrs signal. Furthermore, it allows for the description and analysis of spectral trends in Rrs using a single variable. The algorithm calculates the weighted harmonic mean of the Rrs wavelengths and outputs the IAVW in units of nanometers (nm).
The AVW algorithm has been enhanced by extending the wavelength range of the input spectral data to extend the range of 360–830 nm. This improvement is referred to as the Improved Apparent Visual Wavelength (IAVW).
2.4.4. Water Extraction
Given that the satellite data for Lake Taihu includes both terrestrial and aquatic features, it is necessary to extract the water bodies of Lake Taihu. Accordingly, the Modified Normalized Difference Water Index (MNDWI) was used to extract the water bodies [45]. Pixels with MNDWI values greater than zero were designated as water bodies, while those with values less than zero were classified as land areas. The MNDWI formula is as follows:
MNDWI = (Rrhos(green) − Rrhot(swir))/(Rrhos(green) + Rrhot(swir))
The reflectance of the green and shortwave infrared bands, corresponding to wavelengths of 560 nm and 1613 nm, are represented by Rrhos(green) and Rrhot(swir), respectively. In this context, Rrhos represents the Rrs of water after the atmosphere correction, and Rrhot represents the Rrs of water before the atmosphere correction.
2.4.5. Dynamic Fluorescence Line Height (DFLH)
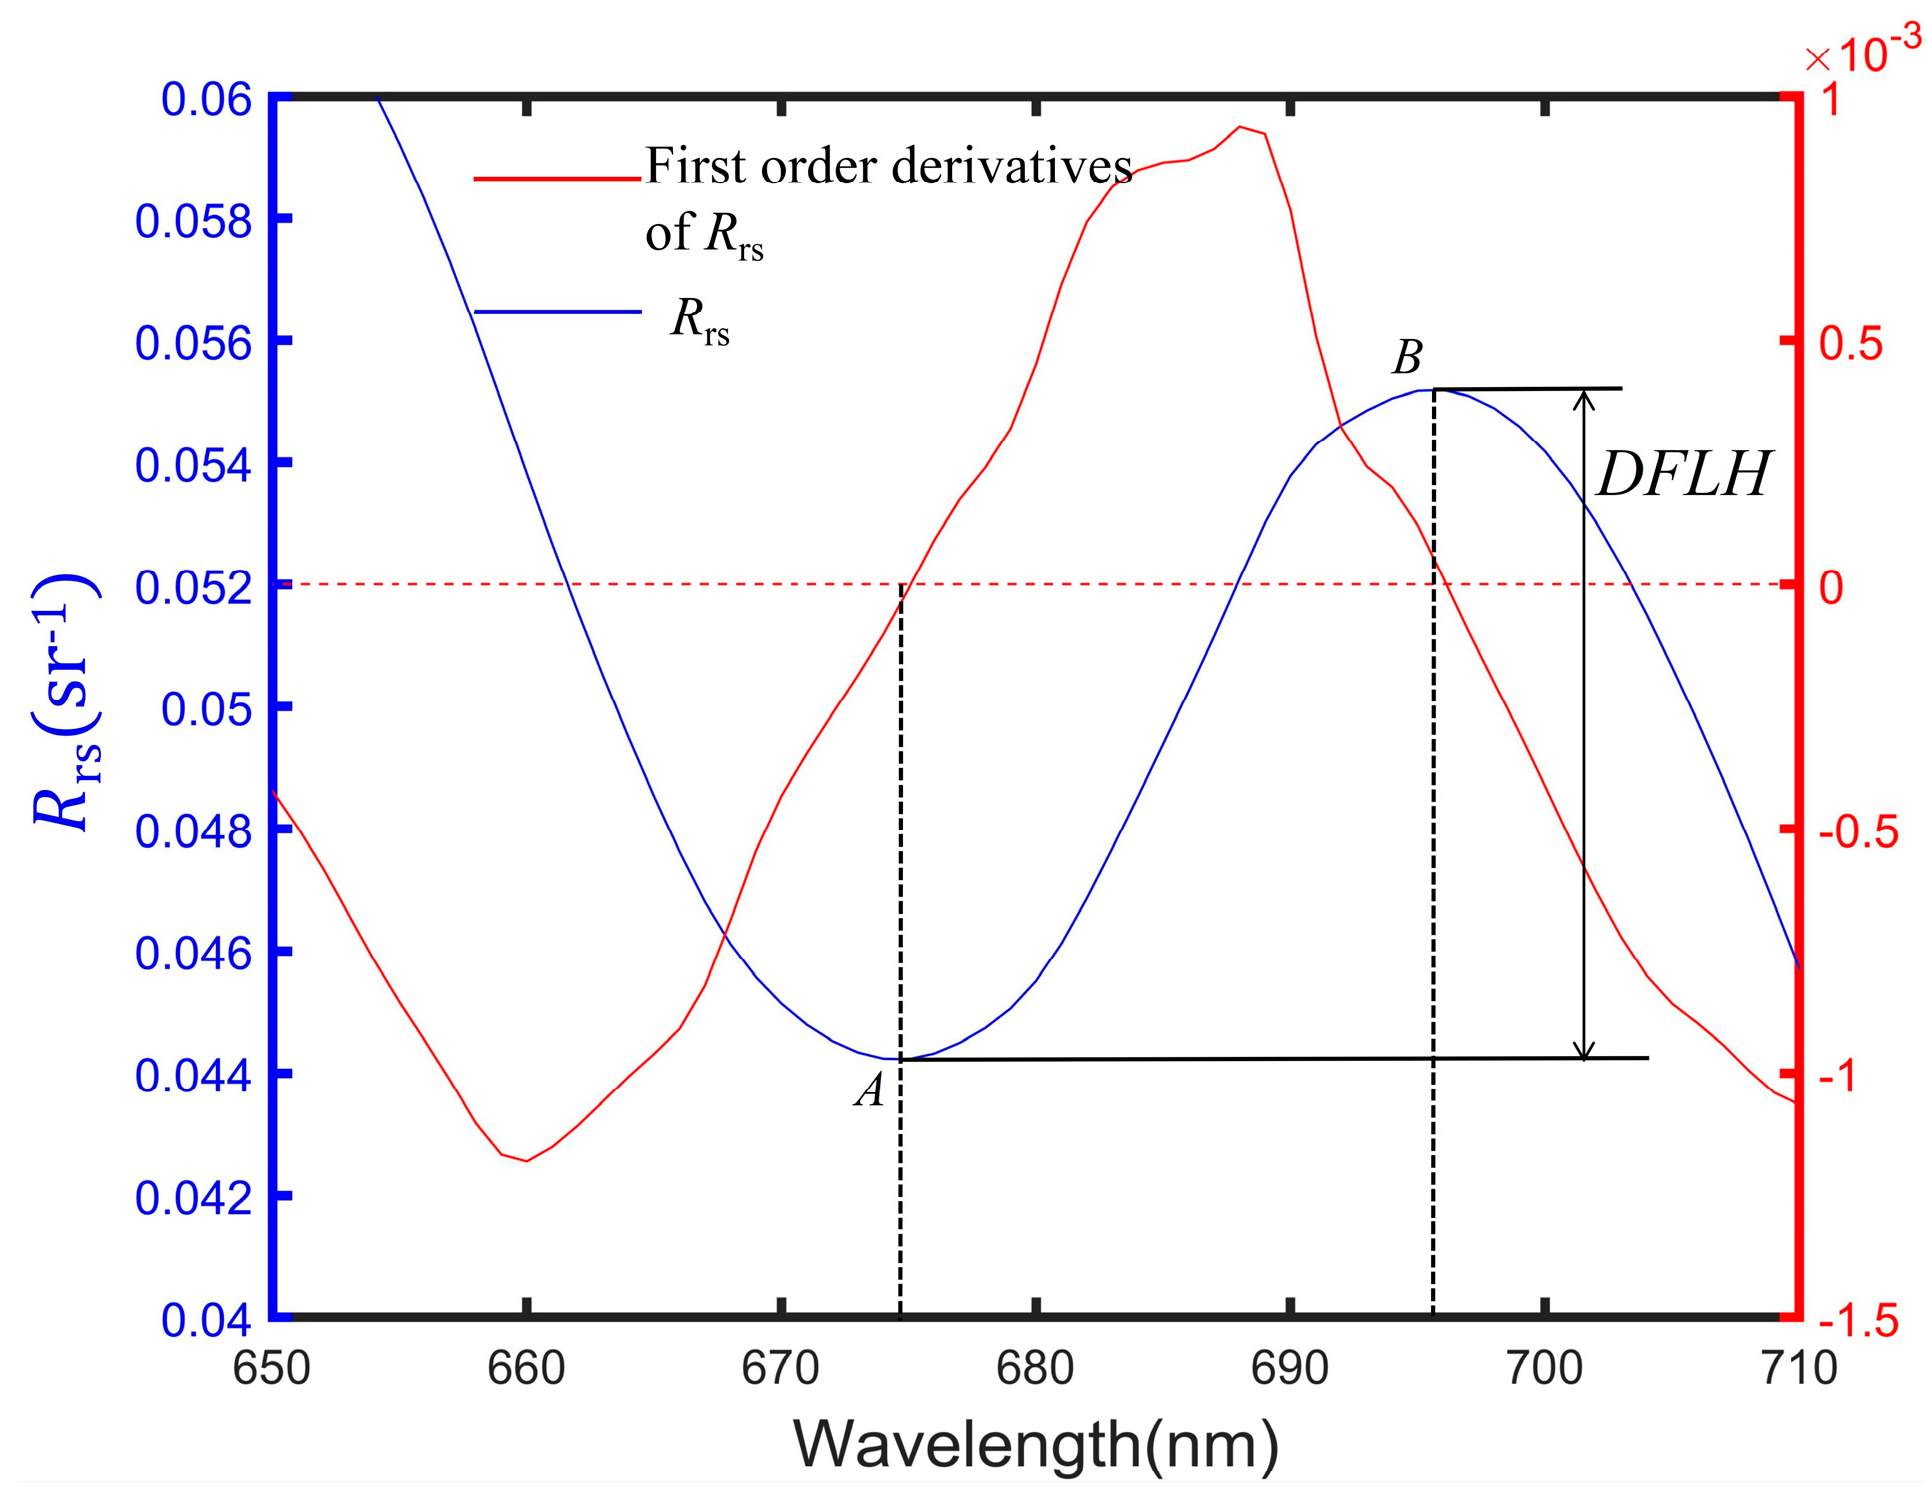
The fluorescence height was calculated with the following steps:
In the first step, the chlorophyll absorption peak at 675 nm serving as the reference point was designated as point A.
In the second step, the first-order derivatives of the hyperspectral Rrs curves of water bodies were calculated in order to locate the wavelength B of the fluorescence peak. This was achieved by identifying the point where the derivative of the 675 nm wavelength in the long-wave direction was zero and where Rrs reached its maximum value within the wavelength range of 680–750 nm.
Subsequently, the Rrs of the fluorescence peak point at the same wavelength on the hyperspectral Rrs curves was obtained. In the third step, the fluorescence height was obtained by calculating the difference between the Rrs of point B and point A. This calculation was then applied to the remaining hyperspectral spectrums, following the same pattern. In Figure 3, the fluorescence height obtained by this calculation method is referred to as the dynamic fluorescence height (DFLH). The specific formula is provided below for reference:
DFLH = RrsB − RrsA
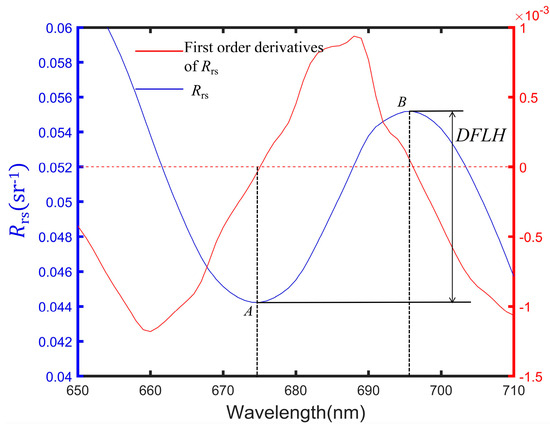
Figure 3.
The spectrum is represented by the blue curve, which depicts the algal hyperspectral Rrs. The red curve represents the first-order derivative of the spectrum. Point A is the valley of the spectrum at 675 nm, while point B is the peak of the spectrum at a distance of 675 nm in the direction of the longwave (at the point of the first-order derivative of 0).
2.4.6. The Method of Detecting the Algae Bloom in Lake Taihu
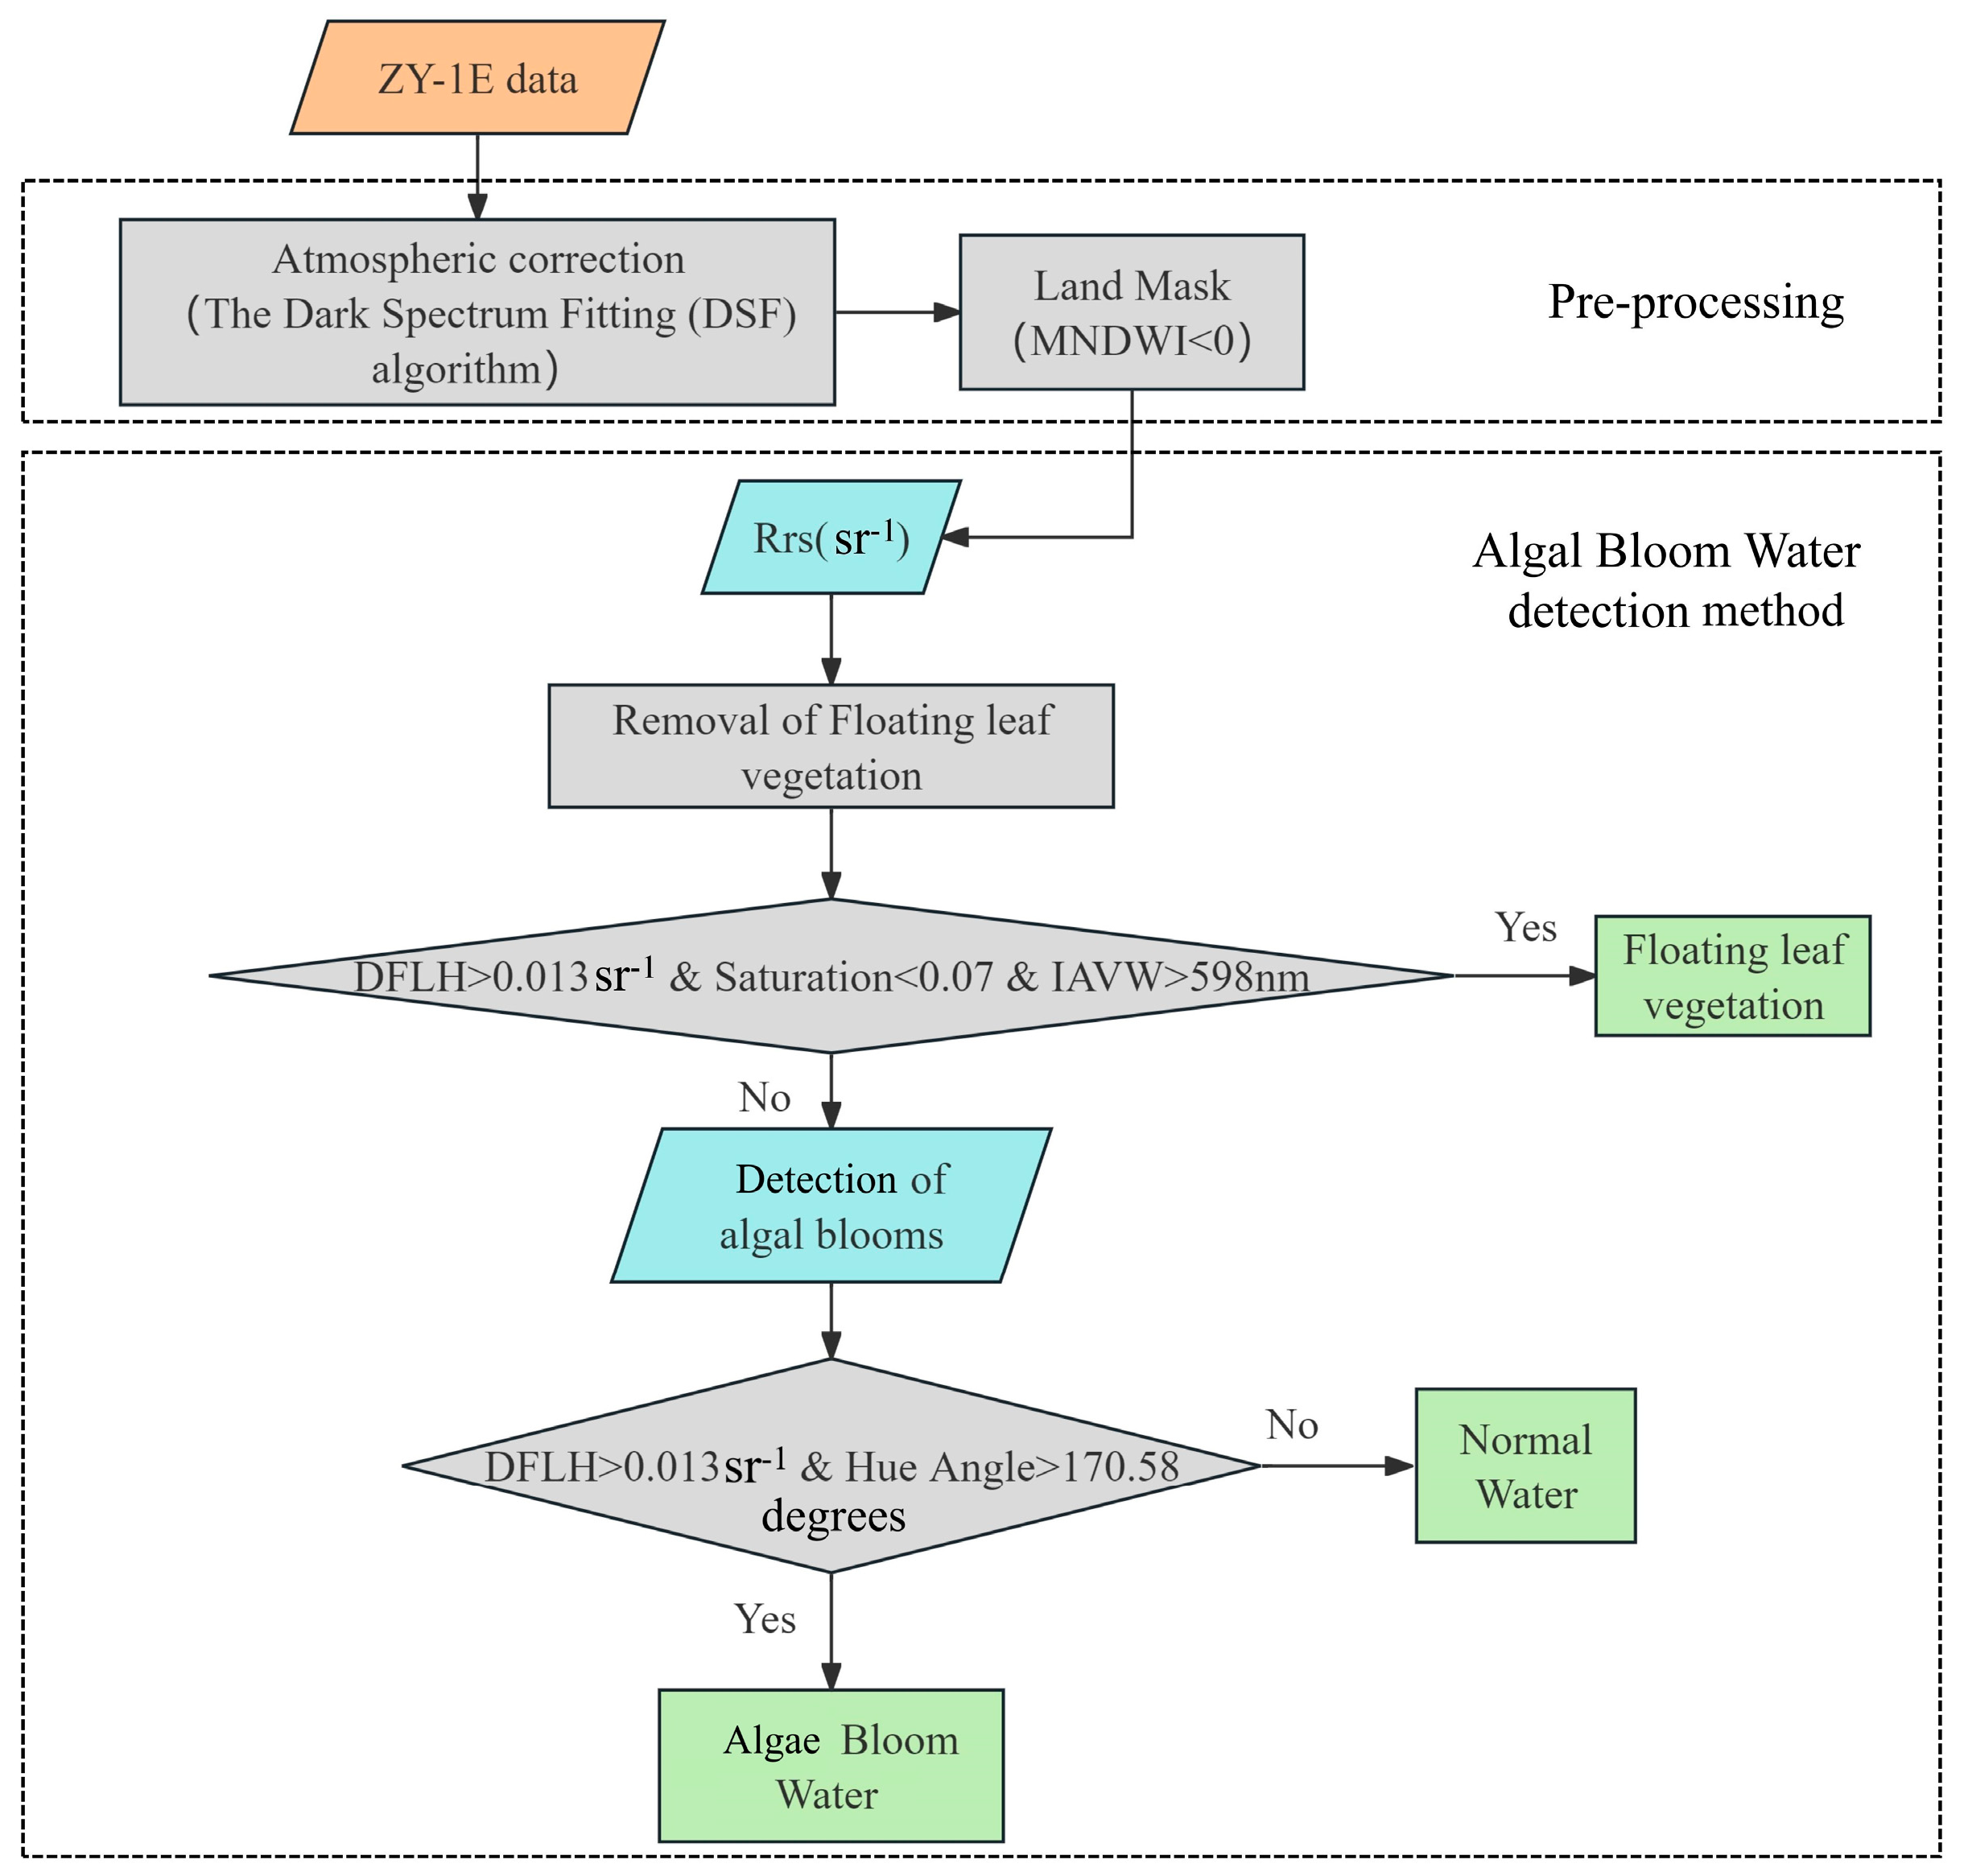
In this study, multiple parameters, including chromatic parameters, fluorescence parameters, and IAVW, were used to detect algal bloom water bodies in Lake Taihu. First, ZY-1E satellite data were pre-processed using the Dark Spectrum Fitting (DSF) atmospheric correction method and the land mask (MNDWI < 0) to obtain the Rrs of Lake Taihu water bodies. Secondly, floating leaf vegetation was removed based on a threshold method. Finally, algal bloom water bodies were detected using the threshold method. The detailed detection process is illustrated in the flowchart (Figure 4). The parameter thresholds for different water bodies are shown in Table 3.

Figure 4.
Flowchart of the (AHSI) ZY-1E hyperspectral remote sensing method for algal bloom water detection in Lake Taihu.
Table 3.
The threshold of multiple parameters for algal bloom detection methods in Lake Taihu.
2.4.7. Accuracy Assessment
In this study, the algal bloom water body extraction model was evaluated using the confusion matrix approach [46], which includes OA, Precision, Recall, and F1-score. The OA (Overall Accuracy) represents the proportion of correctly identified water body categories. Precision represents the proportion of correctly identified water body categories within the predicted water body categories. Recall refers to the proportion of correctly identified water body categories within the actual water body categories. The F1-score is the harmonic mean of precision and recall. This paper is based on the field survey of Lake Taihu from September 2014 to October 2018 to obtain real algal bloom information.
3. Result
3.1. DFLH, Colorimetric Parameters, IAVW Distribution Characteristics
In this study, the ZY-1E hyperspectral satellite image of Lake Taihu, acquired on 6 September 2020 with cloud coverage below 5%, was selected. The data were preprocessed using the DSF atmospheric correction method. The MNDWI was applied to extract water bodies. Next, we calculated the key parameters for algal bloom detection, including DFLH, chromatic parameters, and IAVW. The distribution map and statistical figures of the key parameters are shown in Figure 5.
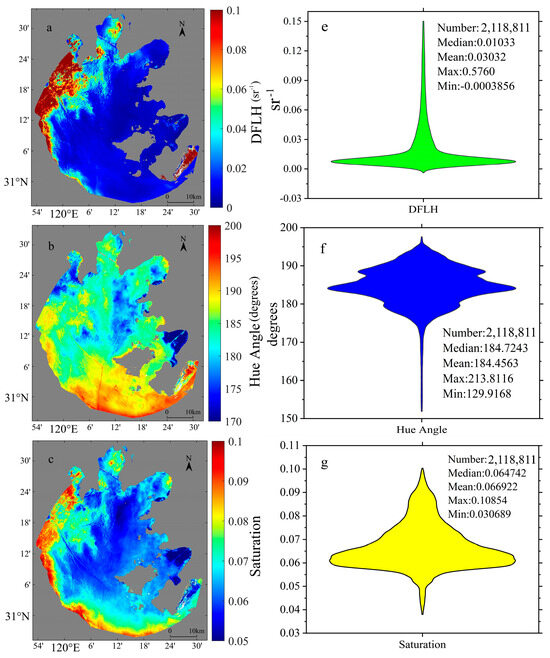

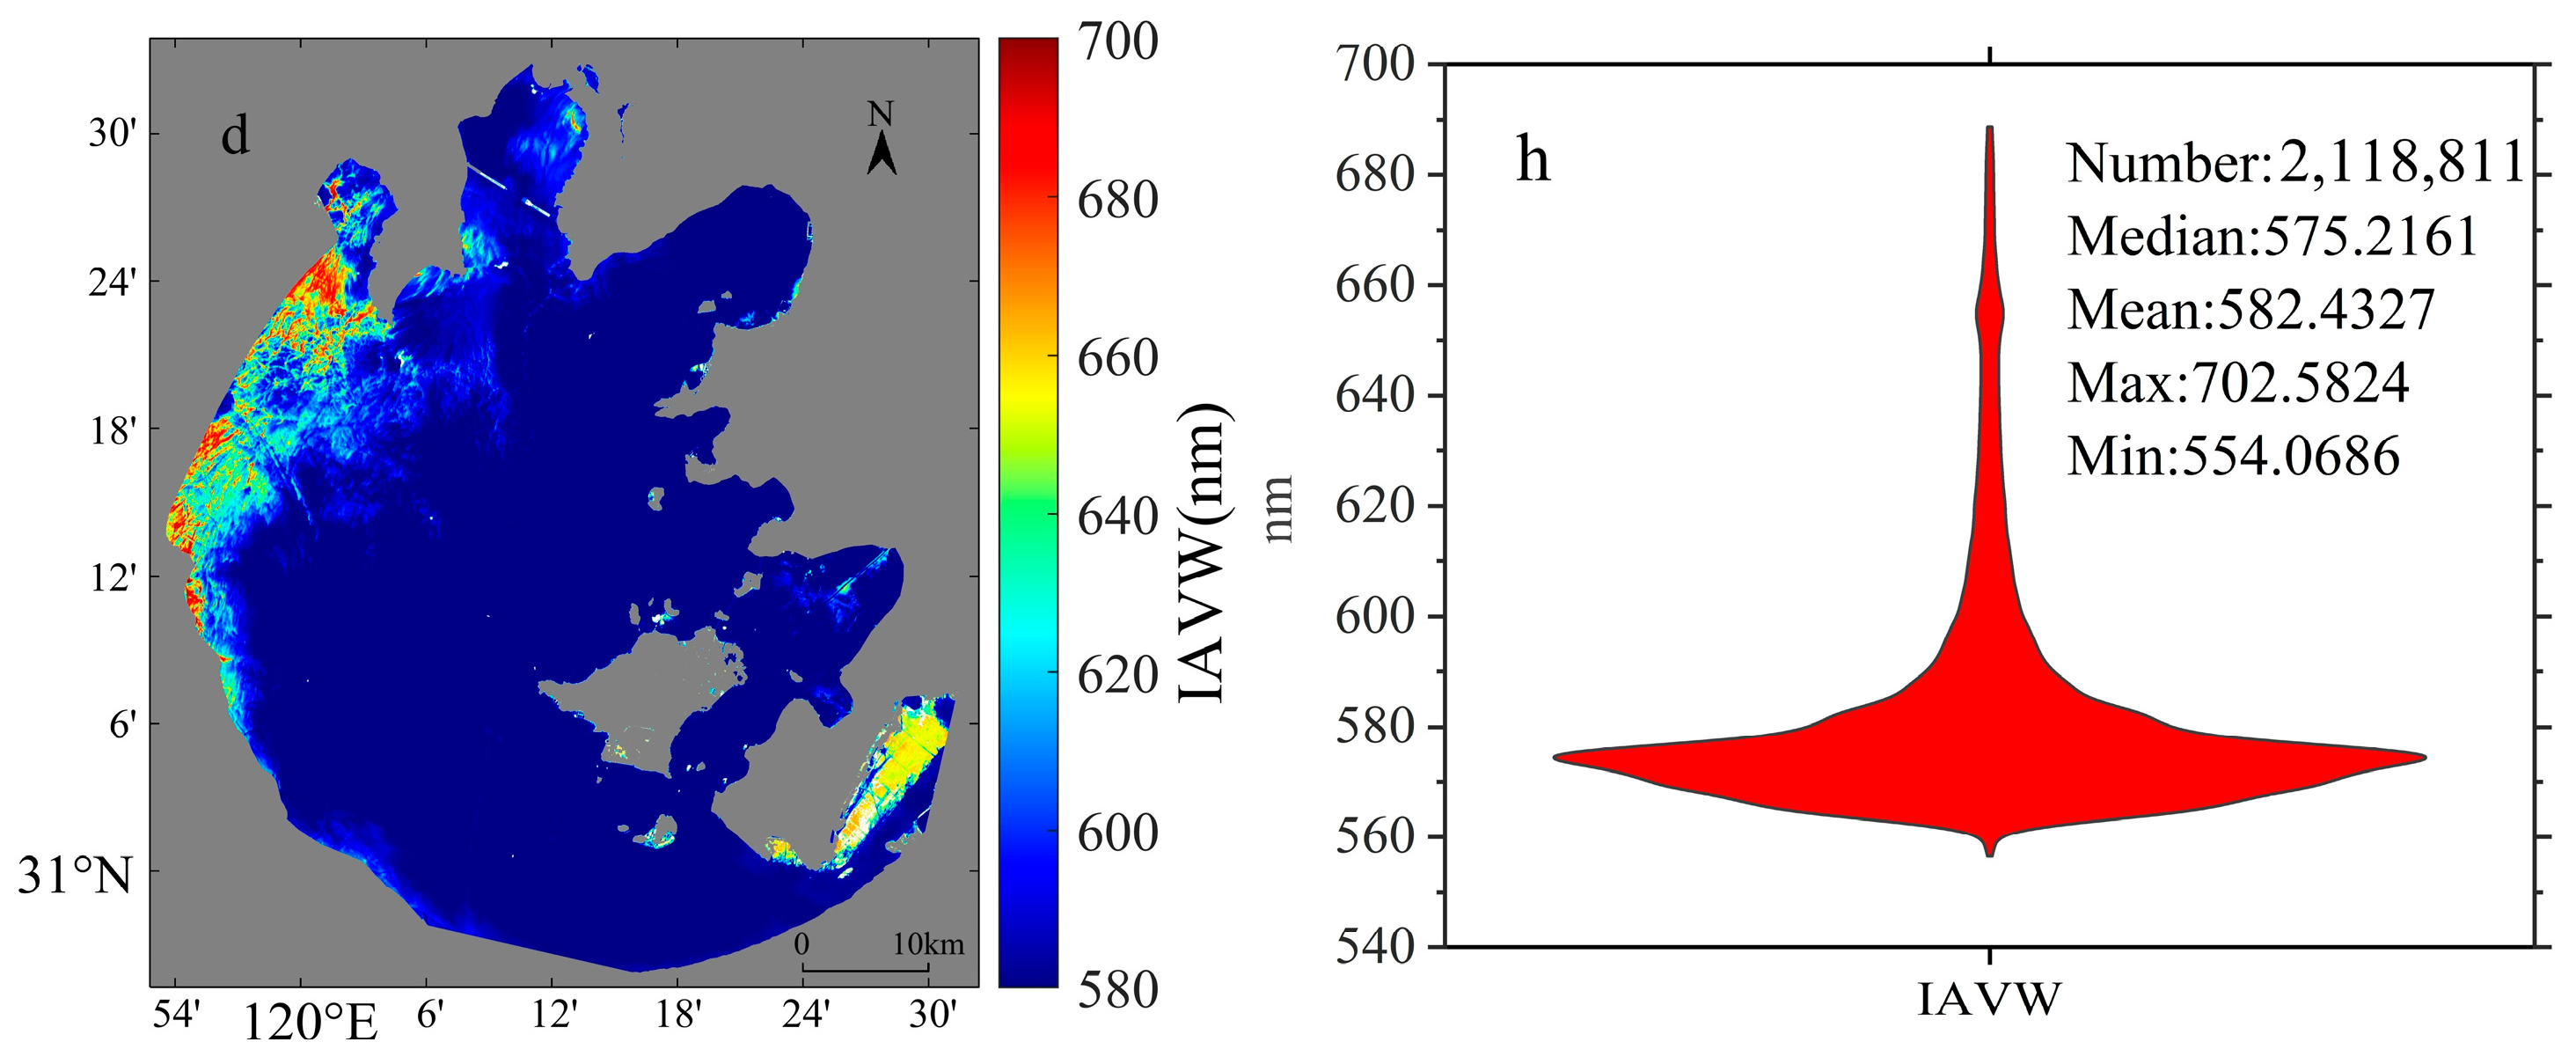
Figure 5.
Statistical maps of water colorimetry parameters and dynamic fluorescence height distribution in the Lake Taihu region ((a–d) are the following spatial distribution maps: (a) DFLH, (b) hue angle, (c) saturation, and (d) IAVW. (e–h) are the following statistical histograms: (e) DFLH, (f) hue angle, (g) saturation, and (h) IAVW).
3.1.1. Characterization of the DFLH Distribution
The DFLH of Lake Taihu ranged from −0.00039 to 0.576 sr−1. The mean value and median value are, respectively, 0.03032 sr−1 and 0.01033 sr−1. The standard deviation was 0.055 sr−1 (see Figure 5a,e). In the western and southern littoral zone of Lake Taihu, the water body exhibited a high DFLH value, ranging from 0.095 to 0.6 sr−1 (see Figure 5a). Additionally, in East Lake Taihu, the floating leaf vegetation had a high value, reaching 0.09~0.14 sr−1. This area with high DFLH values demonstrated a gradual decrease in the overall trend from the northwest to the southeast coastline. Notably, Zhushan Lake and Meiliang Lake were the areas with high DFLH values in Lake Taihu.
3.1.2. Characterization of the Distribution of Colorimetric Parameters
The hue angle of Lake Taihu ranged from 129.92 to 213.81 degrees. The mean value was 582.43 degrees, and the standard deviation was 5.68 degrees (see Figure 5f). In Figure 5b, the high-value areas are located along the southern coast and eastern part of Lake Taihu, with hue angle values ranging from 189.66 to 194.58 degrees. Conversely, the northern coast and the central region of Lake Taihu exhibited low hue angle values, ranging from 175.85 to 178.66 degrees. Overall, the hue angle values showed a gradual decline from the southern to the northern region of Lake Taihu.
The saturation of Lake Taihu ranged from 0.031 to 0.109, with the mean value of 0.067 and the standard deviation of 0.001 (see Figure 5g). From the spatial and temporal distribution of saturation (see Figure 5c), it can be observed that the areas with the highest saturation levels are located along the western and southern shores of Lake Taihu, with values ranging from 0.072 to 0.088. Additionally, high-value areas were observed in Zhushan Lake and Meiliang Lake. The distribution of saturation showed a decreasing trend from the shores to the center of the lake, with the lowest value ranging from 0.047 to 0.057.
3.1.3. Characterization of the Distribution of IAVW
The IAVW of Lake Taihu ranged from 554.07 to 702.58 nm, with the mean value of 582.43 nm and the standard deviation of 21.81 nm (see Figure 5h). An analysis of the spatial and temporal distribution characteristics of IAVW (see Figure 5d) revealed that the high-value areas were located along the western and eastern coasts of Lake Taihu. The IAVW value on the western coast was in the range of 632.74~643 nm. In the western region of Lake Taihu, the values ranged from 632.74 to 643.07 nm, while in the eastern region, they ranged from 595.44 to 656.51 nm. The distribution of these values showed a gradual decrease from the coastline towards the central region of the lake. The region with the lowest IAVW value in the lake was observed to range between 562.21 and 565.33 nm.
3.2. Establishment of Algal Bloom Water Body Detection Methods for Lake Taihu Based on In Situ Measured Data
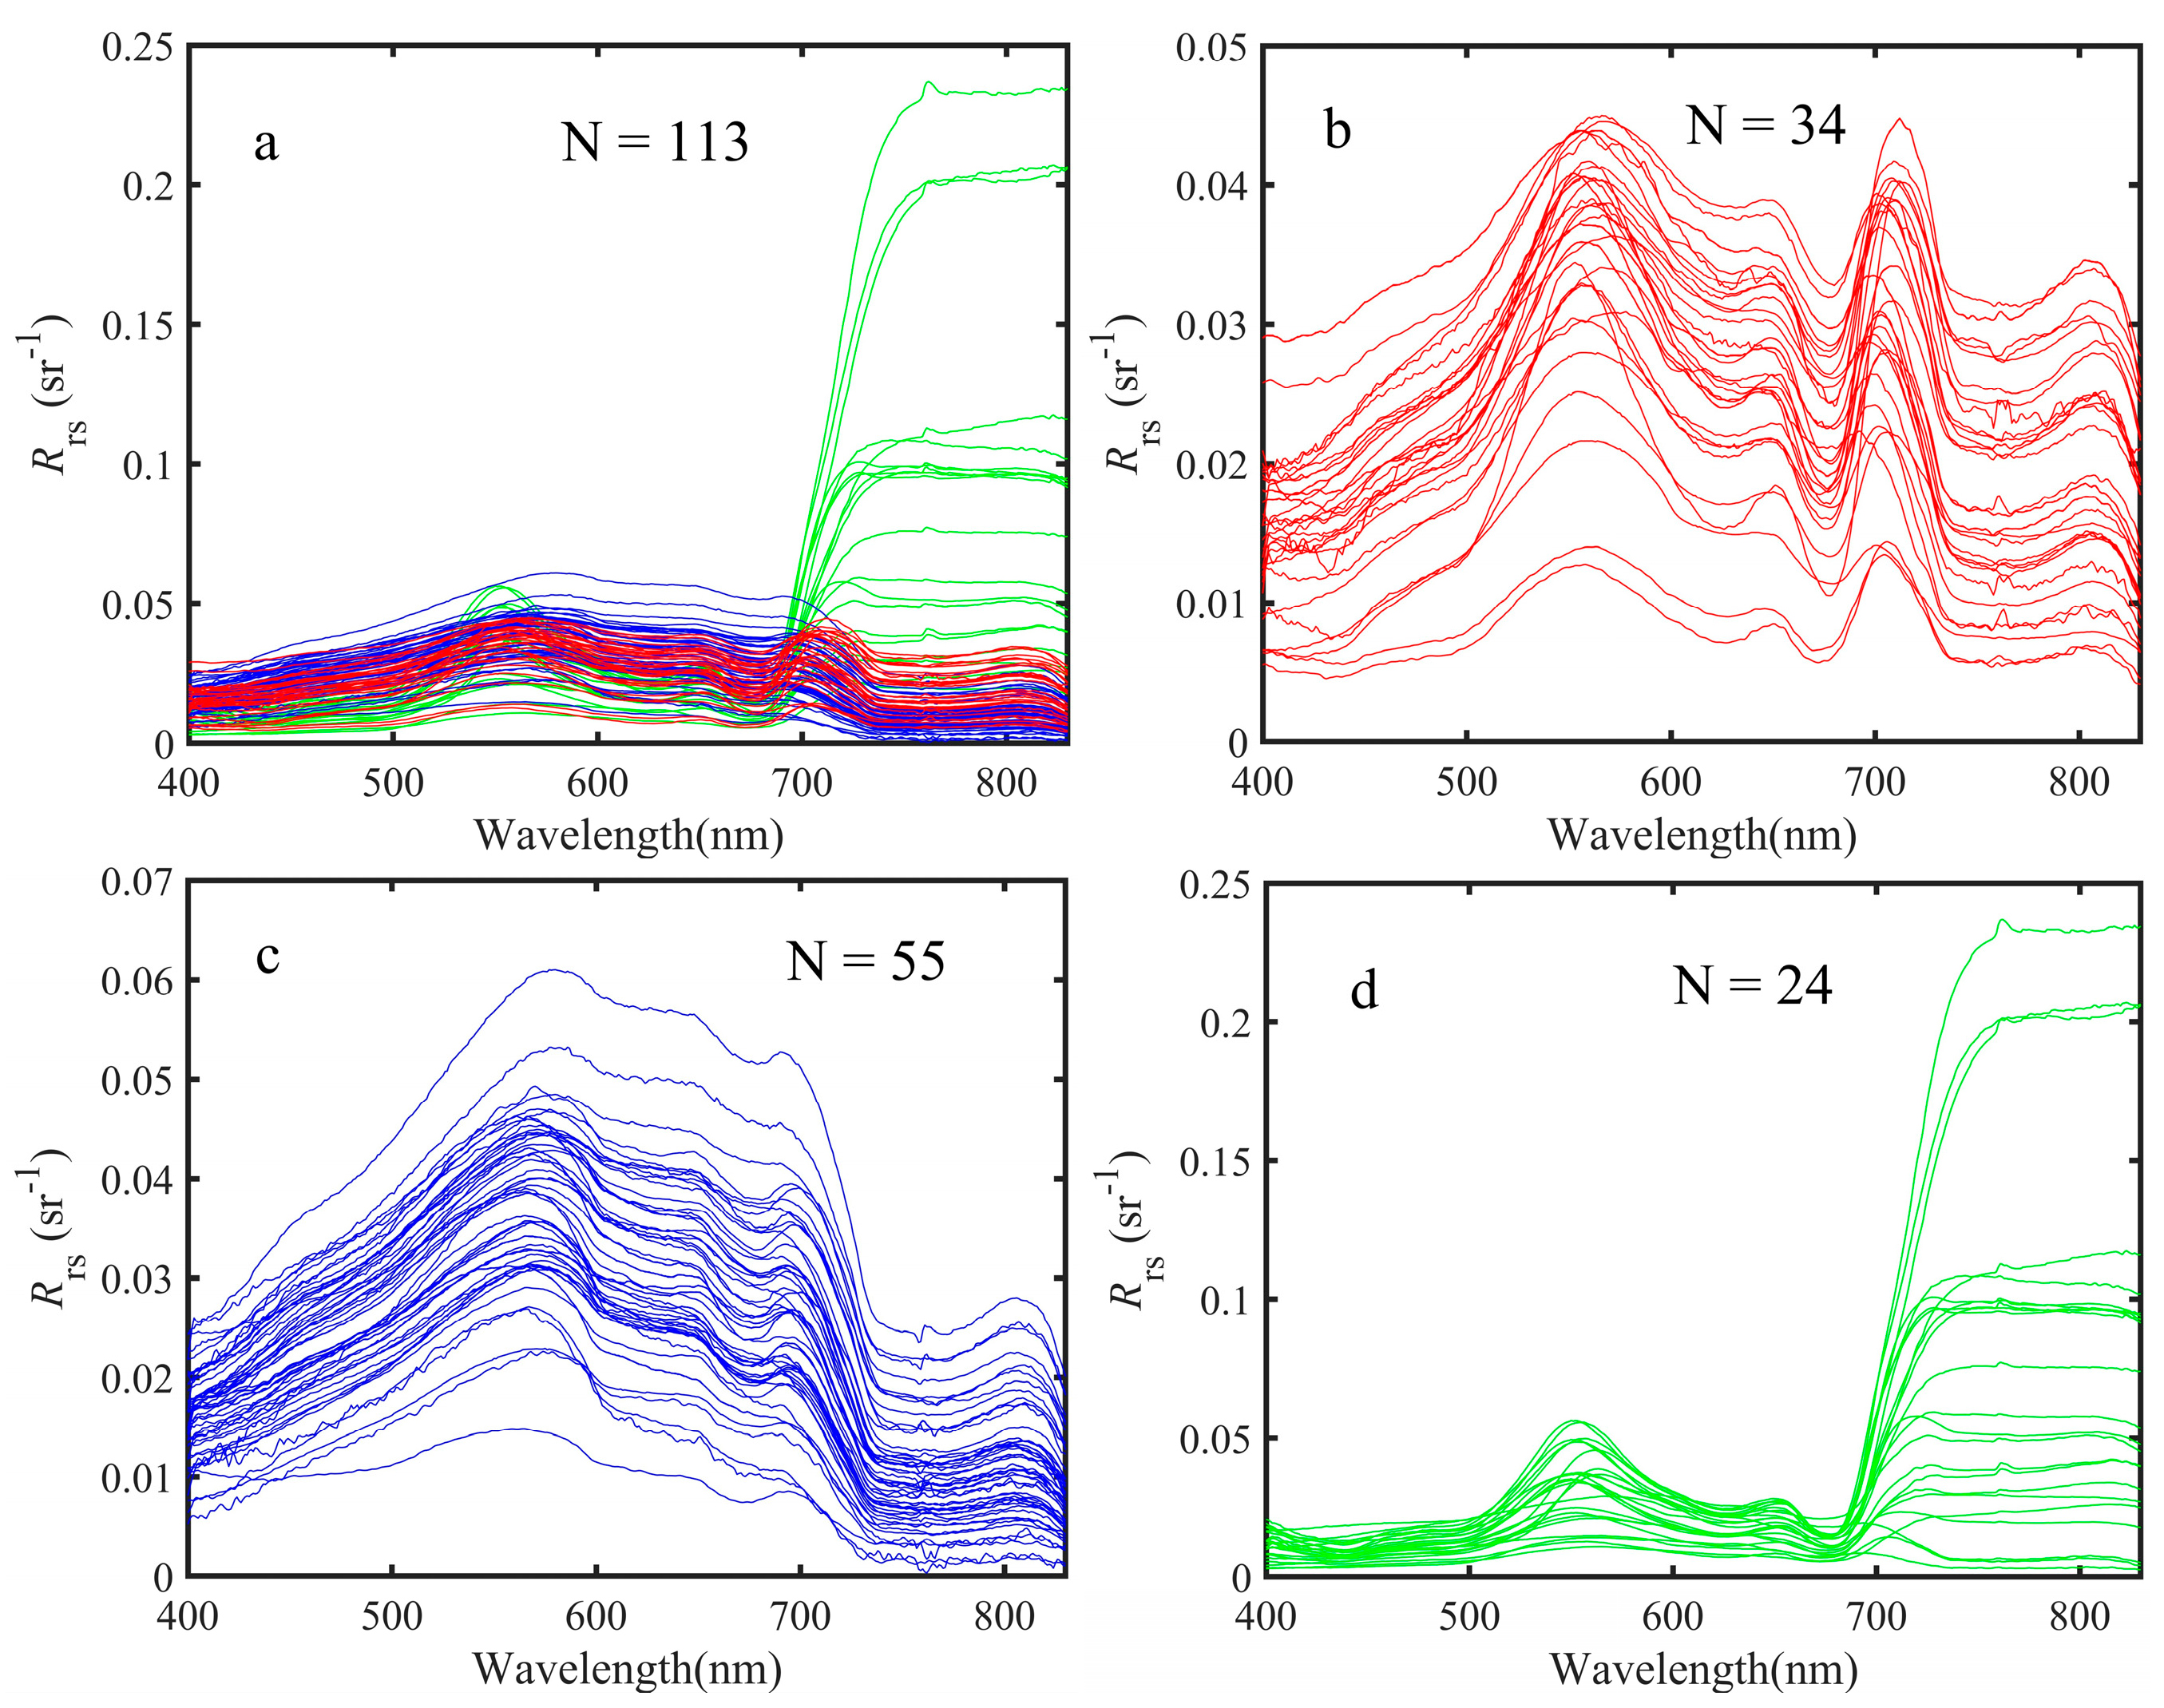
The range of algal blooms is an important indicator for algal bloom detection. It is crucial for the prevention, control, and management of algal blooms. The water bodies of Lake Taihu show clear signs of eutrophication [8]. The in situ spectrum from eutrophic water bodies reveals distinct fluorescence peaks [11]. A total of 113 in situ measurement data with Rrs were selected from Lake Taihu. The corresponding spectra are shown in Figure 6.

Figure 6.
Spectrum of three types of water bodies in Lake Taihu based on in situ measurements ((a) The total spectrum, (b) algae bloom water body (red lines), (c) normal water body (blue lines), and (d) floating leaf vegetation water body (green lines)).
The threshold method was applied by referencing the algal bloom information on the surface of Lake Taihu and corresponding algal density. By referencing the national environmental protection standards of the People’s Republic of China, the clear water which consist little amount of cyanobacterial cells (below 1 × 10⁷ cells/L), was identified as normal water. The water, which consists of a large amount of cyanobacterial cells (above 1 × 10⁷ cells/L), was identified as algal bloom water. This classification was used to establish the threshold-based model.
Previous studies and the in situ measurement spectrum have shown that the spectra of Lake Taihu water bodies can be classified into three main types: algal bloom [47], floating leaf vegetation [13], and clear water. Based on in situ measured spectra and the algal bloom information on the lake surface, the spectra were classified into the three aforementioned categories (Figure 6).
Spectral analysis revealed that both algal blooms and floating leaf vegetation exhibit a distinct fluorescence peak around 700 nm, compared to clear water bodies. For inland water bodies, a fluorescence height greater than 0 does not always indicate the presence of an algal bloom. It can be observed that some normal water in Lake Taihu has a DFLH greater than 0 sr−1 (Figure 6c). By calculating the first and third quartiles of the algal bloom and normal water bodies, the results show that the DFLH of algal bloom water is concentrated between 0.0059 sr−1 and 0.013 sr−1, while normal water is concentrated between 0 sr−1 and 0.0015 sr−1. Therefore, the value of the DFLH. The threshold for DFLH was preliminarily determined to be 0.013 sr−1. Using the same method, the first and third quartiles of the hue angle for normal water and algal bloom water were calculated to determine their concentrated distribution ranges. The hue angle of algal bloom and normal water is concentrated between 180.60 degrees and 191.35 degrees, 156.99 degrees and 198.02 degrees, respectively. The hue angle threshold was set at 170.58 degrees to detect the algal bloom.
However, based on in situ measurements of algal blooms in Lake Taihu and existing research findings, some areas of floating leaf vegetation were identified in the southeastern corner of the lake. Through the calculations based on in situ measurements, it was revealed that the DFLH values in the floating leaf vegetation were also high. Therefore, only relying on DFLH is insufficient for accurately removing floating leaf vegetation areas. Using the same method, the first and third quartiles of the IAVW for algal bloom water and floating leaf vegetation were calculated to determine their concentrated distribution ranges. The IAVW range of algae bloom water body and floating leaf vegetation were, respectively, from 561.20 to 580.67 nm and from 610.46 to 661.31 nm. The IAVW threshold was set at 598 nm to remove the floating leaf vegetation area. The thresholds based on DFLH and IAVW still lead to the inclusion of some floating leaf vegetation. It was found that some parts of floating leaf vegetation areas had the saturation value lower than 0.07. Therefore, an additional threshold of saturation < 0.07 was applied to further remove these floating leaf vegetation areas. We use the threshold of saturation and IAVW (saturation < 0.07 and IAVW > 598 nm) enabled the removal of floating leaf vegetation from the algal bloom water body. The threshold of the multiple parameters for the detection of algae bloom in Lake Taihu are shown in Table 3.
Among the in situ measurement data from September 2014 to October 2018, 100 points were selected as the modeling datasets for establishing the algal bloom detection method in Lake Taihu. while 13 points were selected as the validation datasets for accuracy validation of the method. The accuracy index was further calculated by constructing a confusion matrix, comparing the real algal bloom information on the lake surface with the results from the algal bloom detection method. In the modeling datasets, the OA value is 0.81, and the F1-score is 0.86 (Table 4). In the validation datasets, the OA value is 0.83, and the F1-score is 0.89 (Table 4). These results demonstrate that the algal bloom detection, based on the in situ measured data in Lake Taihu, exhibits high accuracy.
Table 4.
Performance accuracy of threshold models for algal bloom detection in Lake Taihu.
3.3. The Detection of the Algal Blooms in Lake Taihu
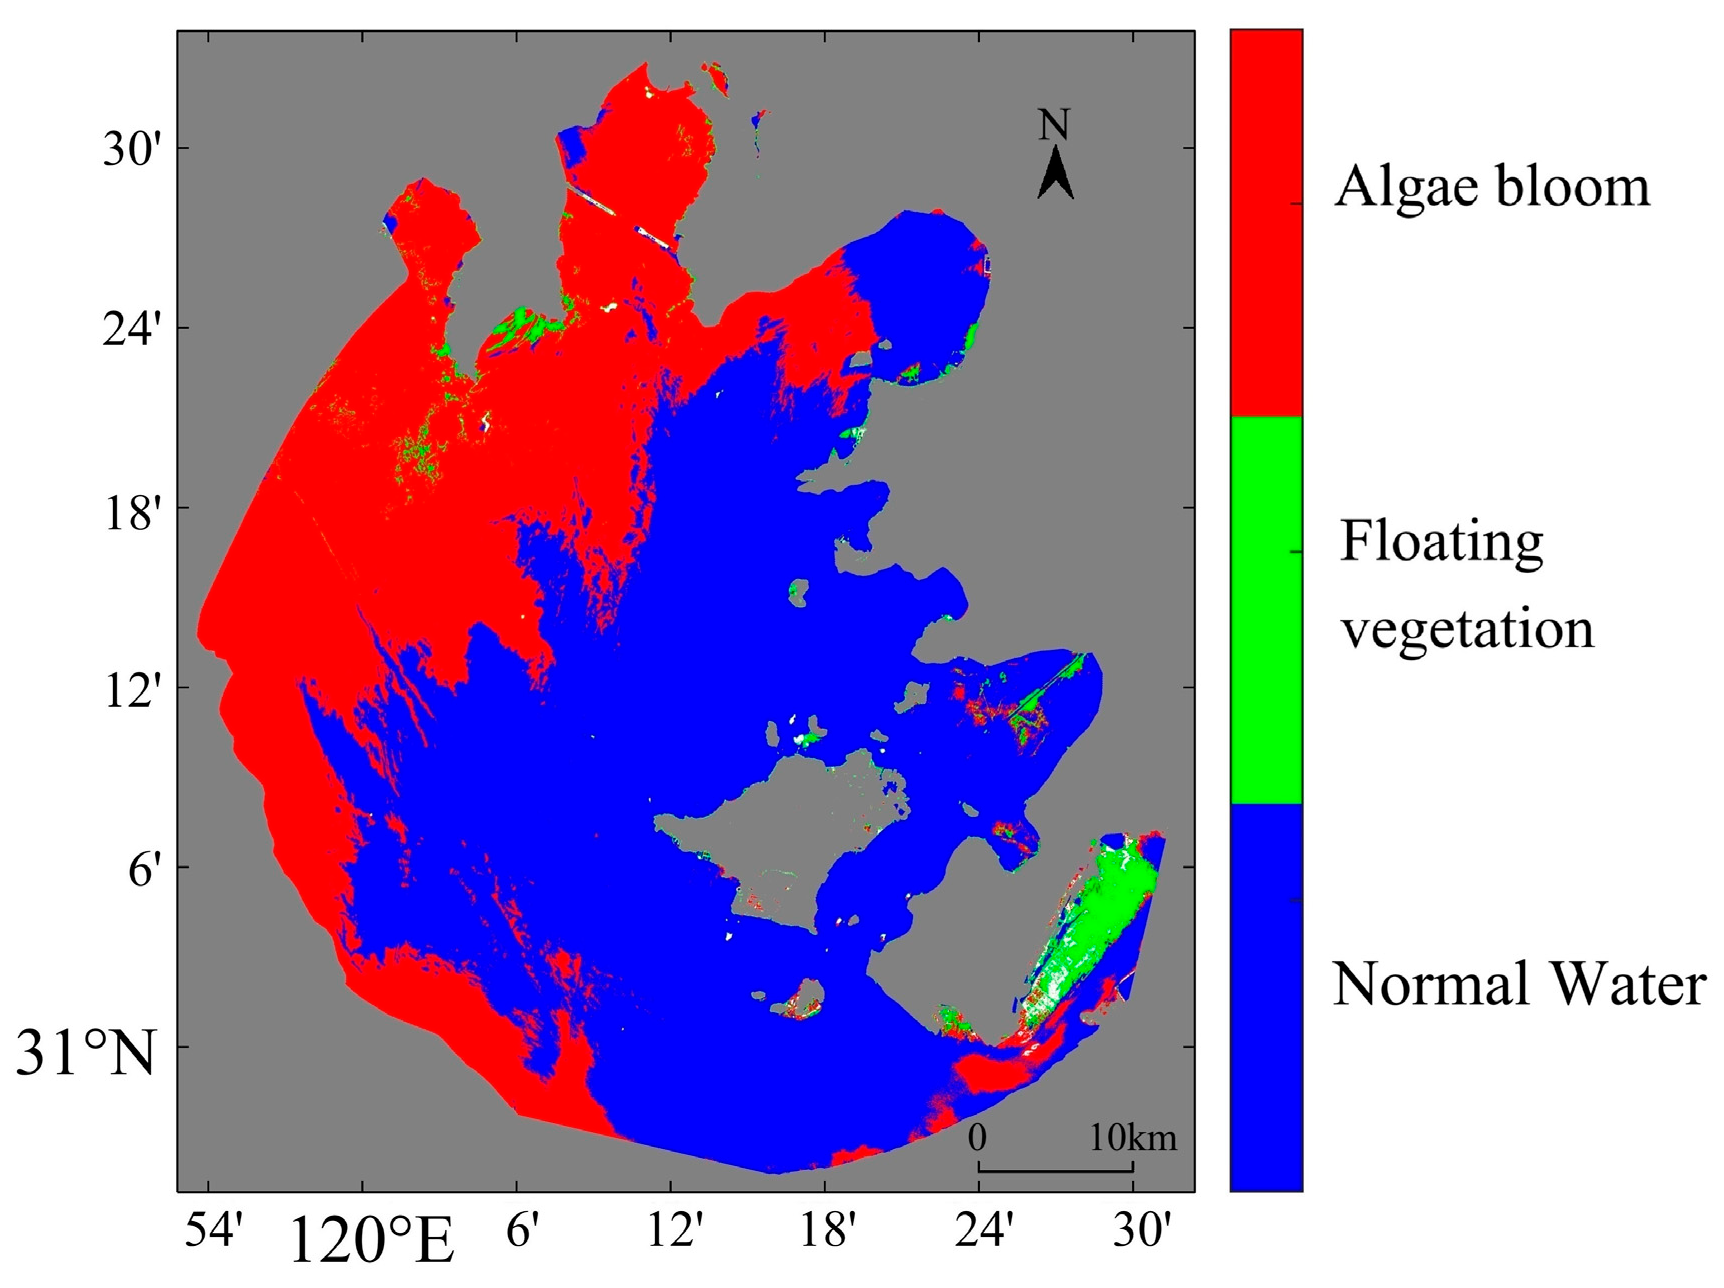
Based on the algal bloom detection threshold model, we detect the algal bloom water bodies in Lake Taihu using the image data obtained from the AHSI onboard the ZY-1E on 6 September 2020. The algae bloom detection results were shown in Figure 7. The hyperspectral data analysis revealed significant differences in the optical properties of Lake Taihu across different regions on 6 September 2020. These differences are consistent with the qualitative observations of cyanobacteria blooms, as well as the known spatial distribution of cyanobacteria in the lake [48,49].
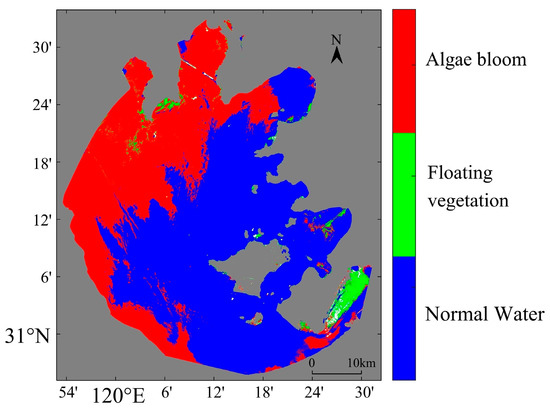
Figure 7.
The range of three water body types in Lake Taihu on 6 September 2020.
According to the national environmental protection standards of the People’s Republic of China, the algal density above 1 × 10⁷ cells/L is categorized into mild, moderate, and severe algal blooms, with the value below 1 × 10⁷ cells/L considered as having no significant algal bloom, which is the normal water body. We further used the in situ algal density data on 6 September 2020 to validate the accuracy of algal bloom detection results in Lake Taihu. We spatially and temporally matched the algal density data from 19 stations in Lake Taihu. The algal density ranges for normal water bodies and algal bloom water bodies were shown in Table 5. The results indicated that the algal density in algal bloom water bodies is significantly higher than that in normal water bodies.
Table 5.
The algal density range of two types of water bodies in Lake Taihu on 6 September 2020.
Among the in situ measured points on 6 September 2020 in Lake Taihu, eighteen measured points were correctly detected, while one point was incorrectly detected. The overall accuracy (OA) and F1-score were 0.95 and 0.95, respectively (Table 6). These results further validate that the multi-parameter-based method for detecting algal bloom in Lake Taihu can be effectively applied to ZY-1E satellite data on 6 September 2020, with high accuracy.
Table 6.
Performance accuracy of algal bloom detection result in Lake Taihu on 6 September 2020.
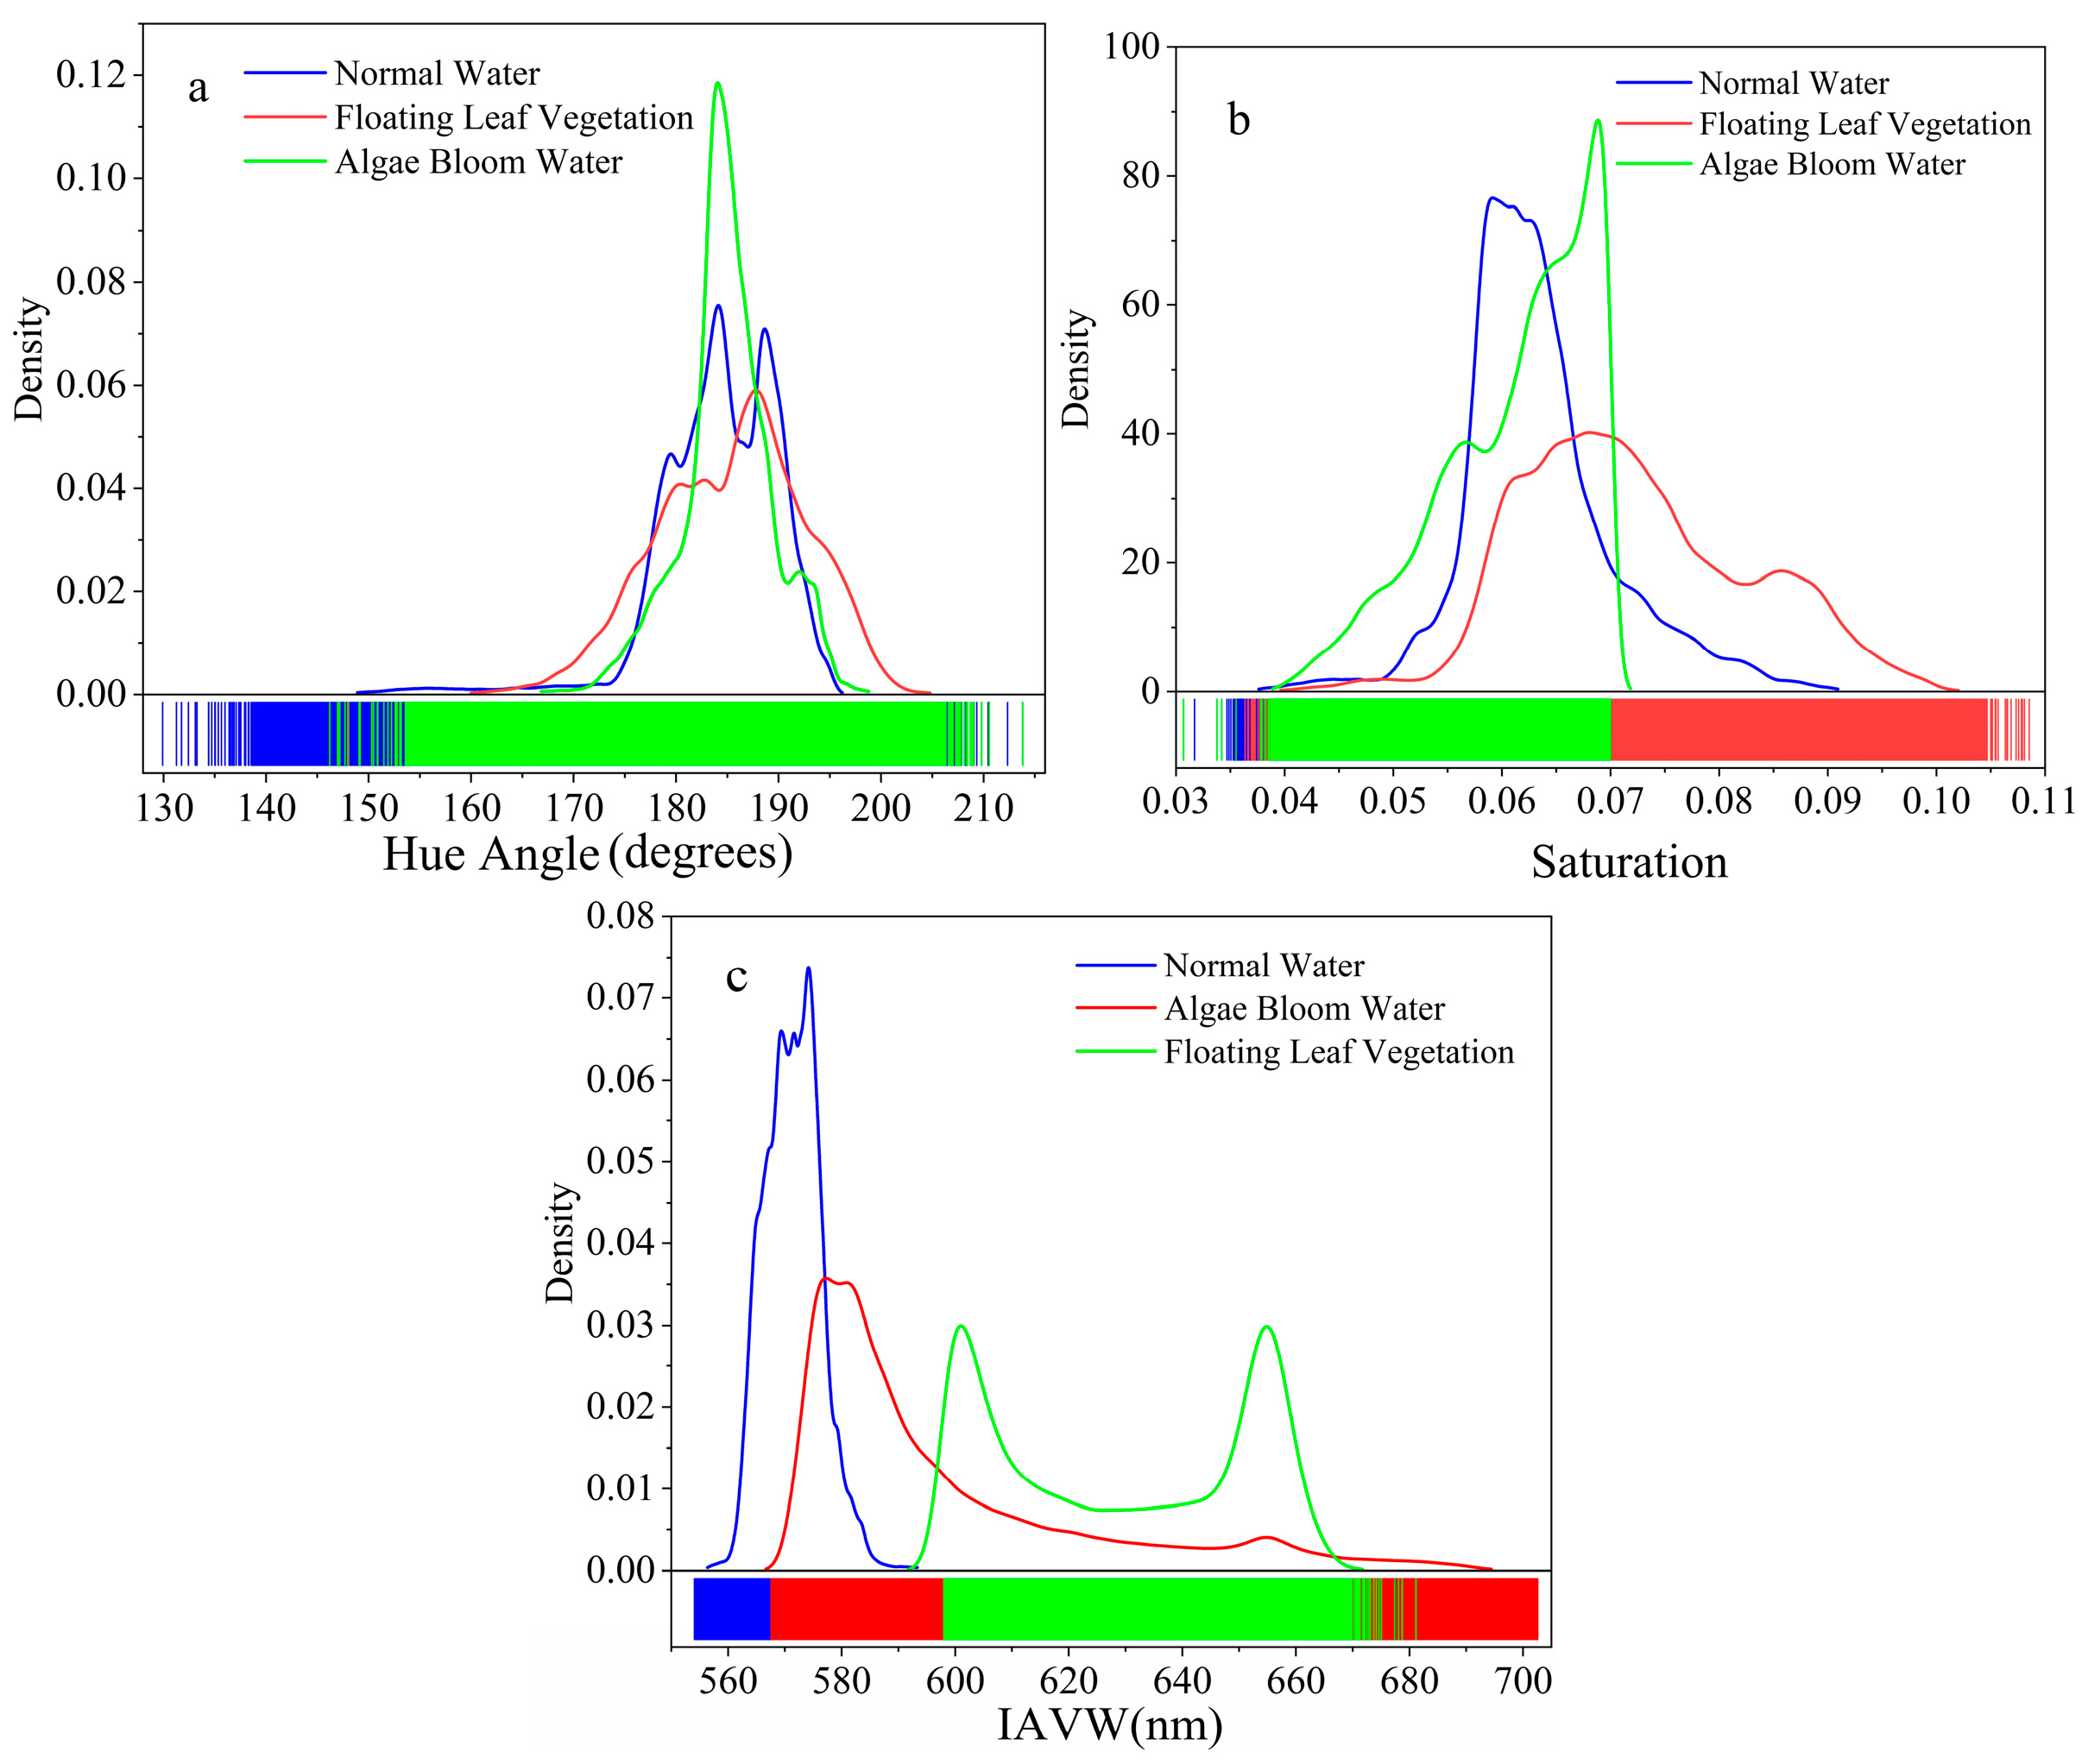
In this study, we did a statistical analysis of hue angle, saturation, and IAVW for three types of water bodies (as shown in Figure 8).
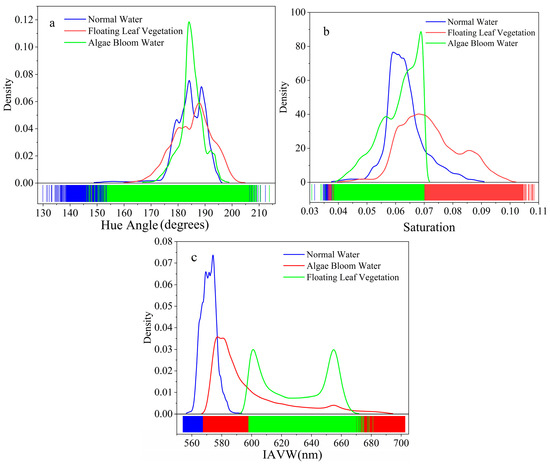
Figure 8.
The histograms of chromatic parameters of three water body types in Lake Taihu ((a) hue angle, (b) saturation, and (c) IAVW).
The hue angle values of algae bloom, normal water, and floating vegetation, respectively, ranged from 146.2 to 213.8 degrees, from 129.9 to 212.3 degrees, and from 147.0 to 208.1 degrees. The saturation values of algae bloom, normal water, and floating vegetation ranged, respectively, from 0.034 to 0.109, from 0.032 to 0.094, and from 0.031 to 0.070. The IAVW value of algae bloom, normal water, and floating vegetation ranged, respectively, from 567.6 to 702.6 nm, from 554.1 to 627.6 nm, and from 598.0 to 681.1 nm. The hue angle mean value of algae bloom, normal water, and floating vegetation were 184.9 degrees, 184.1 degrees, 185.3 degrees, respectively. The saturation mean value of algae bloom, normal water, and floating vegetation were 0.072, 0.063, and 0.061, respectively. The IAVW mean value of algae bloom, normal water, and floating vegetation were 598.1 nm, 571.5 nm, and 629.3 nm, respectively. The abilities of chromatic parameters in discriminating three types of water bodies, in descending order, are IAVW, saturation (S), and hue angle.
4. Discussion
4.1. Effect of Atmospheric Correction on DFLH, Colorimetric Parameters, IAVW
The DSF algorithm is the default atmospheric correction algorithm of ACOLITE. It has been demonstrated to achieve accurate correction for multispectral satellites, including Landsat (OLI) [41] and Sentinel-2/3 (MLI/OLCI) [40]. Vanhellemont et al. has demonstrated to exhibit good calibration accuracy [42]. Since this study lacked the in situ spectrum for Lake Taihu corresponding to the observation time of ZY-1E, further verification of the atmospheric correction accuracy is required.
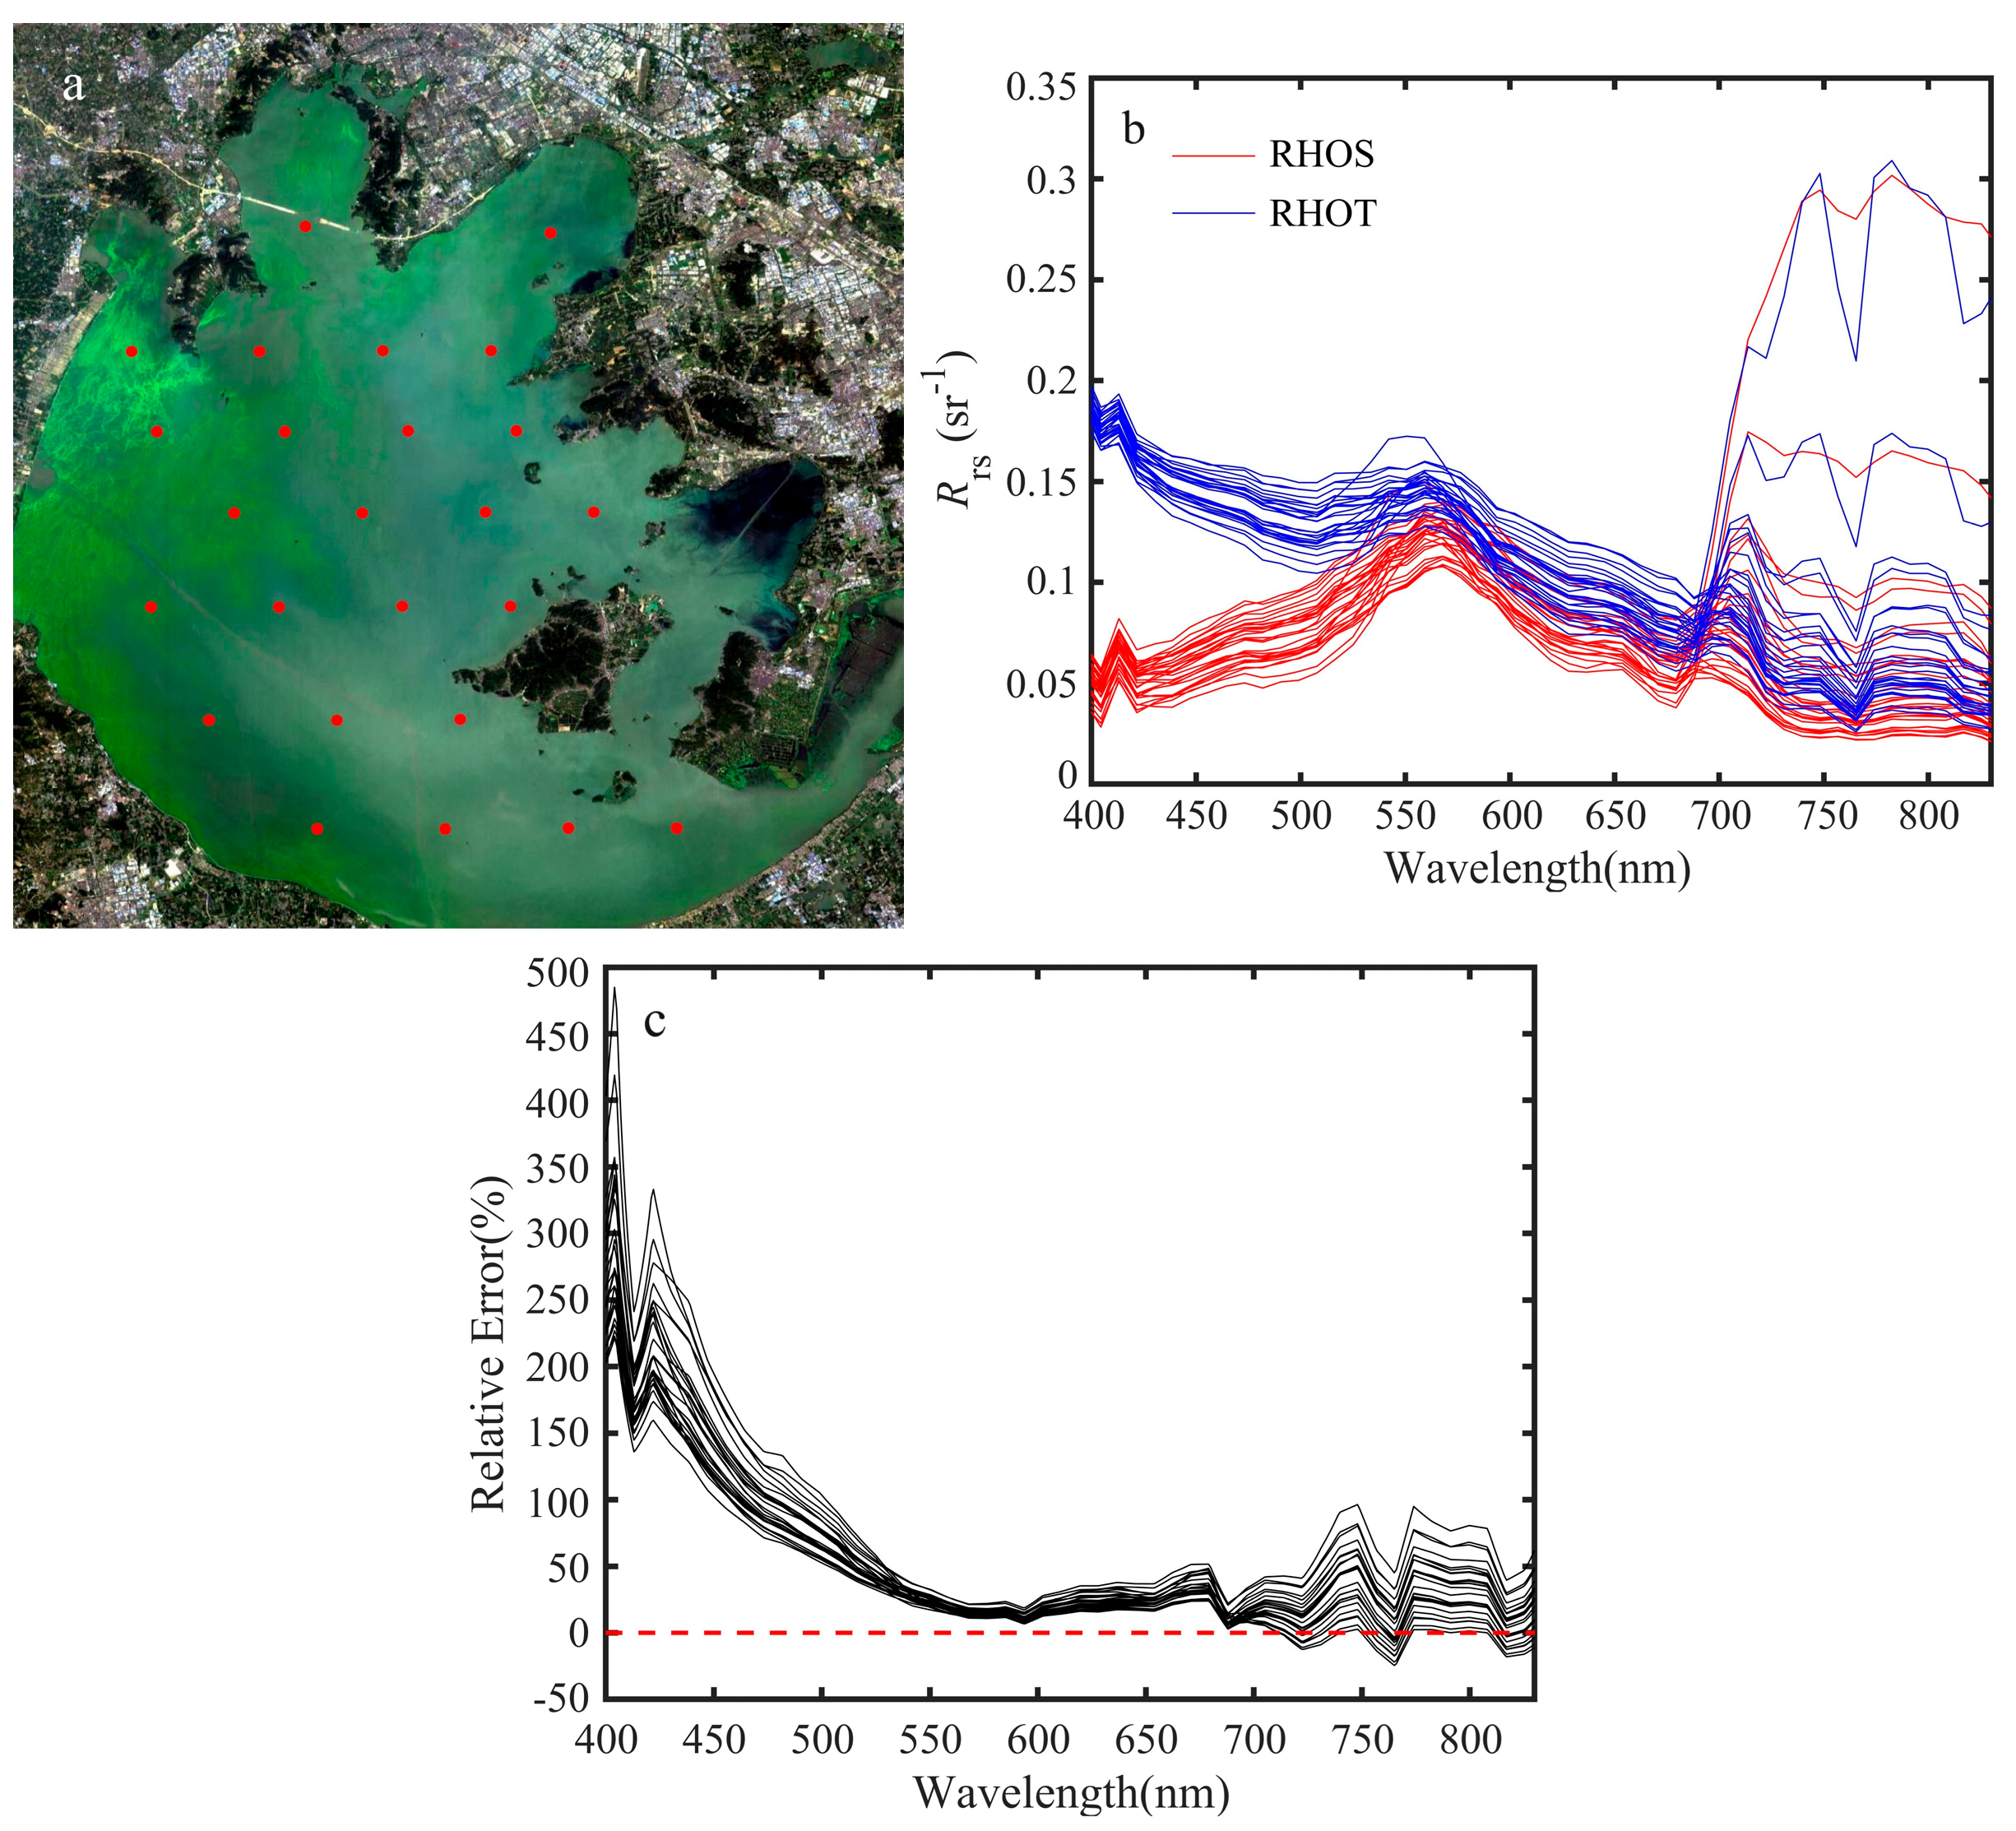
The hyperspectral satellite data, before and after atmospheric correction, were sampled using the SNAP software (version 11.0.0). The sampling points were evenly distributed within the water body of Lake Taihu. The specific latitude and longitude coordinates of the sampling points are provided in Table A1. Atmospheric correction significantly influences the overall shape of the water spectrum, leading to the biases in the calculation of chromatic parameters. We selected 25 locations in Lake Taihu to obtain the spectrum (see Figure 9a). Figure 9b reveals that the Rrs within the wavelength range of 400–720 nm becomes lower after atmospheric correction. In Figure 9c, the relative error of Rrs gradually decreases from 450% to 25% as the wavelength increases after atmospheric correction. After the wavelength reaches 600 nm, the relative error gradually stabilizes at around 25%. In the spectrum with the high fluorescence peaks above 700 nm, the Rrs increased after atmospheric correction, particularly from 721 nm to 729 nm, from 754 nm to 771 nm, and 811 nm+. Furthermore, in the spectrum without the fluorescence peaks above 700 nm, the Rrs decreased after atmospheric correction.

Figure 9.
Spectrum and sampling points of Lake Taihu before and after atmospheric correction ((a) spectrum sampling locations, (b) spectrum of sampling locations, and (c) relative error of Rrs before and after atmospheric correction) (red line—RHOS, blue line—RHOT, and the red dashed line represents the relative error of 0).
In Figure 10a, the DFLH ranges from −0.0115 to 0.556 sr−1 before atmospheric correction and from −0.00039 to 0.576 sr−1 after atmospheric correction. The mean values of DFLH before and after atmospheric correction are 0.021 sr−1 and 0.010 sr−1, respectively. The value of DFLH increased by 56.52% after the atmospheric correction. The DFLH is most closely associated with the valley and peak of the Rrs in the wavelength ranges near 675 nm and 709 nm, respectively. It reflects the local morphological characteristics of the spectrum.

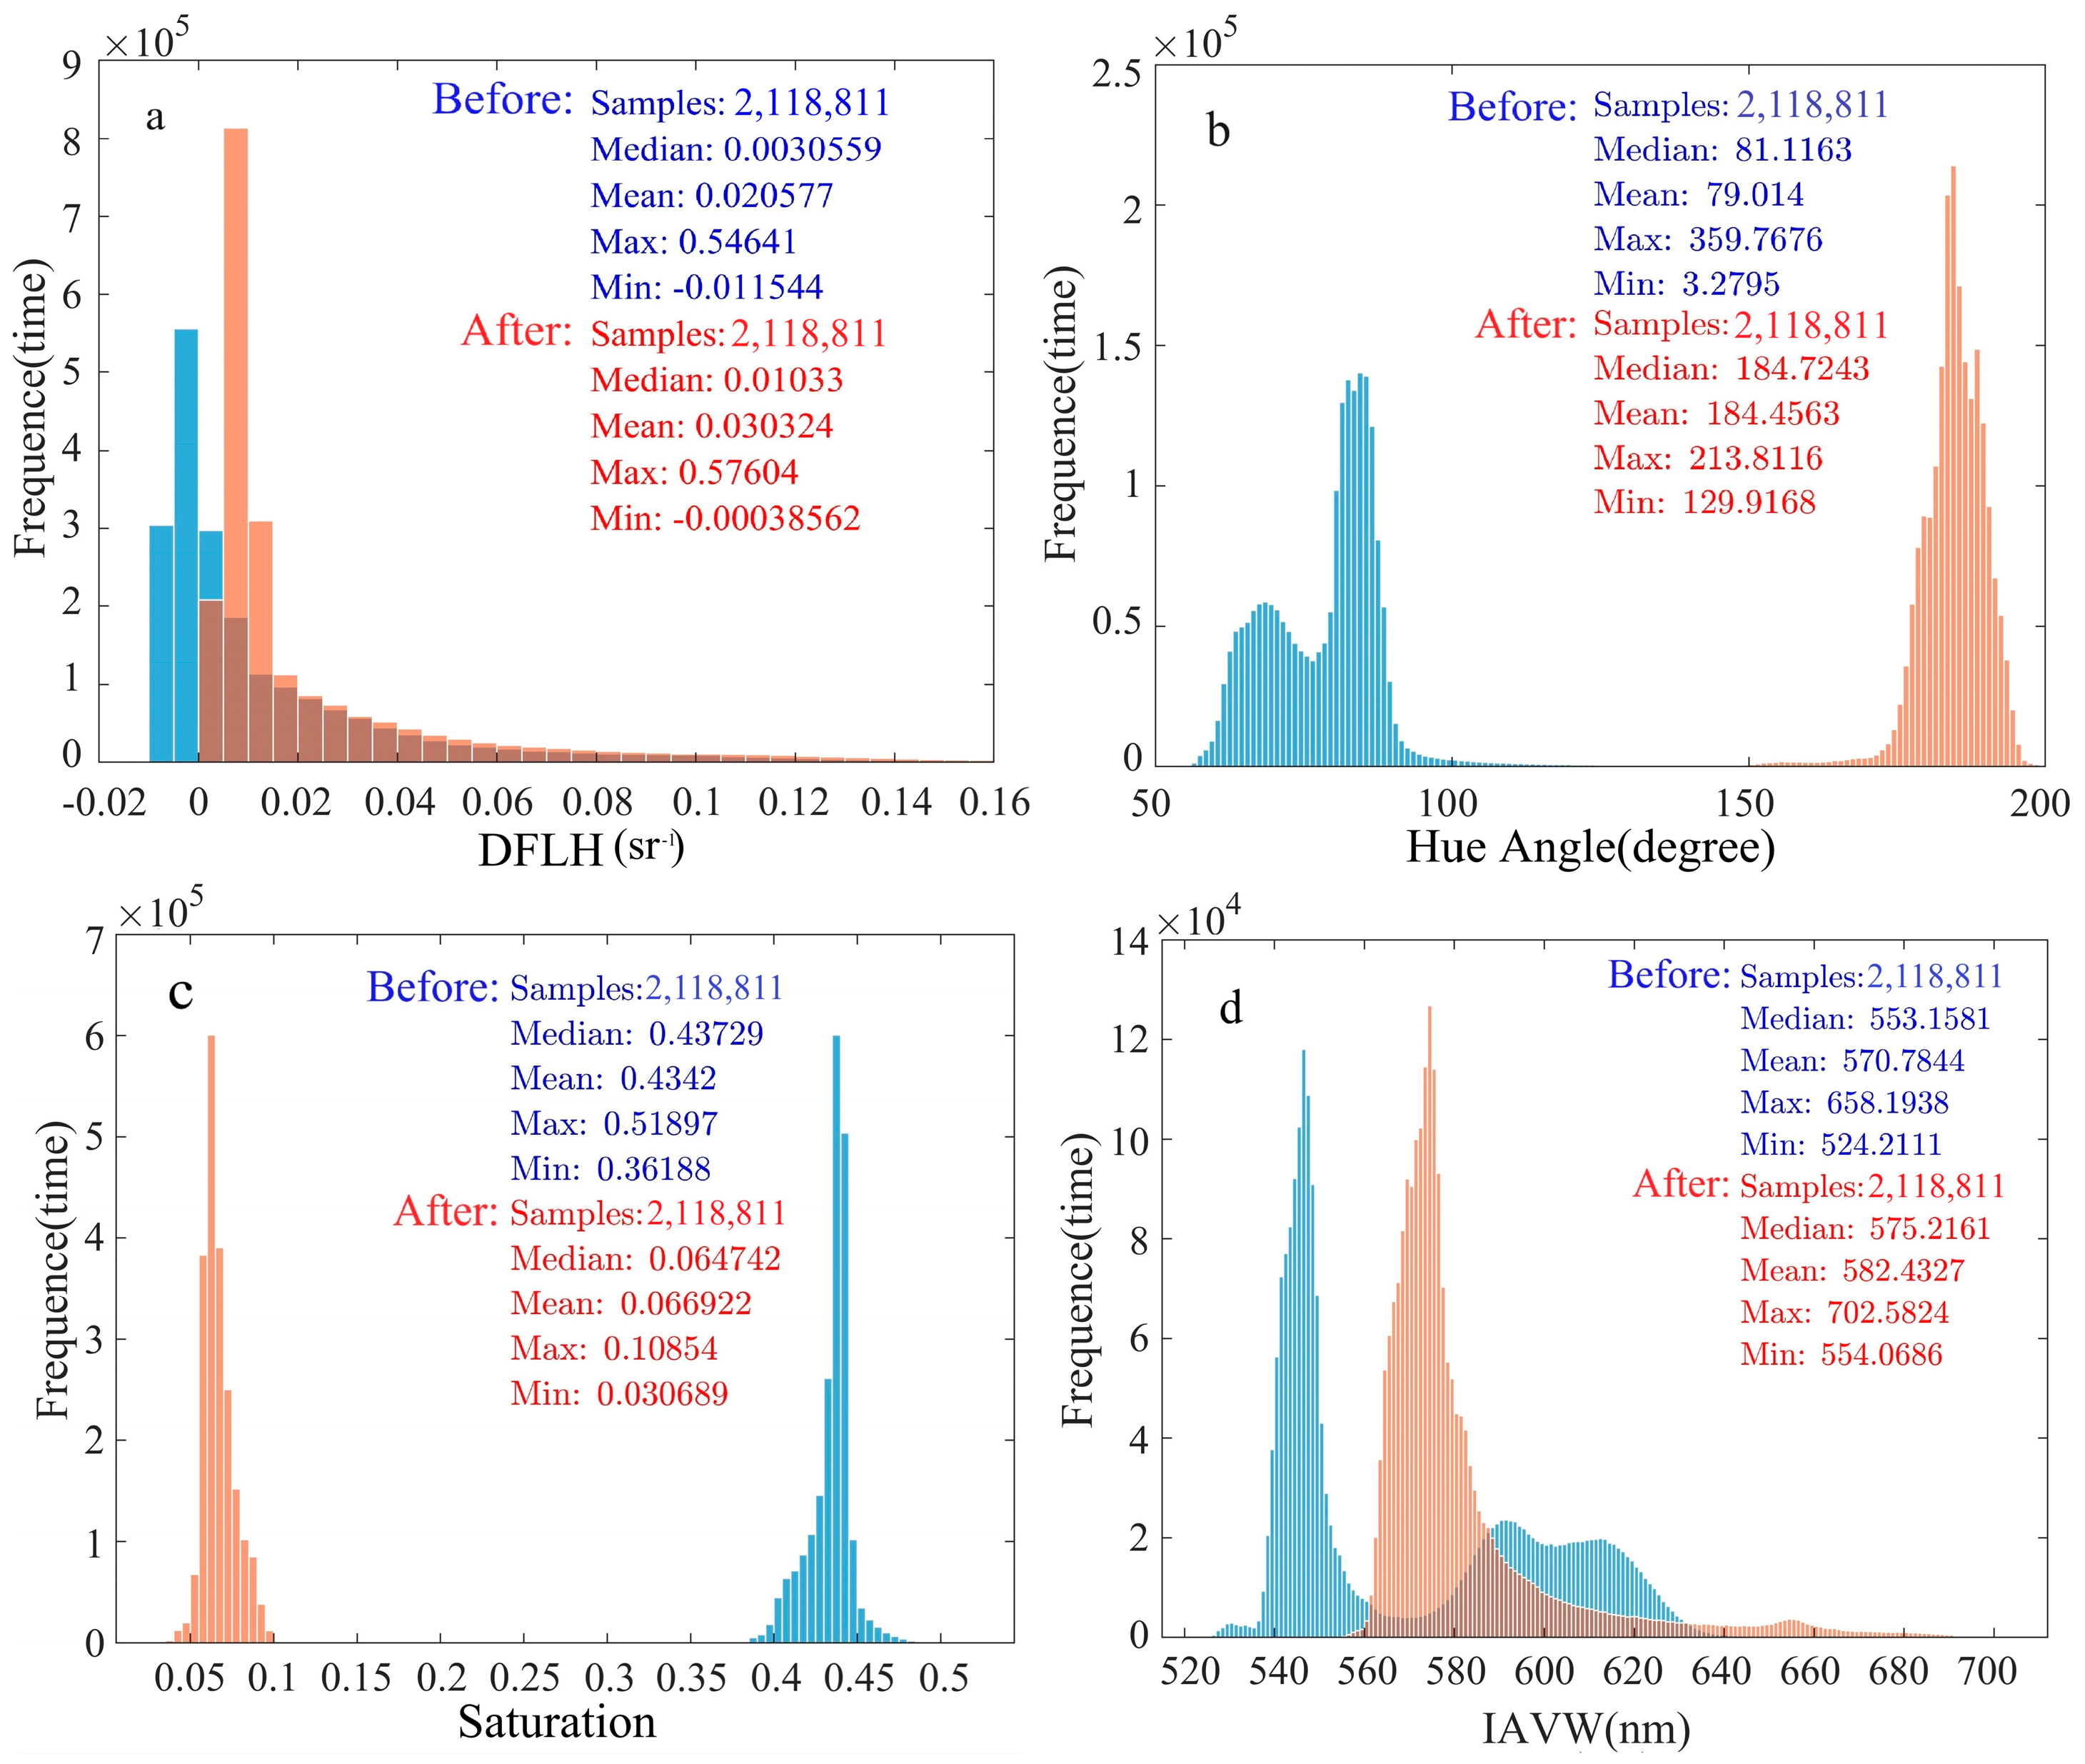
Figure 10.
Histogram of chromatic parameters, DFLH and IAVW before and after atmospheric correction ((a) DFLH, (b) hue angle, (c) saturation, and (d) IAVW).
In Figure 10b, the hue angle ranged from 3.28 to 359.77 degrees before atmospheric correction and from 129.92 to 213.81 degrees after atmospheric correction. The mean values of the hue angle before and after atmospheric correction were 79.01 degrees and 184.46 degrees, respectively. The hue angle increased by 133.46% after atmospheric correction. In Figure 10c, the saturation ranged from 0.362 to 0.519 before atmospheric correction and from 0.031 to 0.109 after atmospheric correction. The mean values of saturation before and after atmospheric correction were 0.43 and 0.067, respectively. The saturation decreased by 84.42% after atmospheric correction.
An increase in Rrs was observed in the long-wave range, as shown in Figure 9b. After the atmosphere correction, the IAVW ranged from 554.07 nm to 702 nm. The mean values of the IAVW before and after atmospheric correction were 570.78 nm and 582.43 nm, respectively. It was observed that the IAVW increased by 2.04% after atmospheric correction.
4.2. The Analysis of Algal Bloom Range Detection Results in Lake Taihu
Wynne et al. [3] developed the Cyanobacteria Index (CI) based on MERIS satellite imagery to detect the algal blooms. Song et al. [16] used the Modified Augmented Normalized Difference Water Index (MANDWI) to detect algal blooms in Lake Taihu. This study applies the same methods mentioned above to detect the algal blooms in Lake Taihu on 6 September 2020 (Figure 11). We compared the results with the true algal bloom data. The OA and F1-score were calculated. The specific results are shown in Table 7.
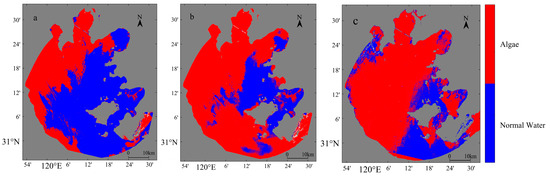
Figure 11.
The detection range of the algal bloom in Lake Taihu with our model, Wynne et al.’s model, and Song et al.’s model ((a) our model, (b) Wynne et al.’s model, and (c) Song et al.’s model).
Table 7.
Comparison of accuracy validation between different Taihu algae detection model results and measured values.
The results indicate that the hyperspectral satellite-based algal bloom detecting model constructed using chromatic parameters in this study achieves higher accuracy. It is likely due to the complex natural environment of Lake Taihu. Existing spectral models built for multispectral satellites cannot fully capture the optical characteristics of the algal bloom waters. Additionally, models that rely on single indicators for detecting algal blooms still have certain limitations. The model constructed based on the chromatic features of Lake Taihu, using hyperspectral data, can cope with the complexities of inland water bodies and reduce potential spectral interferences, resulting in more accurate detecting results.
The three types of water bodies, named normal water bodies (blue), algal bloom water bodies (red), and floating leaf vegetation (green), were plotted in the CIE-xy coordinate system. It revealed an overlap of the three color types of water bodies in Figure 12. The chromatic visual matching function (CMF) exhibits a lower value within the wavelength range beyond 700 nm. The fluorescence absorption peak of algal blooms is predominantly in this range. Consequently, when calculating the chromatic parameters, a slight increase in the height of the fluorescence peaks led to only a little increase in the chromatic parameters [50]. When there are considerable changes in the height of the fluorescence peaks, the change in the chromatic parameters becomes more pronounced.
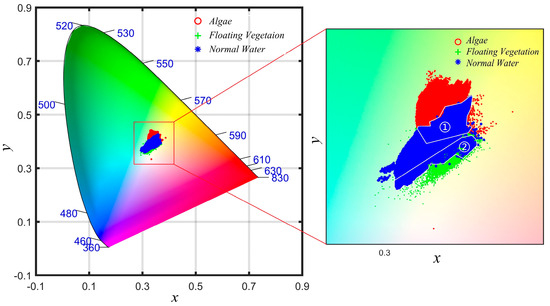
Figure 12.
The range of algal bloom, normal water, and floating leaf vegetation in Lake Taihu in the CIE-xy coordinate system (Part ① is the overlap of normal water and floating leaf vegetation, and Part ② is the overlap of algal bloom and normal water). x and y represent the horizontal and vertical axes of the CIE-xy chromaticity coordinate system.
4.3. Analysis of the Discrimination Ability of Chromatic Parameters for Distinguishing Algal Blooms with Different Colors
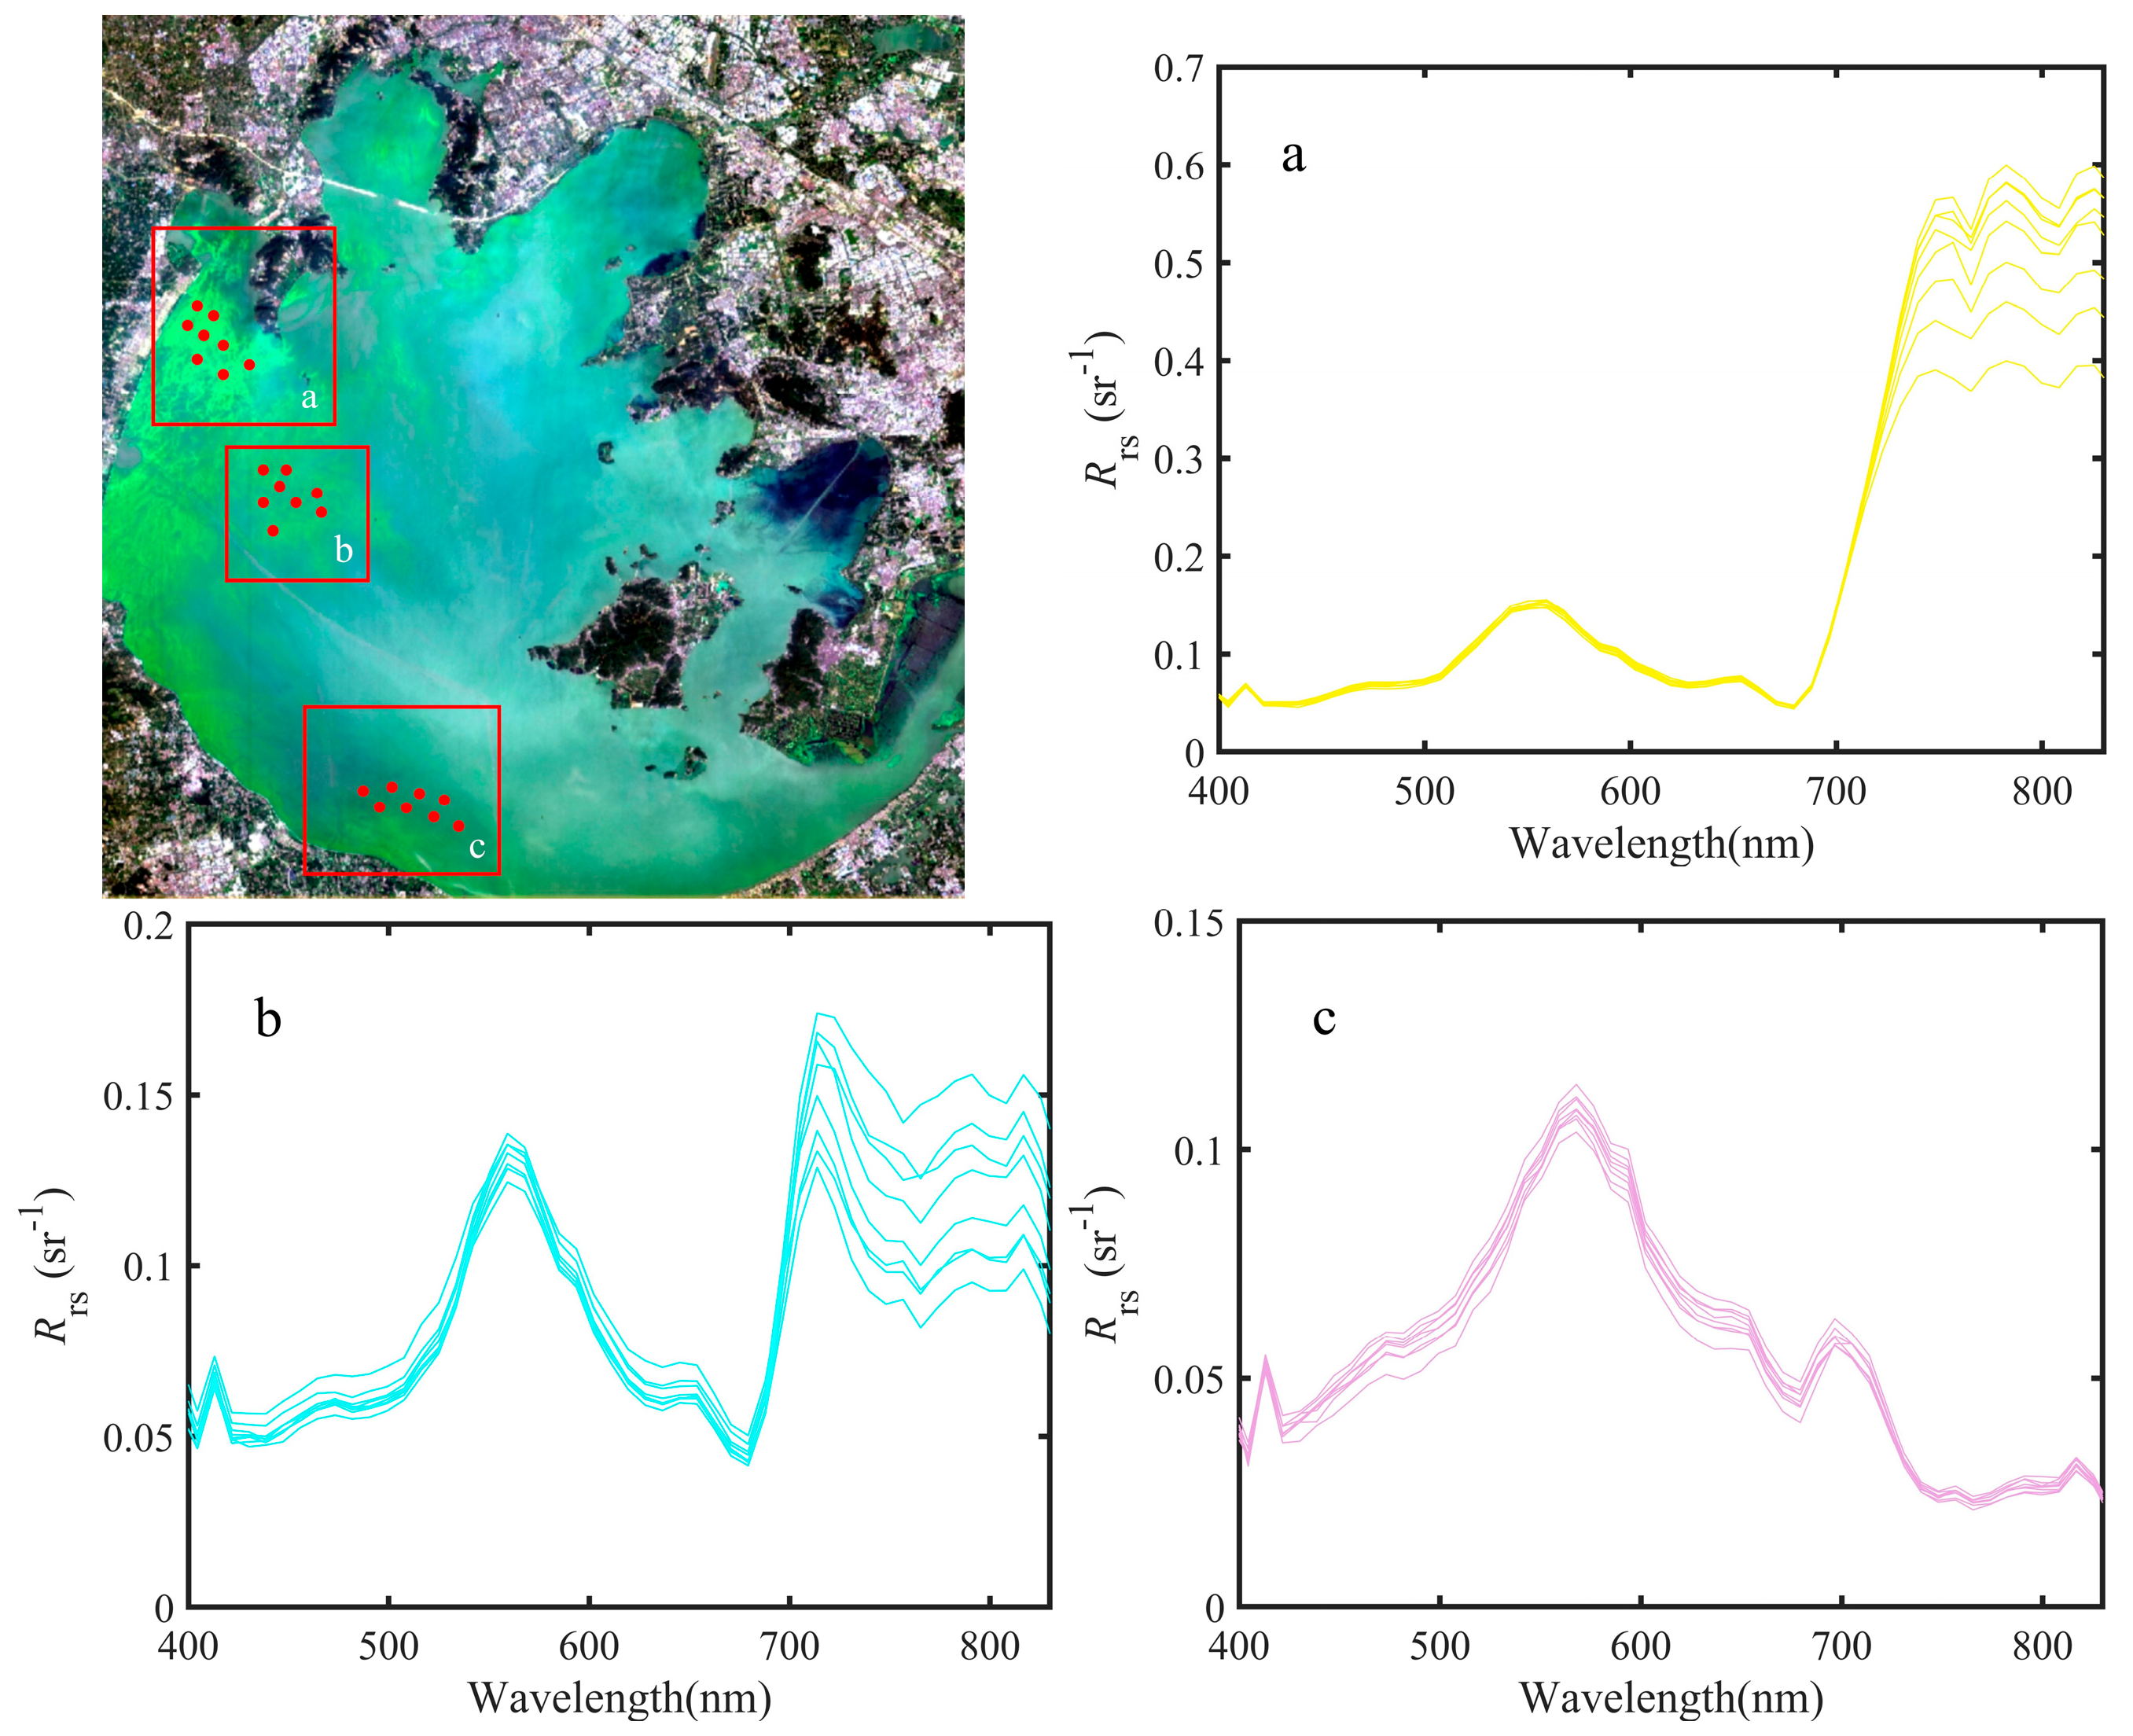
The true-color image was sampled using the SNAP software. The specific latitude and longitude coordinates of the sampling points are provided in Table A2. From the true-color composite image of Lake Taihu, it was revealed that the water bodies display a range of distinctive color characteristics in the algal blooms range. The main colors of the water bodies are as follows: the highlight-colored water bodies in the northwestern shores of Lake Taihu (Figure 13a), the bright-colored water bodies (Figure 13b), and the dark-colored water bodies in the southern shores (Figure 13c). Furthermore, the spectrum of three colors of water bodies revealed that they all have the fluorescence peaks around 700 nm (Figure 13). However, the height of the fluorescence peaks around 700 nm are different (Figure 13).
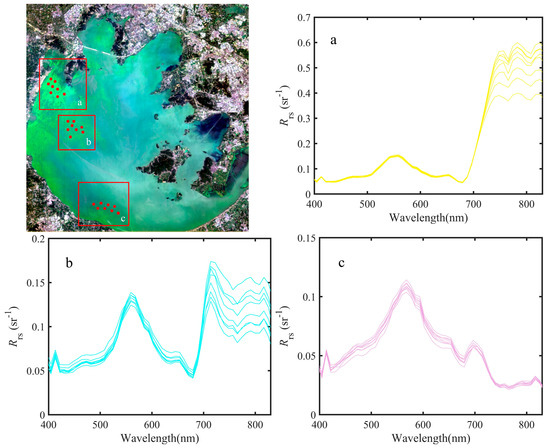
Figure 13.
The spectrum of water bodies extracted from the true-color image of Lake Taihu water bodies ((a) the highlight-colored water bodies (yellow lines), (b) the bright-colored water bodies (cyan lines), and (c) the dark-colored water bodies (pink lines)).
By combining the spectrum of the three water bodies (Figure 13) and the colors of the water bodies. We discriminate the three types of colors in water bodies by DFLH (Table 8) to further discuss the color discrimination abilities of the chromatic parameters. The yellow area indicates ranges with highly bright-colored water bodies, which may represent algal bloom aggregation areas [51]. The cyan area represents bright-colored water bodies. The pink area represents dark-colored water bodies [11]. The latter two types of water bodies may represent two different types of algae. They gave the difference in the heights of the fluorescence peaks. It was suggested that the algal bloom water bodies in Lake Taihu may be further discerned. However, the lack of detailed bio-optical data of the different algae species in Lake Taihu. Further validation is necessary to determine the exact type of the three different colored water bodies.
Table 8.
The DFLH threshold for different colored algal blooms.
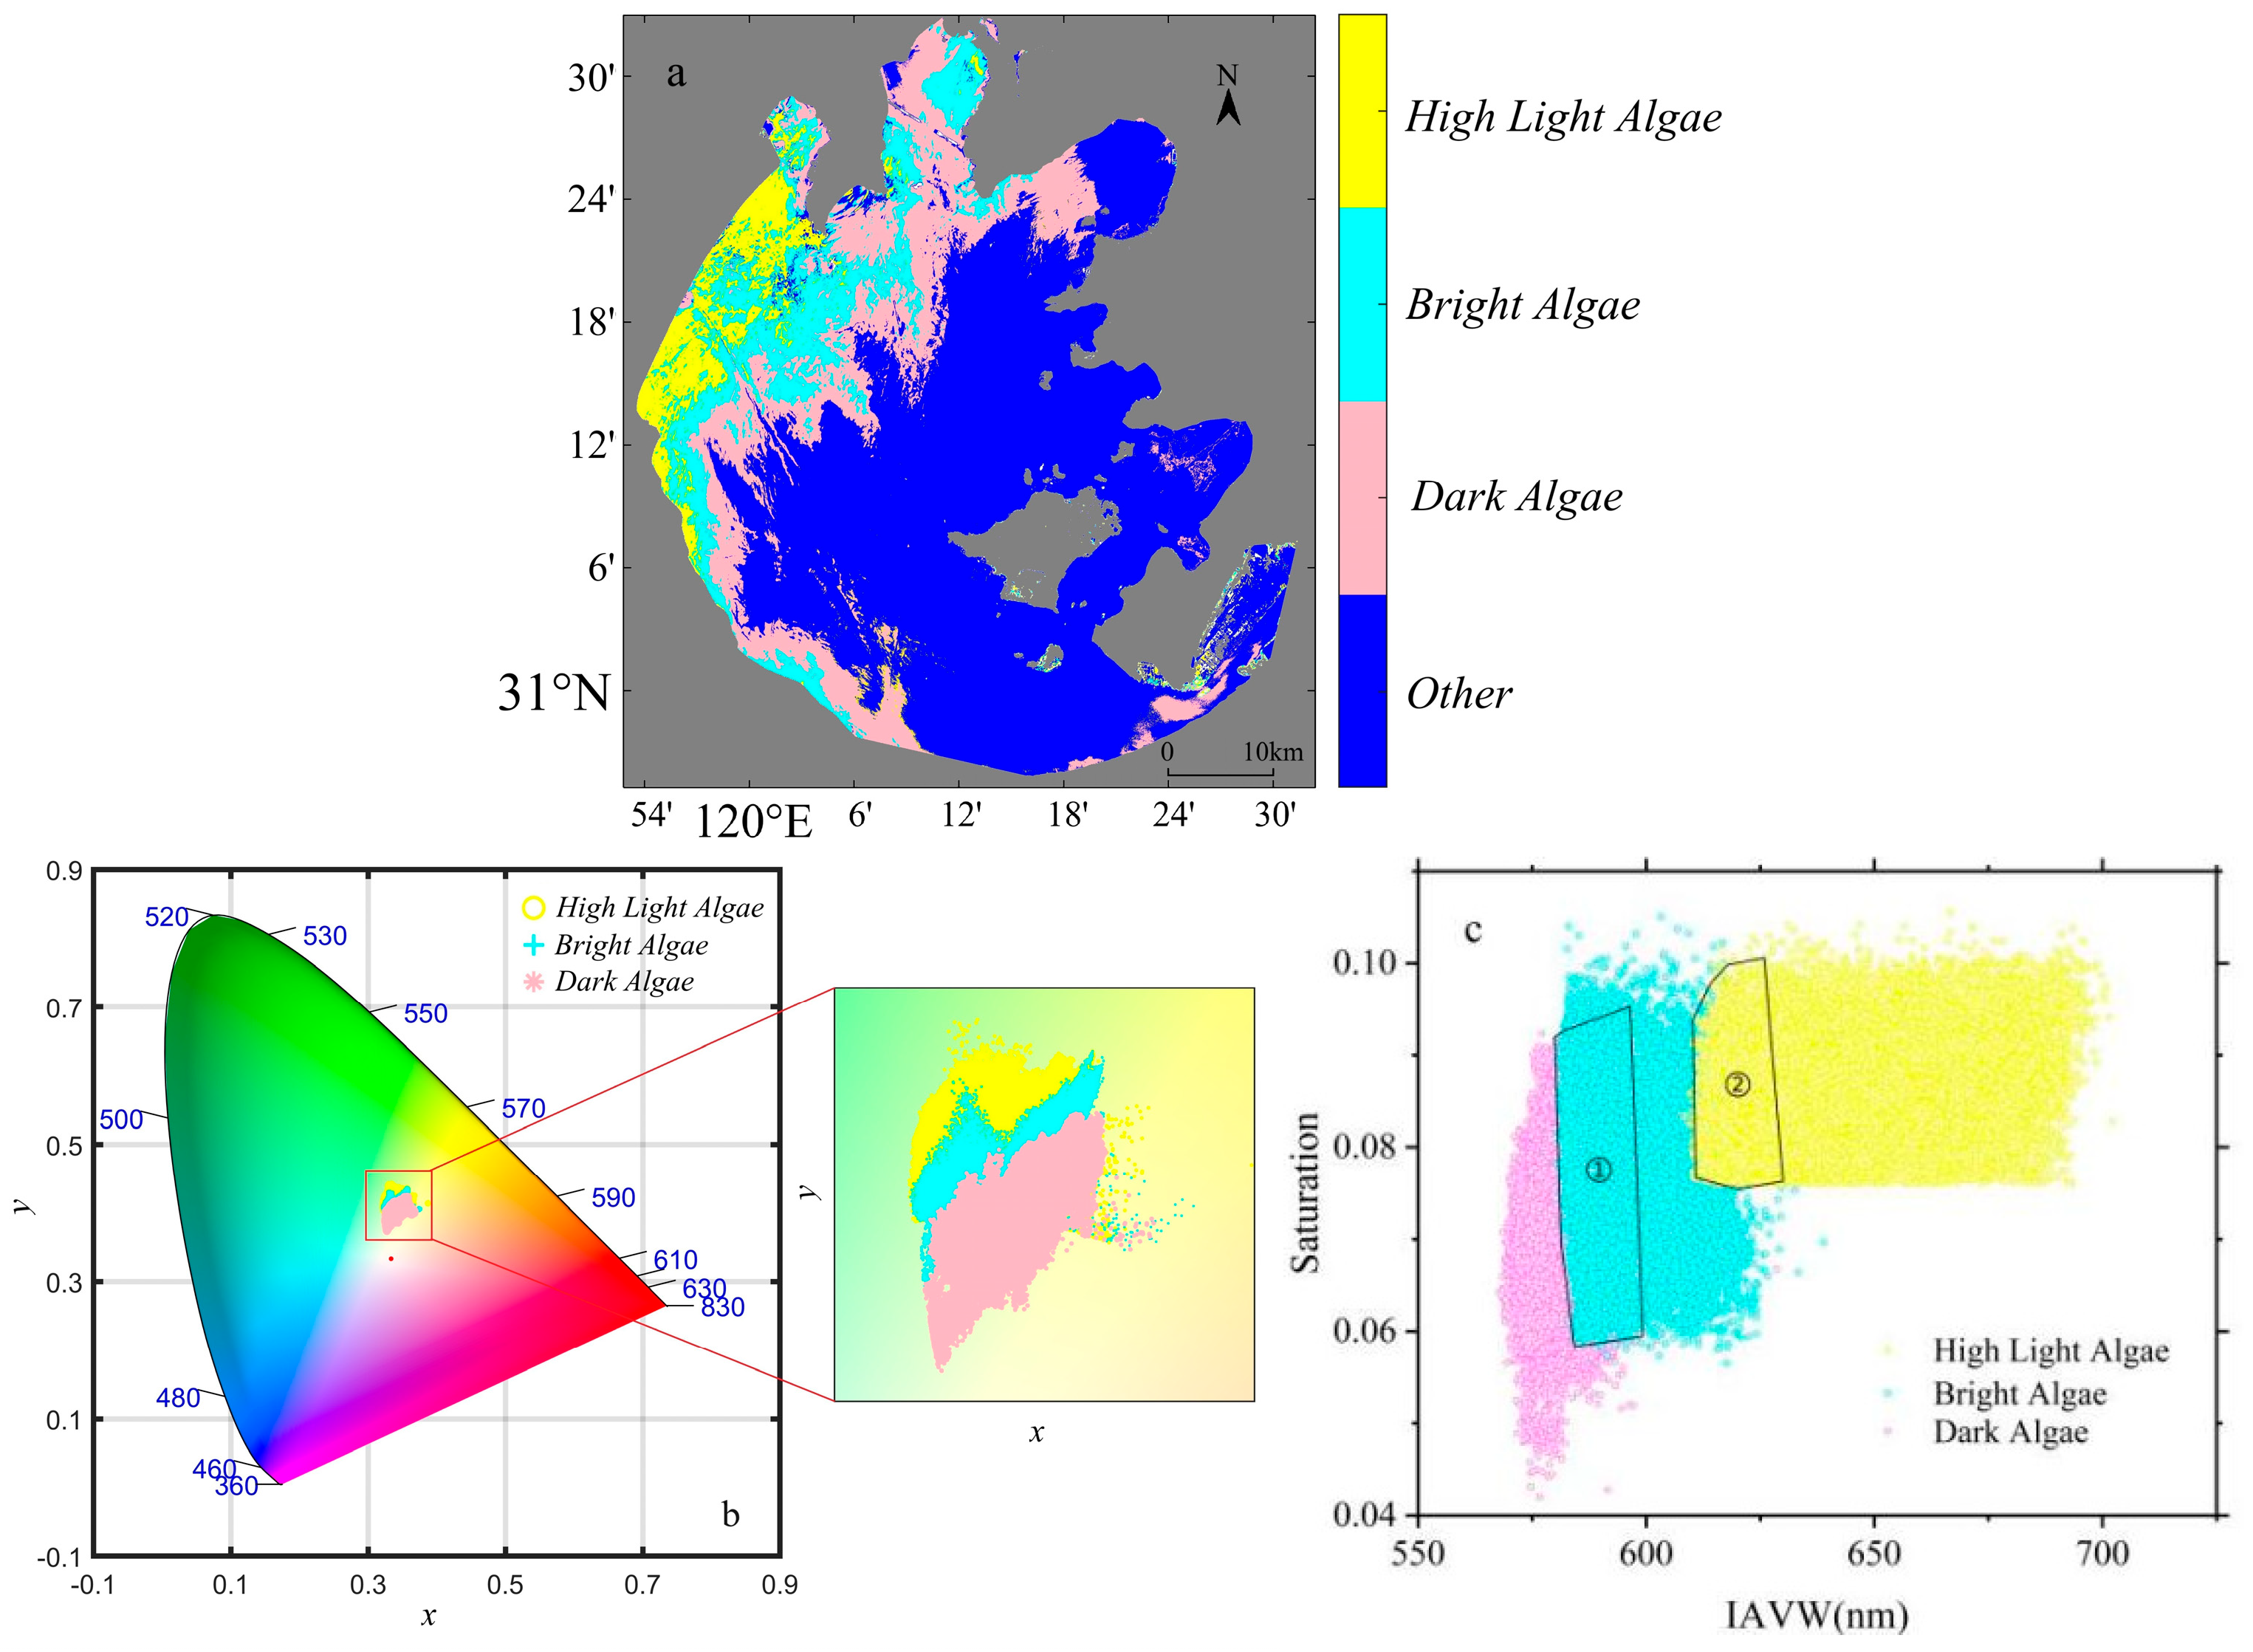
In the CIE-xy coordinate system (Figure 14b), there is an overlap between the highlight-colored water body and the bright-colored water body, as well as the bright-colored water body and the dark-colored water body. Furthermore, the IAVW vs. saturation scatter plots of the three color waters reveal the existence of an overlap between the three types of color waters (Figure 14c). It may be caused by the adjacency effects of water bodies with different colors.

Figure 14.
Discrimination and analysis of algal bloom by color ((a) Range of algal bloom discriminated by color. (b) The range of algal bloom in the CIE-xy coordinate system. (c) Scatterplot of Saturation vs. IAVW for three colors of water bodies. Part ① for the overlap of highlight-colored water and bright-colored water, and part ② is the overlap of bright-colored water bodies and dark-colored water bodies).
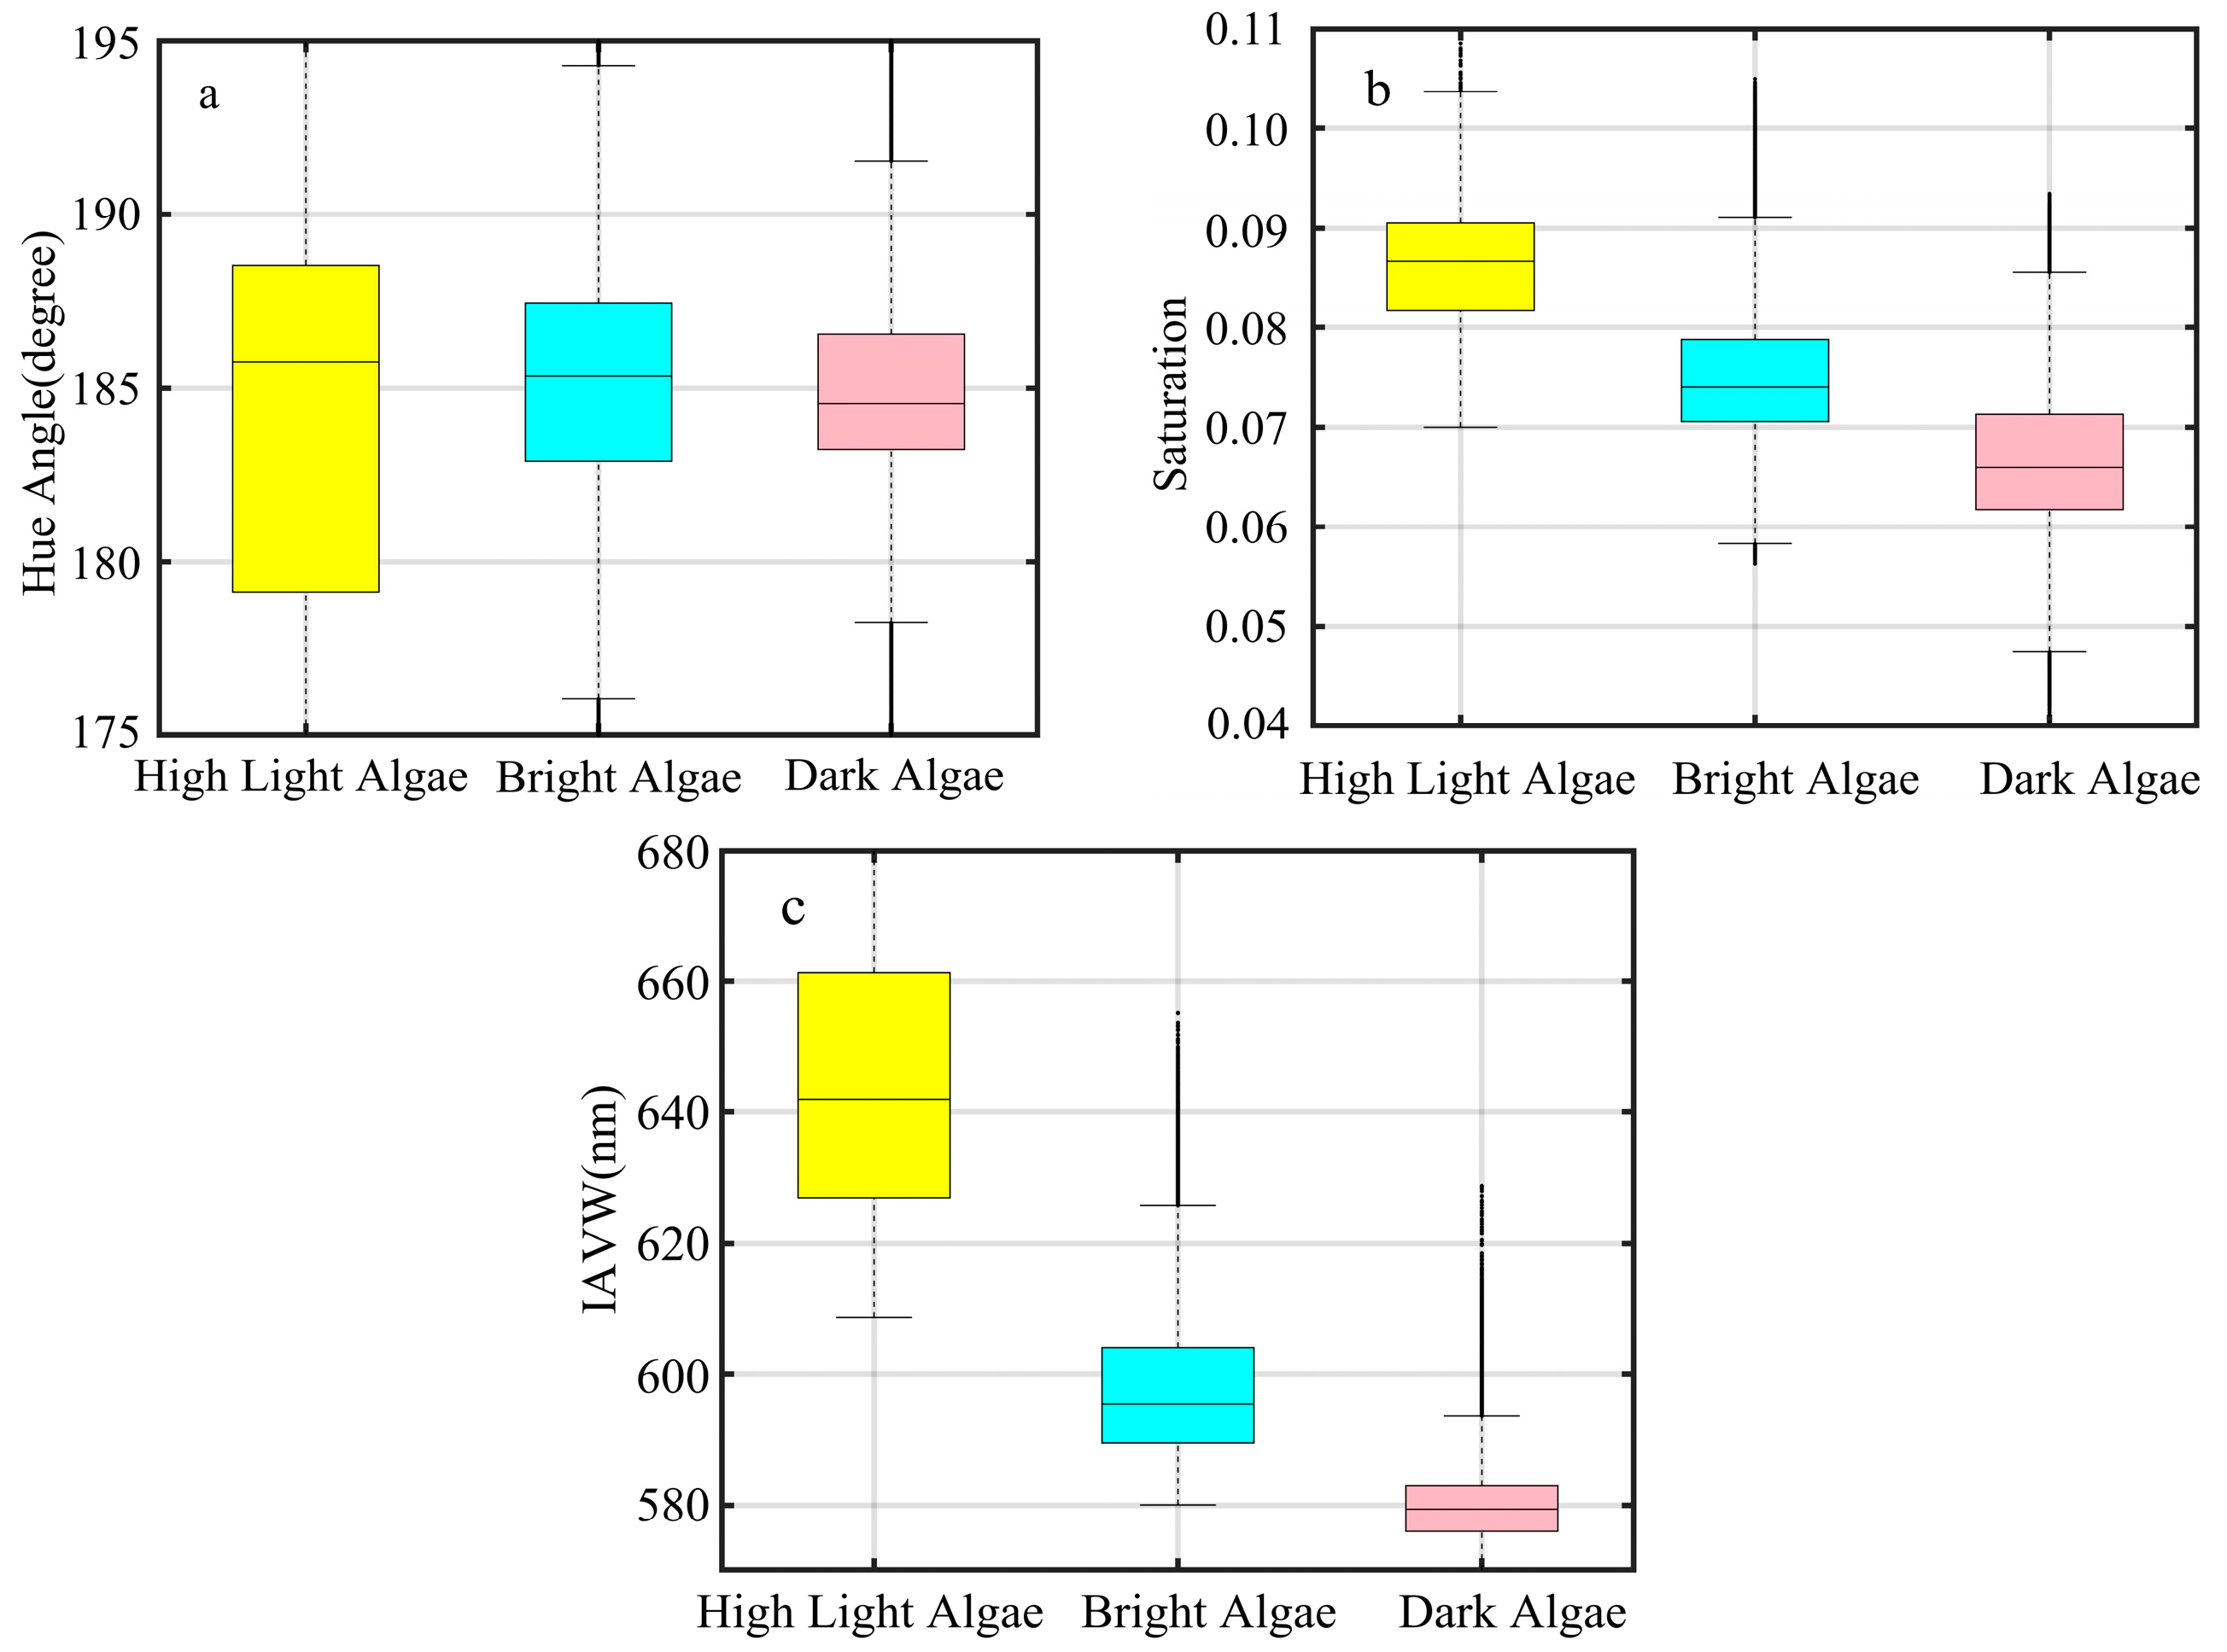
The statistical analysis of three chromatic parameters for three types of colored water was shown in Figure 15a. The hue angle of the highlight-colored water body, the bright-colored water body, and the dark-colored water body, respectively, ranged from 170.23 to 213.81 degrees, from 146.63 to 210.56 degrees, and from 146.20 to 207.28 degrees.
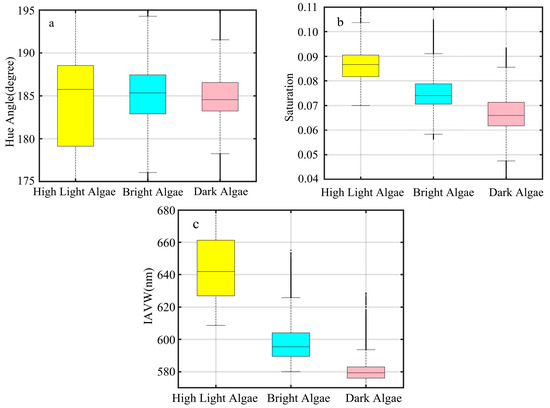
Figure 15.
Further discrimination of box plots of chromatic parameters of algal bloom in Lake Taihu ((a) hue angle, (b) saturation, and (c) IAVW).
In Figure 15b, the saturation of the highlight-colored water body, the bright-colored water body, and the dark-colored water body, respectively, ranged from 0.070 to 0.109, from 0.041 to 0.105, and from 0.036 to 0.093.
In Figure 15c, the IAVW of the highlight-colored water body, the bright-colored water body, and the dark-colored water body, respectively, ranged from 608.59 to 702.58 nm, from 580.07 to 655.20 nm, and from 567.57 to 628.75 nm.
The values of all three chromatic parameters were at their maximum for the highlight-colored water and minimum for the dark-colored water. The IAVW, hue angle, and saturation of the highlight-colored water were, respectively, concentrated at 641.89 nm, 185.76 degrees, and 0.087. The IAVW, hue angle, and saturation of the bright-colored water were, respectively, concentrated at 595.44 nm, 185.35 degrees, and 0.074. The IAVW, hue angle, and saturation of dark-colored water exhibited were, respectively, concentrated at 579.48 nm, 184.53 degrees, and 0.066.
From the perspective of the color discrimination abilities, the overlap range of the IAVW for the three types of water bodies is the smallest (Figure 15). In Figure 15, the three colors of algal bloom water cannot distinctly be separated based on the hue angle. The color discrimination ability of saturation and IAVW is better than the hue angle.
5. Conclusions
This study utilized the in situ algal bloom data from Lake Taihu to construct an algal bloom detecting model based on water color characteristics. The method was further utilized to detect the algae bloom in Lake Taihu using the ZY-1E image data on 6 September 2020. The detection effectiveness was evaluated and validated based on the in situ algal density data from the same time. The conclusions are as follows:
- (1)
- The model accuracy has been validated based on in situ field measurements. In the modeling datasets, the OA value is 0.81, and the F1-score is 0.86. In the validation datasets, the OA value is 0.83, and the F1-score is 0.89. The model demonstrated high accuracy. The three separated water body types still exhibited some overlap in their chromatic characteristics, which may be caused by atmospheric correction challenges and adjacency effects.
- (2)
- From the detection results of the algae bloom based on the image data obtained from the AHSI on board ZY-1E. Among the in situ measured points in Lake Taihu, eighteen measured points were correctly detected, while one point was incorrectly detected. The overall accuracy (OA) and F1-score were 0.95 and 0.95, respectively. Compared with the algal bloom detecting model based on spectral characteristics, the model constructed using water color characteristics achieves higher accuracy and better reflects the optical properties of Lake Taihu’s water body. These results demonstrate that the algal bloom detection method in this study is effective to detect the algal bloom in Lake Taihu on 6 September 2020 with ZY-1E satellite data.
This study proposes an algal bloom detecting model for Lake Taihu based on water color characteristics. Through accuracy validation and comparative analysis, it was found that the method is applicable for algal bloom detection in Lake Taihu using hyperspectral satellite data from 6 September 2020, and it demonstrates high accuracy.
Author Contributions
Conceptualization, Q.L., D.Z., Z.Q. and Y.Z.; Methodology, Q.L., D.Z., Z.Q. and Y.Z.; Validation, Y.Z.; Formal analysis, Q.L., D.Z., Z.Q., S.J. and Y.Z.; Resources, S.J.; Data curation, S.J.; Writing—original draft, Q.L., D.Z., Z.Q. and S.J.; Writing—review & editing, Q.L., D.Z., Z.Q., S.J. and Y.Z.; Visualization, Q.L.; Project administration, Z.Q. and Y.Z.; Funding acquisition, Z.Q. All authors have read and agreed to the published version of the manuscript.
Funding
This study is supported by the National Natural Science Foundation of China (No. 41976165); FY-3(03)-AS-11.10-ZT and FY-3(03)-AS-11.12-ZT; and by the Hainan Province Science and Technology Special Fund.
Institutional Review Board Statement
Not applicable.
Informed Consent Statement
Not applicable.
Data Availability Statement
The raw data supporting the conclusions of this article will be made available by the authors on request.
Acknowledgments
We thank Ronghua Ma, Yunlin Zhang, and Hongtao Duan for providing the hyperspectral data regarding Lake Taihu.
Conflicts of Interest
The authors declare no conflicts of interest.
Appendix A
Table A1.
The Sampling Point Locations from Figure 9.
Table A1.
The Sampling Point Locations from Figure 9.
| Number | Longitude (°E) | Latitude (°N) | Number | Longitude (°E) | Latitude (°N) |
|---|---|---|---|---|---|
| 1 | 120.344 | 31.413 | 14 | 120.069 | 31.257 |
| 2 | 120.166 | 34.455 | 15 | 119.975 | 31.204 |
| 3 | 120.262 | 31.330 | 16 | 120.059 | 31.189 |
| 4 | 120.212 | 31.343 | 17 | 120.139 | 31.173 |
| 5 | 120.124 | 31.371 | 18 | 120.212 | 31.155 |
| 6 | 120.020 | 31.381 | 19 | 120.193 | 31.080 |
| 7 | 120.019 | 31.311 | 20 | 120.119 | 31.094 |
| 8 | 120.107 | 31.297 | 21 | 120.039 | 31.010 |
| 9 | 120.202 | 31.292 | 22 | 120.305 | 30.972 |
| 10 | 120.273 | 31.283 | 23 | 120.234 | 30.980 |
| 11 | 120.316 | 31.208 | 24 | 120.169 | 30.996 |
| 12 | 120.242 | 31.219 | 25 | 120.102 | 31.006 |
| 13 | 120.171 | 31.236 |
Table A2.
The Sampling Point Locations from Figure 13.
Table A2.
The Sampling Point Locations from Figure 13.
| Range | Number | Longitude (°E) | Latitude (°N) | Range | Number | Longitude (°E) | Latitude (°N) |
|---|---|---|---|---|---|---|---|
| a | 1 | 120.019 | 31.404 | b | 5 | 120.113 | 31.243 |
| 2 | 120.021 | 31.397 | 6 | 120.112 | 31.234 | ||
| 3 | 120.007 | 31.392 | 7 | 120.100 | 31.245 | ||
| 4 | 120.023 | 31.395 | 8 | 120.094 | 31.250 | ||
| 5 | 120.156 | 31.386 | c | 1 | 120.141 | 30.985 | |
| 6 | 120.032 | 31.387 | 2 | 120.135 | 30.995 | ||
| 7 | 120.045 | 31.368 | 3 | 120.130 | 30.986 | ||
| 8 | 120.030 | 31.366 | 4 | 120.126 | 31.000 | ||
| b | 1 | 120.095 | 31.282 | 5 | 120.118 | 30.993 | |
| 2 | 120.081 | 31.284 | 6 | 120.115 | 31.004 | ||
| 3 | 120.077 | 31.268 | 7 | 120.104 | 30.997 | ||
| 4 | 120.076 | 31.252 | 8 | 120.103 | 31.007 |
References
- Dai, Y.; Yang, S.; Zhao, D.; Hu, C.; Xu, W.; Anderson, D.M.; Li, Y.; Song, X.-P.; Boyce, D.G.; Gibson, L. Coastal phytoplankton blooms expand and intensify in the 21st century. Nature 2023, 615, 280–284. [Google Scholar] [CrossRef] [PubMed]
- Huisman, J.; Codd, G.A.; Paerl, H.W.; Ibelings, B.W.; Verspagen, J.M.; Visser, P.M. Cyanobacterial blooms. Nat. Rev. Microbiol. 2018, 16, 471–483. [Google Scholar] [CrossRef]
- Wynne, T.T.; Stumpf, R.P.; Litaker, R.W.; Hood, R.R. Cyanobacterial bloom phenology in Saginaw Bay from MODIS and a comparative look with western Lake Erie. Harmful Algae 2021, 103, 101999. [Google Scholar] [CrossRef]
- McCabe, R.M.; Hickey, B.M.; Trainer, V.L. The Pacific Northwest Harmful Algal Blooms Bulletin. Harmful Algae 2023, 127, 102480. [Google Scholar] [CrossRef]
- Watson, S.B.; Ridal, J.; Boyer, G.L. Taste and odour and cyanobacterial toxins: Impairment, prediction, and management in the Great Lakes. Can. J. Fish. Aquat. Sci. 2008, 65, 1779–1796. [Google Scholar] [CrossRef]
- Brooks, B.W.; Lazorchak, J.M.; Howard, M.D.; Johnson, M.V.V.; Morton, S.L.; Perkins, D.A.; Reavie, E.D.; Scott, G.I.; Smith, S.A.; Steevens, J.A. Are harmful algal blooms becoming the greatest inland water quality threat to public health and aquatic ecosystems? Environ. Toxicol. Chem. 2016, 35, 6–13. [Google Scholar] [CrossRef]
- Huo, D.; Gan, N.; Geng, R.; Cao, Q.; Song, L.; Yu, G.; Li, R. Cyanobacterial blooms in China: Diversity, distribution, and cyanotoxins. Harmful Algae 2021, 109, 102106. [Google Scholar] [CrossRef]
- Wang, X.; Liu, R. Spatial analysis and eutrophication assessment for chlorophyll a in Taihu Lake. Environ. Monit. Assess. 2005, 101, 167–174. [Google Scholar]
- Dong, X.; Bennion, H.; Battarbee, R.; Yang, X.; Yang, H.; Liu, E. Tracking eutrophication in Taihu Lake using the diatom record: Potential and problems. J. Paleolimnol. 2008, 40, 413–429. [Google Scholar] [CrossRef]
- Li, Y. Inland Water Color Parameters Retrieval and Algal Bloom Monitoring Using Multi-Source Remote Sensing. Ph.D. Thesis, Institute of Remote Sensing and Digital Earth, Chinese Academy of Sciences, University of Chinese Academy of Sciences, Beijing, China, 2017. [Google Scholar]
- Cao, Z.; Jing, Y.; Zhang, Y.; Lai, L.; Liu, Z.; Yang, Q. Innovative remote sensing identification of cyanobacterial blooms inspired from pseudo water color. Remote Sens. 2022, 15, 215. [Google Scholar] [CrossRef]
- Huang, C.; Li, Y.; Yang, H.; Sun, D. Detection of algal bloom and factors influencing its formation in Taihu Lake from 2000 to 2011 by MODIS. Environ. Earth Sci. 2014, 71, 3705–3714. [Google Scholar] [CrossRef]
- Zhu, Q.; Li, J.; Zhang, F.; Shen, Q. Distinguishing Cyanobacterial Bloom from Floating Leaf Vegetation in Lake Taihu Based on Medium-Resolution Imaging Spectrometer (MERIS) Data. IEEE J. Sel. Top. Appl. Earth Obs. Remote Sens. 2018, 11, 34–44. [Google Scholar] [CrossRef]
- Ahn, Y.-H.; Shanmugam, P.; Ryu, J.-H.; Jeong, J.-C. Satellite detection of harmful algal bloom occurrences in Korean waters. Harmful Algae 2006, 5, 213–231. [Google Scholar] [CrossRef]
- Shen, F.; Tang, R.; Sun, X.; Liu, D. Simple methods for satellite identification of algal blooms and species using 10-year time series data from the East China Sea. Remote Sens. Environ. 2019, 235, 111484. [Google Scholar] [CrossRef]
- Song, H.; Pan, X.; Xie, W.; Yang, Y. Eutrophic water information extraction based on modified augmented normalized difference water index. J. Lake Sci. 2025, 37. [Google Scholar]
- Wang, J.; Zhang, Y.; Zhi, L.; Wang, Y. Comparative Analysis of Multiple Blue-Green Algae Bloom Monitoring Methods in Taihu Lake Using MODIS Time Series Data. J. N. China Univ. Water Resour. Electr. Power Nat. Sci. Ed. 2023. [Google Scholar]
- Yin, Y.; Ma, L.; Li, P. Hue-Subregion Weighted Constrained Hue-Plane Preserving Camera Characterization. Acta Opt. Sin. 2024, 44, 0933001. [Google Scholar]
- Gao, X.; Huang, M.; Wang, Y.; Li, Y.; Li, X.; Yan, Z.; Xu, Y.; Liu, Y. Color calculation accuracy of LED display based on CIE1931 color matching functions. Acta Opt. Sin. 2022, 42, 2233001. [Google Scholar]
- Dev, P.J.; Sukenik, A.; Mishra, D.R.; Ostrovsky, I. Cyanobacterial pigment concentrations in inland waters: Novel semi-analytical algorithms for multi-and hyperspectral remote sensing data. Sci. Total Environ. 2022, 805, 150423. [Google Scholar] [CrossRef]
- Reinart, A.; Kutser, T. Comparison of different satellite sensors in detecting cyanobacterial bloom events in the Baltic Sea. Remote Sens. Environ. 2006, 102, 74–85. [Google Scholar] [CrossRef]
- Cogliati, S.; Sarti, F.; Chiarantini, L.; Cosi, M.; Lorusso, R.; Lopinto, E.; Miglietta, F.; Genesio, L.; Guanter, L.; Damm, A. The PRISMA imaging spectroscopy mission: Overview and first performance analysis. Remote Sens. Environ. 2021, 262, 112499. [Google Scholar] [CrossRef]
- Kramer, S.J.; Siegel, D.A.; Maritorena, S.; Catlett, D. Modeling surface ocean phytoplankton pigments from hyperspectral remote sensing reflectance on global scales. Remote Sens. Environ. 2022, 270, 112879. [Google Scholar] [CrossRef]
- Garcia, R.A.; Fearns, P.R.; McKinna, L.I. Detecting trend and seasonal changes in bathymetry derived from HICO imagery: A case study of Shark Bay, Western Australia. Remote Sens. Environ. 2014, 147, 186–205. [Google Scholar] [CrossRef]
- Guo, Y.; Mokany, K.; Ong, C.; Moghadam, P.; Ferrier, S.; Levick, S.R. Plant species richness prediction from DESIS hyperspectral data: A comparison study on feature extraction procedures and regression models. ISPRS J. Photogramm. Remote Sens. 2023, 196, 120–133. [Google Scholar] [CrossRef]
- Valentini, E.; Taramelli, A.; Marinelli, C.; Martin, L.P.; Fassari, M.; Troffa, S.; Mzid, N.; Casa, R.; Pignatti, S. Hyperspectral mixture models in the CHIME mission implementation for topsoil texture retrieval. J. Geophys. Res. Biogeosci. 2023, 128, e2022JG007272. [Google Scholar] [CrossRef]
- Zhao, E.; Gao, C.; Han, Q.; Yao, Y.; Wang, Y.; Yu, C.; Yu, H. An operational land surface temperature retrieval methodology for Chinese second-generation Huanjing disaster monitoring satellite data. IEEE J. Sel. Top. Appl. Earth Obs. Remote Sens. 2022, 15, 1283–1292. [Google Scholar] [CrossRef]
- Zhang, R.; Zhou, W.; Chen, H.; Zhang, L.; Zhang, L.; Ma, P.; Zhao, S.; Wang, Z. Aerosol Information Retrieval from GF-5B DPC Data over North China Using the Dark Dense Vegetation Algorithm. Atmosphere 2023, 14, 241. [Google Scholar] [CrossRef]
- Dierssen, H.M.; Kudela, R.M.; Ryan, J.P.; Zimmerman, R.C. Red and black tides: Quantitative analysis of water-leaving radiance and perceived color for phytoplankton, colored dissolved organic matter, and suspended sediments. Limnol. Oceanogr. 2006, 51, 2646–2659. [Google Scholar] [CrossRef]
- Song, T.; Liu, G.; Zhang, H.; Yan, F.; Fu, Y.; Zhang, J. Lake Cyanobacterial Bloom Color Recognition and Spatiotemporal Monitoring with Google Earth Engine and the Forel-Ule Index. Remote Sens. 2023, 15, 3541. [Google Scholar] [CrossRef]
- Liu, J.L.; Zhao, X.H.; Kang, X.Y.; Zhuang, M.M.; Ding, X.W.; Zhao, L.J.; Wen, Q.L.; Zhu, Y.; Gu, K.; Bao, Q.J.; et al. Good news: We can identify Ulva species erupted in the Yellow Sea more easily and cheaply now. Conserv. Genet. Resour. 2020, 12, 447–449. [Google Scholar] [CrossRef]
- Vandermeulen, R.A.; Mannino, A.; Craig, S.E.; Werdell, P.J. 150 shades of green: Using the full spectrum of remote sensing reflectance to elucidate color shifts in the ocean. Remote Sens. Environ. 2020, 247, 111900. [Google Scholar] [CrossRef]
- Men, J.; Chen, X.; Hou, X.; Tian, J.; Song, Q.; Tian, L. OC_3S: An optical classification and spectral scoring system for global waters using UV–visible remote sensing reflectance. ISPRS J. Photogramm. Remote Sens. 2023, 200, 153–172. [Google Scholar] [CrossRef]
- Dierssen, H.M.; Vandermeulen, R.A.; Barnes, B.B.; Castagna, A.; Knaeps, E.; Vanhellemont, Q. QWIP: A quantitative metric for quality control of aquatic reflectance spectral shape using the apparent visible wavelength. Front. Remote Sens. 2022, 3, 869611. [Google Scholar] [CrossRef]
- Bi, S.; Hieronymi, M. Holistic optical water type classification for ocean, coastal, and inland waters. Limnol. Oceanogr. 2024, 69, 1547–1561. [Google Scholar] [CrossRef]
- Neville, R.; Gower, J. Passive remote sensing of phytoplankton via chlorophyll α fluorescence. J. Geophys. Res. 1977, 82, 3487–3493. [Google Scholar] [CrossRef]
- Vos, W.; Donze, M.; Bueteveld, H. On the reflectance spectrum of algae in water: The nature of the peak at 700 nm and its shift with varying concentration. In Communications on Sanitary Engineering and Water Management; TU Delft: Delft, The Netherlands, 1986; Volume 7, 22p. [Google Scholar]
- Zhao, D.; Zhang, F.; Yang, J.; Guo, H.; Zhao, L. The optimized spectral bands ratio for the relation of sun-induced chlorophyll fluorescence height with high chlorophyll a concentration of algal bloom waters. Acta Oceanol. Sin. 2005, 27, 146–153. [Google Scholar]
- Lavigne, H.; Ruddick, K.; Vanhellemont, Q. Monitoring of high biomass Phaeocystis globosa blooms in the Southern North Sea by in situ and future spaceborne hyperspectral radiometry. Remote Sens. Environ. 2022, 282, 113270. [Google Scholar] [CrossRef]
- Vanhellemont, Q. Adaptation of the dark spectrum fitting atmospheric correction for aquatic applications of the Landsat and Sentinel-2 archives. Remote Sens. Environ. 2019, 225, 175–192. [Google Scholar] [CrossRef]
- Liu, X.-y.; Shen, C.; Cui, W.-X.; Yang, Q.; Yu, D.-f.; Gao, H.; Yang, L.; Zhou, Y.; Zhao, X.-x. Evaluation of various atmospheric correction methods in the processing of Landsat8/OLI data in Jiaozhou Bay. Spectrosc. Spectr. Anal. 2022, 42, 2513–2521. [Google Scholar]
- Vanhellemont, Q. Sensitivity analysis of the dark spectrum fitting atmospheric correction for metre- and decametre-scale satellite imagery using autonomous hyperspectral radiometry. Opt. Express 2020, 28, 29948–29965. [Google Scholar] [CrossRef]
- Woerd, H.J.; Wernand, M.R. True colour classification of natural waters with medium-spectral resolution satellites: SeaWiFS, MODIS, MERIS and OLCI. Sensors 2015, 15, 25663–25680. [Google Scholar] [CrossRef]
- Bukata, R.P.; Jerome, J.H.; Kondratyev, A.S.; Pozdnyakov, D.V. Optical Properties and Remote Sensing of Inland and Coastal Waters; CRC Press: Boca Raton, FL, USA, 1995. [Google Scholar]
- Xu, H. A Study on Information Extraction of Water Body with the Modified Normalized Difference Water Index (MNDWI). J. Remote Sens. 2005, 9, 589–595. [Google Scholar]
- Wang, S.; Li, J.; Zhang, B.; Spyrakos, E.; Tyler, A.N.; Shen, Q.; Zhang, F.; Kuster, T.; Lehmann, M.K.; Wu, Y.; et al. Trophic state assessment of global inland waters using a MODIS-derived Forel-Ule index. Remote Sens. Environ. 2018, 217, 444–460. [Google Scholar] [CrossRef]
- Qin, B.; Yang, G.; Ma, J.; Wu, T.; Li, W.; Liu, L.; Deng, J.; Zhou, J. Spatiotemporal Changes of Cyanobacterial Bloom in Large Shallow Eutrophic Lake Taihu, China. Front. Microbiol. 2018, 9, 451. [Google Scholar] [CrossRef]
- Song, T.; Zhang, H.; Xu, Y.; Dai, X.; Fan, F.; Wang, Y.; Liu, G. Cyanobacterial blooms in Lake Taihu: Temporal trends and potential drivers. Sci. Total Environ. 2024, 942, 173684. [Google Scholar] [CrossRef]
- Xu, Y.; Zhao, L. Analysis of Spatial and Temporal Changes of Cyanobacteria Bloom in Taihu Lake Based on Remote Sensing Technology. Water Resour. South North Water Divers. 2023, 52, 5–6. [Google Scholar]
- Zhao, D.; Luo, Q.; Qiu, Z. Chromaticity-Based Discrimination of Algal Bloom from Inland and Coastal Waters Using In Situ Hyperspectral Remote Sensing Reflectance. Water 2024, 16, 2276. [Google Scholar] [CrossRef]
- Liu, X.; Shi, C.; Xu, X.; Li, X.; Xu, Y.; Huang, H.; Zhao, Y.; Zhou, Y.; Shen, H.; Chen, C.; et al. Spatial distributions of β-cyclocitral and β-ionone in the sediment and overlying water of the west shore of Taihu Lake. Sci. Total Environ. 2017, 579, 430–438. [Google Scholar] [CrossRef]


Disclaimer/Publisher’s Note: The statements, opinions and data contained in all publications are solely those of the individual author(s) and contributor(s) and not of MDPI and/or the editor(s). MDPI and/or the editor(s) disclaim responsibility for any injury to people or property resulting from any ideas, methods, instructions or products referred to in the content. |
© 2025 by the authors. Licensee MDPI, Basel, Switzerland. This article is an open access article distributed under the terms and conditions of the Creative Commons Attribution (CC BY) license (https://creativecommons.org/licenses/by/4.0/).