Article

Climate Variability and Fish Community Dynamics: Impacts of La Niña Events on the Continental Shelf of the Northern South China Sea

1
South China Sea Fisheries Research Institute, Chinese Academy of Fishery Sciences, Guangzhou 510300, China
2
College of Marine Living Resource Sciences and Management, Shanghai Ocean University, Shanghai 201306, China
3
Key Laboratory for Sustainable Utilization of Open-Sea Fishery, Ministry of Agriculture and Rural Affairs, Guangzhou 510300, China
4
Guangdong Provincial Key Laboratory of Fishery Ecology and Environment, Guangzhou 510300, China
*
Authors to whom correspondence should be addressed.
J. Mar. Sci. Eng. 2025, 13(3), 474; https://doi.org/10.3390/jmse13030474
Submission received: 13 February 2025 / Revised: 25 February 2025 / Accepted: 26 February 2025 / Published: 28 February 2025

Abstract

:
This study investigates the impacts of climate variability, particularly La Niña events, on the fish community on the continental shelf of the northern South China Sea, a region highly sensitive to environmental fluctuations. Historical fishery survey data, collected from autumn 2019 to autumn 2022, were used to analyze changes in species composition, diversity indices, and community structure during La Niña and non-La Niña periods. The results show that La Niña significantly altered the fish community dynamics. During La Niña, cold-water conditions expanded the range of suitable habitats for cold-water species, leading to increased dominance of the Japanese scad (Decapterus maruadsi), with its index of relative importance (IRI) reaching 1795.9 and 1320.2 in autumn 2021 and 2022, respectively. In contrast, warm-water species experienced a reduction in suitable habitats. During La Niña, Margalef’s richness index (D’) peaked at 23.18 in autumn 2021 but decreased to 20.69 by spring 2022. The Shannon–Wiener diversity index (H’) dropped from 2.597 during a non-La Niña period (spring 2020) to 2.406 during La Niña (spring 2022); similarly, Pielou’s evenness index fell from 0.4749 to 0.4396, indicating an increase in ecological imbalance. As La Niña conditions weakened, the fish community began to recover. By autumn 2022, D’ had risen to 22.73 and H’ to 2.573, reflecting a gradual return to fish community conditions before the La Niña event. Species distribution models incorporating key environmental variables (i.e., sea surface temperature, salinity, and dissolved oxygen) demonstrated that the habitat of D. maruadsi expanded significantly during La Niña and contracted during post-event periods. Our findings highlight the ecological sensitivity of fish communities to climate variability and underscore the importance of adaptive resource management strategies to mitigate the impacts of climate change on marine ecosystems. This research provides valuable insights for sustaining regional fishery resources under changing environmental conditions.

1. Introduction

As global warming intensifies, climate fluctuations are occurring with increasing frequency, leading to significant impacts on marine ecosystems, particularly fish communities. Climate change influences fish growth, reproductive capacity, and distributions by altering their physiology and behavior, which, in turn, drive dynamic adjustments in the community structure [1,2], shifts in species diversity, and habitat succession [1,3,4,5,6]. The oceans, as critical regulators of the global climate system, absorb the majority of the excess heat generated by carbon emissions and play a key role in carbon sequestration [7,8,9,10]. As a result, changes within marine ecosystems not only reflect the direct effects of climate change but also pose substantial challenges to the global food chain and the sustainable management of fishery resources [11,12]. Understanding how fish communities respond to climate change has thus become a crucial area of study for unraveling the complex dynamics of marine ecosystems. Among the key drivers of interannual climate variability is the El Niño Southern Oscillation (ENSO), which alternates between El Niño (warm-phase) and La Niña (cold-phase) events. This phenomenon significantly influences the climate system in the tropical Pacific Ocean, with widespread effects on global marine ecosystems through the interaction of atmospheric and oceanic currents [13,14,15,16].
The South China Sea (SCS) is highly sensitive to global climate change, with its complex environmental characteristics and diverse habitats playing a significant role in responding to climate anomalies [17,18]. As a critical subregion of the SCS, landings in the northern South China Sea (NSCS) provide more than 95% of the total fishery catch, primarily from nearshore shelf waters <200 m deep [19]. This area forms a vital connection between the continental coast of East Asia and tropical waters, is heavily influenced by the East Asian monsoon season, and serves as a key response center to the impacts of ENSO events. Variations in the sea surface temperature (SST), upwelling intensity, and nutrient distribution caused by the ENSO directly affect primary productivity and fishery resources in the NSCS [20,21,22]. The continental shelf of the northern South China Sea (NSCS shelf) is home to rich nearshore habitats, including coral reefs, mangroves, and seagrass beds, which serve as essential living and breeding grounds for fish. However, these critical ecosystems face mounting threats from seawater warming, ocean acidification, and coastal development [23,24,25].
Species distribution models (SDMs) are a widely utilized tool for predicting and analyzing species distributions across geographic regions. By integrating known species occurrence data with environmental variables, SDMs estimate the extent of suitable habitats for species and then project their potential geographic ranges [26,27]. These models rely on a variety of environmental parameters and are capable of evaluating changes in species distributions, including range expansion or contraction and migration, under both current and future climate scenarios [28,29,30]. Recent advances in computational techniques and ecological knowledge have greatly expanded the application of SDMs, particularly to assess marine fish distributions based on habitat suitability. These models provide critical scientific insight into how changes in ocean conditions may shape the future spatial distributions of fish, allowing for the prediction of distribution dynamics in diverse environmental scenarios [31,32].
Small pelagic fish are key components of the marine food web. They are characterized by a short lifespan, rapid growth, high mobility, and a diet based on plankton. These fish play an important role in the ecosystem by converting low-trophic-level plankton to higher-trophic-level fish, thereby providing energy and nutrients to species at higher trophic levels [33]. The population dynamics of small pelagic fish are highly sensitive to environmental changes, including factors such as sea temperature, upwelling intensity, and primary productivity. Their growth, maturation, reproduction, and population structure exhibit significant fluctuations in response to climate change and changes in environmental conditions. In particular, their abundance and biomass are influenced by variations in ocean temperature, nutrient availability, and ocean currents [34,35]. There are various small pelagic fish species in the northern South China Sea, among which Japanese jack mackerel (Trachurus japonicus) and Japanese scad (Decapterus maruadsi) are considered as ideal model species for understanding the impacts of climate change on habitat distribution [20,21].
The effects of La Niña events on the fish community on the NSCS shelf remain insufficiently understood. To address this gap, we analyzed historical fishery data from the region, focusing on changes in species composition, diversity, abundance, and community structure, before and after La Niña events. Building on these results, we selected D. maruadsi, a species exhibiting the most-pronounced changes in dominance associated with La Niña events, as a case study. Using SDMs and incorporating key environmental variables, such as SST and chlorophyll-a concentration (Chl-a), we analyzed this specie’s habitat expansion and contraction, and its distribution patterns under varying climatic conditions. This study provides valuable insights into the impacts of environmental change on regional fishery resources, contributing to a better understanding of ecosystem dynamics and informing sustainable management strategies.

2. Materials and Methods

2.1. Data

2.1.1. Survey Data

The data used in this study were obtained from bottom-trawl surveys on the NSCS shelf conducted by the South China Sea Fisheries Research Institute of the Chinese Academy of Fisheries Sciences (Figure 1). The data were collected in spring 2020 and 2022 and in autumn 2019, 2021, and 2022. The surveys were conducted using a commercial fishing vessel with a main engine power of 441 kW and measuring 36.8 m in length, 6.8 m in width, and 3.8 m in draft. A total of 45 predetermined sampling stations were consistently surveyed each year. The trawl nets employed measured 76 m in length, 53.79 m in width, and 34 m in height, with 200 mm mesh, and a 39 mm cod-end mesh. In most cases, towing was carried out at a speed of 3.5 knots for 1 h. However, at certain nearshore stations, the trawl duration was shortened to 30–50 min to prevent potential collisions with other vessels or fixed fishing structures. During the survey voyage in autumn 2019, trawl operations were not conducted at five of the stations (D1, E1, F1, G1, and H1) because of adverse weather conditions and other factors.

2.1.2. Oceanic Niño Index (ONI)

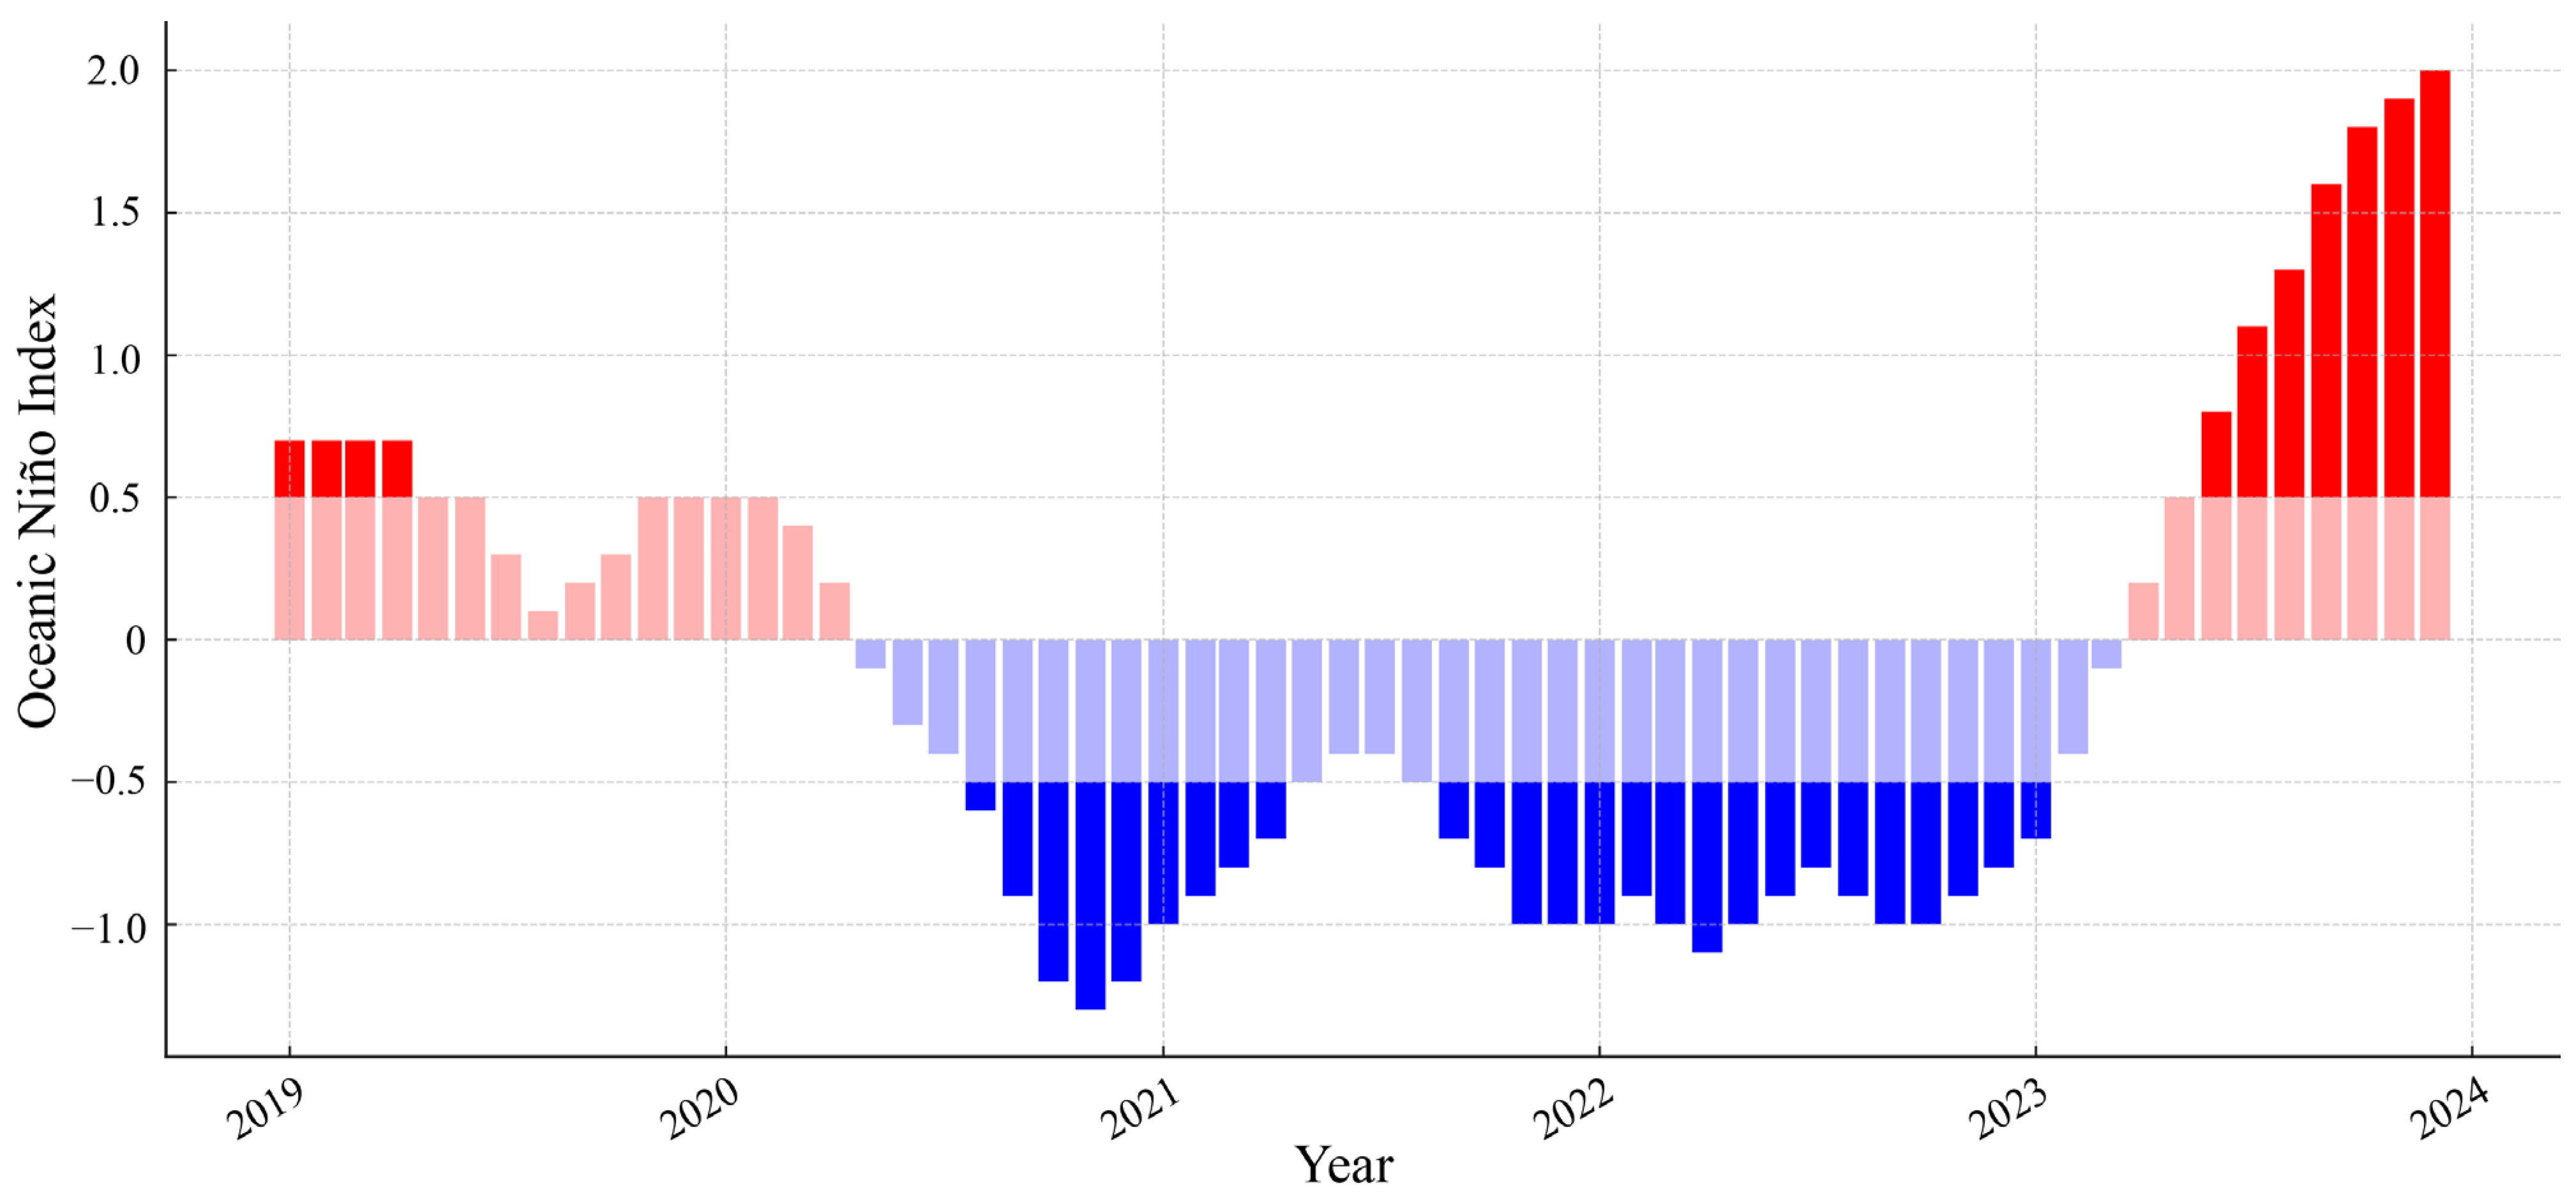
Time-series ONI data were obtained from the National Oceanic and Atmospheric Administration website (https://origin.cpc.ncep.noaa.gov, accessed on 25 July 2024). The ONI indicated the occurrence of two La Niña events: from August 2020 to May 2021 and from August 2021 to January 2023 (Figure 2).

2.2. Data Analyses

2.2.1. Dominant Fish Species

We calculated the index of relative importance (IRI) to analyze the abundance, biomass, and ecological dominance of fish species within the fish community on the NSCS shelf [36]. The formula is as follows:
IRI = (N + M) × F
where N is the percentage of a specie’s numerical abundance relative to the total number of individuals, M is the percentage of a specie’s biomass relative to the total weight of all the species, and F is the frequency of the occurrence of the species during the survey. A higher IRI value indicates greater ecological significance for a given species. The species were categorized based on their dominance as follows: IRI ≥ 1000 (dominant), 500 ≤ IRI < 1000 (significant), 100 ≤ IRI < 500 (frequent), 10 ≤ IRI < 100 (occasional), and IRI < 10 (scarce) [14,37].

2.2.2. Fish Diversity

We analyzed fish community characteristics using Simpson’s dominance index (λ) to evaluate species dominance [38], the Hill N1 and Hill N2 indices to assess effective species richness and the number of dominant species [39], Margalef’s richness index (D’) to measure species richness [40], Pielou’s evenness index (J’) to examine distribution uniformity [41], and the Shannon–Wiener diversity index (H’) to reflect the overall community diversity [42] as follows:
λ = i = 1 S n i N 2
N 1 = e H
N 2 = 1 λ
D = S 1 ln N
J = H ln S
H = i = 1 S P i ln P i
where S is the total number of species recorded in the sample; ni is the number of individuals of the ith species, representing the observed individuals of that species; N is the total number of individuals of all the species in the sample, i.e., the sum of all the observed individuals; and Pi is the relative abundance of the ith species.

2.3. Fish Community Composition

To minimize the impacts of rare species on the analyses of the community composition, species with a catch ratio of <0.1% and recorded at fewer than 3% of the stations were excluded. The data were fourth-root transformed to construct a Bray–Curtis similarity matrix. The fish community structure was analyzed using cluster analysis and non-metric multidimensional scaling (NMDS). Differences in the fish species composition before and after ENSO events were assessed through an analysis of similarities (ANOSIM). All the data processing and analyses were conducted using the ‘vegan’ package in R (version 4.3.0), while the spatial distribution of the abundance for selected commercially exploited species was visualized using ArcGIS 10.8 software.

2.4. Species Distribution Models (SDMs)

2.4.1. Screening of Environmental Data

For the SDMs, we selected six candidate predictors, all obtained from the Copernicus Marine Service (https://data.marine.copernicus.eu, accessed on 25 July 2024) (Table 1). Extensive research has shown that these factors, along with their interactions, directly or indirectly influence the spatial distribution patterns of marine fishes [43,44]. For example, rising ocean temperatures and fluctuations in salinity can alter habitat availability, leading to significant shifts in fish distribution patterns [45]. Changes in seawater salinity can influence the survival rate of fish eggs. A decrease in salinity causes the eggs to sink, and they are unable to survive in the hypoxic conditions of deeper waters. Fish, in response to salinity fluctuations, migrate to habitats with optimal salinity levels to prevent osmotic stress, thereby resulting in changes to the structure of fish communities [46]. Similarly, dissolved oxygen levels affect fish activity and habitat suitability through physiological tolerance limits, which ultimately impact fish biomass and community structure across different regions [47].

2.4.2. Ensemble Modeling

We implemented an ensemble model (EM) to predict the distribution of D. maruadsi using three machine-learning algorithms: a generalized additive model (GAM), a gradient-boosting machine (GBM), and random forests (RFs). These algorithms were implemented with the default settings of the package biomod2 in R and integrated using the EMca algorithm to enhance the prediction accuracy and robustness. During data preparation, actual occurrence points of the species were collected, and 1000 pseudo-presence points were randomly generated within the study area, excluding points overlapping with actual presence data to ensure data integrity. The dataset was then randomly divided into a training set (80%) and a validation set (20%), with a cross-validation approach applied, and the modeling process was repeated 10 times to ensure robust results. Response curves of environmental variables were generated to analyze their influences on the species distribution. Model performance was evaluated using the true skill statistics (TSS) score and the receiver operating characteristic/area under the curve (ROC/AUC) metric, where a TSS value of >0.55 indicated a well-fitting model, and an AUC value of >0.6 suggested acceptable classification performance. Additionally, ROC values nearing 1 are typically indicative of model overfitting [48]. TSS is an evaluation metric that combines sensitivity (recall) and specificity (true negative rate), with values ranging from −1 to 1, where values closer to 1 indicate better performance. The ROC curve plots the relationship between the true positive rate and false positive rate, with a curve closer to the upper-left corner representing better model performance. AUC, the area under the ROC curve, provides an overall measure of classification ability, with values closer to 1 signifying stronger performance [49]. By integrating outputs from multiple models, the ensemble model significantly improved the accuracy and robustness of the species distribution predictions.

3. Results

3.1. Fish Community Composition and Dominant Species

During the surveys in autumn 2019 and spring 2020, a total of 236 fish species were recorded, representing the lowest species richness among all the surveys. By comparison, 263 species were observed in autumn 2021, 237 species in spring 2022, and the highest species count (267) was recorded in autumn 2022. Of these, 118 species were consistently present across all five surveys, indicating a degree of community stability. Furthermore, 161 species were observed in the spring surveys of both 2020 and 2022, accounting for 94.4% of the total catch, while 155 species were recorded in the autumn surveys of 2019, 2021, and 2022, comprising 94.8% of the total catch.
La Niña events had significant impacts on the catch biomass and numerical distribution of the dominant fish species. In this study, we only analyzed species with an IRI value of >500. In the spring surveys, the abundance of a warm-water fish, the bensasi goatfish (Upeneus bensasi), increased notably, with its IRI value increasing from 677.5 in 2020 to 762.8 in 2022. Conversely, the abundance of a warm-temperate species, the greater lizardfish (Saurida tumbil), declined sharply, with an IRI value of 613.2 in spring 2020 (Table 2).
The shifts in species dominance were even more pronounced in the autumn surveys. The IRI value of D. maruadsi reached 1795.9 and 1320.2 in the autumns of 2021 and 2022, respectively, making it a highly dominant species during these seasons owing to a marked increase in abundance. In contrast, the relative importance of S. tumbil decreased significantly; its highest IRI value, at 919.1, was in autumn 2019, but by the autumns of 2021 and 2022, it was no longer a dominant species (Table 2). These findings indicate that La Niña events likely exert profound effects on the fish community structure and population dynamics by altering marine environmental conditions.

3.2. Fish Diversity and Community Structure

The survey data of autumn 2019 and spring 2020 show that the fish community remained relatively stable during a non-La Niña period. Margalef’s richness index (D’) was 21.3 for autumn 2019 and 21.04 for spring 2020, and Pielou’s evenness (J’) values were 0.4745 and 0.4749, respectively; moreover, the Shannon–Wiener diversity index (H’) reached its highest values, at 2.595 and 2.597, indicating a well-balanced community. The dominance effect of the species was moderate, as reflected in Simpson’s dominance index (λ) values of 0.7681 and 0.7653 for autumn 2019 and spring 2020, respectively, and Hill’s N1 and N2 values were 13.39 and 13.42, and 4.124 and 4.074, respectively (Table 3).
The survey data of autumn 2021 and spring 2022 revealed significant disruptions to the fish community under the cold-water conditions of La Niña. Species richness (D’) peaked at 23.18 in autumn 2021 but declined to 20.69 by spring 2022. Evenness (J’) dropped to 0.4357 and 0.4396, significantly lower than values for outside the La Niña period (t-test: T = 18.901, p = 0.03177) (see above). Diversity (H’) reached lows of 2.429 and 2.406. Accordingly, the dominance effect increased, as indicated by Simpson’s λ values of 0.7548 and 0.7559. Hill’s N1 and N2 values decreased to 11.35 and 11.09, and 3.883 and 3.982, respectively (Table 3), with cold-water species becoming more dominant, resulting in a more uneven community distribution.
The survey data collected in autumn 2022, late in this La Niña period, indicated that the fish community began to recover. Species richness (D’) increased to 22.73, evenness (J’) improved to 0.4602, and diversity (H’) rebounded to 2.573. The dominance effect of the species diminished, as reflected in a Simpson’s λ value of 0.7594. Hill’s N1 and N2 values recovered to 13.11 and 3.999, respectively (Table 3), and the community structure became more balanced, with fish diversity gradually returning to levels similar to those observed before the La Niña event (i.e., in autumn 2021 and spring 2022).

3.3. Distributions of Fish Assemblages

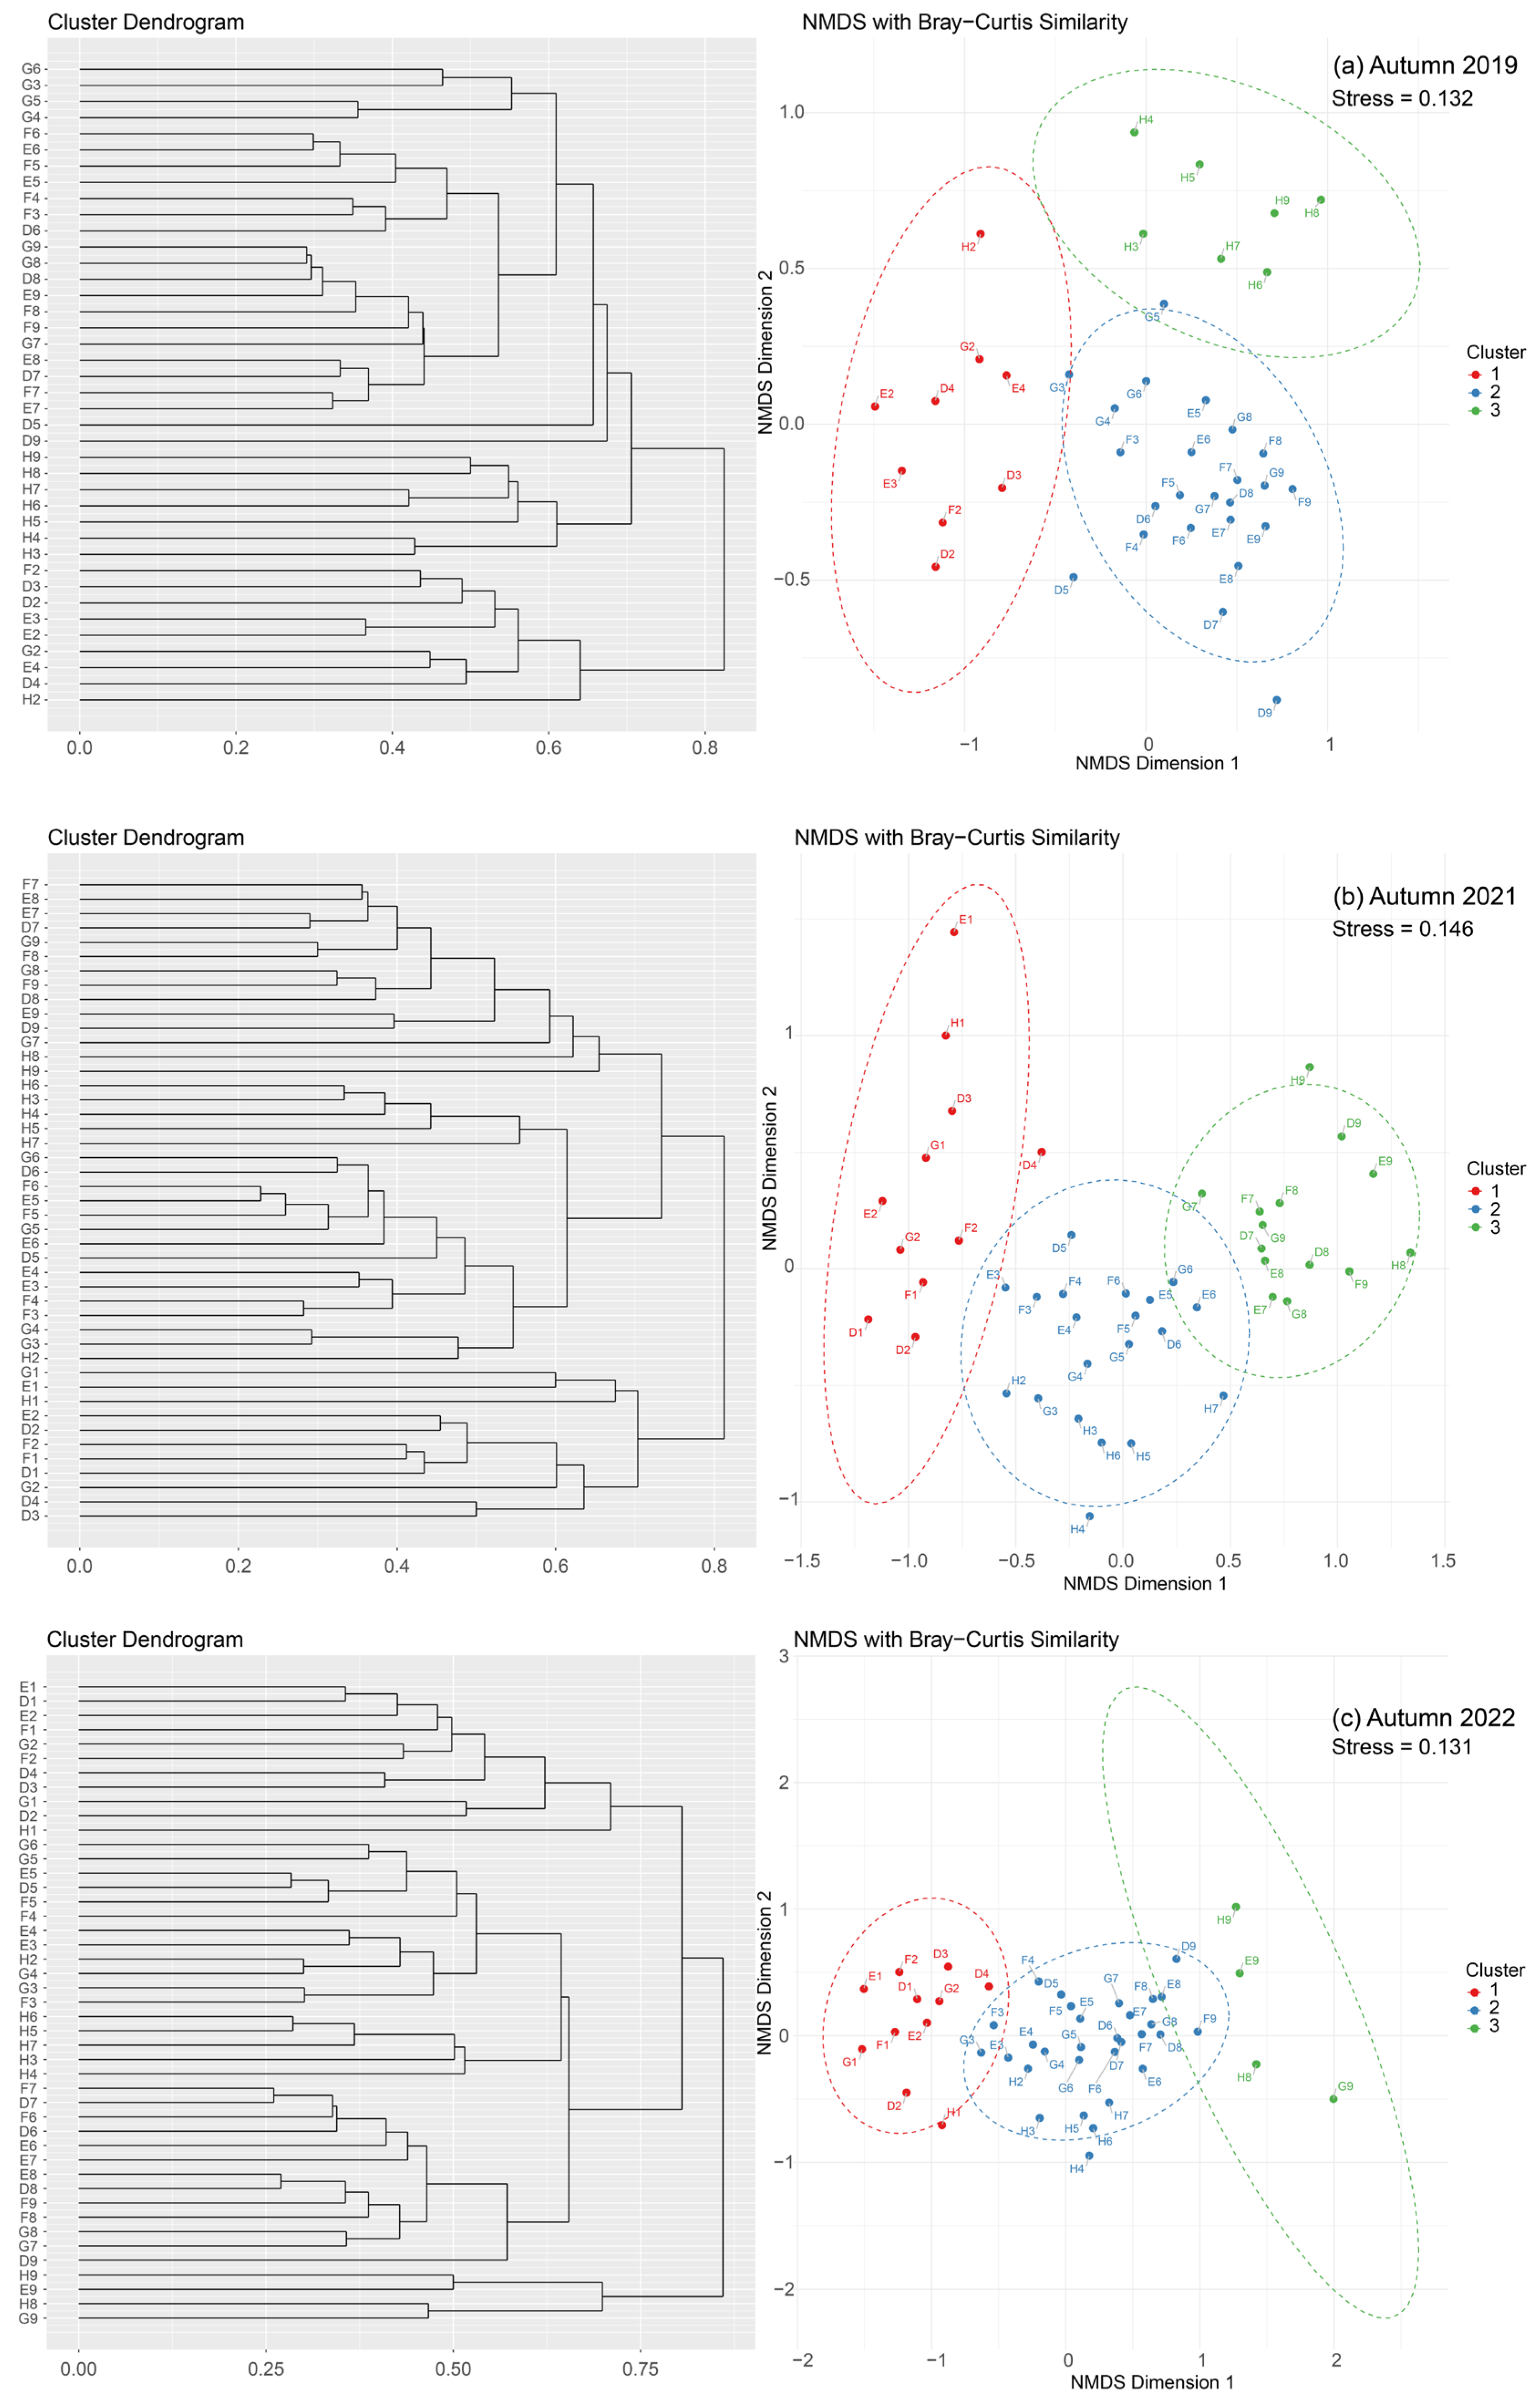
Cluster analysis with NMDS ordination demonstrated both spatial and temporal variations in the fish assemblages. Given that the NMDS stress values for each year were <0.2, the results are considered as statistically meaningful and interpretable (Figure 3 and Figure 4).
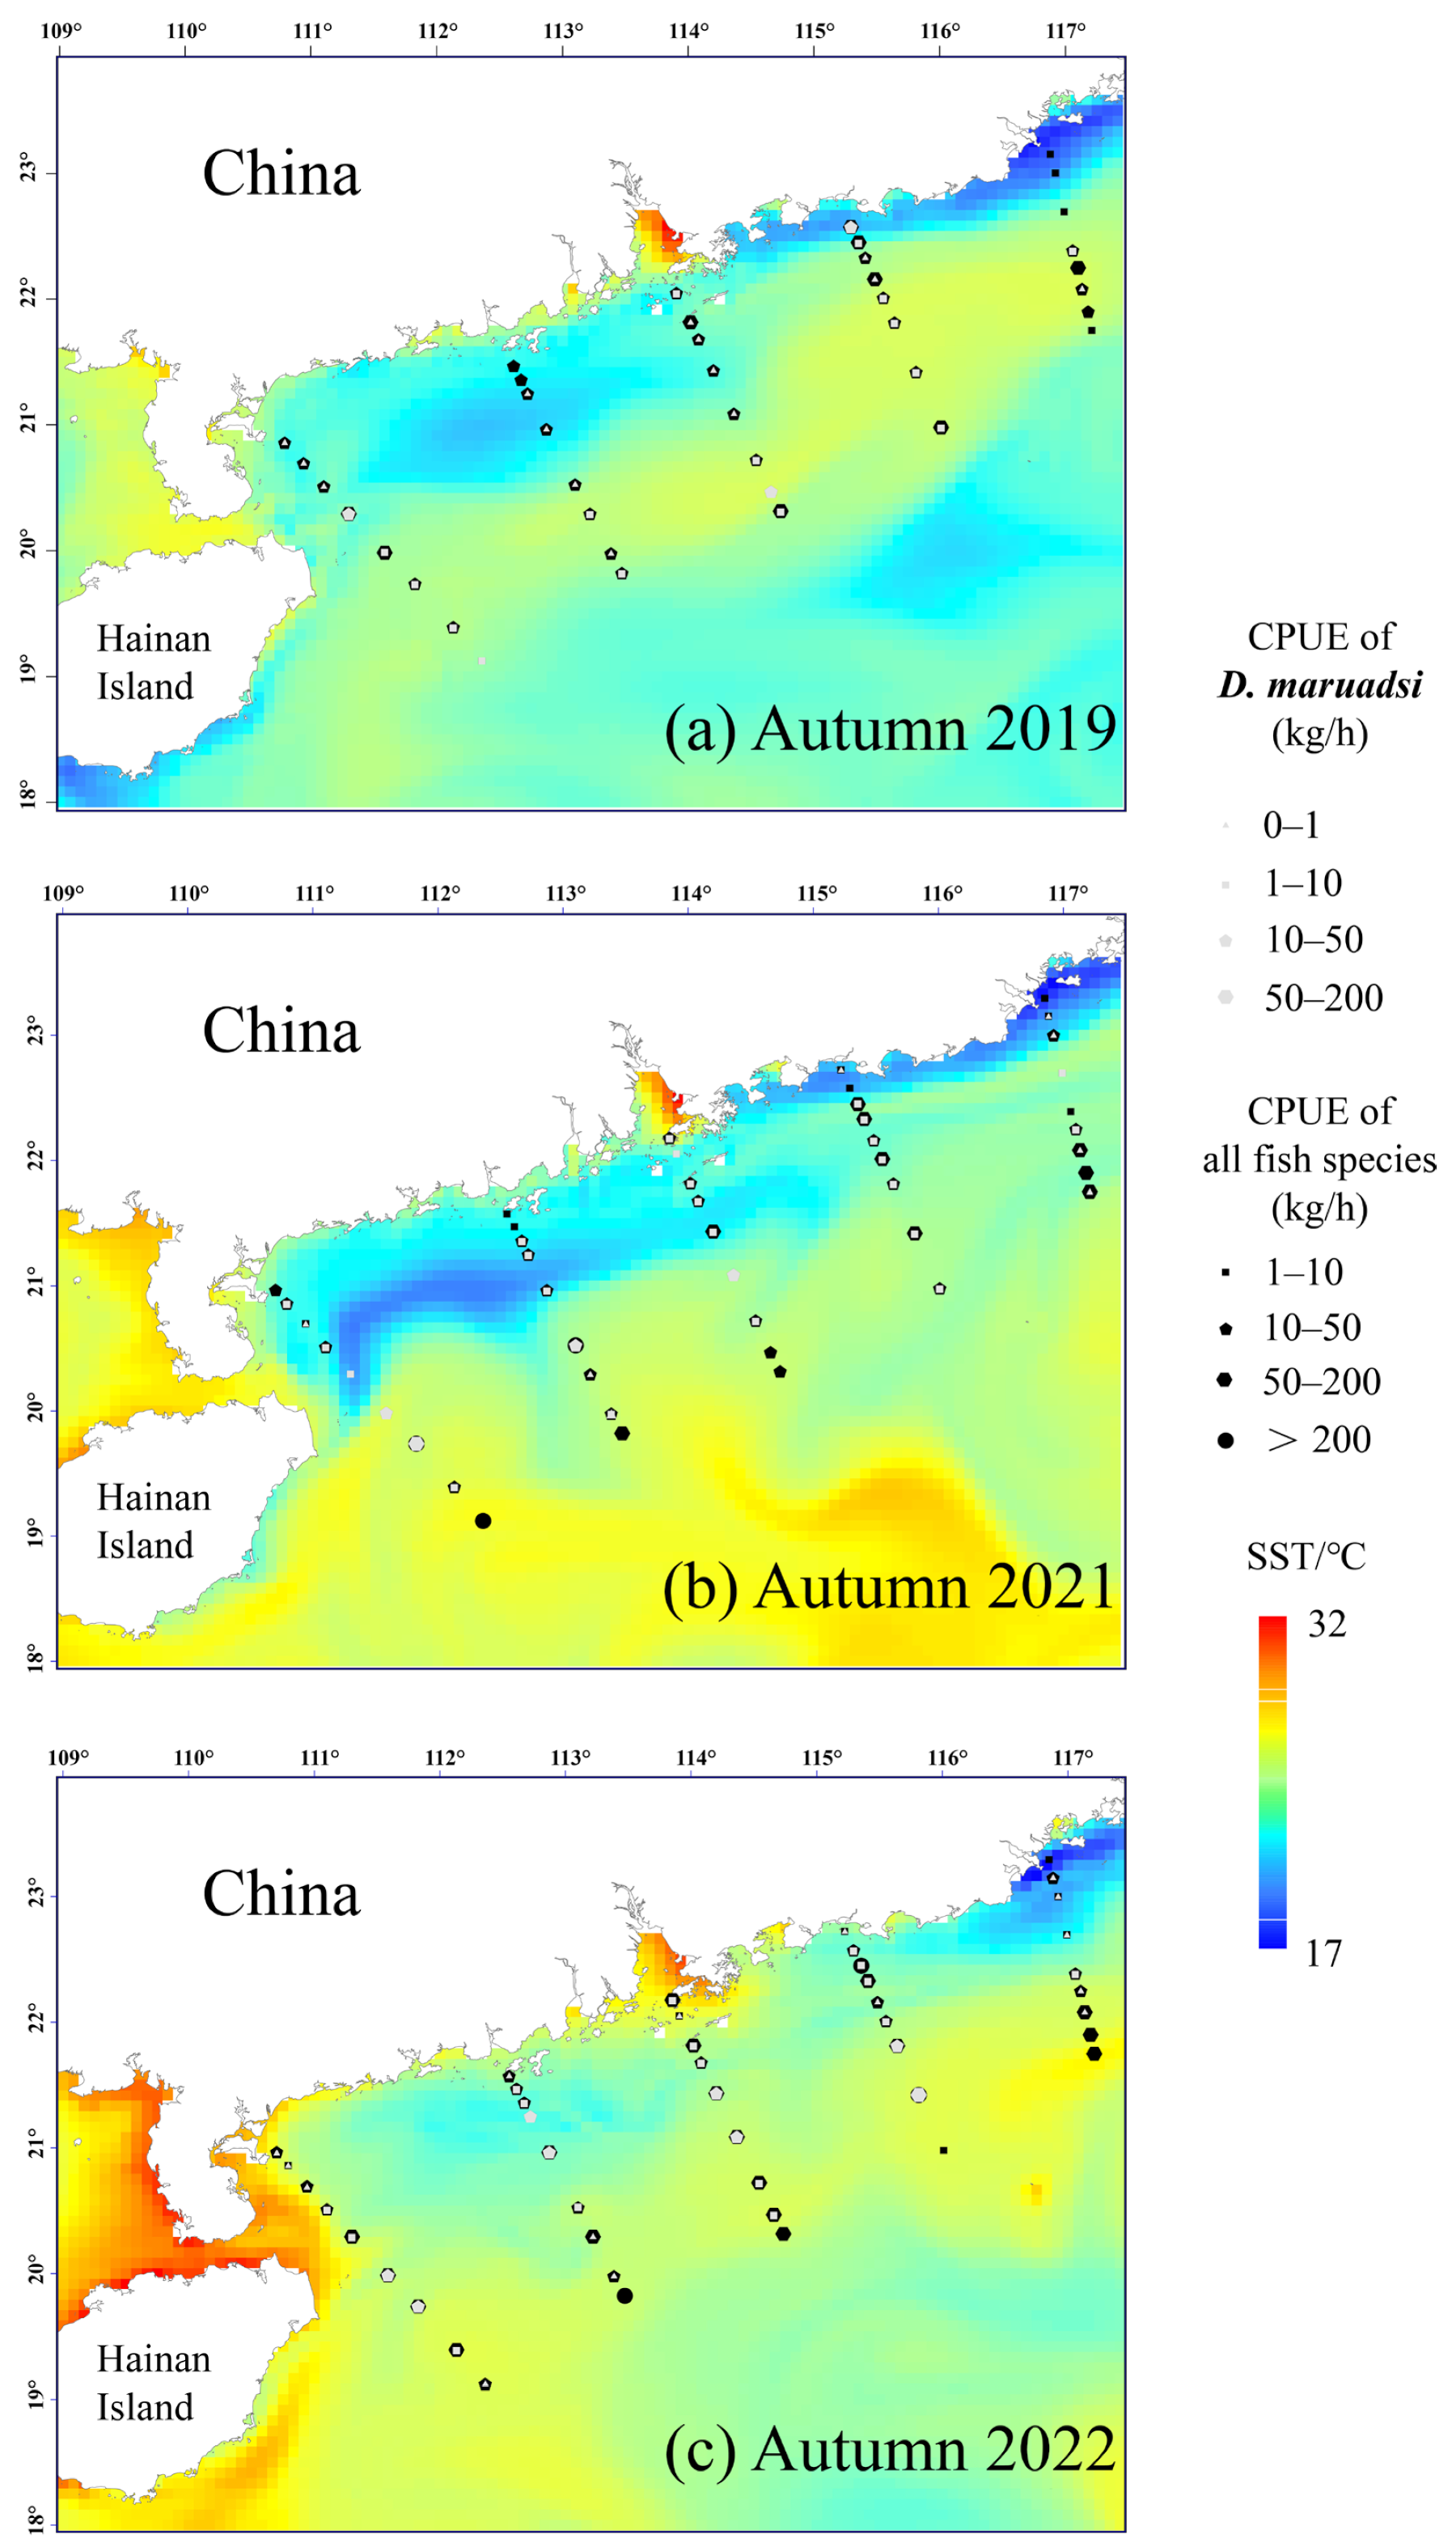
The survey data showed that changes in water temperatures in autumn across different years significantly influenced the fish community distribution. In autumn 2019 (a non-La Niña period), SSTs were relatively high and uniform (ranging from 27.12 °C to 31.79 °C) (Figure 5a), resulting in a concentrated fish community distribution with a more uniform species composition (Figure 3a). In contrast, in autumn 2021 (a La Niña period), the SSTs had slightly decreased (ranging from 26.98 °C to 31.87 °C) (Figure 5b), leading to the manifestation of cold-water effects. This caused the fish community distribution to become more dispersed, with increased heterogeneity (Figure 3b). By autumn 2022 (post La Niña), the SSTs had returned to higher levels (ranging from 28.02 °C to 31.73 °C) (Figure 5c), and the fish community distribution became more concentrated once again, gradually reverting to conditions similar to those in the non-La Niña period (Figure 3c).
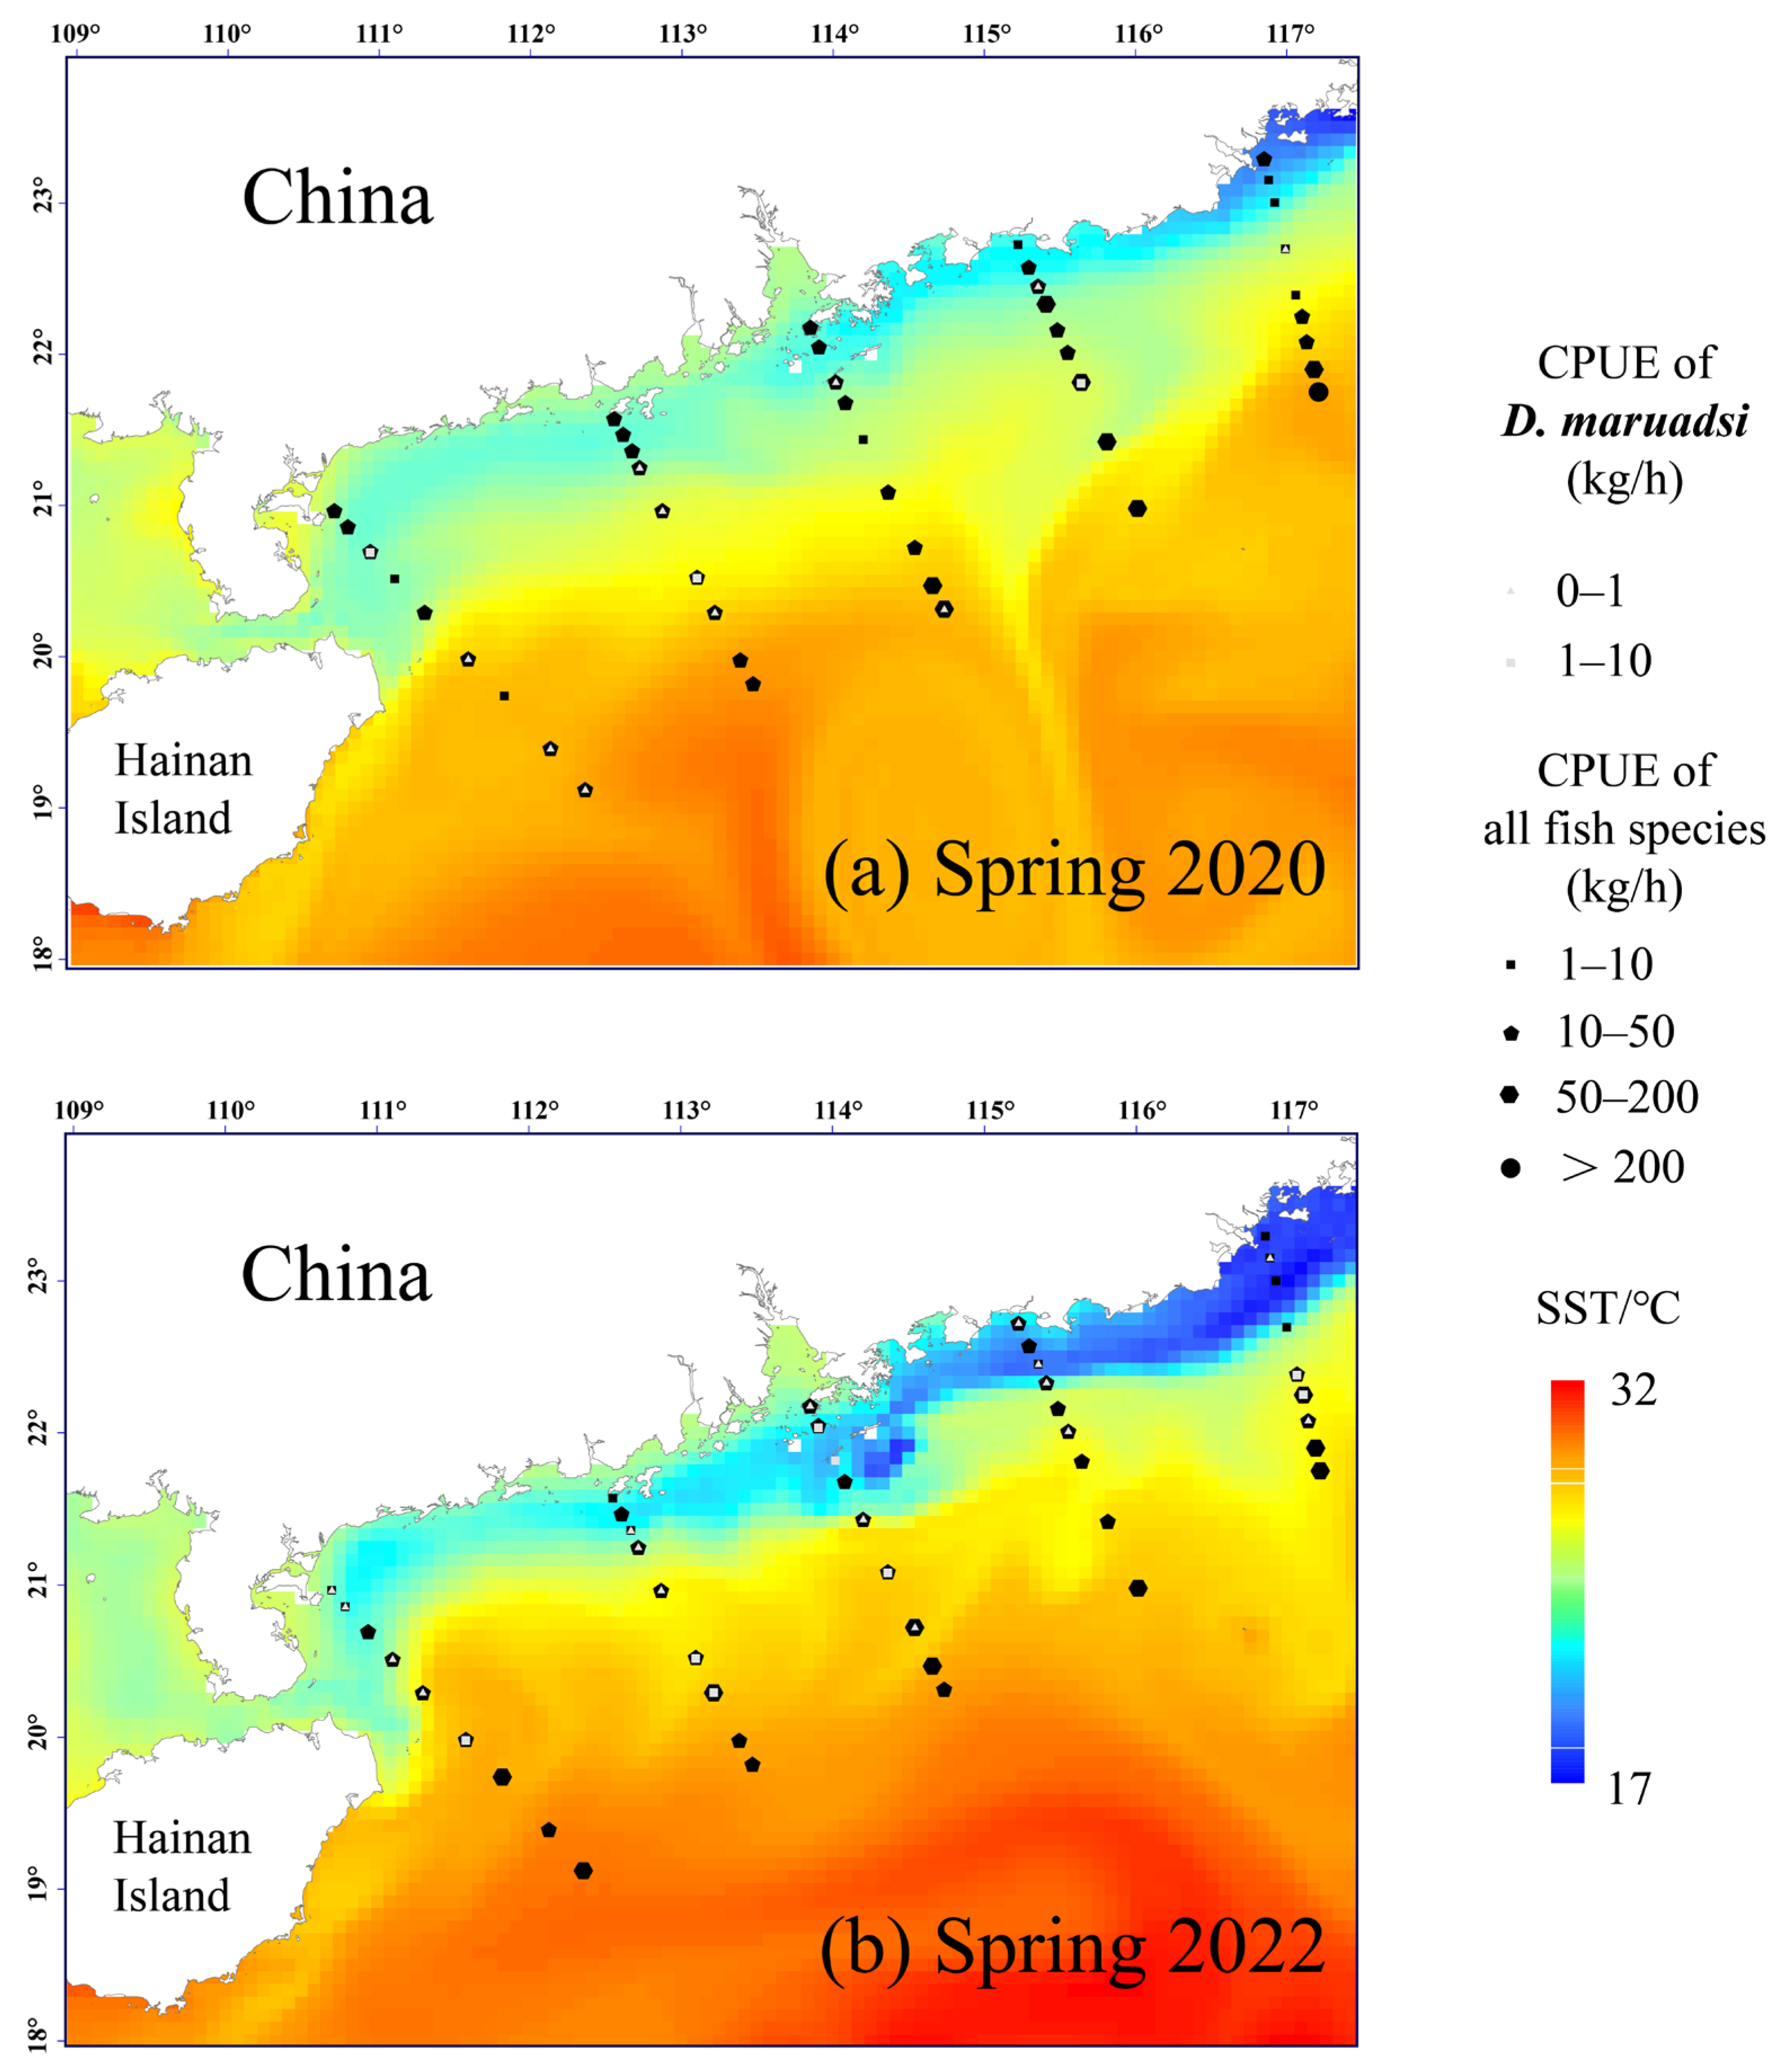
The SSTs were generally lower in spring than in autumn, resulting in a more dispersed fish community distribution. In the spring of 2020 (a non-La Niña period), the SSTs ranged from 17.30 °C to 26.72 °C (Figure 6a), limiting the availability of suitable habitats and increasing variation among the sampling points (Figure 4a). In the spring of 2022 (a La Niña period), the SSTs decreased further (ranging from 17.50 °C to 26.57 °C) (Figure 6b), amplifying the cold-water effects and expanding the fish community’s distribution range (Figure 4b). However, the fish community distribution remained dispersed, with notable local heterogeneity. Overall, the community distribution in spring was influenced by both low temperatures and reproductive behaviors, leading to an expanded distribution range but with a lower spatial concentration.

3.4. Phased Variations in the Fish Density Distribution and Habitat Preferences of D. maruadsi

The total fish density distribution, determined from catch-per-unit-of-effort (CPUE) data, exhibited phased changes between 2019 and 2022. Between autumn 2019 (Figure 5a) and spring 2020 (Figure 6a), the fish density increased slightly. During the autumn of 2021 (Figure 5b), under the influence of La Niña, it rose significantly (t-test: T = −12.222, p = 0.04645). However, by spring 2022 (Figure 6b), the fish density had declined before reaching its highest level in autumn 2022, when SSTs again exceeded 28 °C. Changes in the fish density varied across the different sampling stations. The stations in Zone D recorded a significant increase in fish densities during the La Niña period, whereas the stations in Zones E and F showed an initial rise in fish densities in the autumn of 2021 (Figure 5b), followed by a decline in the autumn of 2022.
In the autumn surveys, the distributional density of D. maruadsi peaked in autumn 2021 (Figure 5b) and remained relatively high, with only minor fluctuations throughout the 2021–2022 La Niña period. This species was primarily concentrated around the stations in Zone D, with particularly high densities recorded at stations D2, D6, and D7; however, the density at station D8 showed a decline in autumn 2022 (Figure 5c).
In the spring surveys, a peak in the D. maruadsi density was observed in spring 2020, which was likely associated with reproductive activities. Thus, the short-term increase in population density would be attributable to the typical increase in the number of juvenile fish during this period.

3.5. SDM Analysis

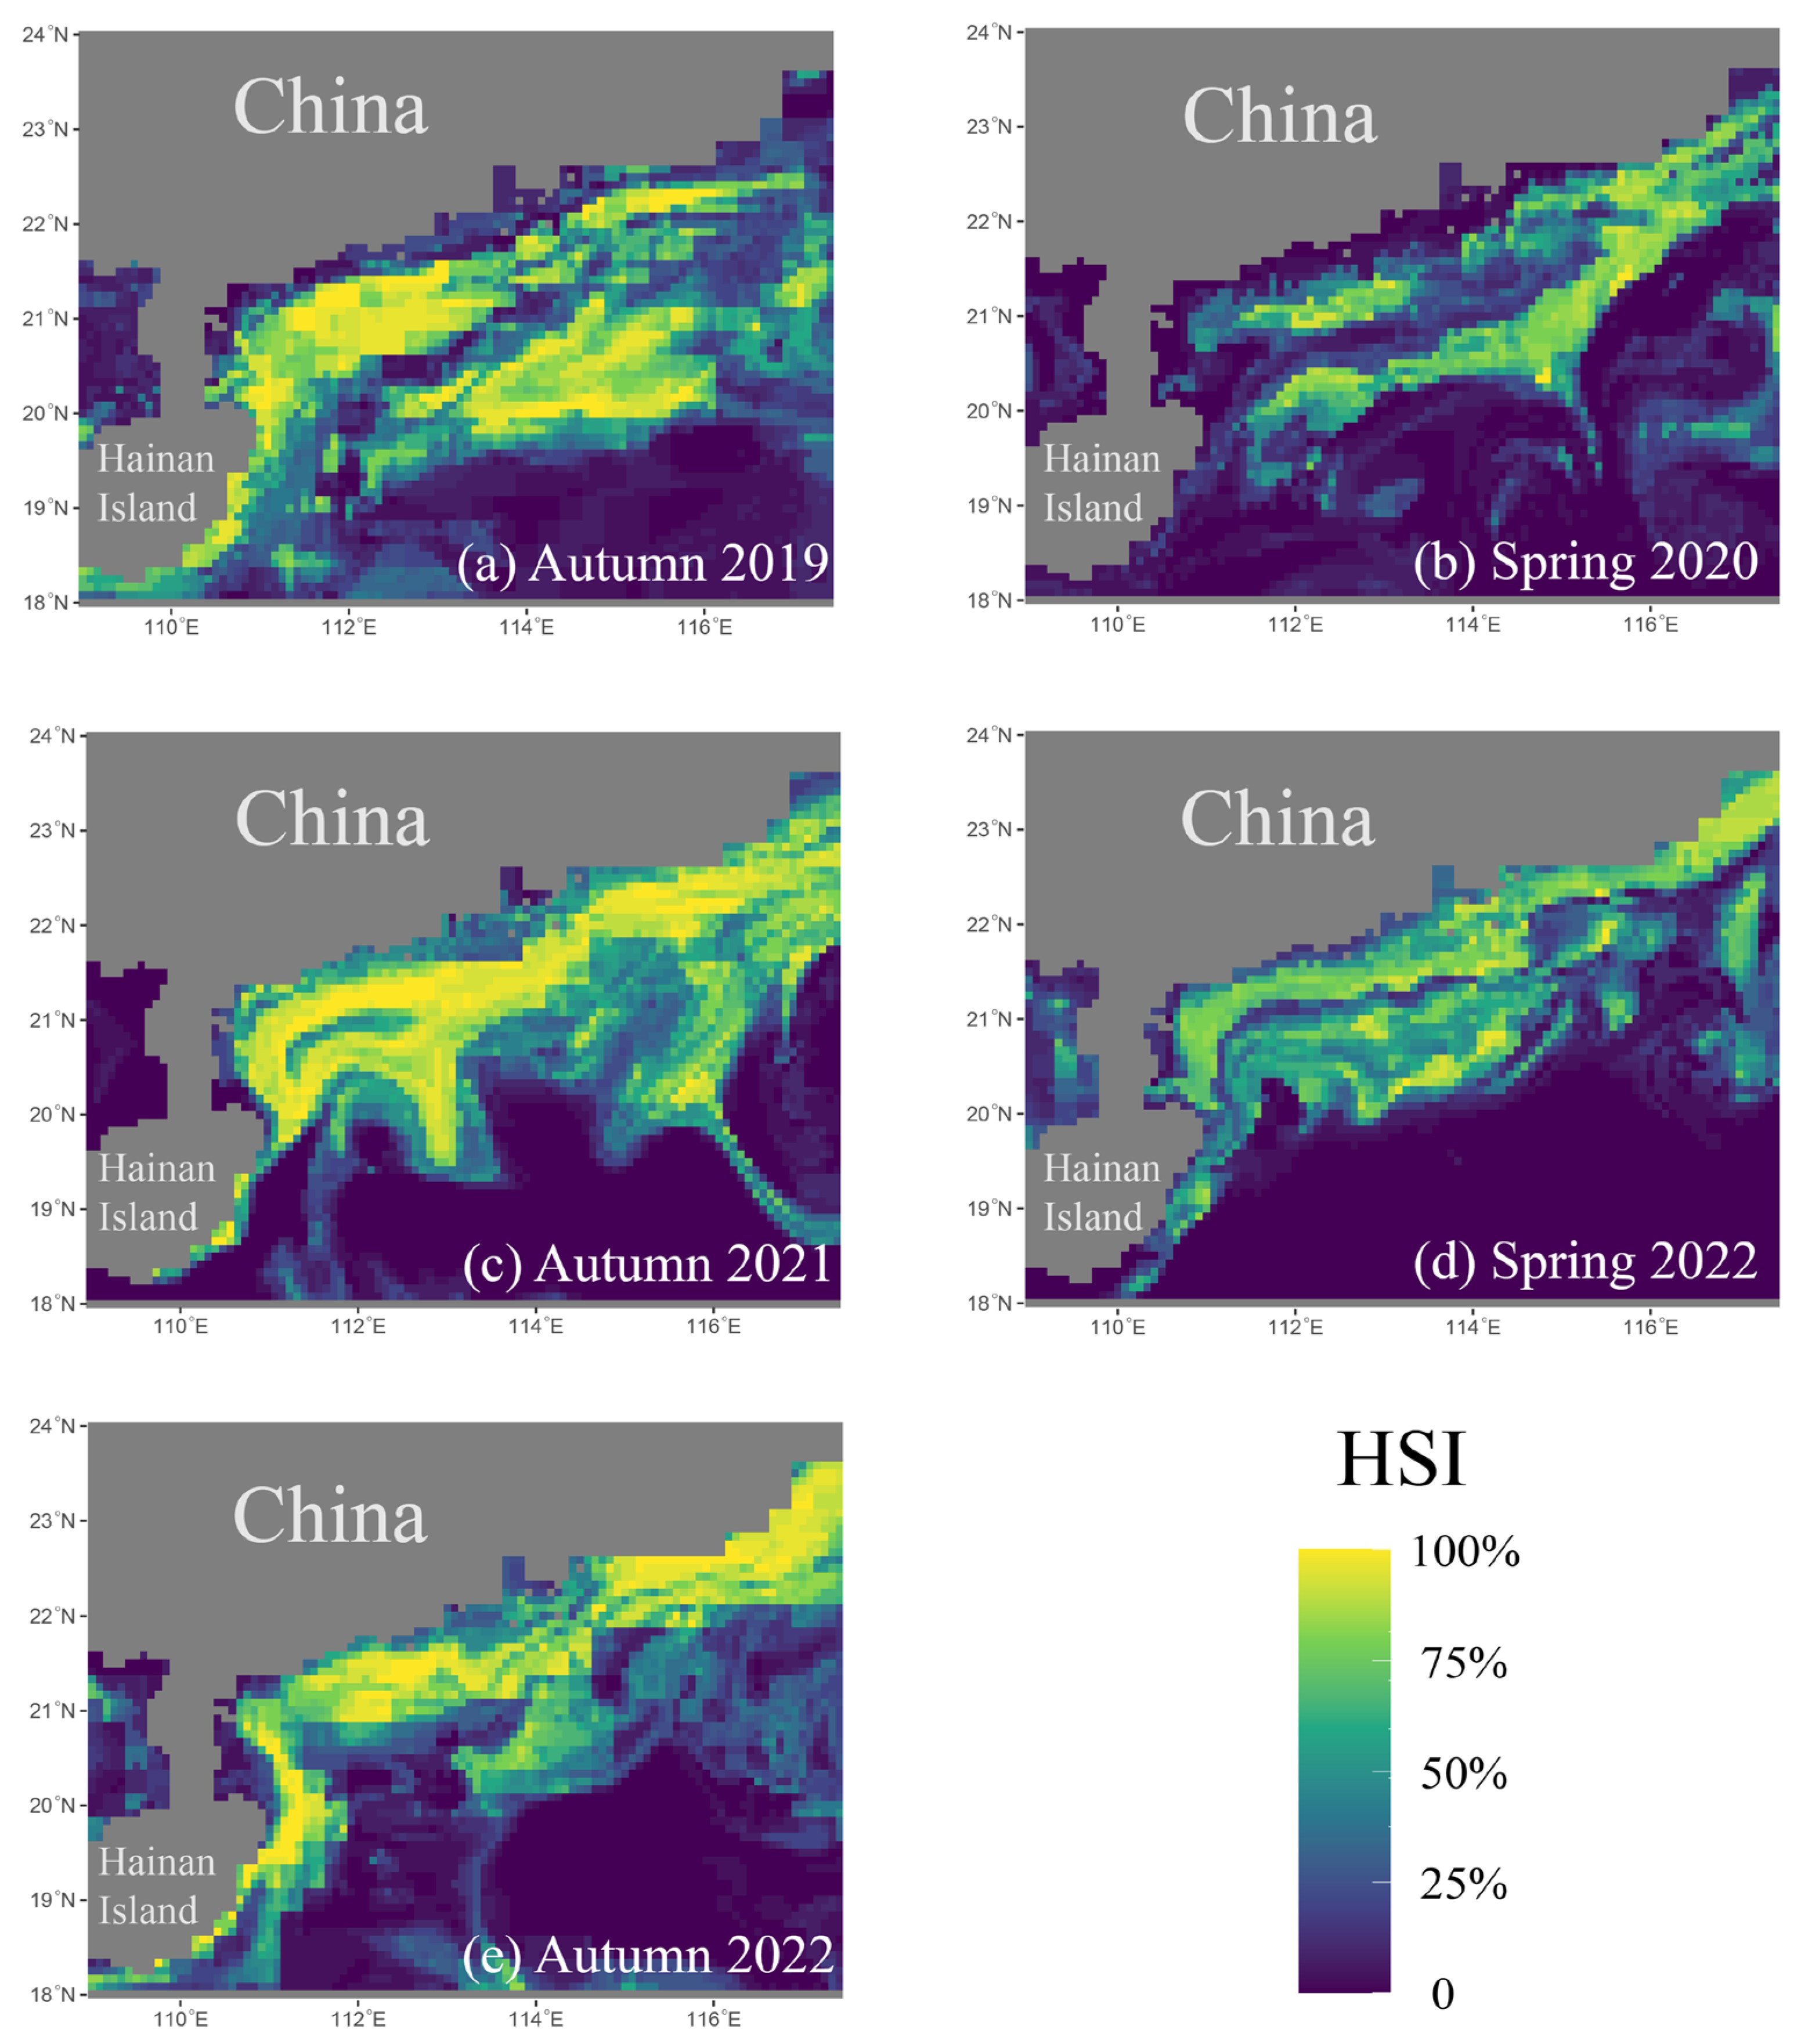
The habitat range of D. maruadsi exhibited marked variations across different years and seasons. The autumn survey data revealed that in autumn 2019 (a non-La Niña period) (Figure 7a), the predicted suitable habitats were relatively concentrated, primarily covering shallow coastal waters between 20–23° N and 112–116° E, with few high-abundance areas (occurrence probability: 75–100%), which only accounted for 11.05% (Figure 8). In autumn 2021 (a La Niña period) (Figure 7c), the habitat distribution expanded significantly, covering the 19–23° N region, and the number of high-abundance areas increased significantly, reaching 19.40%. Moreover, the distribution hotspots extended farther from the coast and onto the continental shelf. By autumn 2022 (a post-La Niña period) (Figure 7e), the range of suitable habitats contracted, with fewer high-abundance areas, but hotspots reappeared in coastal regions.
The spring survey data showed that in spring 2020 (a non-La Niña period) (Figure 7b), the predicted distribution of suitable habitats slightly expanded northward, covering the 23–24° N region, with a few high-abundance areas concentrated between 113 and 114° E. In spring 2022 (a La Niña period) (Figure 7d), the distribution of suitable habitats expanded to 19–23° N, and the proportion of high-abundance areas increased from 5.31% in spring 2020 to 11.34% (Figure 8), concentrated in shallower coastal waters.
Overall, the range of suitable habitats for D. maruadsi expanded significantly during the La Niña period, accompanied by an increase in high-abundance areas, whereas in the post-La Niña period, the range of suitable habitats gradually reverted to that available before the La Niña event.

4. Discussion

4.1. Fish Species Composition and the Dominant Species

Our research indicates that the fish community structure on the NSCS shelf underwent significant seasonal and annual variations between autumn 2019 and autumn 2022. Despite differences in fish species composition during each survey, certain species appeared consistently across all the sampling trips. The presence of these stable fish populations highlights that some species possess strong ecological adaptability and seasonal migratory capabilities [14,17,50].
In the spring surveys, the dominant species were primarily warm-water fish, and no single species dominated. In contrast, the autumn surveys revealed D. maruadsi as a leading species in the autumn fish community, being particularly prominent in 2021 and 2022 [51,52]. La Niña events can significantly impact the biomass, abundance, and distribution of fish communities [14,53]. Specifically, during La Niña, the abundance of warm-water species was significantly greater in spring, suggesting that climate variability may promote their reproduction and distribution by altering ocean temperatures [54,55]. Conversely, the proportion of warm-temperate fishes decreased during La Niña, likely because of rising ocean temperatures limiting their range of suitable habitats [56].
In the autumn surveys, the composition of the dominant species within the fish community changed further. The abundance and ecological importance of D. maruadsi increased significantly, gradually establishing it as a key dominant species [57,58]. The relative abundance and importance of other fish species declined, particularly some traditionally dominant populations, which frequency and abundance decreased in autumn [59]. These changes were likely driven by temperature fluctuations associated with the La Niña event, indicating that climate events directly affect the fish community composition and dynamics [60].
These dynamic changes reflect the high sensitivity of fish communities to climate events, including La Niña [18]. These findings suggest that by altering ocean temperatures and ecological conditions, La Niña may facilitate the expansion of warm-water fish populations while suppressing warm-temperate fish abundance. This phenomenon highlights the ecological response mechanisms of fish communities to climate variability, offering theoretical support for future research on the impacts of climate change on fishery resources [61]. Investigating the mechanisms driving the responses of fish communities on the NSCS shelf to ENSO and other climate-change-related factors is crucial for understanding the dynamic patterns of regional marine ecosystems. Such research provides valuable scientific support for resource management and ecological conservation.

4.2. Impacts of La Niña on the Fish Community Structure and Seasonal Recovery Dynamics

During the non-La Niña periods, the fish community exhibited a relatively stable structure, characterized by high species richness, good evenness, and strong diversity, indicating a healthy ecosystem with balanced species distribution [62]. At this time, interspecific competition was relatively even, and the influence of the dominant species was moderate. However, the onset of the La Niña event significantly affected the community structure, particularly through the introduction of cold-water effects, which led to the gradual expansion of cold-water species [57,63]. Although species richness had peaked in the autumn 2021 survey, the evenness of the species distribution and community diversity had declined markedly, reflecting the overexpansion of a few dominant cold-water species [64].
As the influence of La Niña gradually weakened, the recovery process of fish communities began to take shape. The dominance of cold-water species diminished, while the distribution of warm-water species began to rebound. The community structure gradually returned to a more balanced state. In autumn 2022, the species richness remained high, and the species distribution was more even, indicating that the ecosystem had progressively recovered to the non-La Niña condition [65]. This suggests that fish communities possess a certain level of resilience and adaptive capacity to environmental disturbances [66].
Seasonal changes in water temperature had a significant impact on the fish community distribution, particularly in autumn. In autumn 2019, with relatively high and stable water temperatures, the distribution of fish species was concentrated, and the species composition was relatively uniform [67]. By autumn 2021, during the La Niña event, SSTs had decreased slightly and became more variable, resulting in a more dispersed fish community and greater species heterogeneity [68]. This cold-water effect facilitated the rapid expansion of cold-water species, which established dominance in the community, while warm-water species were suppressed. Consequently, the community diversity and evenness declined [69]. By autumn 2022, when water temperatures recovered to higher levels, the fish community distribution was more concentrated and the species composition more balanced, marking the gradual recovery of the fish community after the La Niña event.
In spring, lower water temperatures contributed to a more dispersed community distribution. Hence, the predicted area of suitable habitats for fish was limited in the spring of 2020, leading to greater spatial differences in the community distribution. By the spring of 2022, when water temperatures had dropped further, the cold-water effect expanded the range of the fish community distribution. However, because of the inhibiting effect of lower temperatures, the fish community remained highly dispersed and exhibited strong spatial heterogeneity [57,70]. Additionally, spring is a peak reproductive season for many species. Therefore, breeding behaviors could have intensified spatial differences in the community distribution, causing a certain degree of imbalance in the community structure [71].
Overall, our results suggest that La Niña had a profound impact on the ecological structure of the fish community on the NSCS shelf, particularly through the expansion of cold-water species, whereas the growth of some warm-water species would have been suppressed, thereby leading to structural imbalances [71]. As the effects of La Niña waned, the fish community gradually recovered in terms of species diversity and evenness, demonstrating strong ecological resilience and adaptive capacity in response to the environmental changes [57].

4.3. Phased Changes in the Fish Distributional Density (CPUE) and Environmental Responses

During the period from autumn 2019 to autumn 2022, the fish density, measured as catches per unit of effort (CPUEs), exhibited distinct phased changes, reflecting the combined effects of environmental conditions and ecological factors on population dynamics. Overall, the total fish density underwent a slight increase between autumn 2019 and spring 2020. However, the autumn 2021 survey showed a significant rise in the fish density, presumably an outcome of La Niña-induced cold-water upwelling, which increases the supply of nutrients [72,73,74]. In spring 2022, the fish density had declined commensurate with a drop in water temperatures but then reached the highest level in autumn 2022, when SSTs exceeded 28 °C. This pattern suggests that fluctuations in temperature and nutrient availability have significant regulatory effects on the fish density. Specifically, nutrient-enriched cold-water upwelling during La Niña enhances phytoplankton production, which indirectly influences fish distributions and densities [14,20,22].
Changes in the fish density also varied across different sampling stations. The stations in Zone D were particularly prone to SST fluctuations, and there was a significant increase in the fish density during La Niña. This indicates that coastal areas are highly sensitive to water temperature changes, which directly affect the extent of suitable habitats and the growth of fish populations [57,75]. In contrast, the stations in Zones E, F, G, and H exhibited relatively stable trends in the fish density. The fish density at these stations showed an increase in autumn 2021 yet a decline in autumn 2022, suggesting that different habitats respond differently to temperature variations. For warm-water species, lower ocean temperatures during La Niña may limit their growth and restrict their distribution [17].
The density of D. maruadsi demonstrated clear seasonal and environmental response characteristics. Specifically, this specie’s density peaked in the autumn 2022 survey, and its density was relatively high with minimal fluctuation throughout the La Niña period [35,72]. This species was primarily concentrated around the stations in Zone D, particularly at stations D2, D6, and D7. These findings highlight the sensitivity of D. maruadsi to temperature and its habitat preference for warmer, shallower coastal areas, underscoring its ecological adaptation as a warm-water species [75].
Despite lower water temperatures during La Niña, D. maruadsi maintained high population densities, indicating a strong tolerance for environmental variability. As mentioned, cold-water nutrient-enriched upwelling would have stimulated phytoplankton growth and provided abundant food resources for D. maruadsi, thereby promoting its population growth and higher density [76,77]. This observation aligns with previous studies suggesting that cold-water upwelling not only lowers SSTs but also enhances primary productivity, thereby improving food availability within the marine food chain [14,21,57].
Additionally, the peak density of D. maruadsi, observed in spring 2020, may be associated with reproductive activities, with an increase in juvenile fish contributing to a short-term rise in the population density [21,78]. This seasonal phenomenon highlights the close relationship between population dynamics and reproductive behavior. During spring, particularly under low-temperature conditions, a preference for breeding in coastal waters may have a significant influence on the spatial distribution of the fish density [20,21]. Nonetheless, despite colder conditions during La Niña, D. maruadsi maintained high densities within suitable habitats, demonstrating its strong adaptability to varying temperature environments.
In summary, variations in the total fish density and the density of D. maruadsi were primarily influenced by multiple factors, including the water temperature, nutrient supply, and reproductive cycles [21,75]. During the La Niña event, cold-water upwelling increased nutrient concentrations, promoting phytoplankton growth and providing abundant food resources for fish populations [60]. However, the lower water temperatures also had an inhibitory effect on certain warm-water species, significantly affecting their distribution and density [33]. D. maruadsi exhibited strong ecological adaptability by maintaining high densities in warmer coastal areas despite greater environmental fluctuations in that region. As water temperatures rose by the autumn of 2022, the total fish density reached its highest level, indicating the capacity of fish communities to recover and adapt following environmental disturbances.

4.4. SDMs for D. maruadsi

The spatial distribution of D. maruadsi in autumn varied markedly across the different years, primarily influenced by SST and cold-water effects. In autumn 2019 (a non-La Niña period), SSTs ranged between 27 °C and 31 °C, with warm-water conditions dominating the habitat distribution of D. maruadsi. At this time, the areas with a high probability of its occurrence were concentrated in the shallow coastal waters, with fewer hotspots and a stable distribution pattern, characteristic of a typical warm-water species [67,75]. In autumn 2021 (a La Niña period), although the SSTs were similar to those recorded in autumn 2019, cold-water effects significantly altered the distribution pattern of D. maruadsi. Areas of predicted suitable habitats expanded farther onto the continental shelf, and the number of high-probability occurrence regions increased substantially [79]. Hotspots were no longer limited to coastal waters but extended to deeper offshore areas. This shift demonstrates the enhanced adaptability D. maruadsi to cold-water conditions, with marked improvement in the extent of suitable habitats [80]. Our SDMs revealed a high frequency of distribution within the 50–100% probability zones during this period. However, in autumn 2022 (a late La Niña period), the SSTs were >28 °C; hence, the influences of the cold-water effects would have diminished. Consequently, the range of suitable habitats for D. maruadsi began to contract, and the number of high-probability occurrence regions decreased [21,79]. Their distribution gradually returned to a pattern similar to that in 2019, with a reduction in the range of suitable habitats but a more-stable population distribution [81].
In spring, the distribution of D. maruadsi was influenced by both the SST and reproductive behavior. In spring 2020 (a non-La Niña period), the SSTs ranged between 17 °C and 26 °C and were <20 °C at the coastal stations [67,80]. The predicted area of suitable habitats was limited, and high-probability occurrence regions were fewer and concentrated near coastal waters [82,83]. By spring 2022 (a La Niña period), cold-water effects further reduced coastal temperatures, expanding the range of suitable habitats to more-distant shallow-sea areas. Although the area of suitable habitats increased, the dispersal effect of the reproductive behavior prevented a significant increase in high-probability occurrence regions. Hotspots remained concentrated in coastal waters. Probability-of-occurrence data suggest that during this period, the area of mid-to-high-probability zones had expanded compared with that in 2020, though the overall population concentration remained low [20,84,85].
Overall, the cold-water effect in autumn substantially expanded the suitable habitats for D. maruadsi, increasing its probability of occurrence across various regions. In the autumn 2021 survey, both the distribution range and the number of high-probability occurrence regions reached their peaks. By autumn 2022, as temperatures recovered, the distribution gradually returned to its non-La Niña state. Similarly, in spring, cold-water effects expanded the range of suitable habitats. However, reproductive behavior caused population dispersal, preventing a significant concentration of high-probability regions. These findings suggest that D. maruadsi exhibits strong ecological adaptability to fluctuations in ocean temperature and flexibility in its reproductive activities. Its adaptive responses were evident during both the La Niña period and the subsequent temperature recovery phases [86].
SDMs are widely used in ecology and biogeography; however, they have several limitations. (1) Many models assume a linear relationship between species and environmental factors, whereas the actual relationships are often more complex, and non-linear interactions may reduce the model performance. (2) The accuracy of these models heavily depends on the selection of appropriate environmental variables. Omitting key variables or including irrelevant ones can substantially impact the results. (3) SDMs often neglect species interactions (such as competition and predation), which play critical roles in real ecosystems. Ignoring these factors can lead to biased predictions. Despite these limitations, SDMs remain an important tool for species distribution predictions, and future research should aim to integrate other approaches to address these shortcomings.

5. Conclusions

This study comprehensively analyzed the dynamics of the fish community structure on the NSCS shelf during a 3-year period (from autumn 2019 to autumn 2022) under varying climatic conditions, with a particular focus on La Niña events. The results demonstrate that climate variability, such as La Niña, substantially affects the composition, distribution, and diversity of fish communities by altering key environmental factors, such as the SST, upwelling intensity, and nutrient availability. During La Niña periods, cold-water effects facilitated the expansion of cold-water species, increasing their ecological dominance. Conversely, warm-water species experienced reduced habitat suitability, leading to reductions in community evenness and diversity. D. maruadsi exhibited strong ecological adaptability, with its distribution expanding significantly during La Niña, along with distinct seasonal fluctuations in its range of suitable habitats and population density. As the influences of La Niña diminished, the fish community showed signs of resilience and recovery. Species evenness and diversity gradually improved, and the dominance of cold-water species decreased, restoring a more-balanced community structure similar to that of pre-La Niña conditions. This recovery process underscores the fish community’s capacity for ecological resilience and self-regulation in response to climate disturbances. Furthermore, our analyses of the SDMs highlight the critical role of key environmental factors, namely, SST, SSS, and DO, in shaping the fish habitat distribution. The models revealed that fish habitats undergo expansion or contraction in response to different phases of climate variability, providing valuable insights for the sustainable management of regional fishery resources. In conclusion, this study emphasizes the profound impacts of climate events on the fish community on the NSCS shelf. We emphasize the need for implementing ecosystem-based, preventive, and adaptive fishery management, highlighting that continued monitoring and research on long-term ecosystem dynamics under climate variability conditions are essential to support sustainable fishery management and ecological conservation in the region.

Author Contributions

Conceptualization, K.Z. and Z.C.; methodology, J.L. and K.Z.; software, J.Z. and Z.L.; validation, J.L. and Z.C.; formal analysis, J.Z. and Z.L.; investigation, J.Z. and Z.L.; resources, Z.C.; writing—original draft preparation, Z.L.; writing—review and editing, K.Z. and Z.C.; funding acquisition, K.Z. and Z.C. All authors have read and agreed to the published version of the manuscript.

Funding

This research was funded by the National Key R&D Program (2024YFD2400400), the Guangdong Basic and Applied Basic Research Foundation (the mechanisms of El Niño and La Niña events on fish community patterns and diversity in Guangdong waters), the Central Public-Interest Scientific Institution Basal Research Fund of the South China Sea Fisheries Research Institute, CAFS (2025RC01), and the Central Public-Interest Scientific Institution Basal Research Fund of the Chinese Academy of Fishery Sciences (2023TD05).

Institutional Review Board Statement

This study was conducted according to the guidelines of the South China Sea Fisheries Research Institute’s Animal Welfare Committee.

Informed Consent Statement

Not applicable.

Data Availability Statement

The datasets used and analyzed during the current study are available from the corresponding author upon reasonable request.

Acknowledgments

The authors thank the captains and crew members who participated in the fishery surveys for their support.

Conflicts of Interest

The authors declare no conflicts of interest.

References

  1. Garcia, A.M.; Vieira, J.; Winemiller, K. Dynamics of the shallow-water fish assemblage of the Patos Lagoon estuary (Brazil) during cold and warm ENSO episodes. J. Fish Biol. 2001, 59, 1218–1238. [Google Scholar] [CrossRef]
  2. Jaureguizar, A.J.; De Wysiecki, A.M.; Camiolo, M.D.; Clara, M.L. Inter-annual fluctuation in the population structure of an estuarine fish: Influence of environmental drivers. J. Marine Syst. 2021, 218, 103526. [Google Scholar] [CrossRef]
  3. Boyce, D.G.; Tittensor, D.P.; Garilao, C.; Henson, S.; Kaschner, K.; Kesner-Reyes, K.; Pigot, A.; Reyes, R.B., Jr.; Reygondeau, G.; Schleit, K.E. A climate risk index for marine life. Nat. Clim. Change 2022, 12, 854–862. [Google Scholar] [CrossRef]
  4. Daly, J.; Knott, C.; Keogh, P.; Singh, G.G. Changing climates in a blue economy: Assessing the climate-responsiveness of Canadian fisheries and oceans policy. Mar. Policy 2021, 131, 104623. [Google Scholar] [CrossRef]
  5. Barber, R.T.; Chávez, F.P. Ocean variability in relation to living resources during the 1982–83 El Niño. Nature 1986, 319, 279–285. [Google Scholar] [CrossRef]
  6. Feng, Z.; Zhang, Y.; Yu, W.; Chen, X. Differences in habitat pattern response to various ENSO events in Trachurus murphyi and Dosidicus gigas located outside the exclusive economic zones of Chile. J. Fish. Sci. China 2021, 28, 1195–1207. [Google Scholar]
  7. Brierley, A.S.; Kingsford, M.J. Impacts of Climate Change on Marine Organisms and Ecosystems. Curr. Biol. 2009, 19, R602–R614. [Google Scholar] [CrossRef]
  8. Poloczanska, E.S.; Burrows, M.T.; Brown, C.J.; García Molinos, J.; Halpern, B.S.; Hoegh-Guldberg, O.; Kappel, C.V.; Moore, P.J.; Richardson, A.J.; Schoeman, D.S. Responses of marine organisms to climate change across oceans. Front. Mar. Sci. 2016, 3, 62. [Google Scholar] [CrossRef]
  9. Allison, E.H.; Bassett, H.R. Climate change in the oceans: Human impacts and responses. Science 2015, 350, 778–782. [Google Scholar] [CrossRef]
  10. Bigg, G.R.; Jickells, T.D.; Liss, P.S.; Osborn, T.J. The role of the oceans in climate. Int. J. Climatol. 2003, 23, 1127–1159. [Google Scholar] [CrossRef]
  11. Yang, T.-Y.; Gao, T.-X.; Meng, W.; Jiang, Y.-L. Genome-wide population structure and genetic diversity of Japanese whiting (Sillago japonica) inferred from genotyping-by-sequencing (GBS): Implications for fisheries management. Fish. Res. 2020, 225, 105501. [Google Scholar] [CrossRef]
  12. Bolin, J.A.; Schoeman, D.S.; Evans, K.J.; Cummins, S.F.; Scales, K.L. Achieving sustainable and climate-resilient fisheries requires marine ecosystem forecasts to include fish condition. Fish Fish. 2021, 22, 1067–1084. [Google Scholar] [CrossRef]
  13. Philander, S.G.H. El Nino southern oscillation phenomena. Nature 1983, 302, 295–301. [Google Scholar] [CrossRef]
  14. Li, M.; Xu, Y.; Sun, M.; Li, J.; Zhou, X.; Chen, Z.; Zhang, K. Impacts of strong ENSO events on fish communities in an overexploited ecosystem in the South China Sea. Biology 2023, 12, 946. [Google Scholar] [CrossRef] [PubMed]
  15. Andreotti, G.F.; Alves, J.C.; Alves, D.C.; Agostinho, A.A.; Gomes, L.C. The response of fish functional diversity to the El Niño Southern Oscillation (ENSO) in a Neotropical floodplain. Hydrobiologia 2021, 848, 1207–1218. [Google Scholar] [CrossRef]
  16. Lehodey, P.; Bertrand, A.; Hobday, A.; Kiyofuji, H.; McClatchie, S.; Menkes, C.; Pilling, G.; Polovina, J.; Tommasi, D. El Niño Southern Oscillation in a Changing Climate. Hydrobiologia 2020, 2, 429–451. [Google Scholar] [CrossRef]
  17. Hu, W.; Du, J.; Su, S.; Tan, H.; Yang, W.; Ding, L.; Dong, P.; Yu, W.; Zheng, X.; Chen, B. Effects of climate change in the seas of China: Predicted changes in the distribution of fish species and diversity. Ecol. Indic. 2022, 134, 108489. [Google Scholar] [CrossRef]
  18. Kang, B.; Pecl, G.T.; Lin, L.; Sun, P.; Zhang, P.; Li, Y.; Zhao, L.; Peng, X.; Yan, Y.; Shen, C. Climate change impacts on China’s marine ecosystems. Rev. Fish Biol. Fish. 2021, 31, 599–629. [Google Scholar] [CrossRef]
  19. Xu, Y.; Zhang, P.; Panhwar, S.K.; Li, J.; Yan, L.; Chen, Z.; Zhang, K. The initial assessment of an important pelagic fish, Mackerel Scad, in the South China Sea using data-poor length-based methods. Mar. Coast. Fish. 2023, 15, e210258. [Google Scholar] [CrossRef]
  20. Xiong, P.; Cai, Y.; Jiang, P.; Xu, Y.; Sun, M.; Fan, J.; Chen, Z. Impact of climate change on the distribution of Trachurus japonicus in the northern South China Sea. Ecol. Indic. 2024, 160, 111758. [Google Scholar] [CrossRef]
  21. Zhang, K.; Li, M.; Li, J.; Sun, M.; Xu, Y.; Cai, Y.; Chen, Z.; Qiu, Y. Climate-induced small pelagic fish blooms in an overexploited marine ecosystem of the South China Sea. Ecol. Indic. 2022, 145, 109598. [Google Scholar] [CrossRef]
  22. Li, M.; Xu, Y.; Sun, M.; Fan, J.; Li, J.; Zhang, K.; Chen, Z. Variation in fish community structure in Beibu Gulf before and after La Niña event. South China Fish. Sci. 2023, 19, 1–11. [Google Scholar]
  23. Tkachenko, K.S.; Hoang, D.T.; Dang, H.N. Ecological status of coral reefs in the Spratly Islands, South China Sea (East Sea) and its relation to thermal anomalies. Estuar. Coast. Shelf Sci. 2020, 238, 106722. [Google Scholar] [CrossRef]
  24. Cai, R.; Guo, H.; Fu, D.; Yan, X.; Tan, H. Response and adaptation to climate change in the South China Sea and Coral Sea. In Climate Change Adaptation in Pacific Countries: Fostering Resilience and Improving the Quality of Life; Leal Filho, W., Ed.; Springer: Cham, Switzerland, 2017; pp. 163–176. [Google Scholar] [CrossRef]
  25. Lyu, Y.; Zhou, Z.; Zhang, Y.; Chen, Z.; Deng, W.; Shi, R. The mass coral bleaching event of inshore corals form South China Sea witnessed in 2020: Insight into the causes, process and consequence. Coral Reefs 2022, 41, 1351–1364. [Google Scholar] [CrossRef]
  26. Guisan, A.; Thuiller, W. Predicting species distribution: Offering more than simple habitat models. Ecol. Lett. 2005, 8, 993–1009. [Google Scholar] [CrossRef] [PubMed]
  27. Srivastava, V.; Lafond, V.; Griess, V.C. Species distribution models (SDM): Applications, benefits and challenges in invasive species management. CABI Rev. 2019, 2019, 1–13. [Google Scholar] [CrossRef]
  28. Wisz, M.S.; Pottier, J.; Kissling, W.D.; Pellissier, L.; Lenoir, J.; Damgaard, C.F.; Dormann, C.F.; Forchhammer, M.C.; Grytnes, J.A.; Guisan, A. The role of biotic interactions in shaping distributions and realised assemblages of species: Implications for species distribution modelling. Biol. Rev. 2013, 88, 15–30. [Google Scholar] [CrossRef]
  29. Santini, L.; Benítez-López, A.; Maiorano, L.; Čengić, M.; Huijbregts, M.A. Assessing the reliability of species distribution projections in climate change research. Divers. Distrib. 2021, 27, 1035–1050. [Google Scholar] [CrossRef]
  30. Grenouillet, G.; Buisson, L.; Casajus, N.; Lek, S. Ensemble modelling of species distribution: The effects of geographical and environmental ranges. Ecography 2011, 34, 9–17. [Google Scholar] [CrossRef]
  31. Robinson, L.; Elith, J.; Hobday, A.; Pearson, R.; Kendall, B.; Possingham, H.; Richardson, A. Pushing the limits in marine species distribution modelling: Lessons from the land present challenges and opportunities. Glob. Ecol. Biogeogr. 2011, 20, 789–802. [Google Scholar] [CrossRef]
  32. Brodie, S. Integrating dynamic subsurface habitat metrics into species distribution models. Front. Mar. Sci 2018, 5, 219. [Google Scholar] [CrossRef]
  33. Fromentin, J.-M.; Stemmann, L.; Demarcq, H.; Estournel, C.; Saraux, C. Concomitant changes in the environment and small pelagic fish community of the Gulf of Lions. Prog. Oceanogr. 2020, 186, 102375. [Google Scholar] [CrossRef]
  34. Pincinato, R.B.M.; Asche, F.; Oglend, A. Climate change and small pelagic fish price volatility. Clim. Change 2020, 161, 591–599. [Google Scholar] [CrossRef]
  35. Albo-Puigserver, M.; Pennino, M.G.; Bellido, J.M.; Colmenero, A.I.; Giráldez, A.; Hidalgo, M.; Gabriel Ramírez, J.; Steenbeek, J.; Torres, P.; Cousido-Rocha, M. Changes in life history traits of small pelagic fish in the Western Mediterranean Sea. Front. Mar. Sci. 2021, 8, 570354. [Google Scholar] [CrossRef]
  36. Pinkas, L.; Oliphant, M.S.; Iverson, I.L.K. Fish Bulletin 152. Food Habits of Albacore, Bluefin Tuna and Bonito in Californian Waters; Scripps Digital Collection: San Diego, CA, USA, 1971; pp. 11–105. [Google Scholar]
  37. Gu, D.E.; Yu, F.D.; Hu, Y.C.; Wang, J.W.; Xu, M.; Mu, X.D.; Yang, Y.X.; Luo, D.; Wei, H.; Shen, Z.X.; et al. The Species Composition and Distribution Patterns of Non-Native Fishes in the Main Rivers of South China. Sustainability 2020, 12, 4566. [Google Scholar] [CrossRef]
  38. Simpson, E.H. Measurement of Diversity. Nature 1949, 163, 688. [Google Scholar] [CrossRef]
  39. Hill, T.C.J.; Walsh, K.A.; Harris, J.A.; Moffett, B.F. Using ecological diversity measures with bacterial communities. FEMS Microbiol. Ecol. 2003, 43, 1–11. [Google Scholar] [CrossRef]
  40. Margalef, R. Information theory in ecology. Gen. Syst. 1958, 3, 36–71. [Google Scholar] [CrossRef]
  41. Pielou, E.C. Species-diversity and pattern-diversity in the study of ecological succession. J. Theor. Biol. 1966, 10, 370–383. [Google Scholar] [CrossRef]
  42. Wilhm, J.L. Use of biomass units in Shannon’s formula. Ecology 1968, 49, 153–156. [Google Scholar] [CrossRef]
  43. Lima, A.R.; Baltazar-Soares, M.; Garrido, S.; Riveiro, I.; Carrera, P.; Piecho-Santos, A.M.; Peck, M.A.; Silva, G. Forecasting shifts in habitat suitability across the distribution range of a temperate small pelagic fish under different scenarios of climate change. Sci. Total Environ. 2022, 804, 150167. [Google Scholar] [CrossRef] [PubMed]
  44. Chen, Y.; Shan, X.; Gorfine, H.; Dai, F.; Wu, Q.; Yang, T.; Shi, Y.; Jin, X. Ensemble projections of fish distribution in response to climate changes in the Yellow and Bohai Seas, China. Ecol. Indic. 2023, 146, 109759. [Google Scholar] [CrossRef]
  45. Fujiwara, M.; Martinez-Andrade, F.; Wells, R.D.; Fisher, M.; Pawluk, M.; Livernois, M.C. Climate-related factors cause changes in the diversity of fish and invertebrates in subtropical coast of the Gulf of Mexico. Commun. Biol. 2019, 2, 403. [Google Scholar] [CrossRef]
  46. Yang, W.; Hu, W.; Chen, B.; Tan, H.; Su, S.; Ding, L.; Dong, P.; Yu, W.; Du, J. Impact of climate change on potential habitat distribution of Sciaenidae in the coastal waters of China. Acta Oceanol. Sin. 2023, 42, 59–71. [Google Scholar] [CrossRef]
  47. Fan, J.; Chen, Z.; Feng, X.; Yu, W. Climate-related changes in seasonal habitat pattern of Sthenoteuthis oualaniensis in the South China Sea. Ecosyst. Health Sustain. 2021, 7, 1926338. [Google Scholar] [CrossRef]
  48. Arabameri, A.; Saha, S.; Roy, J.; Chen, W.; Blaschke, T.; Tien Bui, D. Landslide susceptibility evaluation and management using different machine learning methods in the Gallicash River Watershed, Iran. Remote. Sens. 2020, 12, 475. [Google Scholar] [CrossRef]
  49. Duan, R.-Y.; Kong, X.-Q.; Huang, M.-Y.; Fan, W.-Y.; Wang, Z.-G. The predictive performance and stability of six species distribution models. PLoS ONE 2014, 9, e112764. [Google Scholar] [CrossRef]
  50. Hipfner, J.M.; Galbraith, M.; Bertram, D.F.; Green, D.J. Basin-scale oceanographic processes, zooplankton community structure, and diet and reproduction of a sentinel North Pacific seabird over a 22-year period. Prog. Oceanogr. 2020, 182, 102290. [Google Scholar] [CrossRef]
  51. Hixon, M. Tropical and temperate reef fishes: Comparison of community structures. In The Ecology of Fishes on Coral Reefs; Sale, P.F., Ed.; Academic Press: London, UK, 1991; pp. 509–563. [Google Scholar] [CrossRef]
  52. Jin, X.; Tang, Q. Changes in fish species diversity and dominant species composition in the Yellow Sea. Fish. Res. 1996, 26, 337–352. [Google Scholar] [CrossRef]
  53. Sugimoto, T.; Kimura, S.; Tadokoro, K. Impact of El Niño events and climate regime shift on living resources in the western North Pacific. Prog. Oceanogr. 2001, 49, 113–127. [Google Scholar] [CrossRef]
  54. Yu, W.; Chen, X.; Yi, Q.; Gao, G.; Chen, Y. Impacts of climatic and marine environmental variations on the spatial distribution of Ommastrephes bartramii in the Northwest Pacific Ocean. Acta Oceanol. Sin. 2016, 35, 108–116. [Google Scholar] [CrossRef]
  55. Lonhart, S.I.; Jeppesen, R.; Beas-Luna, R.; Crooks, J.A.; Lorda, J. Shifts in the distribution and abundance of coastal marine species along the eastern Pacific Ocean during marine heatwaves from 2013 to 2018. Mar. Biodivers. Rec. 2019, 12, 13. [Google Scholar] [CrossRef]
  56. Yang, W.; Zheng, S.-Z.; Zhou, S.-H.; Zhao, L.; Zhu, J.-Y.; Lukwambe, B.; Nicholaus, R.; Li, C.-H.; Zheng, Z.-M. Structure and functional diversity of surface bacterioplankton communities in an overwintering habitat for large yellow croaker, Pseudosciaena crocea, of the Southern East China Sea. Front. Mar. Sci. 2020, 7, 472. [Google Scholar] [CrossRef]
  57. Zhang, K.; Guo, J.; Xu, Y.; Jiang, Y.e.; Chen, Z. Long-term variations in fish community structure under multiple stressors in a semi-closed marine ecosystem in the South China Sea. Sci. Total Environ. 2020, 745, 140892. [Google Scholar] [CrossRef]
  58. Huang, M.; Chen, Y.; Zhou, W.; Wei, F. Assessing the response of marine fish communities to climate change and fishing. Conserv. Biol. 2024, 38, e14291. [Google Scholar] [CrossRef]
  59. Chen, Z.; Ren, Q.; Liu, C.; Xian, W. Seasonal and spatial variations in fish assemblage in the Yangtze estuary and adjacent waters and their relationship with environmental factors. J. Mar. Sci. Eng. 2022, 10, 1679. [Google Scholar] [CrossRef]
  60. Hsiao, P.-Y.; Lan, K.-W.; Lee, W.-H.; Liang, T.-Y.; Liao, C.-H.; Su, N.-J. Impacts of El Niño–Southern Oscillation (ENSO) Events on Trophodynamic Structure and Function in Taiwan Bank Marine Ecosystem. Diversity 2024, 16, 572. [Google Scholar] [CrossRef]
  61. Shi, Y.; Wang, J.; Zuo, T.; Shan, X.; Jin, X.; Sun, J.; Yuan, W.; Pakhomov, E.A. Seasonal changes in zooplankton community structure and distribution pattern in the Yellow Sea, China. Front. Mar. Sci. 2020, 7, 391. [Google Scholar] [CrossRef]
  62. Wernberg, T.; Smale, D.A.; Tuya, F.; Thomsen, M.S.; Langlois, T.J.; De Bettignies, T.; Bennett, S.; Rousseaux, C.S. An extreme climatic event alters marine ecosystem structure in a global biodiversity hotspot. Nat. Clim. Change 2013, 3, 78–82. [Google Scholar] [CrossRef]
  63. Chaikin, S.; Dubiner, S.; Belmaker, J. Cold-water species deepen to escape warm water temperatures. Glob. Ecol. Biogeogr. 2022, 31, 75–88. [Google Scholar] [CrossRef]
  64. Tonkin, J.D.; Bogan, M.T.; Bonada, N.; Rios-Touma, B.; Lytle, D.A. Seasonality and predictability shape temporal species diversity. Ecology 2017, 98, 1201–1216. [Google Scholar] [CrossRef] [PubMed]
  65. Sánchez-Caballero, C.; Borges-Souza, J.; Ferse, S. Rocky reef fish community composition remains stable throughout seasons and El Niño/La Niña events in the southern Gulf of California. J. Sea Res. 2019, 146, 55–62. [Google Scholar] [CrossRef]
  66. Moore, J.W.; Schindler, D.E. Getting ahead of climate change for ecological adaptation and resilience. Science 2022, 376, 1421–1426. [Google Scholar] [CrossRef]
  67. Santiago, J.M.; Muñoz-Mas, R.; Solana-Gutiérrez, J.; Garcia de Jalon, D.; Alonso, C.; Martínez-Capel, F.; Pórtoles, J.; Monjo, R.; Ribalaygua, J. Waning habitats due to climate change: The effects of changes in streamflow and temperature at the rear edge of the distribution of a cold-water fish. Hydrol. Earth Syst. Sci. 2017, 21, 4073–4101. [Google Scholar] [CrossRef]
  68. Paes, E.T.; Moraes, L.d.S. A new hypothesis on the influence of the El Niño/La Niña upon the biological productivity, ecology and fisheries of the Southern Brazilian Bight. Pan-Am. J. Aquat. Sci. 2007, 2, 94–102. [Google Scholar]
  69. Daufresne, M.; Boet, P. Climate change impacts on structure and diversity of fish communities in rivers. Glob. Change Biol. 2007, 13, 2467–2478. [Google Scholar] [CrossRef]
  70. Sims, D.W.; Wearmouth, V.J.; Genner, M.J.; Southward, A.J.; Hawkins, S.J. Low-temperature-driven early spawning migration of a temperate marine fish. J. Anim. Ecol. 2004, 73, 333–341. [Google Scholar] [CrossRef]
  71. Badjeck, M.-C.; Allison, E.H.; Halls, A.S.; Dulvy, N.K. Impacts of climate variability and change on fishery-based livelihoods. Mar. Policy 2010, 34, 375–383. [Google Scholar] [CrossRef]
  72. Takasuka, A. Biological mechanisms underlying climate impacts on population dynamics of small pelagic fish. In Fish Population Dynamics, Monitoring, and Management: Sustainable Fisheries in the Eternal Ocean; Tsukamoto, K., Kawamura, T., Takeuchi, T., Beard, T.D., Jr., Kaiser, M.J., Eds.; Springer: Tokyo, Japan, 2018; pp. 19–50. [Google Scholar] [CrossRef]
  73. Ottersen, G.; Kim, S.; Huse, G.; Polovina, J.J.; Stenseth, N.C. Major pathways by which climate may force marine fish populations. J. Mar. Syst. 2010, 79, 343–360. [Google Scholar] [CrossRef]
  74. Peck, M.A.; Reglero, P.; Takahashi, M.; Catalán, I.A. Life cycle ecophysiology of small pelagic fish and climate-driven changes in populations. Prog. Oceanogr. 2013, 116, 220–245. [Google Scholar] [CrossRef]
  75. Freitas, C.; Olsen, E.M.; Knutsen, H.; Albretsen, J.; Moland, E. Temperature-associated habitat selection in a cold-water marine fish. J. Anim. Ecol. 2016, 85, 628–637. [Google Scholar] [CrossRef] [PubMed]
  76. Puccinelli, E.; Noyon, M.; McQuaid, C.D. Hierarchical effects of biogeography and upwelling shape the dietary signatures of benthic filter feeders. Mar. Ecol. Prog. Ser. 2016, 543, 37–54. [Google Scholar] [CrossRef]
  77. Goldenberg, S.U.; Taucher, J.; Fernandez-Mendez, M.; Ludwig, A.; Arístegui, J.; Baumann, M.; Ortiz, J.; Stuhr, A.; Riebesell, U. Nutrient composition (Si: N) as driver of plankton communities during artificial upwelling. Front. Mar. Sci. 2022, 9, 1015188. [Google Scholar] [CrossRef]
  78. Lorenzen, K.; Camp, E.V. Density-dependence in the life history of fishes: When is a fish recruited? Fish Res. 2019, 217, 5–10. [Google Scholar] [CrossRef]
  79. Kangur, K.; Kangur, P.; Ginter, K.; Orru, K.; Haldna, M.; Möls, T.; Kangur, A. Long-term effects of extreme weather events and eutrophication on the fish community of shallow Lake Peipsi (Estonia/Russia). J. Limnol. 2013, 72, 376–387. [Google Scholar] [CrossRef]
  80. McPhaden, M.J. El Niño and La Niña: Causes and global consequences. In Encyclopedia of Global Environmental Change; MacCracken, M.C., Perry, J.S., Eds.; John Wiley & Sons: Chichester, UK, 2002; Volume 1, pp. 353–370. Available online: https://tao.ndbc.noaa.gov/proj_overview/pubs/ElNinoLaNina.pdf (accessed on 13 November 2024).
  81. Stock, C.A.; Pegion, K.; Vecchi, G.A.; Alexander, M.A.; Tommasi, D.; Bond, N.A.; Fratantoni, P.S.; Gudgel, R.G.; Kristiansen, T.; O’Brien, T.D. Seasonal sea surface temperature anomaly prediction for coastal ecosystems. Prog. Oceanogr. 2015, 137, 219–236. [Google Scholar] [CrossRef]
  82. Bertignac, M.; Lehodey, P.; Hampton, J. A spatial population dynamics simulation model of tropical tunas using a habitat index based on environmental parameters. Fish. Oceanogr. 1998, 7, 326–334. [Google Scholar] [CrossRef]
  83. Rijnsdorp, A.D.; Peck, M.A.; Engelhard, G.H.; Möllmann, C.; Pinnegar, J.K. Resolving the effect of climate change on fish populations. ICES J. Mar. Sci. 2009, 66, 1570–1583. [Google Scholar] [CrossRef]
  84. Overland, J.E.; Alheit, J.; Bakun, A.; Hurrell, J.W.; Mackas, D.L.; Miller, A.J. Climate controls on marine ecosystems and fish populations. J. Mar. Syst. 2010, 79, 305–315. [Google Scholar] [CrossRef]
  85. Petitgas, P.; Rijnsdorp, A.D.; Dickey-Collas, M.; Engelhard, G.H.; Peck, M.A.; Pinnegar, J.K.; Drinkwater, K.; Huret, M.; Nash, R.D. Impacts of climate change on the complex life cycles of fish. Fish. Oceanogr. 2013, 22, 121–139. [Google Scholar] [CrossRef]
  86. Jorge-Romero, G.; Celentano, E.; Lercari, D.; Ortega, L.; Licandro, J.A.; Defeo, O. Long-term and multilevel impact assessment of the 2015–2016 El Niño on a sandy beach of the southwestern Atlantic. Sci. Total Environ. 2021, 775, 145689. [Google Scholar] [CrossRef]
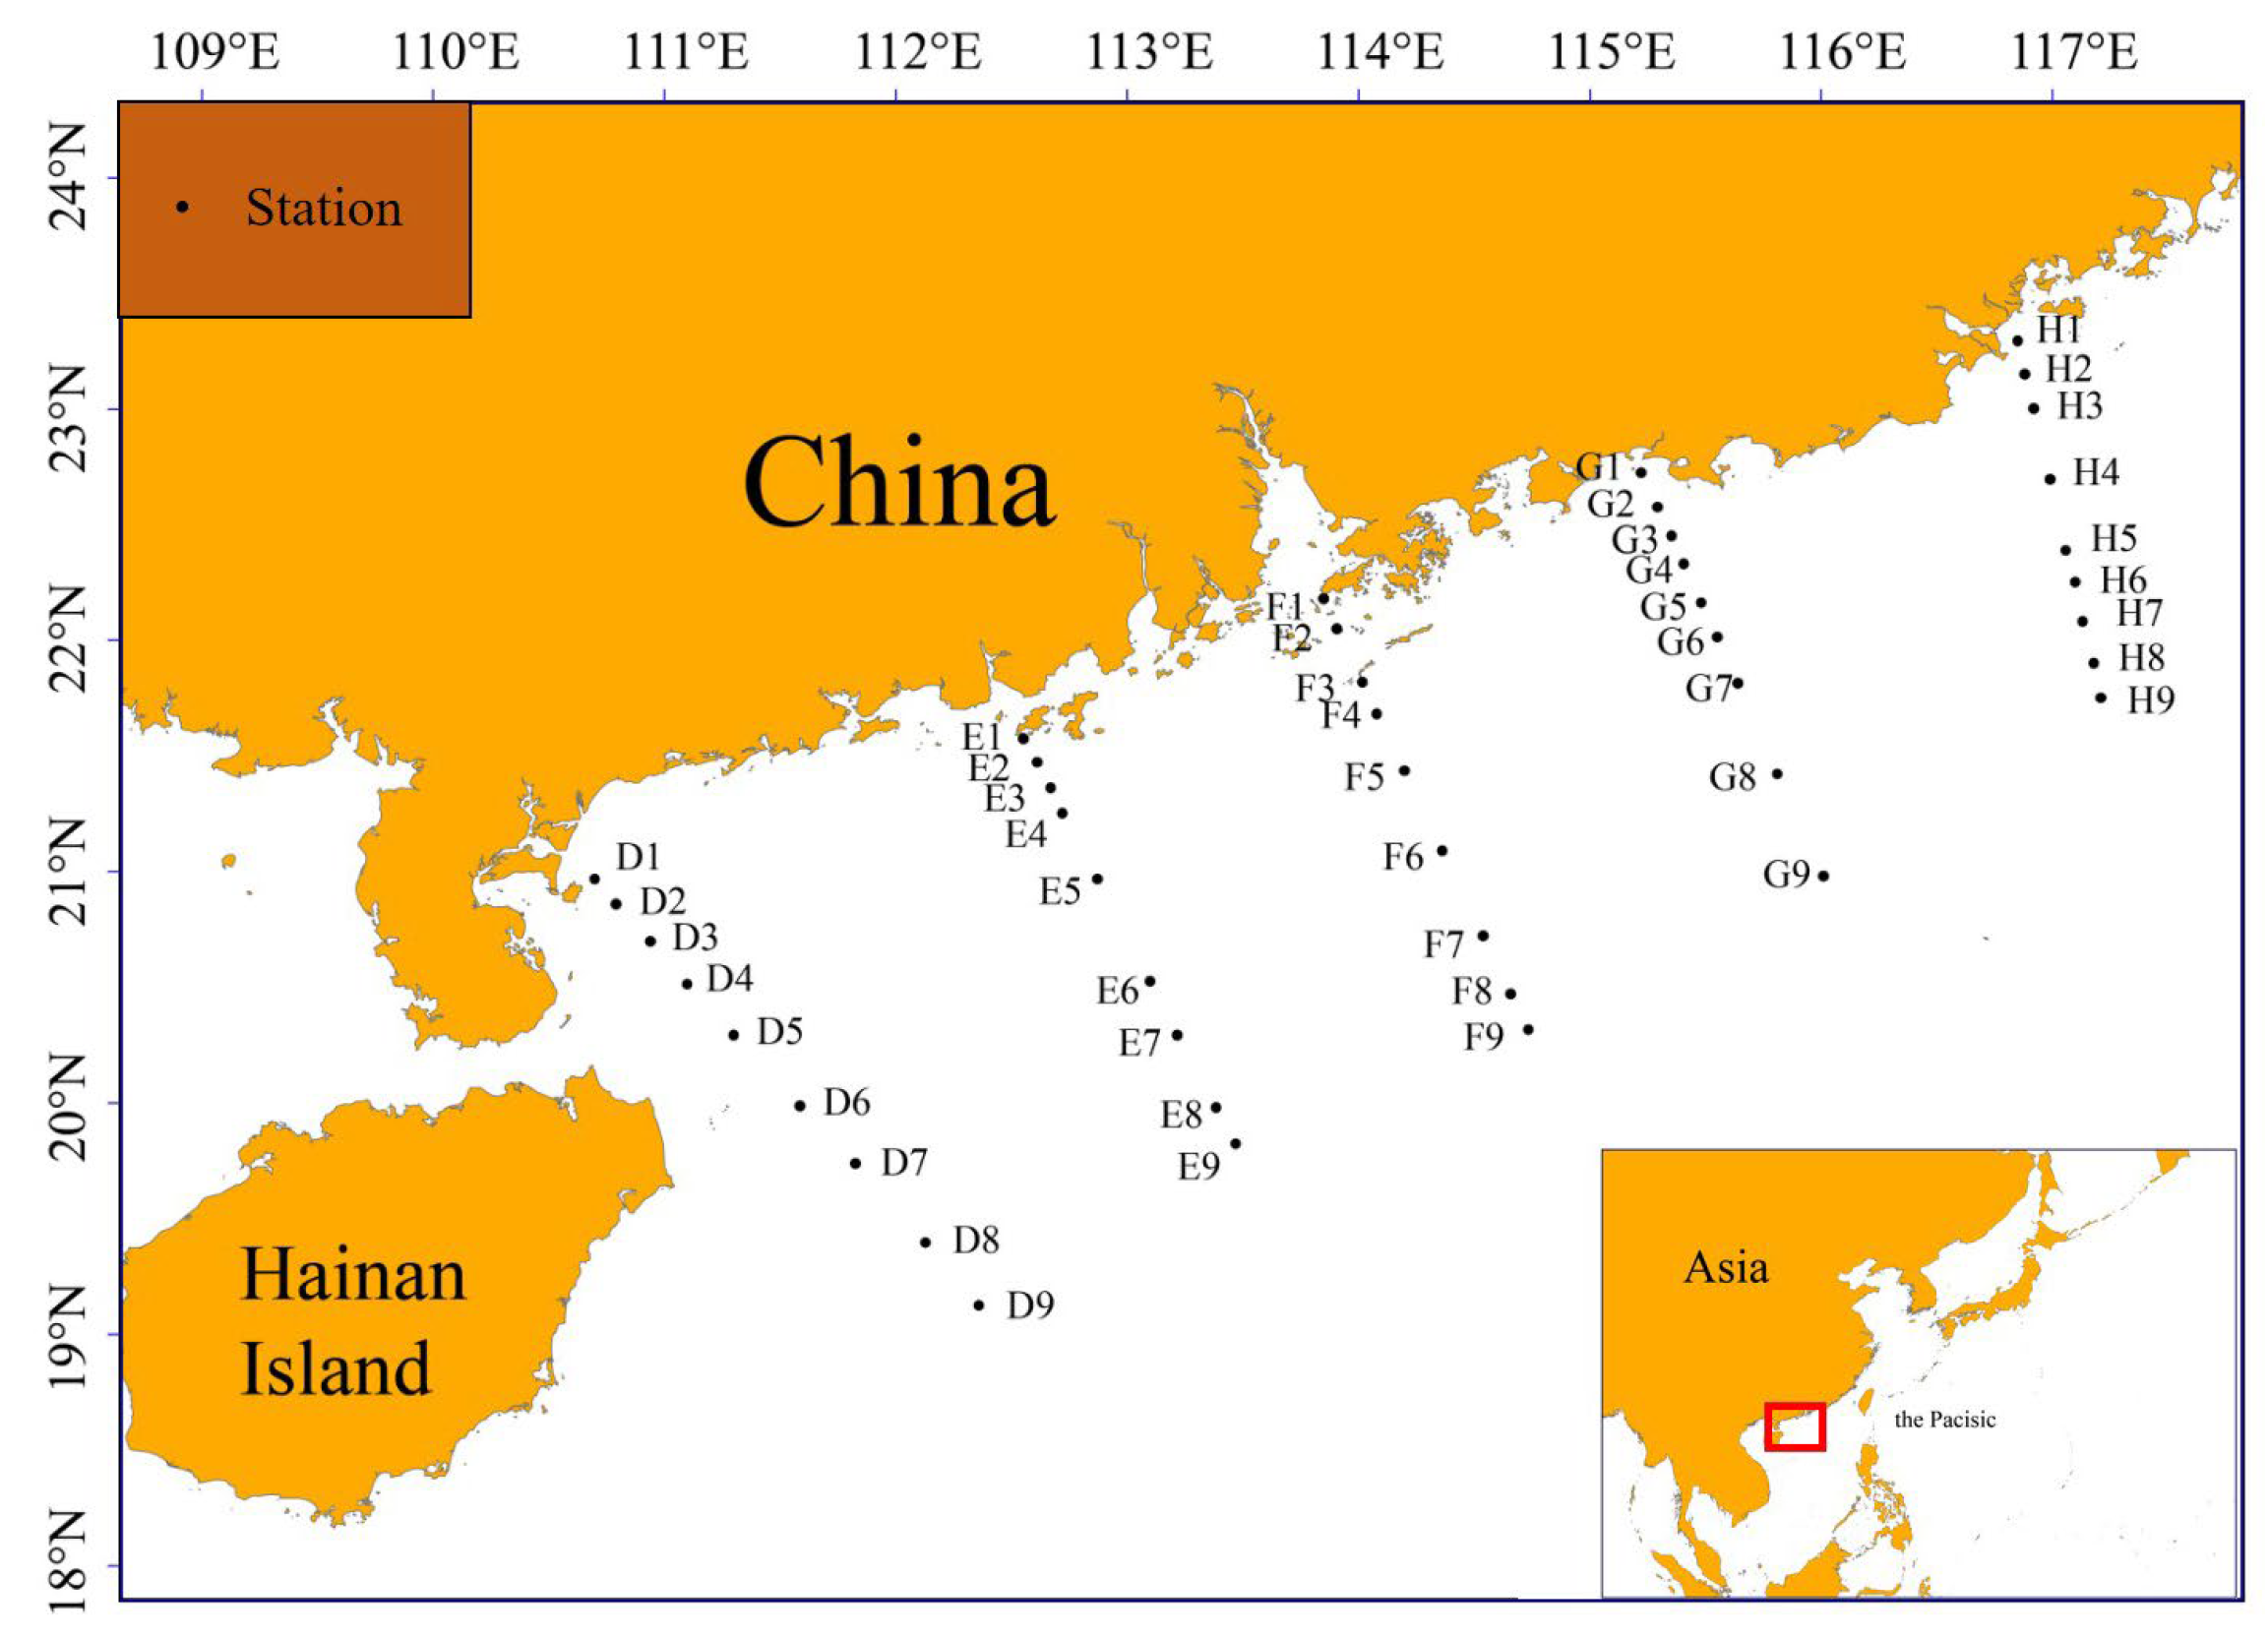
Figure 1. Locations of the fish-sampling stations in the northern South China Sea.
Jmse 13 00474 g001
Figure 2. Oceanic Niño Index (ONI) values for 2019 to 2023, indicating the occurrence of El Niño (red bars) and La Niña (blue bars) events.
Jmse 13 00474 g002
Figure 3. Cluster analysis and non-metric multidimensional scaling (NMDS) ordination of 45 fish-sampling stations on the NSCS shelf in terms of the autumn surveys of 2019, 2021, and 2022 (distance: correlation; clustering method: average linkage).
Jmse 13 00474 g003
Figure 4. Cluster analysis and non-metric multidimensional scaling (NMDS) ordination of 45 fish-sampling stations on the NSCS shelf in terms of the spring surveys of 2020 and 2022 (distance: correlation; clustering method: average linkage).
Jmse 13 00474 g004
Figure 5. The total CPUE and Decapterus maruadsi CPUE in relation to sea surface temperature (SST) on the NSCS shelf during the autumn surveys of 2019, 2021, and 2022.
Jmse 13 00474 g005
Figure 6. The total CPUE and Decapterus maruadsi CPUE in relation to sea surface temperature (SST) on the NSCS shelf during the spring surveys of 2020 and 2022.
Jmse 13 00474 g006
Figure 7. Distribution of predicted suitable habitats for Decapterus maruadsi in autumn 2019 (a), 2021 (c), and 2022 (e) and in spring 2020 (b) and 2022 (d).
Jmse 13 00474 g007
Figure 8. Probability of the occurrence of Decapterus maruadsi on the NSCS shelf in autumn 2019, 2021, and 2022 and in spring 2020 and 2022.
Jmse 13 00474 g008
Table 1. The six candidate predictors used for the species distribution models.
VariableDescriptionUnitSpatial Resolution
SSSSeawater salinityPSU0.083° × 0.083°
SSTSea surface temperature°C0.083° × 0.083°
Chl-aSea surface chlorophyll-a concentrationmg/m30.25° × 0.25°
pHSeawater pH, reported at the total scale 0.083° × 0.083°
DODissolved oxygenmg/m30.083° × 0.083°
MLDMixed-layer depthm0.083° × 0.083°
Table 2. Changes in dominant fish species (index of relative importance (IRI) values of >500) across five survey voyages in the northern South China Sea.
Sampling DateSpeciesIRI
Autumn 2019Saurida tumbil919.1
Decapterus maruadsi790.0
Upeneus bensasi738.8
Spring 2020Saurida undosquamis869.6
Champsodon atridorsalis768.8
Upeneus bensasi677.5
Saurida tumbil613.2
Trichiurus lepturus502.1
Autumn 2021Decapterus maruadsi1795.9
Evynnis cardinalis883.7
Synagrops japonicus679.5
Upeneus bensasi666.9
Champsodon atridorsalis664.8
Spring 2022Upeneus bensasi762.8
Thamnaconus hypargyreus589.5
Trichiurus lepturus514.1
Autumn 2022Decapterus maruadsi1320.2
Champsodon atridorsalis600.0
Table 3. Indices of the fish community on the NSCS shelf across five survey voyages.
Sampling DateMargalef’s Richness Index (D’)Pielou’s Evenness Index (J’)Shannon–Wiener Diversity Index (H’)Simpson Dominance Index (λ)
Autumn 201921.300.47452.5950.7681
Spring 202021.040.47492.5970.7653
Autumn 202123.180.43572.4290.7548
Spring 202220.690.43962.4060.7559
Autumn 202222.730.46022.5730.7594
Disclaimer/Publisher’s Note: The statements, opinions and data contained in all publications are solely those of the individual author(s) and contributor(s) and not of MDPI and/or the editor(s). MDPI and/or the editor(s) disclaim responsibility for any injury to people or property resulting from any ideas, methods, instructions or products referred to in the content.