Article

Hydrology Modulates the Microplastics Composition and Transport Flux Across the River–Sea Interface in Zhanjiang Bay, China

College of Chemistry and Environmental Science, Guangdong Ocean University, Zhanjiang 524088, China
*
Author to whom correspondence should be addressed.
J. Mar. Sci. Eng. 2025, 13(3), 428; https://doi.org/10.3390/jmse13030428
Submission received: 16 January 2025 / Revised: 15 February 2025 / Accepted: 18 February 2025 / Published: 25 February 2025
(This article belongs to the Section Marine Environmental Science)

Abstract

:
Estuaries act as significant pathways for plastic waste entry into the oceans, with microplastics (MPs) being intricately influenced by river and coastal hydrodynamics. MPs become entrapped within estuaries during transport, particularly at the river–sea interface, which impacted by tidal fluctuations. However, few studies have examined the role of the impacts of tidal variations on microplastic abundance and export flux at the river–sea interface across contrasting hydrological regimes (dry vs. wet seasons). In this study, we conducted observations to assess MPs abundance, composition, and flux in the Suixi Estuary of Zhanjiang Bay, China The results indicated an overall mean abundance of MPs of 91.1 ± 75.0 items/L, which was linked to tidal variations, decreasing during high tides and increasing during low tides. Transparent color, fibrous shape, and a size range of 100–330 μm were the most prevalent characteristics in water samples. MPs diversity was higher during the wet season compared to the dry season. In addition, the MPs influx was about 1.61 × 10⁹ items/year from the river to the sea across both seasons. Additionally, hydrological regimes, tidal forces, and human activities were identified to influence MPs abundance and flux. This quantitative analysis establishes a mechanistic framework for understanding hydrological impacts on estuarine MPs transport, providing critical baseline data for developing targeted pollution management strategies in coastal ecosystems.

1. Introduction

The general consensus among scientists involved in research on microplastics is that they came into being in 2004. [1]. Subsequent to this, microplastics research has broadened its scope from the study of marine litter, notably plastic litter, which now constitutes 60–80% of marine litter and up to 90–95% in certain areas, witnessing a yearly increase. Marine plastic waste is categorized into two groups: macroscopic (>5 mm) and microscopic (<5 mm) [2]. Particles with a diameter of less than 5 mm are collectively termed microplastics [3]. Microplastics exhibit various morphologies, including fragmented, fibrous, and granular forms. Land-based inputs, coastal tourism, and ship transportation are the primary sources of microplastics. Land-based discharge constitutes the primary source of marine microplastic pollution [4]. These discharges encompass discarded plastic waste, commonly used household skincare products, and detergents [5]. Throughout their migration, microplastics assimilate various chemical pollutants from the surrounding environment [6] and are ingested by diverse organisms to varying degrees. For example, benthic invertebrates [7], seabirds [8], dolphins [9], and zooplankton [10] face threats due to plastic accumulation in their bodies. This poses risks to both their survival and human health [11,12].
Rivers are the principal conduits for plastic waste to enter the ocean [13]. Global plastic input modelling estimates that between 11.5 and 2.41 million tons of plastic litter enters the ocean from rivers annually [14]. In recent years, a burgeoning body of research has examined the abundance, flux, and transport of riverine MPs. This encompasses studies assessing the impacts of wastewater discharges, high population densities, and hydro-meteorological conditions on microplastic flux [15,16], as well as transport mechanisms [17]. Prior research indicates that microplastics are sequestered in estuaries during transport, with the interface region being influenced by both riverine and marine factors. Tidal dynamics significantly influence hydrological conditions in offshore waters and estuaries [18]. However, knowledge regarding the influences of riverine inputs on tidal dynamics in marine environments remains limited [19]. Quantifying plastic emissions in the ocean hinges on understanding the downstream transfer process from rivers and estuaries. Estuaries offer critical ecosystem services, such as shoreline protection from erosion and wave action, carbon sequestration, and nutrient cycling [20]. They also serve as crucial transitional zones between terrestrial pollution sources and marine sinks, essential for preserving marine biodiversity. Thus, they warrant particular scrutiny. However, most existing studies focus on prompt value in the estuary, with samples predominantly collected during low tide. This coincides with the period when microplastics are flushed from the estuarine zone [21,22]. Studies have indicated a higher microplastic abundance in estuarine surface water compared to the coastal zone [23,24]. However, comprehensive tidal cycle studies are scarce, and findings from studies conducted at specific estuarine moments often conflict with those from subsequent periods. Therefore, a comprehensive understanding of the hydrodynamics, composition, and flux of microplastics in tidal rivers and estuaries is essential. This necessitates identifying and analyzing the hydrologically-driven transport processes of microplastics from the land–sea interface to the ocean. It is therefore essential to concentrate on achieving a comprehensive understanding of microplastic composition, fluxes, and hydrodynamics in tidal rivers and estuaries, especially to identify and analyze hydrologically-driven processes of MPs transport from the river–sea interface to the ocean.
Zhanjiang Bay (ZJB), located on the Leizhou Peninsula, represents the southernmost point of China’s mainland. ZJB connects to the South China Sea [25] and experiences predominantly irregular semi-diurnal and diurnal tides [26]. The coastal waters receive influx from several seasonal rivers, including the Suixi, Nanliu, and Lvtang [27]. The economy of Zhanjiang has seen rapid growth in recent decades, marked by an expansion of coastal industrial facilities, tourism, aquaculture, and shipbuilding. However, this has led to substantial industrial wastewater discharge and an increase in land-based plastic waste [28,29,30]. Despite extensive research on land-based sources of ZJB [30], there remains a paucity of research focusing on the tidal river and river–sea interface within Zhanjiang City. In order to enhance our comprehension of the pollution in ZJB, this study investigated microplastics at the tidal river and river–sea interface of ZJB during both the dry and wet seasons.
To address hydrological modulation of the microplastics composition and transport flux across the river–sea interface, the Suixi River–Sea interface in ZJB was selected to address the following objectives: (1) examining the abundance distribution of MPs during dry and wet seasons; (2) determining the composition and diversity of microplastics; (3) estimating and quantifying tidal fluxes; and (4) revealing other factors’ effects on MP composition. This study investigates the transport of microplastics from rivers to the ocean driven by hydrological factors, assesses the impact of human activities and tidal variations, and quantifies the alterations in microplastic fluxes due to hydrodynamics.

2. Materials and Methods
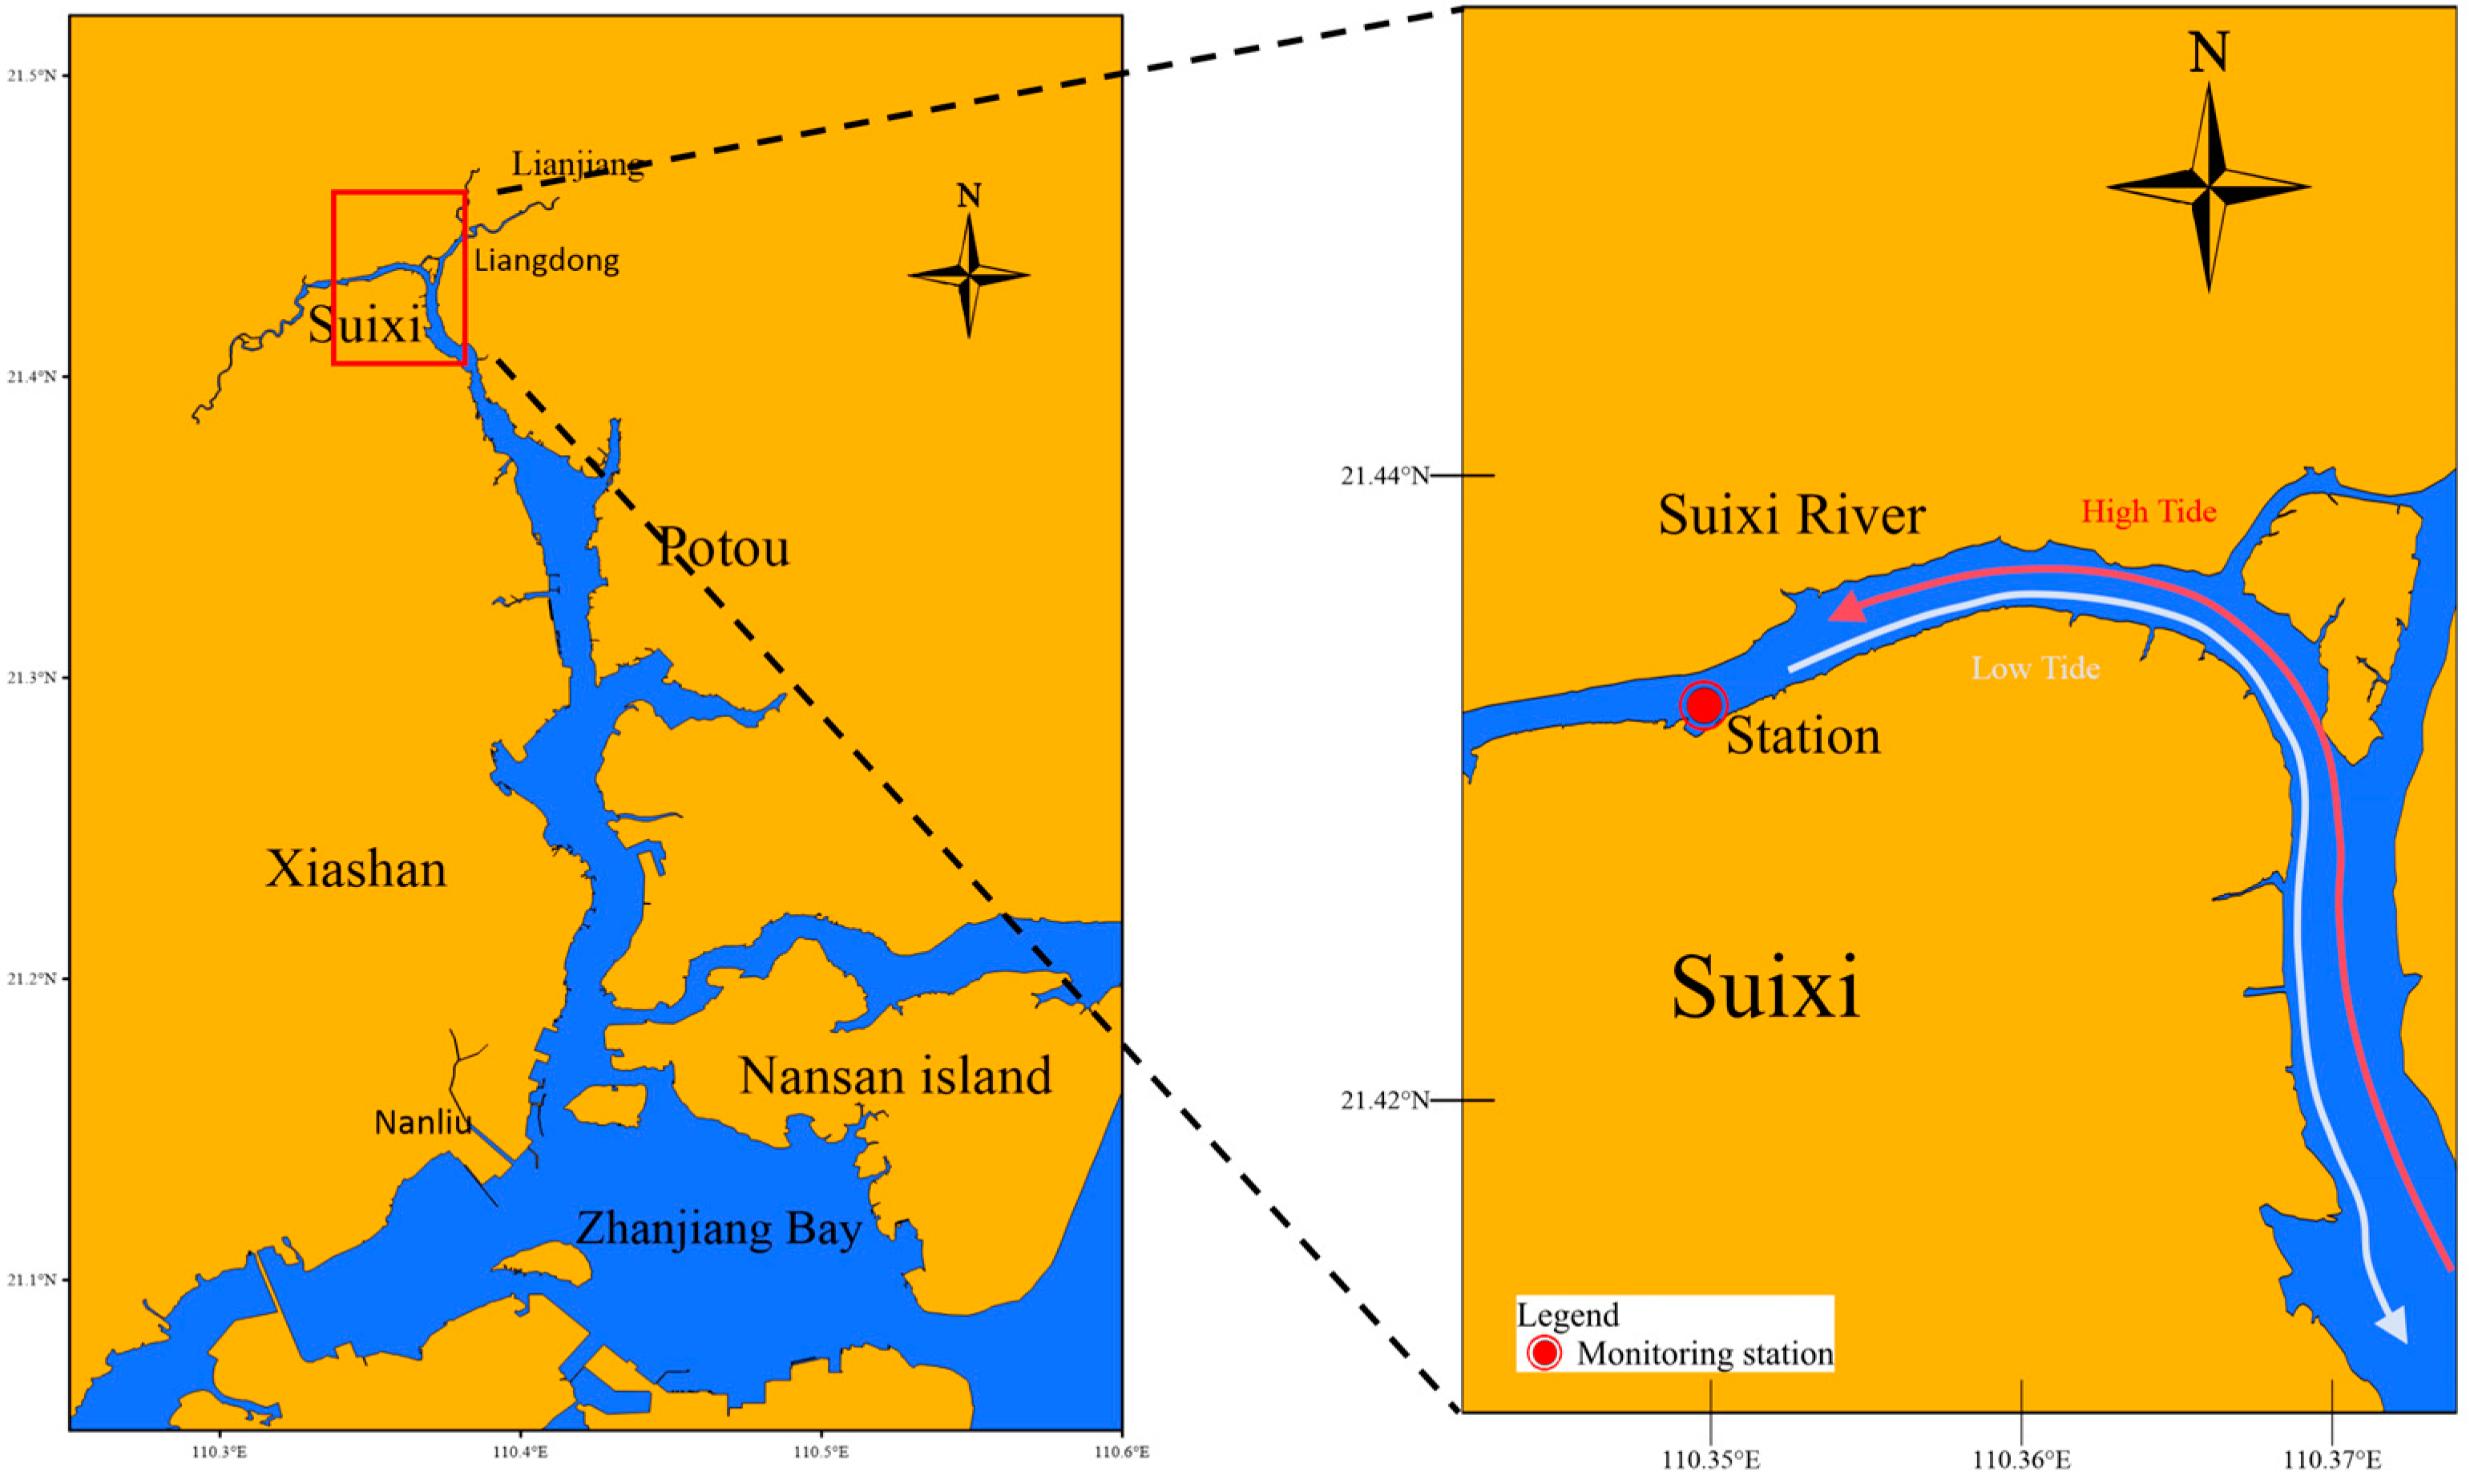
2.1. Study Area

ZJB is a semi-enclosed bay with a narrow 2 km-long channel connecting to the South China Sea [30]. It is rich in marine resources and has a surface area of 193 km2, a longitudinal length of 15 km [30], and a transverse width of about 24 km. The bay connects the Suixi River, Nanliu River, and Liangdong River. The economic development of Zhanjiang City has led to the construction of industrial facilities and sewage treatment plants in coastal areas. As a result, the number of tourists in this coastal city has significantly increased. In 2023, the number of tourists exceeded 2 × 10⁷, which led to an increase in plastic waste. According to the statistics bureau of Zhanjiang City, the permanent resident population exceeded 7 million in 2023 (2023 Zhanjiang City National Economic and Social Development Statistical Bulletin). The rivers in coastal urban areas are polluted by industrial wastewater, domestic wastewater, sewage outfall, and other sources. This pollution has had a negative impact on the ecological condition of the rivers and has resulted in serious marine ecological and environmental problems [30,31]. The water body of the Suixi River was sampled at different time periods during the dry and wet seasons to investigate the impact of tidal changes on the abundance and composition of microplastics (MPs) (Figure 1).

2.2. Sampling and Analysis Methods

In order to investigate the effect of tidal dynamics on MPs, samples were collected in the estuarine zone of the Suixi Estuary of the ZJB. Eight point samples were collected on 7–8 December 2022, and nine point samples were collected on 30–31 August 2023. The collection was based on the tide tables of Zhanjiang City in 2022 and 2023, respectively, with the samples representing the dry season (7–8 December 2022) and the wet season (30, 31 August 2023). The technical specification (HJ/T91-2002) [32] sets out the requirements for monitoring surface water, including the collection, storage, and measurement of river water samples. The water samples were collected using a portable sampler in accordance with the specifications set forth in the Standard for Open Channel Liquid Flow Measurement (GB50179-93) (Ministry of Water Resources, 2005). The monitoring of a range of hydrological data at the river–sea interface were conducted using electromagnetic current meters: ‘Specification for Marine Surveys Part 2: Marine Hydrographic Observations’ (GB/T12763.2-2007). According to the tide tables of Zhanjiang City in 2022 and 2023, a certain number of surface water samples were collected with a 5-liter metal sampler based on the tidal height. These samples were then transported back to the laboratory in a timely manner. Subsequently, the instruments were covered with aluminum foil to prevent any potential shedding of MPs. Prior to sample filtration, a specific volume of the sample solution was measured and passed through a 50 mm diameter acetate fiber filter membrane with a pore size of 5 μm. The resulting filter membrane was then transferred to a beaker, to which 10 mL of 30% hydrogen peroxide (H2O2) solution and 10 mL of 0.05 M ferrous sulfate (FeSO4) [Ferrous sulphate heptahydrate (Xilong Science Co. Ltd., Shantou, China)] solution were added. The beaker containing the mixture was then placed in a preheated water bath at 75 °C for two hours before being cooled to room temperature. The samples were filtered using an acetate membrane under a vacuum pump. Subsequently, the membranes were wrapped in aluminium foil and air-dried at 75 °C [33]. Following the drying process, the suspected MPs were photographed and marked using a stereomicroscope [34]. The MPs were observed after treatment and the suspected MPs retained on the filter membrane were systematically counted using a stereomicroscope (SMZ1270, Nikon, Tokyo, Japan) at up to 40× magnification [35,36]. The shape of the MPs collected was classified as fiber, membrane, fragment, or foam [29], and their size was measured and counted based on the longest side. The MPs’ sizes were divided into six categories: 5–100 μm, 100–330 μm, 330–500 μm, 500–1000 μm, 1000–2000 μm, and 2000–5000 μm. The colors available are blue, white, red, transparent, green, black, multicolor, pink, orange, yellow, purple, and brown [37]. It is not possible to identify MPs with complete accuracy by visual observation alone [38]. The selected suspected MPs were subjected to analysis on a Fourier Transform Infrared Spectrometer (Frontier, PerkinElmer, Waltham, MA, USA), with the resulting spectra being compared with those contained in the instrument’s spectral library. Only those particles that matched the spectral library by a minimum of 60% were identified as MPs.

2.3. Quality Assurance and Control

To prevent the influence of other clothing materials [33], it is recommended to wear a white cotton lab coat during all experimental steps, including sampling, sample pretreatment, and observation. Additionally, during the experiment, it is important to wash all metal and glass containers and instruments several times with ultra-pure water and cover them with aluminum foil to prevent contamination. Before sample treatment, all water samples were filtered using a cellulose acetate filter to prevent interference from other MPs. Additionally, to avoid the influence of fibers on the filter membrane, the membrane was washed with ultra-pure water two to three times before filtration. During the pretreatment process, a blank group of samples was prepared. This group consisted of the same volume of ultra-pure water replacing the water sample. The blank group underwent unified treatment throughout the process to enable comparison. On average, nine MPs were detected on the filter membranes of the blank group. These MPs may have originated from airborne sources [39]. To increase the accuracy of the experimental data, the final results were adjusted using the average concentration of MPs in the blank group.

2.4. Diversity Index of MPs

To estimate the complexity of MPs types and sources in the Suixi River, we calculated the diversity index D′ (MPs) according to Equation (1) [40,41,42]. In summary, D′ (MPs) was calculated based on the characteristics of size, color, and shape; specifically, size D′ (MPs), color D′ (MPs), and shape D′ (MPs).
D = 1 y = 1 x N y N 2
where the formula for x is the number of categories of MPs, N is the total number of MPs in a sample, and Ny is the number of MPs that are classified as the type.
To assess the impact of hydrodynamic forces on MPs, we computed the MPs flux in the Suixi Estuary area of ZJB using Equation (2).
F i = C i D Depth W Width V i
Among them, Fi (unit) represents the microplastic flux in the Suixi Estuary area of ZJB. Ci (unit/m3) represents the average microplastic abundance per second at time i in the Suixi Estuary area of ZJB. D represents the average depth of the observed section. V represents the velocity (ms−1) at moment i of the following hydrodynamic flow.
Additionally, Formula (3) was used to estimate the total amount of MPs in ZJB.
F = t 0 t n F t d t Δ t 2 i = 0 n 1 F t i + F t i + 1
In this context, F(ti) represents the instantaneous flux at time point i, with delta t denoting the time interval. The symbol F is used to denote the total microplastic flux in Suixi Estuary, ZJB, over a 24 h period.
In accordance with Equation (2), the flux of MPs in the Suixi River of ZJB was determined at 24 discrete time points, spanning the dry season between 12:00 on 7 December and 12:00 on 8 December, and the wet season between 12:00 on 30 August and 12:00 on 31 August. The total flux of MPs over a 24 h period in both the dry and wet seasons can be calculated using Equation (3). The flux of MPs at high tide is defined as positive, indicating a movement from ZJB to the Suixi Estuary. Conversely, the flux of MPs at low tide is defined as negative, indicating a movement from the Suixi Estuary to ZJB.

2.5. Statistical Analysis

Microsoft Excel 2019 was used for the analysis of MPs data and Software Origin 2024 (Origin Lab Corporation, Northampton, MA, USA) was used for graphical analysis. Significance was first analyzed in SPSS 26 using the normal distribution, and if it did not conform to a normal distribution, a non-parametric test was performed; if it conformed to the normal distribution, a one-way analysis of variance (ANOVA) was performed for MPs abundance, and a two-way ANOVA (two factors for station and time) was used to analyze MPs’ size, color, and shape. When p > 0.05, it was considered statistically insignificant; when p < 0.05, it was considered significantly correlated. Site locations were mapped using ArcGIS 10.2 (Esri Corporation, New York, NY, USA).

3. Results

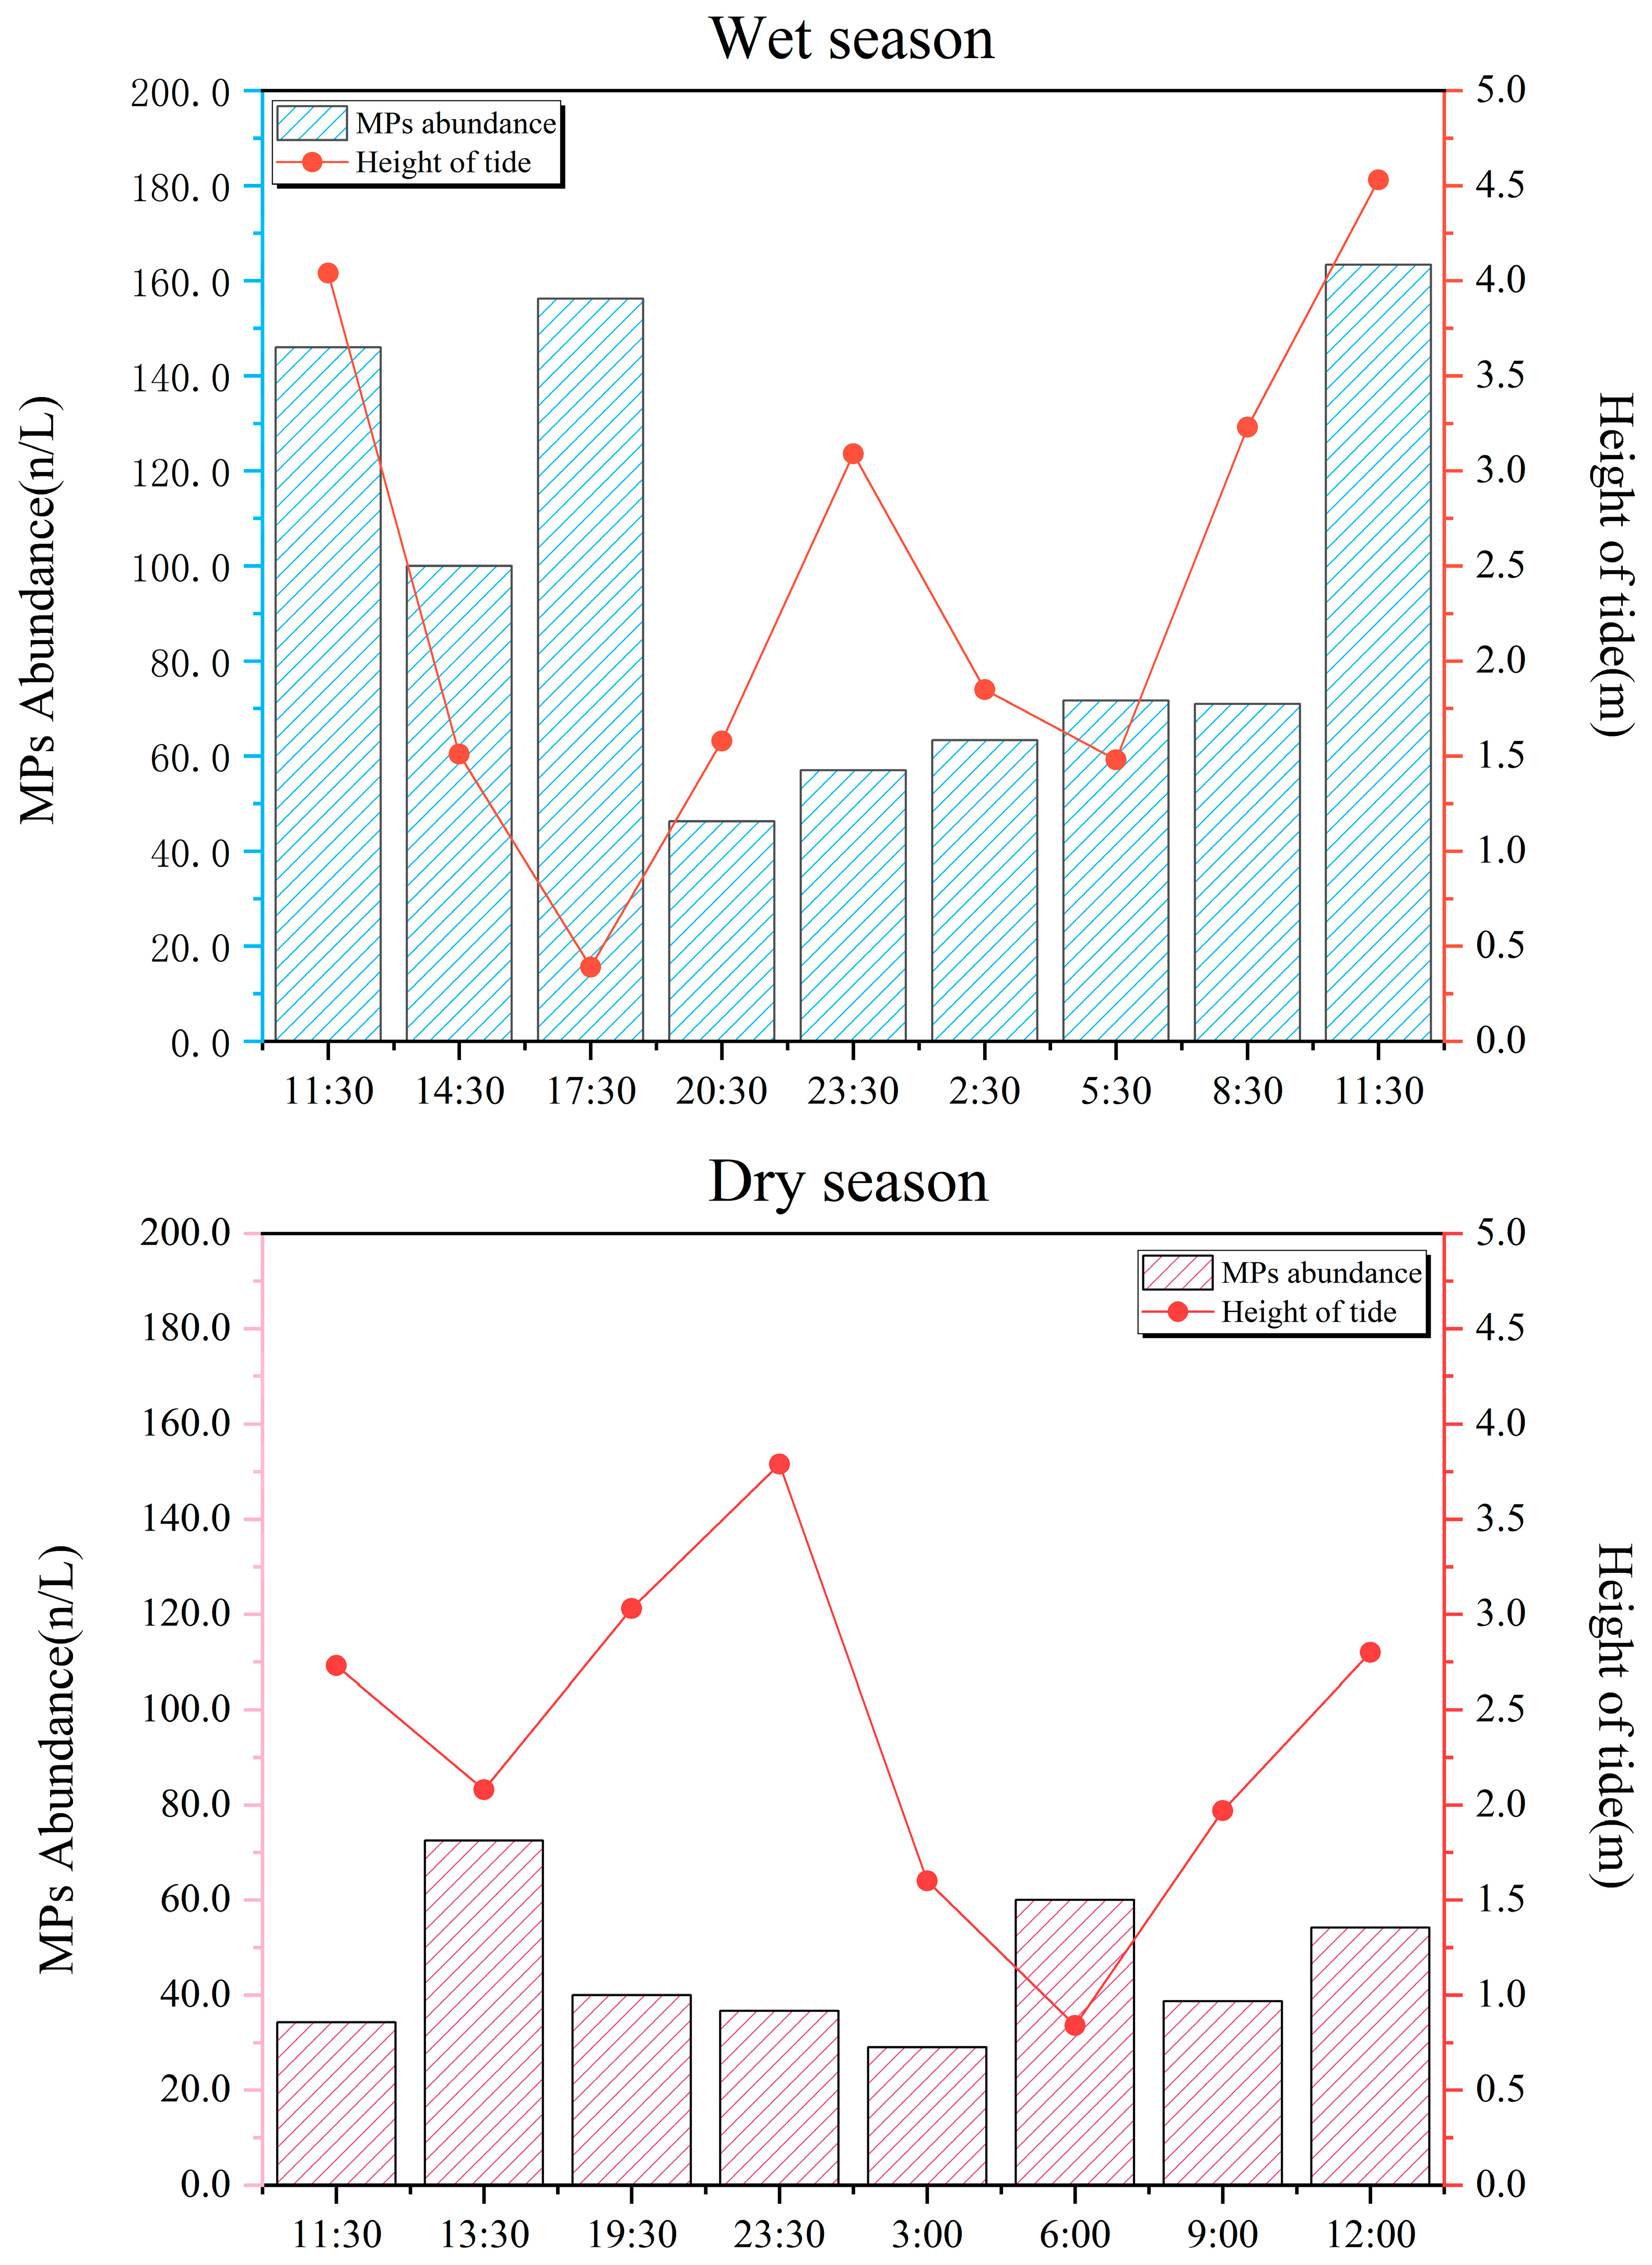
3.1. Hydrodynamic Variation in the Suixi River–Sea in ZJB

The Suixi Estuary in ZJB experienced irregular semi-diurnal tides. As demonstrated in Table 1, during the dry season, high tides exhibited greater duration than low tides, reaching a maximum of 379 cm on 7 December at 23:30 and ebbing to 84 cm on 8 December at 6:00. Conversely, during the wet season, high and low tides exhibited equal durations, with the tide reaching its peak at 453 cm on 31 August at 11:30 and its nadir at 39 cm on 30 August at 17:30. The maximum river flow rate during the wet season was 75.4 cm/s, whereas in the dry season, the maximum flow rate was 65.6 cm/s. The findings indicated that while the wet season exhibited greater variability in flow rates than the dry season, the latter had a higher average flow rate. Within the confines of the estuary, tidal fluctuations exerted a substantial influence on the flow of the river. Despite lower river flow rates in the dry season, tidal effects enhanced inflow in the estuary. Salinity distribution was influenced by river discharge, precipitation, evaporation, and the degree of seawater mixing. During the wet season, salinity levels typically ranged from a maximum of 1.9 PSU to a minimum of 0.1 PSU, while in the dry season, the range extended from a maximum of 9.6 PSU to a minimum of 0.7 PSU. A notable decrease in salinity was observed during the wet season when compared to the winter months. The wet season exhibited a more pronounced disparity between rainfall and evapotranspiration compared to the dry season, where stronger tides and higher seawater content contributed to increased salinity.

3.2. Hydrodynamics on MPs Abundance in the Suixi River–Sea in ZJB

This section of the study investigated the relationship between microplastic abundance and tidal variation in the Suixi Estuary of ZJB, focusing on the dry and wet seasons. Water samples were collected at eight dry season and nine wet season periods, detecting microplastic particles in every sample (Figure 2). As demonstrated in Figure 3, The statistical analysis revealed significant differences in microplastic abundance between the wet and dry seasons (p < 0.05). In the wet season, microplastic abundance peaked midday at 11:30 (146.0 items/L) and afternoon at 17:30 (156.3 items/L). These accounted for 16.7% and 17.9% of the wet season’s total abundance, respectively. Conversely, the minimum abundance, comprising 5.3% of the total, was recorded at 20:30 (46.3 items/L). At 23:30, microplastic abundance was 3.16 times that of 20:30. Peak tidal levels occurred from 10:00 to 11:00, while the lowest were observed between 17:00 and 18:00. The highest tide level in the estuary occurred at 11:30, with the lowest at 17:30. The ebb tide period, from 11:30 to 17:30, showed lower abundances compared to both the highest and lowest tide periods. The high tide period occurred between 17:30 and 23:30. In the dry season, maximum abundances were observed at 6:00 p.m. and 6:00 a.m. (60.0 items/L), and 1:30 a.m. (72.5 items/L). The minimum abundance, comprising 13.3% and 16.1% of the total, was recorded at 3:00 a.m. (29.0 items/L). Microplastic abundance at 23:30 was 2.5 times that at 03:00. Notably, the highest tide occurred at 10:50, and the lowest at 05:18. Lowest tidal levels at 13:30 and 6:00 corresponded with maximum microplastic abundances. During the high tide period from 13:30 to 23:30, abundance decreased gradually, while during the low tide period from 23:30 to 6:00, it increased sharply. It is inferred that microplastic abundance correlated with tidal changes, decreasing at high tide and increasing at low tide, though the highest and lowest tides showed the greatest abundance.

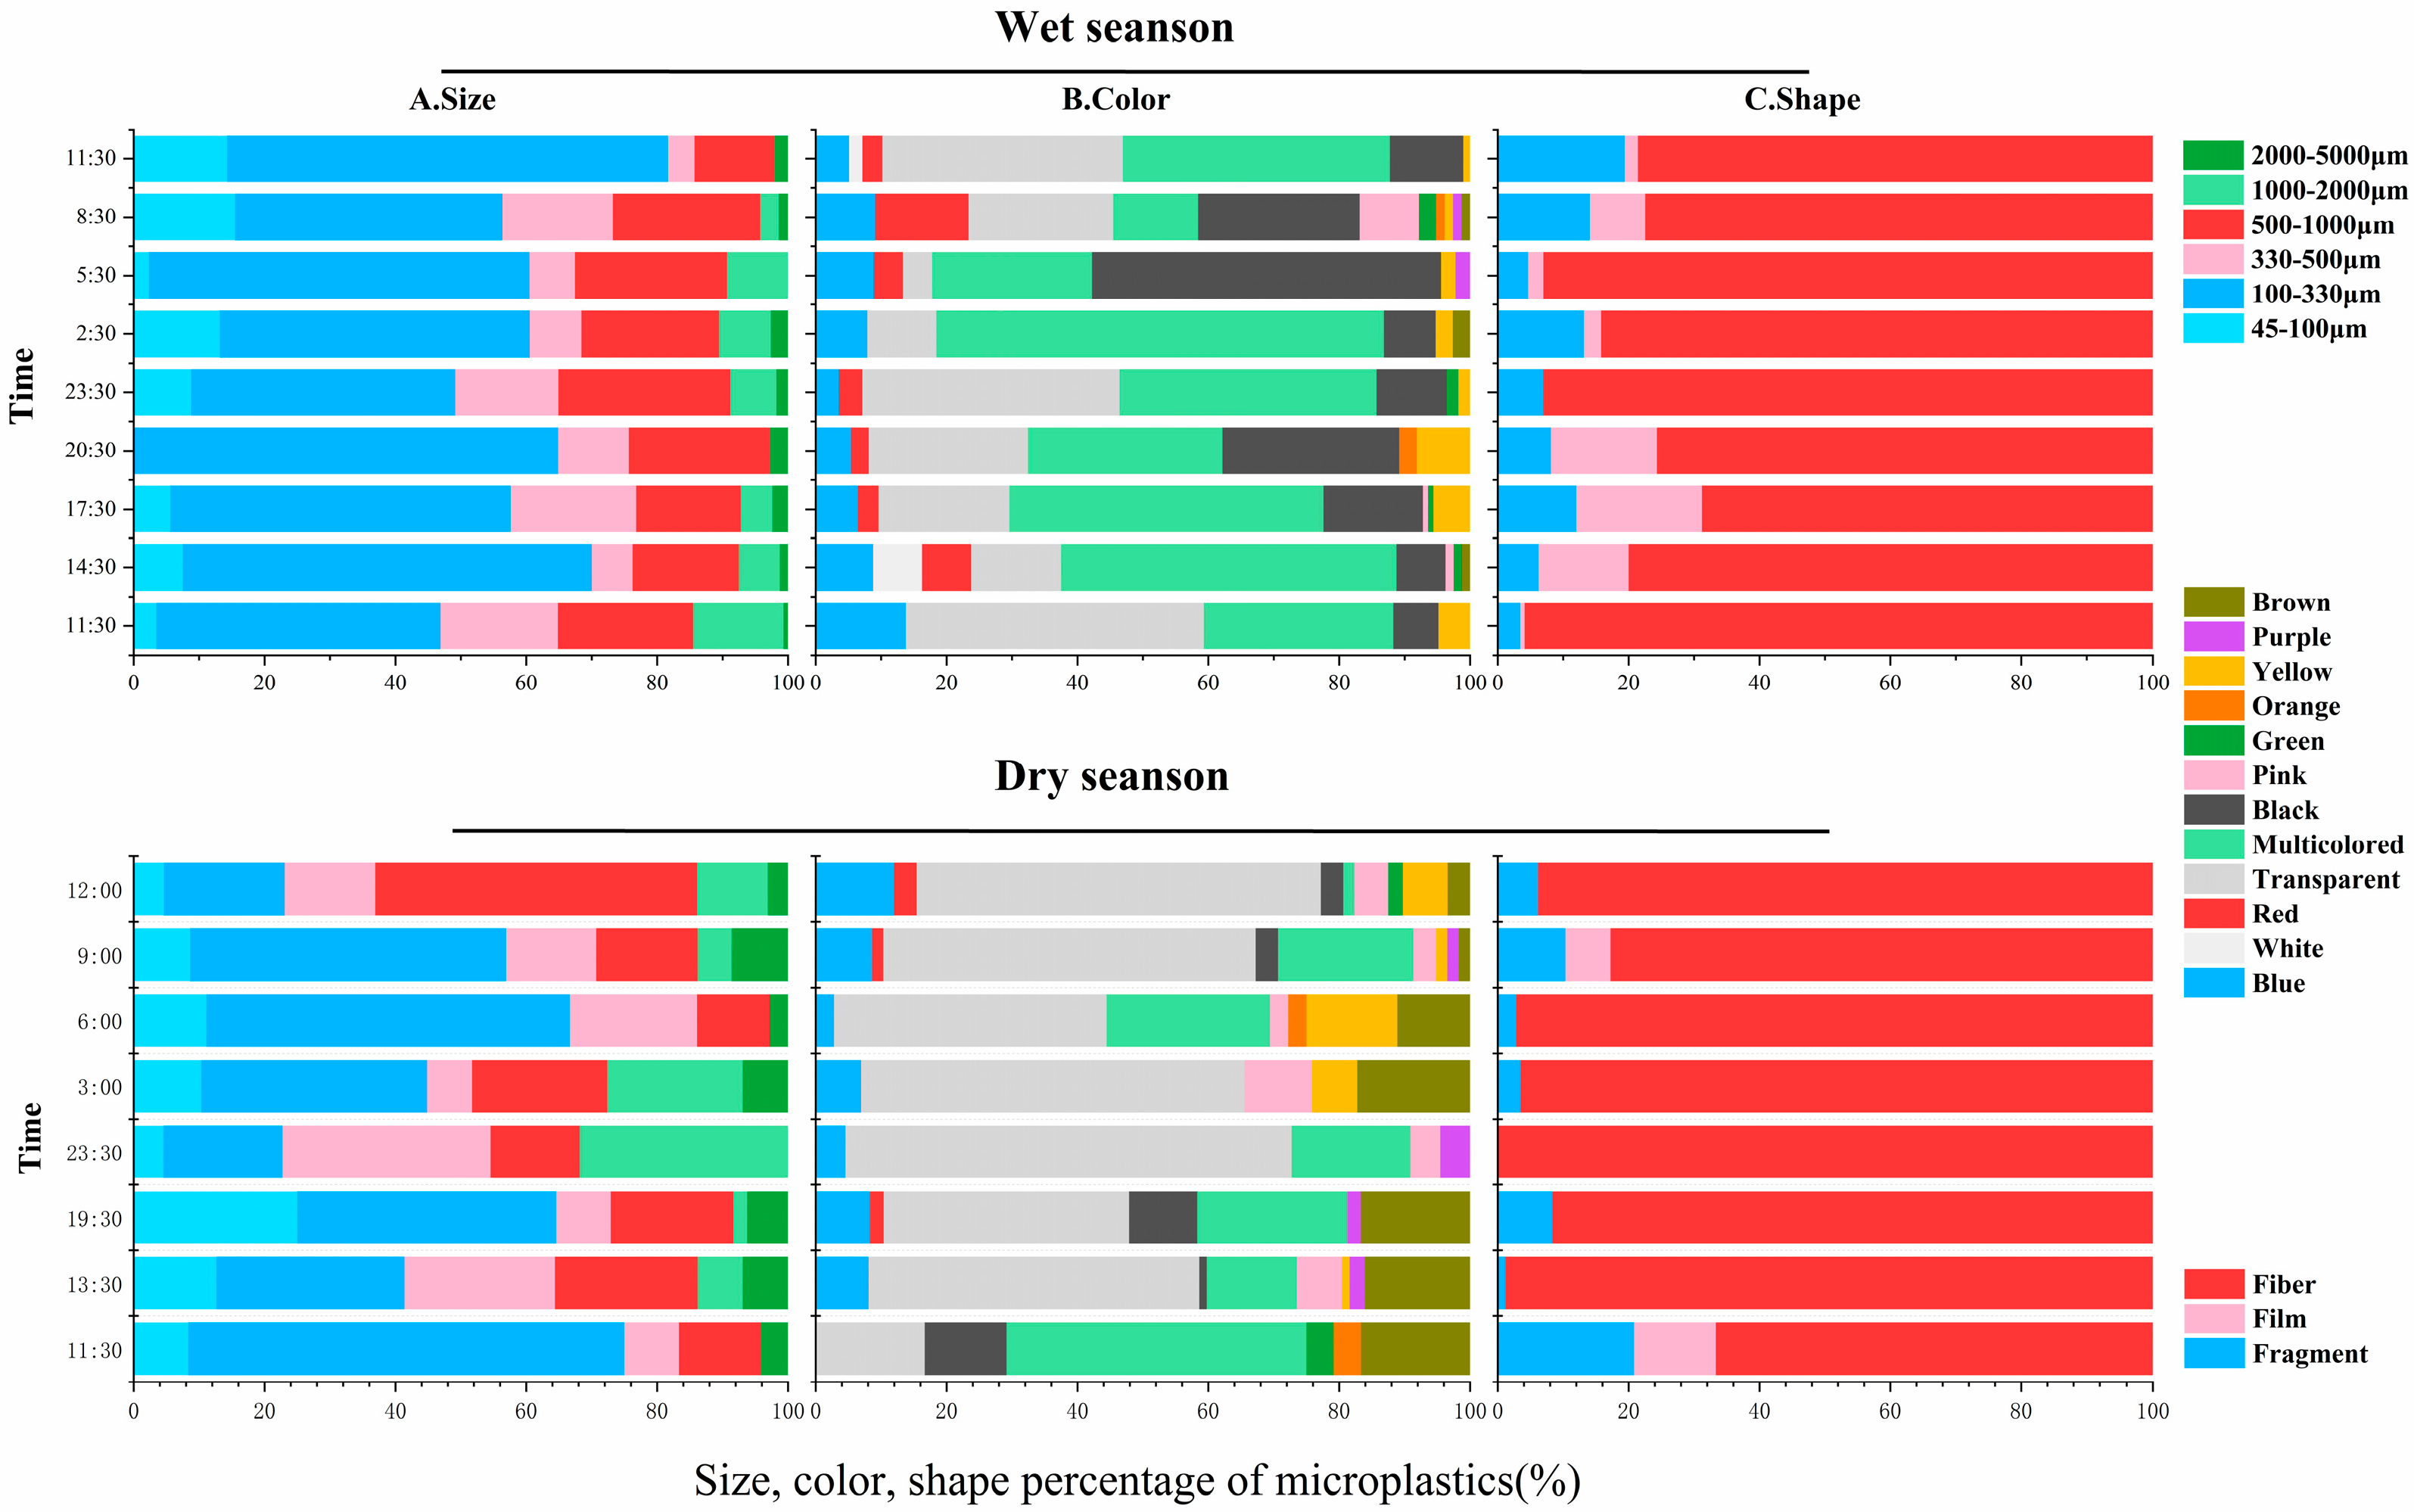
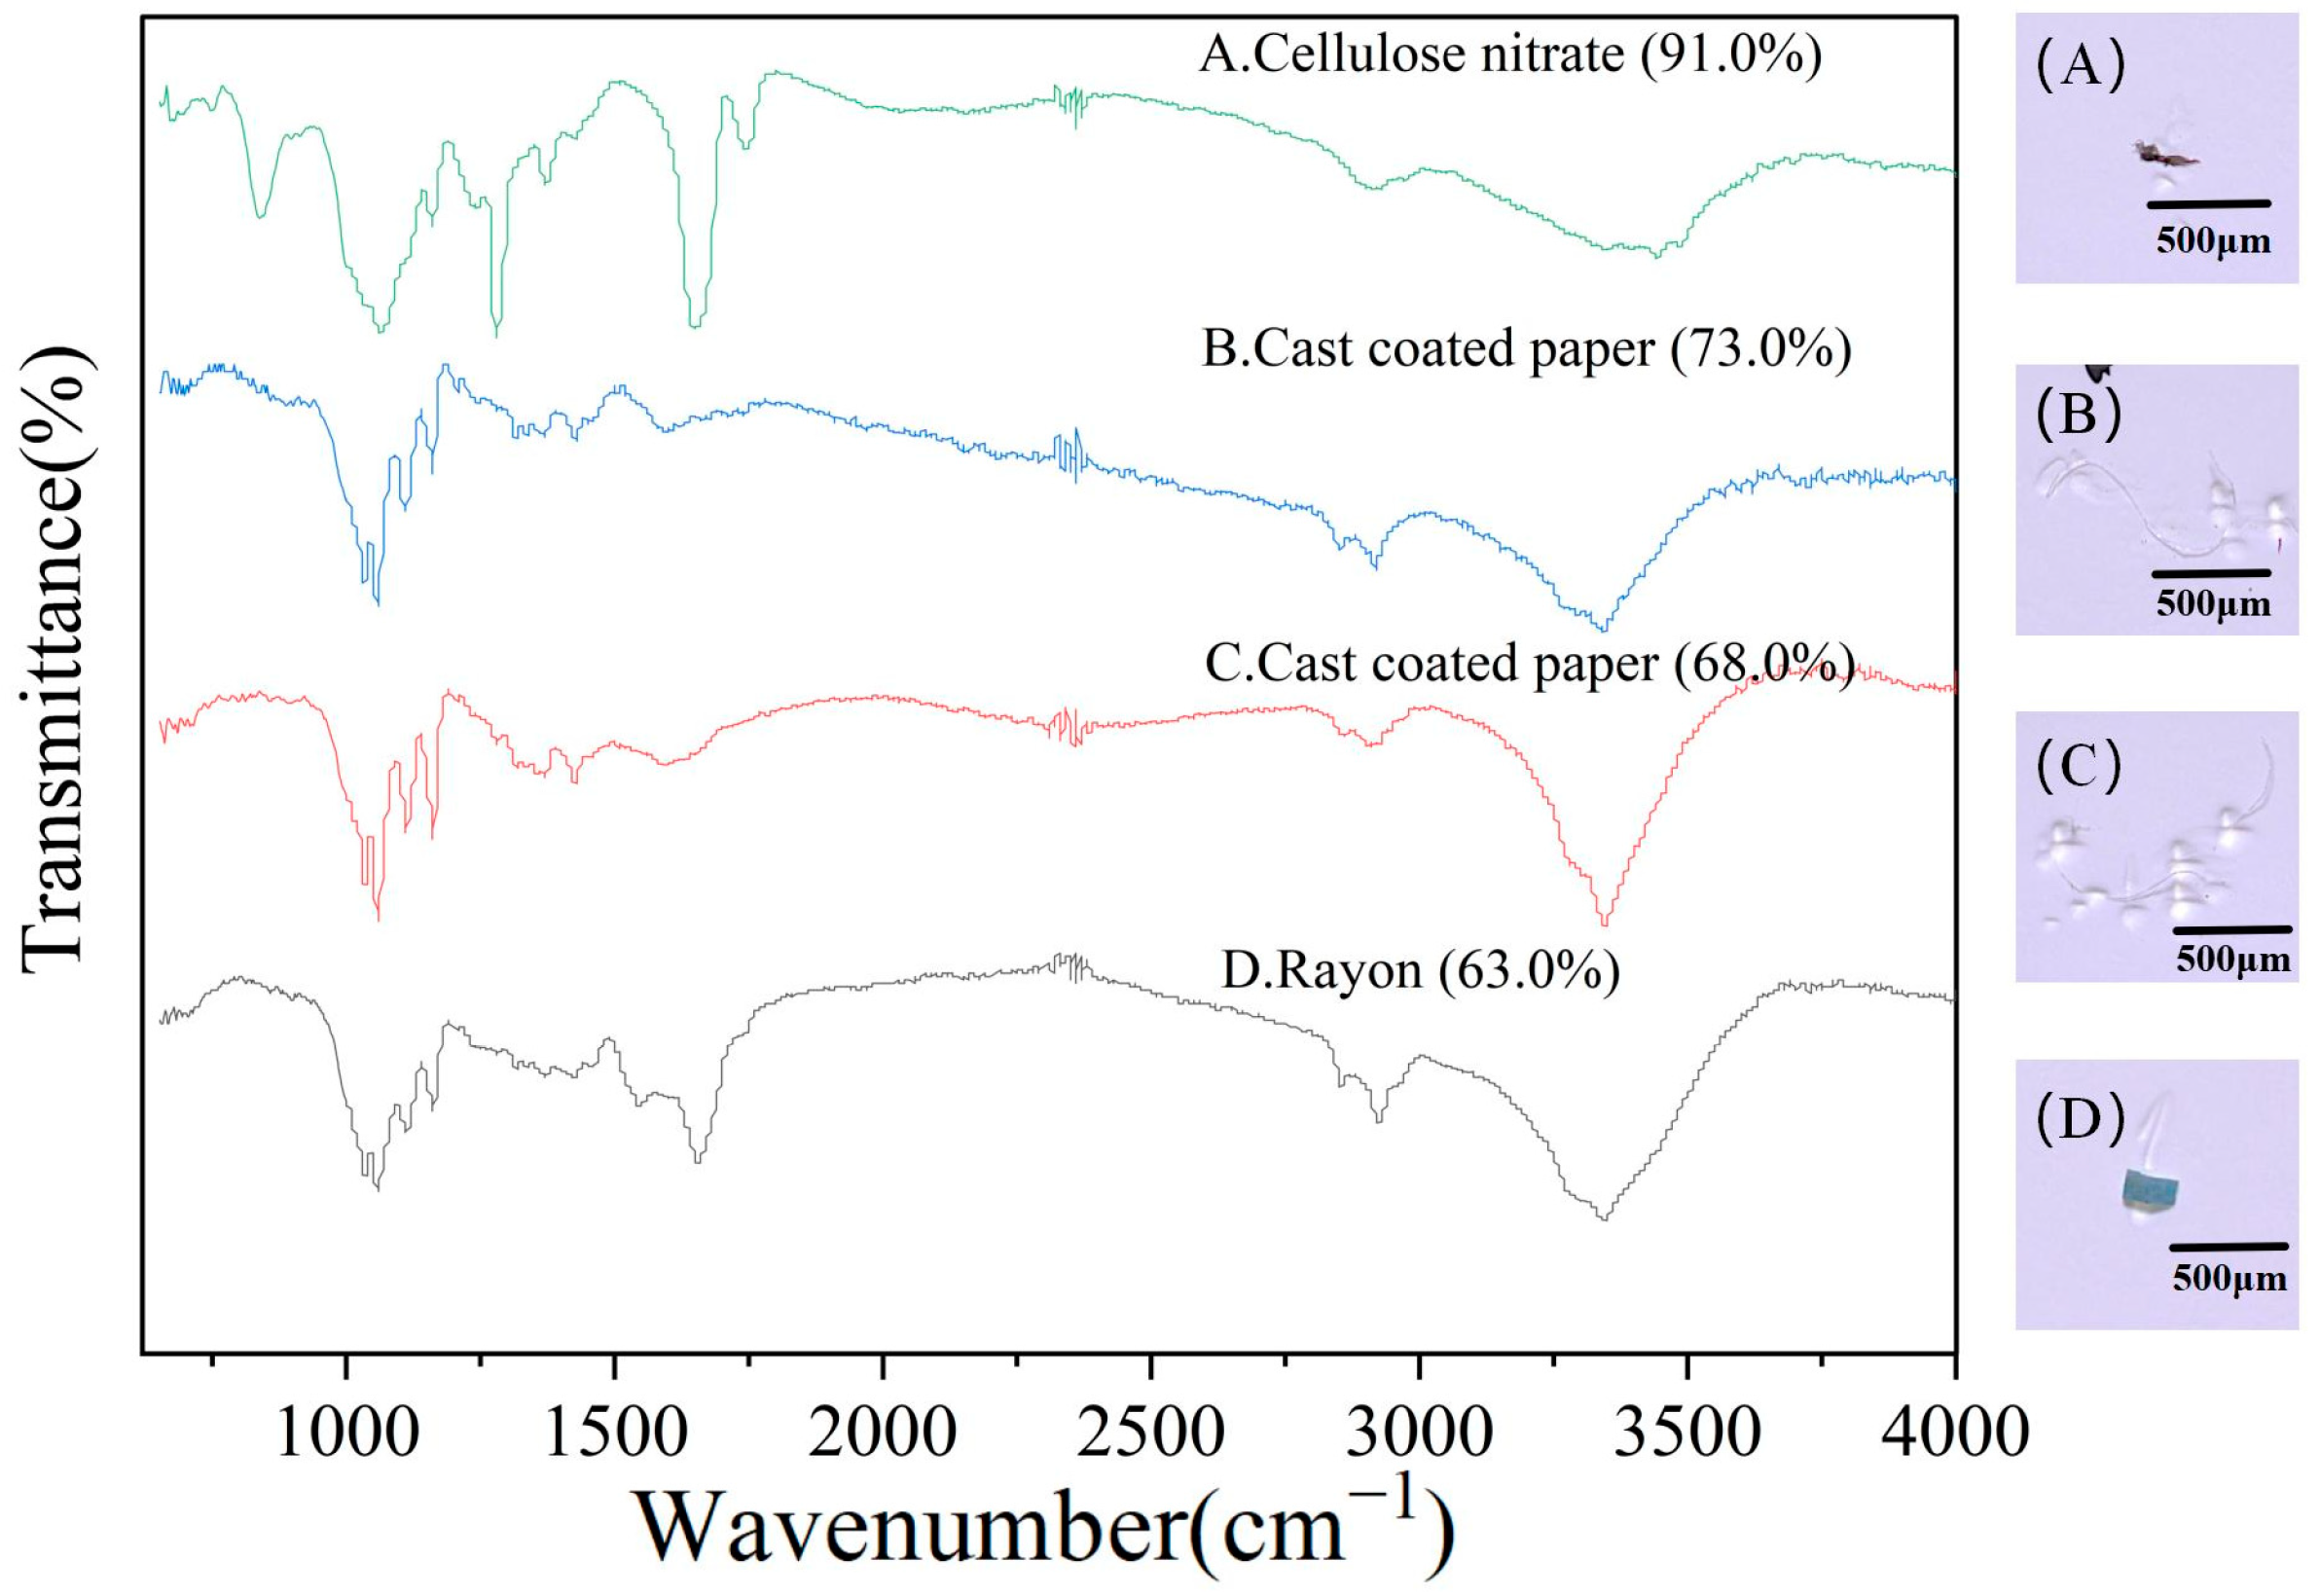
3.3. Hydrodynamics on MPs Composition in the Suixi River–Sea in ZJB

As demonstrated in Figure 4, the determination of the source of MPs was dependent upon a number of factors, including size, color and shape. In terms of the size of the detected MPs, the largest proportion was found in the range of 100–330 μm (52.2%), followed by those in the range of 500–1000 μm (19.0%), with the smallest proportion in the range of 2000–5000 μm (1.6%). The proportion of MPs in the ranges of 0–100 μm and 1000–2000 μm were comparable during all periods of the wet season. The proportion of MPs in the 2000 μm range was comparable. During the dry period, the highest proportion of MPs (38.7%) was observed in the range of 100–330 μm, followed by the ranges of 500–1000 μm (20.4%) and 330–500 μm (15.7%). The proportions of MPs were found to be similar for the ranges of 0–100 μm and 1000–2000 μm. The lowest proportion of MPs was observed in the 2000–5000 μm range (4.8%). Consequently, it could be inferred that the proportion of MPs was comparable in the 0–100 μm and 1000–2000 μm ranges. Therefore, it could be concluded that the size of MPs in water samples remained consistent throughout the seasons. However, the number of colors observed in the MPs varied. During the wet season, the maximum percentage of multicolored microplastic particles (37.8%) was observed, followed by transparent (27.6%), black (15.5%), and blue (8.4%) particles. While microplastic particles of other colors were also identified, they collectively constituted less than 5% of the total. In the dry season, the most prevalent color was clear (47.8%), followed by black (18.5%), brown (10.3%), and blue (6.3%), with all other colors representing less than 5% of the total. The shape of MPs detected in the wet season was similar to that of the dry season, with fibers being the most common form. This accounted for 82.7 percent of MPs detected in the wet season and 90.9 per cent of MPs detected in the dry season. The next most common forms were detritus and film.
Meanwhile, the infrared diagram in Figure 5 shows the typical characteristics and composition of MPs under micro-FTIR spectroscopy. Major polymers were found in selected samples of black film (A), white fiber (B), white fiber (C), and blue film (D), with the main types being cellulose nitrate (A), cast coated paper (B) (C), and rayon (D).

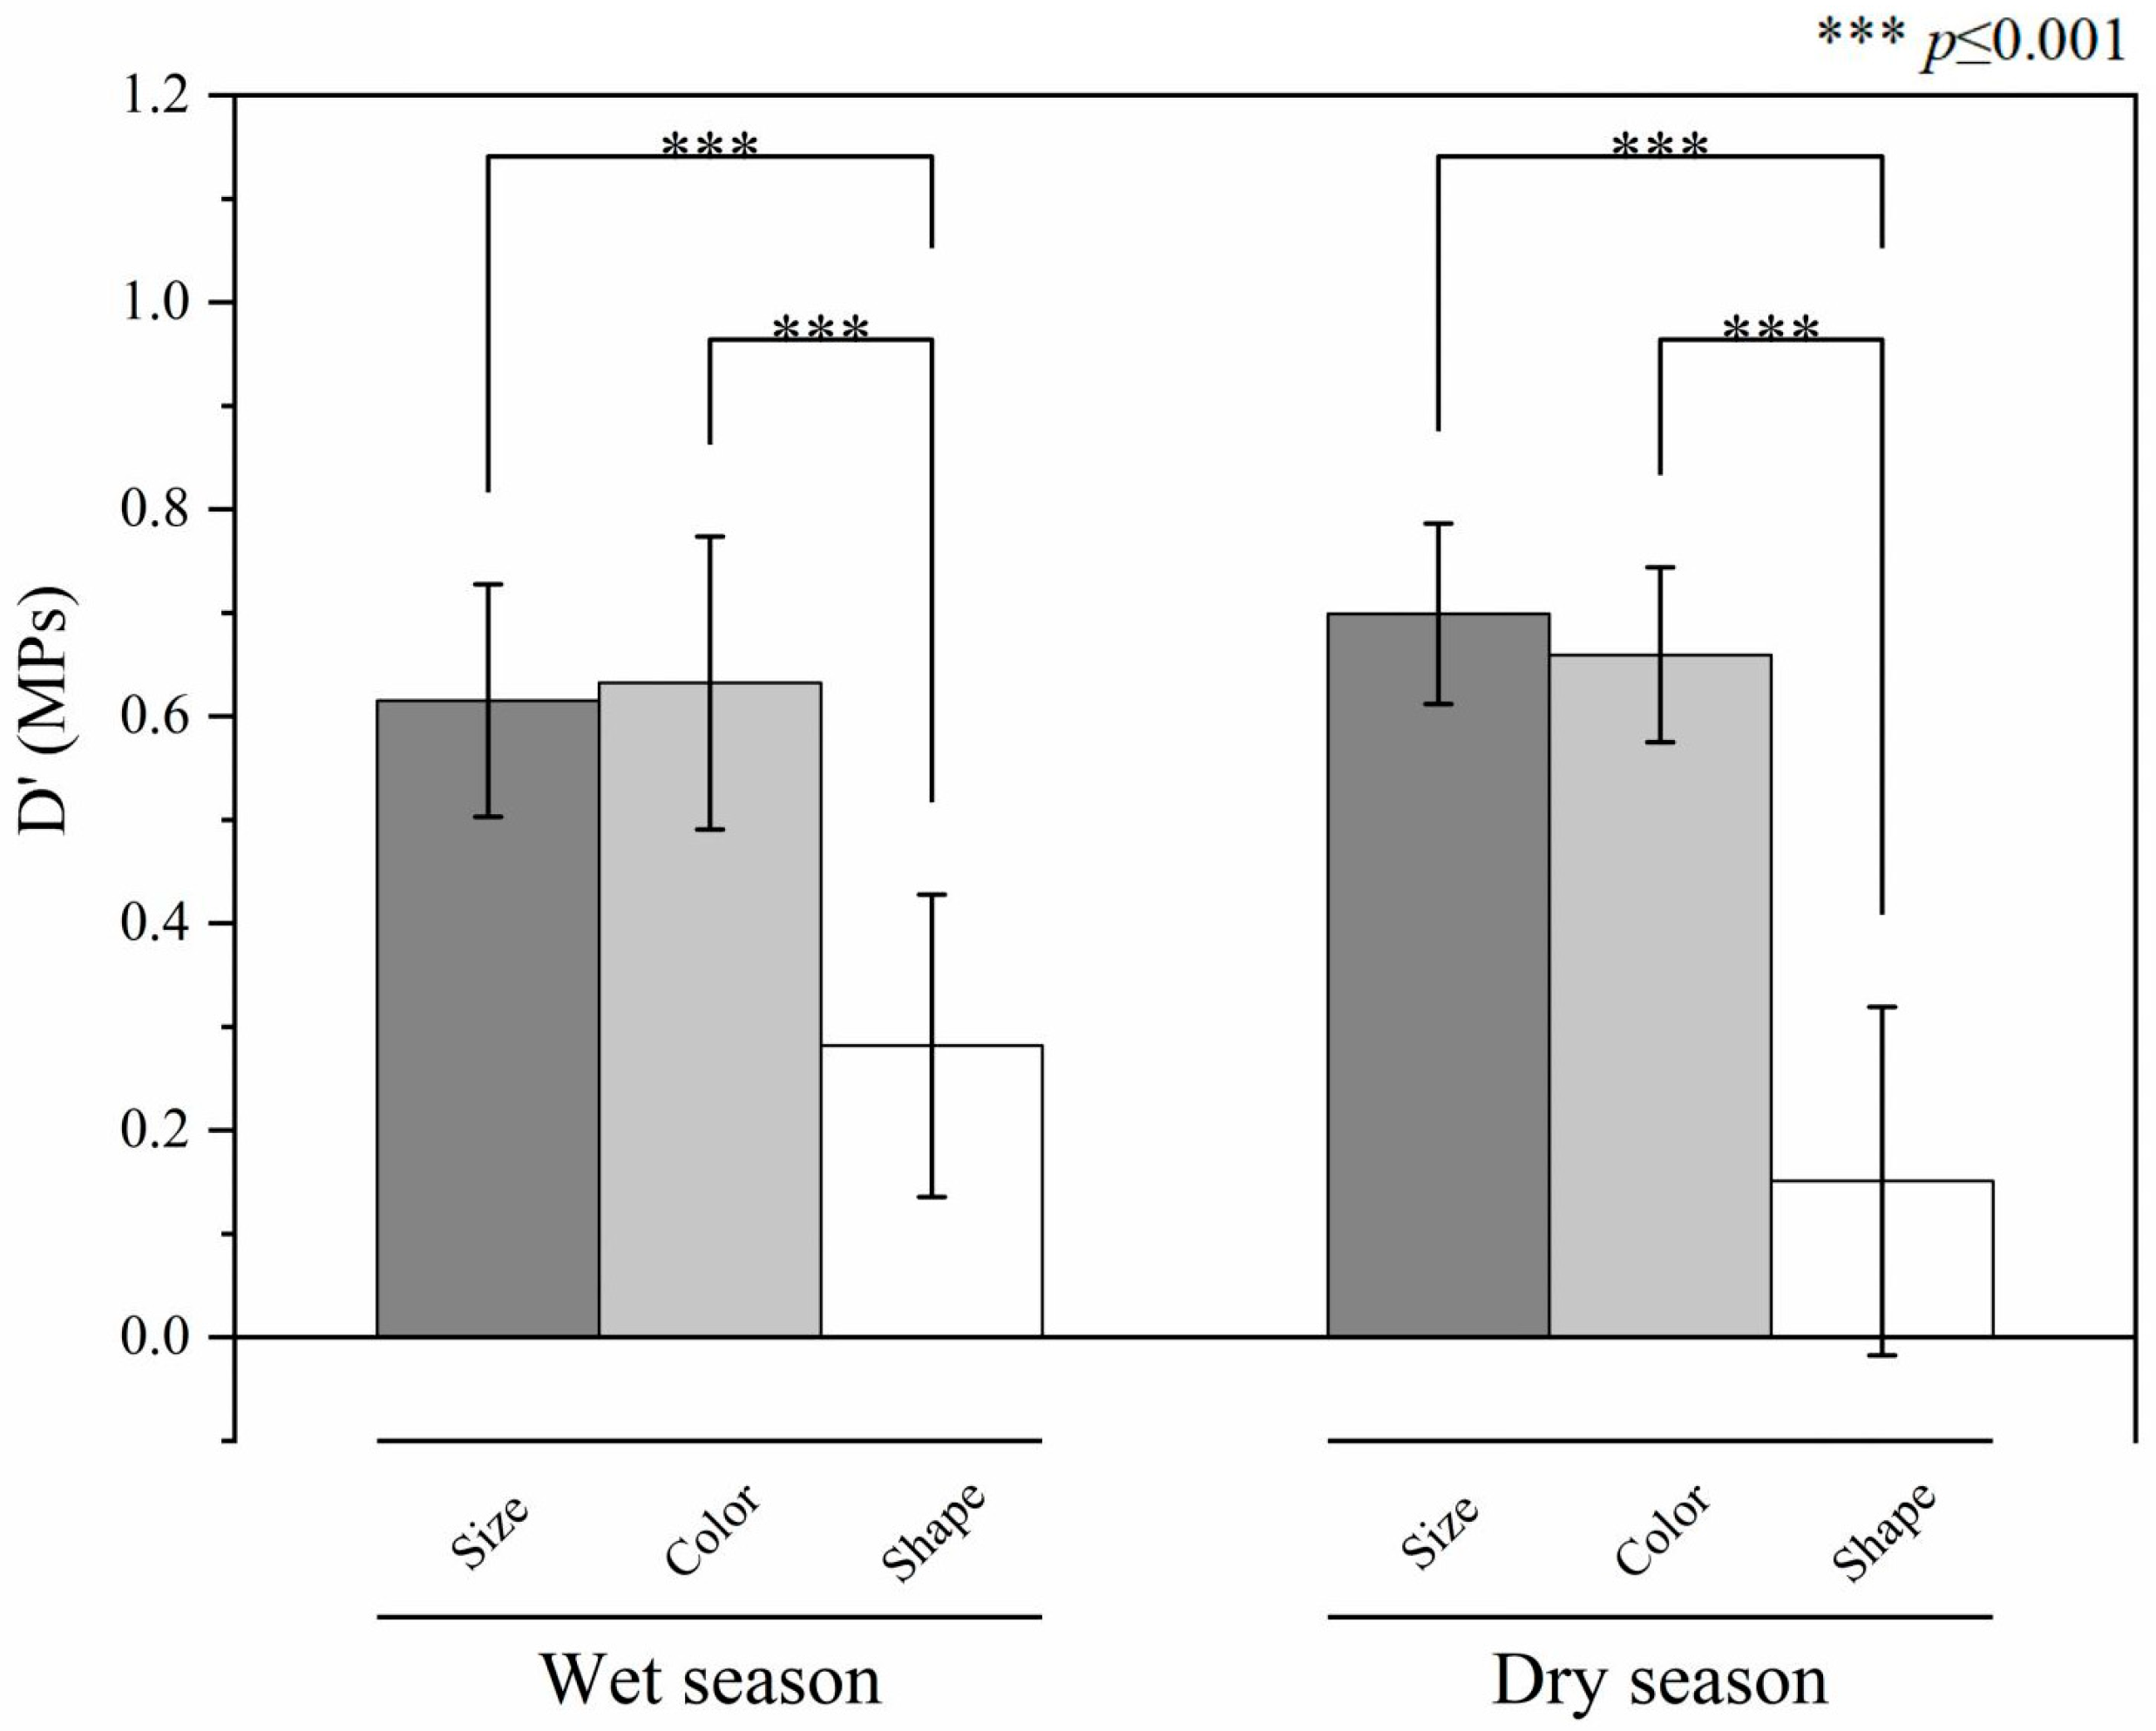
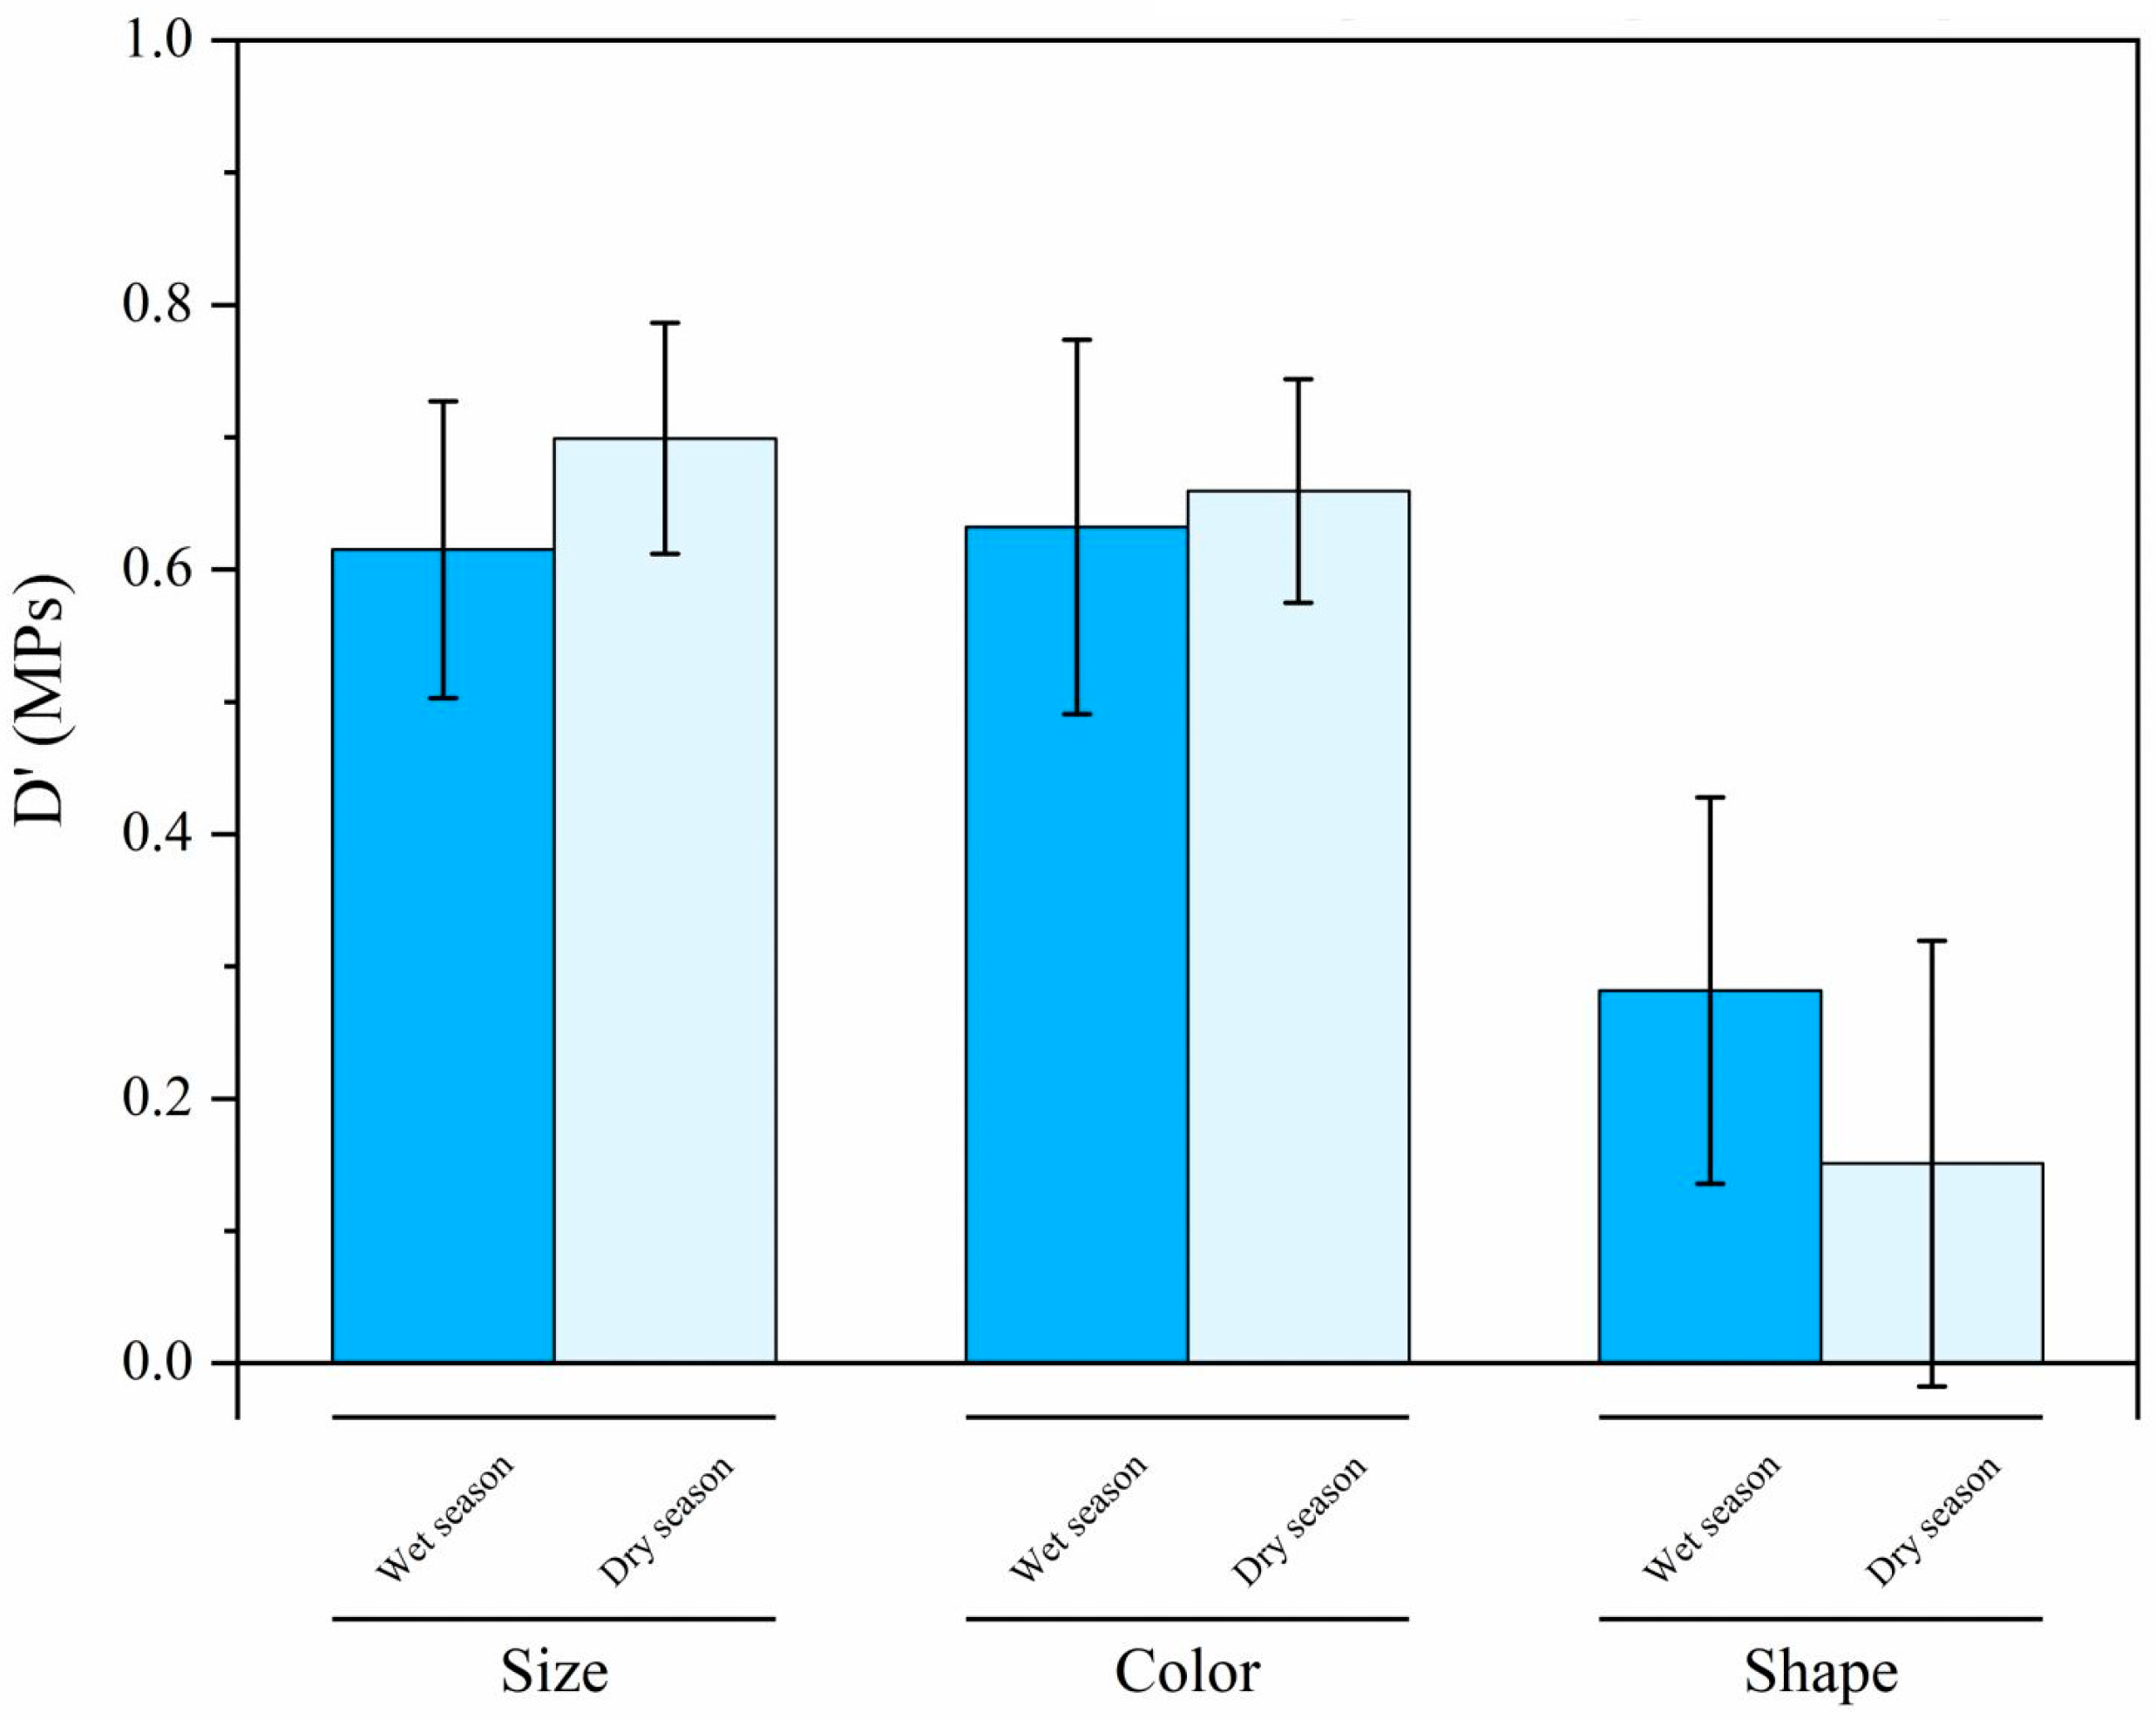
3.4. MPs on the Diversity of Dry and Wet Seasons in the River–Sea

The diversity indices of size, color, and shape (i.e., size D′, color D′, and shape D′) were calculated separately for MPs in the Suixi River according to the methodology outlined in Equation (1). As illustrated in Figure 6, a notable distinction was evident between size D′ (MPs) and shape D′ (MPs) during the wet season (p ≤ 0.001), as well as between color D′ (MPs) and morphology D′ (MPs) (p ≤ 0.001). A significant difference was observed between size D′ (MPs) and shape D′ (MPs) (p ≤ 0.001) and color D′ (MPs) and morphology D′ (MPs) (p ≤ 0.001) in the dry season. As illustrated in Figure 7, the diversity index analysis comparing size, color, and shape in the dry and wet seasons, respectively, did not reveal any significant differences between the two.

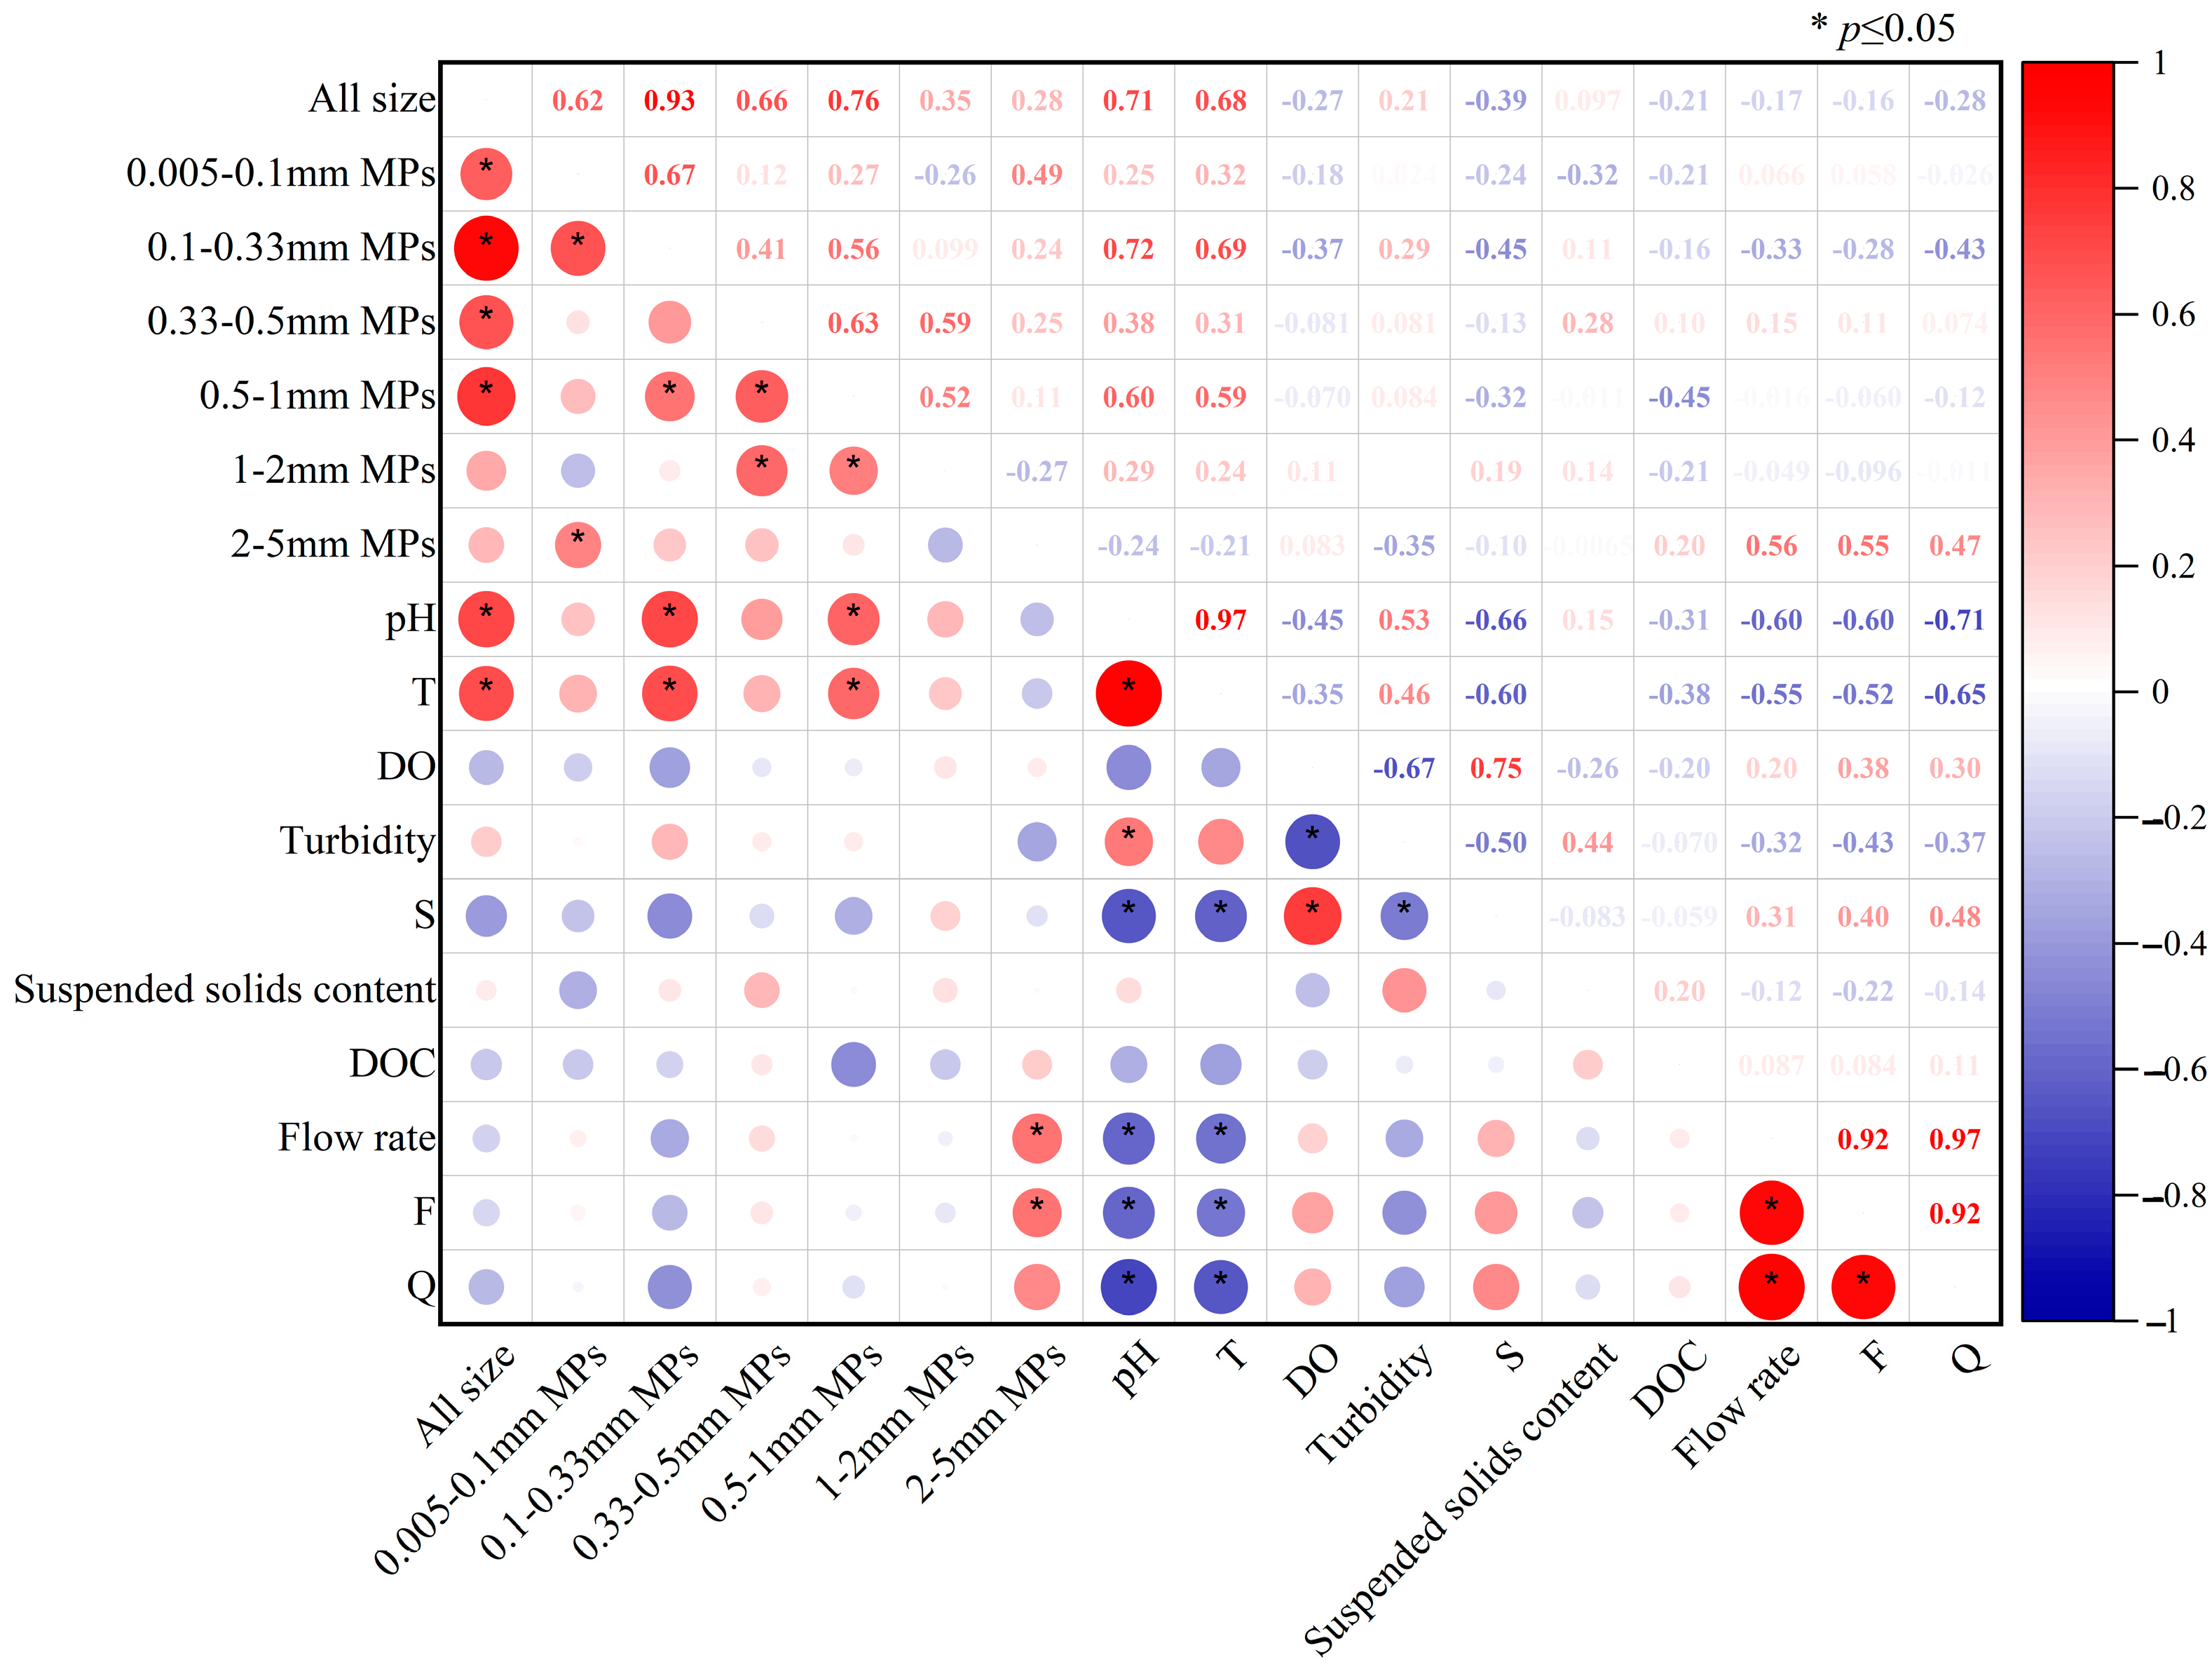
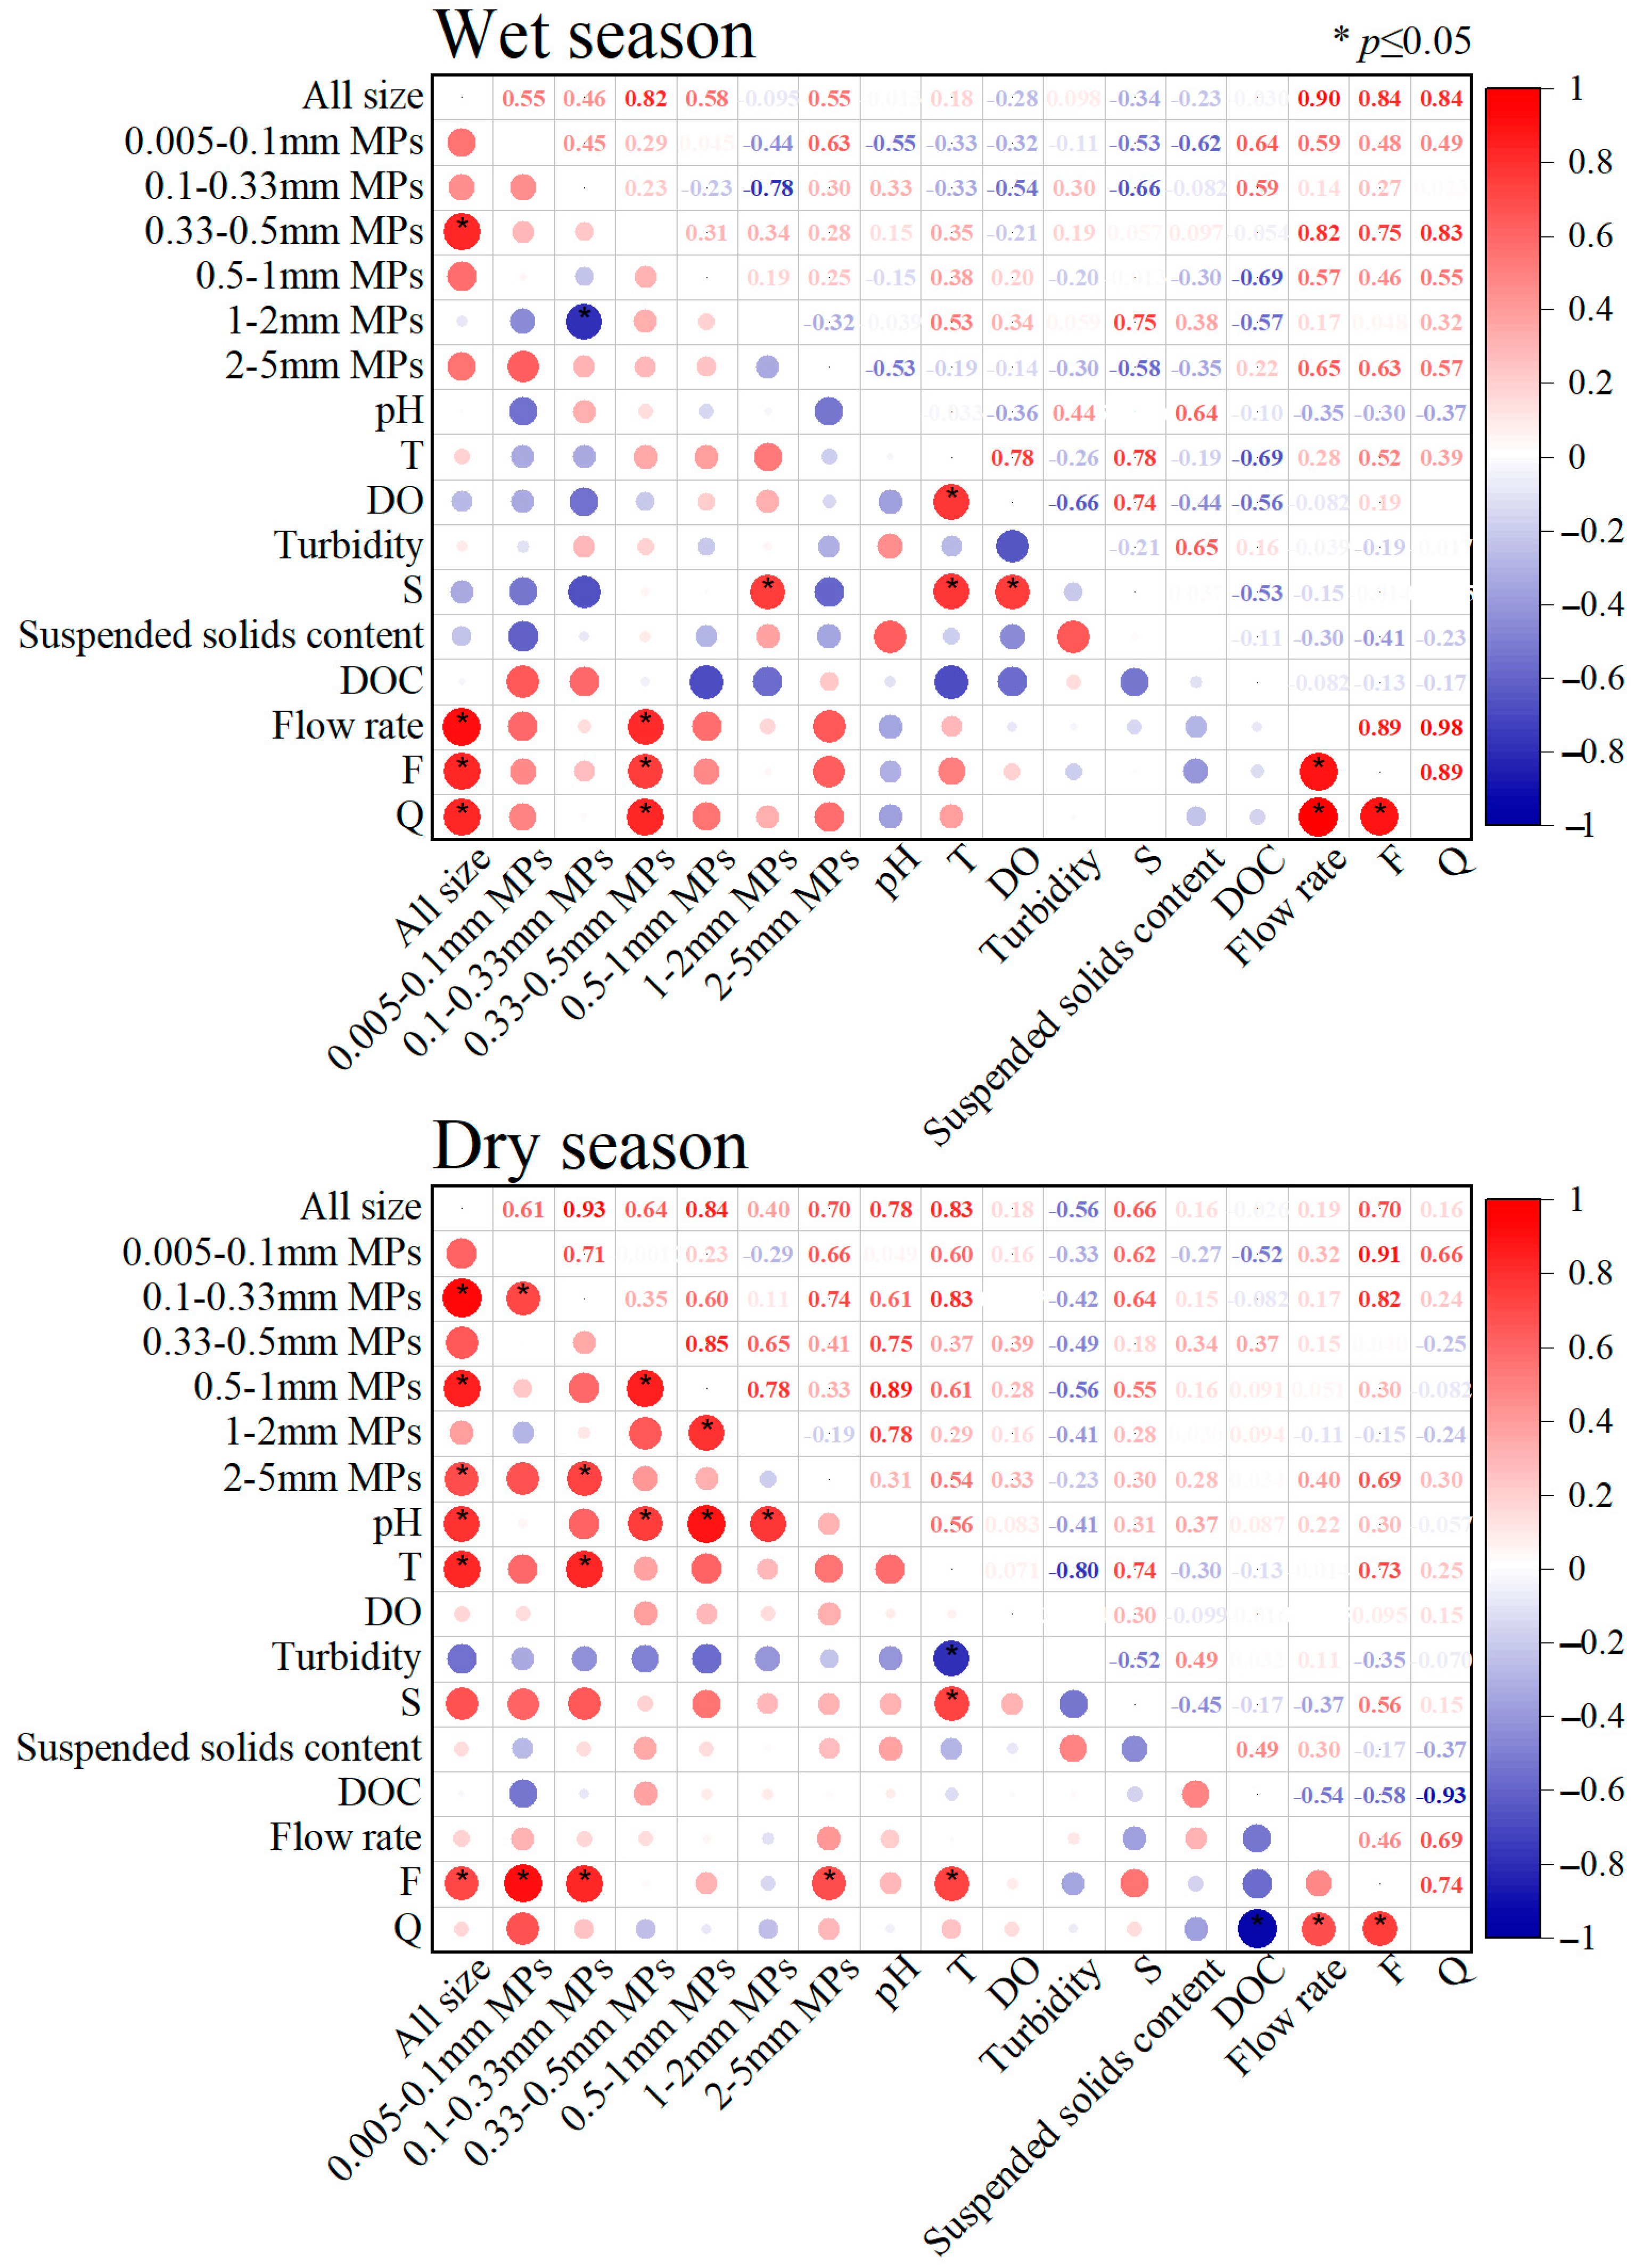
3.5. Relationships Between MPs of Different Sizes in the Suixi River–Sea as Influenced by Hydrodynamics and a Variety of Factors

The correlation plot derived from the pooled data across both seasons indicated a positive correlation (p < 0.05) between all MP sizes and MPs of 0.005–0.1 mm, 0.1–0.33 mm, 0.33–0.5 mm, and 0.5–1 mm (Figure 8). Furthermore, MPs of 0.005–0.1 mm were found to be positively correlated (p < 0.05) with MPs of 0.1–0.33 mm and 2–5 mm. Furthermore, MPs of 0.1–0.33 mm demonstrated a positive correlation with MPs of 0.5–1 mm (p < 0.05). Furthermore, MPs between 0.33–0.5 mm were found to be positively correlated with MPs of 0.5–1 mm and 1–2 mm (p < 0.05). Moreover, MPs of 0.5–1 mm demonstrated a positive correlation with MPs of 1–2 mm (p < 0.05). Temperature (T) and pH exhibited a positive correlation with all MP sizes, including 0.1–0.33 mm and 0.5–1 mm MPs (p < 0.05). Besides, MPs between 2–5 mm were found to be positively correlated with flow rate and flux (F) (p < 0.05).
As demonstrated in Figure 9, a positive correlation existed between the abundance of MPs and their size, both in dry and wet seasons. The results of the correlation analysis indicated a positive correlation (p < 0.05) between wet season MP sizes and MPs in the size ranges of 0.1–0.33 mm, 0.5–1 mm, and 2–5 mm. Furthermore, MPs measuring 0.005–0.1 mm demonstrated a positive correlation (p < 0.05) with MPs of 0.1–0.33 mm, 0.33–0.5 mm, and 0.5–1 mm. Furthermore, Flux (F) demonstrated a positive correlation (p < 0.05) with all MP sizes, including 0.5–1 mm, 0.1–0.33 mm, and 2–5 mm. Additionally, pH exhibited a positive correlation (p < 0.05) with all MP sizes, including 0.33–0.5 mm, 0.5–1 mm, and 1–2 mm MPs. Temperature (T) demonstrated a positive correlation (p < 0.05) with all MP sizes, including 0.1–0.33 mm MPs. Furthermore, a positive correlation was observed between all MP sizes and MPs measuring 0.33–0.5 mm during the dry season (p < 0.05). Conversely, MPs of 0.33–0.5 mm were found to be negatively correlated with MPs of 1–2 mm (p < 0.05). Furthermore, MPs of 1–2 mm were found to be positively correlated with salinity (S) (p < 0.05). Furthermore, MPs of 0.33–0.5 mm were found to be positively correlated with flow rate, flux (F), and net water flux (Q) (p < 0.05). Consequently, MPs of all sizes were found to be positively correlated with flow rate, flux (F), and net water flux (Q) (p < 0.05). However, the correlation plots indicate that some data sets exhibit low correlation, potentially due to insufficient data collection.

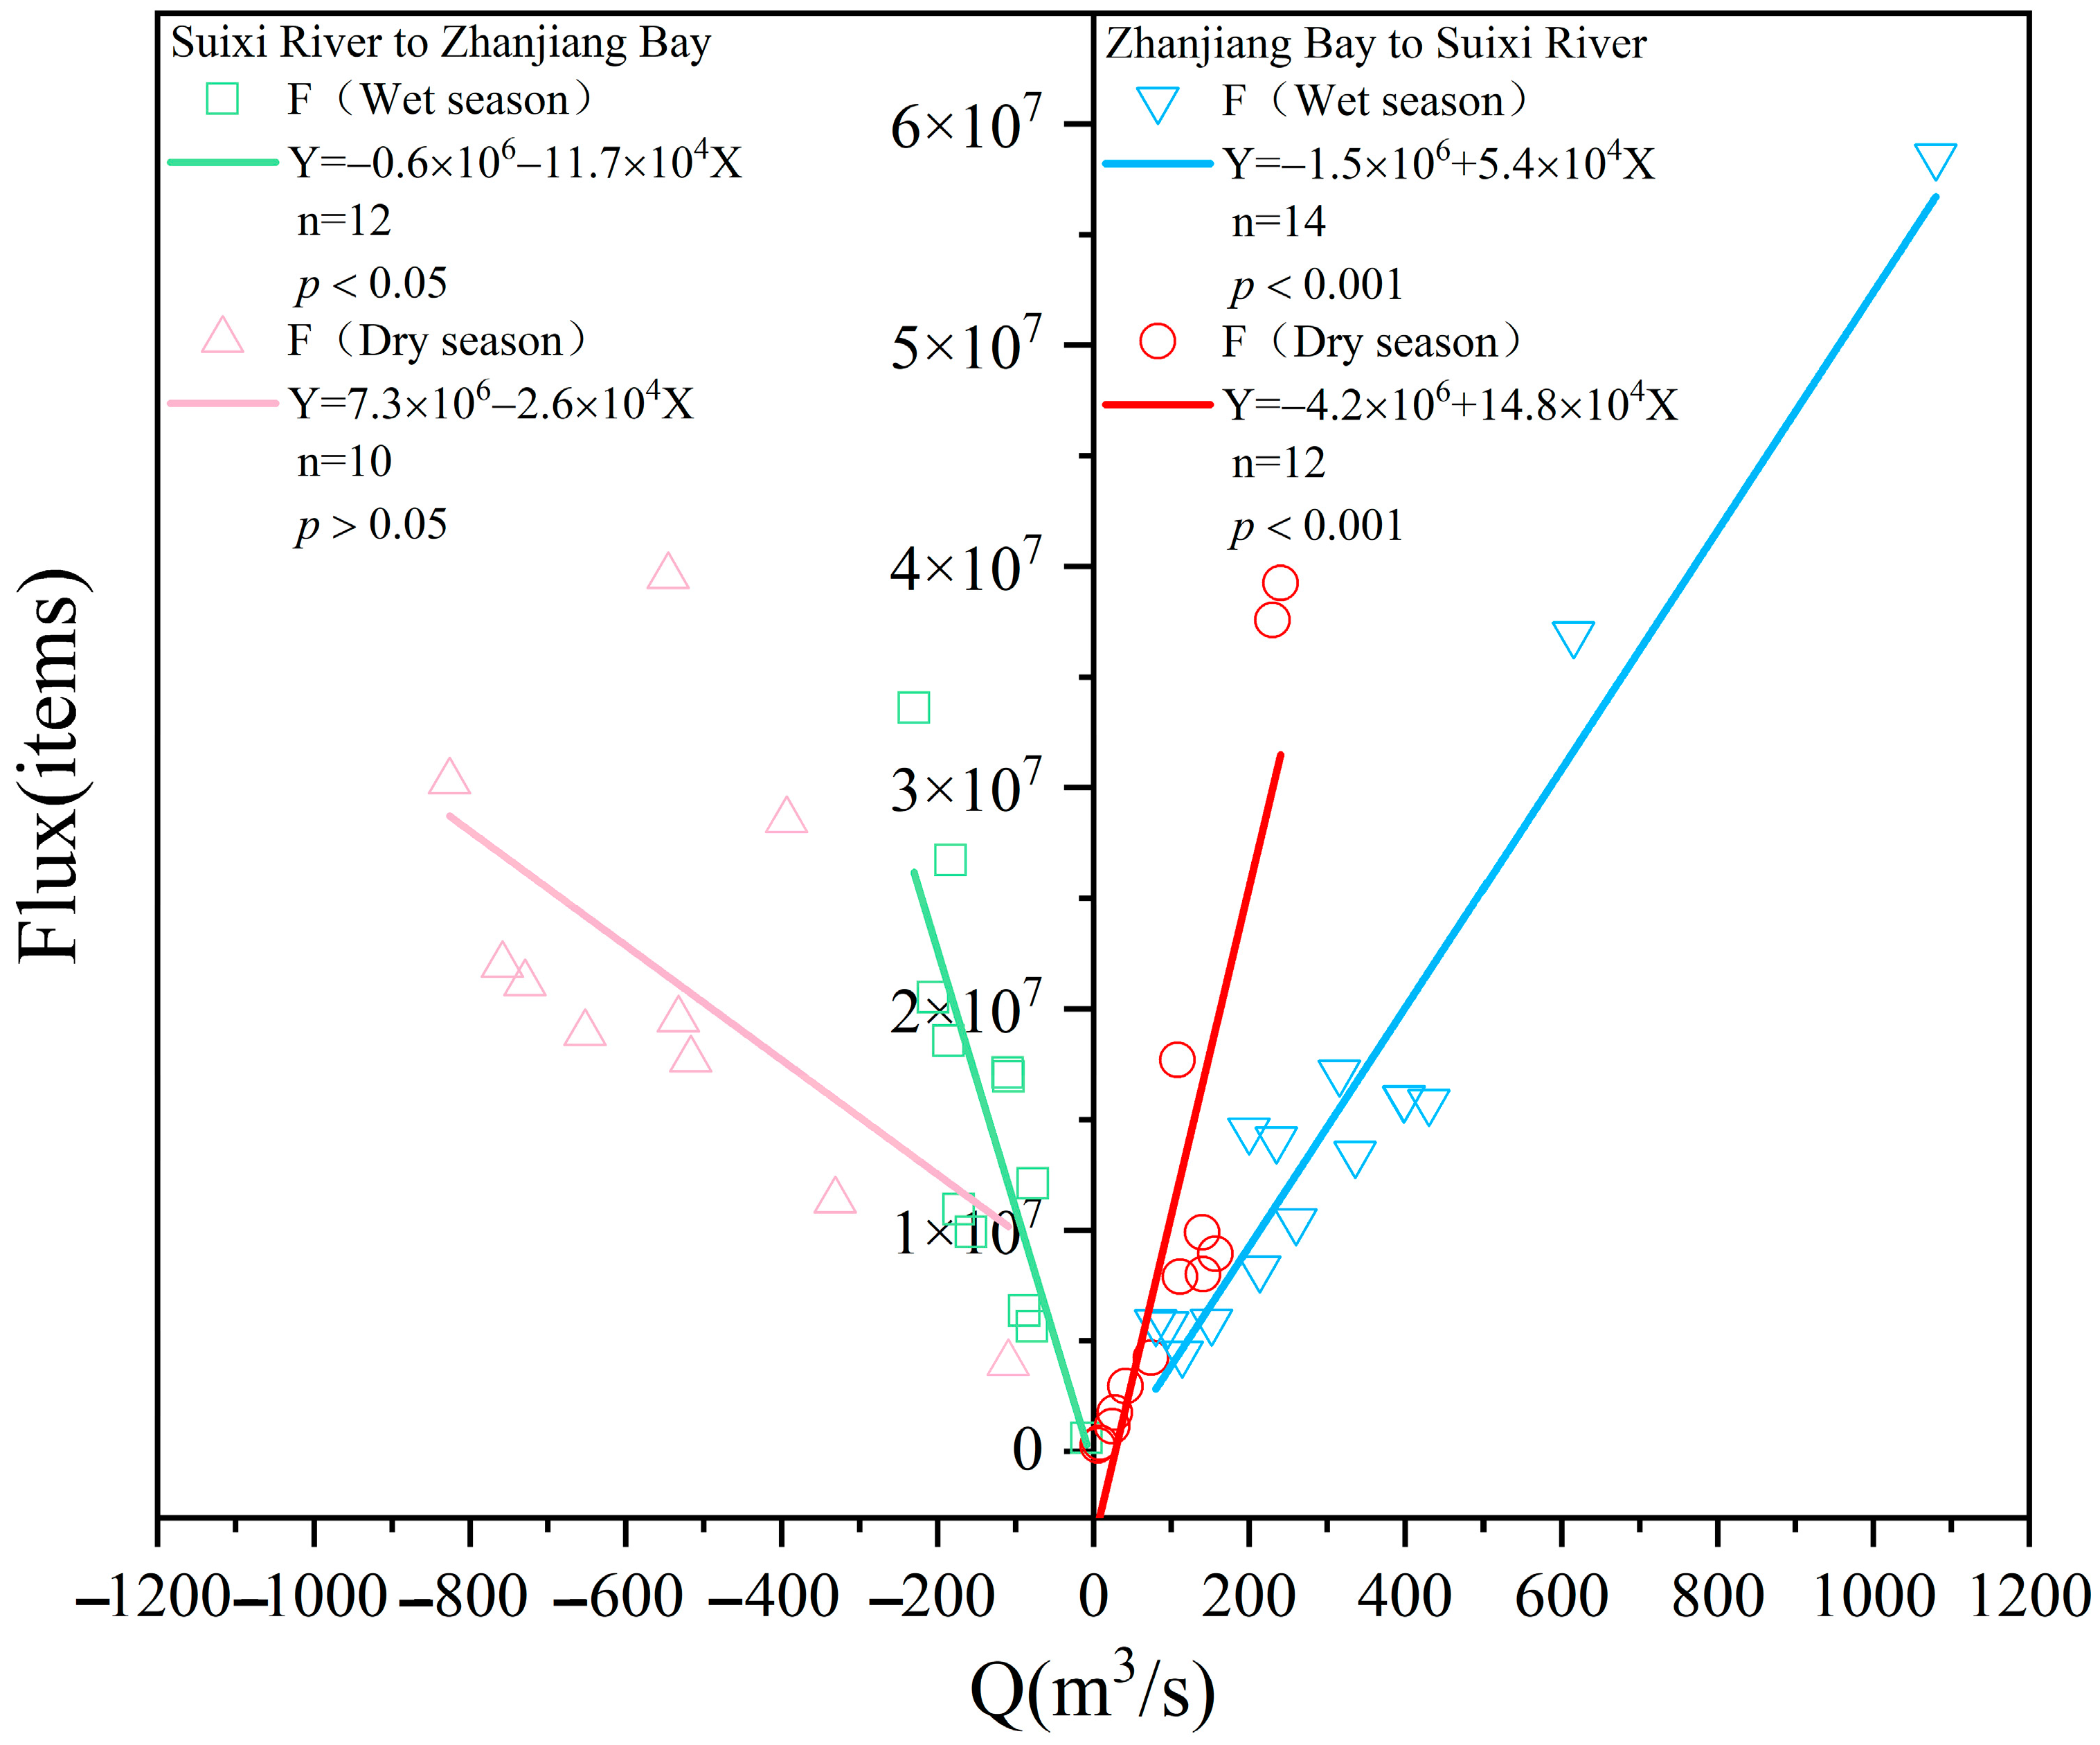
3.6. Hydrodynamic Regulation of MPs Flux into the River–Sea

As demonstrated in Figure 10, the 24 h MPs flux reached 1.78 × 10⁸ items during high tide and 1.28 × 10⁸ items during low tide in the dry season. In the wet season, the 24 h MP flux reached 1.55 × 10⁸ items during high tide and 2.01 × 10⁸ items during low tide. Figure 10 illustrates the correlation between net hydrological flux (Q) and MPs flux (F) across both seasons. A positive correlation was noted between net hydrological flux (Q) and MPs flux (F) in both seasons. In the wet season, the net water flux peaked from 10:00–11:00 p.m., troughed at 20:00 p.m. and 6:00 a.m., with the highest MPs flux at 10:00 p.m. (3.93 × 10⁷ items) and the lowest at 2. In the dry season, the net water flux was highest at 11:00 p.m., with peak MPs fluxes at 17:00 p.m. and 23:00 p.m. The correlation between net water flux (Q) and MPs flux (F) was positive in both seasons. The highest MPs flux (5.85 × 10⁷ items) occurred at 11:00 p.m., and the lowest (3.99 × 10⁶ items) at 23:00 p.m. Overall, the net water flux and MPs flux were higher in the wet season compared to the dry season. Thus, Equation (3) shows the dry season’s ocean-to-estuary MPs flux at 3.45 × 10⁷ items over 24 h, and the wet season’s estuary-to-ocean flux at 3.01 × 10⁷ items. Subsequently, the annual flux of MPs transported from the estuary to the ocean was calculated to be 1.61 × 10⁹ items. As a consequence of tidal dynamics, the quantity of MPs transported from ZJB to Suixi Estuary during the dry season was greater than that transported from Suixi Estuary to ZJB over a 24 h period. In contrast, the quantity of MPs transported from ZJB to Suixi Estuary during the wet season was smaller than that transported from Suixi Estuary to ZJB.

4. Discussion

4.1. Levels of Microplastic Pollution in the Suixi River–Sea

Table 2 shows our comparative analysis of MPs abundance in global river estuaries. This study utilized a 45–50 μm sieve for sampling, contrasting with other methods such as the 10–333 μm sieve. The Suixi River showed slightly higher MP pollution levels than other global estuaries and harbors. The collected data showed the Suixi River Estuary’s MPs abundance surpassing all other regions listed. This disparity likely stems from the lack of standardized definitions for MPs, especially regarding size and sampling techniques. Thus, caution is advised when comparing sites. Direct water column sampling was more accurate than methods like the Neuston net [43], manta ray trawl [44], and biosampling. Plastic may also have entered the river differently, experiencing varying shear forces, leading to varying microplastic sizes at sampling sites [45]. Besides population density driving higher MPs abundance, high river inputs and substantial wastewater discharges from urban areas with low treatment capacities [46] also contributed to elevated MPs levels compared to other estuaries [21]. According to the statistics of Zhanjiang Municipal Bureau of Statistics, in 2023, the number of tourists exceeded 2 × 10⁷, and the resident population in the area where the Suixi River is located also exceeded 800,000 (2023 Zhanjiang Municipal Economic and Social Development Statistical Bulletin). Research showed that there are many drainage outlets near the Suixi River [31]. Conclusively, the Suixi Estuary’s appeal and the industries around ZJB, contributing significant wastewater, explained the high MPs abundance. Our study revealed significant variations in MPs abundance between low and high tides. This pattern likely results from the high tide’s mixture of seawater and a smaller volume of river water. River water contained higher MP concentrations due to substantial terrestrial inputs, while seawater had significantly lower MPs levels than the estuary. Thus, MPs abundance at low tide exceeds that at high tide.

4.2. Seasonal Variation in the of MPs in the River–Sea

Previous research has concluded that MPs are more prevalent during the wet season than the dry season [54,56,57]. The results of these studies indicate that the mean abundance of MPS in the dry season (42.6 ± 16.4 n/L) is significantly lower than the mean abundance of MPs in the wet season (97.2 ± 46.0 n/L). The wet season exhibited a significantly higher abundance of MPs compared to the dry season, particularly at both the lowest and highest tide levels. The wet season’s low tide level (156.3 n/L) exhibited an abundance 1.2 times higher than the dry season’s (72.5 n/L), while the wet season’s high tide level (146.00 n/L) displayed an abundance 4.3 times higher than the dry season’s (34.3 n/L). It can thus be concluded that MPs were present in greater abundance during the wet season than the dry season in the present study. During the exchange of seawater with river water, the abundance of MPs in the wet and dry seasons exhibited less discrepancy. The overall flow rate in the wet season was greater than that in the dry season, and the net water flux in the wet season was greater than that in the dry season. It had been demonstrated that the majority of microplastic pollutants are produced by human activities on land and could be transported into freshwater ecosystems through runoff processes [58]. In addition to other factors, correlation analyses of MPs may be conducted to examine the relationship between microplastic abundance and temperature. This can be achieved by investigating the impact of temperature on the interactions between pollutants and aquatic invertebrates and plankton in the ocean [59,60]. Salinity and turbidity also exert an influence on the abundance of MPs, which tend to accumulate at the turbidity maximum in the estuary. This provides an opportunity to analyze the microplastic abundance based on turbidity [61]. Sousa and colleagues propose that the abundance of MPs is affected by the rate of flushing in the estuary, namely the effect of flow velocity [62]. During the wet season, more extreme flows can exacerbate microplastic contamination in these water bodies and resuspend particles that have previously been trapped in sediments [63]. In the absence of precipitation, these plastics have an extended residence time in rivers and continue to degrade over time [64]. It can thus be concluded that during the wet season, when precipitation levels are high and river volume is high, a significant quantity of terrestrial plastics are transported into the river, resulting in an increase in microplastic abundance. Conversely, during the dry season, when precipitation levels are low, only a minor quantity of terrestrial sources are present, and a greater concentration of MPs present in river–bottom sediments is observed. During the wet season, the salinity of the water body was below 2.0 PSU, with the lowest salinity recorded at 0. 1 PSU, indicating that during the irregular semi-diurnal ebb and flow process, there was a large influx of seawater at high tide, resulting in increased salinity, greater buoyancy, slower sinking of microplastic particles and greater abundance of MPs; Conversely, during low tide, an influx of freshwater led to the transportation of microplastic particles from the estuary to the ocean, resulting in decreased salinity, decreased buoyancy, and faster sinking of microplastic particles, thereby leading to reduced microplastic abundance at low tide. In addition, tidally induced hydrological changes have been shown to cause MPs in marine sediments to return to the surface [65], an effect that is more pronounced during rainfall and tides [54,64,65,66]. It had also been determined that water density stratification due to salinity changes has a significant impact on the vertical distribution and horizontal transport pathways of MPs. Furthermore, it has been established that sediment resuspension and salinity changes are pivotal parameters affecting microplastic transport, particularly within estuarine systems [67,68,69]. The transport of MPs is also influenced by the various forces that affect estuarine hydrodynamics at different timescales, such as wind, tides, river currents, and waves.

4.3. Influence of Seasonal Variation and Tidal Dynamics on the Abundance and Flux of MPs in the River–Sea

In light of the survey conducted on the importance of MPS and the results presented in Figure 11, the following analyses have been conducted. Elevated temperatures modify the sensitivity of organisms to pollutants, thereby increasing the pollutants and resulting in adverse effects on the producing organisms [59,60]. Our study revealed a significant correlation between T and abundance based on data from both seasons. Additionally, T and S influence the adsorption capacity of MPs concurrently [70], as evidenced by the positive correlation between T and abundance observed in our study. In their analysis, Sousa and colleagues present the argument that the abundance of MPs is influenced by the rate of estuarine flushing, defined as the flow rate [62], and that reduced flushing rates result in increased MPs accumulation within the estuary [71]. The positive correlation between flow rate and abundance during the dry season in the analyses from our study indicates that microplastic abundance during the dry season is more influenced by flow rate than microplastic abundance during the wet season. Although the flow velocity was lower during the dry season than the wet season, the flux of MPs was higher during the dry season due to the reduced flushing of the estuary, which resulted in a greater accumulation of microplastic particles within the estuary. River flow intensity had been demonstrated to resuspend MPs from the sediment into the water column [65,69,72,73]. The wet season is characterised by high precipitation levels, resulting in the influx of considerable quantities of freshwater into the estuary. In contrast, the dry season is characterised by low river flow rates, attributable to reduced rainfall. Such low river flows have been observed to enhance the deposition of MPs and reduce their abundance in the water column. In general, high precipitation during the wet season results in a greater quantity of terrestrial MPs being input into the estuary, thereby facilitating their flushing process to the sea [61]. The high level of perennial precipitation at the study site resulted in reduced precipitation during the dry season in comparison to the wet season. This may have resulted in a greater microplastic flux during the dry season than the wet season, and a positive correlation between flow rate and F across different seasons, as evidenced by the findings of our study. Furthermore, other studies have demonstrated that the concentration of MPs is higher during the dry season [74]. This phenomenon may be attributed to elevated precipitation levels, which precipitate an increase in riverine flux, thereby diluting MPs concentrations within the estuary [57]. Furthermore, salinity and turbidity have been demonstrated to exert an influence on the abundance of MPs, which tend to accumulate at the turbidity maximum in the estuary [61]. During the wet season, lower salinity and reduced buoyancy resulted in faster sinking of MPs. In contrast, during the dry season, higher salinity and reduced buoyancy resulted in slower sinking of MPs. Nevertheless, the correlation between turbidity and salinity on changes in microplastic abundance was found to be relatively weak in this study. The concentration of chlorophyll a is a reliable indicator of plankton activity. In this study, a positive correlation was observed between the abundance of MPs with a diameter of 0.33–2 mm and chlorophyll a during the wet season. The shape of a microplastic also affects its settling rate. For instance, fibers settle at a rate approximately two orders of magnitude lower than that of particles [75]. The slow settling rate of fibers suggests the presence of a higher fiber content in the water column. Consequently, the fiber percentage was found to be the highest in the water samples tested during both seasons.

4.4. Mitigation Strategies to Reduce the Accumulation of MPs in River–Sea Interface

This study indicates that the abundance and flux of MPs are affected by seasonality, the influence of complex tidal activity, and a variety of hydrological factors. Despite the limited understanding of this phenomenon, the continuous development of economic and cultural development has led to an increased concern among the public regarding the environmental impacts of MPs [57]. However, there is still a significant lack of awareness regarding the spawning hazards of MPs to the environment [57]. Rivers were identified as the primary conduit for plastic waste to enter the ocean [13]. The results of our observations indicated that the predominant color across the seasons was transparent, followed by black and blue. This provides important clues for us to trace the source of MPs. Transparent MPs may originate from human activities other than fishing gear packaging [76], plastic packaging used by travelers [77], and colored MPs may originate from apparel materials, packaging, and other commercial applications [78]. It was demonstrated that black MPs are derived primarily from tires transporting black rubber debris through road runoff [21]. Furthermore, clear, white, and blue plastic waste are preferentially ingested by aquatic organisms [79,80]. Most of the sewage outlets are located at the confluence of seawater and river water in Zhanjiang City, so the abundance and flux of microplastics may also be affected by sewage outlets [31,81]. Consequently, prioritizing environmental protection in the development of fisheries, tourism and textile industries represents an efficacious strategy for the mitigation of microplastic pollution in estuaries. The study revealed that fiber constituted the highest percentage of MPs, followed by debris and film, respectively. Upon entering the river, plastics are gradually broken down into different sizes and shapes of MPs under the influence of various shear stresses, including photodegradation and physical decomposition. Additionally, the use of different sampling methods may also influence the observed sizes of MPs [45]. The sources of fibers may be diverse, including textiles, clothing, PCP, discarded ropes, sewage sources, and large-scale marine traffic and fishing activities [57]. Consequently, the production of fiber products for discharge and the implementation of sewage treatment are crucial tools for the mitigation of fibrous MPs in river waters. Consequently, in areas where human activities are considered to be intensive, the focus should be on the discharge of relevant pollution sources first, followed by the development of advanced treatment technologies to track and recycle MPs to reduce the discharge of MPs at the source. Concurrently, the government should integrate the monitoring of MPs in estuaries into the routine monitoring system of urban rivers, thereby enabling the effective prevention and control of MPs through the data pattern. Furthermore, the general public should be encouraged to take care of the environment, minimize the use of plastics, and refrain from discarding plastics randomly, in order to effectively reduce the ecological risk of MPs in multiple ways.

5. Conclusions

The present study aimed to investigate effects of the hydrology on the abundance, composition, and flux of MPs from the Suixi Estuary to ZJB in the South China Sea across different seasons. The results obtained indicate that the Suixi Estuary of ZJB had a higher mean abundance of MPs in comparison to other global estuaries. Furthermore, the MPs abundance exhibited a negative correlation with high tide and a positive correlation with low tide. The collected MPs were predominantly 100–300 μm in size, transparent in color, and fibrous in shape. Calculations revealed a dry season MPs flux of 1.78 × 10⁸ items at high tide and 1.28 × 10⁸ items at low tide, with more MPs moving from ZJB to Suixi Estuary than vice versa. The wet season’s 24 h MP flux peaks at 1.55 × 10⁸ items at high tide and 2.01 × 10⁸ items at low tide, with less MPs moving from ZJB to Suixi Estuary compared to the reverse. The total quantity of MPs entering the sea from estuaries was estimated to be approximately 1.61 × 10⁹ items per year, according to hydrological data. This study provides a vital baseline data set on how hydrologically driven transport, human activities, and complex tidal variations affect MPs movement from rivers to sea. Furthermore, it facilitates the quantification of microplastic flux changes from rivers to the ocean influenced by hydrodynamics.

Author Contributions

Conceptualization, P.Z.; Methodology, P.Z. and J.Z.; Software, X.C.; Validation, X.C. and Y.C.; Form analysis, X.C., J.L. and Y.C.; Writing—original draft preparation, P.Z., J.Z. and X.C.; Writing—review and editing, P.Z. and J.Z.; Visualization, P.Z.; Supervision, P.Z.; Project management, P.Z. and J.Z.; Funding acquisition, P.Z. and J.Z. All listed authors made substantial, direct, and intellectual contributions to the work and are approved for publication. All authors have read and agreed to the published version of the manuscript.

Funding

This research was supported by the Guangdong Basic and Applied Basic Research Foundation (2023A1515012769), Guangdong Basic and Applied Basic Research Foundation (2020A1515110483), Research and Development Projects in Key Areas of Guangdong Province (2020B1111020004), Guangdong Ocean University Fund Project (R18021), and Province College Student Innovation and Entrepreneurship Plan (S202410566058).

Institutional Review Board Statement

Not applicable.

Informed Consent Statement

Not applicable.

Data Availability Statement

The original contributions presented in this study are included in the article. Further inquiries can be directed to the corresponding author.

Acknowledgments

Thanks for the financial support by the Guangdong Basic and Applied Basic Research Foundation (2023A1515012769), Guangdong Basic and Applied Basic Research Foundation (2020A1515110483), Research and Development Projects in Key Areas of Guangdong Province (2020B1111020004), Guangdong Ocean University Fund Project (R18021), and Province College Student Innovation and Entrepreneurship Plan (S202410566058) for funding. Special appreciation is given to the reviewers for their careful reviews and constructive suggestions. We thank all members of the research team and others who participated in this study.

Conflicts of Interest

The authors declare no conflicts of interest.

References

  1. Thompson, R.C.; Olsen, Y.; Mitchell, R.P.; Davis, A.; Rowland, S.J.; John, A.W.; McGonigle, D.; Russell, A.E. Lost at sea: Where is all the plastic? Science 2004, 304, 838. [Google Scholar] [CrossRef]
  2. Moore, C.J. Synthetic polymers in the marine environment: A rapidly increasing, long-term threat. Environ. Res. 2008, 108, 131–139. [Google Scholar] [CrossRef]
  3. Hartmann, N.B.; Hüffer, T.; Thompson, R.C.; Hassellöv, M.; Verschoor, A.; Daugaard, A.E.; Rist, S.; Karlsson, T.; Brennholt, N.; Cole, M.; et al. Are we speaking the same language? Recommendations for a definition and categorization framework for plastic debris. Environ. Sci. Technol. 2019, 53, 1039–1047. [Google Scholar] [CrossRef] [PubMed]
  4. Jambeck, J.R.; Geyer, R.; Wilcox, C.; Siegler, T.R.; Perryman, M.; Andrady, A.; Narayan, R.; Law, K.L. Plastic waste inputs from land into the ocean. Science 2015, 347, 768–771. [Google Scholar] [CrossRef] [PubMed]
  5. Fendall, L.S.; Sewell, M.A. Contributing to marine pollution by washing your face: Microplastics in facial cleansers. Mar. Pollut. Bull. 2009, 58, 1225–1228. [Google Scholar] [CrossRef] [PubMed]
  6. Rochman, C.M.; Hoh, E.; Hentschel, B.T.; Kaye, S. Long-term field measurement of sorption of organic contaminants to five types of plastic pellets: Implications for plastic marine debris. Environ. Sci. Technol. 2013, 47, 1646–1654. [Google Scholar] [CrossRef] [PubMed]
  7. Graham, E.R.; Thompson, J.T. Deposit-and suspension-feeding sea cucumbers (Echinodermata) ingest plastic fragments. J. Exp. Mar. Biol. Ecol. 2009, 368, 22–29. [Google Scholar] [CrossRef]
  8. Spear, L.B.; Ainley, D.G.; Ribic, C.A. Incidence of plastic in seabirds from the tropical pacific, 1984–1991: Relation with distribution of species, sex, age, season, year and body weight. Mar. Environ. Res. 1995, 40, 123–146. [Google Scholar] [CrossRef]
  9. Denuncio, P.; Bastida, R.; Dassis, M.; Giardino, G.; Gerpe, M.; Rodríguez, D. Plastic ingestion in Franciscana dolphins, Pontoporia blainvillei (Gervais and d’Orbigny, 1844), from Argentina. Mar. Pollut. Bull. 2011, 62, 1836–1841. [Google Scholar] [CrossRef]
  10. Alfonso, M.B.; Lindsay, D.J.; Arias, A.H.; Nakano, H.; Jandang, S.; Isobe, A. Zooplankton as a suitable tool for microplastic research. Sci. Total Environ. 2023, 905, 167329. [Google Scholar] [CrossRef] [PubMed]
  11. Wright, S.L.; Thompson, R.C.; Galloway, T.S. The physical impacts of microplastics on marine organisms: A review. Environ. Pollut. 2013, 178, 483–492. [Google Scholar] [CrossRef] [PubMed]
  12. Jenner, L.C.; Rotchell, J.M.; Bennett, R.T.; Cowen, M.; Tentzeris, V.; Sadofsky, L.R. Detection of microplastics in human lung tissue using μFTIR spectroscopy. Sci. Total Environ. 2022, 831, 154907. [Google Scholar] [CrossRef] [PubMed]
  13. Lebreton, L.; Andrady, A. Future scenarios of global plastic waste generation and disposal. Palgrave Commun. 2019, 5, 1–11. [Google Scholar] [CrossRef]
  14. Lebreton, L.C.; Van Der Zwet, J.; Damsteeg, J.W.; Slat, B.; Andrady, A.; Reisser, J. River plastic emissions to the world’s oceans. Nat. Commun. 2017, 8, 15611. [Google Scholar] [CrossRef]
  15. Cordova, M.R.; Nurhati, I.S. Major sources and monthly variations in the release of land-derived marine debris from the Greater Jakarta area, Indonesia. Sci. Rep. 2019, 9, 18730. [Google Scholar] [CrossRef]
  16. Wu, F.; Pennings, S.C.; Tong, C.; Xu, Y. Variation in microplastics composition at small spatial and temporal scales in a tidal flat of the Yangtze Estuary, China. Sci. Total Environ. 2020, 699, 134252. [Google Scholar] [CrossRef] [PubMed]
  17. Valero, D.; Belay, B.S.; Moreno-Rodenas, A.; Kramer, M.; Franca, M.J. The key role of surface tension in the transport and quantification of plastic pollution in rivers. Water Res. 2022, 226, 119078. [Google Scholar] [CrossRef] [PubMed]
  18. Cohen, J.H.; Internicola, A.M.; Mason, R.A.; Kukulka, T. Observations and simulations of microplastic debris in a tide, wind, and freshwater-driven estuarine environment: The Delaware Bay. Environ. Sci. Technol. 2019, 53, 14204–14211. [Google Scholar] [CrossRef] [PubMed]
  19. Van Emmerik, T.; Mellink, Y.; Hauk, R.; Waldschläger, K.; Schreyers, L. Rivers as plastic reservoirs. Front. Water 2022, 3, 786936. [Google Scholar] [CrossRef]
  20. Schaafsma, M.; Turner, R.K. Valuation of coastal and marine ecosystem services: A literature review. In Coastal Zones Ecosystem Services: From Science to Values and Decision Making; Springer: Cham, Switzerland, 2015; pp. 103–125. [Google Scholar]
  21. Gray, A.D.; Wertz, H.; Leads, R.R.; Weinstein, J.E. Microplastic in two South Carolina Estuaries: Occurrence, distribution, and composition. Mar. Pollut. Bull. 2018, 128, 223–233. [Google Scholar] [CrossRef]
  22. Pazos, R.S.; Bauer, D.E.; Gómez, N. Microplastics integrating the coastal planktonic community in the inner zone of the Río de la Plata estuary (South America). Environ. Pollut. 2018, 243, 134–142. [Google Scholar] [CrossRef] [PubMed]
  23. Zhao, S.; Wang, T.; Zhu, L.; Xu, P.; Wang, X.; Gao, L.; Li, D. Analysis of suspended microplastics in the Changjiang Estuary: Implications for riverine plastic load to the ocean. Water Res. 2019, 161, 560–569. [Google Scholar] [CrossRef] [PubMed]
  24. Wu, Y.; Wang, S.; Wu, L.; Yang, Y.; Yu, X.; Liu, Q.; Liu, X.; Li, Y.; Wang, X. Vertical distribution and river-sea transport of microplastics with tidal fluctuation in a subtropical estuary, China. Sci. Total Environ. 2022, 822, 153603. [Google Scholar] [CrossRef] [PubMed]
  25. Zhang, P.; Peng, C.; Zhang, J.; Zhang, J.; Chen, J.; Zhao, H. Long-term harmful algal blooms and nutrients patterns affected by climate change and anthropogenic pressures in the Zhanjiang Bay, China. Front. Mar. Sci. 2022, 9, 849819. [Google Scholar] [CrossRef]
  26. Zhang, J.; Zhang, Y.; Zhang, P.; Li, Y.; Li, J.; Luo, X.; Xu, J.; Zhao, L. Seasonal phosphorus variation in coastal water affected by the land-based sources input in the eutrophic Zhanjiang Bay, China. Estuar. Coast. Shelf Sci. 2021, 252, 107277. [Google Scholar] [CrossRef]
  27. Zhang, P.; Wei, S.; Zhang, J.; Zhong, H.; Wang, S.; Jian, Q. Seasonal distribution, composition, and inventory of plastic debris on the Yugang Park Beach in Zhanjiang Bay, South China Sea. Int. J. Environ. Res. Public Health 2022, 19, 4886. [Google Scholar] [CrossRef]
  28. Zhang, P.; Peng, C.H.; Zhang, J.B.; Zou, Z.B.; Shi, Y.Z.; Zhao, L.R.; Zhao, H. Spatiotemporal urea distribution, sources, and indication of DON bioavailability in Zhanjiang Bay, China. Water 2020, 12, 633. [Google Scholar] [CrossRef]
  29. Zheng, Y.; Li, J.; Sun, C.; Cao, W.; Wang, M.; Jiang, F.; Ju, P. Comparative study of three sampling methods for microplastics analysis in seawater. Sci. Total Environ. 2021, 765, 144495. [Google Scholar] [CrossRef]
  30. Zhang, P.; Xu, J.L.; Zhang, J.B.; Li, J.X.; Zhang, Y.C.; Li, Y.; Luo, X.Q. Spatiotemporal dissolved silicate variation, sources, and behavior in the eutrophic Zhanjiang Bay, China. Water 2020, 12, 3586. [Google Scholar] [CrossRef]
  31. Zhang, P.E.N.G.; Wei, L.R.; Lai, J.Y.; Dai, P.D.; Chen, Y.; Zhang, J.B. Concentration, composition and fluxes of land-based nitrogen and phosphorus source pollutants input into Zhanjiang Bay in Summer. J. Guangdong Ocean Univ. 2019, 39, 63–72. [Google Scholar]
  32. HJ/T 91-2002; Technical Specifications Requirements for Monitoring of Surface Water and Waste Water. Ministry of Environment Protection, People’s Republic of China, Standards Press of China: Beijing, China, 2002.
  33. Nuelle, M.T.; Dekiff, J.H.; Remy, D.; Fries, E. A new analytical approach for monitoring microplastics in marine sediments. Environ. Pollut. 2014, 184, 161–169. [Google Scholar] [CrossRef] [PubMed]
  34. Liu, K.; Wu, T.; Wang, X.; Song, Z.; Zong, C.; Wei, N.; Li, D. Consistent transport of terrestrial microplastics to the ocean through atmosphere. Environ. Sci. Technol. 2019, 53, 10612–10619. [Google Scholar] [CrossRef] [PubMed]
  35. Free, C.M.; Jensen, O.P.; Mason, S.A.; Eriksen, M.; Williamson, N.J.; Boldgiv, B. High-levels of microplastic pollution in a large, remote, mountain lake. Mar. Pollut. Bull. 2014, 85, 156–163. [Google Scholar] [CrossRef]
  36. Gies, E.A.; LeNoble, J.L.; Noël, M.; Etemadifar, A.; Bishay, F.; Hall, E.R.; Ross, P.S. Retention of microplastics in a major secondary wastewater treatment plant in Vancouver, Canada. Mar. Pollut. Bull. 2018, 133, 553–561. [Google Scholar] [CrossRef]
  37. Li, R.L.; Yu, L.; Chai, M.; Wu, H.; Zhu, X. The Distribution, Characteristics and ecological risks of microplastics in the mangroves of Southern China. Sci. Total Environ. 2020, 708, 135025. [Google Scholar] [CrossRef] [PubMed]
  38. Silva, A.B.; Bastos, A.S.; Justino, C.I.; da Costa, J.P.; Duarte, A.C.; Rocha-Santos, T.A. Microplastics in the environment: Challenges in analytical chemistry-A review. Anal. Chim. Acta 2018, 1017, 1–19. [Google Scholar] [CrossRef] [PubMed]
  39. Dris, R.; Gasperi, J.; Saad, M.; Mirande, C.; Tassin, B. Synthetic fibers in atmospheric fallout: A source of microplastics in the environment? Mar. Pollut. Bull. 2016, 104, 290–293. [Google Scholar] [CrossRef]
  40. Wang, S.; Jian, Q.; Zhang, P.; Zhang, J.; Zhao, L.; Liu, D.; Kang, X. Tracing land-based microplastic sources in coastal waters of Zhanjiang Bay, China: Spatiotemporal pattern, composition, and flux. Front. Mar. Sci. 2022, 9, 934707. [Google Scholar] [CrossRef]
  41. Huang, J.S.; Koongolla, J.B.; Li, H.X.; Lin, L.; Pan, Y.F.; Liu, S.; He, W.H.; Maharana, D.; Xu, X.R. Microplastic accumulation in fish from Zhanjiang mangrove wetland, South China. Sci. Total Environ. 2020, 708, 134839. [Google Scholar] [CrossRef] [PubMed]
  42. Huang, Y.Z.; Xiao, X.; Effiong, K.; Xu, C.C.; Su, Z.N.; Hu, J.; Jiao, S.J.; Holmer, M. New Insights Into the Microplastic Enrichment in the Blue Carbon Ecosystem: Evidence From Seagrass Meadows and Mangrove Forests in Coastal South China Sea. Environ. Sci. Technol. 2021, 55, 4804–4812. [Google Scholar] [CrossRef] [PubMed]
  43. Nakano, H.; Alfonso, M.B.; Jandang, S.; Phinchan, N.; Chavanich, S.; Viyakarn, V.; Isobe, A. Influence of monsoon seasonality and tidal cycle on microplastics presence and distribution in the Upper Gulf of Thailand. Sci. Total Environ. 2024, 920, 170787. [Google Scholar] [CrossRef] [PubMed]
  44. Defontaine, S.; Sous, D.; Tesan, J.; Monperrus, M.; Lenoble, V.; Lanceleur, L. Microplastics in a salt-wedge estuary: Vertical structure and tidal dynamics. Mar. Pollut. Bull. 2020, 160, 111688. [Google Scholar] [CrossRef] [PubMed]
  45. Enfrin, M.; Lee, J.; Gibert, Y.; Basheer, F.; Kong, L.; Dumée, L.F. Release of hazardous nanoplastic contaminants due to microplastics fragmentation under shear stress forces. J. Hazard. Mater. 2020, 384, 121393. [Google Scholar] [CrossRef] [PubMed]
  46. Trindade, L.D.S.; Gloaguen, T.V.; Benevides, T.C.L.; Valentim, A.S.; Bomfim, M.R.; Santos, J.a.G. Microplastics in surface waters of tropical estuaries around a densely populated Brazilian bay. Environ. Pollut. 2023, 323, 121224. [Google Scholar] [CrossRef]
  47. Pasquier, G.; Doyen, P.; Chaïb, I.; Amara, R. Do tidal fluctuations affect microplastics distribution and composition in coastal waters? Mar. Pollut. Bull. 2024, 200, 116166. [Google Scholar] [CrossRef]
  48. Yan, M.; Nie, H.; Xu, K.; He, Y.; Hu, Y.; Huang, Y.; Wang, J. Microplastic abundance, distribution and composition in the Pearl River along Guangzhou city and Pearl River estuary, China. Chemosphere 2019, 217, 879–886. [Google Scholar] [CrossRef] [PubMed]
  49. Qi, H.; Fu, D.; Wang, Z.; Gao, M.; Peng, L. Microplastics occurrence and spatial distribution in seawater and sediment of Haikou Bay in the northern South China Sea. Estuar. Coast. Shelf Sci. 2020, 239, 106757. [Google Scholar] [CrossRef]
  50. Santucci, L.; Fernández-Severini, M.D.; Rimondino, G.N.; Colombo, C.V.; Prieto, G.; Forero-López, A.D.; Carol, E.S. Assessment of meso-and microplastics distribution in coastal sediments and waters at the middle estuary of the Rio De La Plata, Argentina (SW Atlantic Ocean). Sci. Total Environ. 2024, 914, 170026. [Google Scholar] [CrossRef] [PubMed]
  51. Hossain, M.B.; Yu, J.; Nur, A.A.U.; Banik, P.; Jolly, Y.N.; Al-Mamun, M.; Arai, T.; Albeshr, M.F. Microplastics in surface water from a mighty subtropical estuary: First observations on occurrence, characterization, and contamination assessment. Environ. Res. 2023, 226, 115594. [Google Scholar] [CrossRef] [PubMed]
  52. Taha, Z.D.; Amin, R.M.; Anuar, S.T.; Nasser, A.A.A.; Sohaimi, E.S. Microplastics in seawater and zooplankton: A case study from Terengganu estuary and offshore waters, Malaysia. Sci. Total Environ. 2021, 786, 147466. [Google Scholar] [CrossRef] [PubMed]
  53. Wei, N.; Bai, M.; Wang, Y.; Wang, J.; Liu, K.; Zhu, L.; Zhang, F.; Wang, X.; Wu, T.; Zhang, Z.; et al. Dynamic signatures of microplastic distribution across the water column of Yangtze River Estuary: Complicated implication of tidal effects. Mar. Environ. Res. 2023, 188, 106005. [Google Scholar] [CrossRef]
  54. Zhao, W.; Huang, W.; Yin, M.; Huang, P.; Ding, Y.; Ni, X.; Liu, H.; Wang, G.; Zheng, H.; Cai, M. Tributary inflows enhance the microplastic load in the estuary: A case from the Qiantang River. Mar. Pollut. Bull. 2020, 156, 111152. [Google Scholar] [CrossRef] [PubMed]
  55. Bikker, J.; Lawson, J.; Wilson, S.; Rochman, C.M. Microplastics and other anthropogenic particles in the surface waters of the Chesapeake Bay. Mar. Pollut. Bull. 2020, 156, 111257. [Google Scholar] [CrossRef]
  56. Gupta, P.; Saha, M.; Rathore, C.; Suneel, V.; Ray, D.; Naik, A.; Unnikrishnan, K.; Dhivya, M.; Daga, K. Spatial and seasonal variation of microplastics and possible sources in the estuarine system from central west coast of India. Environ. Pollut. 2021, 288, 117665. [Google Scholar] [CrossRef] [PubMed]
  57. Suteja, Y.; Atmadipoera, A.S.; Riani, E.; Nurjaya, I.W.; Nugroho, D.; Cordova, M.R. Spatial and temporal distribution of microplastic in surface water of tropical estuary: Case study in Benoa Bay, Bali, Indonesia. Mar. Pollut. Bull. 2021, 163, 111979. [Google Scholar] [CrossRef] [PubMed]
  58. Horton, A.A.; Walton, A.; Spurgeon, D.J.; Lahive, E.; Svendsen, C. Microplastics in freshwater and terrestrial environments: Evaluating the current understanding to identify the knowledge gaps and future research priorities. Sci. Total Environ. 2017, 586, 127–141. [Google Scholar] [CrossRef] [PubMed]
  59. Van Dinh, K.; Konestabo, H.S.; Borgå, K.; Hylland, K.; Macaulay, S.J.; Jackson, M.C.; Verheyen, J.; Stoks, R. Interactive effects of warming and pollutants on marine and freshwater invertebrates. Curr. Pollut. Rep. 2022, 8, 341–359. [Google Scholar] [CrossRef]
  60. Wojtal-Frankiewicz, A. The effects of global warming on Daphnia spp. population dynamics: A review. Aquat. Ecol. 2011, 46, 37–53. [Google Scholar] [CrossRef]
  61. Malli, A.; Corella-Puertas, E.; Hajjar, C.; Boulay, A.M. Transport mechanisms and fate of microplastics in estuarine compartments: A review. Mar. Pollut. Bull. 2022, 177, 113553. [Google Scholar] [CrossRef] [PubMed]
  62. Sousa, M.C.; DeCastro, M.; Gago, J.; Ribeiro, A.S.; Des, M.; Gómez-Gesteira, J.L.; Dias, J.M.; Gomez-Gesteira, M. Modelling the distribution of microplastics released by wastewater treatment plants in Ria de Vigo (NW Iberian Peninsula). Mar. Pollut. Bull. 2021, 166, 112227. [Google Scholar] [CrossRef]
  63. Hurley, R.; Woodward, J.; Rothwell, J.J. Microplastic contamination of river beds significantly reduced by catchment-wide flooding. Nat. Geosci. 2018, 11, 251–257. [Google Scholar] [CrossRef]
  64. Li, C.; Busquets, R.; Campos, L.C. Assessment of microplastics in freshwater systems: A review. Sci. Total Environ. 2020, 707, 135578. [Google Scholar] [CrossRef] [PubMed]
  65. Yan, M.; Wang, L.; Dai, Y.; Sun, H.; Liu, C. Behavior of microplastics in inland waters: Aggregation, settlement, and transport. Bull. Environ. Contam. Toxicol. 2021, 107, 700–709. [Google Scholar] [CrossRef] [PubMed]
  66. Zhang, J.; Zhang, C.; Deng, Y.; Wang, R.; Ma, E.; Wang, J.; Bai, J.; Wu, J.; Zhou, Y. Microplastics in the surface water of small-scale estuaries in Shanghai. Mar. Pollut. Bull. 2019, 149, 110569. [Google Scholar] [CrossRef] [PubMed]
  67. Kooi, M.; Reisser, J.; Slat, B.; Ferrari, F.F.; Schmid, M.S.; Cunsolo, S.; Brambini, R.; Noble, K.; Sirks, L.A.; Linders, T.E.; et al. The effect of particle properties on the depth profile of buoyant plastics in the ocean. Sci. Rep. 2016, 6, 33882. [Google Scholar] [CrossRef]
  68. Browne, M.A.; Galloway, T.S.; Thompson, R.C. Spatial patterns of plastic debris along estuarine shorelines. Environ. Sci. Technol. 2010, 44, 3404–3409. [Google Scholar] [CrossRef] [PubMed]
  69. Besseling, E.; Quik, J.T.; Sun, M.; Koelmans, A.A. Fate of nano-and microplastic in freshwater systems: A modeling study. Environ. Pollut. 2017, 220, 540–548. [Google Scholar] [CrossRef] [PubMed]
  70. Ustabasi, G.S.; Baysal, A. Bacterial interactions of microplastics extracted from toothpaste under controlled conditions and the influence of seawater. Sci. Total Environ. 2020, 703, 135024. [Google Scholar] [CrossRef] [PubMed]
  71. Stead, J.L.; Cundy, A.B.; Hudson, M.D.; Thompson, C.E.; Williams, I.D.; Russell, A.E.; Pabortsava, K. Identification of tidal trapping of microplastics in a temperate salt marsh system using sea surface microlayer sampling. Sci. Rep. 2020, 10, 14147. [Google Scholar] [CrossRef] [PubMed]
  72. Piehl, S.; Atwood, E.C.; Bochow, M.; Imhof, H.K.; Franke, J.; Siegert, F.; Laforsch, C. Can water constituents be used as proxy to map microplastic dispersal within transitional and coastal waters? Front. Environ. Sci. 2020, 8, 92. [Google Scholar] [CrossRef]
  73. Qian, J.; Tang, S.; Wang, P.; Lu, B.; Li, K.W.; He, X. From source to sink: Review and prospects of microplastics in wetland ecosystems. Sci. Total Environ. 2021, 758, 143633. [Google Scholar] [CrossRef]
  74. Han, M.; Niu, X.; Tang, M.; Zhang, B.T.; Wang, G.; Yue, W.; Kong, X.; Zhu, J. Distribution of microplastics in surface water of the lower Yellow River near estuary. Sci. Total Environ. 2020, 707, 135601. [Google Scholar] [CrossRef] [PubMed]
  75. Waldschläger, K.; Schüttrumpf, H. Effects of particle properties on the settling and rise velocities of microplastics in freshwater under laboratory conditions. Environ. Sci. Technol. 2019, 53, 1958–1966. [Google Scholar] [CrossRef] [PubMed]
  76. Maghsodian, Z.; Sanati, A.M.; Tahmasebi, S.; Shahriari, M.H.; Ramavandi, B. Study of microplastics pollution in sediments and organisms inmangrove forests: A review. Environ. Res. 2022, 208, 112725. [Google Scholar] [CrossRef] [PubMed]
  77. Aliabad, M.K.; Nassiri, M.; Kor, K. Microplastics in the surface sea waters of Chabahar Bay, Gulf of Oman (Makran coasts). Mar. Pollut. Bull. 2019, 143, 125–133. [Google Scholar] [CrossRef] [PubMed]
  78. Xu, P.; Peng, G.; Su, L.; Gao, Y.; Gao, L.; Li, D. Microplastic risk assessment in surface waters: A case study in the Changjiang Estuary, China. Mar. Pollut. Bull. 2018, 133, 647–654. [Google Scholar] [CrossRef]
  79. Oben Mbeng, L.; David, M.; Ntyanm Ondo, S. Classification Study of Ingested Plastic Particles in Marine Organisms using Electron Microscope: A Case Study of Cameroon Beaches. Int. J. Adv. Sci. Res. Eng. (IJASRE) 2021, 7, 85–92. [Google Scholar]
  80. Parvin, F.; Jannat, S.; Tareq, S.M. Abundance, characteristics and variation of microplastics in different freshwater fish species from Bangladesh. Sci. Total Environ. 2021, 784, 147137. [Google Scholar] [CrossRef] [PubMed]
  81. Pol, W.; Żmijewska, A.; Stasińska, E.; Zieliński, P. Spatial–temporal distribution of microplastics in lowland rivers flowing through two cities (Ne Poland). Water Air Soil Pollut. 2022, 233, 140. [Google Scholar] [CrossRef]
Figure 1. Suixi river–sea interface location and monitoring station in ZJB.
Jmse 13 00428 g001
Figure 2. Effect of tides on the abundance variation of microplastics.
Jmse 13 00428 g002
Figure 3. Comparison of microplastics abundance in different seasons.
Jmse 13 00428 g003
Figure 4. Composition of MPs at the mouth of Suixi river–sea in ZJB.
Jmse 13 00428 g004
Figure 5. Typical microplastics used for identification and their composition; (A) black film, (B) white fibers, (C) white fibers, and (D) blue film.
Jmse 13 00428 g005
Figure 6. Impact of MPs on dry and wet season diversity in the Suixi river–sea, ZJB.
Jmse 13 00428 g006
Figure 7. The diversity of microplastics size, color and shape during the dry and wet seasons in the Suixi river–sea in ZJB.
Jmse 13 00428 g007
Figure 8. Relationship between microplastics abundance and different sizes as influenced by multiple factors in the Suixi river–sea, ZJB.
Jmse 13 00428 g008
Figure 9. Relationship between microplastics abundance and different sizes in dry and wet seasons as influenced by multiple factors in the Suixi river–sea, ZJB.
Jmse 13 00428 g009
Figure 10. Hydrodynamic modulation of microplastic fluxes in the Suixi river–sea, ZJB.
Jmse 13 00428 g010
Figure 11. Trends of microplastic flux Q and net hydrological flux F during wet and dry seasons in Suixi river–sea, ZJB.
Jmse 13 00428 g011
Table 1. Hydrographic parameters of Suixi river–sea, ZJB.
SeasonDry SeasonWet Season
Average ValueRangeAverage ValueRange
Temperature (°C)19.3 ± 0.818.1–20.129.5 ± 0.828.4–30.7
Salinity (PSU)4.2 ± 2.70.7–9.60.6 ± 0.60.1–1.9
Flow velocity (cm/s)36.9 ± 20.410.8–65.643.6 ± 22.13.3–75.4
Tide level (m)2.4 ± 0.90.8–3.82.4 ± 1.30.9–4.5
Table 2. A comparative analysis of the abundance of microplastics in the Suixi river–sea, ZJB, with other estuaries and harbors.
AreaSampling TimeAbundance (n/m3)Mesh
(μm)
Main Size (mm)References
Si Chang Island (Thailand)August 2022,
October–November 2022,
March–April 2023
17.58 ± 21.682121–1.1[43]
The Adour Estuary (France)June 2019,
September 2019
1.13300<2[44]
The Liane River
(France)
March 20220.76 ± 0.26300<1[47]
Pearl River Estuary
(China)
December 2017890250<0.5[48]
Haikou Bay (China)June 20180.44 ± 0.213331–1.9[49]
The Rio De La Plata (Argentina)March 202114,170 ± 55000.45<1.5[50]
The Meghna (Bangladesh)March-April 2022128.89 ± 67.94300<0.5[51]
Terengganu Estuary (Malaysia)August 2018, September 2018421.8 ± 110200.36 ± 0.23[52]
Yangtze River Estuary (China)July 2017,
October 2017,
January 2018,
May 2018
83.95 ± 19.5300<1[53]
The Qiantang River
(China)
June 2018,
November 2018
1183 ± 269100<5[54]
The Chesapeake Bay
(United States)
20150.16 ± 0.2873300.5–1[55]
Suixi River Estuary
(China)
December 2022,
August 2023
91,0990.45<1This study
Disclaimer/Publisher’s Note: The statements, opinions and data contained in all publications are solely those of the individual author(s) and contributor(s) and not of MDPI and/or the editor(s). MDPI and/or the editor(s) disclaim responsibility for any injury to people or property resulting from any ideas, methods, instructions or products referred to in the content.

