Article

Comparative Study on the Diffusion of Thermal Discharge from Coastal Power Plants in Different Geographical Environments

1
Third Institute of Oceanography, Ministry of Nature Resources, Xiamen 361005, China
2
Fujian Provincial Key Laboratory of Marine Physical and Geological Processes, Xiamen 361005, China
*
Author to whom correspondence should be addressed.
J. Mar. Sci. Eng. 2025, 13(2), 383; https://doi.org/10.3390/jmse13020383
Submission received: 20 January 2025 / Revised: 9 February 2025 / Accepted: 17 February 2025 / Published: 19 February 2025
(This article belongs to the Special Issue Coastal Water Quality Observation and Numerical Modeling)

Abstract

:
The diffusion characteristics of thermal discharge from coastal power plants were studied by analyzing the Ningde Nuclear Power Plant and Kemen Power Plant, which are located in different geographical regions in China. The former is in the open sea, and the latter is in a well-sheltered bay. In the vicinity of the outfall areas of the two power plants, large-area surface temperature observations and tidal current observations were conducted. The results indicate that the thermal discharge diffusion characteristics of coastal power plants located in different geographical environments are significantly different. In the well-sheltered sea area of the Kemen Power Plant, the water temperature diffuses faster along the coast, in line with the direction of tidal movement, and slower in the offshore direction under the influence of rectilinear tidal currents within the bay, resulting in a significantly greater longitudinal diffusion distance of thermal discharge along the shore than the transverse diffusion distance offshore. In the area surrounding the Ningde Nuclear Power Plant, rotational currents diffuse the thermal discharge in various directions, causing the range of temperature rise to expand toward the outer sea. Dominant tidal currents within the tidal cycle in the sea area can influence the distribution of high-temperature rise zones near outfalls. The distribution of high-temperature rise zones predominantly occurs on the side with the higher average tidal velocity, either the ebb tide side if its velocity is greater than that of the flood tide or the flood tide side otherwise.

1. Introduction

With the rapid development of the marine economy and the increasing demand for electricity, the number of power plants being planned and constructed in coastal areas is constantly growing. The operation of power plants requires a large amount of continuous supply of cooling water to solve the cold source of heat engines and other cooling problems, and the waste heat carried by circulating cooling water is carried directly into the sea, resulting in thermal discharge. Compared with other pollution sources, thermal discharge is characterized by high temperature and large volume, so it has a very obvious impact on marine ecology [1]. Thermal discharge disseminates a significant amount of heat into the surrounding environment, not only causing abnormal temperature rises in local sea areas and thereby disrupting the original temperature distribution of the water body but also impacting the water quality and the ecological environment [2,3]. Thermal discharge may modify the physical and chemical characteristics of the water body and may also directly pollute and influence the marine ecosystem, encompassing the growth and reproduction of marine organisms, as well as the material cycles and energy flows within the ecosystem. At present, the marine ecological problems caused by thermal discharge from coastal power plants have attracted increasing attention.
In recent years, the research on thermal discharge mainly focused on the following aspects: (1) According to the field investigating and monitoring data, the water quality changes in the surrounding sea area [4] and the changes and losses of biological resources caused by the thermal drainage from the power plant are analyzed [5,6,7,8,9,10]; (2) Based on the in situ data and numerical simulation, the amplitude and influence range of temperature rise caused by thermal discharge from power plant are estimated [6,11,12,13,14,15,16,17,18]; (3) From the aspects of environmental impact assessment [19], ecological risk evaluation [20], numerical simulation [21], and field investigation [22,23], the impact of thermal discharge from power plants on the marine environment and ecosystem is discussed; (4) The effects of different factors such as topography [24,25], water depth [25], flow velocity [26,27], and project layout [12,28] on the diffusion of thermal discharge from coastal power plants are studied. However, there are few comparative analyses on thermal discharge from coastal power plants under diverse hydrodynamic conditions due to different geographical locations. Regarding the geographical environment influencing factor, Lin et al. [25] believed that the shoreline topography close to the outfall affects the thermal diffusion capacity of the emitting source of coastal nuclear power plants and thermal power plants, rather than the geographical location. Their research primarily examined the degree of obstruction to heat transfer caused by the topography near the outlets of power plants, which are located in various areas such as bays and open seas, and they believed that the thermal discharge from power plants have little relevance to the geographical location of the sea area. Jia et al. [29] argued that the range of impact of thermal discharge from coastal power plants is determined by the geographical environment. Their research indicates that power plants located in bays have the largest range of temperature rise, followed by those at estuaries, and those in open seas have the smallest. However, they overlooked a comparable premise that the temperature rise and discharge capacity at the power plant’s outlets should be consistent. Neither the research by Lin et al. [25] and Jia et al. [29] conducted an in-depth analysis of the differences in thermal discharge diffusion mechanisms across different geographical environments. Our study selects two coastal power plants in different geographical locations, where one is situated in the open sea area and the other is located in a well-sheltered, semi-enclosed bay. Based on the field observation data of water temperature of the two power plants, the diffusion characteristics of thermal discharge are compared. Through the research, we have gained some mechanistic insights into the temperature rise distribution of coastal power plants located in different positions. Initially, a background of the study area and the overview of field observation data are provided in this study, along with the research methods employed. The research approach integrates field observations with numerical modeling, with the latter validated through the field observation data. Following this, the tidal current characteristics surrounding the two power plants are presented and the findings of the thermal discharge diffusion range of these plants are showed. A comparative analysis, coupled with an in-depth discussion, is then conducted on the diffusion patterns of thermal discharges from the two power plants. Ultimately, a concise summary and some useful conclusions are presented.

2. Materials and Methods
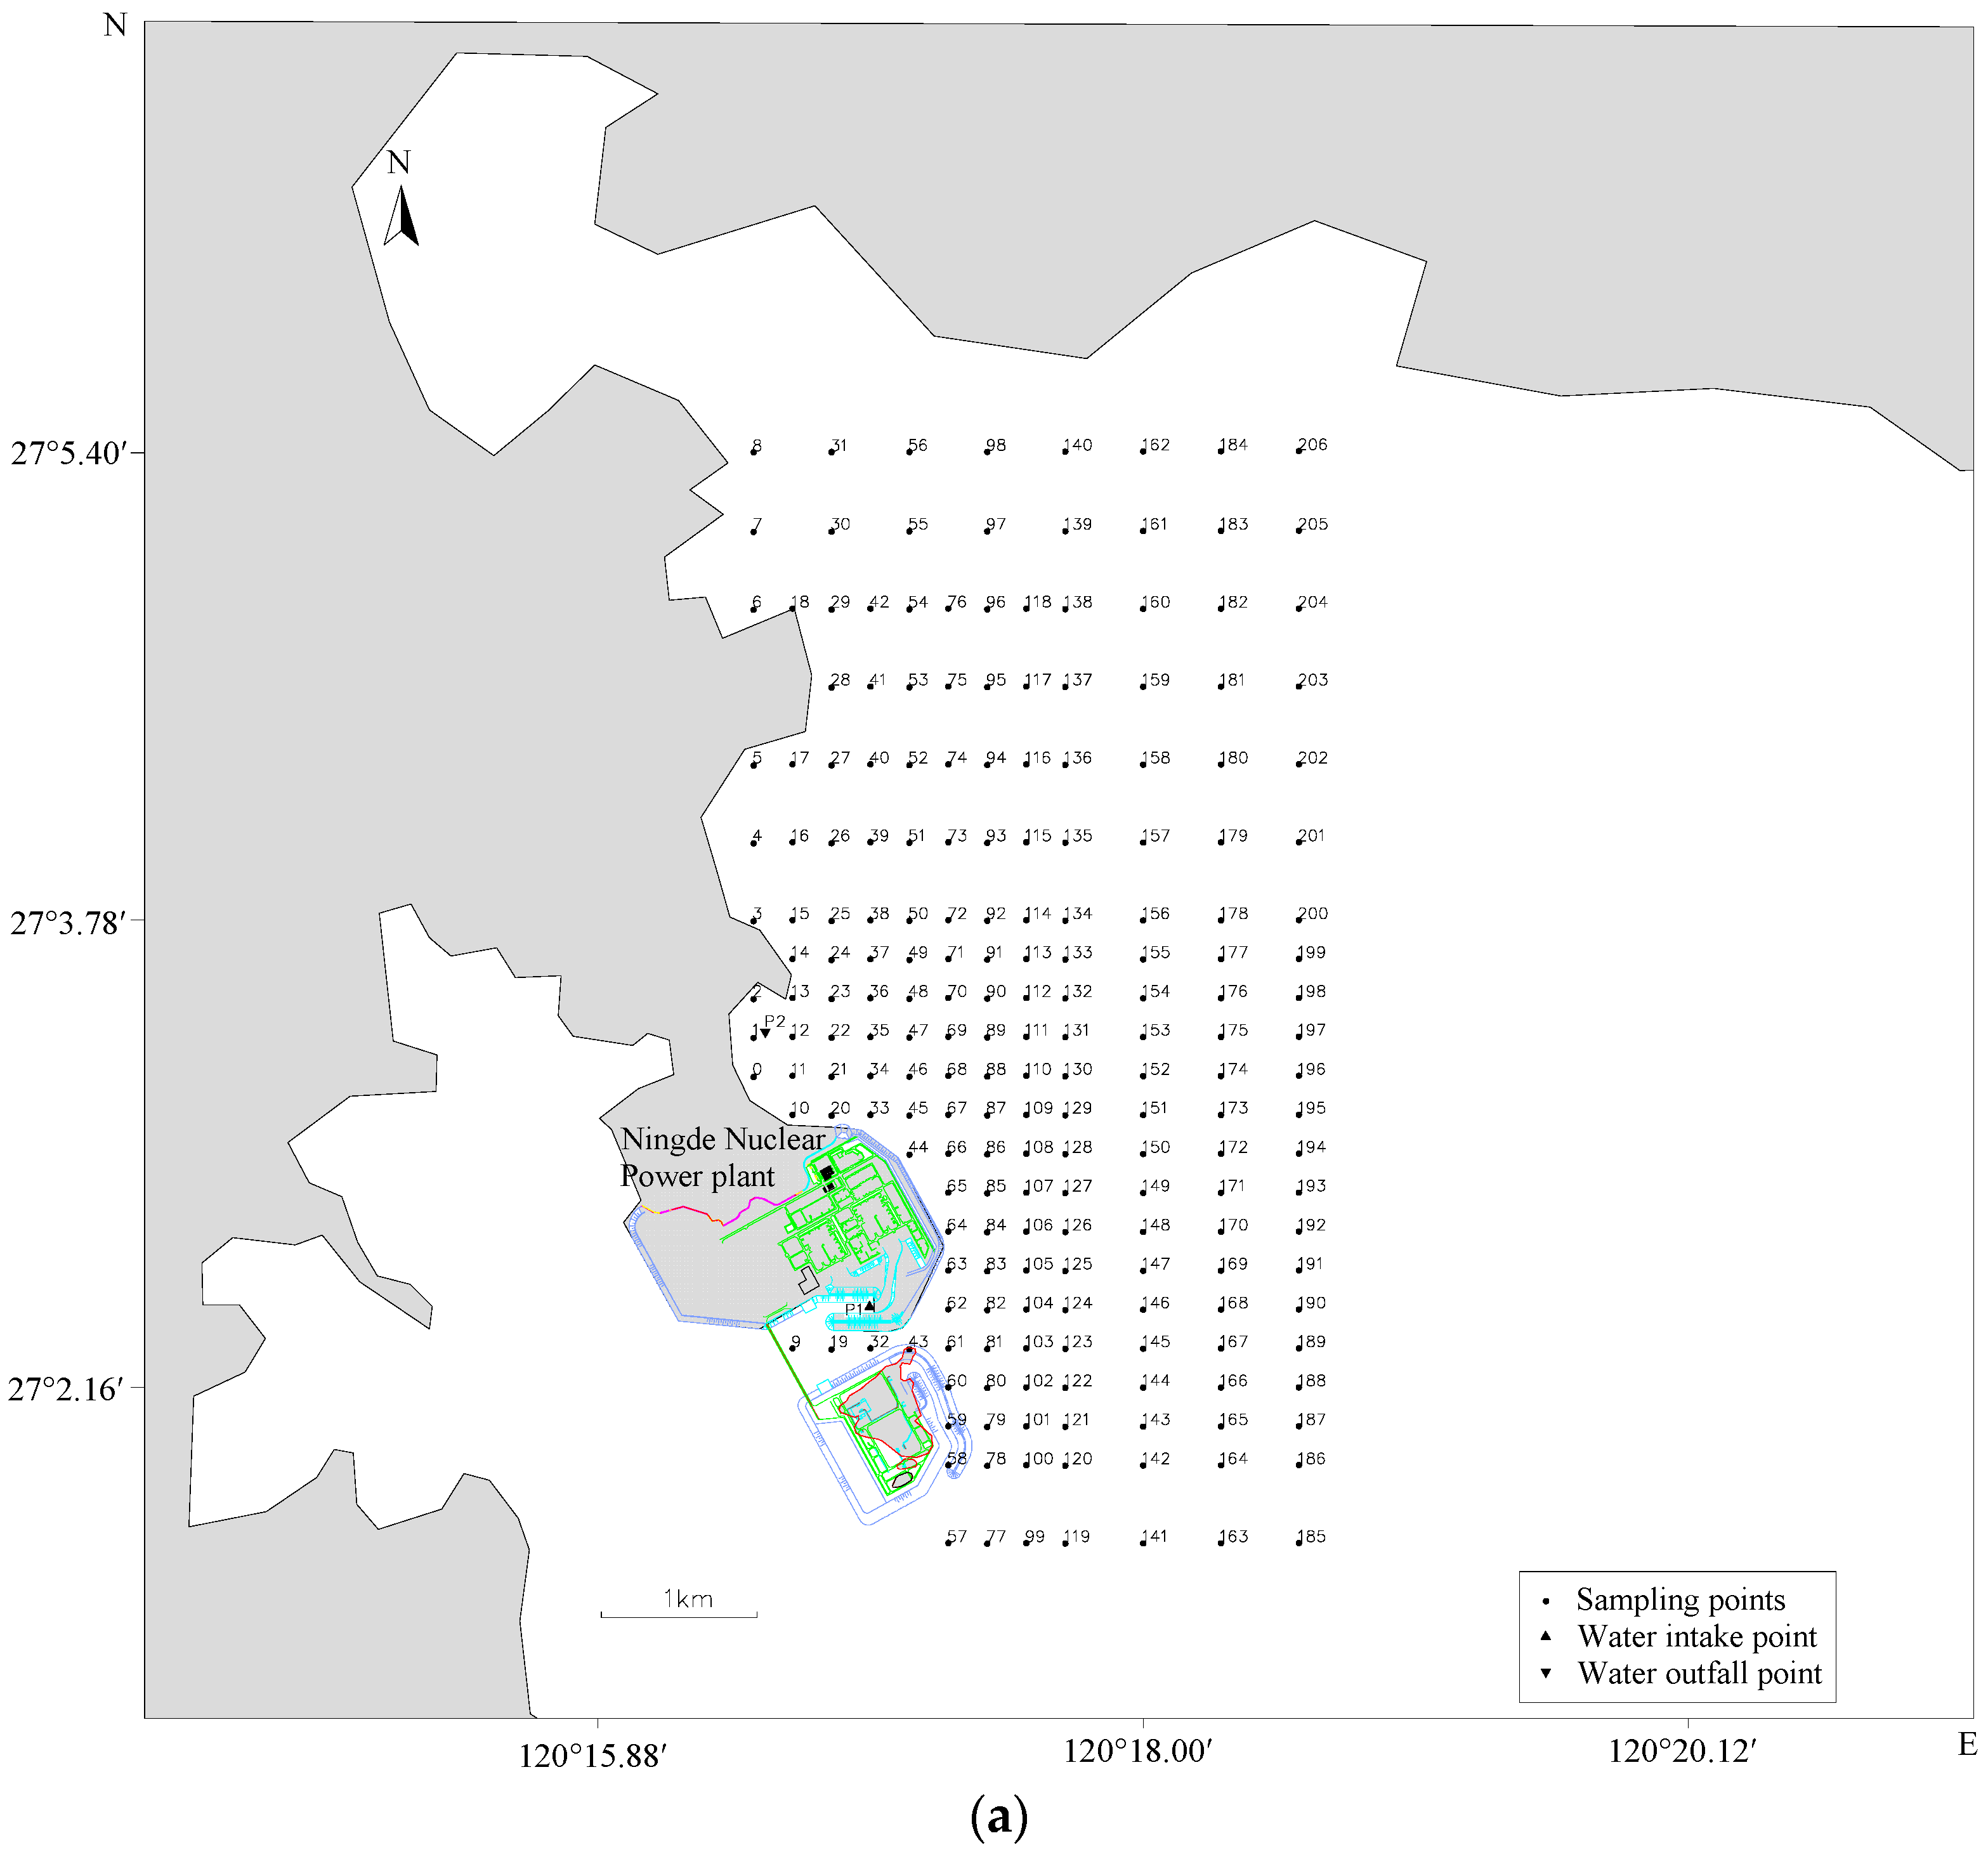
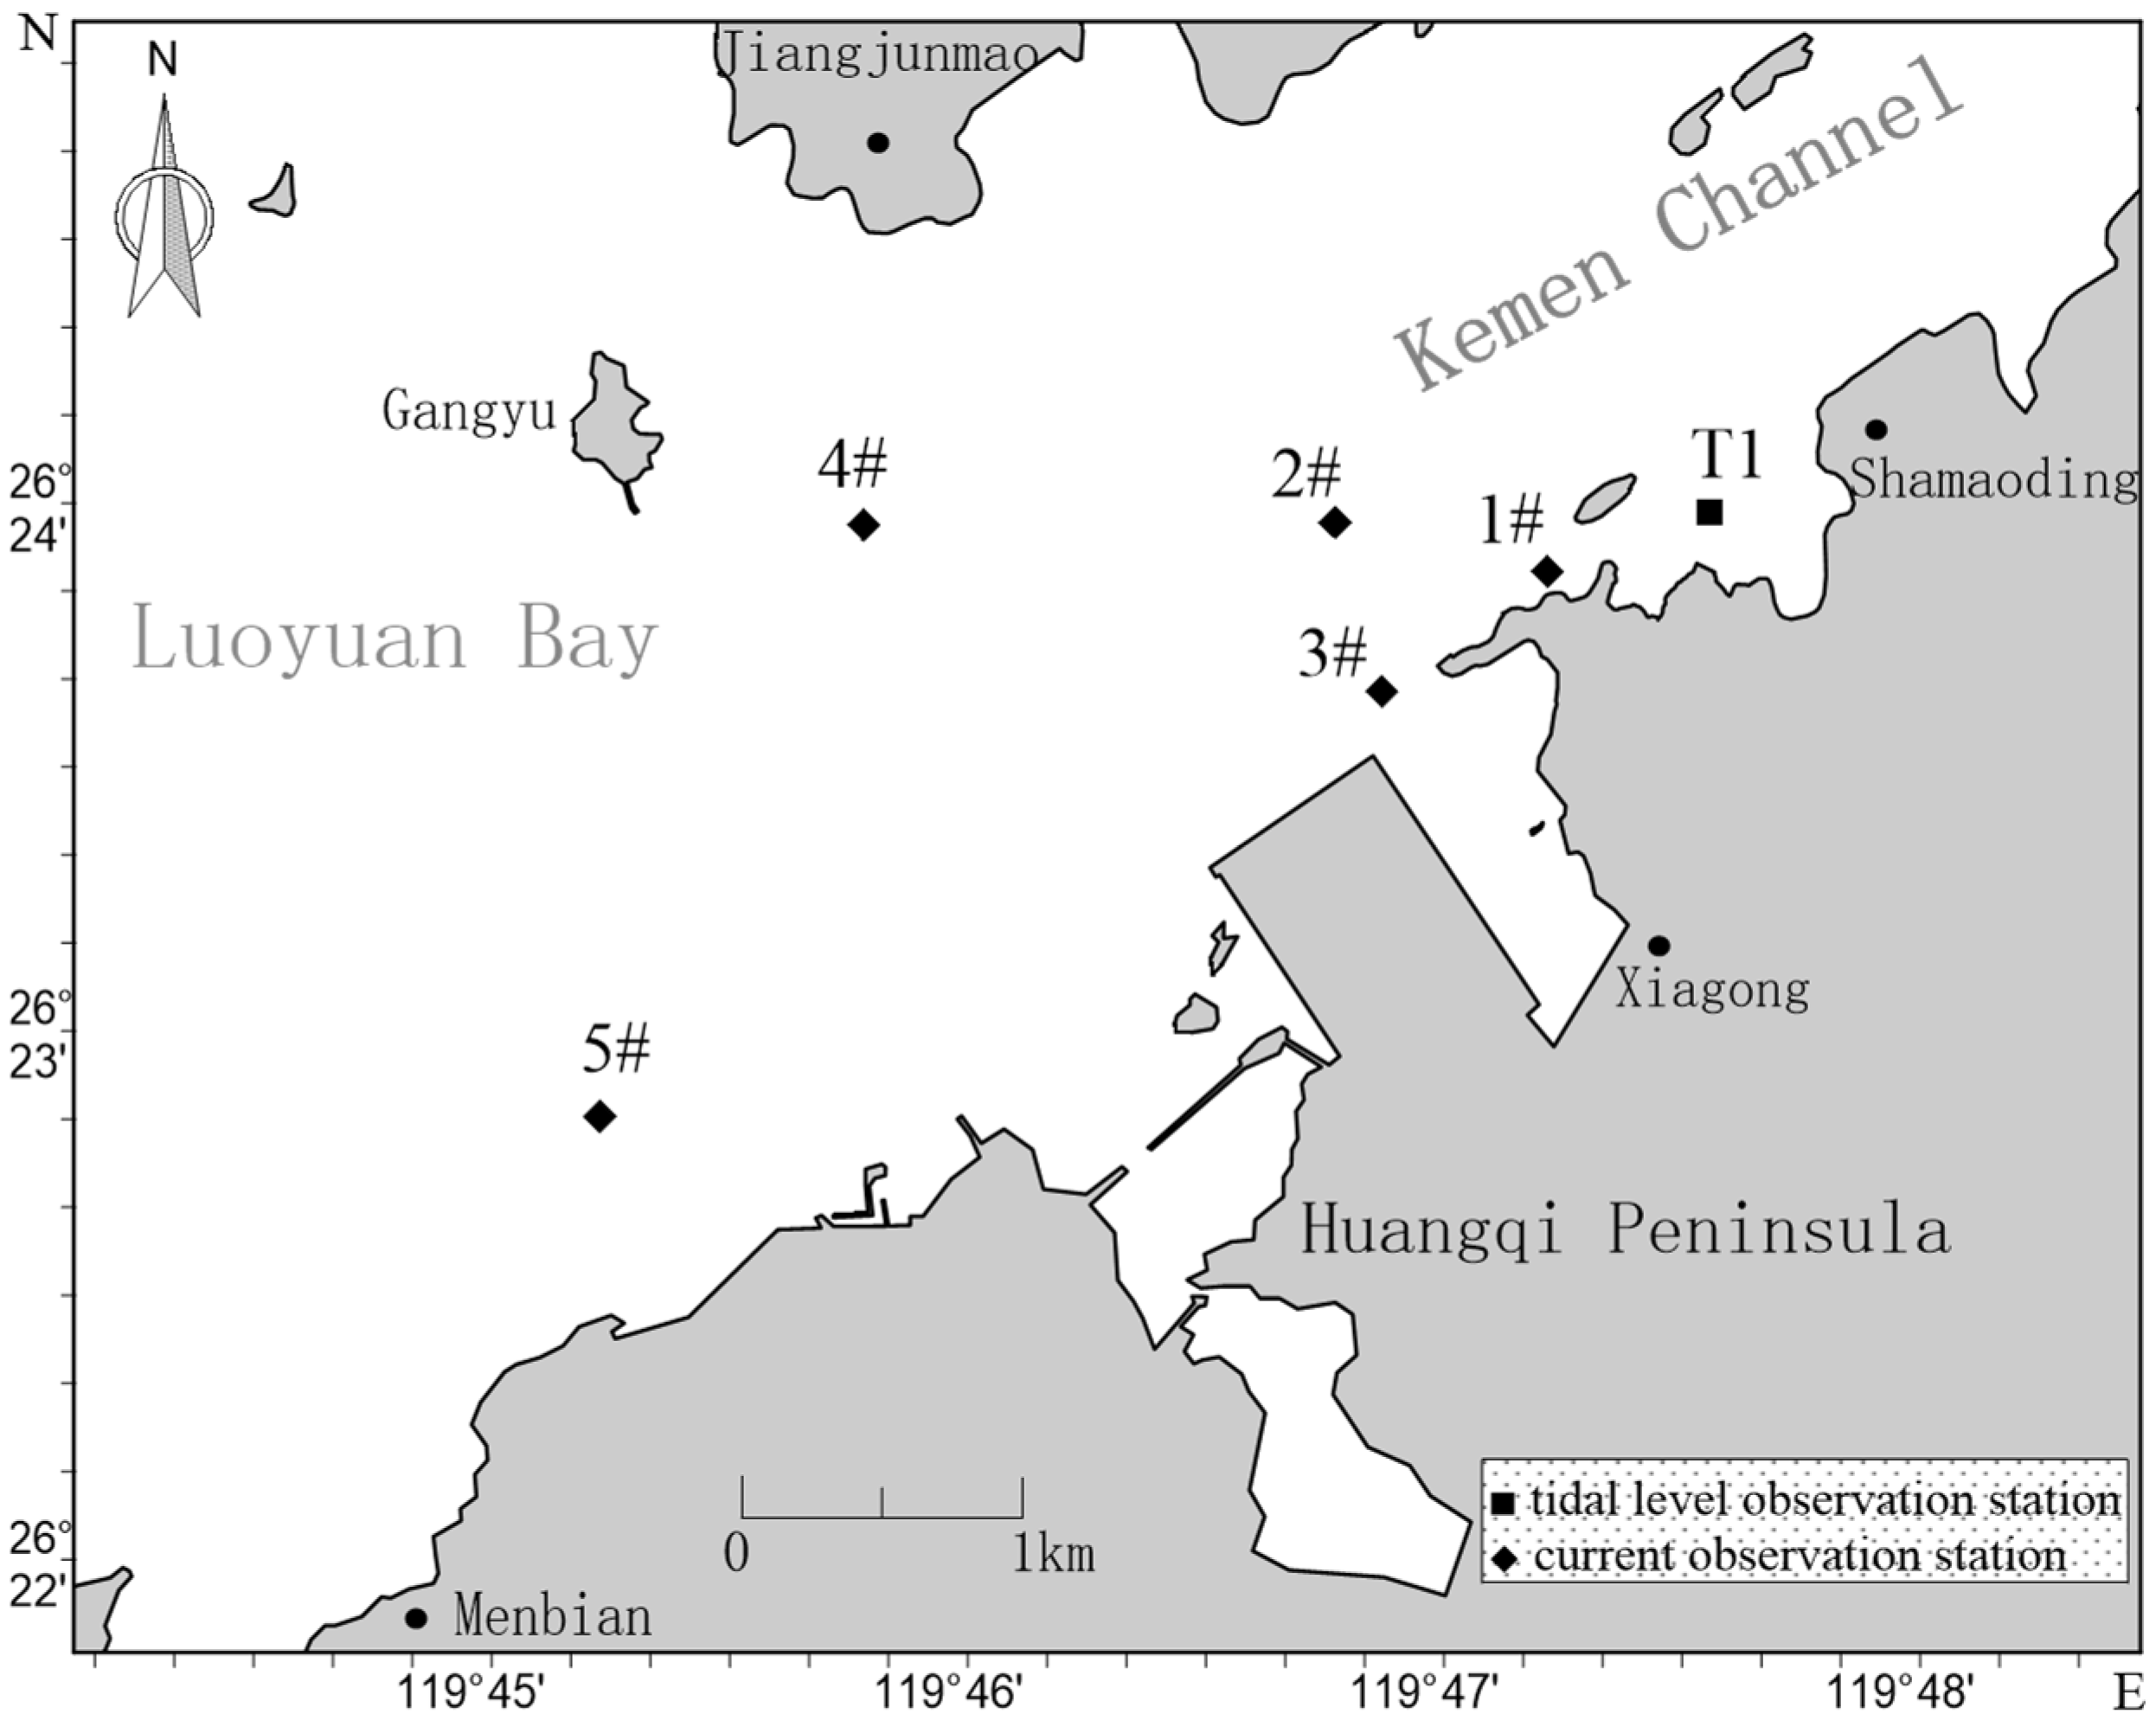
2.1. Study Areas

The Ningde Nuclear Power Plant is located in Beiwan village, Taimushan town, Fuding city, Ningde, Fujian Province, and is positioned on the west coast of Qingchuan Bay, approximately 32 km southeast of Fuding urban area (Figure 1). The planned capacity of the plant is 6-million-kilowatt units. The project was constructed in two phases, with 4 units in the first phase and 2 units in the second phase. The circulating cooling scheme of the units adopts a seawater once-through cooling scheme. The water intake and displacement of the first phase units are 130 m3/s, and the design temperature rise of the thermal discharge is 8.35 °C. The first phase of the project utilized the open channel drainage type, with the drainage outlet located on the northeast side of the plant area directly facing the open sea.
The Kemen power plant is a thermal power plant located at Kemen Port on the southern shore of Luoyuan Bay along the northeastern coast of Fujian Province (Figure 1). Luoyuan Bay is shaped like a gourd, with a topography that is characterized by a circuitous shoreline, a narrow entrance, and a broad basin. Surrounded by Luoyuan Peninsula and Huangqi Peninsula, Luoyuan Bay is directly connected to the East China Sea through a 2-km-wide narrow entrance in its northeast region. Hence, it is a semi-enclosed bay with good shielding condition. The seabed topography in the bay is complex and varies significantly, with the water depth exceeding 10 m in the Kemen waterway, reaching a maximum of 74 m. The planned capacity of the power plant is 10 million kilowatts, and there are currently four 0.6 million kilowatt supercritical units with a total installed capacity of 2.4 million kilowatts. The power plant utilizes seawater as its cooling water source, featuring a designed drainage capacity of 82 m3/s and a temperature rise of 8 °C.

2.2. In Situ Data

To ascertain the impact of thermal discharge on the water temperature in the surrounding sea area during the operation of coastal power plants, onsite investigations on sea water temperature rise were carried out in the sea areas of the two power plants.
The observation range for the large-area surface water temperature in the sea area of the Ningde Nuclear Power Plant site spanned 9000 m × 8500 m. The spacing between measurement points ranged from 250 m to 500 m, with smaller spacings near the outfall and wider intervals at the periphery. Onsite observations were conducted during both flood tide and ebb tide periods, with observation points arranged accordingly, totaling approximately 400 observations, and their distribution map is illustrated in Figure 2. Large-area surface water temperature observations were carried out during the spring tide on 5 June 2016. On that day, the temperature rise at the outfall of the Ningde Nuclear Power Plant’s Phase I was 8 °C, and the displacement was 130 m3/s. Additionally, during the spring tide in June 2016, current observations were conducted at four stations in the sea area near the nuclear power plant, and the data of the current observations are quoted below for illustration.
The water temperature observations at the Kemen power plant were divided into two parts: observations of large-area sea surface water temperatures and observations of local vertical layers water temperatures. The observation range for the large-area sea surface water temperature, approximately 600 m × 6000 m, featured a grid spacing of 200 m between measurement points, with the specific arrangement depicted in Figure 3a. Most of the observation points of the local vertical layers water temperature were near the drainage outfall, while the other points were in the northeast and southwest of the outfall area. Except for the area near the drainage outfall where the distance between adjacent measurement points was encrypted to 100 m, all the other points were spaced 200 m apart, totaling 43 observation points, as shown in Figure 3b. The water temperature observations were conducted hourly during the period of neap tides from 7:00 to 18:00 on 22 March 2013. On that day, the temperature rise at the outfall of the Kemen Power Plant was 11 °C, and the displacement rate was 40 m3/s. Additionally, during the spring tide in March 2012, current observations and tidal level observations were carried out in the sea area near the Kemen Power Plant, and the current data from five representative stations and tidal level data from one tidal station were selected for illustrative analysis and as verification data in the subsequent sections.

2.3. Methods

The two-dimensional shallow water equations with a source term in the rectangular plane coordinate system were employed as the tidal field equation:
η t + x ( H u ) + y ( H v ) = q
u t + u u x + v u y = g η x + f v r u + A x ( 2 u x 2 + 2 u y 2 ) + M x
v t + u v x + v v y = g η y f v r u + A y ( 2 v x 2 + 2 v y 2 ) + M y
where x and y represent the horizontal coordinates; t denotes time; H = d + η represents the total water depth (m); d represents the water depth below the mean water level; η represents the water surface elevation; u and v represent the velocity components in the x and y directions, respectively; u = ( 1 / H ) h η u d z and v = ( 1 / H ) h η v d z represent the depth-averaged velocity; g represents the gravitational acceleration; f represents the Coriolis parameter; r = g u 2 + v 2 / c n 2 H represents the bottom friction coefficient; c n = H 1 / 6 / n is the Chezy coefficient, where n is the seabed roughness coefficient, which varies across different regions, with a range of approximately 0.017–0.023; q is the source-sink strength of the current per unit area (m/s); Mx and My are the momentum changes at the intake and outfall, respectively (m2/s); and Ax and Ay are the horizontal kinematic viscosity coefficients calculated via the Smagorinsky formula:
A x = C Δ x Δ y [ ( u / x ) 2 + ( u / x + u / y ) 2 / 2 + ( u / y ) 2 ] 1 / 2
where C ≈ 0.1~0.2 and Ay can be determined similarly.
The above Equations (1) to (3) were solved employing the semi-implicit finite difference method proposed by Cassulli and unstructured triangular or quadrilateral orthogonal grids [30,31,32,33]. The grids are encrypted in the sea area near the power plants, with the minimum mesh side length reaching approximately 10m and the maximum extending to about 1000 m. The Euler-Lagrange method was used to discretize the convection term and horizontal viscosity term. Compared to other methods, the time step in this method is not limited by the CFL condition and can be magnified while ensuring stability.
Regarding the boundary conditions, the water levels at the open boundary of the tidal current field are provided by the tidal levels obtained from the Taiwan Strait tidal model, while the open boundary of the Taiwan Strait tidal model is provided by the forced water level, which is given by the resonant tidal levels composed of 34 tidal constituents, specifically MM, MSF, Q1, O1, M1, PI1, P1, K1, PSI1, PHI1, J1, OO1, 2N2, MU2, N2, NU2, M2, L2, T2, S2, K2, 2SM2, MO3, M3, MK3, MN4, M4, SN4, MS4, 2MN6, M6, MSN6, 2MS6, and 2SM6. The water level is a known function of time:
E = i = 1 34 f i H i cos ( σ i t + v 0 i + u i g i )
where E is the tide level; g i , H i are respectively the harmonic constants for the tidal components; σ i is the angular rate of the tidal component; v 0 i is the Greenwich astronomical initial phase angle of the tidal component; u i , f i are the intersection point correction angle and intersection point factor of the tidal component. In the tidal level expression, by substituting the intersection point factor f i and the Greenwich astronomical phase angle v 0 i + u i for each tidal component in synchronization with the observed data, the tidal level curves at each open boundary control point can be predicted in synchronization with the observed data, serving as the open boundary conditions for the tidal current field.

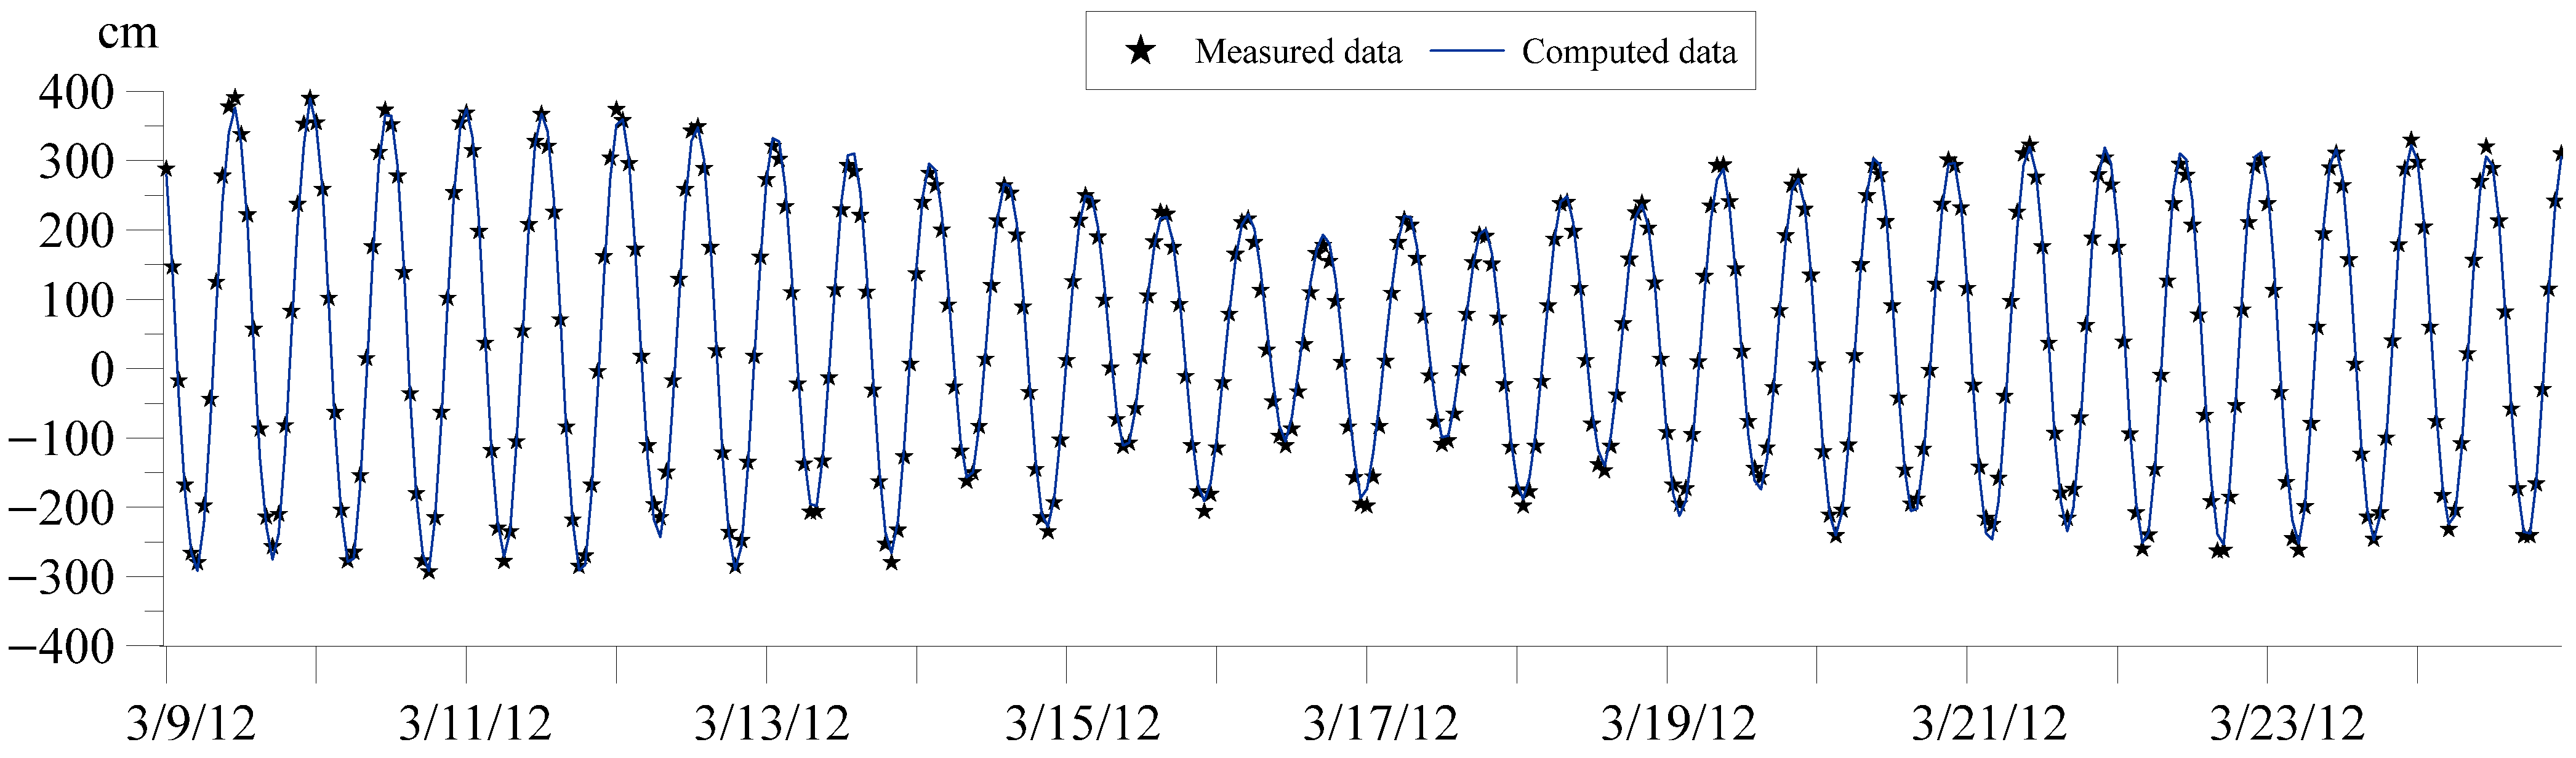
2.4. Model Validation

To assess the reliability of the tidal current field model, validations of tidal levels and tidal currents were first conducted via observational data of tidal levels and currents collected in the Luoyuan Bay area in March 2012. Figure 4 presents the verification station map for tidal levels and tidal currents. Figure 5 shows a comparison curve between the measured and calculated tidal levels at station T1, indicating that the computed data coincided with the measured data. Figure 6 shows the verification curves of the current velocity and direction at the tidal current stations, which demonstrate that the calculated values at each station are essentially consistent with the measured values.
In addition, we validated the model via field-observed tidal current and level data from the Ningde Nuclear Power Project sea area collected in June, 2016. The validation results revealed that the calculated values of the tidal level, current velocity and direction are consistent with the measured values. Owing to space limitations, comparative graphical results are not presented here. The above validation results for tidal levels and tidal currents indicate that the tidal current field model has a good reproducibility and, consequently, can be used for simulating the hydrodynamic environment of the study areas.

3. Results

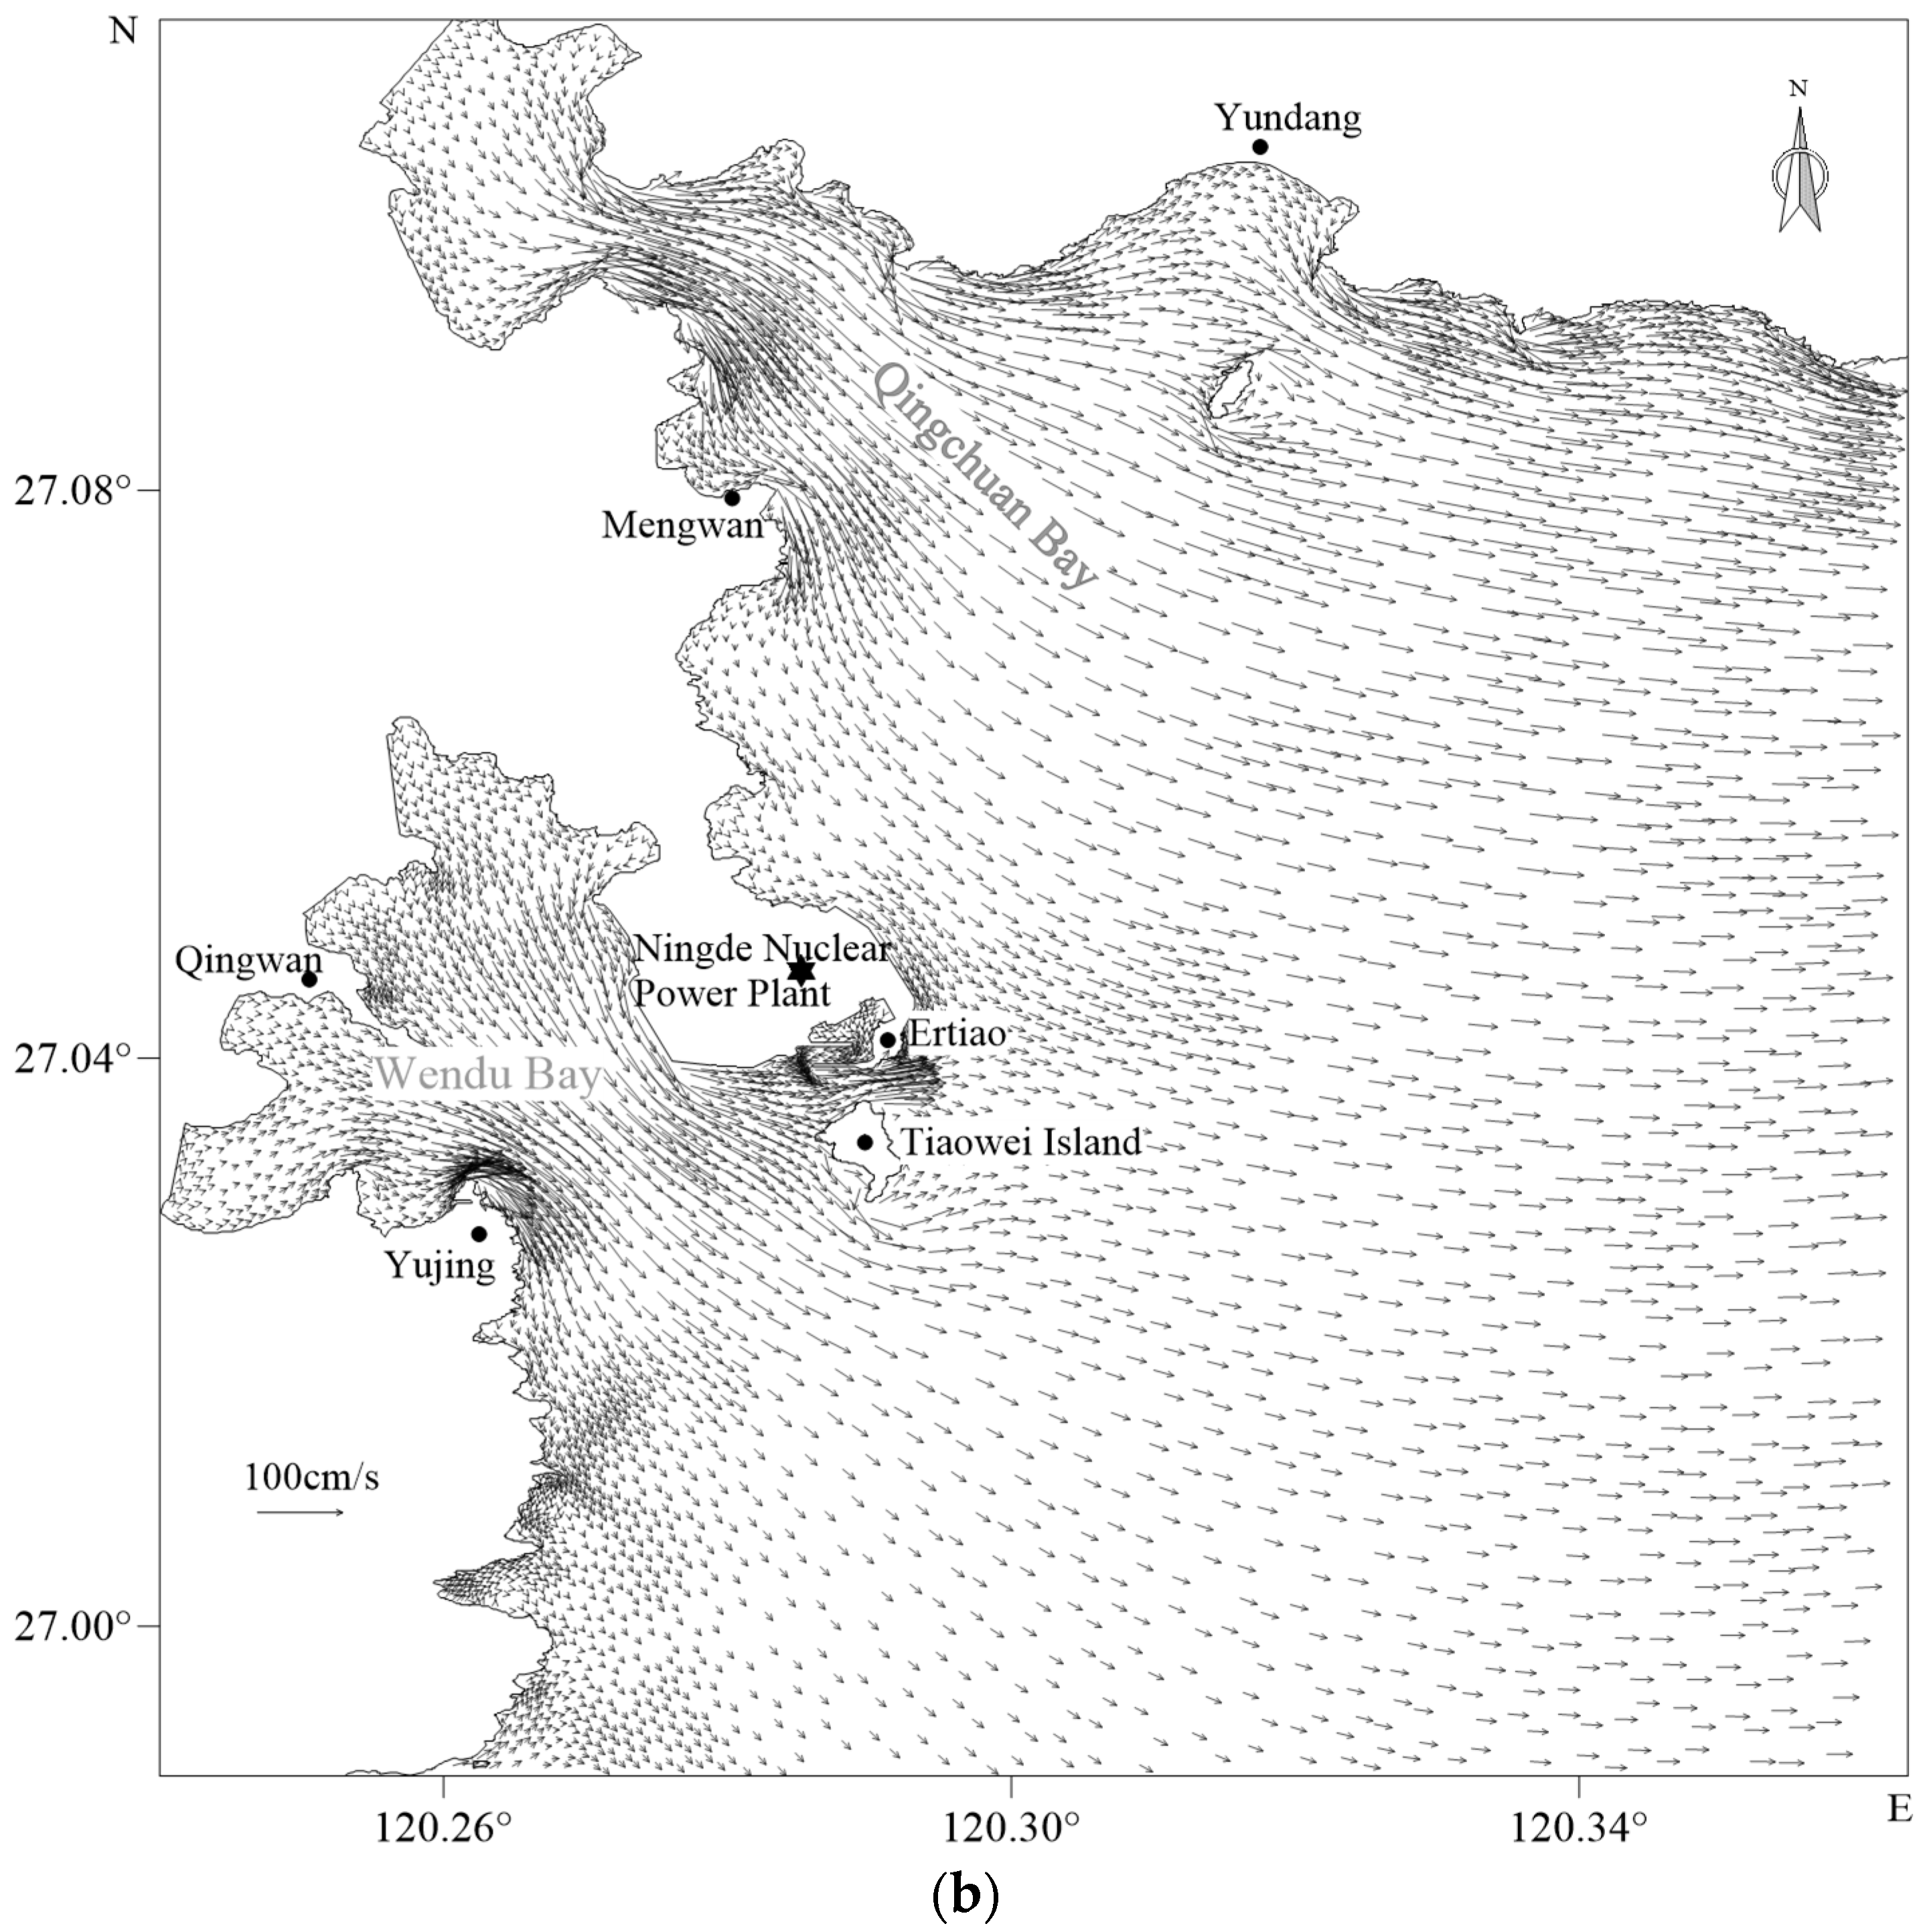
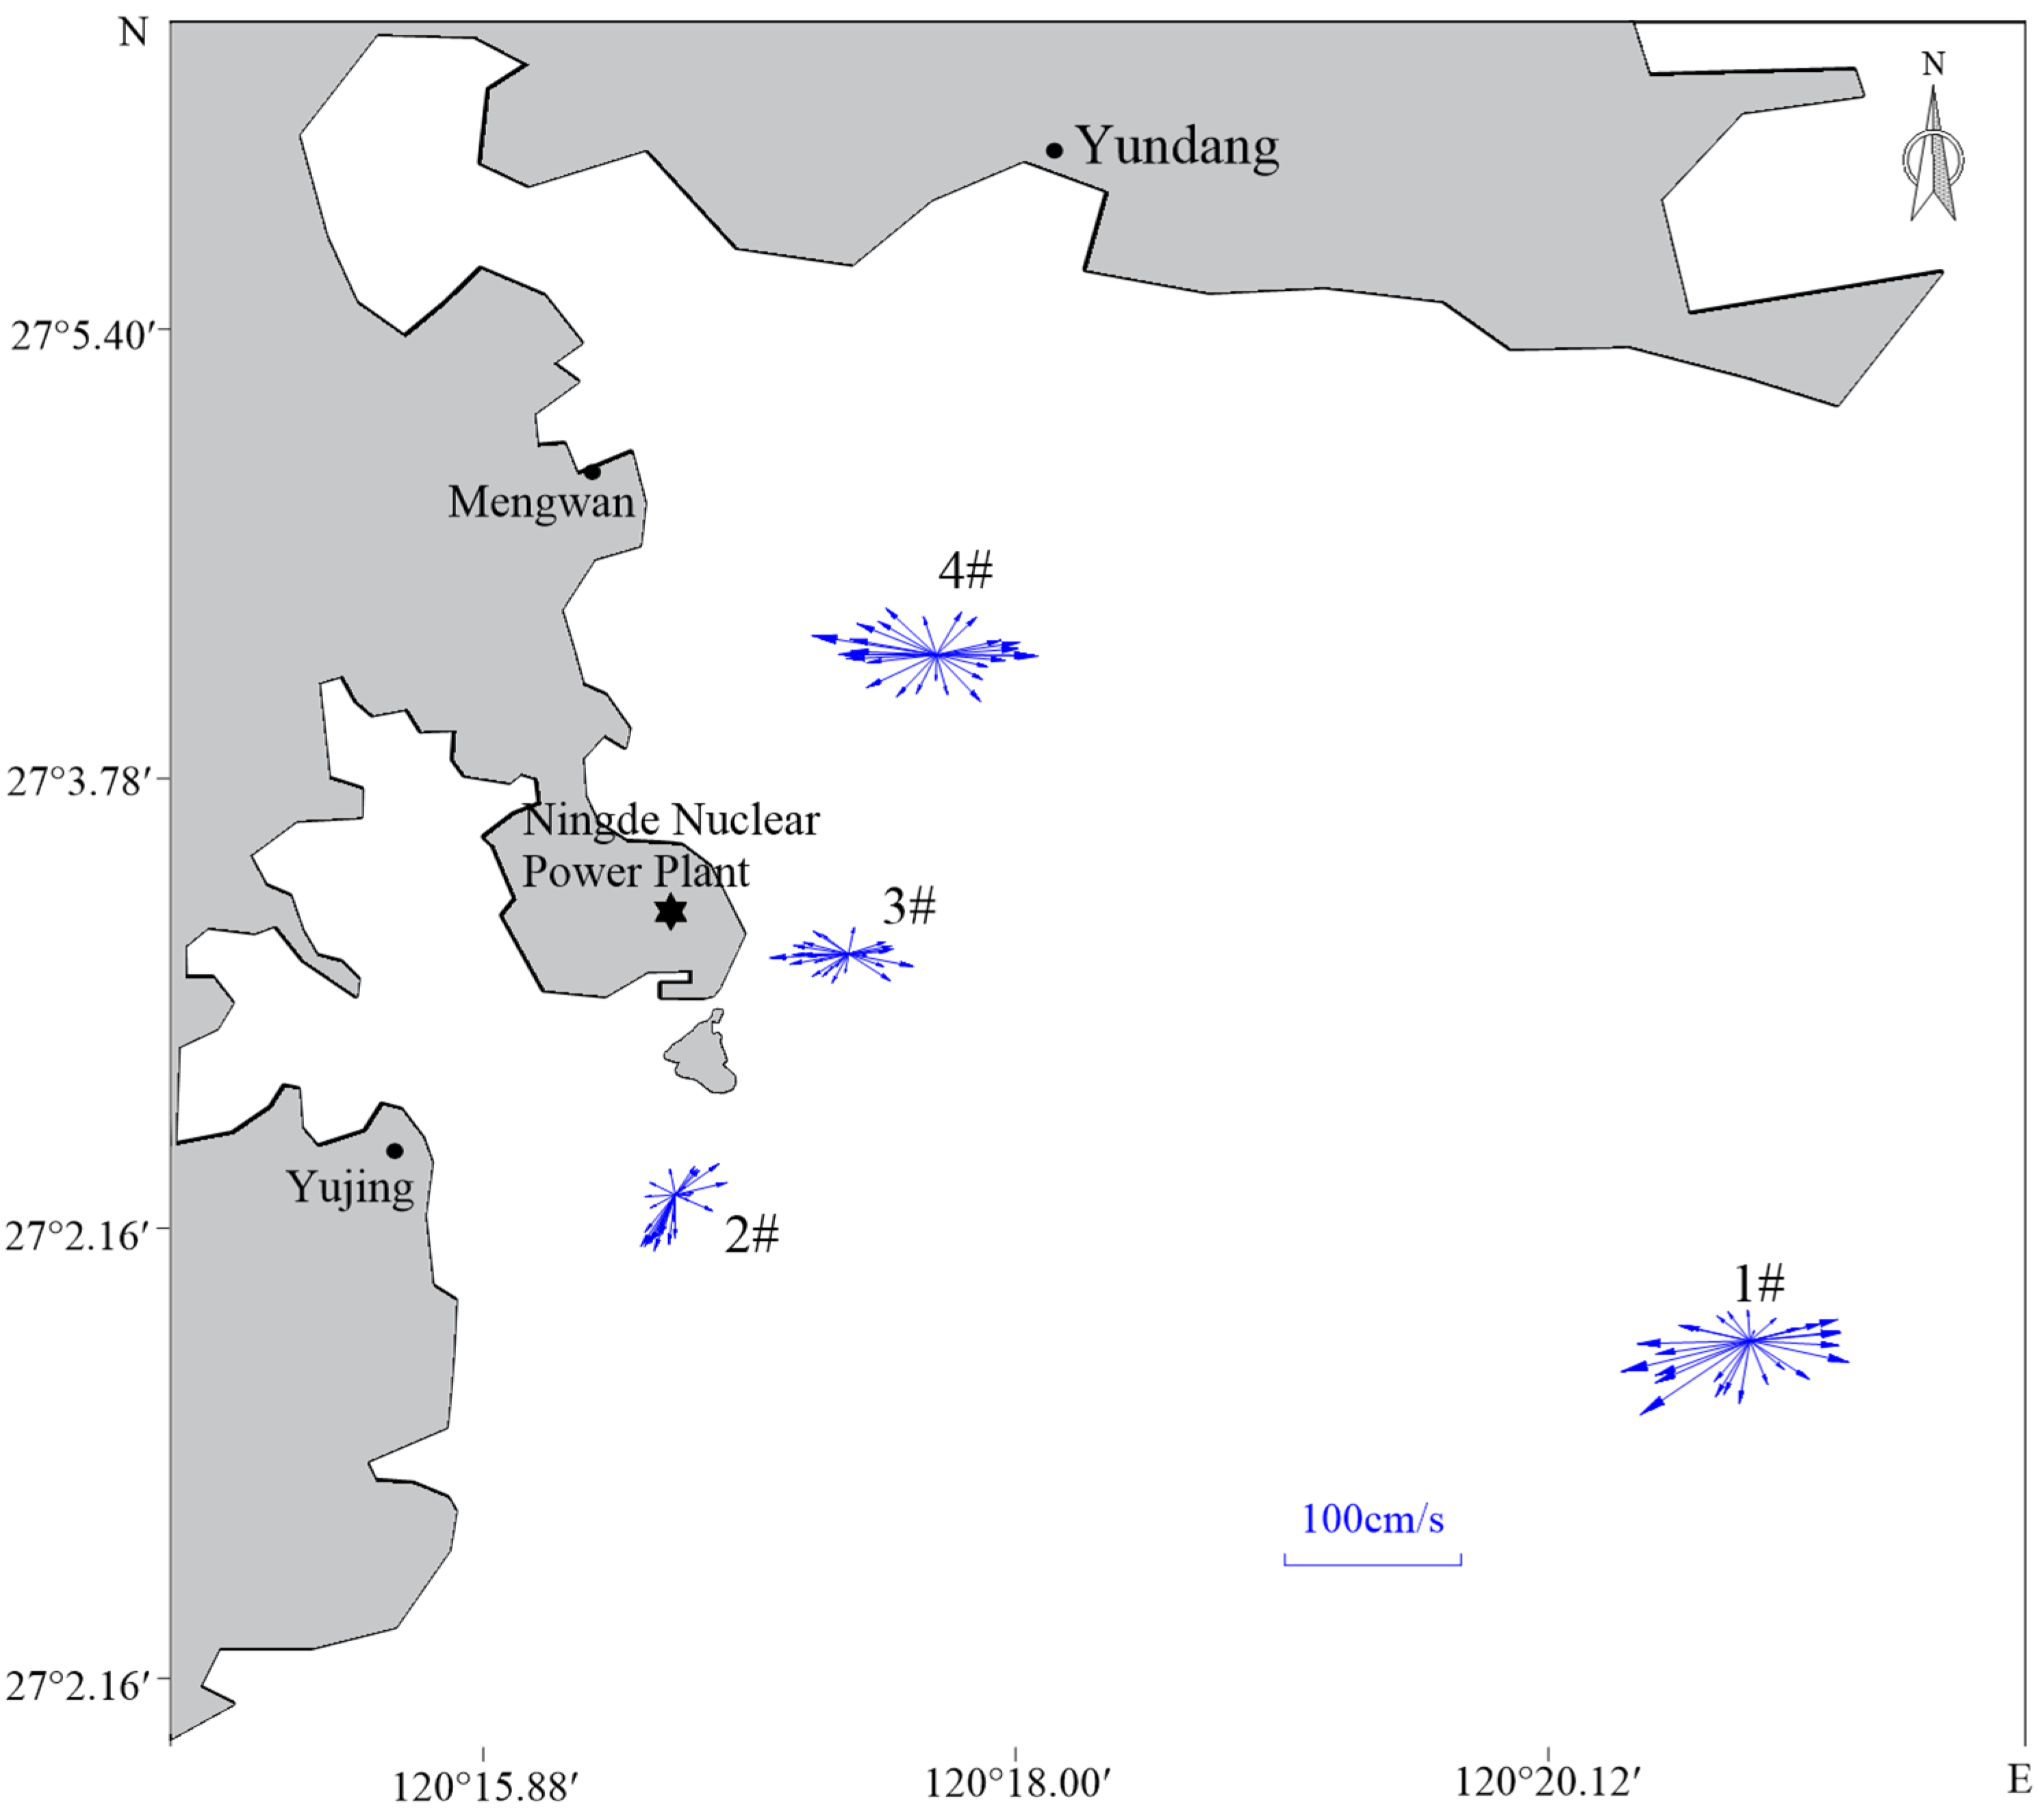
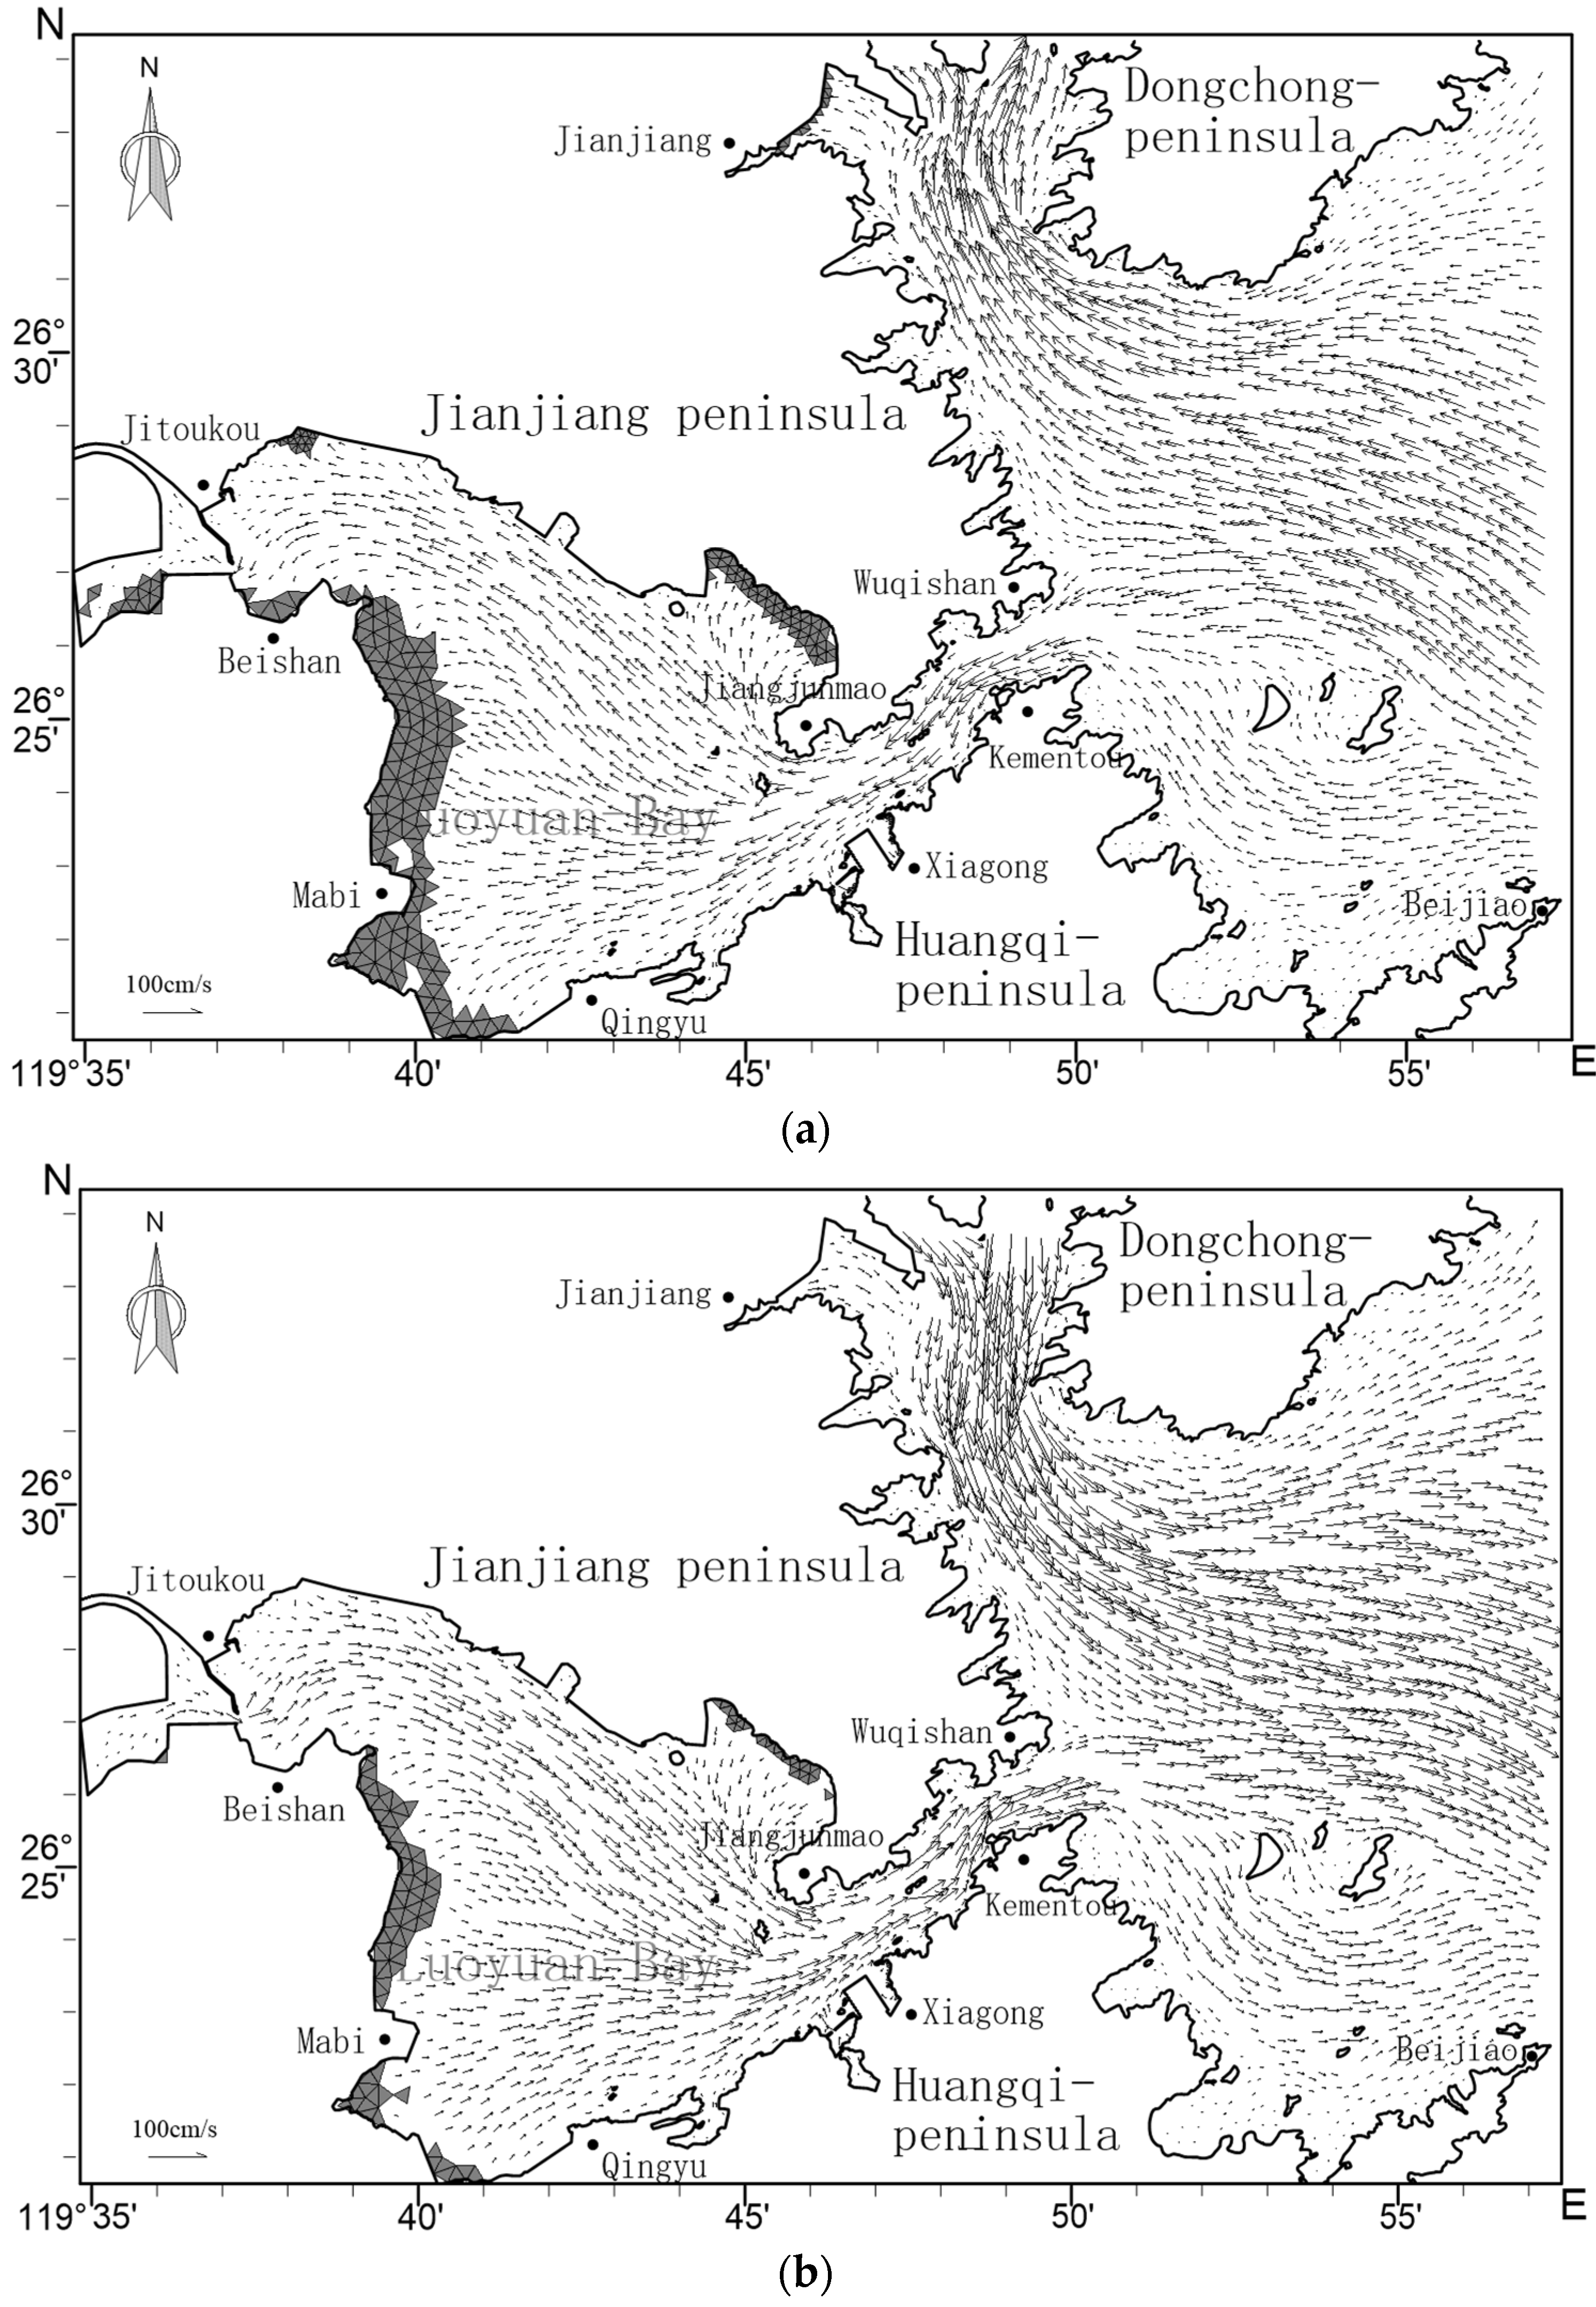
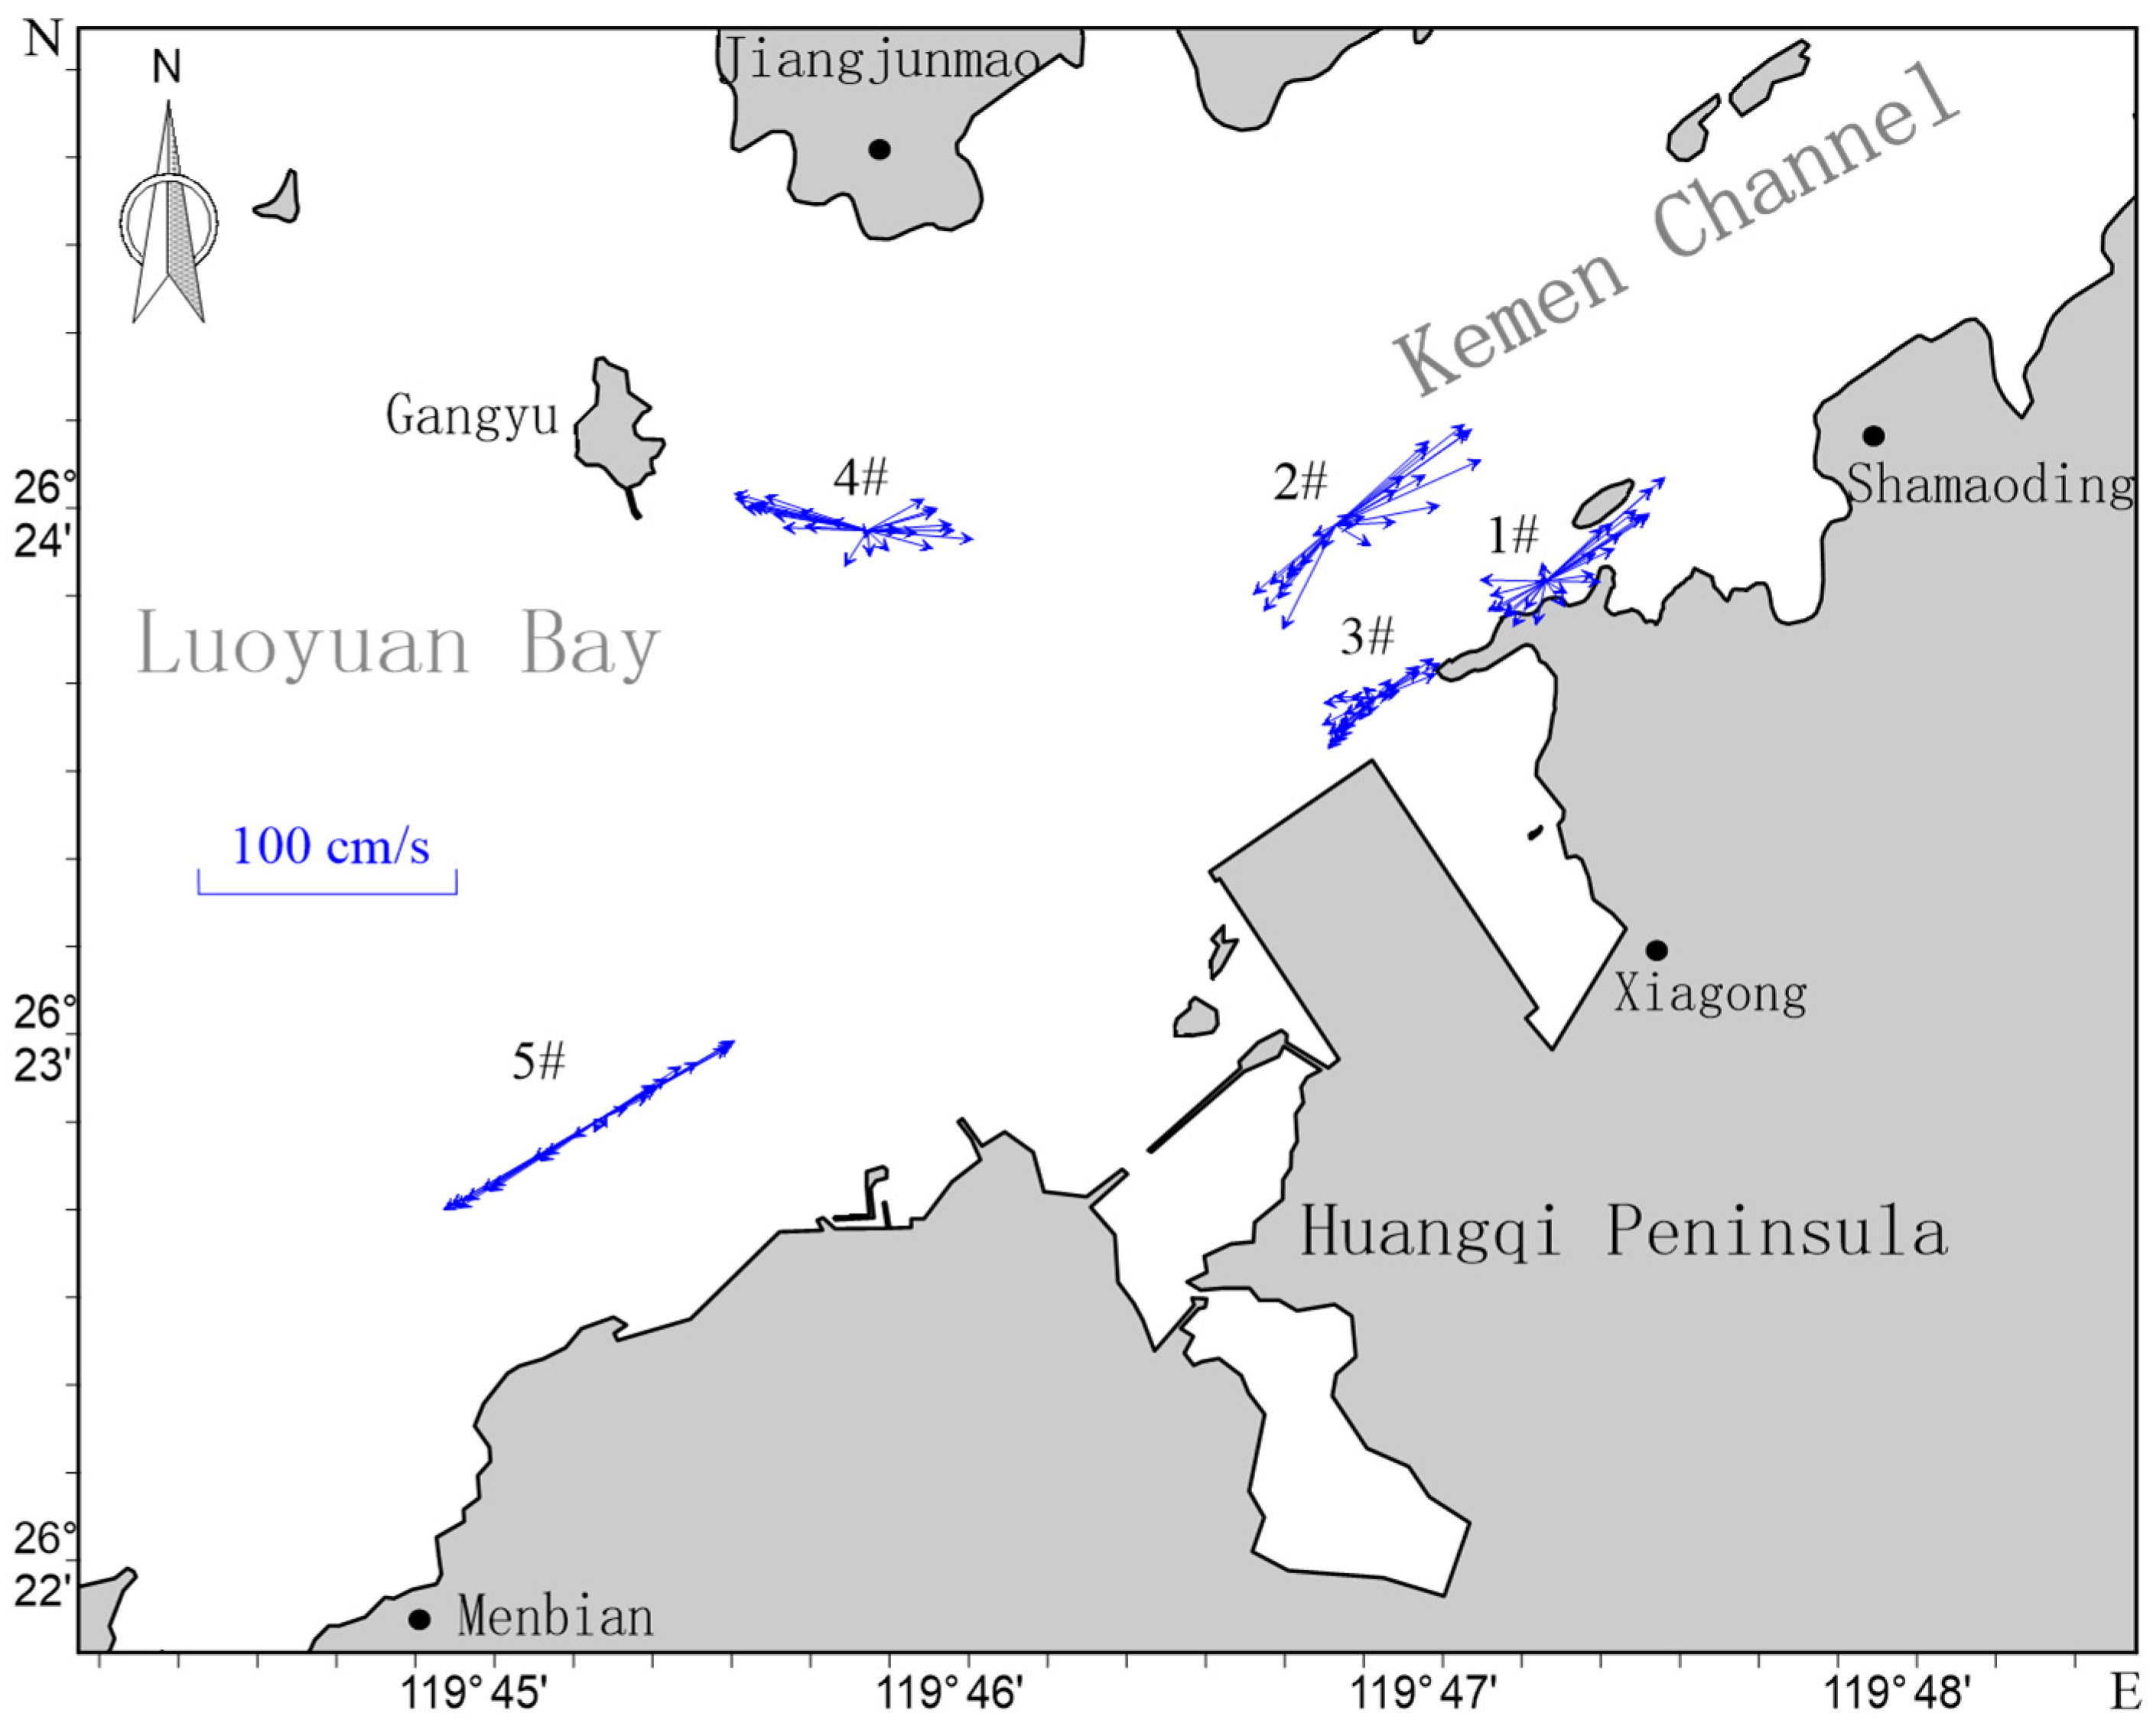
3.1. Tidal Current Characteristics

3.1.1. Ningde Nuclear Power Plant

The flow field diagram for flood and ebb tides during spring tides in the vicinity sea area of the Ningde Nuclear Power Plant site is presented in Figure 7. The flood currents flow westward and northwestward from the open sea east of the Taishan Islands into Qingchuan Bay. Upon reaching the frontal sea area of the plant site, the westward flood currents divide, with one portion flowing northwest toward the top of Qingchuan Bay and the other portion proceeding westward through the waterway between Tiaowei Island and Ertiao Island or bypassing the southern side of Tiaowei Island to enter Wendu Bay. During ebb tides, the currents generally flow in the opposite direction to the flood currents, exiting from the inside of the bay toward the outer sea. In the vicinity of the power plant outfall, the ebb currents flow predominantly in the southeast (SE) direction.
The vertically averaged flow vector diagram for various stations in the vicinity of the Ningde Nuclear Power Plant site during the spring tides in June 2016 is presented in Figure 8, which was plotted via tidal current data collected from hourly observations spanning 27 h at each station. As shown in the diagram, the tidal currents at Stations #2, #3, and #4 in the front sea area of the nuclear power plant site exhibit rotational flow characteristics. For the tidal currents at station #1, which are located slightly offshore, although they display rectilinear flow properties, the flow direction has a certain degree of rotation.

3.1.2. Kemen Power Plant

The current field diagrams for both flood and ebb tides in Luoyuan Bay and its adjacent waters during spring tides are presented in Figure 9. As depicted, the oceanic inflow divides into two branches just outside the entrance of Luoyuan Bay during flood tide. One branch flows northward toward Dongchong Pass, whereas the other branch enters the bay through the entrance and subsequently fans out, flowing toward the westernmost waters of the bay along the northwestern channel, the central shallow waters, and the southwestern channel (Figure 9a). During ebb tide, the direction of the currents is basically opposite to that of the flood currents. The water flows in the northern, central, and southern parts of Luoyuan Bay converge toward the Kemen Waterway in the southeast, east, and northeast directions, respectively, and then flows out to the open sea through the entrance of Luoyuan Bay (Figure 9b).
The vertically averaged flow vector diagram for various stations in the vicinity of the Kemen Power Plant site during the spring tides in March 2012 is presented in Figure 10, which was plotted via tidal current data collected from hourly observations spanning 27 h at each station. As shown in the diagram, the tidal currents at each station exhibit typical reciprocating flow characteristics. This is due to the constraints of the terrain on both the north and south sides of the Kemen Channel, as the water flow can only enter and exit the bay along the waterway during flood and ebb tides. Therefore, the directions of the flood and ebb currents in this area are generally in the direction of the Kemen Waterway, manifesting as reciprocating tidal flows within the tidal cycle.

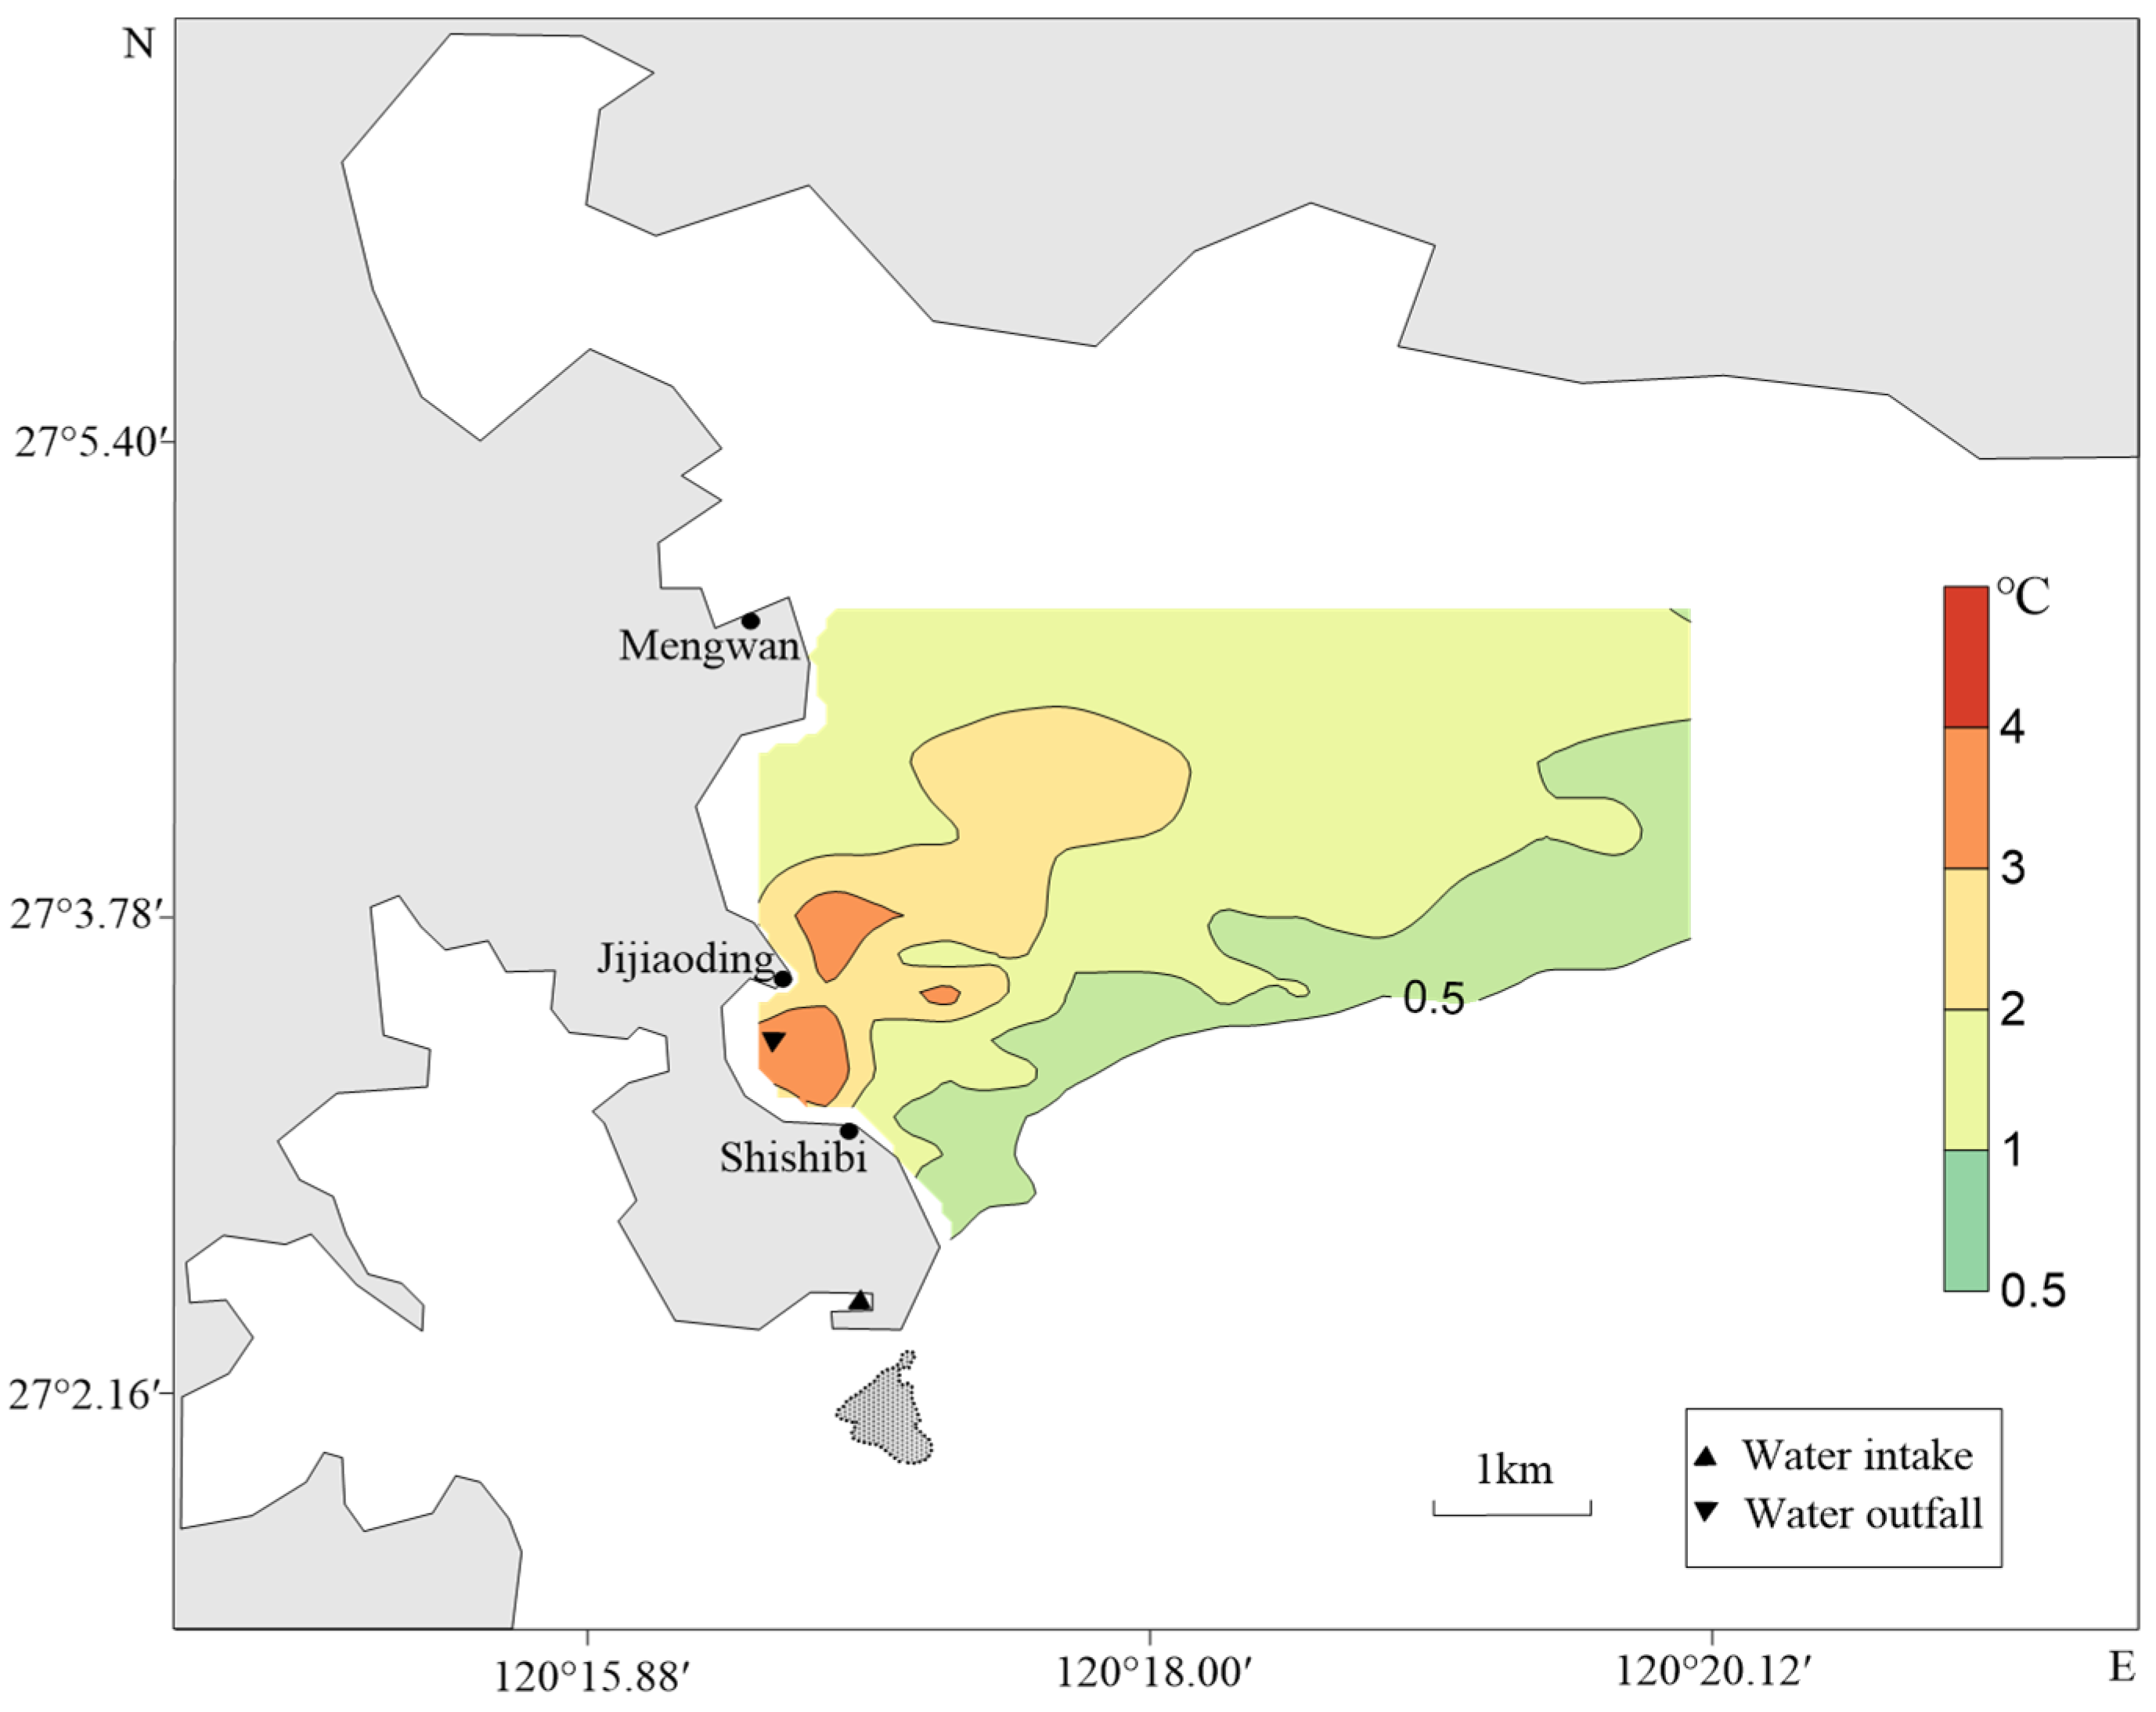
3.2. Thermal Diffusion Range

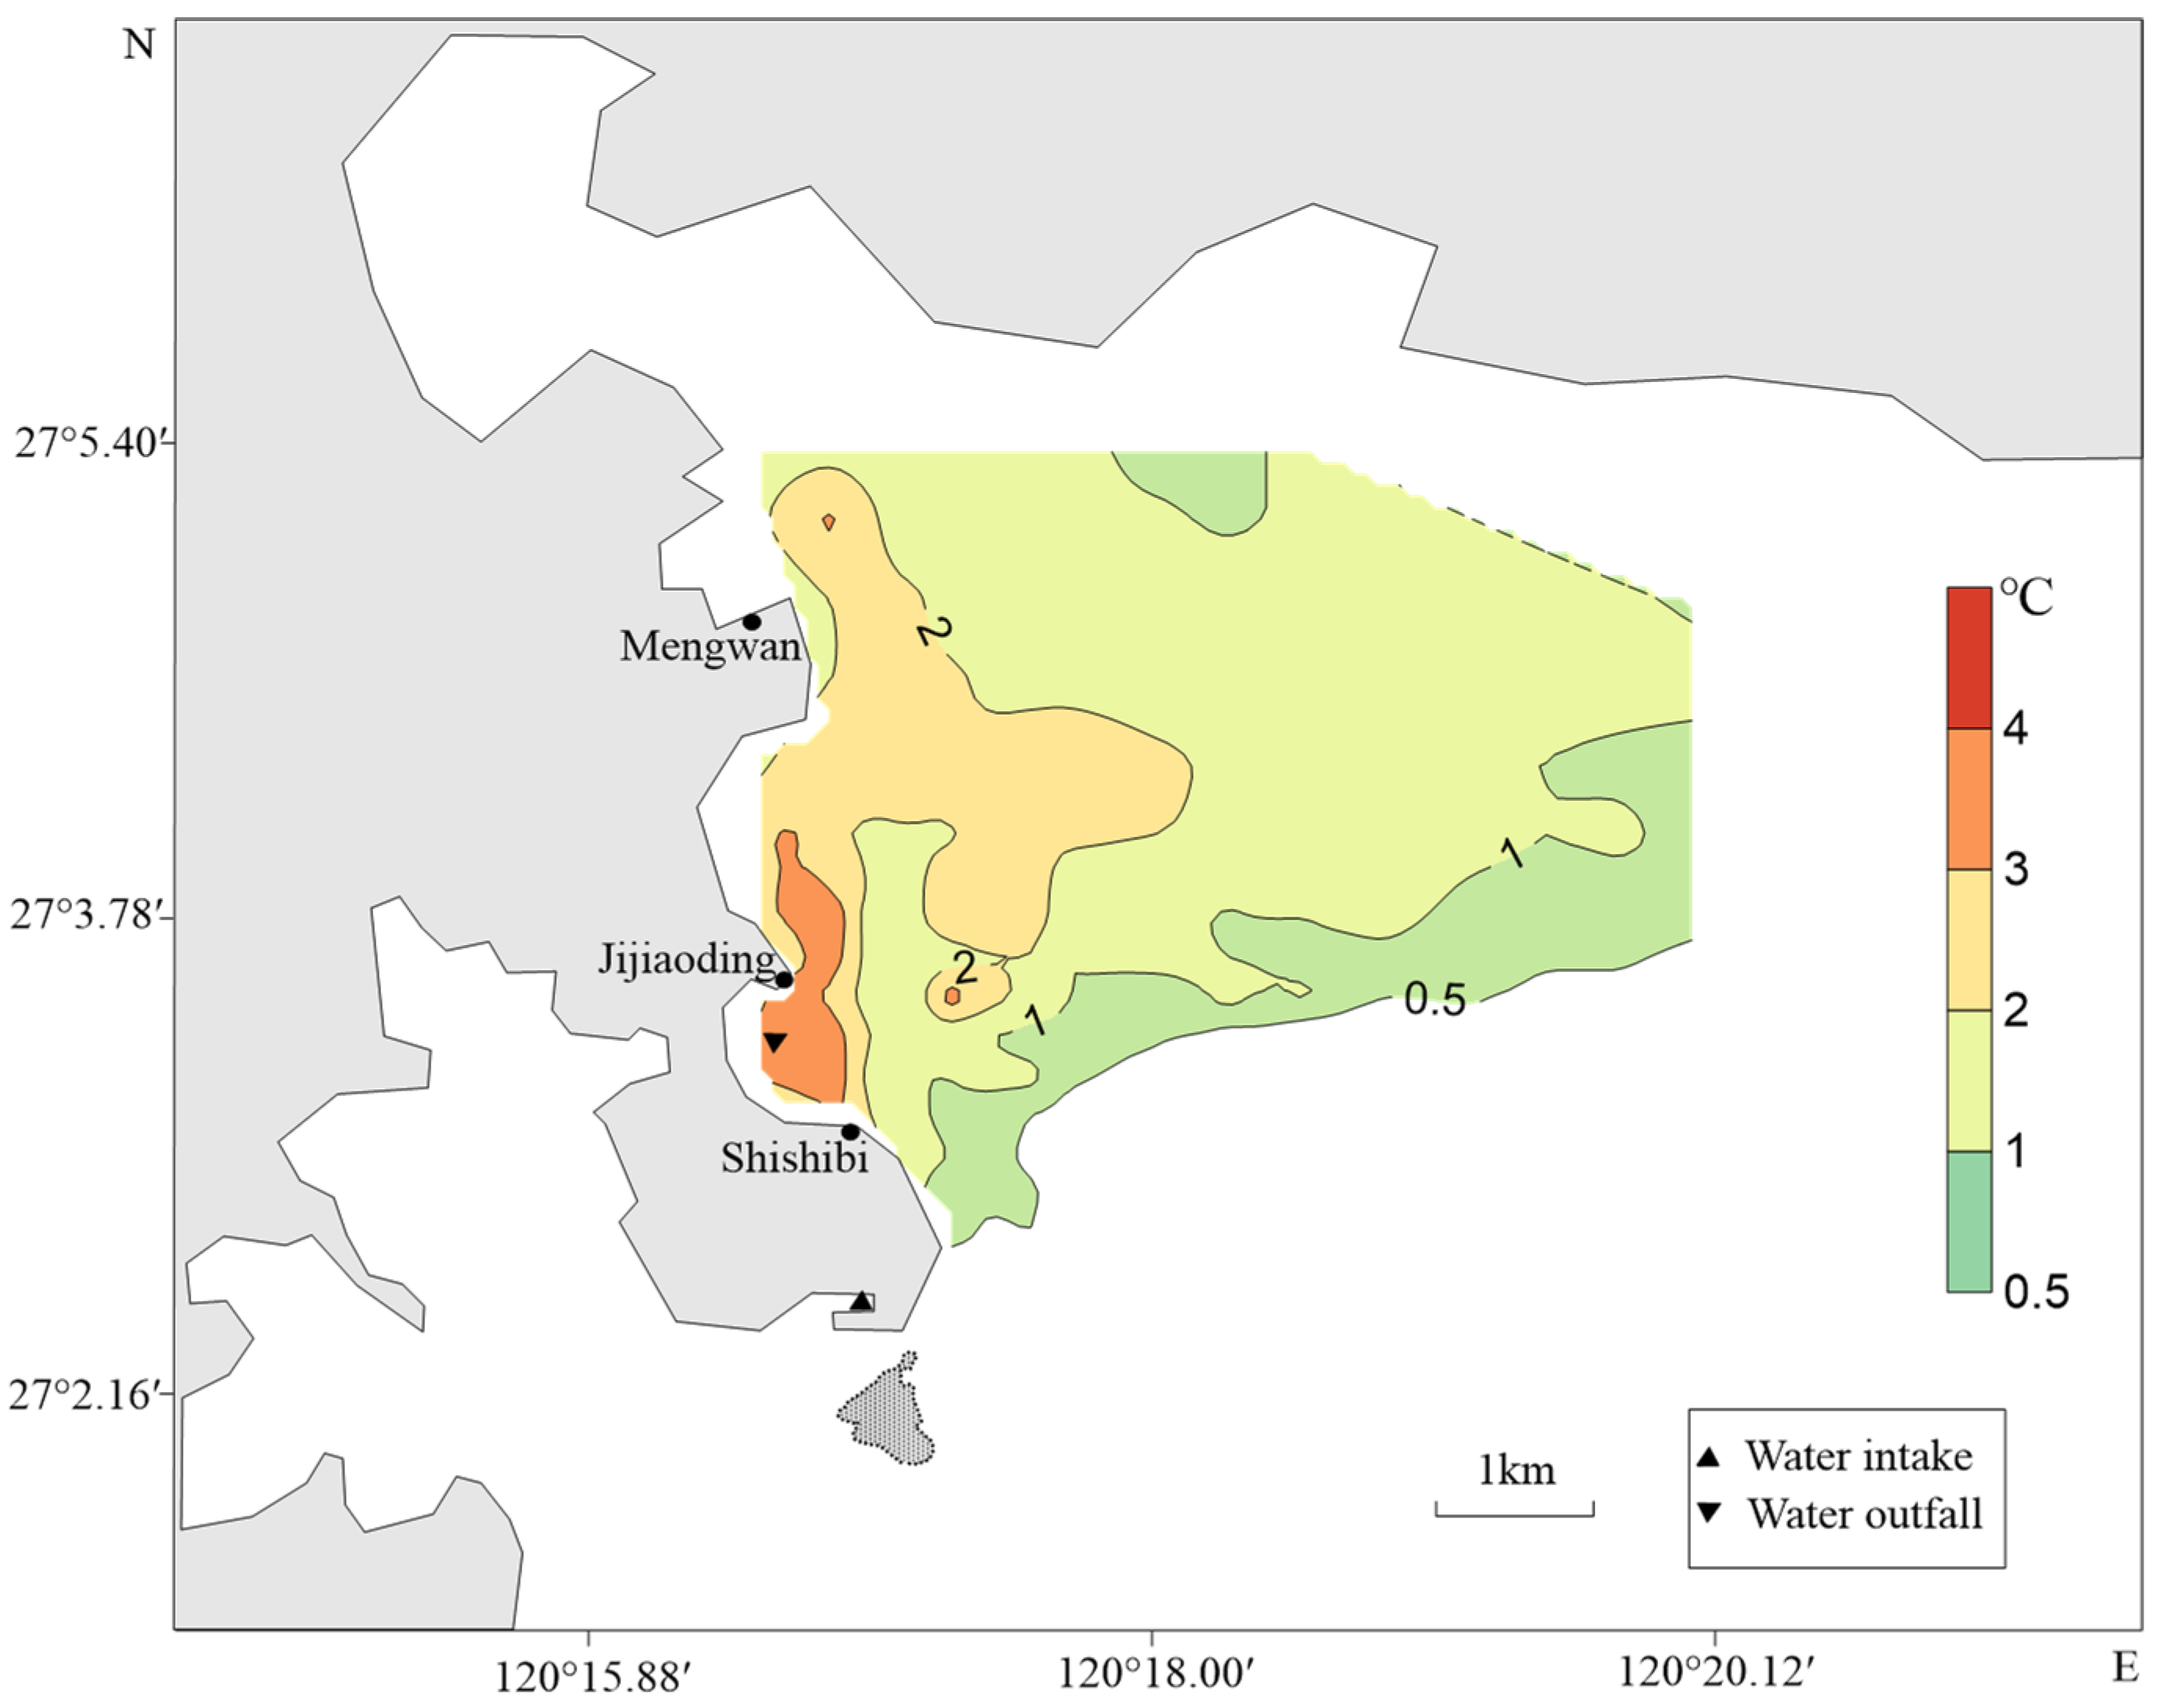
3.2.1. Thermal Diffusion Range in the Sea Area of the Ningde Nuclear Power Plant

On the basis of the measured water temperature data during the spring tides in June 2016 in the sea area of the Ningde Nuclear Power Plant, contour maps of the temperature rise during flood tide and ebb tide periods, as well as an envelope diagram of the maximum temperature rise throughout the entire tidal cycle, were plotted. Figure 11 and Figure 12 individually show the envelope diagrams of the maximum temperature rise during the flood tide and ebb tide periods, whereas Figure 13 presents the envelope diagram of the maximum temperature rise throughout the entire tidal cycle.
As shown in Figure 11, within the observation range during the flood tide period, the envelope of temperature rise exceeding 3 °C is concentrated mainly in localized areas east and north of the outfall, with the maximum temperature rise not exceeding 4 °C; the envelope of temperature rise exceeding 2 °C spreads south toward the Shishibi sea area and north toward the more distant Mengwan sea area; the range of temperature rise exceeding 1 °C extends north beyond most of the survey area’s boundaries, reaching a maximum distance of approximately 3.2 km offshore from the outfall; and the temperature rise in other areas is less than 1 °C. According to Figure 12, within the observation range during the ebb tide period, the envelope of the temperature rise exceeding 3 °C is mainly concentrated in localized areas to the east and northeast of the outfall, with the maximum temperature rise not exceeding 4 °C; the envelope of the temperature rise exceeding 2 °C mainly spreads northeast to approximately 3.3 km away from the outfall; the range of the temperature rise exceeding 1 °C extends northward beyond the boundary of the surveyed area and southward from the Shishibi sea area toward the east-northeast, reaching the eastern boundary of the surveyed area; and the temperature rise in the southern part of this range is less than 1 °C.
From the perspective of the entire tidal cycle (Figure 13), the maximum temperature rise is distributed mainly in localized areas close to the outfall, with the maximum temperature rise not exceeding 4 °C. The envelope of maximum temperature rise exceeding 3 °C is mostly located in the sea area to the north of the outfall, extending farthest around Jijiaoding Reef and spreading approximately 1 km north of it; the range of temperature rise exceeding 1 °C extends to most of the northern boundary and parts of the eastern boundary of the entire surveyed area; and the maximum temperature rise in the area south of the east-northeast direction of Shishibi is less than 1 °C.

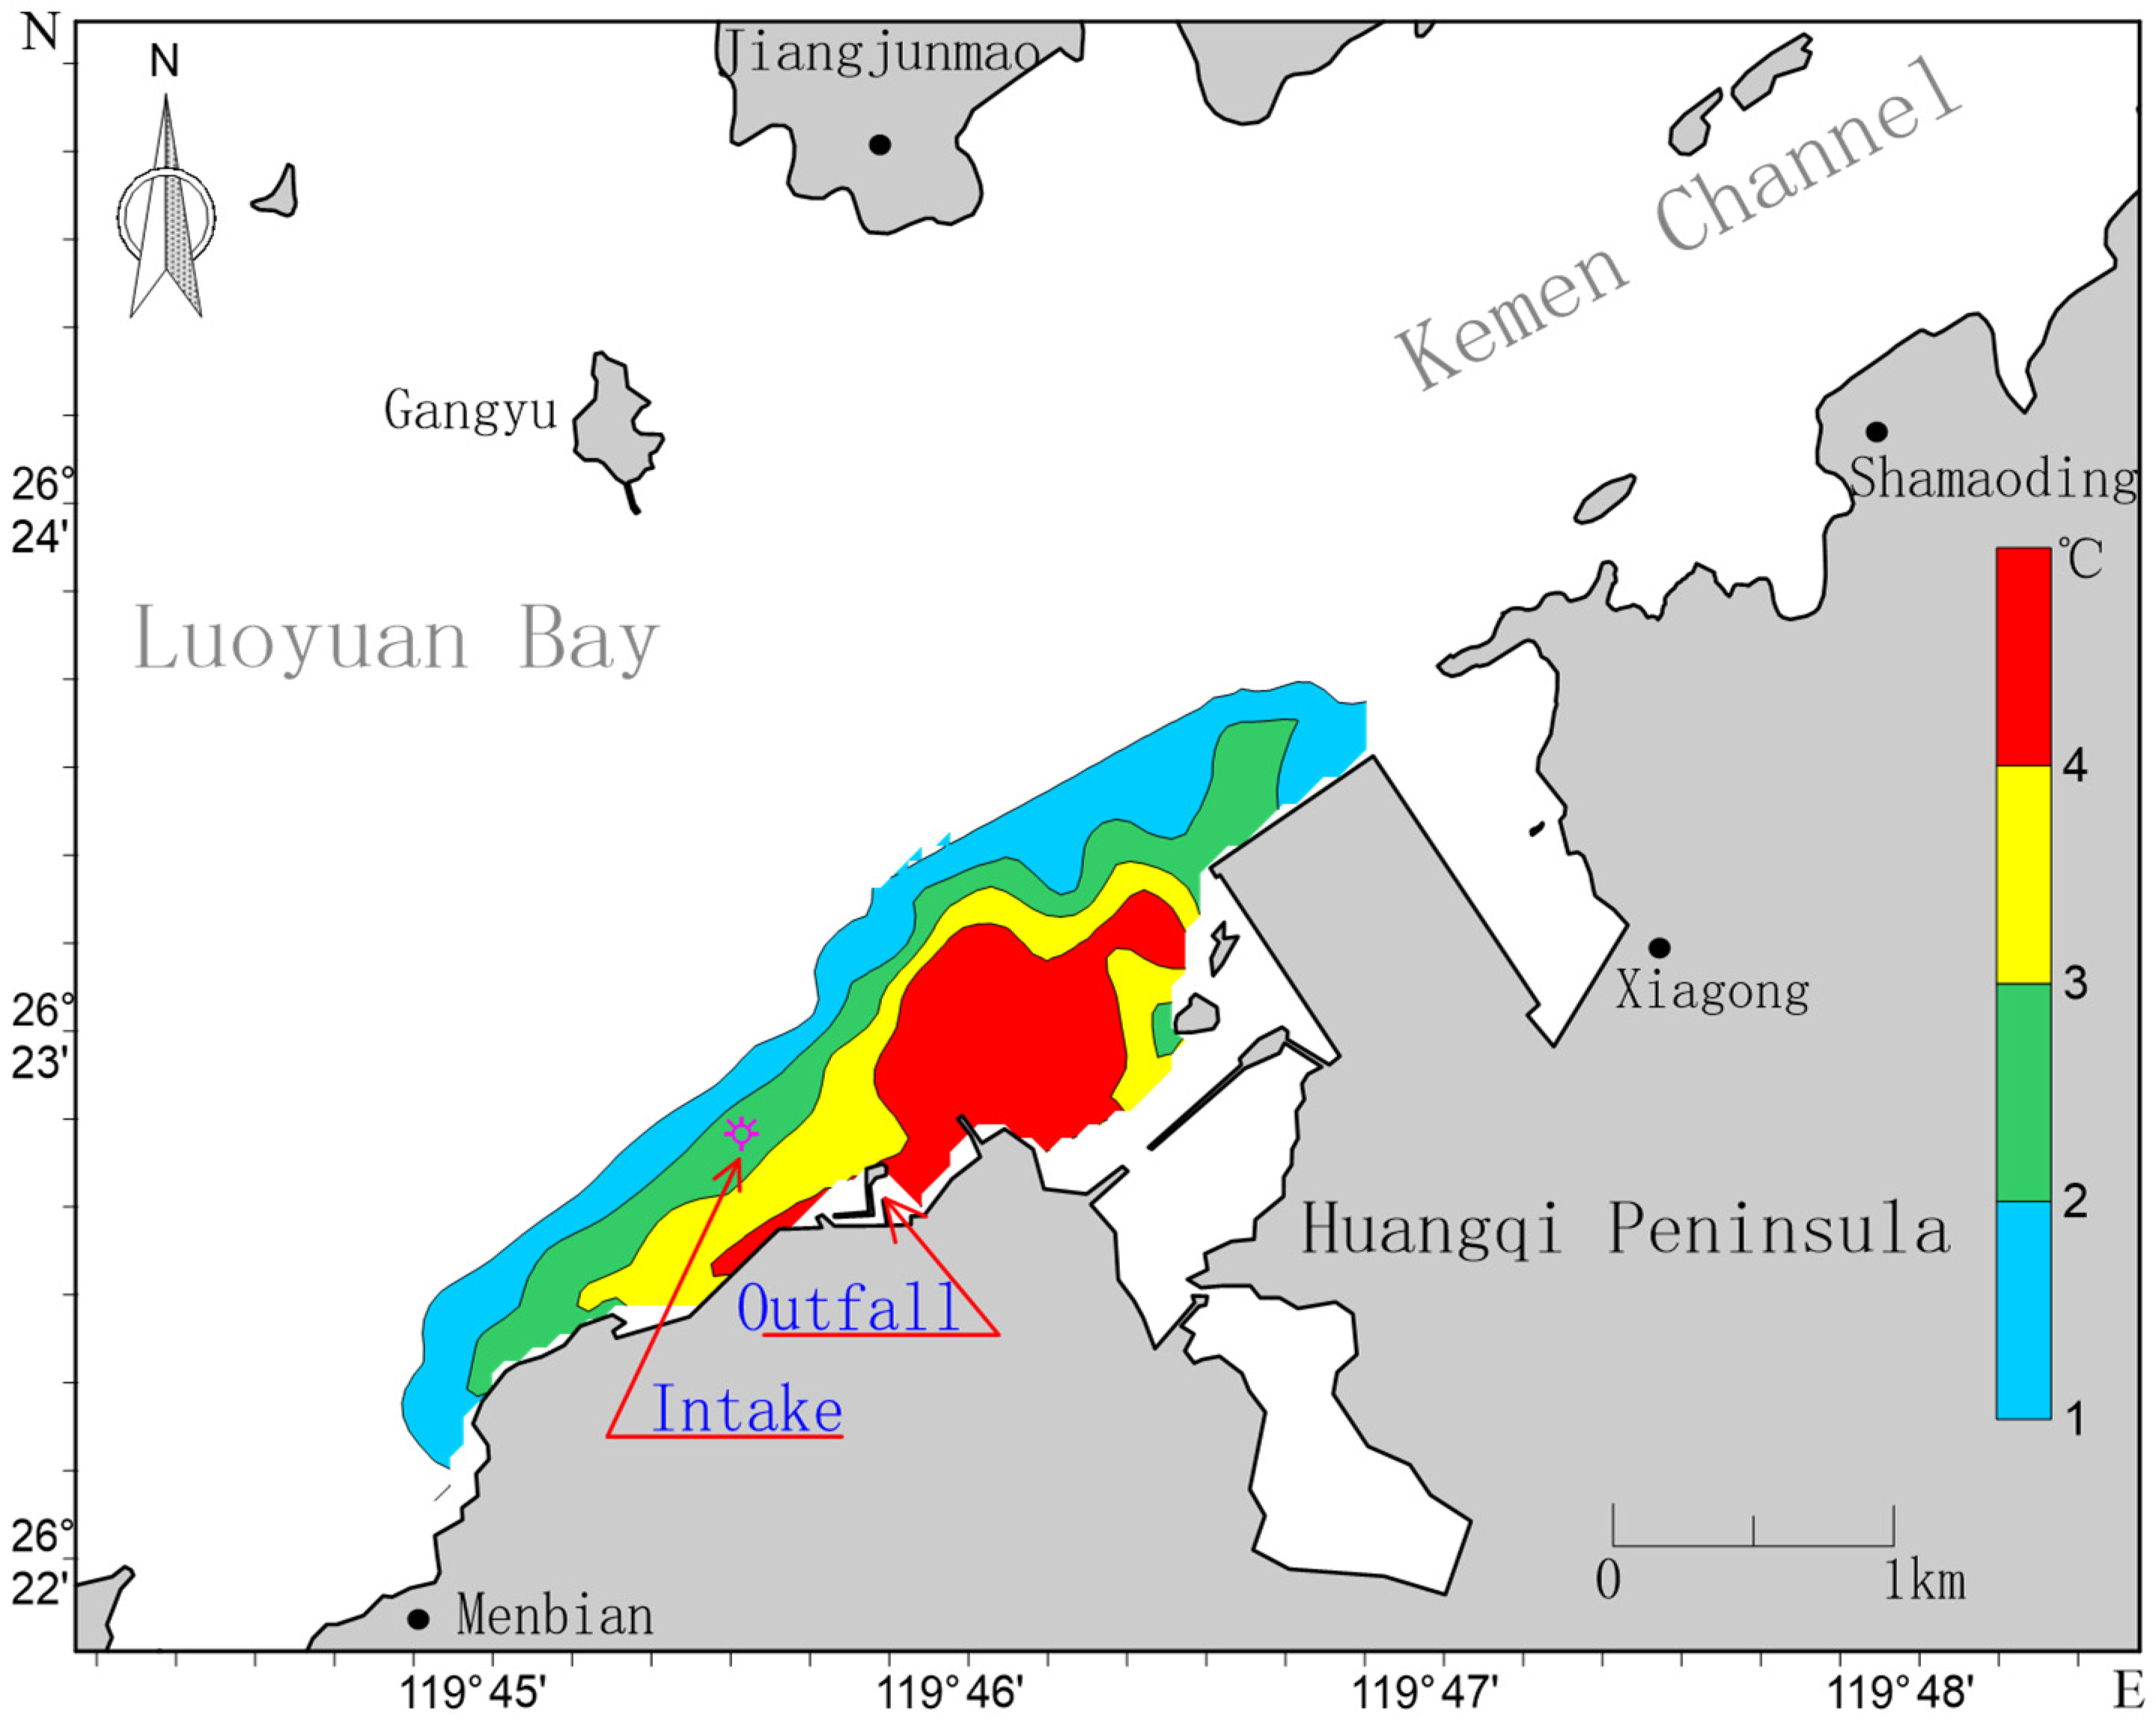
3.2.2. Thermal Diffusion Range in the Sea Area of the Kemen Power Plant

The envelope range of the maximum surface temperature rise observed during a period of neap tides in March 2012 at the Kemen Power Plant is presented in Figure 14. As shown in the figure, after the thermal discharge from the power plant into the sea, the surface water with temperature rise basically spreads along the upstream and downstream of the power plant in a direction parallel to the shoreline. The maximum temperature rise envelope exceeding 1 °C extends northeast toward the berth front area of the Kemen Operation Zone and southwest toward the west of the intake of the Kemen Power Plant. The temperature rise envelope exceeding 4 °C is concentrated in the localized waters on the northeastern side near the outfall. On the basis of the observation results, the maximum surface water temperature rise is approximately 0.5 °C at the outermost part of the surveyed area.

4. Discussion

4.1. Diffusion Direction of the Water Temperature

The drainage outfall of the Ningde Nuclear Power Plant faces the open sea to the east. After the thermal discharge into the sea, it spreads primarily eastward to the sea. Due to the rotational current motion near the sea area of the power plant during the tidal cycle, the thermal water, in addition to spreading along the coast upstream and downstream of the outfall during flood and ebb tides, is also continuously carried toward the outer open sea by the changing tidal currents. As shown in Figure 13, within the survey area, the scale of temperature rise diffusion exceeding 2 °C is comparable both alongshore and offshore, and the diffusion exceeding 1 °C extends offshore to the eastern boundary of the survey area. This finding indicates that rotational tidal currents facilitate the spread of thermal discharge in various directions and that thermal energy diffuses alongshore due to obstruction by land on one side of the shoreline, whereas in the offshore direction, thermal energy spreads toward the open sea.
For the Keman Power Plant, the coastal waters of the power plant are characterized mainly by reciprocating tidal currents along the shoreline, and the thermal discharge from the power plant spreads predominantly along the shoreline in the northeast-southwest (NE-SW) direction after it enters the sea. The area with the maximum temperature rise is located in the nearby region of the drainage outfall. As the distance from the drainage outfall increases, the temperature rise isolines become more parallel to the shoreline. Away from the outfall region, the temperature rise decreases both alongshore and offshore, with a faster decrease in the offshore direction. As shown in Figure 14, the longitudinal coastal diffusion distance of thermal discharge is significantly greater than the transverse offshore diffusion distance because the thermal discharge is transported and moved by reciprocating tidal currents in the NE-SW direction. Under the influence of reciprocating currents, the water temperature diffuses faster along the coast, in line with the direction of tidal movement, and slower in the offshore direction. The direction of tidal movement is strongly influenced by the coastal topography in the NE-SW direction.
Therefore, the diffusion of thermal discharge is closely related to the tidal characteristics and coastal topography of the sea area where the power plant is located. In well-sheltered bays, the water temperature generally diffuses along coastlines with tidal currents, whereas the water temperature tends to diffuse outward with tidal currents in the open sea.

4.2. Influence Range of the Temperature Rise

By measuring the areas corresponding to various temperature rise ranges in the temperature rise envelope diagram, the envelope areas for different temperature rise can be obtained.
On the basis of the measured water temperature data at the Ningde Nuclear Power Plant, the maximum temperature rise envelope area for temperatures exceeding 0.5 °C is 21.80 km2, that for temperatures exceeding 1 °C is 17.50 km2, that for temperatures exceeding 2 °C is 5.50 km2, and that for temperatures exceeding 3 °C is 1.30 km2. No temperature rise exceeding 4 °C was observed, and the maximum temperature rise recorded was 3.9 °C, which occurred during the ebb slack time. Table 1 lists the envelope areas corresponding to various temperature rises.
On the basis of the water temperature data collected at various characteristic tidal times at the Kemen Power Plant, during the ebb strength, ebb slack, and flood strength periods, the maximum temperature rise envelope areas for temperatures exceeding 1 °C are 1.52 km2, 1.42 km2, and 1.47 km2; those for temperatures exceeding 2 °C are 0.78 km2, 0.83 km2, and 0.93 km2; those for temperatures exceeding 3 °C are 0.34 km2, 0.49 km2, and 0.49 km2; and those for temperatures exceeding 4 °C are 0.25 km2, 0.29 km2, and 0.20 km2, respectively. It can be noticed that the maximum temperature rise areas enclosed by various temperature rise values differ somewhat at different characteristic tidal times, but the overall differences are not significant. According to the observations of the maximum temperature rise throughout the tidal cycle, the maximum temperature rise envelope area for temperatures exceeding 1 °C is 2.99 km2, that for temperatures exceeding 2 °C is 2.16 km2, that for temperatures exceeding 3 °C is 1.32 km2, and that for temperatures exceeding 4 °C is 0.65 km2. Table 2 lists the envelope areas corresponding to various temperature rises.
On the basis of the analysis results of the water temperature rise near the outfalls of the two power plants, the thermal discharge from the coastal power plant spreads outward from the outfall, with the temperature rise decreasing as the distance from the outfall increases. Mei et al. [26] pointed out that after the thermal discharge enters the sea area, a temperature rise zone forms near the outfall, with the scope of nearshore sea water temperature rise exceeding 3 °C primarily confined within a 300–500 m radius from the outfall, and the temperature rise diminishes as the distance from the outfall increases. Jia et al. [29] also mentioned that the thermal discharge from coastal power plants basically spreads towards the open sea from the discharge center, and the temperature rise becomes smaller as the distance from the outfall increases. Therefore, the result of this study is consistent with their findings on this point.

4.3. Range of High-Temperature Rise Envelopes

The maximum temperature rise observed in the waters near the outfall of the Ningde Nuclear Power Plant did not exceed 4 °C, with the envelope area of the high temperature rise exceeding 3 °C being 1.30 km2. For the Kemen power plant, the envelope area where the high-temperature rise exceeds 3 °C is 1.32 km2, containing a 0.65 km2 region where the temperature rise is above 4 °C. Therefore, the extent of the high-temperature rise area exceeding 3 °C near the outfalls of both power plants is comparable, but the Kemen power plant experiences a greater average temperature rise in its high-temperature rise area than does the Ningde nuclear power plant. This indicates that the diffusion capacity of the water temperature in a well-sheltered bay is weaker than that in the open sea, which is attributed to their hydrodynamic differences. Within the bay, the hydrodynamic forces are relatively weak, resulting in poor heat exchange between the thermal discharge water and the surrounding water bodies. Consequently, thermal water accumulates within the bay, leading to a greater temperature rise in the vicinity of the outfall.
As shown in Figure 13, the high-temperature rise during the entire tidal cycle at the Ningde Nuclear Power Plant are mainly located in the partial area north of the outfall, corresponding to the flood tide direction, whereas those at the Kemen Power Plant are mostly situated in the partial area northeast of the outfall, corresponding to the ebb tide direction (Figure 14), which may be associated with the dominant currents within the tidal cycle. On the basis of the calculated results of the tide current field in Luoyuan Bay during spring tide, the average current velocities during flood and ebb tides in the sea area in front of the Kemen Power Plant are approximately 0.1–0.3 m/s, with the average ebb tide velocity slightly greater than the average flood tide velocity, resulting in the general distribution of high-temperature rise areas being located on the ebb tide side. On the basis of the calculated results of the tide current field in the waters of the Ningde Nuclear Power Plant, the current velocity near the outfall is approximately 0.2 m/s, with the average flood tide velocity being slightly greater than the average ebb tide velocity, resulting in the general distribution of high-temperature rise areas being located on the flood tide side. From this perspective, the dominant tidal currents within the tidal cycle in power plant waters may influence the distribution of high-temperature rise zones near the outfall.
Based on the discussions and analyses presented in Section 4.1, Section 4.2 and Section 4.3, the results of the thermal discharge diffusion characteristics for the two power plants are summarized in Table 3.

5. Conclusions

The study demonstrated that coastal power plants located in different geographic locations exhibit significant differences in the characteristics of thermal discharge diffusion. In the well-sheltered bay, the rectilinear tidal currents cause the thermal discharge to diffuse predominantly along the coastline, whereas in the open sea, the rotating tidal currents scatter the thermal discharge in various directions, tending to expand the temperature rise impact toward the outer sea areas. Consequently, the diffusion of thermal discharge is closely related to the tidal characteristics and shoreline topography of the sea area where the power plants are located.
The thermal discharge from coastal power plants generally spreads outward from the outfall, with the temperature rise decreasing as the distance from the outfall increases. Under the influence of rectilinear tidal currents within the bay, the water temperature diffuses faster along the coast, in line with the direction of tidal movement, and slower in the offshore direction, resulting in a significantly greater longitudinal diffusion distance of thermal discharge along the shore than the transverse diffusion distance offshore. For power plants with outfalls facing the open sea, the diffusion distance scales of thermal discharge in both alongshore and offshore directions are comparable.
Dominant tidal currents within the tidal cycle in the sea area where power plants are located can influence the distribution of localized high-temperature rise zones near outfalls. The distribution of high-temperature rise zones predominantly occurs on the side with the higher average tidal velocity, either the ebb tide side if its velocity is greater than that of the flood tide or the flood tide side otherwise.
The construction or capacity expansion of coastal power plants within well-sheltered bays requires careful consideration. Owing to the relatively weak hydrodynamic conditions within the bay, which result in poor heat exchange capabilities, high temperatures tend to concentrate locally. Coupled with the limited capacity to accommodate temperature rise in bays, multiple thermal discharge sources within the bay can readily lead to excessively high water temperatures, thus triggering ecological and environmental issues.
Based on the different characteristics of thermal discharge diffusion from power plants, in terms of environmental impact, consideration should be given to the potential effects of the direction and range of thermal discharge diffusion, which should be taken into account when determining the capacity of power plants and the setup of outfalls, on temperature-sensitive biological communities. In terms of engineering economy, power plants located in open seas must also consider the impact of waves and storm surges on safety, leading to higher construction costs compared to those situated in bays. However, on the other hand, their environmental impact is more favorable than that of bay-based power plants. Therefore, a balance between these two aspects needs to be considered.

Author Contributions

Conceptualization, Z.C.; methodology, Z.C.; validation, Z.C. and Z.W.; investigation, Z.C. and Z.Z.; writing—original draft preparation, Z.C.; writing—review and editing, Z.W. and Z.Z.; software, J.T.; supervision, Z.Z.; project administration, Z.Z. All authors have read and agreed to the published version of the manuscript.

Funding

This research is supported by the Youth Science and Technology Innovation Program of Xiamen Ocean and Fisheries Development Special Funds (grant number 23ZHZBQCB40).

Institutional Review Board Statement

Not applicable.

Informed Consent Statement

Not applicable.

Data Availability Statement

Data are contained within the article.

Acknowledgments

The authors gratefully acknowledge the editors and anonymous reviewers for their valuable comments and suggestions to improve the presentation of this paper.

Conflicts of Interest

The authors declare no conflicts of interest.

References

  1. Verones, F.; Hanafiah, M.; Pfister, S.; Huijbregts, M.; Pelletier, G.; Koehler, A. Characterization factors for thermal pollution in freshwater aquatic environments. J. Environ. Sci. Technol. 2010, 44, 9364–9369. [Google Scholar] [CrossRef] [PubMed]
  2. Liu, Y.; Chen, L.; Qiao, Y.; Yang, Y.; Cao, L. The maximum temperature limit of thermal discharge from typical northern coastal npp. J. Mar. Environ. Sci. 2016, 35, 827–830. [Google Scholar] [CrossRef]
  3. Dai, Y.; Qiu, J.; Pan, L.; Peng, X.; Lin, B.; Huang, Y.; Chen, X. Effect of temperature rise and free residual chlorine on growth of subcordiform flat algae in simulated power plant. J. Mar. Sci. 2018, 42, 134–140. [Google Scholar] [CrossRef]
  4. Widya, R.; Cahyaningsih, S.; Wulan, D.R.; Sembiring, T. Water quality assessment around a coal-fired power plant in southern coast of Java, Indonesia. Reg. Stud. Mar. Sci. 2019, 25, 100463. [Google Scholar] [CrossRef]
  5. Lin, Z.; Zhan, H. Effects of thermal effluent on fish eggs and larvae in waters near Daya Bay nuclear plant. J. Trop. Oceanogr. 2000, 19, 44–51. [Google Scholar] [CrossRef]
  6. Zhang, H.; Zhao, Y.; Yang, H.; Chen, B.; Ding, J.; Dai, G.; Du, P. Study on the temperature rise characteristics and influence effects of thermal discharge from coastal power plant in Xiangshan Bay. J. Shanghai Ocean Univ. 2013, 22, 274–281. [Google Scholar]
  7. Fu, Q.; Zhu, L.; Shen, A.; Li, D. Survey and comparison of seasonal influences of thermal discharge from coastal power plant on zooplankton community. J. Ocean Univ. China 2015, 45, 25–33. [Google Scholar] [CrossRef]
  8. Li, X.; Li, B.; Sun, X. Effects of a coastal power plant thermal discharge on phytoplankton community structure in Zhanjiang Bay, China. Mar. Pollut. Bull. 2014, 1, 210–217. [Google Scholar] [CrossRef]
  9. Dong, Y.; Zuo, L.; Ma, W.; Chen, Z.; Cui, L.; Lu, S. Phytoplankton community organization and succession by sea warming: A case study in thermal discharge area of the northern coastal seawater of China. Mar. Pollut. Bull. 2021, 169, 112538. [Google Scholar] [CrossRef]
  10. Zhang, J.; Wang, Y.; Ottmann, D.; Cao, P.; Yang, J.; Yu, J.; Lv, Z. Seasonal variability of phytoplankton community response to thermal discharge from nuclear power plant in temperate coastal area. Environ. Pollut. 2023, 318, 120898. [Google Scholar] [CrossRef] [PubMed]
  11. Zhang, J.; Jia, H.; Feng, W. Analysis of characteristics of thermal discharge of the Chaozhou Power Plant. Trans. Oceanol. Limnol. 2013, 2, 37–43. [Google Scholar]
  12. Jia, H.; Xie, J.; Zhang, J. Distribution of warm discharge water and cooling effect of drainage engineering at the Zhuhai Power Station. Coast. Eng. 2014, 3, 1–9. [Google Scholar] [CrossRef]
  13. Zhu, Z.; Hu, Z.; Zhang, Y.; Chi, W.; Liu, J.; Bian, S.; Xiong, C. Numerical simulation and observations of vertical non-uniform of water temperature in the Meizhou Bay influenced by warm water discharge. Adv. Mar. Sci. 2014, 2, 230–238. [Google Scholar] [CrossRef]
  14. Wang, L. Three-dimensional numerical simulation for thermal discharge of offshore power plant. Guangdong Water Resour. Hydropower 2016, 6, 1–5. [Google Scholar]
  15. Zeng, Z.; Luo, Y.; Chen, Z.; Tang, J.; Wang, Y.; Chen, C. Impact assessment of thermal discharge from the Kemen Power Plant based on field observation and numerical simulation. J. Coast. Res. Spec. Issue 2020, 104, 351–361. [Google Scholar] [CrossRef]
  16. Gaeta, M.G.; Samaras, A.G.; Archetti, R. Numerical investigation of thermal discharge to coastal areas: A case study in South Italy. Environ. Modell. Softw. 2019, 124, 104596. [Google Scholar] [CrossRef]
  17. Chen, Z.; Zeng, Z.; Chen, C.; Tang, J. Study on the planar distribution and vertical variation of temperature rise by the influence of thermal discharge in coastal power plant-a case on Luoyuan Bay Kemen Power Plant. Mar. Environ. Sci. 2023, 42, 111–121. [Google Scholar] [CrossRef]
  18. Zhang, X.; Shi, H.; Zhan, C.; Zhu, J.; Wang, Q.; Li, G. Numerical simulation calculation of thermal discharge water diffusion in coastal nuclear power plants. Atmosphere 2023, 14, 1371. [Google Scholar] [CrossRef]
  19. Huang, X.; Chen, X.; Peng, X.; Zhang, R.; Qian, X.; Tang, J. The research progress of the impact of thermal discharge from coastal power plants on marine environment. Mar. Environ. Sci. 2014, 33, 972–976. [Google Scholar] [CrossRef]
  20. He, Q.; Ren, M.; Cai, Y.; Ye, H.; Huang, X. Research progress on the impact of thermal discharge from coastal power plants on the ecological environment. Ocean Dev. Manag. 2012, 29, 84–88. [Google Scholar]
  21. Lin, j.; Yan, Q.; Chen, B.; Du, P. Ecological impact of thermal discharge from coastal power plants on plankton biomass in Xiangshan Bay. J. Shanghai Ocean Univ. 2015, 24, 894–905. [Google Scholar]
  22. Zheng, L.; Zhang, A.; Qu, L.; Yuan, Y. Evaluation of the environmental effect of the thermal discharged water from Qingdao coastal power plant in Jiaozhou Bay. Trans. Oceanol. Limnol. 2012, 2, 137–141. [Google Scholar] [CrossRef]
  23. Li, B.; Zhang, C.; Sun, S. The effects of thermal discharge from Zhanjiang power plant on marine ecologic environment. Environ. Sci. Technol. 2012, 35, 78–84. [Google Scholar]
  24. Cheng, Y.; Hao, Q. Effects of topography on diffusion of thermal discharge in power plant. Procedia Environ. Sci. 2011, 11, 618–623. [Google Scholar] [CrossRef]
  25. Lin, J.; Zou, X.; Huang, F.; Yao, Y. Quantitative estimation of sea surface temperature increases resulting from the thermal discharge of coastal power plants in China. Mar. Pollut. Bull. 2021, 164, 112020. [Google Scholar] [CrossRef] [PubMed]
  26. Mei, L.; Cai, X.; Lai, M.; Zhou, X.; Zhuang, Y. Retrospective evaluation research on marine ecological effects of warm water drainage from Mawan Power Plant in Shenzhen. Environ. Eng. 2012, S2, 349–351. [Google Scholar]
  27. Huang, G.; Huang, B.; Qiu, J. A study of the affection of different drainage velocity on water temperature field. Jilin Water Resour. 2014, 8, 12–16. [Google Scholar] [CrossRef]
  28. Tu, X.; Gao, S.; Chen, R.; Wu, T. Research on movement and diffusion regularities of cooling water from power plant at estuary area under control of tide. Chin. J. Hydrodyn. 2014, 29, 157–165. [Google Scholar]
  29. Jia, H.; Zheng, S.; Xie, J.; Ying, X.; Zhang, C. Influence of geographic setting on thermal discharge from coastal power plants. Mar. Pollut. Bull. 2016, 111, 106–114. [Google Scholar] [CrossRef] [PubMed]
  30. Casulli, V.; Cattani, E. Stability, accuracy and efficiency of a semi-implicit method for three-dimensional shallow water flow. Comput. Math. Appl. 1994, 27, 99–112. [Google Scholar] [CrossRef]
  31. Casulli, V.; Zanolli, P. A three-dimensional semi-implicit algorithm for environmental flows on unstructured grids. In Proceedings of Numerical Methods for Fluid Dynamics VI, Arcachon, France, 6–10 July 1998; ICFD: Oxford, UK, 1998. [Google Scholar]
  32. Casulli, V.; Cheng, R.T. Semi-implicit finite difference methods for three-dimensional shallow water flow. Int. J. Numer. Methods Fluids 2010, 15, 629–648. [Google Scholar] [CrossRef]
  33. Tang, J.; Wen, S.; Chen, C. Numerical simulation of two-dimensional tidal current model for Haitan Strait. J. Appl. Oceanogr. 2006, 25, 533–540. [Google Scholar] [CrossRef]
Figure 1. Location of the study area.
Jmse 13 00383 g001
Figure 2. Water temperature observation stations during flood tide (a) and ebb tide (b) at the site of the Ningde Nuclear Power Plant.
Jmse 13 00383 g002aJmse 13 00383 g002b
Figure 3. Water temperature observation stations at the site of the Kemen Power Plant. (a) The large-area sea surface layer; (b) the local vertical layers.
Jmse 13 00383 g003
Figure 4. Tidal level and tidal current verification stations in Luoyuan Bay.
Jmse 13 00383 g004
Figure 5. Comparison of measured and calculated tidal levels at the T1 station.
Jmse 13 00383 g005
Figure 6. Comparison of measured and calculated current velocity and direction at stations 1#–5#.
Jmse 13 00383 g006
Figure 7. Flood tide (a) and ebb tide (b) near the sea area of the Ningde Nuclear Power Plant.
Jmse 13 00383 g007aJmse 13 00383 g007b
Figure 8. Vertically averaged flow vector of each station near the sea area of the Ningde Nuclear Power Plant in June 2016.
Jmse 13 00383 g008
Figure 9. Flood tide (a) and ebb tide (b) in Luoyuan Bay and its vicinity waters.
Jmse 13 00383 g009
Figure 10. Vertically averaged flow vector of each station near the sea area of the Kemen Power Plant in March 2012.
Jmse 13 00383 g010
Figure 11. The maximum temperature rise envelope during flood tide in June 2016.
Jmse 13 00383 g011
Figure 12. The maximum temperature rise envelope during ebb tide in June 2016.
Jmse 13 00383 g012
Figure 13. The maximum temperature rise envelope during the whole tide in June 2016.
Jmse 13 00383 g013
Figure 14. The maximum temperature rise envelope during the whole tide in March 2012.
Jmse 13 00383 g014
Table 1. The envelope areas corresponding to various temperature rises at the Ningde Nuclear Power Plant.
Temperature Rise
>0.5 °C>1 °C>2 °C>3 °C
envelope area (km2)21.8017.505.501.30
Table 2. The envelope areas corresponding to various temperature rise at the Kemen Power Plant.
Temperature Rise
Tidal Time>1 °C>2 °C>3 °C>4 °C
envelope area (km2)ebb strength1.520.780.340.25
ebb slack1.420.830.490.29
flood strength1.470.930.490.20
whole tide2.992.161.320.65
Table 3. Summary of results on thermal discharge diffusion characteristics of power plants.
Characteristic Items
Direction of Temperature DiffusionMaximum Temperature RiseVariation of Temperature Rise with DistanceAverage Value in the High Temperature Rise Area (≥3 °C)High Temperature Rise Zone
Ningde Nuclear Power Plant (open sea)Alongshore and offshore and a tendency for diffusion towards the offshore<4 °CAs the distance increases, the temperature rise decreasesSmallerThe dominant flood tidal current side
Kemen Power Plant (well-sheltered bay)Mainly alongshore>4 °CAs the distance increases, the temperature rise decreasesLargerThe dominant ebb tidal current side
Disclaimer/Publisher’s Note: The statements, opinions and data contained in all publications are solely those of the individual author(s) and contributor(s) and not of MDPI and/or the editor(s). MDPI and/or the editor(s) disclaim responsibility for any injury to people or property resulting from any ideas, methods, instructions or products referred to in the content.

