Abstract
This study uses eye-tracking technology (ETT) to investigate discrepancies between seafarers’ perceived and actual performance during simulated maritime operations. The primary objective is to explore how misperceptions regarding the use of navigational tools—such as visual observation, radar, and ECDIS—may contribute to discrepancies in situational awareness, which is critical for safe navigation. By comparing participants’ self-reported perceptions with objective data recorded by ETT, the study highlights cognitive biases that influence navigational decision-making. Data were collected from a simulation scenario involving 32 seafarers with varying levels of maritime experience. The results reveal that participants tend to overestimate their reliance on visual observation and ECDIS, while underestimating their use of radar. These discrepancies may affect decision-making processes and could contribute to an inaccurate perception of situational awareness, although further research is needed to fully establish their direct impact on actual navigational performance. Additionally, the application of ETT identifies differences in the navigational strategies between more and less experienced seafarers, offering insights that could inform the development of training programs aimed at improving situational awareness. Statistical analyses, including Analysis of Variance (ANOVA) and Kruskal–Wallis tests, were conducted to assess the influence of demographic factors on performance. These findings suggest that ETT can be a valuable tool for identifying perceptual biases, potentially improving decision-making and enhancing training for real-world navigational tasks.
1. Introduction
As stipulated in Regulation VIII/2 of the International Convention on Standards of Training, Certification and Watchkeeping for Seafarers, 1978 (STCW Convention), the officer of the watch (OOW) holds significant responsibility for ensuring the safety of the ship, crew, and cargo during watchkeeping duties [1]. The decisions made by the OOW are fundamental to ensuring maritime safety, with human error—often stemming from poor decision-making—being one of the primary causes of maritime accidents. The European Maritime Safety Agency (EMSA) reports that human factors contribute to over 80% of maritime accidents annually [2]. Extensive research has shown the substantial impact of human error on maritime safety, with several studies providing valuable insights into its role in maritime accidents. Sánchez-Beaskoetxea et al. analyzed the causes of human error and concluded that poor decision-making, miscommunication, and failure to follow procedures are primary contributors to accidents [3]. They emphasized that while crew error is often implicated, factors like fatigue and inadequate training also play significant roles. Similarly, Lu applied the Human Factors Analysis and Classification System (HFACS) to explore the role of human error in ship collisions, revealing that cognitive biases, fatigue, and ineffective communication are key contributors [4]. This aligns with the findings of Hasanspahić et al., who highlighted that human factors, particularly the crew’s failure to adequately assess situations and apply appropriate navigation tools, significantly contribute to maritime accidents [5]. Together, these studies underscore the complexity of human error and its crucial impact on maritime safety.
This study specifically addresses gaps in maritime safety research by investigating discrepancies between seafarers’ perceived and actual navigational performance, particularly focusing on the cognitive biases that influence decision-making in maritime environments.
The decision-making process of the OOW is directly linked to the safety of the vessel. OOWs often make decisions based on the available information. As highlighted in the study, the availability of information is one of the key factors influencing situational awareness (SA). Often, this awareness is obscured by assumptions or the belief that certain actions are being performed, based on theoretical knowledge, even though in practice, these actions might not occur as expected.
The decision-making capability of the OOW plays a critical role in ensuring navigational safety and is directly influenced by the OOW’s competence. The competence consists of three essential domains: cognitive (knowledge and application), psychomotor (skills and application), and affective (attitude and behavior), all of which contribute to effective SA and safe operational decisions [6]. Among these, the affective domain has gained increasing attention, particularly regarding the role of the seafarer’s attitude towards decision-making. The Behavior Competence Assessment and Verification (BCAV) model proposed by the Oil Companies International Marine Forum (OCIMF) outlines six behavioral competencies—teamwork, communication, situational awareness, decision-making, result focus, and leadership—highlighting situational awareness as a central component of effective decision-making [7].
SA, defined as the ability to perceive, understand, and predict events in the environment, is crucial for safe navigation and informed decision-making [8,9]. SA is not just about gathering data, but also about integrating and interpreting it to make timely, accurate decisions. Several studies have highlighted the importance of SA in maritime safety, with different aspects contributing to its development. For instance, Maljković et al. emphasized that experience, training, simulators, and modern technology are critical in enhancing SA, particularly among seafarers [10]. Meanwhile, Jaram et al. and Melnyk et al. have shown that experienced officers are better at maintaining SA by integrating all navigational tools at their disposal, leading to more informed decisions, even under pressure [11,12]. They note that a lack of SA, particularly from over-reliance on limited instruments such as radar or visual observation, can cause critical errors. In addition, Gommosani et al. found that many OOWs fail to achieve the highest level of SA because they rely on one or two navigational tools, which compromises their decision-making process and safety [13]. Bayesian network models developed by Vojković et al. support this, showing that the lack or loss of SA is a critical factor in maritime accidents, with failures in SA often leading to navigational errors and loss of control [14]. Kaptan et al. also emphasized the impact of improper use of the Electronic Chart Display and Information System (ECDIS) and other navigational aids, underscoring the need for balanced tool integration to avoid accidents [15]. In this study, the authors expand these findings by specifically focusing on how seafarers’ perceived awareness of their navigational behavior often differs from their actual attention allocation to navigational tools, such as visual observation, radar, and ECDIS. SA in this context is operationally defined as the ability of the OOW to perceive and understand relevant navigational data in real time, as well as to predict potential future events based on that data. This involves integrating and interpreting multiple sources of information—such as visual cues, radar, and ECDIS data—into a unified mental representation of the environment.
The application of ETT in maritime contexts has gained momentum, offering detailed insights into how individuals allocate their attention during critical tasks. Initially used in aviation, ETT has been used in research conducted by Skvarekova and Skultetya to track how pilots distribute their gaze between various cockpit instruments during critical flight phases, such as landing [16]. Their study highlighted that experienced pilots exhibit more efficient gaze patterns, quickly shifting focus between instruments to maintain SA. Conversely, less experienced pilots tend to fixate on fewer instruments, which can reduce their overall SA and decision-making efficiency. This study provided valuable insights into how cognitive processes such as attention allocation can influence pilot performance and safety. This methodology has been successfully adapted to maritime research, allowing for the assessment of how seafarers divide their attention during navigational tasks. Martinez-Marquez et al., in their systematic review, discuss the growing application of ETT across various sectors, including aviation, maritime, and construction, confirming its versatility in analyzing human attention and behavior [17]. Their work highlights how ETT provides valuable insights into cognitive processes, offering potential for enhancing training and human–machine interaction in maritime contexts.
In the maritime domain, studies utilizing ETT have focused on assessing the effectiveness of navigational equipment layouts on high-speed vessels, which require specialized navigation methods due to their reliance on advanced aids. Research by Hareide and Ostnes explored how the layout and placement of navigational equipment on high-speed vessels influence seafarers’ ability to perform tasks safely and efficiently [18,19,20]. Specifically, their studies highlight the role of eye tracking in understanding how navigators interact with the various displays and instruments on the bridge, such as ECDIS, radar, and conning displays. Their findings show that the navigational equipment layout significantly affects SA and overall performance, suggesting that optimal placement of instruments enhances the navigator’s ability to make accurate decisions under pressure. These studies also propose the integration of ETT to monitor and improve visual attention management, which is crucial for maintaining high levels of SA, especially when operating in challenging environments with high-speed vessels.
Uflaz et al. also conducted a pilot study examining the potential of ETT in shipboard operations, highlighting its capacity to enhance OOWs’ ability to perform critical tasks and improve overall maritime safety [21]. Their conclusions emphasized the promise of ETT in optimizing watchkeeping operations, suggesting that such technologies could substantially enhance performance by improving OOWs’ attention management.
Arslan et al. also employed ETT to examine OOW competencies in relation to radar and ECDIS systems. They developed a framework to assess how experienced and novice seafarers interact with these systems, aiming to optimize the design of electronic charts and minimize navigational errors [22]. Their study utilized eye-tracking technology to observe the attention and cognitive load of officers during simulated navigation tasks. By comparing novice and experienced officers, the study revealed that novice users often struggled to efficiently utilize all available systems, leading to an incomplete mental model of the navigational environment. Experienced officers, on the other hand, demonstrated more balanced attention distribution across multiple systems, which helped them maintain a better SA. The results underscored the need to improve training programs to help novice users make full use of all navigational tools. In their subsequent studies, Arslan et al. identified significant design flaws in existing ECDIS systems, particularly in how key navigational data were presented [23]. The study proposed enhancements to the interface, suggesting that modifications would allow novice users to more easily focus on the most critical information, thereby improving their decision-making efficiency and reducing navigational errors. The research showed that optimizing the ECDIS interface design could substantially enhance user experience and safety on board.
While previous studies, such as those by Hareide, Uflaz, Atik, and Arslan, have explored the use of eye-tracking technology (ETT) in maritime settings, this study distinguishes itself by focusing on the gap between seafarers’ beliefs and their real-time interaction with navigational tools during watchkeeping duties. It specifically addresses the cognitive biases that affect situational awareness and decision-making, a dimension not extensively examined in prior research. By analyzing the discrepancy between how OOWs perceive their reliance on various navigational tools versus their actual performance, this study aims to improve situational awareness, reduce errors, and enhance navigational safety, ultimately contributing to the development of more effective training programs.
The key research question of this study is, how do seafarers’ perceptions of their navigational behavior compare to their actual attention allocation during watchkeeping duties?
Additionally, the study explores the following secondary questions:
- Which cognitive biases (e.g., overconfidence, selective attention) influence seafarers’ situational awareness and decision-making?
- How do these biases affect the allocation of attention to different navigational tools, such as visual observation, radar, and ECDIS?
- What impact do these biases have on navigational safety and the decision-making process?
The structure of the paper is as follows. Section 2 outlines the methodology used in this study, detailing the experimental design and data collection methods. The results of the study are presented in Section 3, followed by a discussion of the findings and conclusion, with recommendations for improving situational awareness and navigational safety in maritime operations, presented in Section 4.
2. Materials and Methods
This study utilizes a combination of methods to assess the disparity between seafarers’ perceived and actual navigational performance, focusing primarily on ETT to capture real-time data during maritime simulation exercises. The key methods employed are as follows:
- Structured interview (questionnaire);
- Simulations and scenario design;
- Preparation and execution of the simulation;
- Data analysis;
- Statistical analysis.
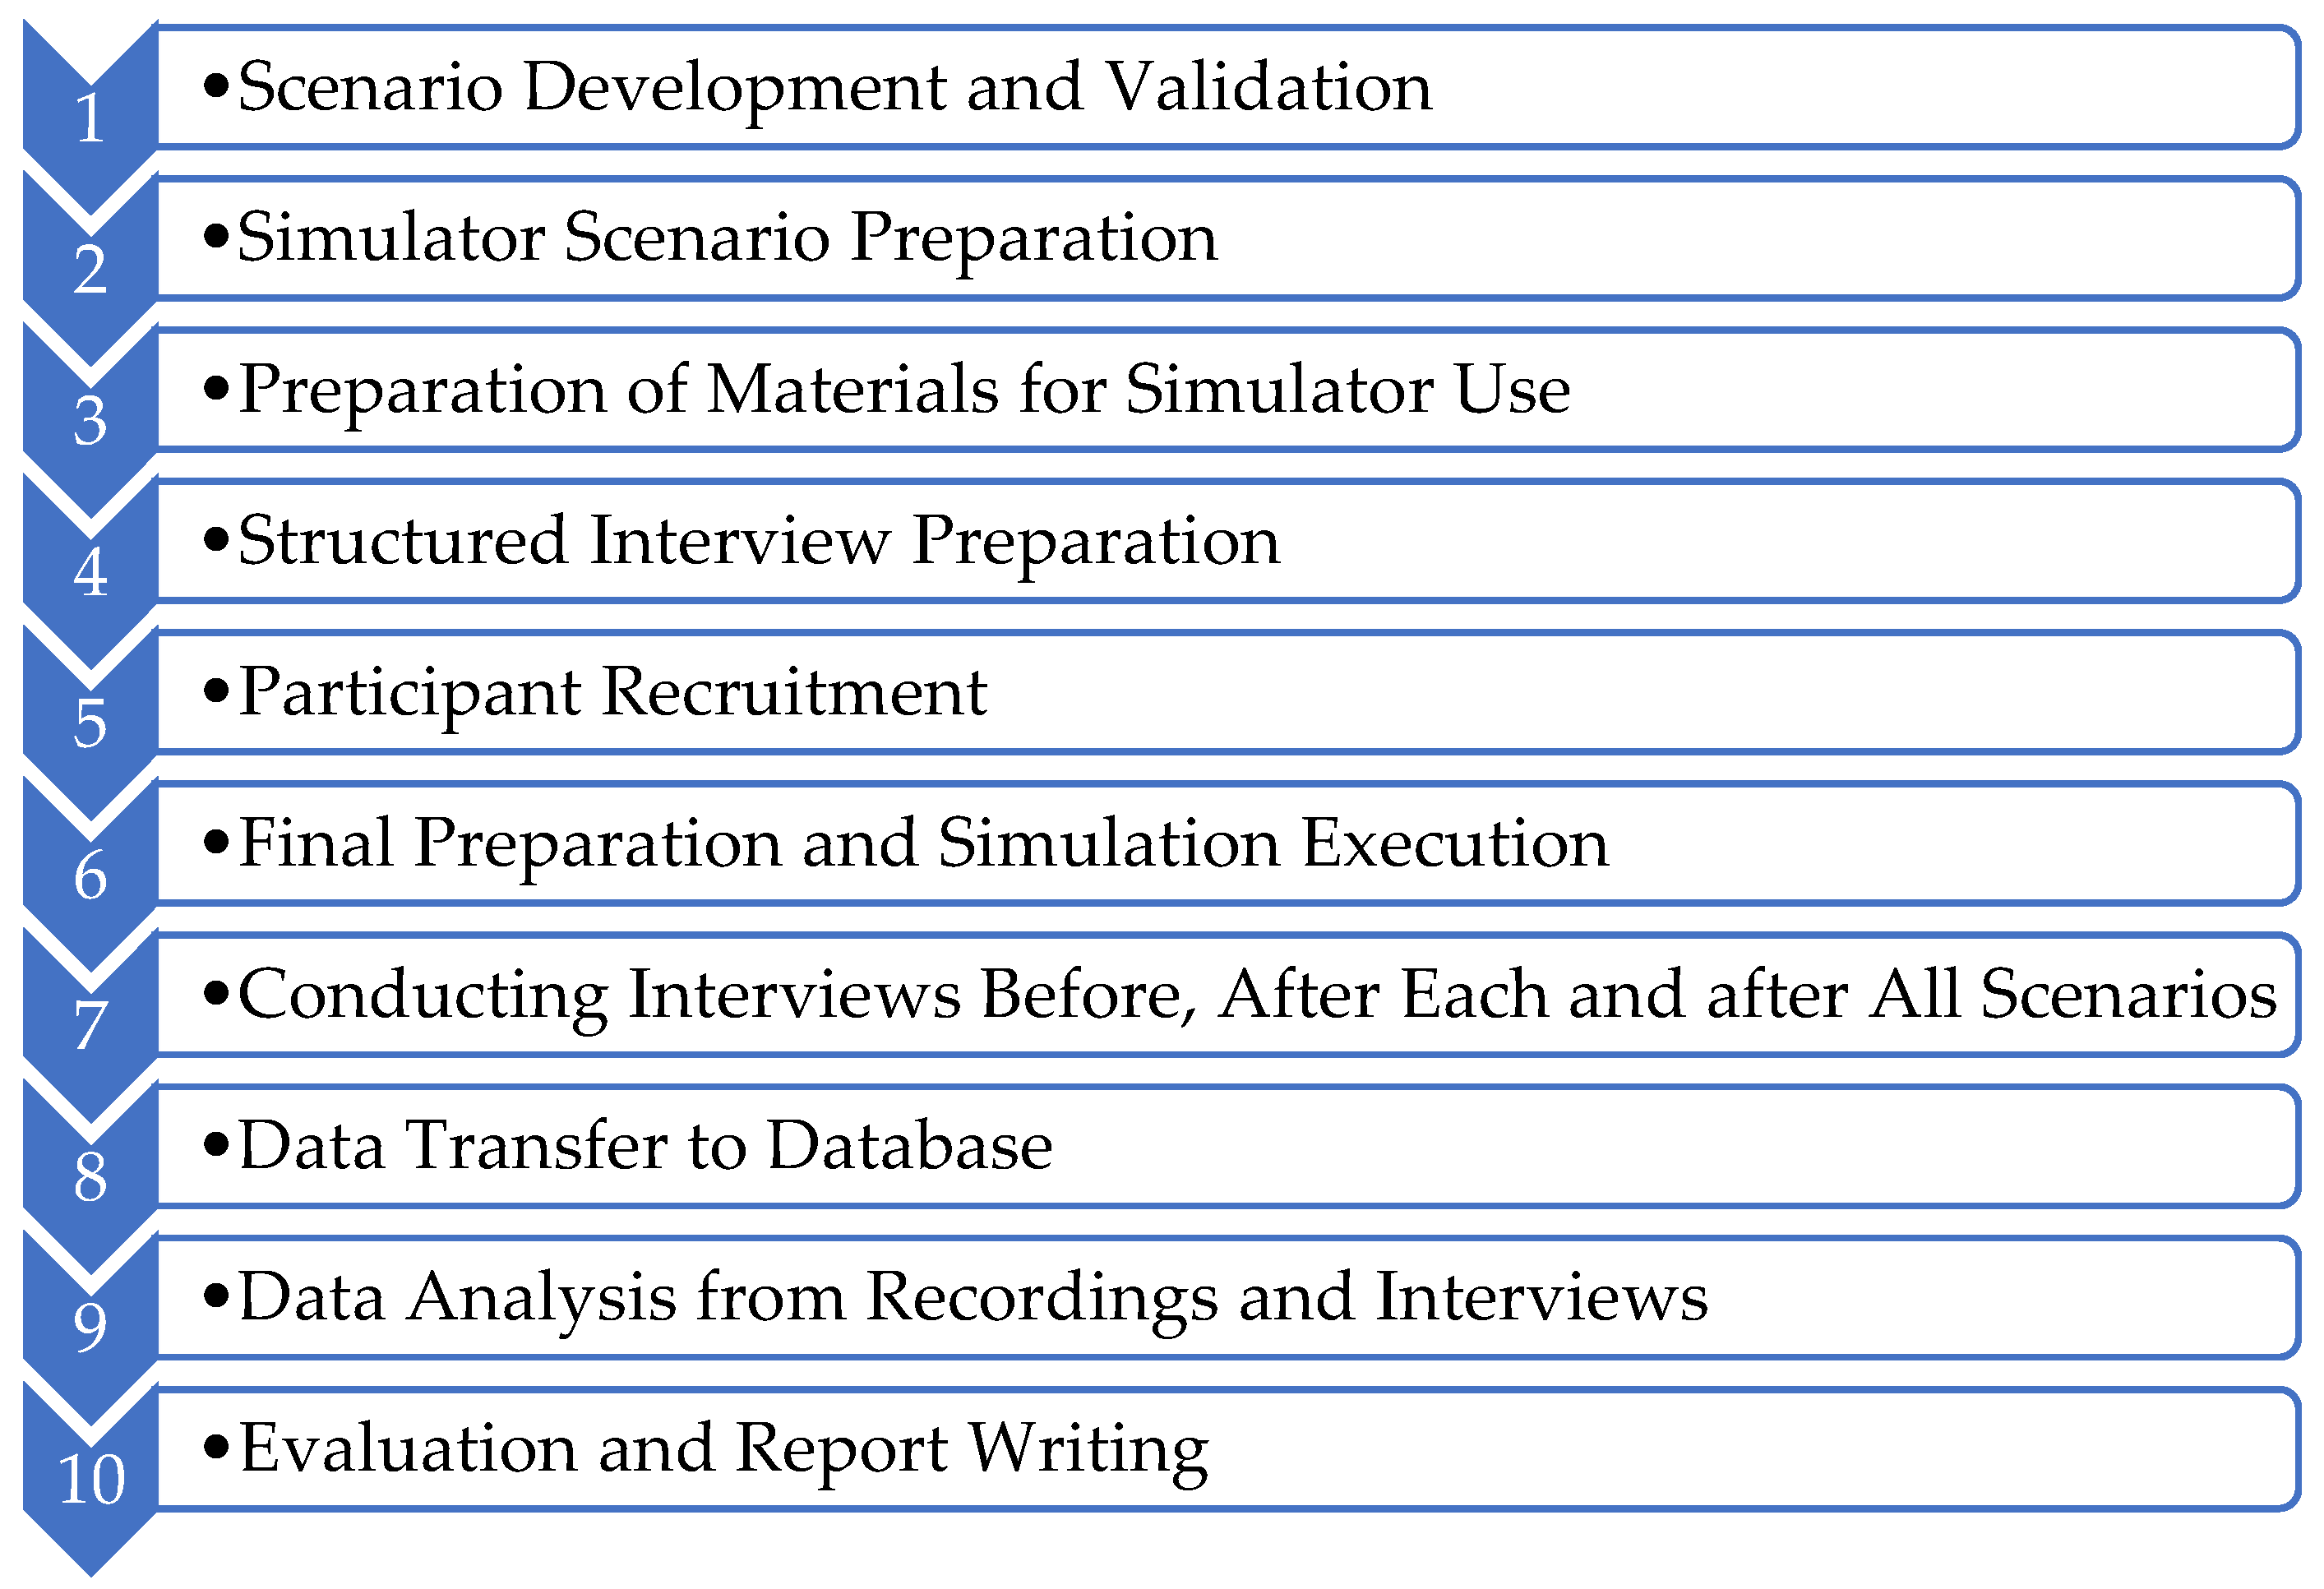
Figure 1 presents a flowchart illustrating the experimental design of this study, outlining the key stages involved in preparing and executing the maritime simulation exercises, from scenario development to data analysis and evaluation.
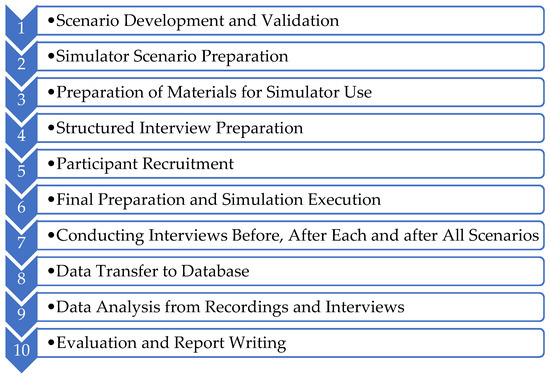
Figure 1.
Flowchart of the experimental design process.
2.1. Structured Interview (Questionnaire)
A structured interview was conducted to measure perceived values, specifically focusing on the three primary navigational tools—visual observation, radar, and ECDIS—commonly employed by seafarers for traffic surveillance and collision avoidance. These tools were selected because they are the primary methods used on the bridge for such tasks, as confirmed in prior professional practice and regulatory guidelines, such as those outlined in the STCW Convention [1]. The interview was conducted prior to the simulation, ensuring that participants’ perceived reliance on navigational tools was documented before the actual simulation began.
2.2. Simulations and Scenario Design
Four navigational scenarios were designed as part of a broader doctoral thesis research. These included crossing vessel from the starboard side, crossing trawler from the port side, crossing power-driven vessel from the port side with no avoiding action, and a scenario involving three small ships in the vicinity of the ship while the OOW performed non-routine tasks during the watch. For the purposes of this study, Scenario 1 is analyzed in detail. All scenarios were specifically crafted to simulate realistic maritime navigation tasks. The initial idea for the scenarios was based on the author’s own professional experience as a captain and instructor, as well as on consultations with experienced maritime instructors. The development of the scenarios was further informed by the input of several experts with extensive maritime and teaching experience. These experts held various positions, including master and OOW, with years of experience both at sea and as instructors in navigational subjects. Table 1 summarizes the professional background of the authors and experts involved in the creation of the scenarios.

Table 1.
Professional experience of authors and experts involved in scenario creation.
Additionally, the author conducted research through several case studies where participants demonstrated shortcomings in collision avoidance actions in similar scenarios [24].
Other studies have employed similar simulation-based scenarios. For example, Kemp investigated seafarers’ behavior in crossing situations using scenarios involving vessels crossing from the port and starboard sides [25], while Vujičić et al. proposed a decision-making model to optimize collision avoidance in such situations [26]. Similar scenarios have been used by Brčko et al., Mohović et al., Ni et al., and Wang et al. [27,28,29,30]. The fourth scenario in this study was designed to observe the performance of the OOW in lookout and traffic surveillance tasks during non-routine tasks on the bridge, inspired by findings in Maglić and Zec’s research on the impact of alerts and distractions on situational awareness [31].
Scenario 1, titled “Crossing Situation with Power-Driven Vessel Approaching from Starboard Side”, simulates a crossing situation where a power-driven vessel approaches from the starboard side with no other traffic around the ship. The conditions are set in open seas with no concern for depth or under-keel clearance (UKC), with good visibility (greater than 10 nm), a light breeze (5 knots from 180°), and a slight sea state (wave height of 0.4 m). The ship’s heading is 270° at a speed of 15.5 knots, while the observed vessel (a container ship) heads 180° at 25.8 knots. The distance between the two vessels is 17.2 nm, with a closest point of approach (CPA) of 0.4 nm. In this scenario, Automatic Identification System (AIS) is turned off to observe whether the participant notices the lack of AIS information and compensates by relying on other tools, such as radar and visual observation. ECDIS displays the route and safety parameters according to the passage plan, which participants were familiarized with before the simulation. The scenario continues until the target vessel is avoided and the participant begins to return the vessel to the planned route (i.e., starts course alteration). The average duration of the recorded Scenario 1 is presented in Table 2.
Table 2.
Duration of recorded scenario per participant.
2.3. Preparation and Execution of the Simulation
The study used ETT—specifically, Tobii Pro Glasses 3 (Version 1.11.6) [32]—alongside the Transas 4000 Full Mission Bridge Simulator, approved by the DNV Classification Society.
The Tobii Pro Glasses 3 system tracks eye movements to gather data on where a participant is looking during navigational tasks. The system utilizes a combination of infrared cameras and sensors that monitor the gaze direction and fixation points of the participant’s eyes. The system features a lightweight, wearable design that allows for hands-free operation, providing greater comfort for participants during long simulation sessions, ensuring that they remain as natural as possible during simulations. The device includes:
- Two infrared cameras that track the movement of the eyes in real time;
- A small eye tracker unit mounted on the glasses, which captures gaze data from the user’s eyes;
- Real-time data processing that allows for analysis of fixations, saccades, and other eye movement metrics.
The technical specifications of the device include:
- Gaze accuracy: ±0.5 degrees;
- Gaze sampling rate: 50 Hz or higher;
- Field of view: 60° (horizontal) × 40° (vertical).
This technology enables a detailed analysis of participants’ focus during critical tasks, helping to uncover cognitive biases, gaps in situational awareness, and areas of attention. The ETT system’s ability to capture eye movement patterns provides an objective measure of how well participants are focusing on relevant navigational tools during their tasks.
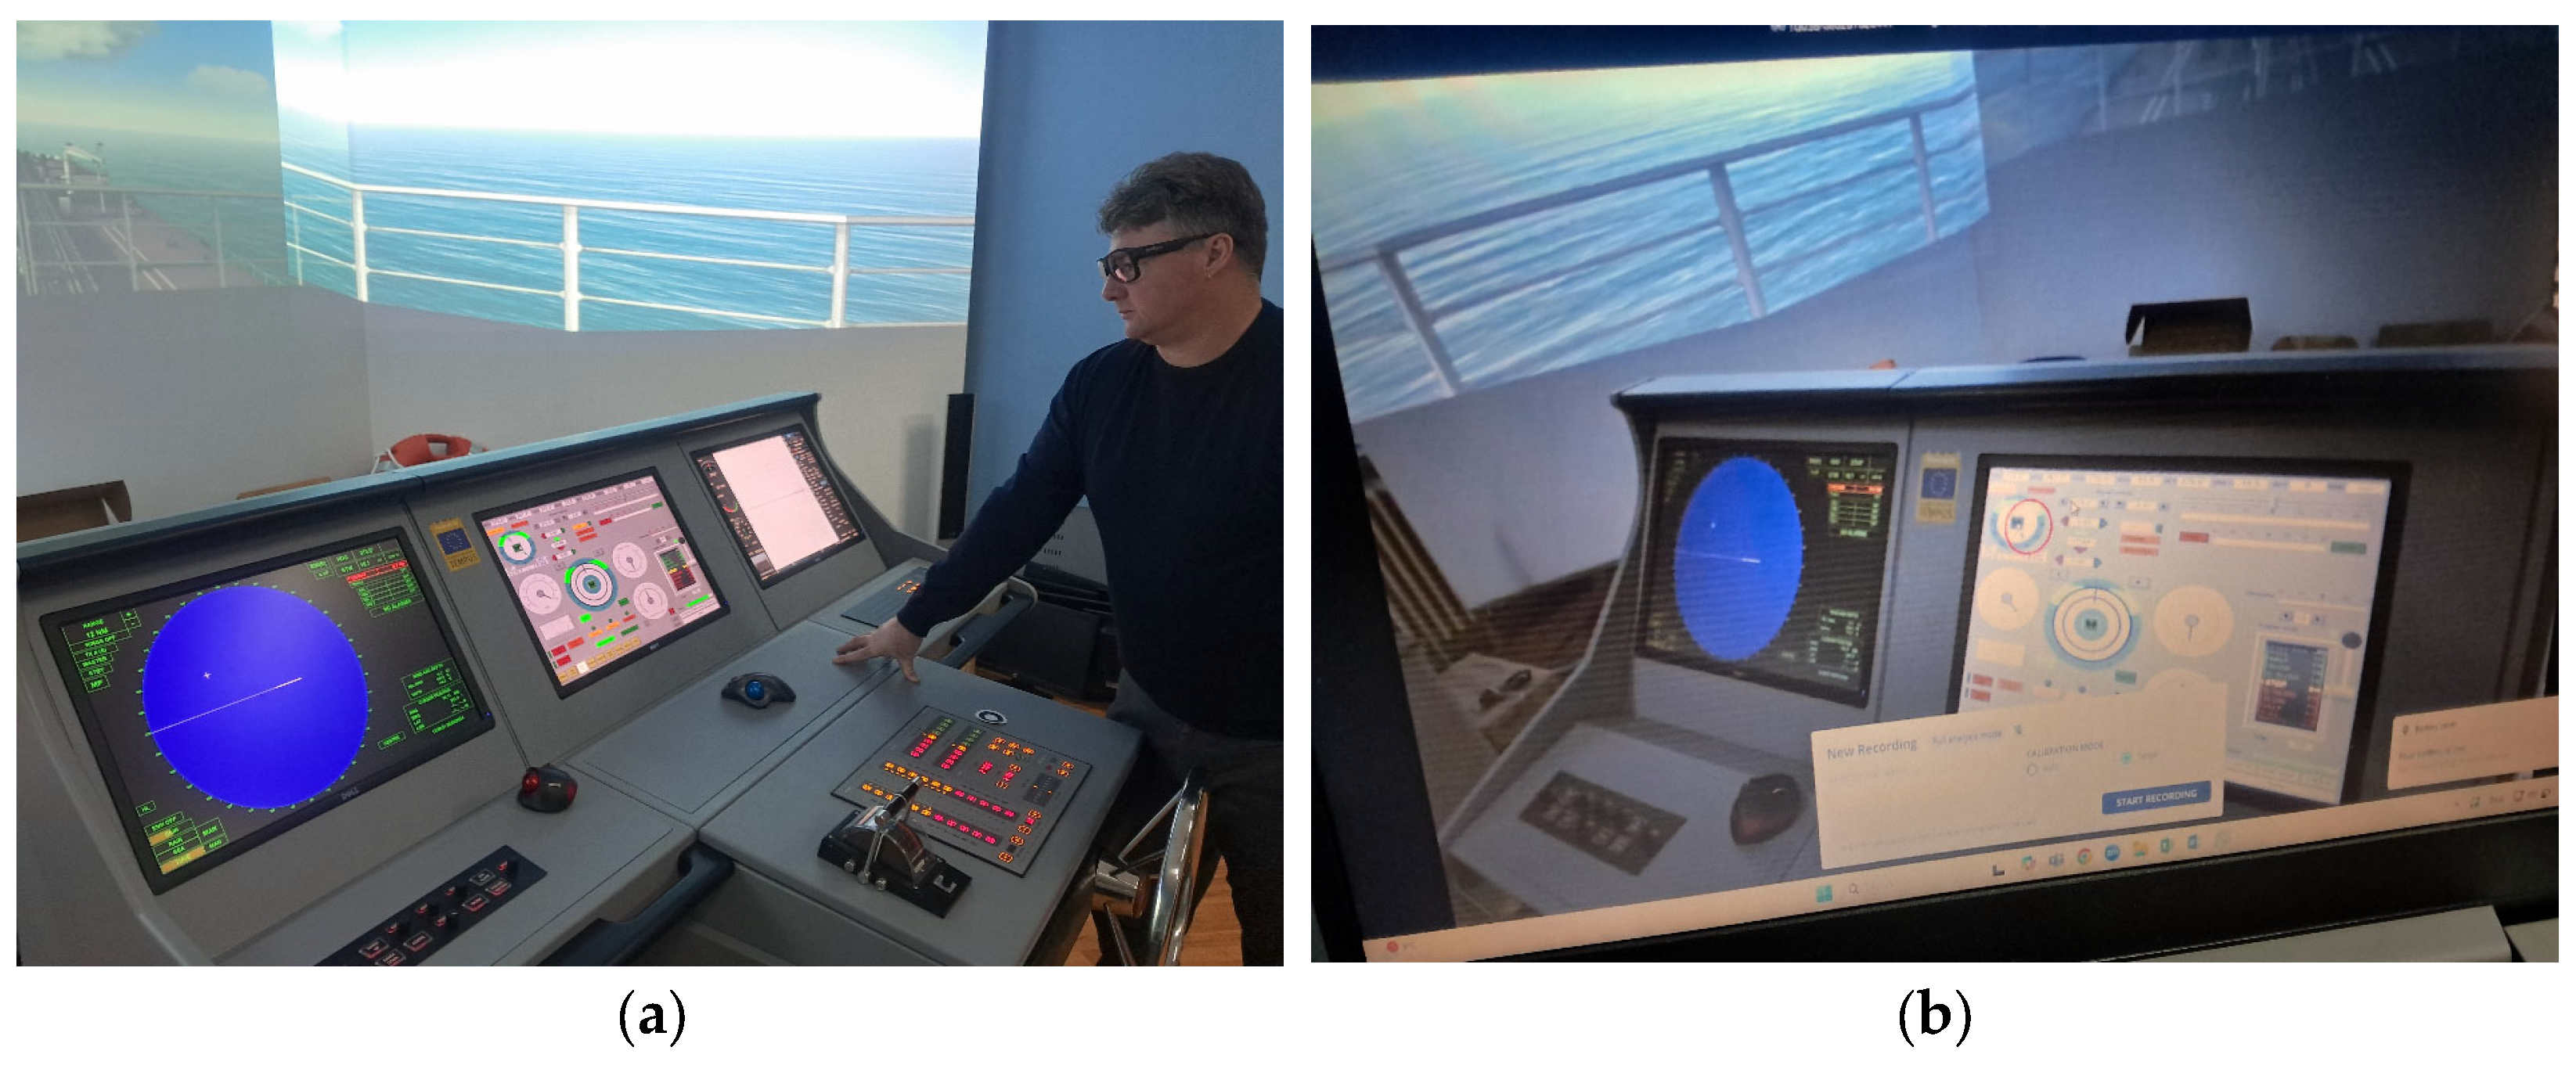
Figure 2 shows a sample of the equipment used in this study.

Figure 2.
Tobii Pro Glasses and application in use—(a) setting of the environment and (b) presentation of Tobii Pro Glasses live video on adjacent application (note: the image depicts the experimental setup without revealing participant identities, as anonymity was ensured throughout the study).
Each participant had access to a bridge simulator visualization of 135 degrees, a steering console, one radar system, and one ECDIS. The use of simulators in research is well established, as they allow researchers to create realistic, repeatable conditions to examine human performance without the risks of real-life environments. Previous research has shown that experience significantly influences navigational decision-making, with seafarers improving in their decision-making and physiological responses as they gain more experience [33,34].
The simulation was carried out in two distinct phases, each with a specific focus on different aspects of the OOW’s responsibilities and their interactions with the ship’s navigational systems.
Phase 1—Bridge Familiarization: Before starting the exercise, every participant received all necessary information about bridge instruments and comprehensive understanding of the vessel’s operational procedures. This phase concludes once the incoming officer confirms their understanding by signing the relevant checklist. The checklists used in this phase, No. 2.3, 2.4, and 2.5, were taken from the ICS Bridge Procedure Guide [35]. Table 3 presents the average duration of the handover procedure.
Table 3.
Duration of familiarization (bridge handover) procedure.
Phase 2—Watch Handover: The second phase of the simulation involves the actual handover of the watch. In this stage, the outgoing OOW (the author) performs a watch handover, transferring responsibility for navigational duties to the incoming officer (participant). This phase is focused specifically on transferring operational control over the vessel’s navigation and safety. The procedures of this phase are distinct from those of the first, as it emphasizes the operational continuity and decision-making responsibility on the bridge. The handover is completed when the incoming officer acknowledges his/her readiness to assume full responsibility for the vessel’s navigation, and the procedure is formally concluded when the incoming officer signs the handover checklist (No. 2.11 and 2.16 from the ICS Bridge Procedure Guide [36]). The participants then continue their duties as if they were the officer on watch. Table 4 presents the average time spent on the watch handover procedure.
Table 4.
Duration of watch handover procedure.
A total of 32 participants were involved in the research, with demographic details shown in Table 5. Participants were informed about the purpose of using eye-tracking technology (ETT) to monitor their gaze patterns during the simulation but were not made aware of the specific objectives of the study. This approach ensured that participants performed the tasks as naturally as possible, without being influenced by the research goals, and allowed for the study to focus on their actual behavior rather than what they thought the study was aiming to measure.
Table 5.
Distribution of demographic groups of the participants.
Given the specific context of eye-tracking technology (ETT) in maritime simulations and the need for in-depth analysis of cognitive biases, the sample size in this study was determined based on several practical factors. These included the feasibility of conducting the study within the available time and resources; the need for high-quality, detailed data; and the specific constraints associated with maritime simulation environments.
This study focuses on a single scenario, with 32 participants completing this scenario, resulting in a total of 32 sessions recorded for analysis. In broader research, four different scenarios were tested by the same participants, providing a much larger dataset (128 sessions across the four scenarios). The scenario presented in this study involved about 29 min per session, with additional time allocated for handover, familiarization, and interviews, totaling over 15.5 h of recorded data (for 32 participants for Scenario 1).
While previous studies, such as those by Hareide, Uflaz, Atik, and Arslan, have used smaller sample sizes (ranging from 5 to 17 participants), subject study expands on this by employing a larger number of participants and focusing on a single scenario that contributes to the broader dataset used in the comprehensive analysis [19,21,22,23]. Furthermore, the extended duration of each session and the extensive data analysis (requiring manual review of over 50 h of footage for all four scenarios) make this study one of the most detailed in the field.
The chosen sample size, although smaller than some other research areas, is justified by the detailed data collected and the unique focus on cognitive biases and attention allocation in maritime decision-making. The findings from this study will serve as a foundation for future, larger-scale research in this domain.
As explained earlier, an OOW is joining a new type of vessel. For this reason, each simulation was prepared using two different types of vessels, both of which feature simplified bridge designs: a bulk carrier and a crude oil tanker. The bulk carrier was used as the ship in 20 simulations, while the crude oil tanker was used in 12.
2.4. Data Analysis
Data collected during the simulation were processed using Tobii Pro Lab software (Version: 1.194.41215) [36]. A total of 27 areas of interest (AOIs) were defined and categorized to analyze participants’ gaze patterns and their interactions with various systems on the bridge. Six AOI groups were established from those 27 AOIs as follows:
- Visualization AOI: Refers to the external view from the bridge window and the controls on the simulator console connected to visualization (visualization central, visualization left, visualization right, visualization control 1, and visualization control 2);
- Radar AOI: Includes the radar screen and controls, displaying vessel position and other navigational information (CPA and time to closest point of approach (TCPA) data; electronic bearing line (EBL) and variable range marker (VRM) data; radar control; radar navigational tool used for parallel indexing (PI) and setting of CPA/TCPA alarms; radar screen; radar setting 1: controls such as gain, tune, anti-clutter (A/C) sea and rain; radar setting 2, with a control for range selection and pulse length; and radar setting 3, with controls such as the vector setting);
- ECDIS AOI: The Electronic Chart Display and Information System (ECDIS) screen and controls, which provide digital charts and critical navigation data (ECDIS control, ECDIS screen, ECDIS setting, instruments on ECDIS, route data, and navigational tool);
- Steering AOI: Includes steering controls and associated parameters used to maneuver the vessel (steering and speed data; steering control, i.e., autopilot and non-follow unit; steering data 1, including magnetic and gyro heading and speed log; steering data 2, consisting of rate of turn indicator and helm, and steering wheel);
- Engine AOI: Refers to engine controls and related parameters, which are essential for managing the vessel’s speed and propulsion (engine control, engine data, engine data and control);
- Outside AOI: Captures any areas outside the immediate focus on the navigation tools, such as the surrounding simulation environment or other environmental factors (any gaze outside the defined AOIs).
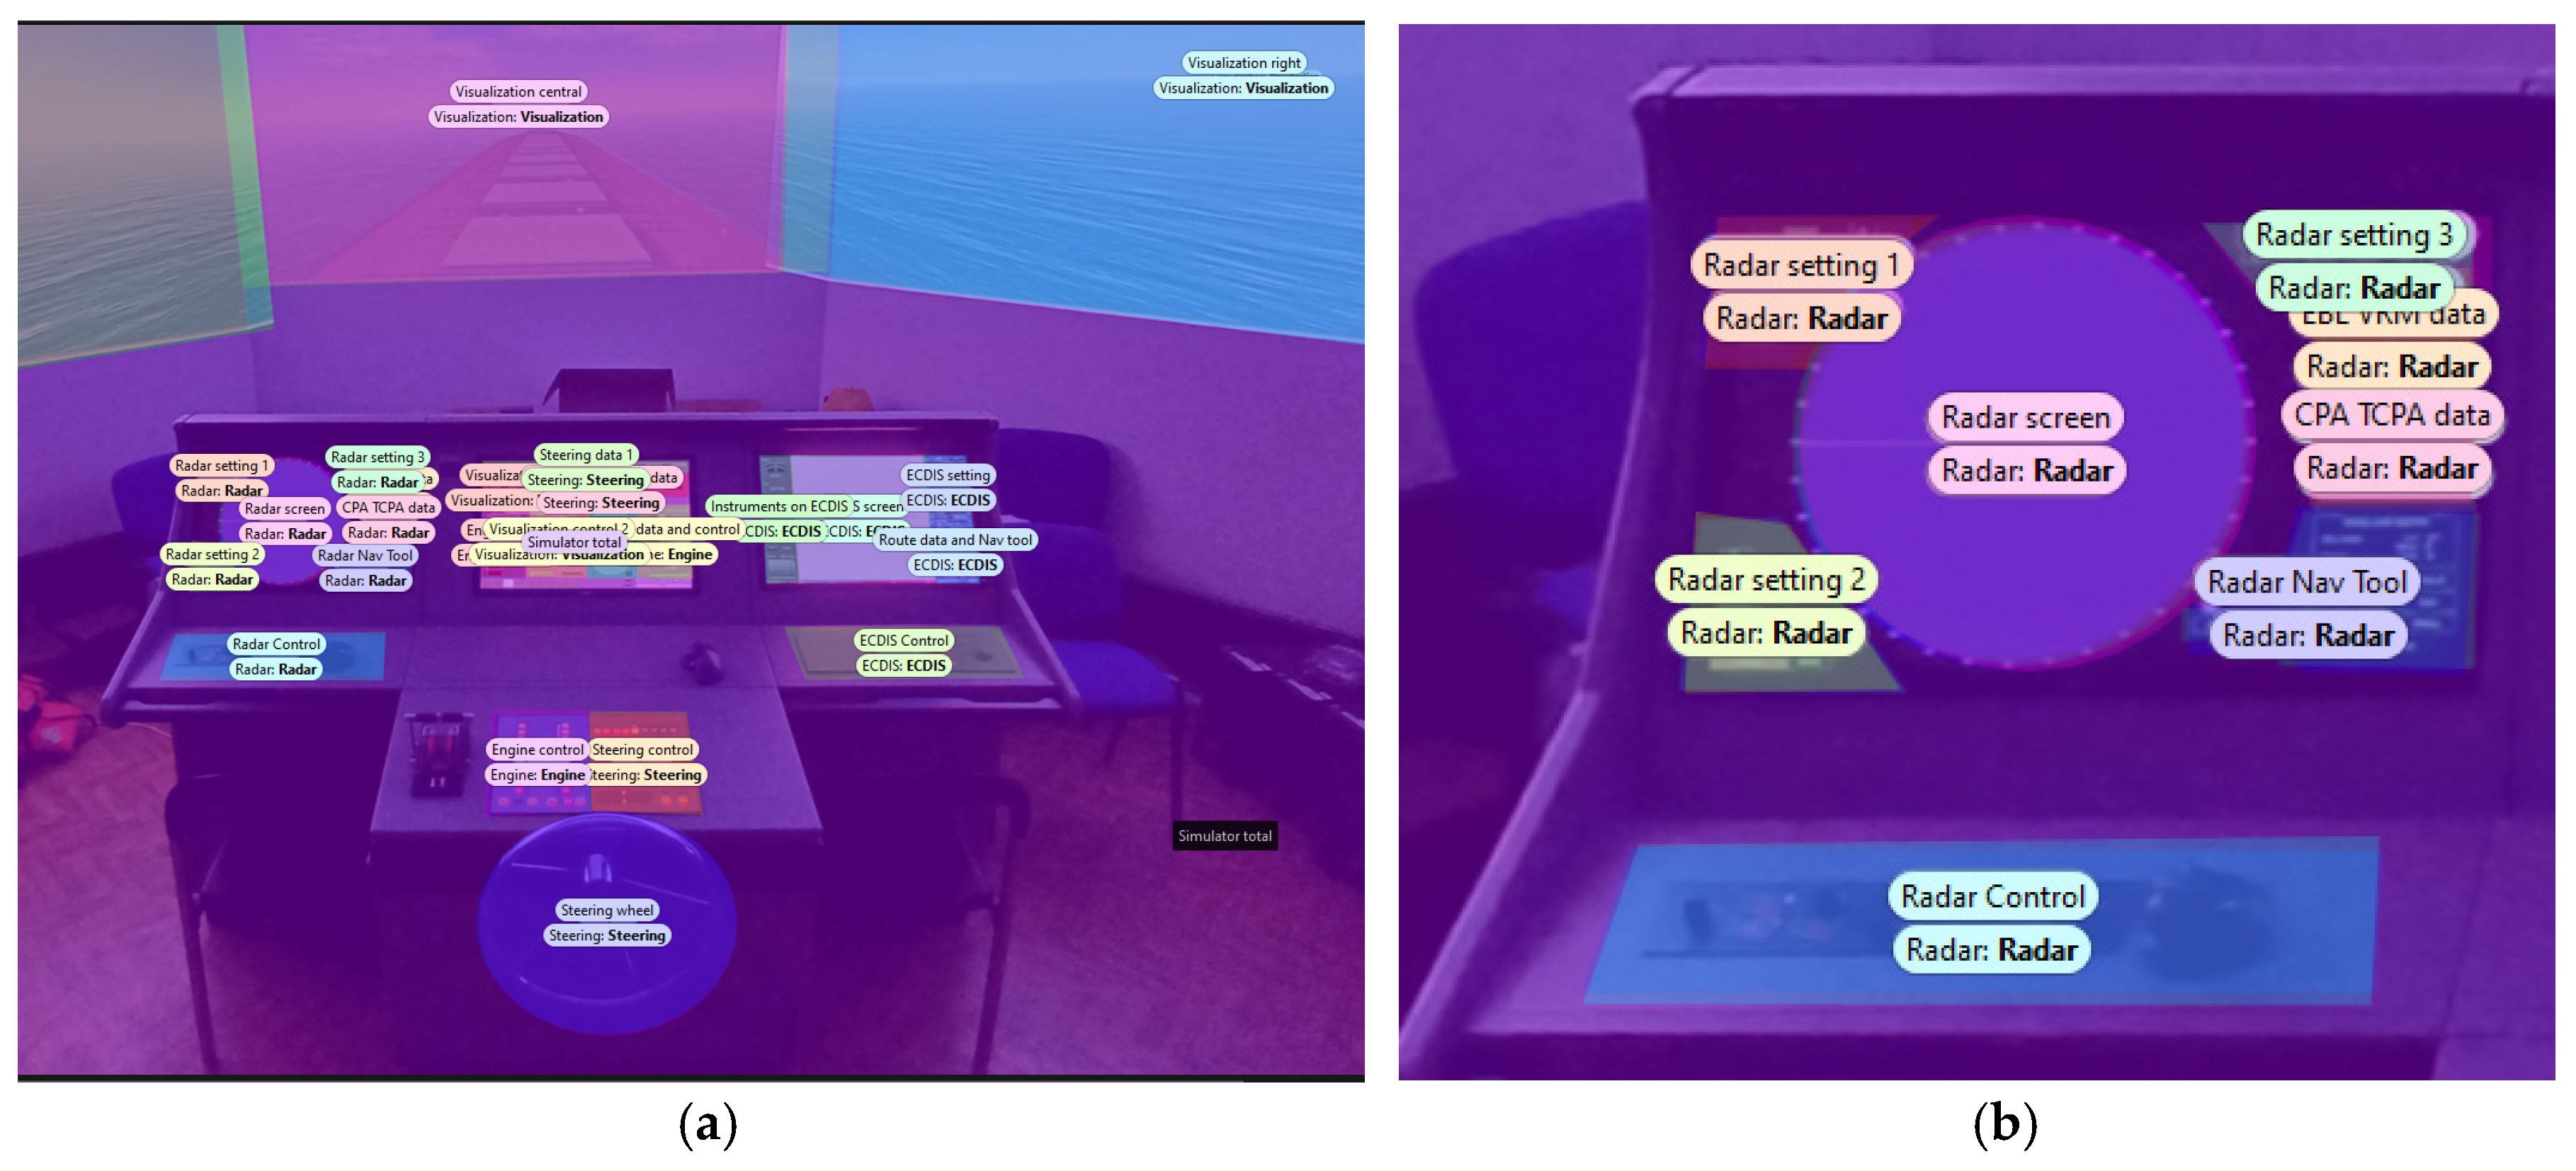
Figure 3 presents the AOI layout and the radar AOI group.

Figure 3.
Definition of AOIs: (a) within the navigational simulator at the Faculty of Maritime Studies, Kotor (referenced in paper), and (b) within the radar AOI group.
It must be noted that for the calculation of perceived and actual performance values and their differences, the focus was placed on the time spent on three primary navigational tools: visual observation, radar, and ECDIS. The time allocated to these three AOI groups represents 100% of the total gaze time. Time spent on other AOI groups (such as steering, engine, and outside AOI) was not included in the performance calculations but was instead used in the analysis of demographic factors, allowing for a broader understanding of how different groups of participants interact with the navigational tools. This distinction ensures that the study accurately measures the effectiveness of the key navigational tools used by participants while considering the impact of other factors in the broader analysis.
2.5. Statistical Analysis
Several statistical tests were employed to assess the relationship between perceived and actual performance and the influence of demographic factors. The Shapiro–Wilk test was used to check for normality, followed by ANOVA for normally distributed data and Kruskal–Wallis for non-parametric data [23,37,38]. Post-hoc tests (Tukey and Dunn) were used to determine significant differences between demographic groups [39,40]. A p-value of <0.05 was considered statistically significant.
3. Results
This section presents the study’s results, focusing on participants’ estimations and real-time performance data, assessed using ETT during the simulations, and a comparison between the two.
3.1. Presentation of Participants’ Perceived (Perceptional) Navigational Performance
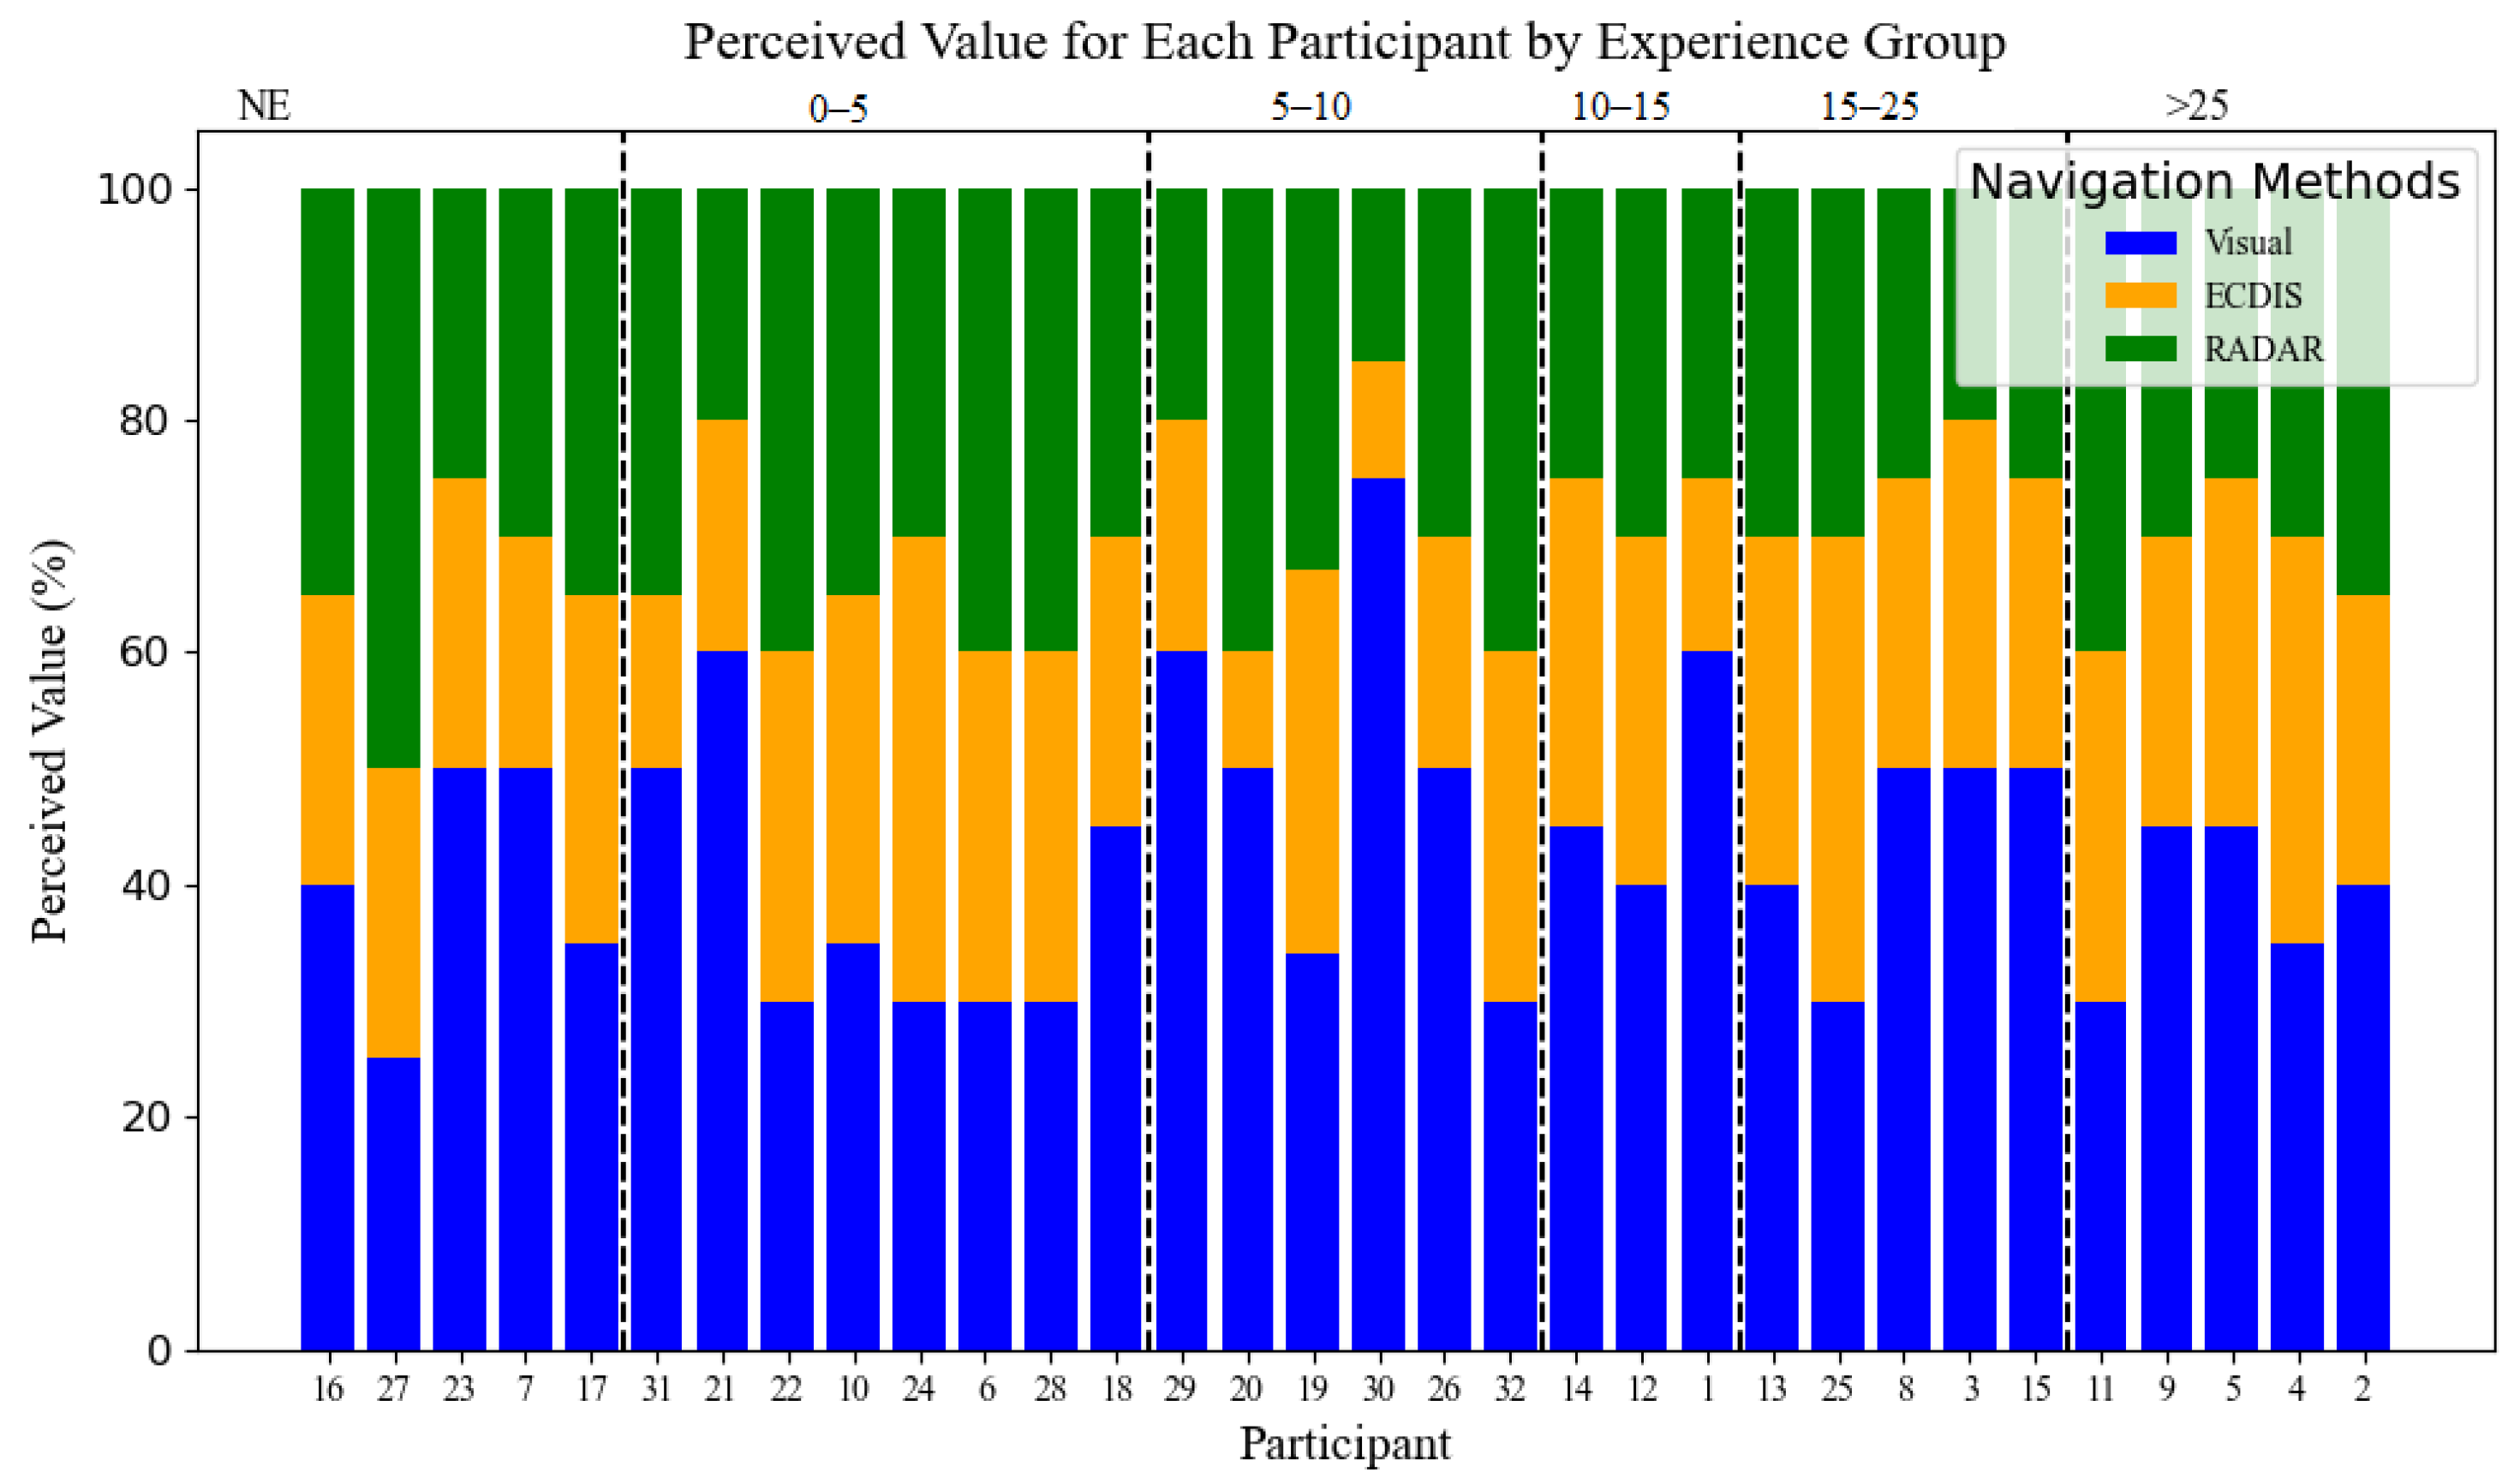
Data for perceived values derive from an interview in which participants were asked to estimate the percentage of time they rely on each navigational method (tool) for collision avoidance and traffic surveillance. They were instructed to distribute the percentages among the three methods based on their perceived usage of these tools, ensuring that the total of all three percentages equaled 100%.
All 32 participants completed the interview, and Figure 4 shows how each participant believes he/she relies on each navigational tool.
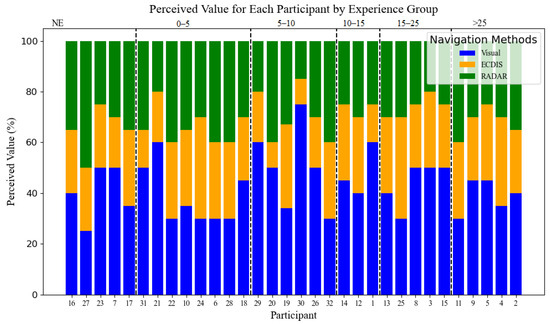
Figure 4.
Perceived value for each participant.
Table 6 displays the mean, standard deviation, median, minimum, and maximum values for perceived reliance on each navigational tool.
Table 6.
Summary of perceived values.
These mean values show that participants generally believed they relied most on visual observation, followed by radar, with ECDIS being considered the least relied-upon navigational tool. The standard deviations indicate variability in perceptions, with visual observation exhibiting the highest variability. This suggests that while most participants felt confident in their visual navigation, some had contrasting experiences.
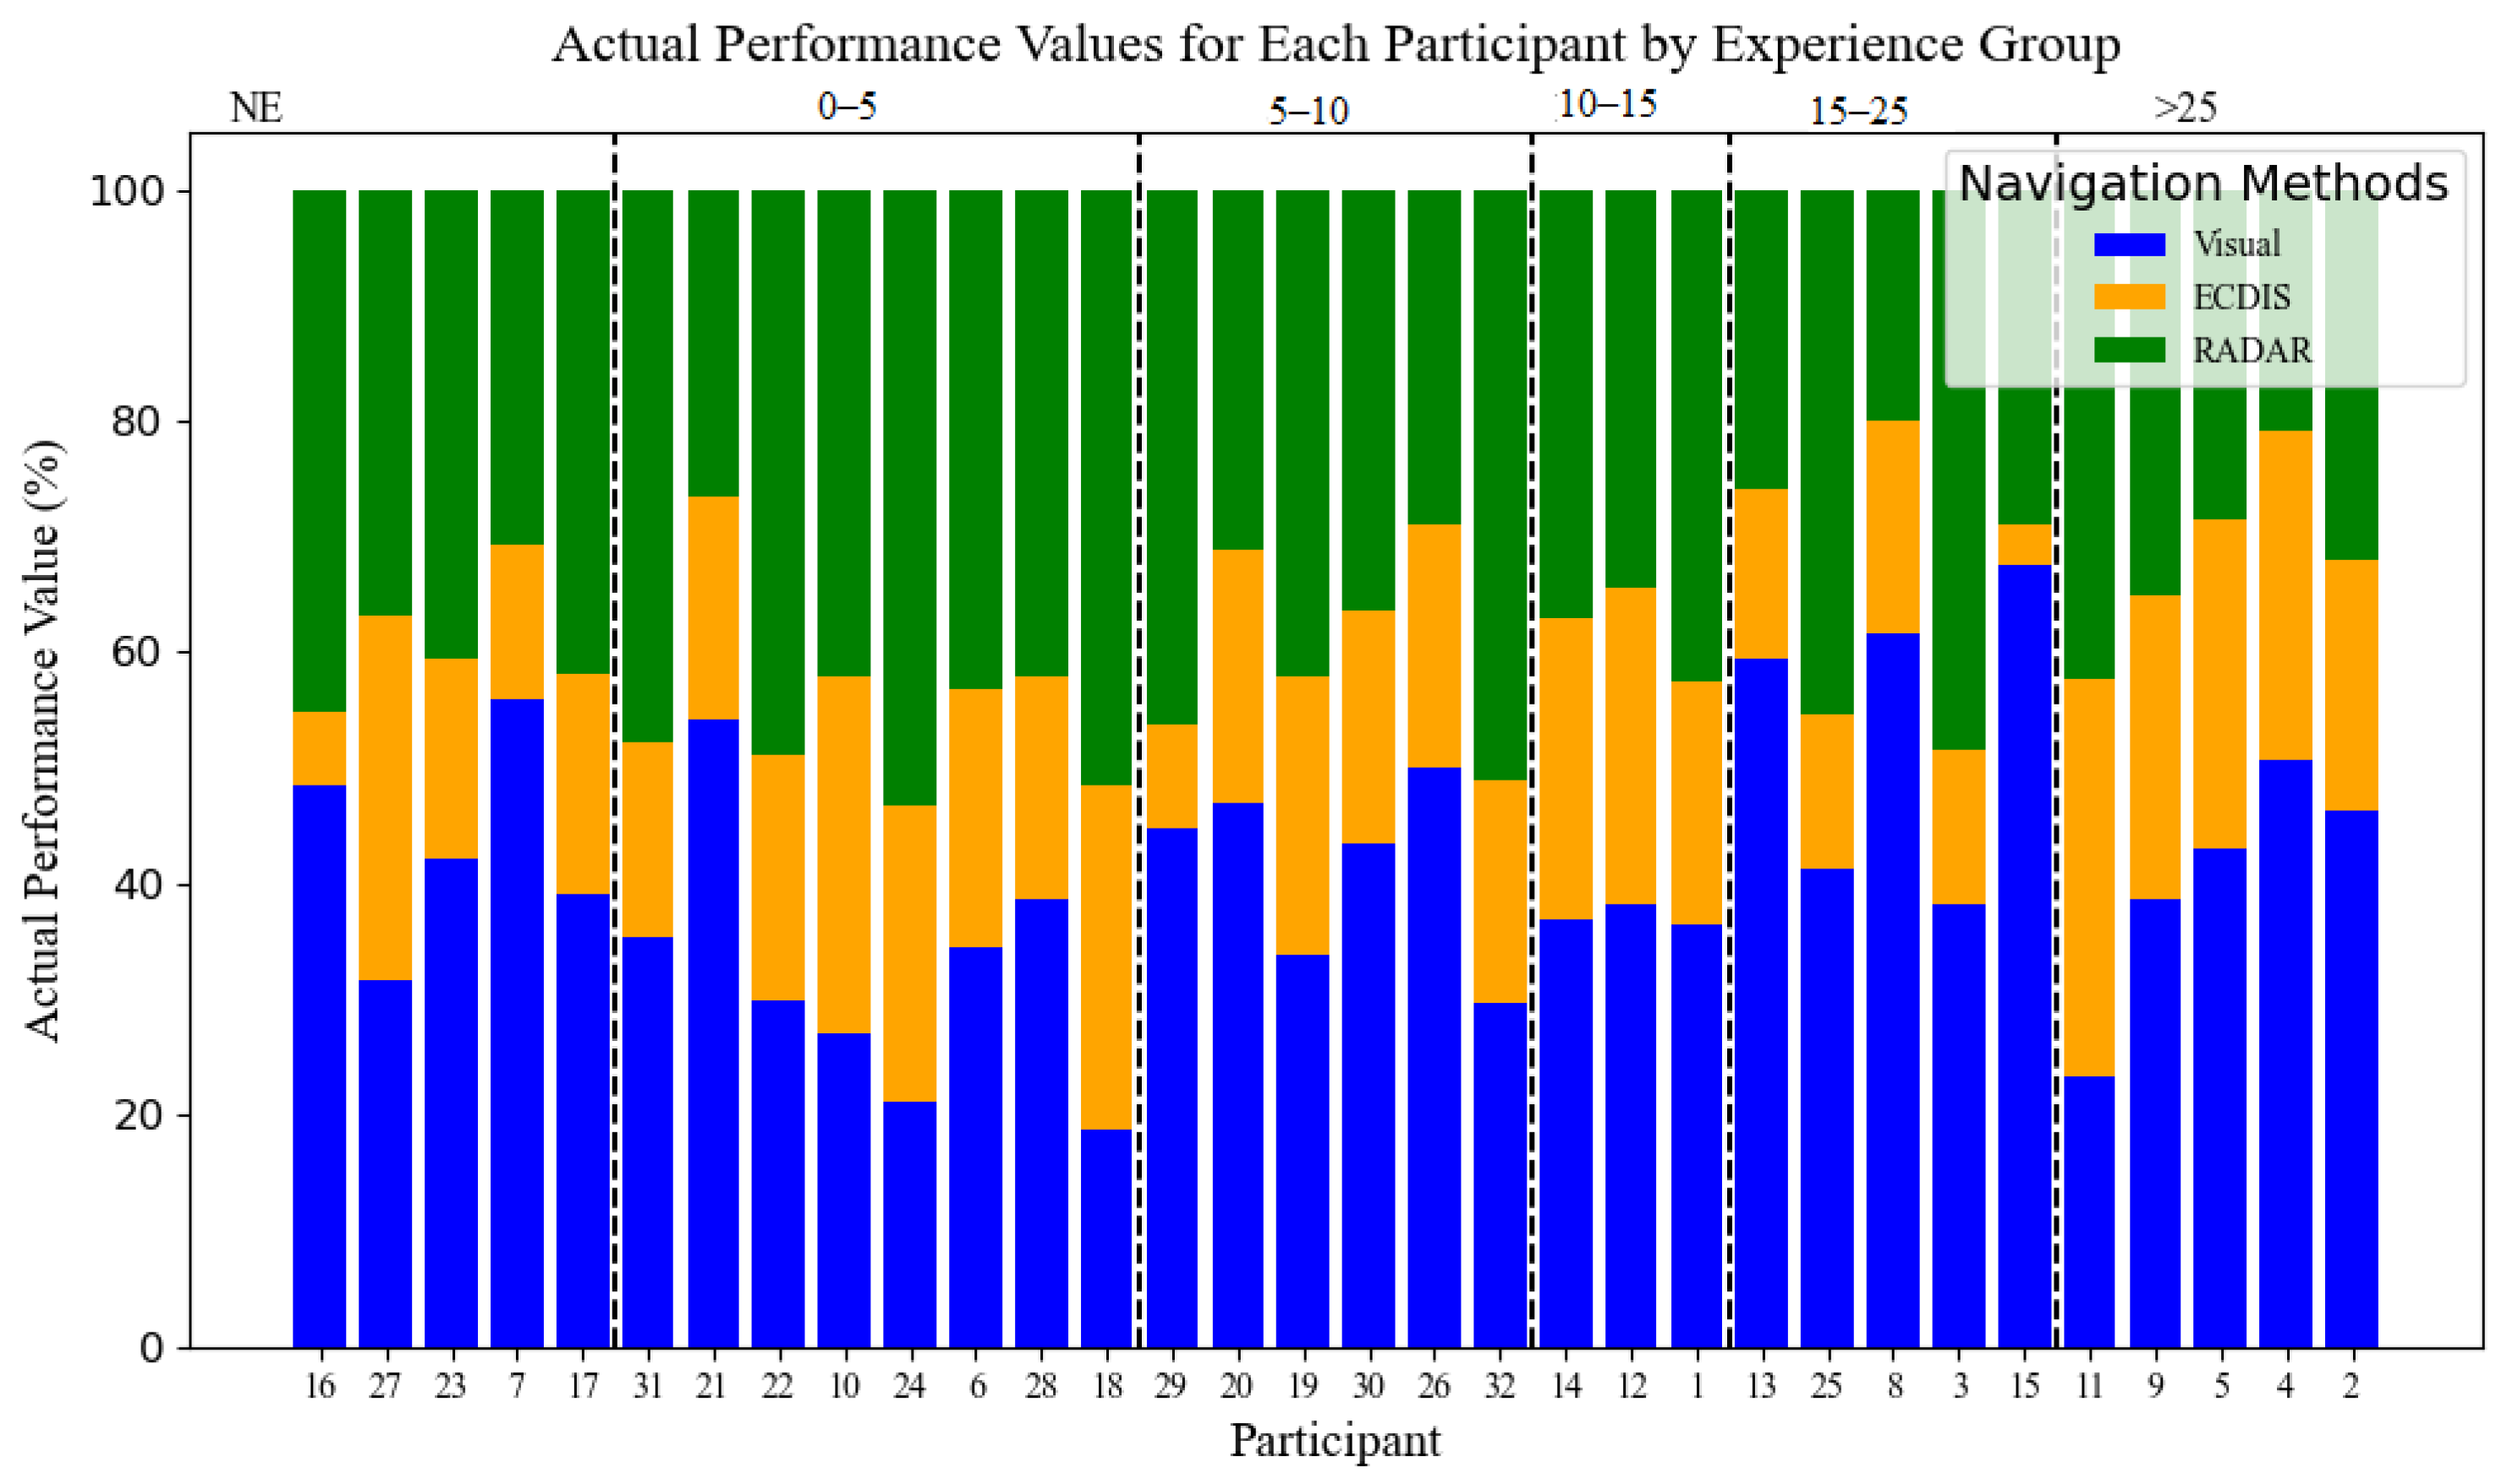
3.2. Presentation of Actual Performance Values Obtained by ETT During Simulation
This section presents the actual performance values obtained by ETT during the simulations. The data obtained by ETT and Tobii Pro Lab software (Version: 1.194.41215) were compiled into a large database for further statistical analysis.
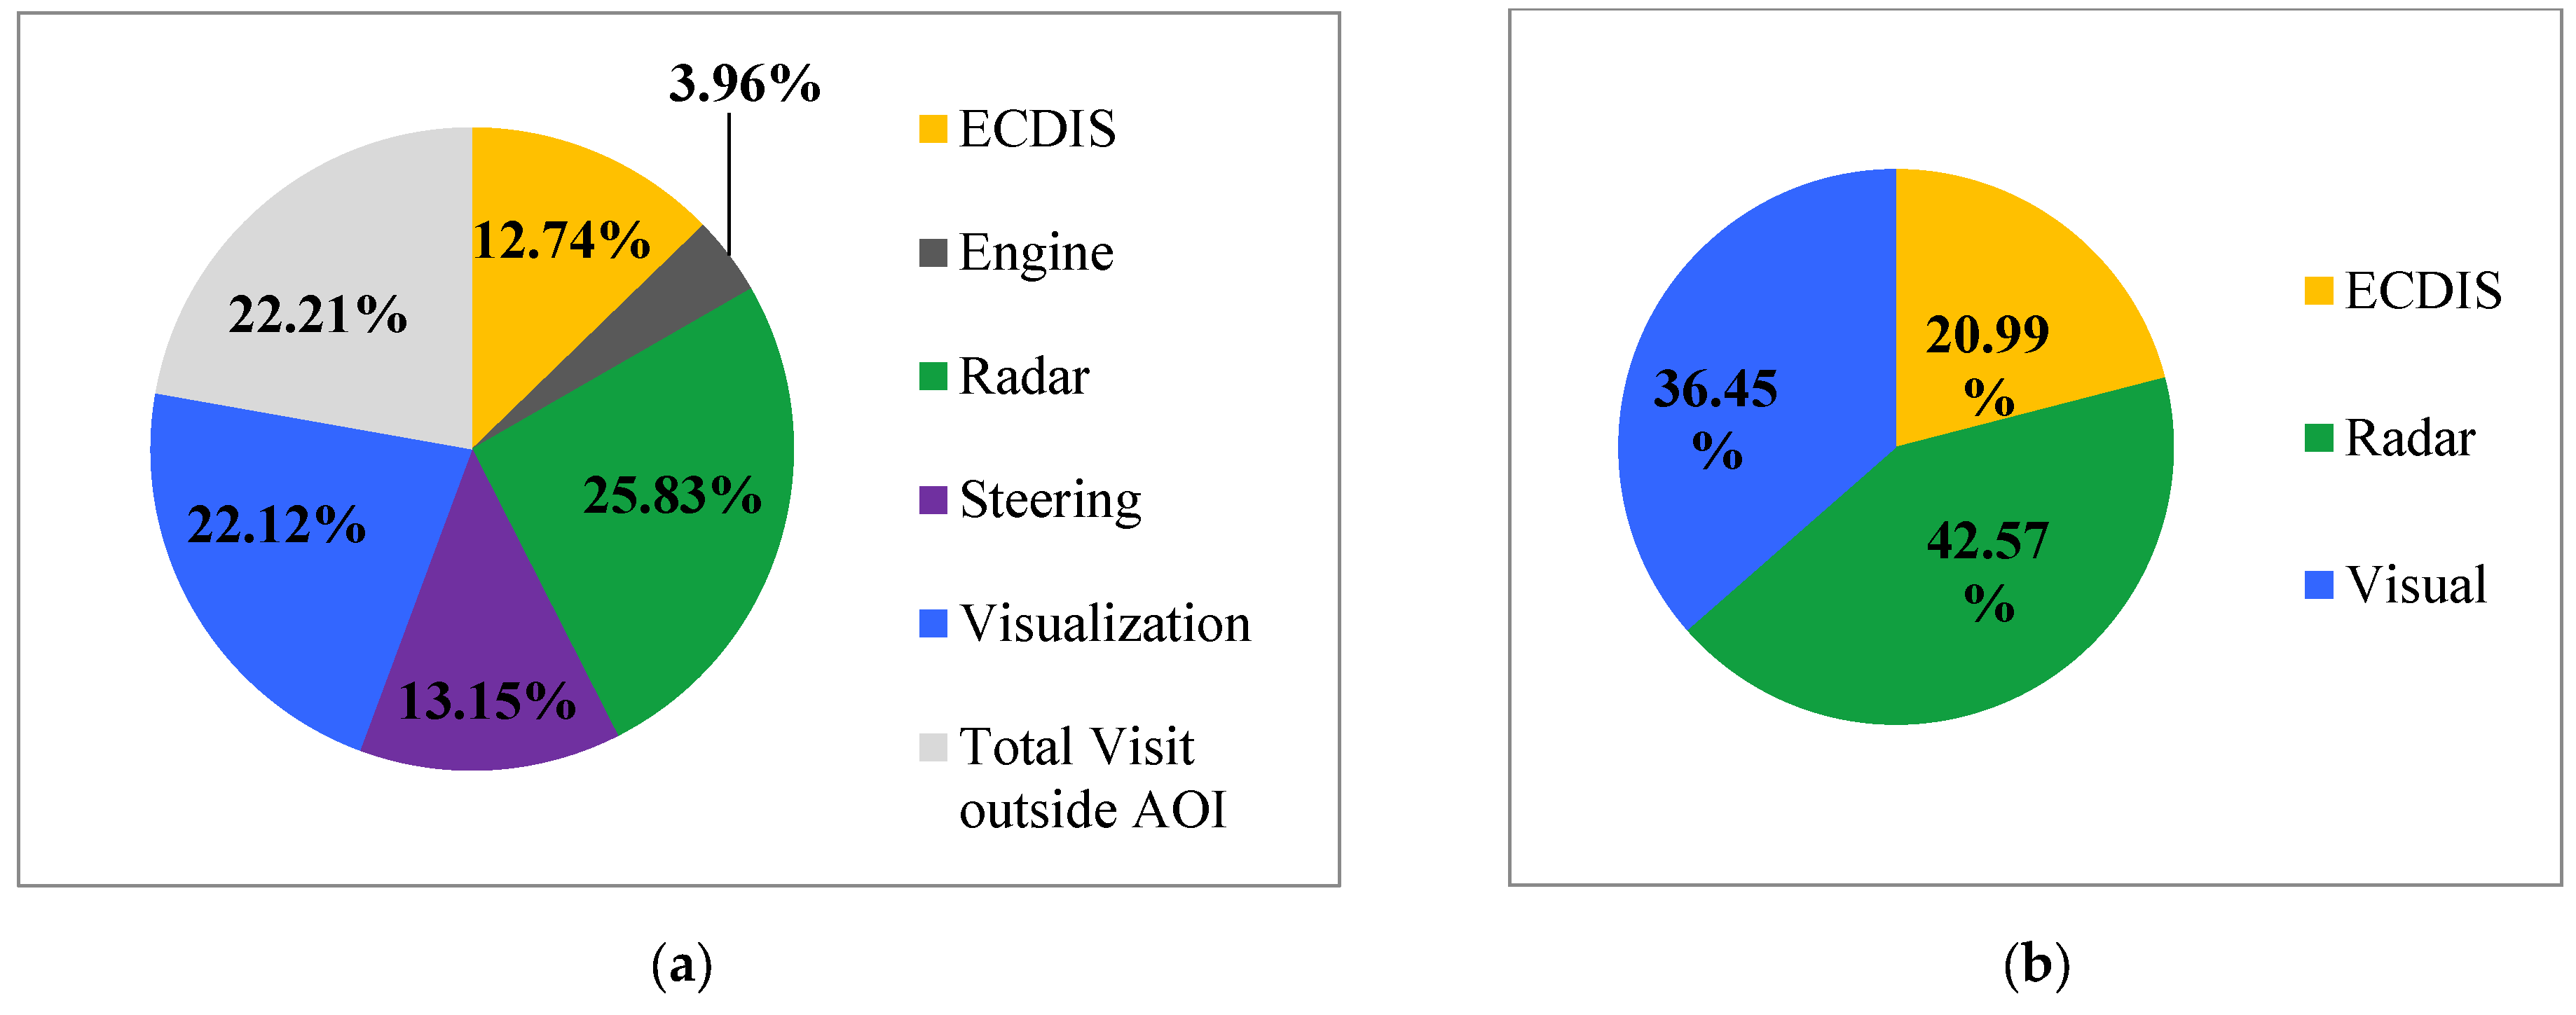
Figure 5a illustrates the distribution of six AOI groups for one of the participants (in this case, participant No. 1), showing the allocation of gaze time across various areas. Figure 5b is a simplified version of Figure 5a, focusing only on the three AOI groups related to traffic surveillance and collision avoidance (visual, radar, and ECDIS).
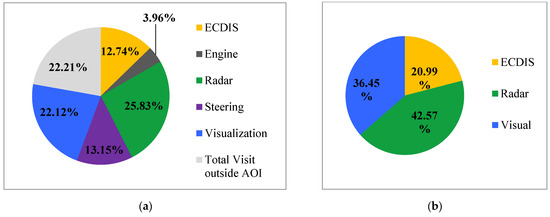
Figure 5.
Presentation of simple metrics based on Tobii Pro Lab software results for one of the participants: (a) AOI group percentage in total gaze time and (b) distribution of gaze time among ECDIS, radar, and visual.
The data for all 32 participants were gathered in the same manner, and Figure 6 displays the gaze time distribution for each participant. Notably, in the data shown for participant 1 in Figure 6, the blue, yellow, and green bars represent the data from Figure 5b, highlighting the gaze time allocation for traffic surveillance and collision avoidance.

Figure 6.
Actual performance value for each participant.
Table 7 presents the mean values and standard deviations for the actual performance of all participants. These values provide insight into general trends and variations across the entire dataset. Descriptive statistics, including medians, minima, and maxima, were also examined to further understand the distribution of results and the potential for extreme values.
Table 7.
Mean values and standard deviations of actual performance values for Scenario 1.
3.3. Difference Between Perceived and Actual Performance Values
This section compares participants’ perceived values (i.e., how they believe they allocate attention between visual observation and various navigational methods/tools) with their actual performance values (i.e., how their gaze was observed by ETT).
Table 8 presents mean differences, standard deviation, median, min, and max data. The differences indicate that, on average, participants overestimated their reliance on visual observation and ECDIS, and underestimated their use of radar. The negative differences for visual methods and the use of ECDIS suggest that participants thought they were looking through the window or at ECDIS more often than they actually were. Meanwhile, the positive difference for radar indicates that participants thought they were relying on this tool less than their actual performance demonstrated.
Table 8.
Differences between perceived and actual performance values in Scenario 1.
Although the mean differences are relatively small, the minimum and maximum values highlight significant discrepancies in individual behaviors. For example, participant No. 30 showed a difference of 31.53% between perceived and actual reliance on visual observation, while participant No. 25 showed a 26.62% difference in reliance on ECDIS, and participant No. 3 exhibited a 28.49% difference for reliance on radar. These are the min and max values for all participants, as shown in Table 8, while Figure 7 illustrates the difference in perceived and actual performance for each participant.
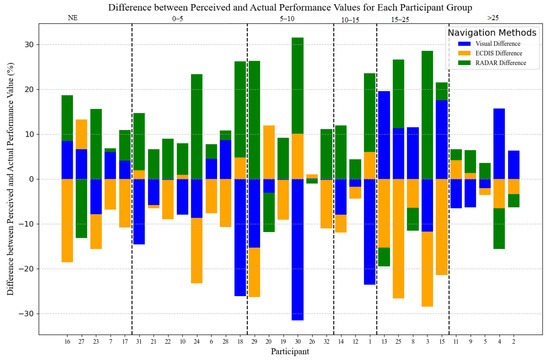
Figure 7.
Differences between perceived and actual performance values for each participant in Scenario 1.
The chart shows how each participant’s perceived performance, based on their self-assessment, compares to their actual performance during the simulation task.
- Blue bars represent the difference for the visual navigation method.
- Orange bars represent the difference for the ECDIS navigation method.
- Green bars represent the difference for the radar navigation method.
As an example, consider participant No. 16 (from the “no experience” group). The figure shows that ECDIS was used 18.6% less than the participant had anticipated, while visual attention and use of radar were 8.4% and 10.2% higher than perceived. These differences illustrate the gap between theory (what the participants believed they were doing) and practice (what they were actually doing) during the watch.
3.4. Demographic Analysis
This section examines the effect of sea experience as OOW on candidates’ performance. The assumption of normality was first assessed using the Shapiro–Wilk test (SW).
SW Test Results: The results of the SW test (summarized in Table 9) revealed that certain variables, such as engine and steering data, were non-normally distributed. Therefore, for these variables, the Kruskal–Wallis test was applied, while ANOVA was used for normally distributed data.
Table 9.
Results of SW test for relevant AOI group data distribution.
Based on the SW test results, either ANOVA or Kruskal–Wallis was used for further analysis, depending on the data distribution. Tukey and Dunn tests were conducted as post hoc tests to identify which specific experience groups differed significantly.
The ANOVA results, presented in Table 10, show significant differences in the use of ECDIS, engine, and steering across different levels of sea experience. Specifically, p-values for ECDIS, engine, and steering were all less than 0.05, suggesting that sea experience significantly influences the use of these methods. Visualization showed borderline significance, while radar did not exhibit any significant differences.
Table 10.
Results of ANOVA test for relevant AOI group based on experience.
The Kruskal–Wallis test (see Table 11) corroborated the ANOVA findings, showing that sea experience impacts the use of ECDIS, engine, and steering, with significant differences across experience groups. As the Kruskal–Wallis results were consistent with ANOVA, they are not discussed separately in this paper.
Table 11.
Results of Kruskal–Wallis test for the relevant AOI group based on experience, Scenario 1.
Post hoc tests (Tukey and Dunn) were used to identify which specific groups showed significant differences, particularly between candidates with the most and least experience. Figure 8 illustrates an example of the post hoc tests for two different navigational methods (ECDIS and steering), showing the significant differences based on sea experience.
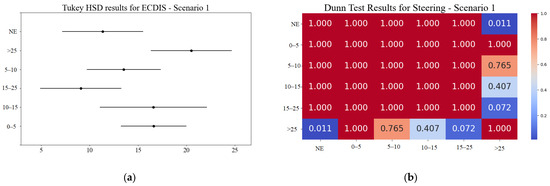
Figure 8.
An example of post hoc tests: (a) Tukey HSD test for the ECDIS AOI group and (b) Dunn test for the steering AOI group.
- ECDIS: A significant difference was found between candidates with >25 years of experience and those with no experience (NE) as OOW, with a p-value of 0.0267. Furthermore, significant differences were observed between candidates with 15–25 years of experience and those with >25 years of experience (p-value 0.0036).
- Engine: Significant differences were observed between candidates with no experience (NE) and those with 15–25 years of experience, and between candidates with 5–10 years and those with 15–25 years of experience (p-value 0.095).
- Steering: A large difference in the use of steering parameters was observed between candidates with no experience (NE) and those with >25 years of experience (p-value 0.011), as well as between candidates with 15–25 years and >25 years of experience (p-value 0.072).
- Visualization: A significant difference in visualization use was observed between candidates with 0–5 years of experience and those with 15–25 years of experience (p-value 0.0297).
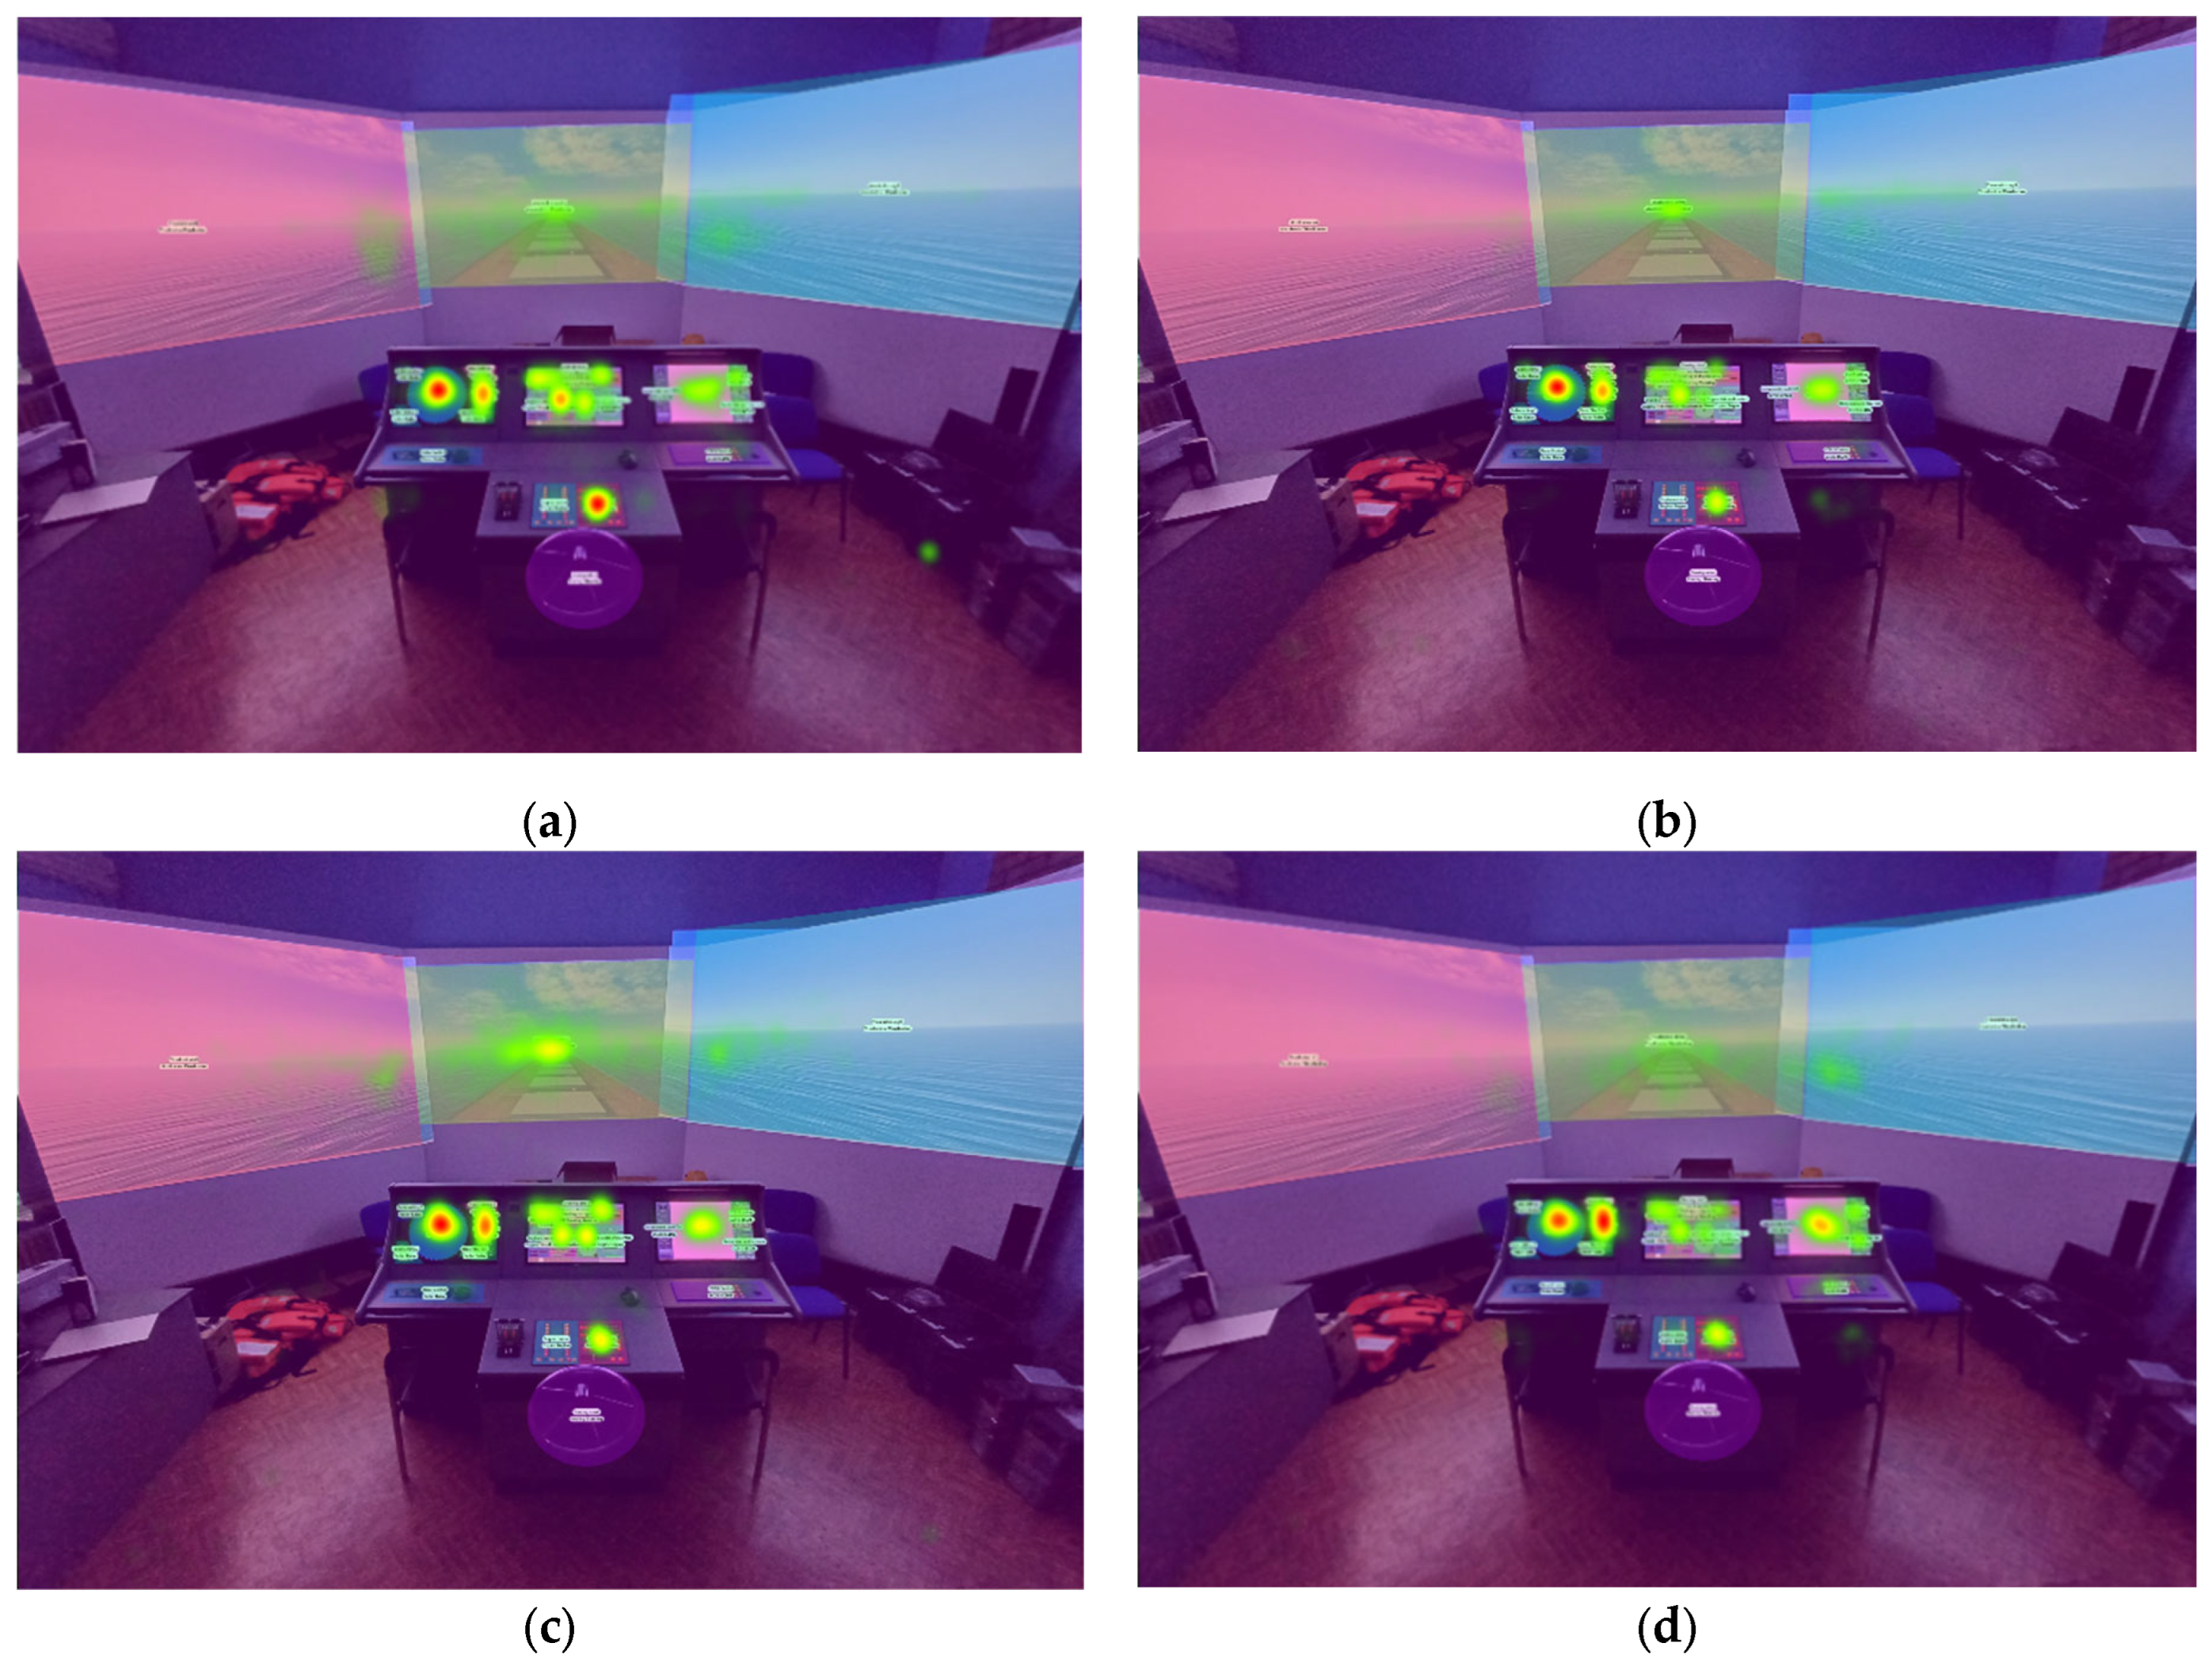
Figure 9 illustrates a heatmap showing the distribution of gaze patterns for four experience groups with significant differences.
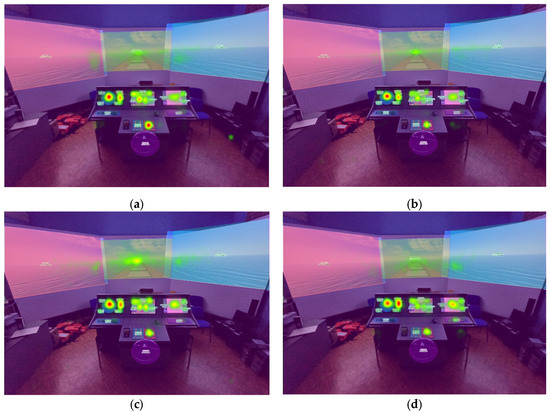
Figure 9.
Distribution of heat maps between candidates based on sea experience as OOW: (a) no experience, (b) 5–10 years, (c) 15–25 years, (d) >25 years. Note: Red areas indicate frequent gaze, while green areas indicate less attention. The intensity of the color corresponds to the frequency of gaze in each region.
3.5. Presentation of Gaze Outside AOI
Although the data regarding the amount of time participants spent gazing outside of AOIs are not directly related to the main objectives of this study, these measurements were recorded as part of a broader research effort for the doctoral thesis. While not directly linked to the core methods of assessing situational awareness, such as the use of navigational tools, they provide valuable insights into potential distractions and factors that could indicate a loss of situational awareness during the simulation exercises.
“Gaze outside of AOIs” refers to instances when participants looked away from areas directly related to lookout tasks, such as monitoring surrounding traffic and avoiding collisions, or to steering and engine parameters. This includes gazing at the ceiling, floor, or various areas of the simulator room not linked to navigation, and distractions unrelated to the simulation, such as looking at a coffee cup or engaging in conversation with the researcher. It is important to note that during the exercises, no distractions were intentionally planned or induced by the researcher; any gaze outside of relevant AOIs was initiated by the participants.
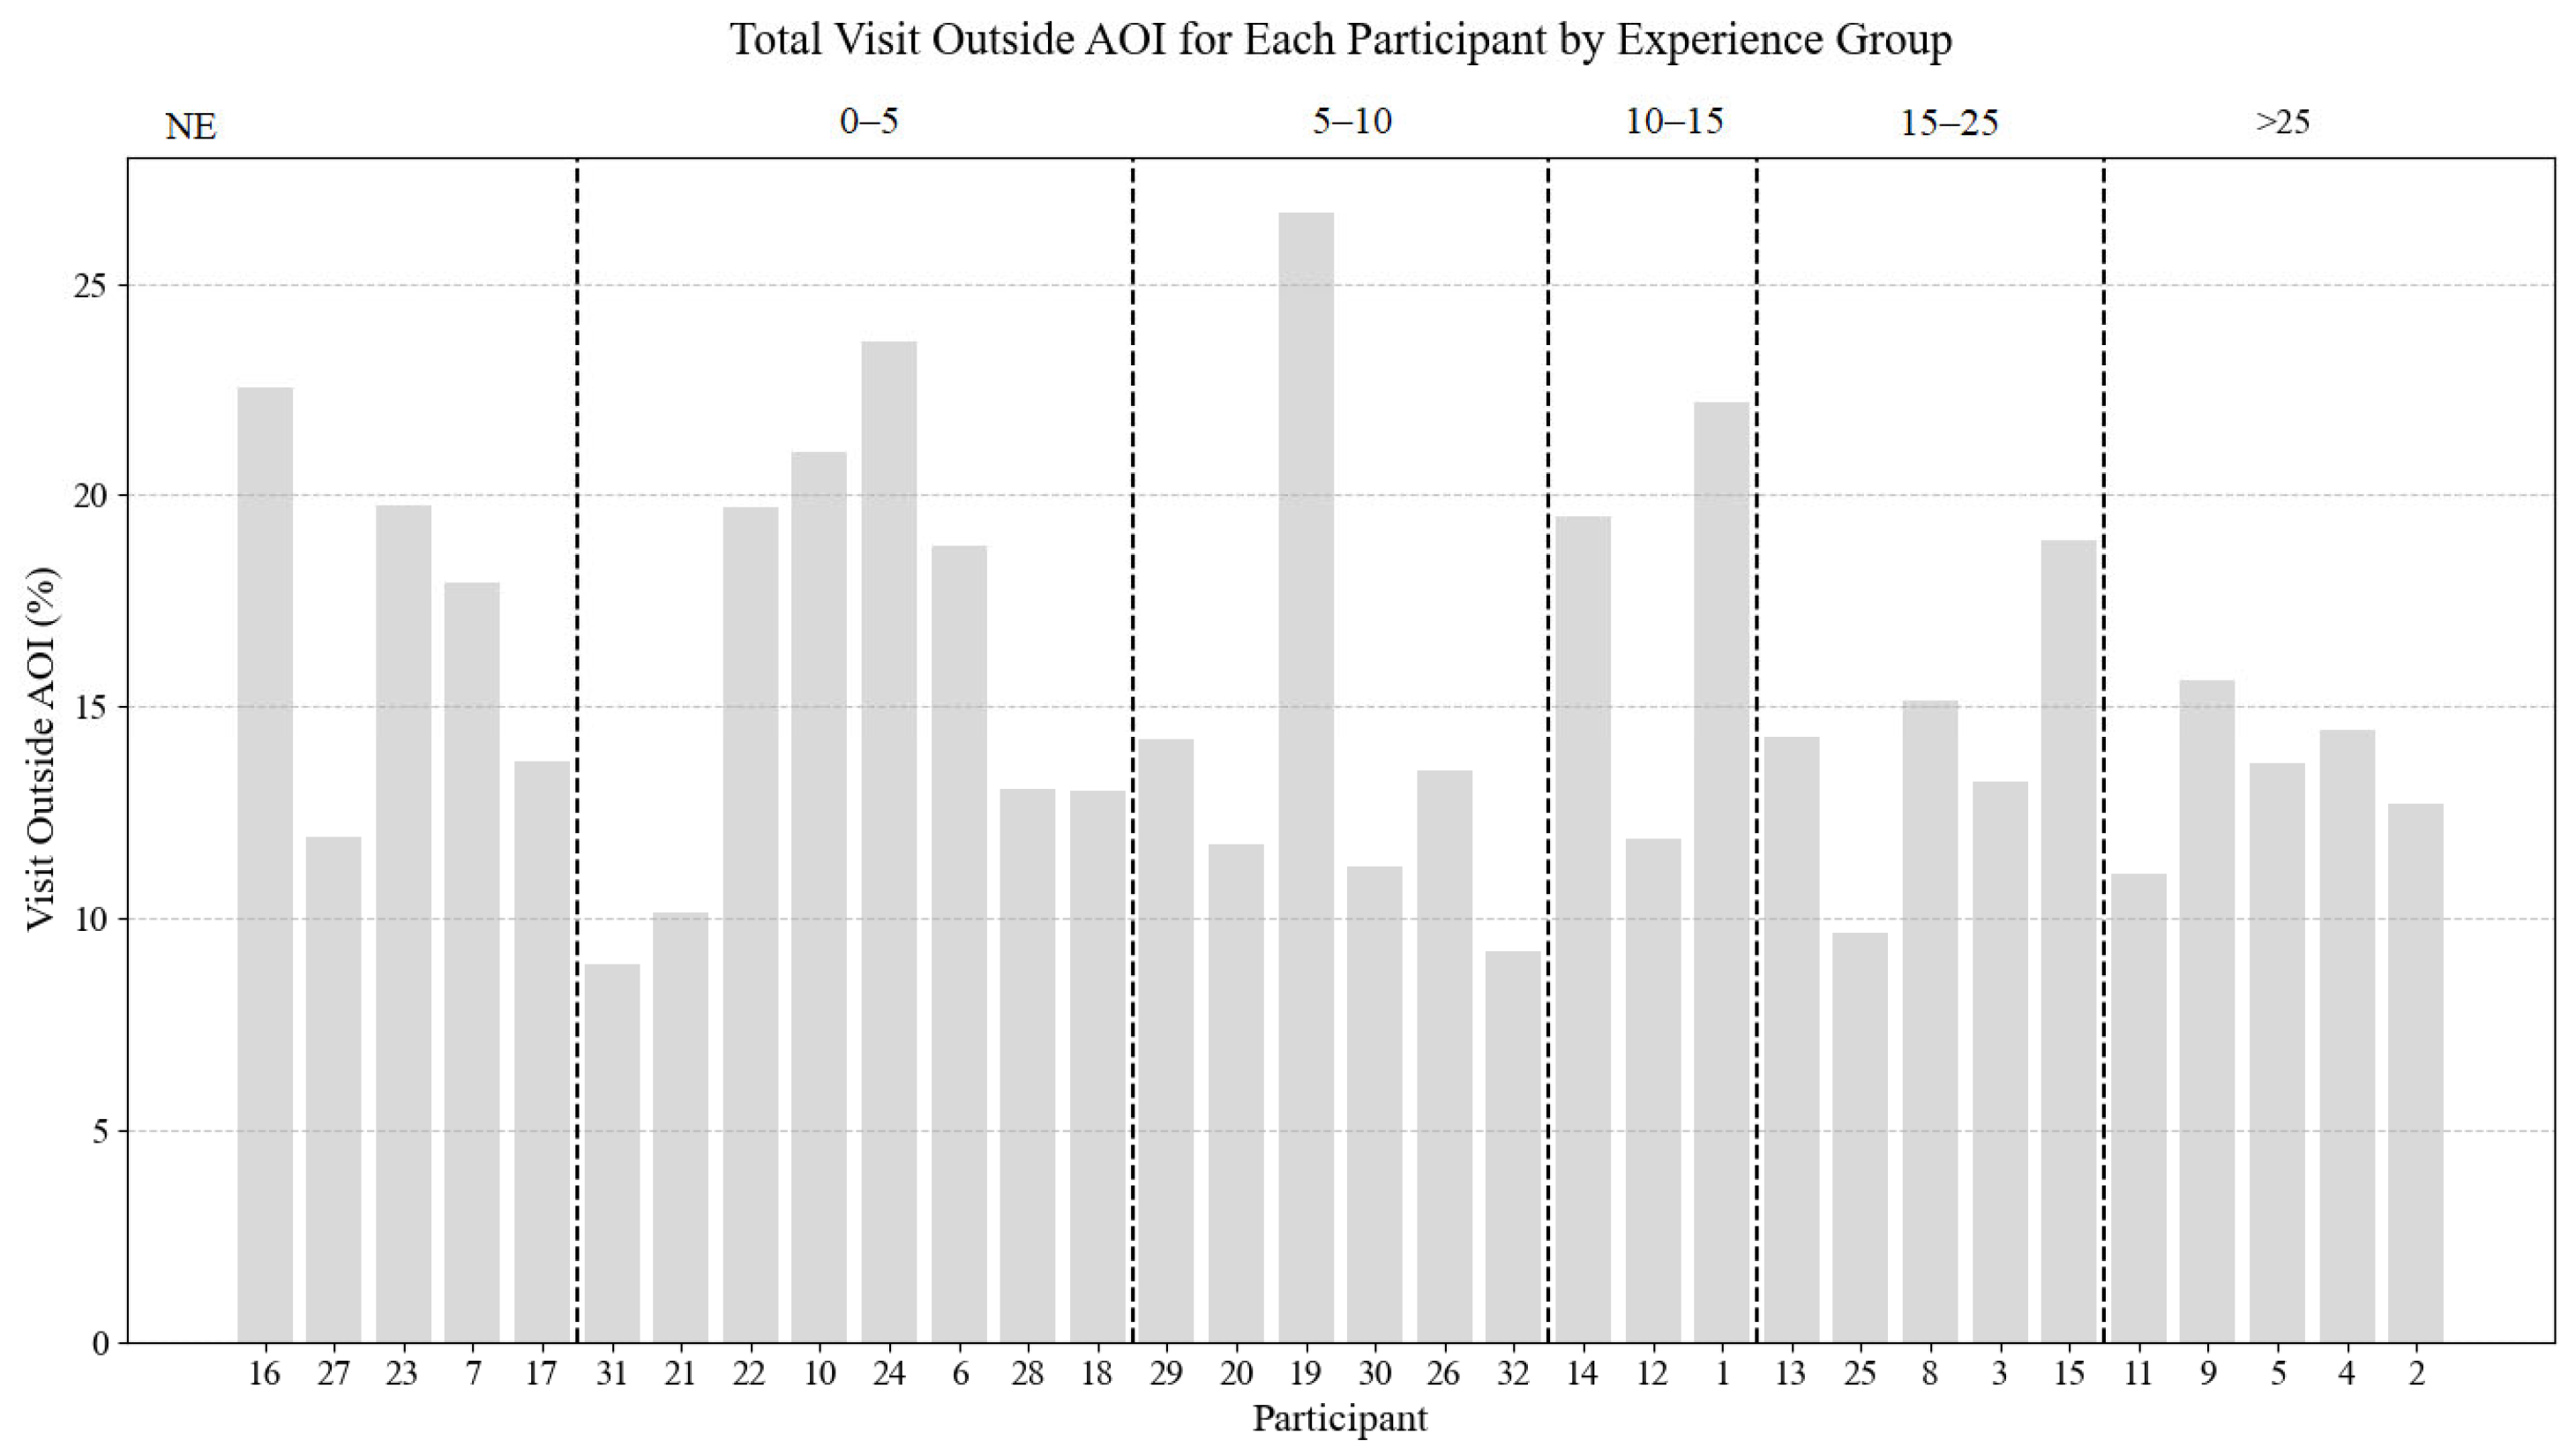
Figure 10 presents the percentage of time spent gazing outside AOIs for each individual participant. These data can be useful for further research into factors that might impact situational awareness, as well as the analysis of potential distractions that occur during the execution of navigational tasks.
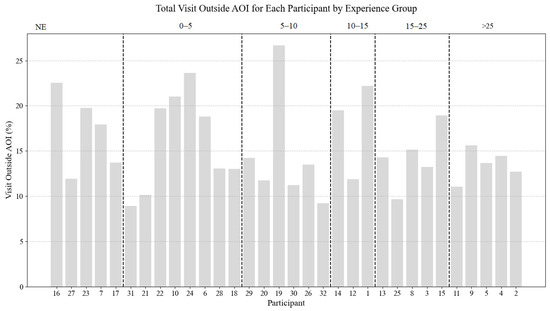
Figure 10.
Total gaze outside AOIs for each participant.
Table 12 presents a summary of the data, including the mean, standard deviation, median, minimum, and maximum values for the percentage of time participants spent gazing outside AOIs.
Table 12.
Summary of total gaze outside AOIs.
The percentage of time participants spent gazing outside AOIs varied across the sample, ranging from 8.92% to 26.67% (as shown in Table 12 and Figure 10), reflecting the amount of time spent disengaged from critical navigational tools or areas directly tied to lookout duties.
The average time participants spent outside the AOIs during the simulation exercises is calculated based on the overall length of the task. The values presented in Table 13 offer insight into how much time, on average, was spent in non-relevant areas, which could potentially indicate a loss of situational awareness.
Table 13.
Duration of total gaze outside AOIs.
These values provide a clearer picture of how much time participants may have spent disengaged from the critical task at hand, suggesting potential losses of situational awareness, which could have consequences for navigational safety.
4. Discussion and Conclusions
The primary aim of this study was to explore discrepancies between seafarers’ perceived and actual navigational performance, as measured by interviews and ETT. The findings provide valuable insights into how seafarers interact with navigational tools and the cognitive processes influencing their decisions.
The results showed that, on average, seafarers overestimated their reliance on visual observation and ECDIS while underestimating their use of radar. Although the mean differences for all three methods/tools were relatively small (less than 7.5%), individual discrepancies (as indicated by the minimum and maximum values) revealed more substantial variations between participants. For example, participant No. 30 overestimated his/her reliance on visual observation by 31.53%, while participant No. 13 underestimated it by 19.52%. Similarly, discrepancies for ECDIS reached as high as 26.62% with participant No. 25, and participant No. 20 underestimated it by 11.90%. For radar, the range of differences spanned from a 13.2% overestimation (participant No. 27) to a 28.49% underestimation (participant No. 3). These significant individual variations illustrate the disparity between participants’ perceived and actual use of navigational tools.
This misalignment between perceived and actual behavior suggests that cognitive biases, such as overconfidence and reliance on visual cues, may be influencing participants’ navigational decisions. The extreme discrepancies, as seen in the individual differences, indicate that some seafarers may have a distorted view of their reliance on different navigational aids. These biases could lead to inaccurate self-assessments, which in turn may contribute to a lack or loss of SA during critical decision-making processes. The substantial range in individual differences further highlights the need for better self-awareness and accuracy in evaluating navigational performance. Some participants may unknowingly rely more on radar or ECDIS, underestimating their actual dependence on these tools, which can result in a false sense of high SA. Consequently, they may believe they are maintaining a high level of SA, when in fact, they may be missing crucial information.
This tendency to make decisions based on assumptions rather than facts, and focusing on short-term consequences, can greatly impact decision-making. Seafarers often prioritize immediate risks without considering the broader picture or longer-term implications of their decisions. This gap between perceived and actual behavior, as demonstrated in this study, shows the importance of recognizing and addressing cognitive biases to improve decision-making accuracy and situational awareness.
The application of ETT has proven invaluable in maritime research, as it not only provides an objective measure of navigational behavior but also highlights how demographic factors, such as maritime experience, influence performance. ETT offers a detailed view of how seafarers allocate their attention during critical tasks, helping to identify biases that impact their situational awareness. The video data from ETT also provides an excellent resource for training, allowing instructors to review and analyze participants’ focus during simulations.
Moreover, ETT can also distinguish gaze patterns between experienced and less experienced seafarers, providing insights for tailored training interventions. Experienced seafarers showed a more balanced use of navigational tools, contributing to better decision-making. In contrast, less experienced individuals relied heavily on specific tools, like radar or visual observation, which could hinder their ability to maintain optimal situational awareness. These discrepancies highlight the need for focused training on tool integration, helping bridge the gap in situational awareness between different experience levels.
The findings also have significant implications for maritime training programs, particularly in addressing cognitive biases that influence SA. The discrepancies observed between perceived and actual reliance on navigational tools emphasize the need for targeted training interventions. By using eye-tracking technology (ETT), it can be identified where participants are focusing their attention during critical tasks, revealing potential weaknesses in SA. Personalized training can then be designed to reinforce the use of disregarded navigational tools or correct over-reliance on one particular tool, ultimately enhancing decision-making.
For instance, if a participant is found to over-rely on ECDIS during watchkeeping, training programs can be adapted by limiting the use of ECDIS and encouraging participants to engage with other navigational tools, such as radar or visual observation. On the simulator, scenarios can be intentionally designed where ECDIS is disabled or unavailable, challenging the participant to rely on alternative tools. These adjustments ensure that seafarers improve their cognitive flexibility and better balance their use of available navigational aids, which is crucial for effective decision-making and maritime safety.
Additionally, through ETT, it can be observed whether participants are disregarding key instruments such as the rate of turn (ROT) and helm indicators during course alterations. These instruments are critical for maintaining proper control of the vessel, especially in narrow channels or high-risk environments. If participants consistently fail to monitor these indicators, trainers can design exercises that focus on reinforcing the importance of these instruments. For example, controlled errors can be introduced, such as giving a command to the rudder that doesn’t match the helm indicator, and observing when the participant notices the issue. By creating these controlled mistakes during the training, trainers can assess whether the participant’s situational awareness and reaction time improve, which is essential for preventing accidents on the bridge.
Furthermore, ETT can reveal whether participants fail to adjust key radar controls, such as gain or anti-clutter settings, that are essential for maintaining radar accuracy under varying environmental conditions. If participants overlook making these adjustments, training can focus on addressing this behavior, incorporating exercises that emphasize the importance of regularly monitoring radar settings during dynamic situations. It is common for seafarers to overlook adjusting these controls during long watches, which is why emphasizing this aspect can reduce errors and improve radar reliability, particularly in changing weather or sea conditions.
This personalized approach to training can be particularly beneficial in courses such as bridge resource management (BRM), COLREG application, and ship handling, where decision-making and SA are critical to ensuring safety and efficiency on the bridge.
By highlighting these findings and incorporating ETT into training programs, maritime education can be better aligned with the realities of bridge operations. This approach will help seafarers develop the necessary skills to maintain effective SA and improve decision-making processes. It ensures that training is not only about becoming an expert in using specific tools but also about integrating them in a way that supports safer and more effective navigation.
The findings also have implications for bridge ergonomics. If participants consistently overlook certain instruments, such as the ROT indicator, it may indicate design flaws or poor instrument placement. Combining ETT data with participant feedback could inform improvements in bridge ergonomics, ensuring that navigational tools are effectively positioned for optimal use.
Additionally, the data on participants’ gaze outside of AOIs offer valuable insights into the time spent disengaged from critical navigational tasks. Although these data were not directly linked to the main objectives of this study, they highlight the potential impact of distractions on situational awareness. The observed range of time spent outside AOIs varied significantly, from 8.92% to 26.67%, indicating how often participants were not focused on relevant navigational tools or lookout duties. This finding further supports the need for continuous focus and self-awareness during maritime operations, especially when performing complex tasks such as navigation and collision avoidance. These additional data provide a more holistic understanding of factors affecting situational awareness and can be used to enhance future training programs aimed at improving focus and reducing errors.
Despite the advantages, the use of ETT in dynamic maritime environments presents challenges, such as the influence of external factors, including the movement of participants within a simulator, room lighting, and individual behaviors, which may affect data accuracy [41]. Nevertheless, ETT remains a valuable tool for analyzing real-time performance during maritime simulations.
In conclusion, this study successfully demonstrated the utility of ETT in assessing discrepancies between seafarers’ perceived and actual navigational performance. The findings confirm that ETT can reveal significant differences between how seafarers believe they allocate attention and their actual gaze patterns. When used in conjunction with software like Tobii Pro Lab, ETT offers a powerful tool for analyzing navigational behavior based on demographic factors such as maritime experience.
Future research could explore other demographic variables, such as age, gender, maritime sector (e.g., tanker, bulk, container, etc.), rank, and education, to better understand how these factors impact navigational performance. In addition to analyzing demographic groups, future studies could also examine the remaining three scenarios outlined in the methodology chapter. Investigating these additional scenarios may reveal whether discrepancies between perceived and actual performance are more pronounced in different circumstances. This study lays the foundation for improving SA in maritime operations and enhancing safety by refining ETT applications and tailoring training programs to different demographic groups. Future research should also evaluate the efficacy of targeted training interventions to reduce discrepancies between perceived and actual performance, ultimately improving navigational safety and reducing human error in maritime decision-making.
Author Contributions
Conceptualization, I.P. and S.V.; methodology, I.P. and S.V. software, I.P.; validation, I.P.; formal analysis, I.P.; investigation, I.P.; resources, I.P.; data curation, I.P.; writing—original draft preparation, I.P.; writing—review and editing, I.P. and S.V.; visualization, I.P. and S.V.; supervision, S.V.; project administration, I.P.; funding acquisition, I.P. All authors have read and agreed to the published version of the manuscript.
Funding
This research received no external funding.
Institutional Review Board Statement
Not applicable.
Informed Consent Statement
Not applicable.
Data Availability Statement
The datasets used and analyzed during the current study are available from the corresponding author upon reasonable request.
Acknowledgments
This research was supported by the Center for Research, Innovation and Entrepreneurship of the Faculty of Maritime Studies Kotor, University of Montenegro, which provided the Tobii Pro Glasses 3 and Tobii Pro Lab software used in the study. These resources were obtained through funding from Erasmus+ BLUEWBC. Additionally, the research was conducted using the Transas Full Mission Bridge Simulator made available by the Faculty of Maritime Studies Kotor, University of Montenegro. We would like to express our gratitude for their valuable support.
Conflicts of Interest
The authors declare no conflicts of interest.
Abbreviations
The following abbreviations are used in this manuscript:
| ETT | Eye-tracking technology |
| OOW | Officer of the watch |
| ECDIS | Electronic Chart Display and Information System |
| Radar | Radio detection and ranging |
| ARPA | Automatic radar plotting aid |
| SA | Situational awareness |
| AOI | Area of interest |
| STCW Convention | International Convention on Standards of Training, Certification and Watchkeeping for Seafarers, 1978 |
| EMSA | European Maritime Safety Agency |
| OCIMF | Oil Companies International Marine Forum |
| ICS | International Chamber of Shipping |
| BCAV | Behavioural competency assessment and verification for vessel operators guidelines |
| UKC | Under-keel clearance |
| CPA | Closest point of approach |
| TCPA | Time to closest point of approach |
| VRM | Variable range marker |
| EBL | Electronic bearing line |
| P.I. | Parallel indexing |
| ROT | Rate of turn |
| A/C Sea | Anti-clutter sea |
| A/C Rain | Anti-clutter rain |
| AIS | Automatic Identification System |
References
- IMO STCW. International Convention on Standards of Training, Certification and Watchkeeping for Seafarers, 2017th ed.; IMO: London, UK, 2017. [Google Scholar]
- EMSA. Annual Overview of Marine Casualties and Incidents 2022; European Maritime Safety Agency: Lisbon, Portugal, 2022. [Google Scholar]
- Sánchez-Beaskoetxea, J.; Basterretxea-Iribar, I.; Sotés, I.; de las Mercedes Maruri Machado, M. Human error in marine accidents: Is the crew normally to blame? Marit. Transp. Res. 2021, 2, 100016. [Google Scholar] [CrossRef]
- Lu, W. Analysis of Human Factors in Ship Collisions Based on Accident Investigation Reports. Master’s Thesis, World Maritime University, Dalian, China, 2021. [Google Scholar]
- Hasanspahić, N.; Vujičić, S.; Frančić, V.; Čampara, L. The Role of the Human Factor in Marine Accidents. J. Mar. Sci. Eng. 2021, 9, 261. [Google Scholar] [CrossRef]
- Anderson, L.W.; Krathwohl, D.R. A Taxonomy for Learning, Teaching and Assesing, A Revision of Bloom’s Taxonomy of Educational Objectives; Addison Wesley Longman: Boston, MA, USA, 2001; ISBN 0-8013-1903-X. [Google Scholar]
- OCIMF. INTERTANKO Behavioural Competency Assessment and Verification for Vessel Operators; OCIMF: London, UK, 2018. [Google Scholar]
- Gregory, D.; Shanahan, P.; Maritime and Coastguard Agency (Great Britain). The Human Element: A Guide to Human Behaviour in the Shipping Industry; TSO for the Maritime and Coastguard Agency: Southampton, UK, 2010; ISBN 978-0-11-553120-0.
- Endsley, M.R. Toward a Theory of Situation Awareness in Dynamic Systems. Hum. Factors J. Hum. Factors Ergon. Soc. 1995, 37, 32–64. [Google Scholar] [CrossRef]
- Maljković, M.; Vukša, S.; Vidan, P.; Meštrović, T. Situational Awareness from the Master Point of View and Importance of Factors That Influence it. In Proceedings of the 20th International Conference on Transport Science (ICTS), Portorož, Slovenia, 23–24 May 2022. [Google Scholar]
- Jaram, H.; Vidan, P.; Vukša, S.; Pavić, I. Situational Awareness—Key Safety Factor For The Officer Of The Watch. Pedagog.-Pedagogy 2021, 93, 225–240. [Google Scholar] [CrossRef]
- Melnyk, O.; Bychkovsky, Y.; Voloshyn, A. Maritime situational awareness as a key measure for safe ship operation. Sci. J. Silesian Univ. Technol. Ser. Transp. 2022, 114, 91–101. [Google Scholar] [CrossRef]
- Gommosani, M.; Turan, O.; Kurt, R. Analysis of maritime accidents due to poor situational awareness. In Proceedings of the 1st International Conference on the Stability and Safety of Ships and Ocean Vehicles, Glasgow, UK, 7–11 June 2021. [Google Scholar]
- Vojkovic, L.; Skelin, A.; Mohović, Đ.; Zec, D. The Development of a Bayesian Network Framework with Model Validation for Maritime Accident Risk Factor Assessment. Appl. Sci. 2021, 11, 10866. [Google Scholar] [CrossRef]
- Kaptan, M.; Uğurlu, Ö.; Wang, J. The effect of nonconformities encountered in the use of technology on the occurrence of collision, contact and grounding accidents. Reliab. Eng. Syst. Saf. 2021, 215, 107886. [Google Scholar] [CrossRef]
- Skvarekova, I.; Skultety, F. Objective Measurement of Pilot’s Attention Using Eye Track Technology during IFR Flights. Transp. Res. Procedia 2019, 40, 1555–1562. [Google Scholar] [CrossRef]
- Martinez-Marquez, D.; Pingali, S.; Panuwatwanich, K.; Stewart, R.A.; Mohamed, S. Application of Eye Tracking Technology in Aviation, Maritime, and Construction Industries: A Systematic Review. Sensors 2021, 21, 4289. [Google Scholar] [CrossRef] [PubMed]
- Hareide, O.S.; Ostnes, R. Maritime Usability Study by Analysing Eye Tracking Data. J. Navig. 2017, 70, 927–943. [Google Scholar] [CrossRef]
- Hareide, O.S.; Ostnes, R. Validation of a Maritime Usability Study with Eye Tracking Data. In Augmented Cognition: Users and Contexts; Schmorrow, D.D., Fidopiastis, C.M., Eds.; Lecture Notes in Computer Science; Springer International Publishing: Cham, Switzerland, 2018; Volume 10916, pp. 273–292. ISBN 978-3-319-91466-4. [Google Scholar]
- Hareide, O.S. The use of Eye Tracking Technology in Maritime HighSpeed Craft Navigation. Ph.D. Thesis, Norwegian University of Science and Technology, Trondheim, Norway, 2019. [Google Scholar]
- Uflaz, E.; Bantan, H.F.; Black, H.; Arslan, O.; Akyuz, E.; Turan, O. Concepts and Applications of Eye Tracking Technology in Maritime Shipboard Operation with Pilot Case Study. In Proceedings of the International Association of Maritime Universities Conference, Helsinki, Finland, 19 October 2023. [Google Scholar]
- Atik, O.; Arslan, Ö. Use of Eye Tracking for Assessment of Electronic Navigation Competency in Maritime Training. J. Eye Mov. Res. 2019, 12, 2. [Google Scholar] [CrossRef] [PubMed]
- Arslan, O.; Atik, O.; Kahraman, S. Eye tracking in usability of electronic chart display and information system. J. Navig. 2021, 74, 594–604. [Google Scholar] [CrossRef]
- Petrović, I.; Nikčević, J.; Kapetanović, V.; Dlabač, T. Seafarers’ education and training in practice: Montenegrin experience. In Proceedings of the Book of Abstracts, Dubrovnik, Croatia, 14 September 2023. [Google Scholar]
- Kemp, J. Behaviour Patterns in Crossing Situations. J. Navig. 2009, 62, 443–453. [Google Scholar] [CrossRef]
- Vujičić, S.; Mohović, Đ.; Mohović, R. A Model of Determining the Closest Point of Approach Between Ships on the Open Sea. PROMET-Traffic Transp. 2017, 29, 225–232. [Google Scholar] [CrossRef]
- Brcko, T.; Androjna, A.; Srše, J.; Boć, R. Vessel Multi-Parametric Collision Avoidance Decision Model: Fuzzy Approach. J. Mar. Sci. Eng. 2021, 9, 49. [Google Scholar] [CrossRef]
- Mohovic, D.; Mohovic, R.; Suljic, M.; Njegovan, M. Reducing the risk of collision between ships in a close-quarters situation by simulating collision avoidance actions. J. Navig. 2021, 74, 558–573. [Google Scholar] [CrossRef]
- Ni, S.; Liu, Z.; Cai, Y. Ship Manoeuvrability-Based Simulation for Ship Navigation in Collision Situations. J. Mar. Sci. Eng. 2019, 7, 90. [Google Scholar] [CrossRef]
- Wang, X.; Liu, Z.; Cai, Y. The ship maneuverability based collision avoidance dynamic support system in close-quarters situation. Ocean Eng. 2017, 146, 486–497. [Google Scholar] [CrossRef]
- Maglić, L.; Zec, D. The Impact of Bridge Alerts on Navigating Officers. J. Navig. 2020, 73, 421–432. [Google Scholar] [CrossRef]
- Tobii AB. Tobii Pro Glass 3, User Manual; Tobii AB: Danderyd Municipality, Sweden, 2023. [Google Scholar]
- Kobayashi, H. Use of simulators in assessment, learning and teaching of mariners. WMU J. Marit. Aff. 2005, 4, 57–75. [Google Scholar] [CrossRef]
- Žagar, D.; Svetina, M.; Perkovic, M.; Dimc, F.; Kosir, A.; Brcko Satler, T. Analysis of Marine-Pilot Biometric Data Recordings during Port-Approach Using a Full-Mission Simulator. Sensors 2022, 22, 2701. [Google Scholar] [CrossRef] [PubMed]
- International Chamber of Shipping. ICS Bridge Procedures Guide, 6th ed.; International Chamber of Shipping: London, UK, 2022. [Google Scholar]
- Tobii AB. Tobii Pro Lab, User Manual; Tobii AB: Danderyd Municipality, Sweden, 2023. [Google Scholar]
- Dominguez-Péry, C.; Tassabehji, R.; Corset, F.; Chreim, Z. A holistic view of maritime navigation accidents and risk indicators: Examining IMO reports from 2011 to 2021. J. Shipp. Trade 2023, 8, 11. [Google Scholar] [CrossRef]
- Cordon, J.R.; Mestre, J.M.; Walliser, J. Human factors in seafaring: The role of situation awareness. Saf. Sci. 2017, 93, 256–265. [Google Scholar] [CrossRef]
- Saray, S.; Satir, T.; Dogan-Saglamtimur, N. Proficiency of Maritime English course: An investigation in Istanbul, Turkey. Herit. Sustain. Dev. 2021, 3, 6–15. [Google Scholar] [CrossRef]
- Gelcich, S.; Edwards-Jones, G.; Kaiser, M.J. Importance of Attitudinal Differences among Artisanal Fishers toward Co-Management and Conservation of Marine Resources. Conserv. Biol. 2005, 19, 865–875. [Google Scholar] [CrossRef]
- Petrović, I.; Vujičić, S. Overcoming Challenges in Using Eye-Tracking Technology in a Dynamic Nautical Simulation Environment. In Proceedings of the Book of Abstracts 4th Kotor International Maritime Conference, Kotor, Montenegro, 27 November 2024. [Google Scholar]


Disclaimer/Publisher’s Note: The statements, opinions and data contained in all publications are solely those of the individual author(s) and contributor(s) and not of MDPI and/or the editor(s). MDPI and/or the editor(s) disclaim responsibility for any injury to people or property resulting from any ideas, methods, instructions or products referred to in the content. |
© 2025 by the authors. Licensee MDPI, Basel, Switzerland. This article is an open access article distributed under the terms and conditions of the Creative Commons Attribution (CC BY) license (https://creativecommons.org/licenses/by/4.0/).