Article

Airflow Dynamics, Sediment Transport, and Morphological Change on a Low-Relief Dune Under Offshore Wind Forcing

Centre de Formation et de Recherche sur les Environnements Méditerranéens, UMR CNRS 5110, Université de Perpignan Via-Domitia, 66100 Perpignan, France
*
Author to whom correspondence should be addressed.
J. Mar. Sci. Eng. 2025, 13(12), 2235; https://doi.org/10.3390/jmse13122235
Submission received: 30 October 2025 / Revised: 20 November 2025 / Accepted: 22 November 2025 / Published: 24 November 2025
(This article belongs to the Special Issue Advances in Coastal Dune and Aeolian Processes Research)

Abstract

Dunes are key geomorphological features controlling airflow and sediment transport. While these processes are well documented under onshore conditions, this study provides the first high-resolution spatial analysis of dune-beach dynamics under offshore winds, integrating wind flow, sediment transport, and topographic data. The investigated site is a low-elevation (<1 m) dune typical of Mediterranean coasts, characterized by a mixed sand–gravel patch and a distinct beach slope break. Results show that dune height strongly controls the magnitude of airflow adjustment. Directional deflections and accelerations remain limited (<15° and <40%, respectively), and the sheltered zone extends only to the downwind dune toe. During strong wind events (gusts > 50%), sediment transport initiates immediately beyond the crest, feeding offshore-directed fluxes. Under weaker winds (gusts < 20%), enhanced surface roughness from the mixed sand–gravel patch and flow stagnation at the slope break shift the active transport zone toward the lower beach, where the most pronounced morphological changes occur. These findings demonstrate that small dunes provide limited aerodynamic shelter and fail to prevent sediment export under offshore winds. They highlight the need to incorporate additional factors (e.g., microtopography, surface properties) when assessing sediment budgets and the long-term evolution of low-relief coastal systems.

1. Introduction

Since the late 20th century, coastal zones have emerged as some of the most critical and densely occupied environments on Earth, currently hosting 23% of the global population [1]. Along these dynamic margins, coastal dune systems stand as key geomorphological features that modulate the interaction between marine processes and terrestrial landscapes. They act as natural buffers against erosion and marine flooding [2,3], yet this protective function is increasingly under threat. Over the past four decades, storm wave energy has intensified in the western Mediterranean Sea [4], while, along the North Atlantic coast, increases in significant wave height (Hs) and alternating climatic phases have driven severe storms, widespread coastal erosion and flooding [5,6]. These trends are further compounded by intense anthropogenic modification and sustained tourism pressure, exacerbating the vulnerability of dune systems [7,8,9]. These changes highlight the urgent need to better understand the processes and feedback that control dune behavior across a range of settings. Global drivers (hydrodynamics, wind) interact with local factors (dune morphology, vegetation, sediment grain size) through intricate feedback that remains challenging to disentangle [10].
Hydrodynamic processes shape the dune-beach profile either daily or episodically during storms, whereas wind plays a dominant role in the sediment budget of sandy coasts and exerts strong control on dune orientation and evolution [11,12,13,14,15]. Flat beach surfaces tend to promote stable airflow across a wide range of conditions, whereas dunes modify flow structure depending on the incident wind angle [16]. Under perpendicular winds, flow decelerates sharply at the dune toe due to pressure buildup [11,17], generating turbulence and roller vortices [18]. Over the stoss slope, streamline compression produces acceleration that may evolve into jet flows [19,20] that peak at the crest [17]. On the lee slope, the abrupt slope change induces flow separation and a marked velocity reduction [21]. As wind obliquity increases, deceleration at the dune toe becomes less pronounced [16]. Roller vortices are progressively replaced by helicoidal vortices with strong alongshore components [11,18,20]. Similar vortices can also develop at the dune crest on steep stoss slopes, where abrupt slope changes inhibit acceleration and promote flow separation [22,23]. In contrast, on gentle stoss slopes, flow tends to realign towards a more perpendicular orientation [11,24,25]. Jet development is delayed and eventually suppressed at high obliquities (>50°) [19]. Consequently, crest velocities remain much lower than under perpendicular flow. Nevertheless, topographic steering toward dune-normal flow along the stoss slope can still promote jet formation at high obliquity [19]. On the lee slope, flow separation weakens or vanishes, and velocities remain relatively stable [16]. Similar patterns have been reported at Leucate beach (SE, France) under perpendicular offshore winds (0–20°), where helicoidal vortices are progressively replaced by simple flow deflection as obliquity increases [7].
These airflow mechanisms exert direct control on sediment transport and morphological change. Transport typically initiates on the berm and progresses landward. Deceleration at the dune toe produces a pronounced deposition zone, particularly under perpendicular winds [11,16,17], whereas oblique winds enhance alongshore sediment transport through helicoidal vortices [11,18,20]. Acceleration over the stoss slope drives peak transport rates at the crest [17], but topographic steering decouples beach and dune transport pathways, limiting sediment delivery to the dune [11]. This limitation is particularly constrained on steep dunes, where dune cliffs disrupt airflow continuity and inhibit landward sediment transfer [23]. On the lee slope, flow separation further constrains transport over distances up to 25 dune heights before reattachment [26,27]. Under perpendicular offshore winds, separation drives landward transport to the dune toe, whereas oblique offshore winds enhance alongshore fluxes [28,29]. This mechanism plays a crucial role in modulating sediment budget and reducing offshore sediment losses. Downwind of flow separation, transport rates can increase by one to two orders of magnitude between the dune toe and the berm, where they typically peak [29].
Most previous investigations have focused on dune dynamics under onshore wind conditions, whereas offshore wind processes remain comparatively unexplored. Dunes are widely recognized as the primary topographic feature disrupting wind flow and sediment transport, yet only a handful of studies have considered these processes and topographic responses over low-elevation dunes (<2.5 m), where other factors may exert a stronger influence on airflow [7,9,30]. This study aims to address this gap by investigating a low-elevation (<1 m) French Mediterranean dune (southern France). We examine how dune morphology, surface roughness, mixed sand-gravel patches, and slope variations interact with offshore winds to influence airflow patterns and sediment transport and how these processes in turn shape beach-dune morphology. The analysis is based on two days of intensive field measurements conducted during offshore wind conditions, combining high-resolution wind and sediment transport data, complemented by detailed topographic and granulometric surveys.

2. Materials and Methods

2.1. Field Site

The study was carried out at Barcarès Beach, located along the southern margin of the Gulf of Lion on the French Mediterranean coast (Figure 1A). This is a microtidal, wave-dominated environment characterized by a very low tidal range (<0.30 m during spring tides). Significant wave height (Hs) is typically low (Hs < 0.3 m for 75% of the time and Hs < 1.5 m for 94% of the time), although storm surge can raise water levels by about 1 m [31]. Only extreme meteorological marine storms are capable of reshaping the coastline [32]. The alternation of infrequent high-energy events with prolonged quiescent periods, combined with the low tidal range, promotes relatively stable emerged beaches [33]. Although many dunes along the Gulf of Lion have been modified or initiated through human activities [7,9], the dune investigated here formed and evolved with minimal anthropogenic influence. In this setting, dune dynamics are strongly driven by aeolian forcing. Wind records by the public Météo-France meteorological station on Cape Leucate, located 11 km north of the study site, highlight two dominant wind directions (Figure 1B). Offshore (NW) winds prevail, occurring 61.6% of the time, with 22.7% of events reaching speeds ≥ 10 m/s. These winds are dry, cold and gusty, with winter gusts reaching up to 30 m/s. In contrast, onshore (SE) winds are less frequent (19.6% of the time) and typically associated with higher humidity. This decoupling between hydrodynamic and aeolian processes affects the surface sediment characteristics: finer sands tend to prevail after a marine storm, whereas prolonged wind periods favor coarser surface textures [34].
The dune-beach system at Barcarès consists of a narrow, low-relief foredune fronting a 28 m wide beach (Figure 1D). The back-dune area, around 300 m wide, is crossed by a road with dense vegetation on its landward side, becoming sparse toward the dune. It is dominated by Elymus farctus and Cakile maritima with invasive species, such as Carpobrotus. The dune itself is poorly developed, a common feature in this region. It comprises two low crests, reaching a maximum height of 0.63 m above the dune toe across a width of 20 m, and is almost devoid of vegetation. A slope break occurs, approximately 6 m seaward of the dune toe, from which the beach surface rises at 4.4° toward the berm.

2.2. Wind Flow

Wind flow was monitored continuously over a 24 h period (11 January 2025, 1:00 p.m. to 12 January 2025, 1:00 p.m.) during a strong offshore wind event. Wind speed and direction were recorded at 1 Hz using 28 two-dimensional ultrasonic anemometers (GILL WindSonic 4) that were deployed along a cross-shore transect (stations a to i) (Figure 1C). Instruments were oriented to magnetic north (±2°) and had a measurement range of 0–60 m/s with ±2% accuracy. Anemometers were placed at heights of 0.04 m to 2.0 m above the surface. A reference station was installed at 4.5 m height, 17 m landward of station a. Wind speed was calculated from the west–east (u) and the north–south (v) components,
Wind   speed = u 2 + v 2 ,
and wind derivation from the trigonometric function atan2, which computes the angle in radians between the two vectors u and v within the range [−π, π]:
Wind   direction   =   a t a n 2 u , v . 180 π + 180
Wind directions were then converted to obliquity with respect to the dune orientation (4°) and averaged over one minute. Only data collected under stable flow conditions at the reference station (SD < 10.5°) were retained [35]. Wind records were classified into three groups based on relative incidence: (i) perpendicular (<20°), (ii) north oblique, and (iii) strong north oblique (>55°) [7,36]. Wind speeds were normalized (NWS) following
NWS ( t , z ) = U ( t , z ) U r e f ( t , Z ) ,
where U(t,z) is wind speed (m/s) at time t and height z and Uref(t,Z) is wind speed (m/s) at the reference station at height Z.
To assess flow stability, the standard deviation of wind direction (SD) and the coefficient of variation (CV) for wind speed were calculated [35,37]. Analysis was based on median values computed for each obliquity class and parameter (obliquity, NWS, CV, and SD) during 22 min for perpendicular winds, 220 min for north oblique winds, and 18 min for strong north oblique winds.

2.3. Sediment Transport

Sediment fluxes were measured using four to seven traps along the transect (d to j) and sampled at 15 min intervals during 9 measurement runs (Figure 1C and Figure 2). Each trap was composed of 12 self-orienting traps mounted vertically on a pivoting pole, modified from the Hilton design [38]. Each trap was built from PVC tubes (38 × 38 mm). The lowest trap was split into two smaller tubes (38 × 20 mm) to improve near-surface resolution. Details of construction are provided in [34]. Sand fluxes (kg/m2/h) were calculated for each trap and integrated over the vertical profile to obtain the total flux (kg/m/h):
Qtot   =   0 + a e b z . d z
where a and b are the regression coefficients.

2.4. Sedimentological Data

Surface sand samples were collected four times during the campaign: twice at the beginning and end of the monitoring period (11 January 2025, 1:00 p.m. and 12 January 2025, 1:00 p.m.) and twice at intermediate stages (11 January 2025, 5:30 p.m. and 12 January 2025, 8:30 p.m.) (Figure 2). Each time, approximately 200 g of sediment was collected at each station from d to j. In the laboratory, the samples were weighed and then placed in an oven to determine their moisture content. The dry mass was subsequently sieved at 30 s intervals for 15 min. The grain-size distribution was determined from the cumulative weights retained on each sieve, and the median grain size (d50) was calculated for each sample.

2.5. Topographic Change

To monitor short-term morphological changes, a topographic profile was surveyed four times, simultaneously with the surface samples. A kinematic differential global positioning system (Trimble R8s) was used, with an accuracy of ±0.02 m and a spatial resolution of approximately 1.4 m. The overall morphological variation was computed by calculating the difference between the first and the last survey after interpolating the profiles at 0.20 m intervals.

3. Results

3.1. Meteorological Conditions

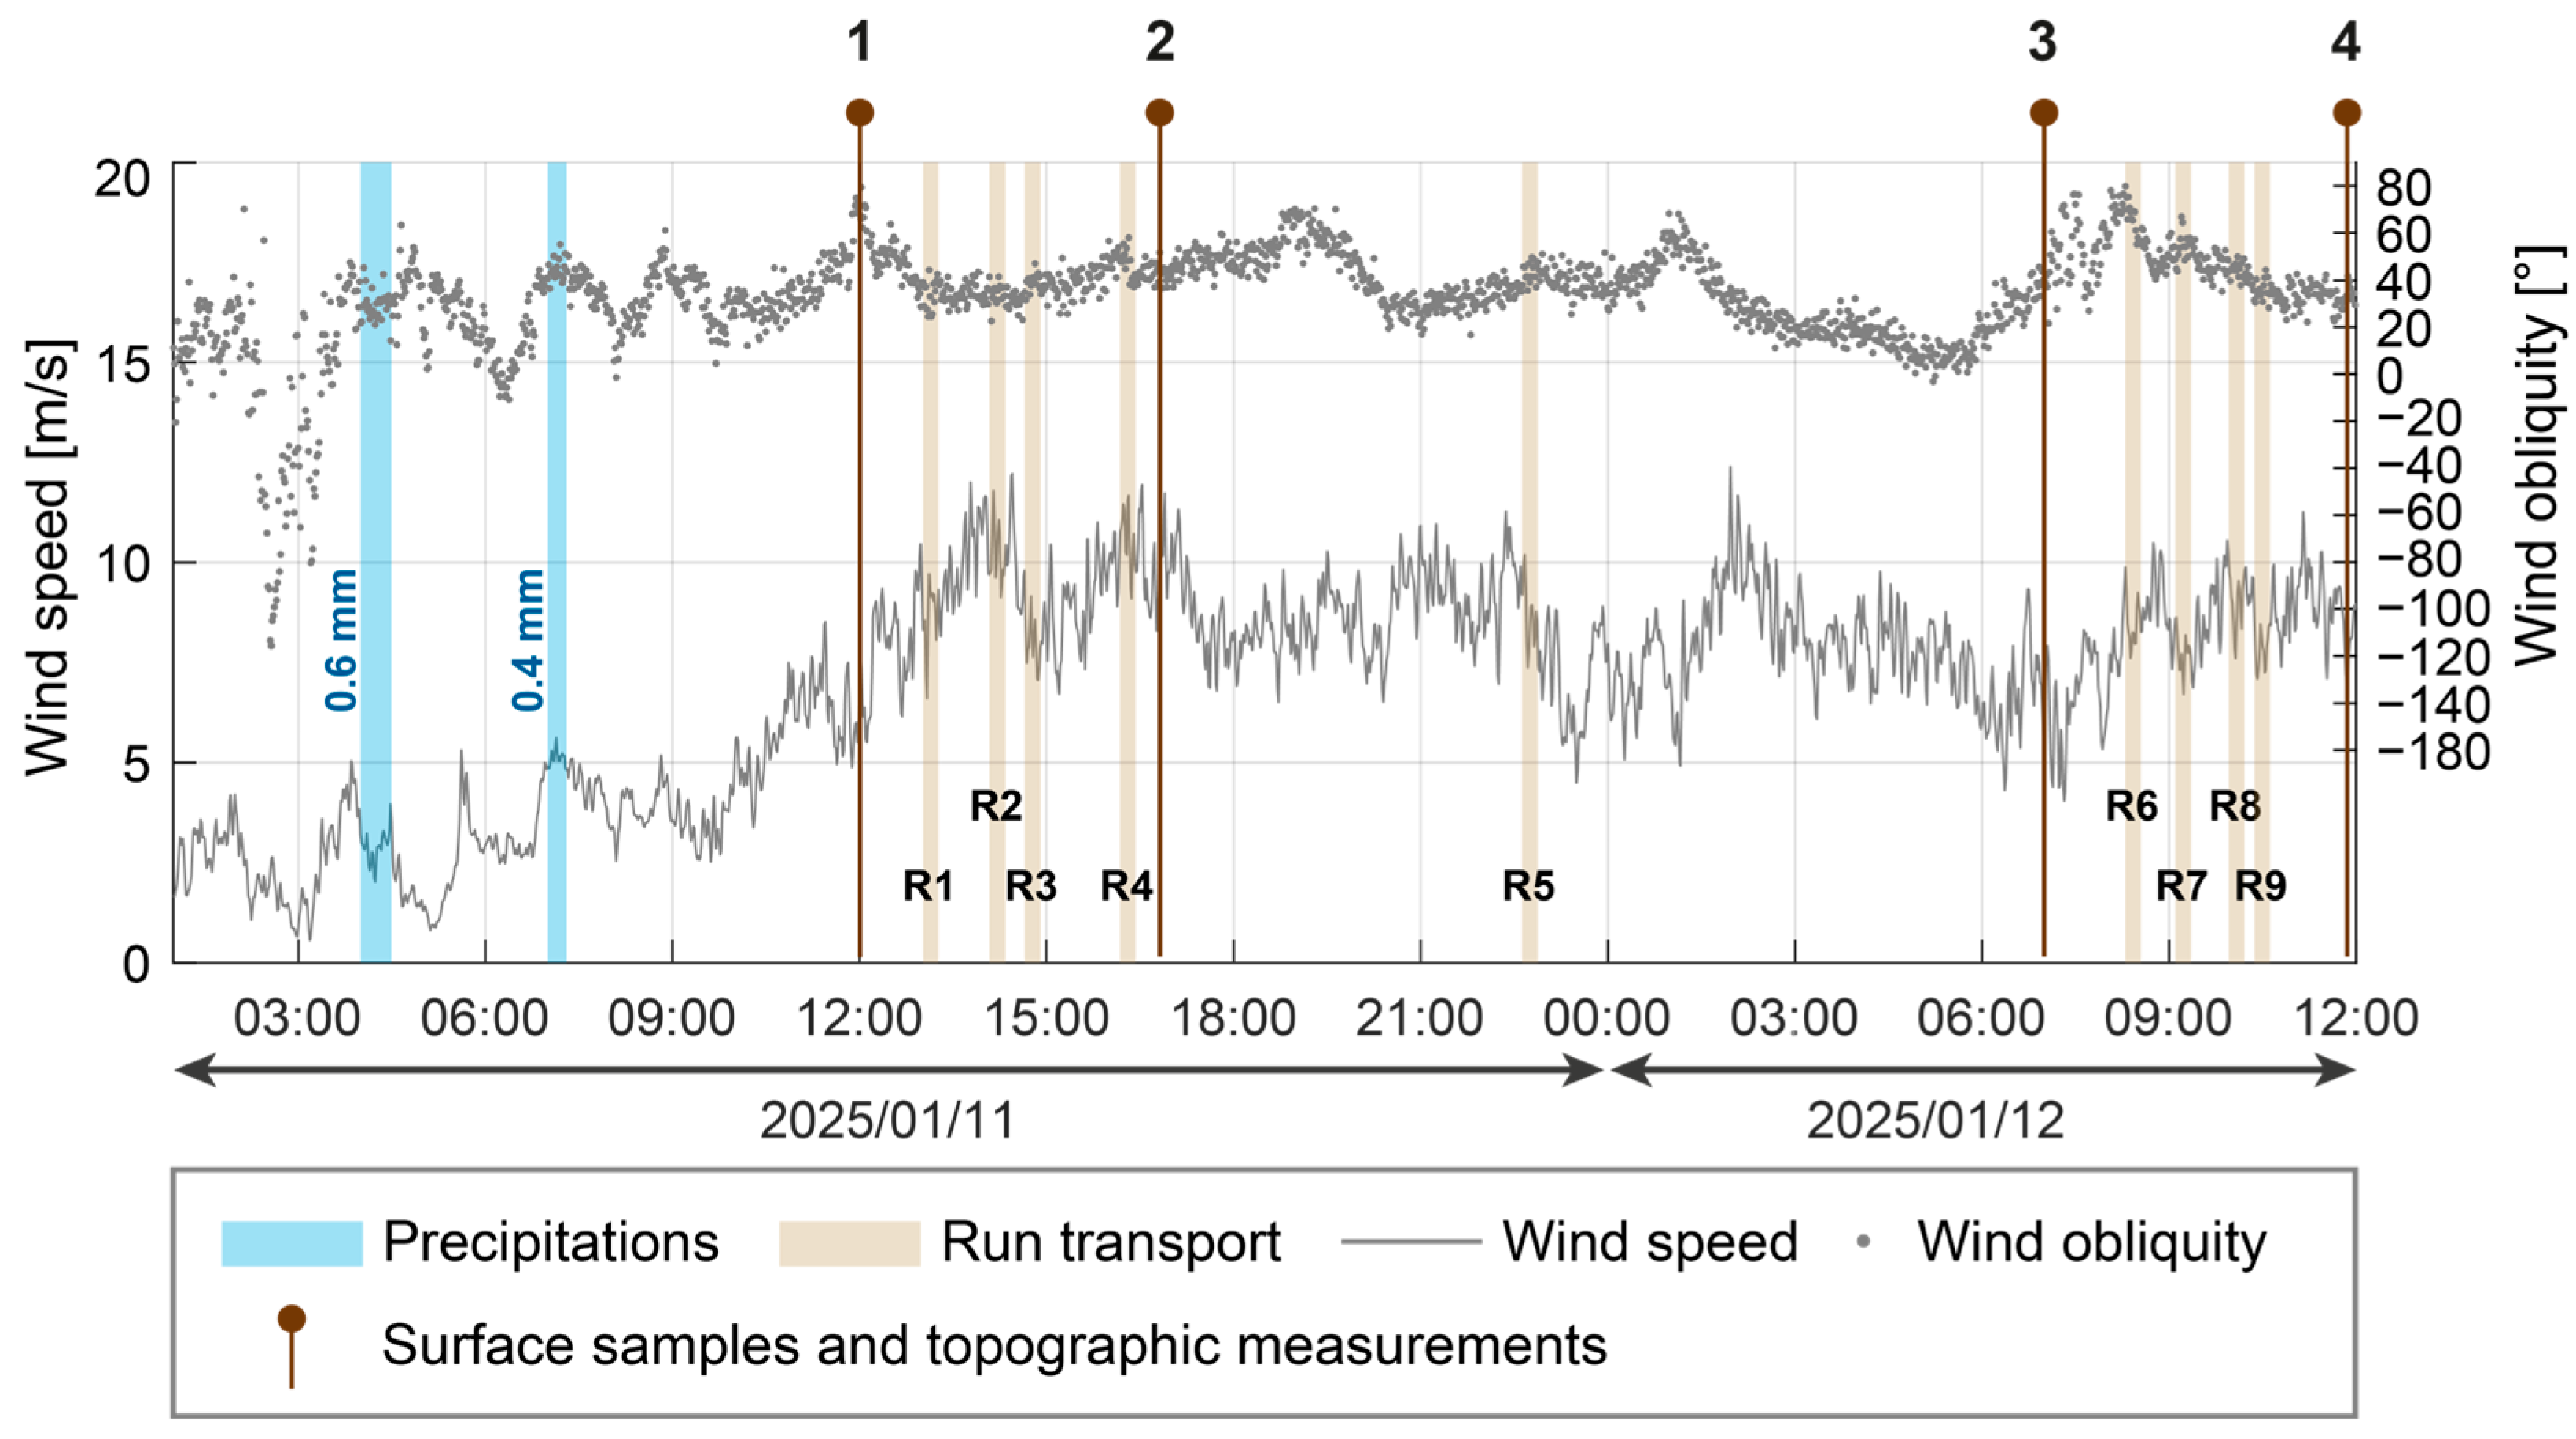
During the 11–12 January 2025 field campaign, winds blew predominantly offshore, with an average obliquity of 25° relative to the dune crest and a mean speed of 6.87 m/s at the reference station (Figure 2). Winds intensified in the morning of 11 January, peaking at 12 m/s 1 h 27 min after the start of measurements (run 2). For the remainder of the campaign, speeds fluctuated around 10 m/s, with two short calm periods near midnight and 6:00 a.m. on 12 January. Minimum obliquity (−3°) occurred during these low-speed periods, while obliquity ranged between 17° and 80° otherwise. The flow conditions were generally turbulent, with SD = 21° and CV = 0.40. Early in the campaign, light rainfall occurred, with 1 mm of cumulative precipitation between 4:00 am and 7:00 am.

3.2. Spatial Structure of Wind Variability

3.2.1. Near-Surface Wind Flow Across the Dune-Beach Profile

Behind the dune (stations a to c), median obliquity values for the three wind patterns remained relatively consistent behind the dune (stations a–c, Figure 3B). From station d onward, however, wind obliquity became the key parameter distinguishing the patterns, particularly between perpendicular and strong north-oblique cases. For the strong north-oblique group (>55°), obliquity increased further at station d, while perpendicular (<20°) and north-oblique (20–55°) values remained close to their upstream values. Downwind of the crest (station e), winds exhibited clear divergence: under strong north-oblique flow, directions were toward the dune normal (−10°), whereas perpendicular winds deflected in the opposite sense. North-oblique values remained essentially unchanged. At station f, located on the upper beach, flow shifted northward most strongly in the oblique cases. Behind the slope transition, station g showed an opposite trend to that of station e: perpendicular winds deflected toward the dune normal (−8°), while north-oblique obliquities remained similar to their upstream values. Downwind beach stations (h and i) generally exhibited more uniform behavior across flow patterns. At station h, winds deflected toward the dune normal, producing obliquities similar to those measured at the system inlet (station a and the reference station). In contrast, station i displayed a slight positive deviation of around +6°, indicating a subtle reorientation of the flow near the berm.
Although SD patterns were broadly similar across wind regimes (Figure 3C), maxima were consistently more pronounced under strong north-oblique conditions. The greatest turbulence was recorded at the upstream dune toe (station c), where SD reached 66° under the strong north-oblique pattern, compared with 17° for the other two. At station d, flow remained turbulent despite a slight SD decrease (around −4°). Stations e and f marked the first zones of directional stabilization along the profile (SD = 10°). Among the post-dune stations, station g was the least stable, with SD = 12° for perpendicular and north-oblique winds, and 44° under the strong north-oblique pattern.
Normalized wind speed (NWS) and its associated stability (CV) exhibited concurrent but opposite trends and are therefore described together (Figure 3D,E). As the flow crossed the back dune, it weakened and became increasingly turbulent, reaching a minimum at station c (NWS = 0.46; CV = 0.32), particularly under the strong north-oblique flow pattern. Station d recorded the highest accelerations along the profile, with increases of +37% for the perpendicular and +28% for the strong north-oblique flow patterns. At station e, wind speed decreased for the perpendicular group but increased for the two oblique cases. All three patterns exhibited marked re-acceleration at station f, with velocities similar to those at station d. This acceleration was interrupted at stations g and h for the perpendicular and north-oblique flows, likely reflecting a stagnation or slight deceleration zone on the mid-beach. From the dune crest down to the berm (station i), wind speeds became progressively more stable, with only stations g and h showing slight increases in turbulence. Station i recorded the lowest variability (CV = 0.22) and exhibited a velocity distribution similar to that at stations d and f, but with the smallest acceleration rates among the three (Figure 3E).
Figure 3. Cross-shore representation (A) of wind obliquity (stations a to i) (B), standard deviation (C), normalized wind speed (D), and coefficient of variation (E) for all stations at 0.30 m. One-minute averaged data and median values for each parameter are shown.
Jmse 13 02235 g003

3.2.2. Vertical Wind Flow Across the Dune-Beach Profile

Vertical arrays of anemometers were deployed at several stations to capture the vertical structure of the flow during crest-crossing and beach winds (Figure 1C). Across all stations, the airflow exhibited systematic vertical deflections toward the dune normal, with deflection magnitude broadly proportional to incident obliquity (e.g., 16–23° at station d; Figure 4). The strongest directional shifts typically occurred close to the surface, below 0.20 m. At crest station d, this pattern was particularly marked under the strong north-oblique flow. In contrast, at stations e and g, vertical trends differed between perpendicular and oblique flow patterns: at station e, perpendicular flow became increasingly oblique above 0.70 m, while other patterns shifted slightly toward the dune normal. At station g, the opposite behavior was observed above 0.30 m, with perpendicular flow maintaining stronger alignment aloft.
Wind directions were generally stable with height, with SD values of 11–12° under most flow patterns, notably at station i (Figure 4). The exception occurred under strong north-oblique flow, when SD values increased sharply with height (up to 46–50°), indicating enhanced turbulence and directional variability throughout the profile. Velocity profiles were typically logarithmic, with normalized wind speeds (NWSs) reaching ~0.75 at 2 m and decreasing around 0.5 near the surface (Figure 4). Clear differences emerged between flow patterns. The strong north-oblique pattern generated the lowest NWS values at crest station d but the highest values at stations g and i, where perpendicular flow was comparatively weaker. Station e displayed a marked departure from a logarithmic shape, with a distinct acceleration near 0.20 m and vertical reversals between flow patterns above and below 1.20 m. Variability (CV) was low throughout the vertical profile, especially at station i, and increased only within the near-surface layer.
Figure 4. Vertical profiles of the four key parameters (obliquity, SD, NWS, CV) relative to the elevation above the surface for the four selected stations (d,e,g,i). They are located at their position along the topographic profile (gray line).
Jmse 13 02235 g004

3.3. Sand Transport Dynamics

Sand transport rates exhibited marked temporal and cross-shore variability, controlled primarily by gust occurrence and mean wind speed. Sediment fluxes measured along the profile are summarized in Figure 5 and ordered by increasing wind speed at the reference station. All runs were conducted under a north-oblique wind regime. Except for run 7, obliquity values remained within a narrow 13° range (26–39°). Mean wind speeds varied between 7.8 and 10.7 m/s, while the proportion of time exceeding 10 m/s differed substantially among runs, from 11.7% (run 7) to 58% (run 4).
Runs 7, 9, 3 and 6, all characterized by gust occurrences below 22%, produced low transport rates, with fluxes < 14 kg/m/h (Figure 5). Under these moderate conditions, transport was initiated only on the lower beach, between stations i and j, where flux gradients exceeded 2 kg/m/h. In contrast, runs 1, 5 and 8, with gust frequencies around 30%, recorded significantly higher transport rates of 27–59 kg/m/h at station j. In these cases, transport initiation shifted upstream to the mid-beach zone (between stations g and h). Notably, despite similar mean wind speeds and gust frequencies, run 5 exhibited nearly twice the transport observed in run 1, reflecting stronger sediment remobilization between stations e and i.
The highest transport rates were measured during runs 2 and 4, both with gust occurrences exceeding 50%. At station j, sediment fluxes exceeded 200 kg/m/h. Transport became significant as early as the dune zone (stations d,e) and peaked on the lower beach (stations h–j), where fluxes increased by 175 kg/m/h (run 2) and 148 kg/m/h (run 4) over a distance of only 11 m. Flux gradients were even steeper across the berm, over just 2.4 m, reaching 100 kg/m/h in run 2 and 60 kg/m/h in run 4. Such sharp gradients delineate zones of intense potential erosion, reflecting strong spatial acceleration of the sand stream and effective sediment focusing toward the swash and shallow subtidal zone.
Figure 5. Overview of sand transport rates (stations d to j) and corresponding wind conditions at the reference station for each experimental run (R1, R2, …).
Jmse 13 02235 g005
Wind speed and gust frequency at 0.30 m correlated strongly with transport, following power-law relationships (R2 = 0.91 at stations i and j; Figure 6). Transport rates increased markedly above threshold values of 6.5 m/s and 5% gust frequency. No clear relationship emerged between SD and transport, although higher fluxes tended to occur under more stable flow (SD < 15°).

3.4. Moisture and Grain Size Evolution

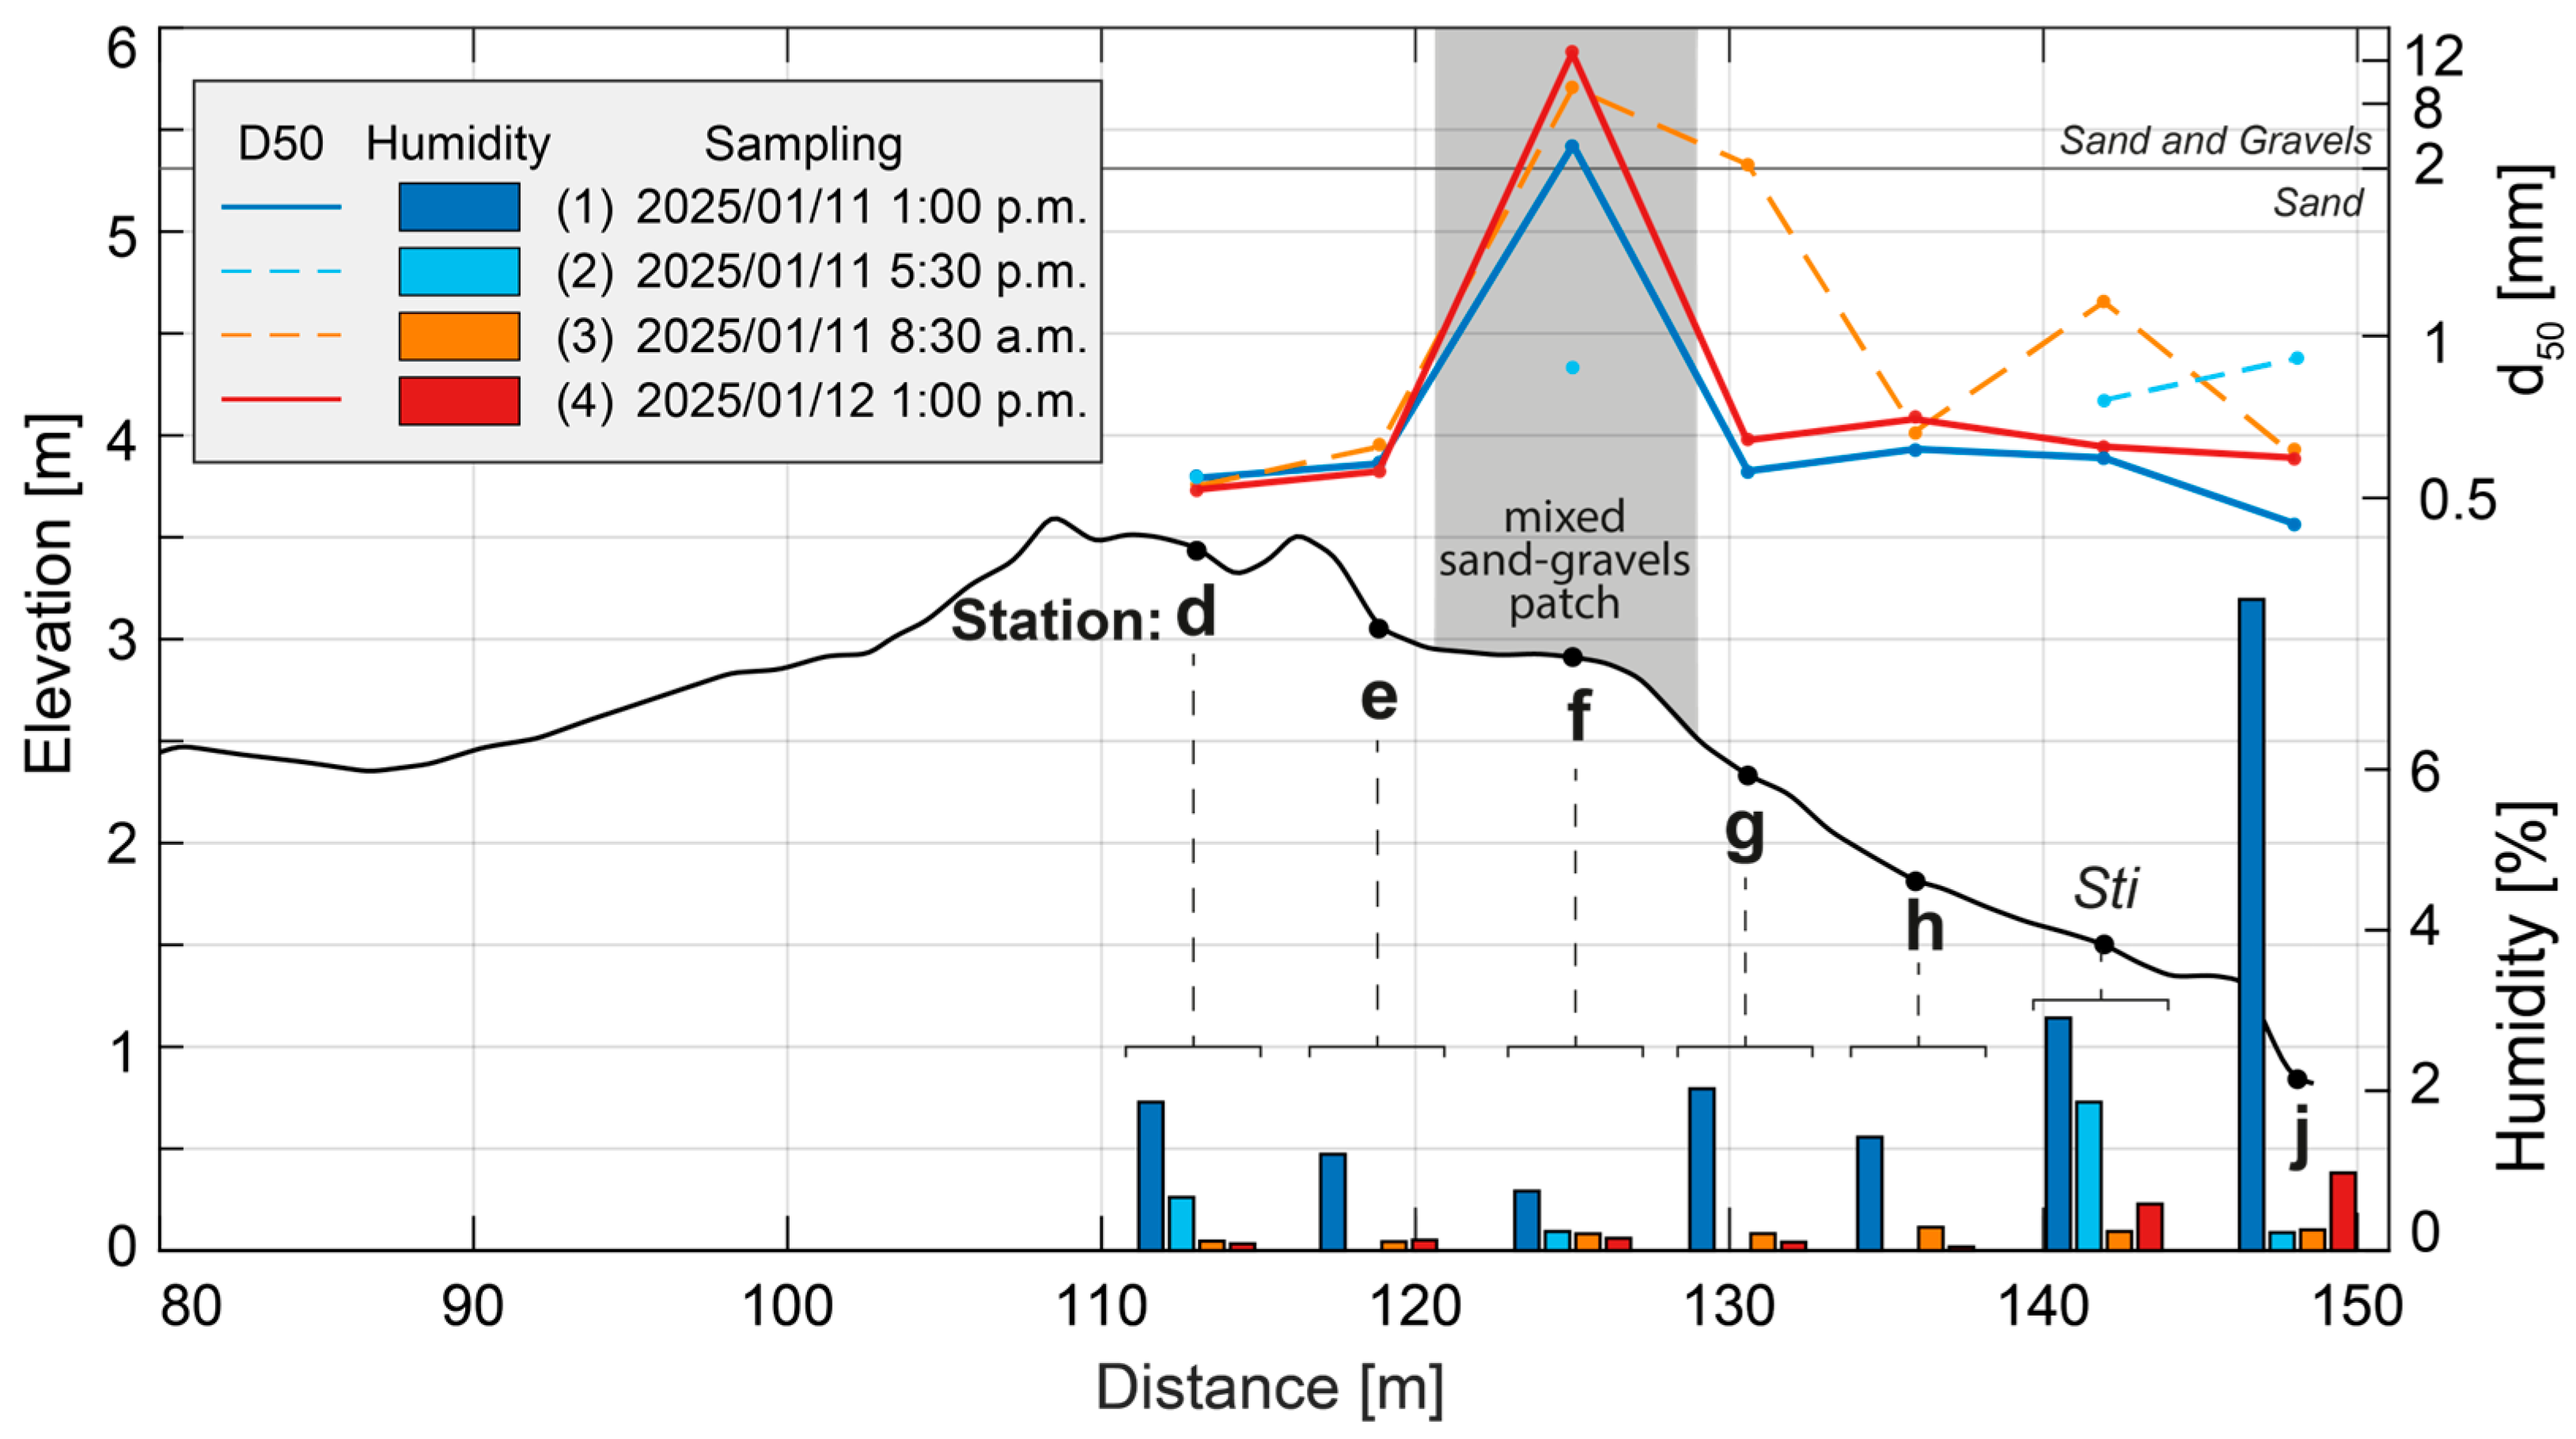
At the start of the campaign (11 January 2025, 1:00 p.m.), median grain size (d50) corresponded to coarse sand (0.61 mm) along most of the profile, including the dune crest (Figure 7). Exceptions were observed: station f, where a mixed coarse sand-gravel patch occurred on the upper beach, and at station j, where medium sand (0.42 mm) dominated the lower beach. Through the campaign, d50 on the dune remained stable. Elsewhere, d50 progressively coarsened, reaching very coarse sand at stations g and i and coarse sand at station j (0.63 mm). At station f, the gravel fraction increased sharply, with d50 rising from 4.18 mm to 9.49 mm. By the end of the campaign (12 January 2025, 8:30 a.m. to 1:00 p.m.), d50 had slightly decreased at stations g and i, returning to coarse sand, remained stable at station j (berm sample), and continued to increase at station f, reaching 12.69 mm.
Initial moisture contents were relatively high (>1.5%) across most stations, peaking at station j (>8%) (Figure 7). Moisture declined rapidly during the first hours of the campaign and, by the second sampling (11 January 2025, 5:30 p.m.), values had dropped markedly. The lowest moisture contents were recorded at the end of the campaign, averaging around 0.1%, except at stations i and j, where moisture rebounded slightly to 1%.

3.5. Beach-Dune Morphological Adjustments

Topographic changes are summarized in Figure 8, highlighting the spatial distribution and magnitude of morphological adjustments across the dune-beach profile during the event. Overall, vertical changes were generally minor (<±0.05 m) along most of the profile, with significant adjustments limited to a few localized sectors, mainly involving crest migration and berm erosion. In the upper dune sector, both crests exhibited similar dynamics, with localized sediment transfers displacing material several meters downwind. This resulted in a seaward migration of the two crests by approximately 0.6 m and 1.7 m, respectively, while overall crest volumes remained essentially unchanged (Zooms 1 and 2). Erosion dominated the mid- to lower beach, with maximum lowering of 0.10 m recorded at the berm crest (Zoom 3). This did not induce any significant crest migration. At the base of the beach face, sediment accumulation in the shallow water zone was of the same order of magnitude as the volume eroded from the berm, indicating efficient nearshore redeposition (Zoom 3).

4. Discussion

4.1. Flow-Form Interactions

Wind flow over dunes has been extensively documented, particularly regarding its role in sediment transport and morphological change. In contrast, offshore flow dynamics remain comparatively underexplored [7,9,22,34,39], and no previous study has focused on a beach-dune system with such a distinctive morphology. The Barcarès site is characterized by a narrow beach and a low, poorly developed foredune, which together generate a set of unique aerodynamic conditions.
Over the back dune, airflow remains closely aligned with incident winds but exhibits reduced near-surface NWS and elevated turbulence levels. Vegetation enhances surface roughness and disrupts the near-surface airflow [40,41]. The greatest velocity reduction (30%) is observed at the dune toe (station c), reflecting the blocking effect of the dune [42,43,44]. As flow ascends the stoss slope, the pressure gradient tightens and wind speeds accelerate, with maximum NWS recorded at the crest (station d) [11,22]. Under perpendicular winds, vertical profiles reveal a jet flow at 0.20 m above the surface, whereas under oblique winds, the acceleration is less pronounced and jet development is inhibited [19]. Observed speed increases of 28% to 37% remain notably lower than the doubling of wind speed predicted in numerical simulations [45]. Their results led to the conclusion that dunes lower than 6 m, such as those at Barcarès, have a limited aerodynamic effect. Vertical wind profiles show maximum flow deflection around 0.20 m toward the crest-normal direction [22]. Deflection angles scale with wind obliquity: the 16–23° measured here are consistent with previous observations showing >30° deflection over high dunes (>7 m) and 15° over low dunes (1–2 m) [46]. Downwind of the crest, airflow adjusts rapidly. Even at the dune toe (station e), flow begins to re-stabilize. In higher and larger dunes, the lee slope is marked by reduced velocity and turbulent eddy recirculation. However, such recirculation requires near-perpendicular winds (<20° obliquity), dune heights >7 m, and sufficiently strong wind speeds [36]. The Barcarès dune is too small to generate separation, though perpendicular winds still cause a measurable NWS decrease, disrupting the logarithmic structure of vertical profiles. Under more oblique wind conditions (north-oblique and strong north-oblique patterns), the dune exerts only a limited influence, producing slight deflections and negligible velocity reductions [7,16]. Consequently, the wake zone is confined only under near-perpendicular winds and remains spatially limited, as flow re-accelerates by station f. Downstream, acceleration usually continues toward the lower beach [7]. At Barcarès, however, this trend is interrupted at station g by a stagnation zone located at the beach slope transition, similar to station e. Both reflect expansion of the pressure gradient, a well-documented process following dune passage [17,18]. Station g is the only post-dune station to exhibit persistent instability, with stagnation effects extending to station h. Only strong north-oblique winds, weakly modulated by topography, show a clear re-acceleration. Maximum acceleration for all wind patterns occurs at station i, where airflow behavior mirrors that observed at stations d and f. Here, vertical profiles return to classical logarithmic shape and deflection angles are minimal (6°), closely aligning incident wind directions [7].
These observations highlight the limited aerodynamic influence of low-relief dunes. At Barcarès, dune sheltering occurs over a narrow range of wind directions and spatial scales. Moreover, the specific beach profile induces a mid-beach stagnation zone, such that stations d, f, and i show comparable acceleration patterns, inversely related to wind obliquity.

4.2. Cross-Shore Variability in Aeolian Transport over Low-Relief Dune-Beach Systems

Wind speed exerts strong control over sand transport at Barcarès, with high and steady winds producing substantial transport rates (Figure 6) [34,47]. Transport activation displays a clear cross-shore spatial variability as wind intensity increases (speed, gust occurrence and NWS) (Figure 3 and Figure 5). Under moderate winds (<8 m/s), transport remains confined to the berm, whereas higher wind speeds (around 10 m/s) shift the active zone landwards to the mid-beach (between stations g and h). During strong wind events (>10 m/s and gust occurrence > 30%), sediment is reactivated across the entire dune-beach profile. This progression reflects both the sectorization of the system according to incident wind velocity and the aerodynamic perturbation induced as flow crosses the dune-beach interface (Figure 3).
Beyond wind velocity, several site-specific factors modulate the temporal and spatial variability of transport rates along the profile:
1.
Station e, located immediately downstream of the crest, records sediment transport during only the strongest wind (>10 m/s at the reference station). Normally, this zone would be sheltered by the dune and stabilized by vegetation [7,48], but at Barcarès, sparse vegetation and the low dune permit entrainment. Transport distances remain limited, with sand redeposited almost immediately on the lee slopes of each crest (stations d and e), without significantly feeding the upper beach (Figure 5 and Figure 8).
2.
Although winds accelerate at station d, sand fluxes are lightly loaded due to the presence of a mixed sand-gravel patch, which limits sediment availability [49]. Under similar wind conditions, aeolian transport can vary by over an order of magnitude depending on grain size [34]. Consequently, the highest fluxes are recorded on the lower beach (stations i and j), where finer coarse sands dominate, and NWS is strongest.
3.
Moisture further constrained transport by increasing inter-grain cohesion. For a grain size of 0.40–0.50 mm, sands are mobilized below 1.29% moisture [50]. This threshold decreases as grain size increases [50]. At Barcarès, antecedent rainfall produced initial moisture above 1.5%, which then decreased rapidly during subsequent runs. This drying explains the differences in transport between runs 1 and 5 despite similar wind conditions. The wind speed-transport relationship weakens significantly under wet sand conditions [51]. Because offshore winds are typically dry, rainfall during these events is uncommon [34].
4.
Progressive coarsening on the beach surface through selective entrainment [34,52] further reduced fluxes in later runs. These site-specific factors explain why the wind speed-transport relationship is strongest on the berm (stations i and j, R2 = 0.91), where sediment availability and aerodynamic conditions are most uniform. In contrast, the dune-mid beach sector (stations g to d) is affected by local controls (sheltering, mixed sand-gravel patches or vegetation) that weaken the overall correlation (R2 = 0.64).
Overall, these results emphasize the combined influence of wind speed, gust occurrence, sediment characteristics and moisture on cross-shore transport variability. While the underlying physical relationships are well established, the low-relief dune-beach configuration at Barcarès produces atypical transport dynamics: the dune acts as a temporary sediment source during strong events, but the lower beach and berm dominate overall fluxes and offer the most favorable conditions for substantial sand loading. The resulting spatial heterogeneity in transport has direct implications for short-term morphological change, as discussed below.

4.3. Topographic Response to Wind Events

The feedback between wind flow, sediment transport, and morphology is well recognized [41], yet few studies have explicitly linked aeolian processes to topographic evolution, particularly at short temporal scales (e.g., multi-day events). Most work instead focuses on morphological changes induced by wave and swell action [8,53,54], while short-term wind-driven responses remain poorly documented, especially outside microtidal [9,30,34] or desert settings [55,56].
In the back-dune area, low NWS values and dense vegetation promote stability by limiting sediment export [57]. Erosion is slight and largely confined within the dune compartment: material eroded from the two crests is redeposited immediately downslope, with maximum accumulation at the dune toe. This pattern reflects a strongly localized wind shadow effect. Overall, the dune sediment budget remains balanced, despite localized crest-toe transfers. Beach topography is mostly stable. On the mixed sand-gravel patch, high surface roughness restricts transport [49], while minor deposition occurs at the slope transition (stations g and h), consistent with the stagnation zone identified in the airflow analysis. Erosion is restricted to the lower beach, coinciding with the main sediment source area. Here, the berm does not prograde but instead loses elevation, with eroded material likely transferred to the swash and shallow subtidal zones. These results highlight the distinctive response of this system compared to nearby sectors [33,34]: sediment loss is neither widespread across the beach nor associated with berm progradation, underscoring the localized and topographically constrained nature of wind-driven morphological change.
Despite the short duration of the event, the observed topographic adjustments demonstrate that wind episodes can exert a measurable geomorphic imprint on coastal dune–beach systems. Such rapid, spatially focused changes emphasize the need to account for aeolian dynamics in both process-based models and coastal management strategies, particularly in wind-dominated environments, even during offshore events.

5. Conclusions

This study provides new insights into the behavior of low-relief coastal dunes shaped by offshore winds. By combining high-resolution wind, sediment transport, and topographic data, it reconstructs the feedback between airflow, aeolian transport, and short-term morphological change. The main conclusions are as follows:
1.
Small dunes (<1 m) disturb the wind profile through the same fundamental mechanisms observed in larger forms: flow stagnation at the toe, acceleration at the crest, and deflection toward the dune-normal direction.
2.
The magnitude of these flow adjustments scales with dune height. Over small dunes, wind speed variations are modest and deflection angles remain low, even under highly oblique winds. Vertical profiles show significant deviations only within the near-surface layer (0.20–0.30 m). The strongest perturbations occur immediately downwind of the crest, over elevations roughly equivalent to the dune height.
3.
Low dunes fail to generate an effective sheltered zone capable of trapping landward-moving sand. During strong wind events, sediment transport resumes almost immediately past the crest and contributes to offshore-directed fluxes, feeding the swash and shallow water zones (sink area).
4.
System stability depends on more than dune height. Mixed sand-gravel patches, vegetation, and slope breaks locally alter the pressure gradient, modulating both airflow and sediment transport. Consequently, secondary source areas are spatially restricted and do not extend across the entire beach profile.
Overall, this study demonstrates, from direct field observations, that dunes less than one meter high exert only limited aerodynamic sheltering and are ineffective in retaining sediment under offshore wind conditions. These findings raise important questions about the long-term sediment budgets of low-relief coastal systems and their capacity to persist where offshore-directed transport predominates. Further research should confirm these conclusions on other low-elevation dunes, and comparisons with systems dominated by onshore wind regimes could provide valuable insights into sediment transfer dynamics.

Author Contributions

Conceptualization, C.R. and N.R.; methodology, C.R.; software, C.R.; validation, C.R. and N.R.; formal analysis, C.R. and T.R.; investigation, C.R., N.R., T.R., A.L. and T.D.; resources, N.R.; data curation, C.R. and T.R.; writing—original draft preparation, C.R. and N.R.; writing—review and editing, C.R. and N.R.; visualization, C.R. and N.R.; supervision, N.R.; project administration, N.R.; funding acquisition, N.R. All authors have read and agreed to the published version of the manuscript.

Funding

This research was funded by OBSCAT (Observatoire de la Cote Catalane). NR and AL were funded by IRICOT-ANR-22-EXIR-0004.

Data Availability Statement

The original contributions presented in this study are included in the article. Further inquiries can be directed to the corresponding author.

Acknowledgments

The authors thank Louisa Bekaddour, Jules Fanti, Julien Labadie and Jade Lallemand for their contribution to the fieldwork. The authors sincerely thank the three reviewers for their valuable feedback and constructive comments.

Conflicts of Interest

The authors declare no conflicts of interest. The funders had no role in the design of the study; in the collection, analyses, or interpretation of data; in the writing of the manuscript; or in the decision to publish the results.

References

  1. Small, C.; Nicholls, R.J. A Global Analysis of Human Settlement in Coastal Zones. J. Coast. Res. 2003, 19, 584–599. [Google Scholar]
  2. Sabatier, F.; Chaïbi, M.; Chauvelon, P. Transport Éolien Par Vent de Mer et Alimentation Sédimentaire Des Dunes de Camargue. Méditerranée 2007, 108, 83–90. [Google Scholar] [CrossRef]
  3. Nicolae Lerma, A.; Castelle, B.; Rosebery, D.; Bouchet, C.; Billy, J.; Ayache, B.; Burvingt, O.; Robin, N. Foredune Guided Remobilization Experiments along the Southwest Coast of France. In Coastal Sediments 2023; World Scientific: New Orleans, LA, USA, 2023; pp. 642–646. [Google Scholar] [CrossRef]
  4. Amarouche, K.; Akpınar, A. Increasing Trend on Storm Wave Intensity in the Western Mediterranean. Climate 2021, 9, 11. [Google Scholar] [CrossRef]
  5. Bertin, X.; Prouteau, E.; Letetrel, C. A Significant Increase in Wave Height in the North Atlantic Ocean over the 20th Century. Glob. Planet. Change 2013, 106, 77–83. [Google Scholar] [CrossRef]
  6. Castelle, B.; Dodet, G.; Masselink, G.; Scott, T. A New Climate Index Controlling Winter Wave Activity along the Atlantic Coast of Europe: The West Europe Pressure Anomaly. Geophys. Res. Lett. 2017, 44, 1384–1392. [Google Scholar] [CrossRef]
  7. Lamy, A.; Smyth, T.A.G.; Robin, N.; Hesp, P.A. Using Computational Fluid Dynamics (CFD) to Investigate Airflow and Sand Transport on a Human-Made Coastal Foredune Dominated by Offshore Wind: Impact of the Shape Variability. Coast. Eng. 2024, 191, 104534. [Google Scholar] [CrossRef]
  8. Robin, N.; Raynal, O.; Balouin, Y.; Rene, C.; Palvadeau, E.; Valentini, N. Investigating the Early Stages of a Dune Restoration in Front of a Dyke on a Microtidal Urban Beach Affected by Chronical Erosion. J. Coast. Res. 2024, 113, 130–134. [Google Scholar] [CrossRef]
  9. René, C.; Robin, N.; Smyth, T.A.G.; Hesp, P.A.; Lamy, A.; Raynal, O.; Heurtefeux, H. Dynamics and Sediment Transport in a Path-Induced Blowout in Opposing Wind Conditions. Sci. Total Environ. 2025, 978, 179340. [Google Scholar] [CrossRef] [PubMed]
  10. Schwarz, C.; Brinkkemper, J.; Ruessink, G. Feedbacks between Biotic and Abiotic Processes Governing the Development of Foredune Blowouts: A Review. J. Mar. Sci. Eng. 2018, 7, 2. [Google Scholar] [CrossRef]
  11. Bauer, B.O.; Davidson-Arnott, R.G.D.; Walker, I.J.; Hesp, P.A.; Ollerhead, J. Wind Direction and Complex Sediment Transport Response across a Beach–Dune System. Earth Surf. Process. Landf. 2012, 37, 1661–1677. [Google Scholar] [CrossRef]
  12. Walker, I.J.; Hesp, P.A.; Davidson-Arnott, R.G.D.; Ollerhead, J. Topographic Steering of Alongshore Airflow over a Vegetated Foredune: Greenwich Dunes, Prince Edward Island, Canada. J. Coast. Res. 2006, 225, 1278–1291. [Google Scholar] [CrossRef]
  13. Montreuil, A.-L.; Robin, N.; Raynal, O.; Houthuys, R.; Chen, M. Mechanism of Coastal Foredune Formation and Evolution at Multi-Decadal Scale. J. Coast. Res. 2024, 113, 478–482. [Google Scholar] [CrossRef]
  14. Ruz, M.-H.; Meur-Ferec, C. Influence of High Water Levels on Aeolian Sand Transport: Upper Beach/Dune Evolution on a Macrotidal Coast, Wissant Bay, Northern France. Geomorphology 2004, 60, 73–87. [Google Scholar] [CrossRef]
  15. Strypsteen, G.; Houthuys, R.; Rauwoens, P. Dune Volume Changes at Decadal Timescales and Its Relation with Potential Aeolian Transport. J. Mar. Sci. Eng. 2019, 7, 357. [Google Scholar] [CrossRef]
  16. Smyth, T.A.G.; Hesp, P.A. Aeolian Dynamics of Beach Scraped Ridge and Dyke Structures. Coast. Eng. 2015, 99, 38–45. [Google Scholar] [CrossRef]
  17. Pourteimouri, P.; Jonkheer, A.J.; Campmans, G.H.P.; Hulscher, S.J.M.H. Numerical Modelling of Airflow and Sediment Transport Patterns over Aeolian Coastal Sand Dunes: Effects of Dune Slope and Wind Direction. Geomorphology 2025, 486, 109883. [Google Scholar] [CrossRef]
  18. Hesp, P.A.; Smyth, T.A.G. CFD Flow Dynamics over Model Scarps and Slopes. Phys. Geogr. 2021, 42, 1–24. [Google Scholar] [CrossRef]
  19. Hesp, P.A.; Smyth, T.A.G. Jet Flow over Foredunes. Earth Surf. Process. Landf. 2016, 41, 1727–1735. [Google Scholar] [CrossRef]
  20. Piscioneri, N.; Smyth, T.A.G.; Hesp, P.A. Flow Dynamics over a Foredune Scarp. Earth Surf. Process. Landf. 2019, 44, 1064–1076. [Google Scholar] [CrossRef]
  21. Sweet, M.L.; Kocurek, G. An Empirical Model of Aeolian Dune Lee-face Airflow. Sedimentology 1990, 37, 1023–1038. [Google Scholar] [CrossRef]
  22. Davidson, S.G.; Hesp, P.A.; DaSilva, M.; Da Silva, G.M. Flow Dynamics over a High, Steep, Erosional Coastal Dune Slope. Geomorphology 2022, 402, 108111. [Google Scholar] [CrossRef]
  23. Robin, N.; René, C.; Lamy, A.; Nicolae Lerma, A.; Castelle, B.; Hesp, P.A.; Raynal, O.; Burvingt, O.; Rosebery, D. Storm Wind Flow and Sediment Dynamics on Adjacent Coastal1 Dunes with Contrasting Morphologies during One Storm Event. J. Geophys. Res. Earth Surf. 2025; submitted. [Google Scholar]
  24. Jackson, D.W.T.; Beyers, J.H.M.; Lynch, K.; Cooper, J.A.G.; Baas, A.C.W.; Delgado-Fernandez, I. Investigation of Three-dimensional Wind Flow Behaviour over Coastal Dune Morphology under Offshore Winds Using Computational Fluid Dynamics (CFD) and Ultrasonic Anemometry. Earth Surf. Process. Landf. 2011, 36, 1113–1124. [Google Scholar] [CrossRef]
  25. Walker, I.J.; Shugar, D.H. Secondary Flow Deflection in the Lee of Transverse Dunes with Implications for Dune Morphodynamics and Migration. Earth Surf. Process. Landf. 2013, 38, 1642–1654. [Google Scholar] [CrossRef]
  26. Parsons, D.R.; Walker, I.J.; Wiggs, G.F.S. Numerical Modelling of Flow Structures over Idealized Transverse Aeolian Dunes of Varying Geometry. Geomorphology 2004, 59, 149–164. [Google Scholar] [CrossRef]
  27. Smyth, T.A.G.; Rooney, P.; Yates, K.L. Dune Slope, Not Wind Speed, Best Predicts Bare Sand in Vegetated Coastal Dunes. J. Coast. Conserv. 2023, 27, 27. [Google Scholar] [CrossRef]
  28. Lynch, K.; Jackson, D.W.T.; Cooper, J.A.G. Foredune Accretion under Offshore Winds. Geomorphology 2009, 105, 139–146. [Google Scholar] [CrossRef]
  29. Lamy, A.; Robin, N.; Hesp, P.A.; Smyth, T.; René, C.; Raynal, O.; Hebert, B. Modification of Offshore Wind Flow and Aeolian Sand Transport by Artificial Foredunes. Geomorphology, 2025; in press. [Google Scholar]
  30. Sabatier, F.; Anthony, E.J.; Héquette, A.; Suanez, S.; Musereau, J.; Ruz, M.-H.; Regnauld, H. Morphodynamics of Beach/Dune Systems: Examples from the Coast of France. Géomorphologie 2009, 15, 3–22. [Google Scholar] [CrossRef]
  31. Certain, R. Morphodynamique d’une Côte Sableuse Microtidale à Barres: Le Golfe Du Lion (Languedoc Roussillon). Ph.D. Thesis, Université de Perpignan, Perpignan, France, 2002. [Google Scholar]
  32. Meslard, F.; Balouin, Y.; Robin, N.; Bourrin, F. Assessing the Role of Extreme Mediterranean Events on Coastal River Outlet Dynamics. Water 2022, 14, 2463. [Google Scholar] [CrossRef]
  33. Feyssat, P.; Certain, R.; Robin, N.; Barusseau, J.-P.; Lamy, A.; Raynal, O.; Hebert, B. Morphodynamics of Two Mediterranean Microtidal Beaches Presenting Permanent Megacusps under the Influence of Waves and Strong Offshore Winds. Cont. Shelf Res. 2024, 272, 105160. [Google Scholar] [CrossRef]
  34. Lamy, A.; Robin, N.; Smyth, T.A.G.; Hesp, P.A.; René, C.; Feyssat, P.; Raynal, O.; Hebert, B. Impact of Temporal Beach Grain Size Variability on Aeolian Sediment Transport and Topographic Evolution in a Microtidal Environment. Geomorphology 2024, 453, 109126. [Google Scholar] [CrossRef]
  35. Nguyen, D.; Hilton, M.; Wakes, S. Wind Flow Dynamics and Sand Deposition behind Excavated Foredune Notches on Developed Coasts. Earth Surf. Process. Landf. 2022, 47, 1698–1719. [Google Scholar] [CrossRef]
  36. Lynch, K.; Jackson, D.W.T.; Cooper, J.A.G. Coastal Foredune Topography as a Control on Secondary Airflow Regimes under Offshore Winds. Earth Surf. Process. Landf. 2010, 35, 344–353. [Google Scholar] [CrossRef]
  37. Hugenholtz, C.H.; Wolfe, S.A. Form–Flow Interactions of an Aeolian Saucer Blowout. Earth Surf. Process. Landf. 2009, 34, 919–928. [Google Scholar] [CrossRef]
  38. Hilton, M.; Nickling, B.; Wakes, S.; Sherman, D.; Konlechner, T.; Jermy, M.; Geoghegan, P. An Efficient, Self-Orienting, Vertical-Array, Sand Trap. Aeolian Res. 2017, 25, 11–21. [Google Scholar] [CrossRef]
  39. Lamy, A.; Robin, N.; Smyth, T.A.G.; Hesp, P. Impact of the Beach Grain Size Variability on Observed and Calculated Aeolian Transport Rates. J. Coast. Res. 2024, 113, 483–487. [Google Scholar] [CrossRef]
  40. Hesp, P.A.; Dong, Y.; Cheng, H.; Booth, J.L. Wind Flow and Sedimentation in Artificial Vegetation: Field and Wind Tunnel Experiments. Geomorphology 2019, 337, 165–182. [Google Scholar] [CrossRef]
  41. Schwarz, C.; Van Starrenburg, C.; Donker, J.; Ruessink, G. Wind and Sand Transport Across a Vegetated Foredune Slope. JGR Earth Surf. 2020, 126, e2020JF005732. [Google Scholar] [CrossRef]
  42. Hesp, P.A.; Davidson-Arnott, R.; Walker, I.J.; Ollerhead, J. Flow Dynamics over a Foredune at Prince Edward Island, Canada. Geomorphology 2005, 65, 71–84. [Google Scholar] [CrossRef]
  43. Walker, I.J.; Hesp, P.A.; Davidson-Arnott, R.G.D.; Bauer, B.O.; Namikas, S.L.; Ollerhead, J. Responses of Three-Dimensional Flow to Variations in the Angle of Incident Wind and Profile Form of Dunes: Greenwich Dunes, Prince Edward Island, Canada. Geomorphology 2009, 105, 127–138. [Google Scholar] [CrossRef]
  44. Jarmalavičius, D.; Satkūnas, J.; Žilinskas, G.; Pupienis, D. The Influence of Coastal Morphology on Wind Dynamics. Est. J. Earth Sci. 2012, 61, 120. [Google Scholar] [CrossRef]
  45. Gargari, S.F.; Karssenberg, D.; Ruessink, G. The Influence of Foredune Geometry on Wind Flow Quantified from Computational Fluid Dynamics Simulations. Aeolian Res. 2025, 74, 101001. [Google Scholar] [CrossRef]
  46. Arens, S.M.; Van Kaam-Peters, H.M.E.; Van Boxel, J.H. Air Flow over Foredunes and Implications for Sand Transport. Earth Surf. Process. Landf. 1995, 20, 315–332. [Google Scholar] [CrossRef]
  47. Udo, K. Wind Turbulence Effects on Dune Sand Transport. J. Coast. Res. 2016, 75, 333–337. [Google Scholar] [CrossRef]
  48. Hesp, P.A.; Walker, I.J.; Chapman, C.; Davidson-Arnott, R.; Bauer, B.O. Aeolian Dynamics over a Coastal Foredune, Prince Edward Island, Canada. Earth Surf. Process. Landf. 2013, 38, 1566–1575. [Google Scholar] [CrossRef]
  49. Rotnicka, J.; Dłużewski, M. Vertical Profiles of Aeolian Mass Flux above Different Sand Surfaces and Sand Surfaces Covered with Pebbles. CATENA 2022, 212, 106006. [Google Scholar] [CrossRef]
  50. Dong, Z.; Liu, X.; Wang, X. Wind Initiation Thresholds of the Moistened Sands. Geophys. Res. Lett. 2002, 29, 25-1–25-4. [Google Scholar] [CrossRef]
  51. Rotnicka, J. Impact of Beach Surface Type on the Rate of Sand Transport by Wind. J. Coast. Res. 2011, 64, 2058–2062. [Google Scholar]
  52. Wal, A.; McManus, J. Wind Regime and Sand Transport on a Coastal Beach-Dune Complex, Tentsmuir, Eastern Scotland. SP 1993, 72, 159–171. [Google Scholar] [CrossRef]
  53. Fontán-Bouzas, Á.; Andriolo, U.; Silva, P.A.; Baptista, P. Wave Impact Analysis on a Beach-Dune System to Support Coastal Management and Nourishment Works: The Showcase of Mira, Portugal. Front. Mar. Sci. 2022, 9, 861569. [Google Scholar] [CrossRef]
  54. Vandenhove, M.; Castelle, B.; Nicolae Lerma, A.; Marieu, V.; Mazeiraud, V. Beach-Dune Dynamics and Coastal Management along the North-Médoc Coastline, Southwest France: A Decade of Morphological Change and Erosion Mitigation. Geomorphology 2025, 482, 109758. [Google Scholar] [CrossRef]
  55. Zamani, S.; Mahmoodabadi, M.; Yazdanpanah, N.; Farpoor, M.H. Meteorological Application of Wind Speed and Direction Linked to Remote Sensing Images for the Modelling of Sand Drift Potential and Dune Morphology. Meteorol. Appl. 2020, 27, e1851. [Google Scholar] [CrossRef]
  56. Zhang, Y.; Zhang, Z. Dune Field Patterns and Their Control Factors in the Middle Areas of China’s Hexi Corridor Desert. Front. Earth Sci. 2022, 10, 818338. [Google Scholar] [CrossRef]
  57. Zhang, Z.; Dong, Z. Characteristics of Aeolian Sediment Transport over Different Land Surfaces in Northern China. Soil Tillage Res. 2014, 143, 106–115. [Google Scholar] [CrossRef]
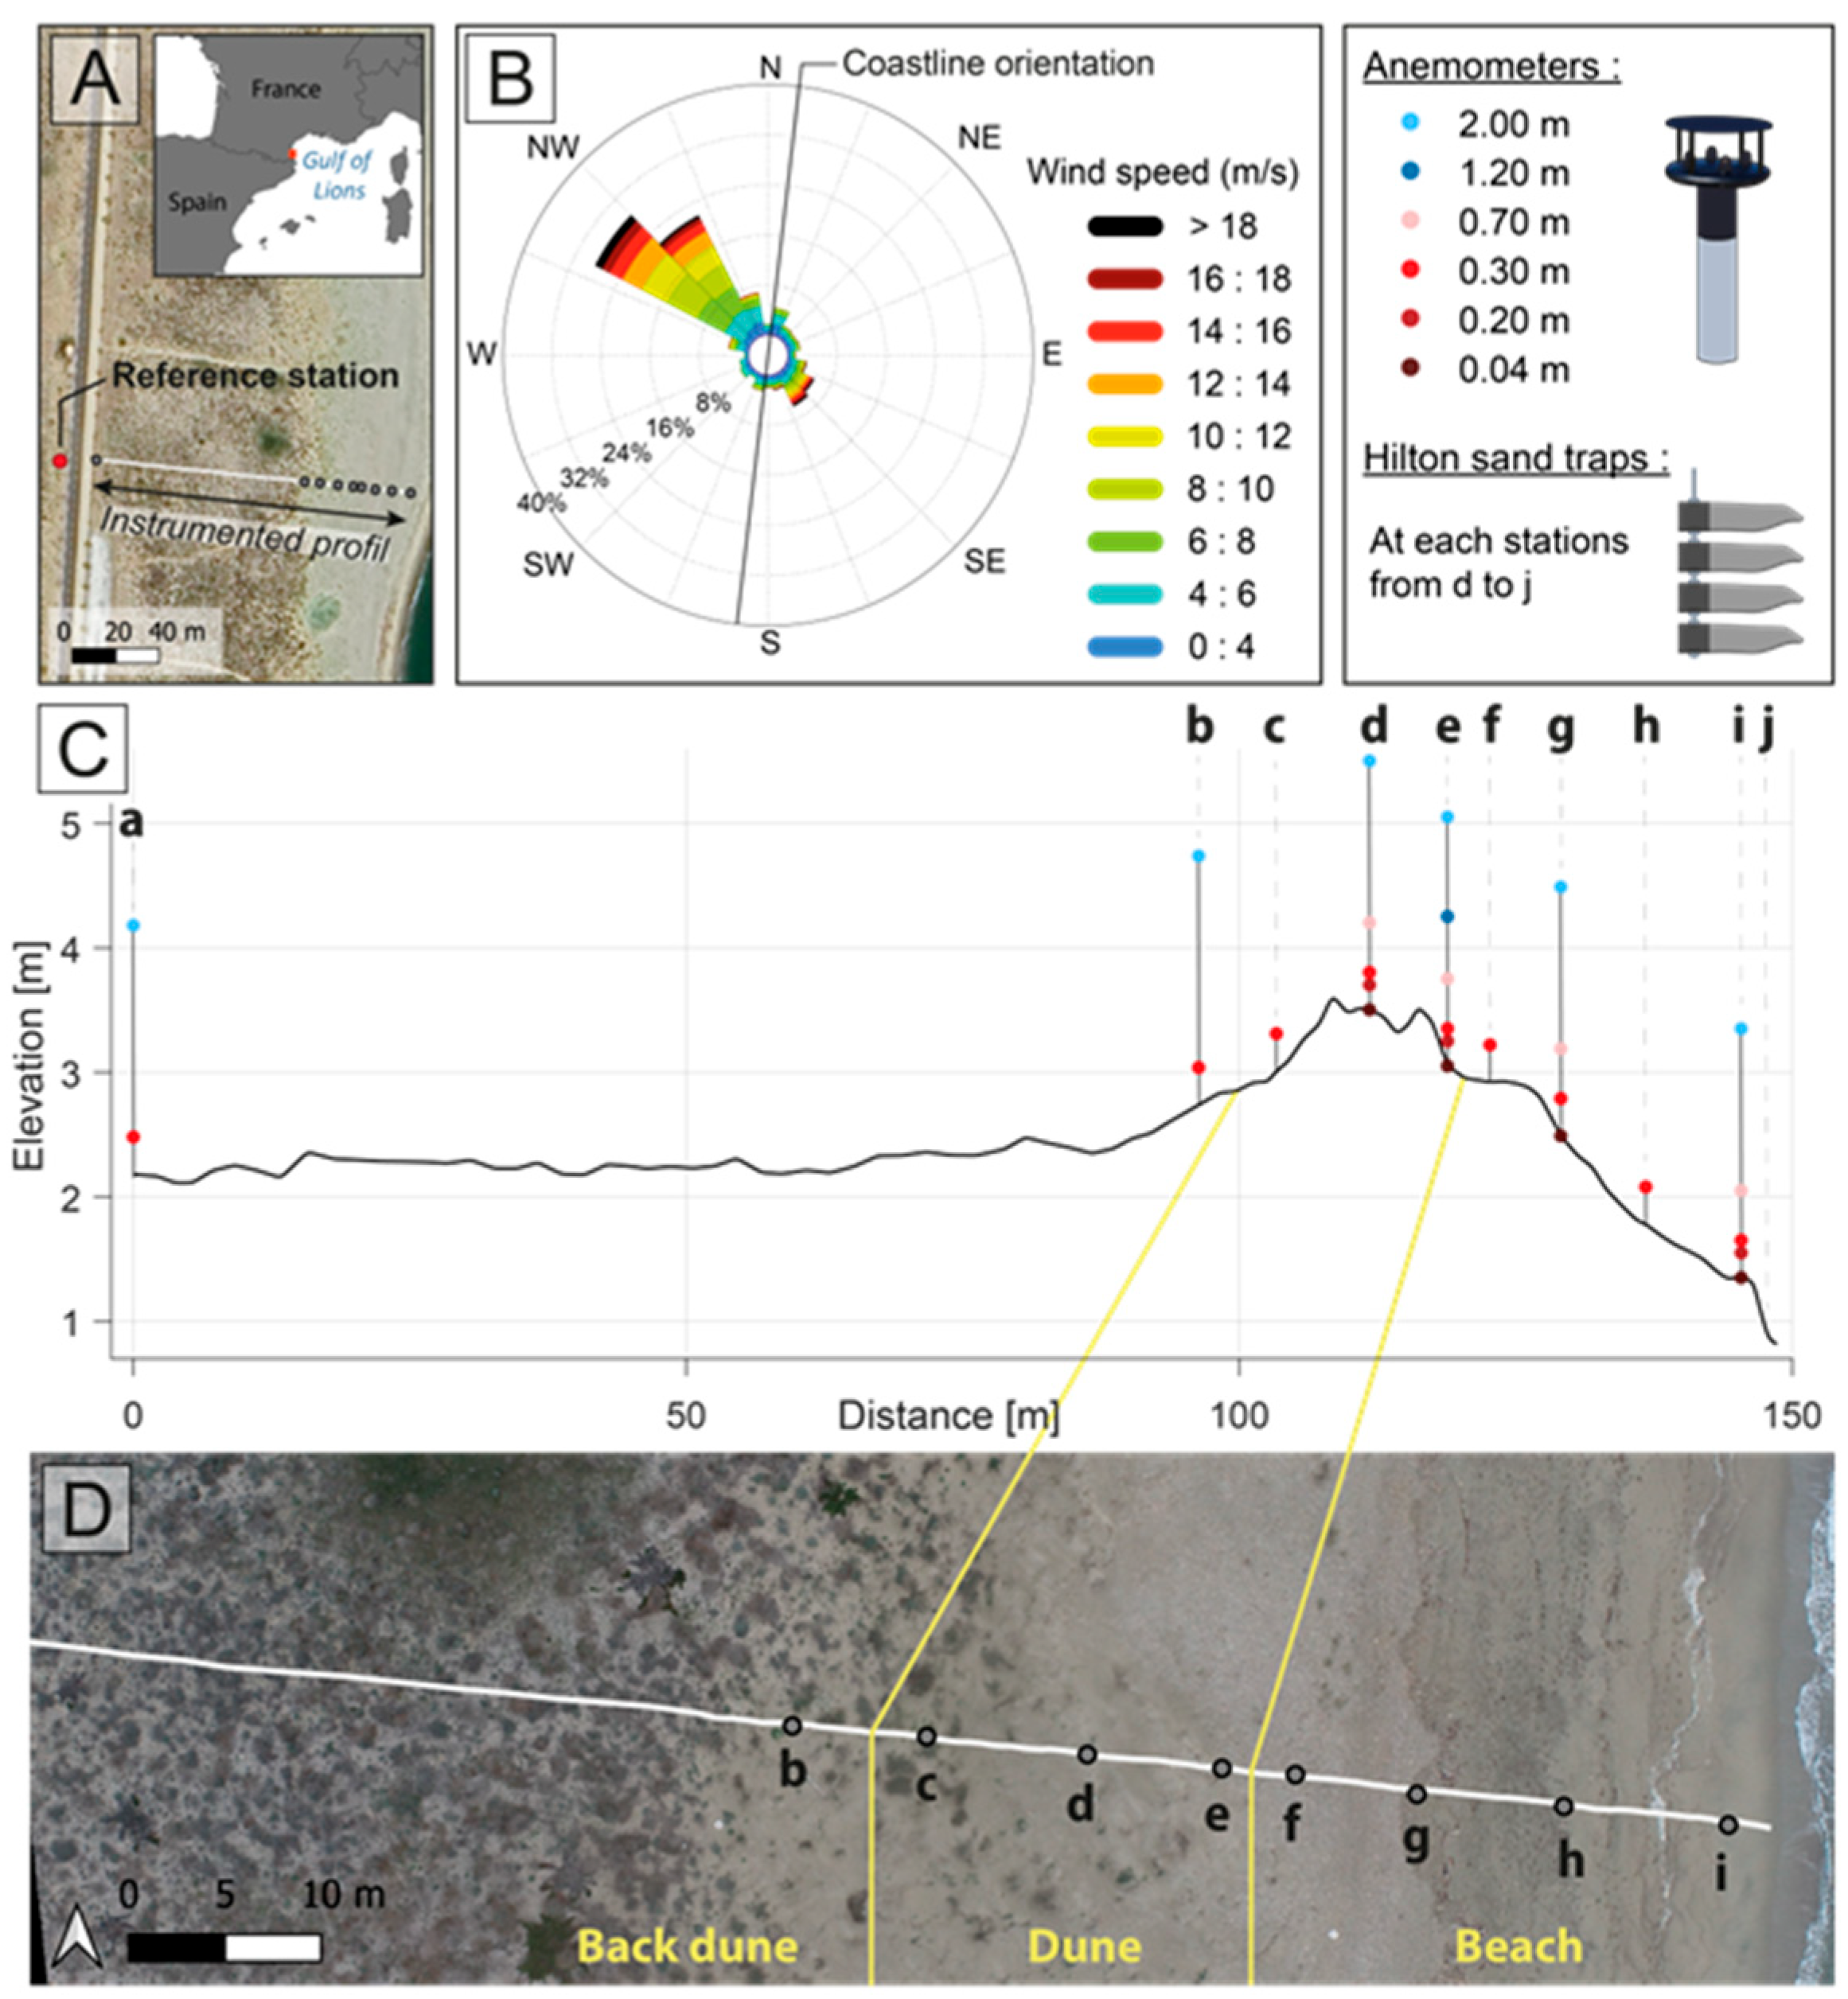
Figure 1. Location of the study site (stations a to i) (Google Earth © 2024 Airbus) (A) with prevailing wind conditions (B). Instrumentation layout showing the position of instruments along the 2D profile (C) and in aerial view from our own UAV flight (13 March 2025) (D).
Jmse 13 02235 g001
Figure 2. Wind (1 min averaged from reference station) and rainfall conditions (from Cape Leucate Météo-France station) recorded during the campaign. Time intervals corresponding to transport runs (R1, R2, …), surface sampling, and topographic surveys are indicated (1, 2, …).
Jmse 13 02235 g002
Figure 6. Scatterplots showing relationships between wind characteristics (wind speed, gusts > 10 m/s and SD) at 0.30 m height and measured sand transport rates (stations d to j). The plotted curves represent the best-fit regressions (highest R2).
Jmse 13 02235 g006
Figure 7. Along-profile variations in median grain size (d50) and moisture content for stations d to j. Sand sample Sti was collected 3.5 m upwind of station i. The extent of the mixed sand-gravel patch was mapped during the final sampling of the campaign. Note that the 0–2 mm range of the d50 axis has been expanded, while the 2–12 mm range has been compressed.
Jmse 13 02235 g007
Figure 8. Topographic evolution during the campaign and associated net elevation change. Sand volumes were computed from the first and last topographic surveys, assuming a one-meter-wide linear section centered on the profile.
Jmse 13 02235 g008
Disclaimer/Publisher’s Note: The statements, opinions and data contained in all publications are solely those of the individual author(s) and contributor(s) and not of MDPI and/or the editor(s). MDPI and/or the editor(s) disclaim responsibility for any injury to people or property resulting from any ideas, methods, instructions or products referred to in the content.