Article

A Discrete Particle Modeling Framework for Exploring the Evolution of Aeolian Sediment Transport on Moist Sand Surfaces

by
Xiuqi Wang
1,*,
Gerhardus H. P. Campmans
1,
Thomas Weinhart
2,
Anthony R. Thornton
2 and
Kathelijne M. Wijnberg
1
1
Department of Civil Engineering and Management, University of Twente, Drienerlolaan 5, 7522 NB Enschede, The Netherlands
2
Department of Thermal and Fluid Engineering, University of Twente, Drienerlolaan 5, 7522 NB Enschede, The Netherlands
*
Author to whom correspondence should be addressed.
J. Mar. Sci. Eng. 2025, 13(9), 1733; https://doi.org/10.3390/jmse13091733
Submission received: 28 July 2025 / Revised: 2 September 2025 / Accepted: 6 September 2025 / Published: 9 September 2025
(This article belongs to the Special Issue Advances in Coastal Dune and Aeolian Processes Research)

Abstract

Aeolian sand transport on beaches is strongly affected by surface moisture, but its influence on transport evolution remains poorly understood. We present a novel discrete particle modeling framework to systematically investigate how moisture from liquid bridges affects the development of transport toward steady state after initiation. Moist sediment particles are modeled using a particle-based approach with evolving liquid bridges coupled to a one-dimensional airflow solver. The model captures realistic grain-scale collision dynamics under moist conditions and reproduces key features of aeolian transport in the dry limit. Simulations reveal two distinct behaviors: In steady state, the transport rate remains insensitive to moisture as lower saltation concentrations are compensated by higher saltation velocities; in the transient phase, however, increasing moisture prolongs the growth phase and delays the peak in transport rate. This delay arises because sand concentration peaks increasingly later than mean saltation velocity as moisture content increases. By projecting the temporal model results into a spatial representation, the position of peak transport is found to scale linearly with wind shear velocity, showing greater sensitivity at higher moisture levels. A preliminary test suggests that evaporation is essential for the initial grain dislodgement by wind alone but is unlikely to affect steady-state transport. This study explains the longer fetch distances observed on moist beaches before transport equilibrates and provides a physics-based tool for predicting sediment transport under varying moisture conditions.

1. Introduction

Surface moisture is known to complicate the process of aeolian sediment transport on sandy beaches by increasing the threshold wind velocity [1,2,3,4,5], altering the transport rate [3,5,6,7,8], and varying the vertical transport profile [7,8,9]. Despite the advances in understanding the role of moisture on transport locally, accurately predicting long-term transport from the beach to foredunes remains a significant challenge. The spatially inhomogeneous surface conditions, induced by the cross-shore moisture gradient, interfere with the way aeolian transport evolves downwind [9,10,11]. Extensive research has examined the evolution of sediment transport for dry conditions in both wind-tunnel and field settings [12,13,14,15,16]. However, the evolution of transport on moist surfaces remains poorly understood.
The limited field evidence suggests that the critical fetch distance required to reach the peak transport rate or equilibrium is significantly longer on moist surfaces [6,11,15,16]. Specifically, in [16], an overshoot pattern of the transport rate prior to steady-state transport was observed on both dry and moist surfaces, while the growth phase before overshoot was significantly extended on moist surfaces. Nevertheless, the physical mechanism behind these phenomena remains unclear. Furthermore, field studies are complicated by highly variable surface conditions, driven by natural processes such as precipitation and evaporation, making systematic investigations into the effects of moisture impractical. Meanwhile, wind-tunnel experiments have primarily focused on the unsaturated phase of transport, often with tunnel lengths too short to allow the system to reach transport saturation [1,2,5,7,17]. To address these limitations, we will employ a novel grain-scale model to provide new insights into these experimentally challenging phenomena.
Discrete particle modeling (also known as DPM), although computationally expensive and limited to small systems, offers precise control over parameters like particle positions and liquid properties, enabling systematic exploration of variables that are difficult to manage in experiments or field studies [18,19]. It also provides detailed insights into particle interactions and liquid distributions, offering a depth of analysis beyond conventional methods. Previously, DPM simulations have been successfully used to investigate sediment transport across various environments [20,21,22]. In particular, simulations with periodic boundary conditions enable the reintroduction of particles into the system after they leave the domain, facilitating continuous transport until a steady state is reached [23]. More recently, the method has been extended to incorporate general inter-particle cohesion by introducing additional forces at particle contacts [24,25,26,27].
In the simulations, the cohesive strength of liquid bridges is quantified by the cohesion number, defined as the ratio of the maximum capillary force to the gravitational force. This parameter is influenced by surface tension, which varies for different liquids, and plays a critical role in affecting the transport process [24,27]. However, the dynamics of liquid bridge volumes, governed by the water content, also strongly influence how the cohesive force evolves with the separation distance between grains [28]. This aspect could significantly impact transport behavior but has received limited attention in previous studies. Earlier research often assumed that cohesive forces are uniformly applied across all particle contacts [24,26,27]. In contrast, we demonstrate that the distribution of liquid bridges is typically non-uniform due to liquid migration across the particle contact network. To address this, our work focuses on the effects of water-based moisture under a fixed cohesion number while varying liquid bridge volumes, accounting for the redistribution of liquid between inter-particle bridges and that adhering to particle surfaces. This advancement provides a robust framework for exploring the complex interplay between moisture and sediment transport at the micro-mechanical level.
The objective of this study is to systematically investigate the impact of moisture from liquid bridges with varying volume content on the evolution of aeolian sediment transport over a time scale of seconds using a novel DPM-based model. The moisture content in the bed will be varied through the volume of inter-particle liquid bridges systematically per model run, isolating the effect of different levels of moisture content in the bed from factors that might change moisture content over time, such as evaporation or groundwater dynamics. Our approach is the first to couple sediment particles, evolving liquid bridges, and airflow dynamics. The paper is organized as follows. First, we introduce our model, which incorporates a liquid bridge model and a one-dimensional airflow model that is coupled to the particle dynamics. We then validate the model in two steps to ensure its accuracy and reliability. Next, we apply the model to systematically study the influence of moisture on steady-state transport and the evolution of transport.

2. Methodology

The transport model is implemented in the open-source software package MercuryDPM [29,30]. It consists of three elements: (1) grain motion, (2) liquid bridge and its evolution, and (3) airflow, respectively, each described in the subsequent sections.

2.1. Grain Motion Model

For this study, sediment grains are modeled as spherical particles for simplicity. Their movement is modeled by solving Newton’s law of motion:
m i d u i d t = m i g + f air , i + j ( f c , i , j + f l , i , j )
I i d ω i d t = r i , j × j ( f c , i , j + f l , i , j )
r i , j = c i , j r i
where u i and ω i are the velocity and angular velocity of a certain particle with an index of i. g is the gravity acceleration, f air , i is the air interaction force, and f c , i , j and f l , i , j are the contact force and the liquid-induced force due to the contact with another particle j, respectively. m i and I i are the mass and moment of inertia, r i , j is the branch vector pointing from particle i to the contact point with particle j, and c i , j and r i are the position vectors of the contact point and particle i, respectively.
The contact force f c , i , j is a combination of linear visco-elastic normal force and sliding friction in tangential direction [31]. During a collision between two neighboring particles, the contact force consists of a normal and a tangential component. The normal part is described by a linear spring force depending on the overlap and a damping force depending on the relative motion of the particles. The tangential part is similar to the normal part, differs in direction, but is controlled by the Coulomb friction limit.
The air phase is considered to exert the drag force and buoyancy force on the particles in this study, which follow the equations below.
f air , i = f drag , i + f bouy , i
f drag , i = π 8 ρ a d i 2 C d | u ( r i ) u i | ( u ( r i ) u i )
f bouy , i = π 6 d i 3 ρ a g
where f drag , i and f bouy , i are the drag force and the buoyancy force exerted on particle i by the surrounding air. ρ a is the air density and u is the airflow velocity. C d is the drag coefficient as a function of the particle Reynolds number Re i = | u ( r i ) u i | d i / ν a , which depends on the velocity difference between the air phase and particle. Here, d i is the particle diameter and ν a is the air kinematic viscosity.
C d = C d , + Re p , c / Re i 2
where C d , 0.5 is the drag coefficient in the turbulent limit and Re p , c 24 is the transitional particle Reynolds number between laminar and turbulent flow regimes [21].

2.2. Liquid Bridge Model and Its Evolution Rule

Particle collision is actively involved in the transport process not only at the sediment bed surface but also in mid air. The frequent collisions and contacts of moist sand particles cause the formation and rupture of liquid bridges, facilitating the redistribution of the interstitial liquid [32,33]. To account for this, we implemented a liquid migration rule that extends beyond the standard liquid bridge model applied to all the particle contacts, different from those in the previous studies [24,26,27]. This migration rule of liquid is given in [34,35], and implemented by [28] in MercuryDPM. The migration rule assumes that particles and liquid are two different entities in the system. The liquid is either attached to particles or to contacts as a liquid bridge, depending on the formation or breakage of contacts. Once a particle pair is subject to contact, the liquid migrates from the particle and forms a bridge with the neighboring particle. When the particles move away from each other, the distance S between them increases. The rupture distance S r is an upper limit for the liquid bridge to exist. Once S reaches S r , the liquid bridge breaks and the liquid is redistributed to other bridges associated with the particles, or equally back to the particle surface if there is no other bridge [28].
The liquid bridge induces a capillary force proposed by [36] and a viscous lubrication force proposed by [37,38].
f l , i , j = f l , cap , i , j + f l , vis , i , j
where f l , cap , i , j and f l , vis , i , j are the capillary force and the lubrication viscous force, respectively, exerted on particle i by the liquid bridge formed with another particle j.
The capillary force within the rupture distance follows
f l , cap , i , j = f l , cap , max 1 + S c ( 1.05 + 2.5 S c ) n i , j for S < S r with f l , cap , max = 2 π R ˜ γ cos θ
S r = ( 1 + 0.5 θ ) · V lb , i , j 1 3
in which f l , cap , max is the maximum capillary force, n i , j is the normal vector for a particle contact, γ is the surface tension of the liquid, θ is the contact angle of the liquid with the particle surface, V lb , i , j is the volume of a liquid bridge between a particle pair, and S c is the dimensionless separation distance calculated below.
S c = S R ˜ V
where R ˜ is the effective radius of the particle pair with radii R i and R j , respectively.
R ˜ = 2 R i R j R i + R j
The capillary force is conservative and only dissipates energy during the rupture event. Therefore, we also include the forces due to the viscous damping effects of the liquid. These viscous forces in both the normal and tangential directions are given as
f l , vis , i , j n = 3 π μ l R ˜ 2 2 S u r n
f l , vis , i , j t = 3 π μ l R ˜ 8 15 ln R ˜ 2 S + 0.9588 u r t
in which μ l is the dynamic viscosity of the liquid and u r n and u r t are the relative velocities in normal and tangential contact directions. The viscous force is only valid above a minimum separation distance S m . Following [39], we take S m = 1 100 min ( R i , R j ) .

2.3. Airflow Model

MercuryDPM is coupled with the FEM solver oomph-lib [30]. However, here, we directly implemented a one-dimensional airflow model, similar to the one in [40], in MercuryDPM for modeling the aerodynamics in the turbulent boundary layer. The governing equation for the airflow is a one-dimensional Reynolds-averaged Navier–Stokes equation, in which the flow velocity is assumed horizontal ( u ( t , r ) = ( u ( t , z ) , 0 , 0 ) ).
ρ a ( 1 ϕ ) u t = ( 1 ϕ ) τ a z F d
where ϕ and F d are the particle volume fraction and the body force density that the particles exert on the air phase over a horizontal layer of the model domain, identified by a layer thickness of d z .
ϕ = 1 L x L y d z i z , z + d z π 6 d i 3
F d = 1 L x L y d z i z , z + d z f drag , i
where L x and L y are the length and width of the model domain, respectively.
The airborne shear stress τ a can be related to the airflow velocity field through a Prandtl turbulent mixing length .
τ a = ρ a ( ν a + 2 | u z | ) u z
in which ν a is the air kinimetic viscosity. The turbulent mixing length is calculated through the differential equation proposed by [21].
z = κ 1 exp 1 R c u ν a
where κ 0.4 is the von Karman’s constant and R c = 7 is a dimensionless parameter [21,41].
The governing equation, Equation (15), is solved subject to the following boundary condition at the bottom of the domain, i.e., z = 0.
u ( z ) = 0 for z = 0
( z ) = κ z 1 exp 1 R vD z u ν a for z 0
in which R vD = 26 is the mixing length scaling constant suggested by [41].
At the top boundary of the model z = L z , the air shear stress is prescribed by τ a = ρ a u 2 , where u is the shear velocity in the turbulent boundary in the absence of particles.
As the initial condition, the profiles of velocity and mixing length scale are prescribed such that it represents the steady-state solution when particles are fixed. In order to achieve this, we start from an initial guess for the velocity field in which the zero-velocity point is at the bed surface, defined as the highest vertical location with an average particle volume below 0.4. Then, we integrate Equation (15) while fixing the particles until the flow profile becomes constant.
Equation (15) is numerically solved through a semi-implicit finite difference scheme, similar to that in [40]. This is implemented using the linear algebra package Eigen in MercuryDPM.

2.4. Simulation Set-Up

The particle size is modeled with a mean diameter of d mean = 0.25 mm, which is a common sand grain size found on sandy beaches [16,42]. To avoid crystallization of the particle bed, a normal distribution with a standard deviation of d std = 0.01 mm is used, following other DPM studies on aeolian transport [43,44]. We simulate a domain of length L x = 100 d mean and width L y = 2 d mean . To save computational efforts and to achieve the evolution of transport over time, periodic boundaries are applied to both x- and y-directions; i.e., the particles leaving the domain from one side will enter it with the same velocity from the other side, similar to the other DPM studies on aeolian transport [21,23,40]. A horizontal bottom wall is placed at z = 0, and an open boundary is applied to the top. Gravity is applied in z-direction. The particle bed is generated by pouring the particles from a certain height onto the bottom wall and letting them settle until stationary. To guarantee that the momentum of a saltating particle impacting the bed is completely dissipated within the bed, the bed should be at least 10d high [22]. Hence, 2715 particles are inserted, leading to a particle bed about 12 d mean high. The domain of the airflow solver has the same size as the bed in x- and y-directions but is 800 d mean high [40]. The flow velocity profile above the bed is shown in Figure A1 in Appendix A. A snapshot of the model simulation is shown in Figure 1c.
The model parameters for particle contact and air properties are selected from the literature and correspond to typical aeolian conditions [21,40], listed in Table 1. The liquid parameters are set to reflect the typical physical properties of water, in which the water–sand contact angle for the liquid bridge model is taken from [45]. The cohesion number in this work corresponds to C o = f l , cap , max / m g = 113. The time step for solving the equations of motion of the particles is 1/50 of the collision time calculated by Equation (22),
t c = π / 2 k n / m ( ν n / m ) 2
in which m is mean particle mass, and k n and ν n are normal stiffness and damping coefficient, respectively, defined according to [31]. The same time step is applied to the airflow solver since its critical time step is much larger than that for the particle dynamics.
The airflow conditions are controlled through the non-dimensionalized shear stress, i.e., the Shields number Θ ˜ . It is related to the shear velocity that determines the strength of the wind.
Θ ˜ = ρ a u 2 ( ρ p ρ a ) g d mean
The simulation parameters are listed in Table 2. The Shields numbers selected for transporting the particles correspond to the shear velocities in the typical aeolian environment. The bed moisture content Ω represents the water content by volume, defined as the ratio of the total liquid volume to the total solid volume and expressed as a percentage:
Ω = i , j C V lb , i , j + i V lp , i i V p , i
in which V lb , i , j is the liquid bridge volume attributed to a particle pair in contact, C is the set of all particle pairs in contact, V lp , i is the liquid volume attributed to a particle, and V p , i is the volume of a particle. After the particle bed is generated, the liquid is added slowly to all the particle contacts in the form of liquid bridges until the prescribed volume is reached to minimize disturbances to the bed, as Figure 1a shows. The cohesive behavior of the simulated moist sediment bed has been validated through a direct shear test (see Appendix B for more details), and the test results are in line with [46]. The prescribed initial moisture profile reflects a sandy beach that is flooded by the tide and replenished from below by the groundwater. In field conditions, the gravimetric moisture content of the top sand layer is in the range of 0–10%, corresponding to 0–26.5% by volume for the density ratio in this study [47]. Here, the studied range of moisture content is limited to the pendular regime (0–20%), where the liquid bridge model is valid [48].
In this study, we aim to investigate the effect of moisture from liquid bridges on sediment transport dynamics beyond the initiation of transport. A preliminary test using our model suggests that initiating transport by wind on moist beds is significantly more difficult than on dry beds. It requires very high Shields numbers (10–20), far beyond the values corresponding to a typical aeolian environment, to overcome the maximum capillary force acting on the particles in the top layer (further discussed in Section 4). This indicates that relying solely on aerodynamic entrainment of the first particle to initiate transport is not realistic for sandy surfaces, where all grains are connected by liquid bridges. Other processes, such as evaporation, are thus required to free at least one particle from liquid bridges to realistically set the sand grains into motion by wind. Therefore, to circumvent the initiation of the first grains set into motion, we injected ten mobile particles into the saltation layer to initiate the transport through particle impact, as shown in Figure 1b, allowing us to focus on the subsequent evolution of transport. This situation, where upwind sediment flux already exists, can occur in field conditions, for example, at an interface between a dry sandy surface and a less erodible moist surface, as commonly observed on sandy beaches [49,50]. These conditions are particularly relevant for understanding the initiation and development of bedforms typically appearing on moist surfaces, such as sand strips. To make sure this initial particle flux does not affect the results qualitatively, we also ran simulations at Θ ˜ = 0.06, with one and five particles injected, respectively. The detailed information about these injected particles is listed in Table A1 in Appendix C.
Previous studies suggest that moisture evaporation can strongly influence aeolian sediment transport dynamics [51,52]. To assess the likely degree of evaporation during the time scales covered by our simulations, we estimated water loss under a range of environmental conditions, including relative humidity and air temperature (Appendix D). The calculations indicate that evaporation can be substantial on both the bed surface and saltating grains when conditions permit (see Section 4). Furthermore, in the intertidal zone, moisture dynamics are more complicated than evaporation alone. There will be regions of the beach where, even though evaporation takes place at its surface, its moisture is replenished via capillary rise from the groundwater that is close to the surface. Therefore, it will inevitably be very interesting to focus on how aeolian sediment transport dynamics beyond the onset of motion are affected by liquid bridges of varying volumes being present at the surface of the sediment bed, leaving these processes for future work.

2.5. Validation of the Modeling Framework

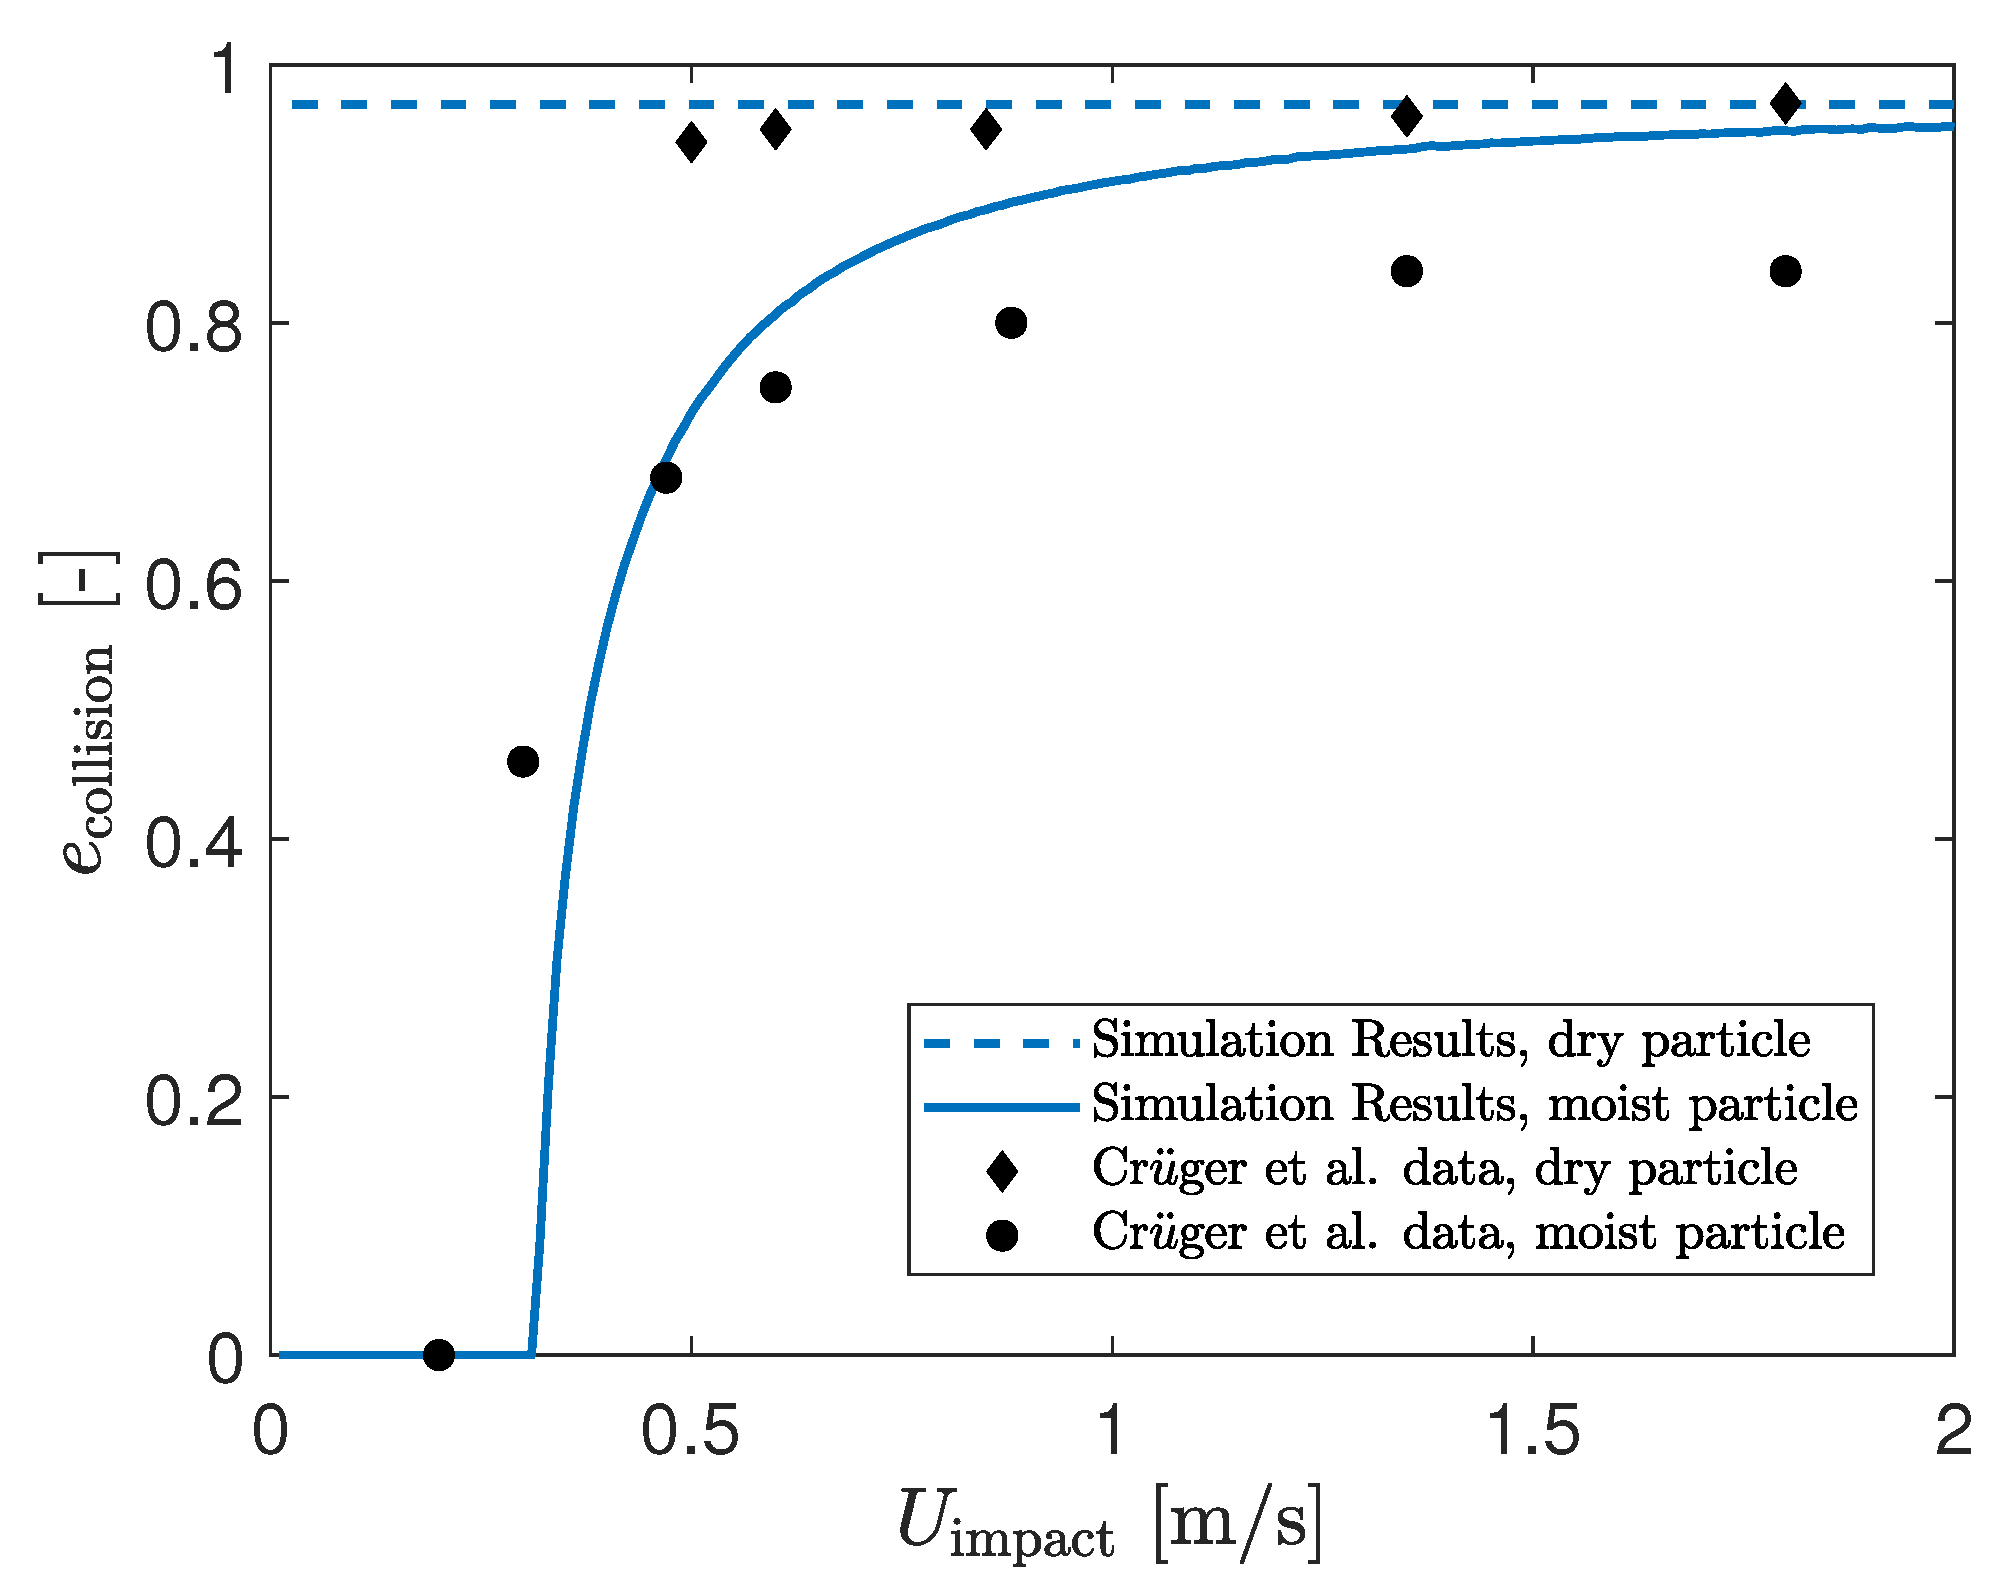
Particle impact is widely recognized as the dominant mechanism for entraining new grains into the saltation layer [53], in which the momentum restitution is influenced significantly by the presence of liquid bridges. Therefore, it is crucial to validate the liquid bridge model on the collision dynamics under moist conditions. In a previous study conducted by [54], an experiment was performed in which a glass bead (1.74 mm) collided with a flat surface both in dry and moist scenarios. In the moist scenario, a thin water layer is above the flat surface. The coefficients of restitution, defined as the rebound velocity over the impact velocity, were measured for various impact velocities. To perform the validation, we conducted a collision test involving a particle with the same diameter and a flat wall. The particle is with a liquid layer of the same thickness as that in the experiment in the moist scenario. The contact parameters are chosen such that the results for the dry particle rebound are not affected; the material properties used in this simulations are identical to those in the experiments [54,55]. Specifically, the particle density is 2500 kg/m3, the surface tension of water is 0.0728 kg/s2, the dynamic viscosity is 0.001 kg/m/s, and the contact angle is assumed to be 35° [56]. The liquid on the particle is assumed to be distributed in a film of 100 μm. After conducting the collision tests, we compared the coefficients of restitution obtained from our simulations to the experimental results in both scenarios, which are depicted in Figure 2.
The results indicate that our model generally captures the coefficient of restitution quite accurately by including both capillary force and viscous lubrication force with the selected parameters. However, in the moist scenario, there is a slight underestimation observed in the low-velocity region and an overestimation in the high-velocity region. It is worth noting that [57] proposed a categorization scheme for particle–liquid collision dynamics, which states that energy dissipation is induced by different forces according to the value of capillary number ( C a = U impact μ l / γ ). In this tested range, the capillary force is dominant in the low-velocity region, but the high-velocity region corresponds to a regime where both capillary and viscous forces are influential. Consequently, the utilization of the same liquid force law in both regimes could contribute to the observed discrepancies. Nevertheless, the behavior of the collision dynamics, as indicated by our model, remains within an acceptable range. Thus, it is worth noting that including the viscous force is crucial for effectively capturing the dynamic behavior.

Validation of the Transport Model at the Dry Limit

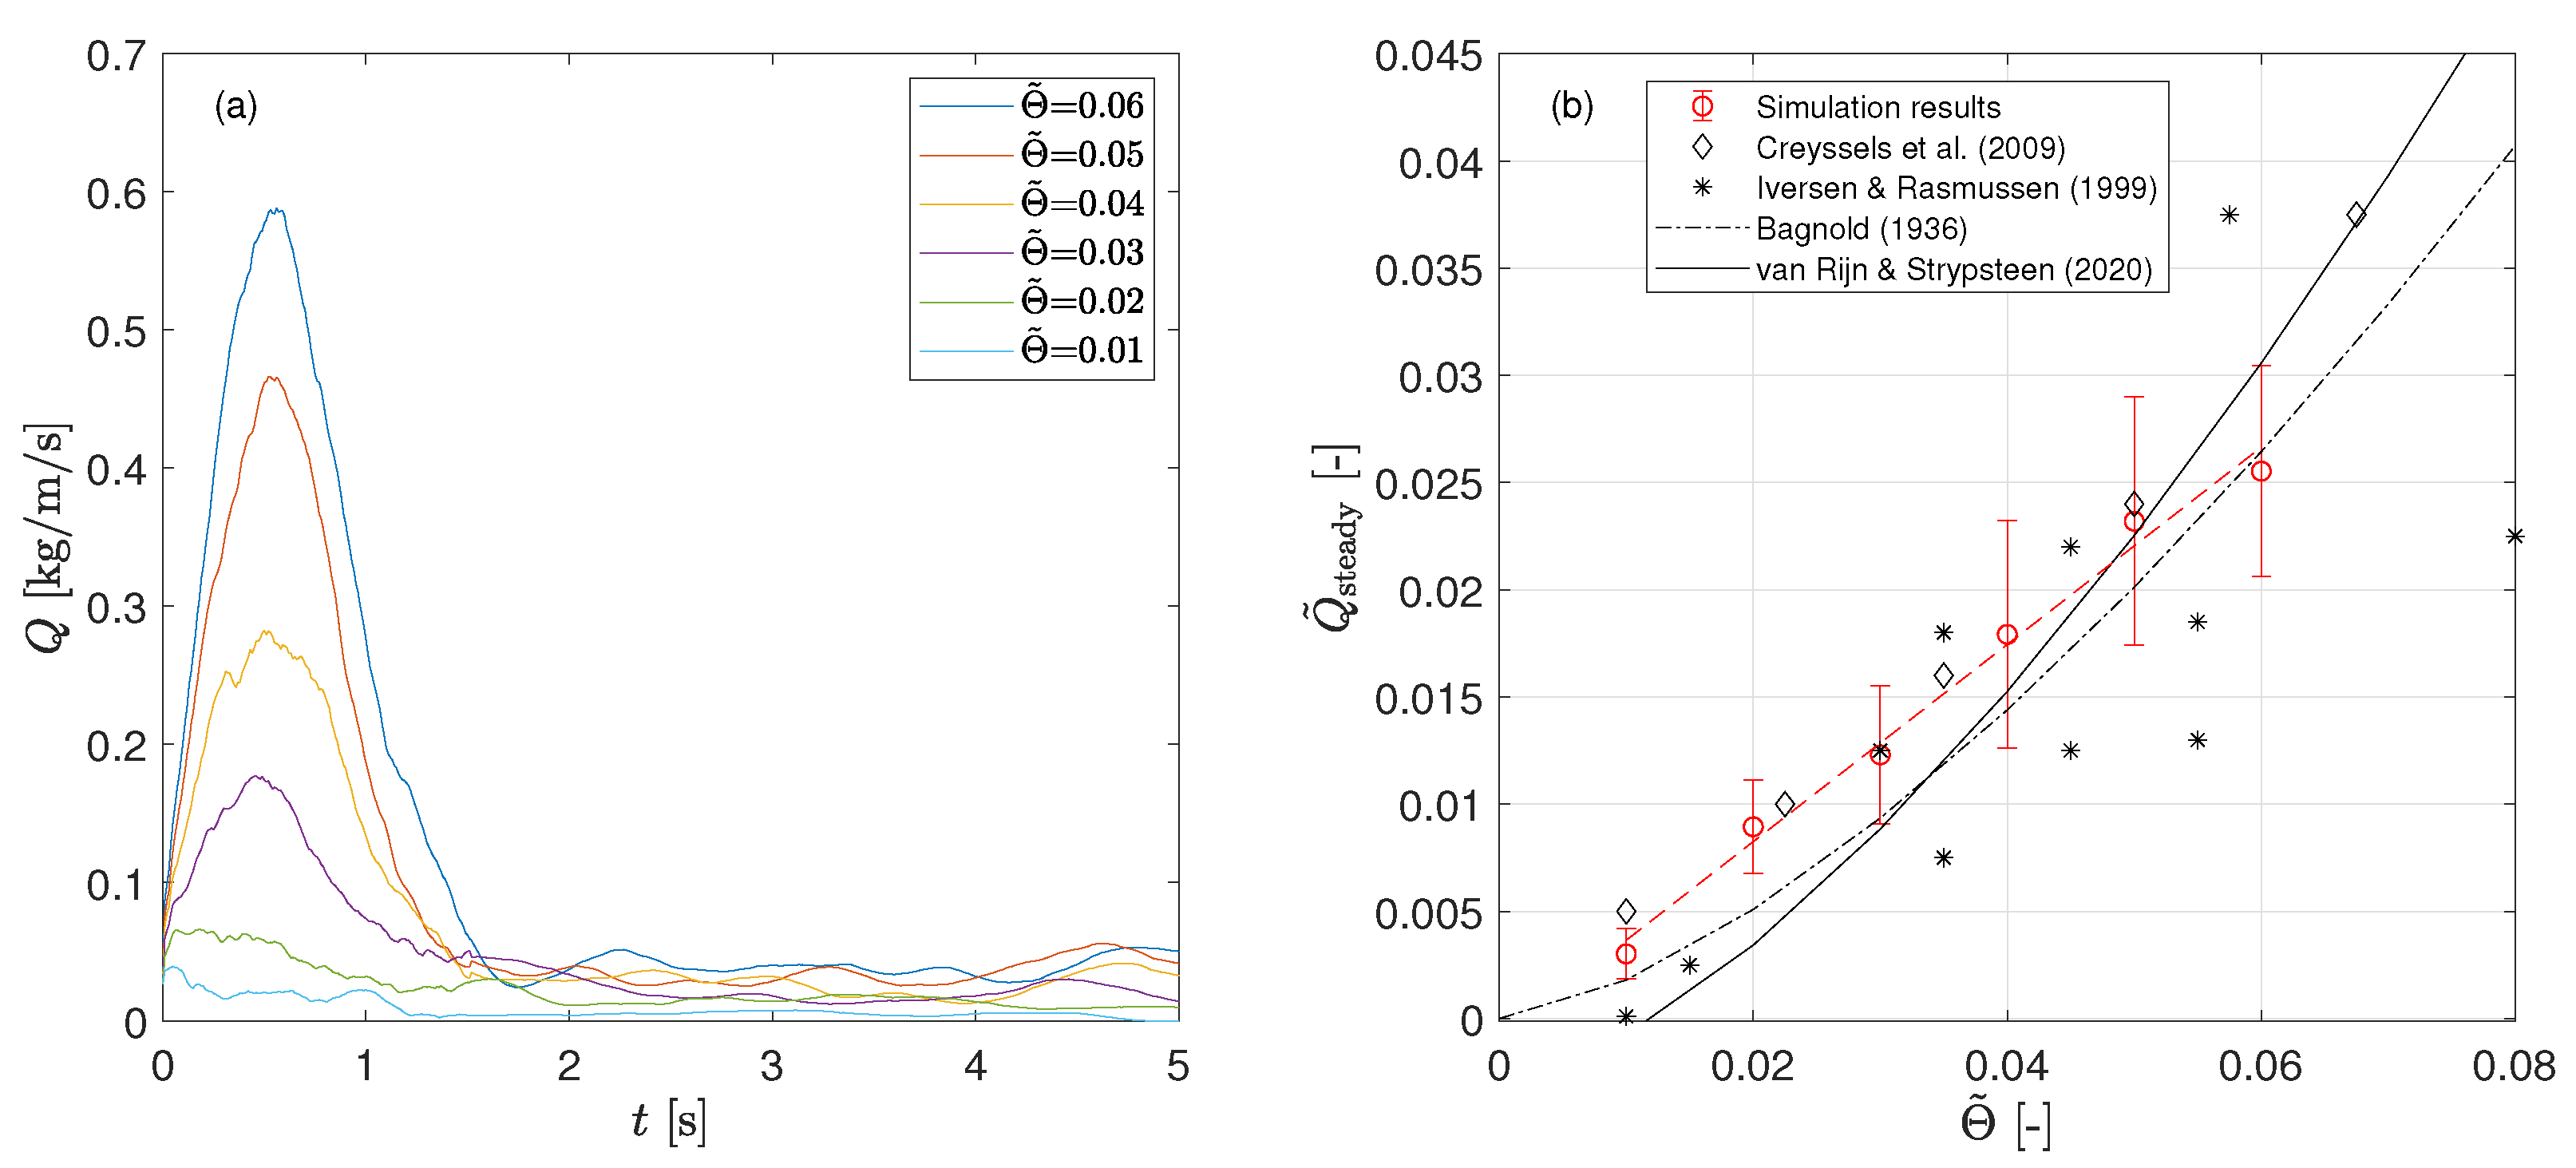
To validate the transport model, simulations of transport on a dry sediment bed were performed. Figure 3a shows the evolution of transport rate over time with varying Shields numbers. Initially, the energetic impact particles and the excessive momentum in the air phase facilitate the entrainment of a substantial number of particles into the saltation layer, leading to a significant increase in the transport rate. However, due to the negative feedback resulting from the increased number of saltating particles, the momentum of the air phase gradually reduces, yielding a decrease in the transport rate. After this time period, including the growth and decline phase, the system eventually reaches a steady state when the momentum of saltating particles and the airflow field balance each other. The momentum of the airflow that changes over time is shown in Figure A1.
We extract the steady-state transport rates by averaging the values from the steady zone in the profile of the temporal transport evolution (see the definition of the steady zone in Section 3.1). Then, they are normalized using Equation (25) [21]. The plotted results in Figure 3b reveal that the simulated transport rate in the steady state, Q steady , exhibits a linear correlation with the Shields number, as claimed by [21]. They also align well with the measured data in wind tunnels and the empirical formulations [58,59,60,61].
Q ˜ = Q ρ p ( ρ p ρ a 1 ) g d mean 3
Due to the periodic boundary conditions, the particle flow is spatially homogeneous. In order to compare the temporal evolution observed in our simulations to the spatial (downwind) evolutions observed in experiments, we related the time to the downwind travel distance of the saltation cloud [23]. By integrating the average saltation velocity U sal ( t ) with time, through Equation (26), we calculated the downwind distance L. The average saltation velocity is taken from the coarse-grained particle velocity field in the saltation layer, defined as the vertical region where the particle velocity is higher than 0.1 u [20]. Figure 4a shows that the transport rate over downwind distance also displays a non-monotonous behavior, with an overshoot at a finite distance at first and a steady value sustaining at the end of the simulations. The evolution resembles the solution of a damped harmonic oscillator, as proposed by [14], with a strong correlation coefficient ( R 2 = 0.97). It is worth noting that the prescribed initial airflow field in our model may lead to relatively high overshoots, particularly at high Shields numbers ( Θ ˜ > 0.04). This can result in less accurate fitting of the evolution curves under such conditions.
L ( t ) = 0 t U sal d t
We defined the distance for the transport rate to reach its peak value as L peak and normalized it by the drag length, as Equation (27) shows. Figure 4b shows that the simulated peak distance, L peak increases with the Shields number, well in line with the experimental trend. According to [14], L peak is not sensitive to the upwind particle flux for dry sediment transport. Thus, even though the initial particle flux in our simulations is different from in their experiments, the same dependency is satisfyingly reproduced.
L ˜ = L ρ p ρ a d mean

3. Results

We performed 5 s transport simulations with various Shields numbers ( Θ ˜ = 0.01–0.06) and bed moisture contents ( Ω = 0–20%). We will first focus on the results of the steady part of the simulations in Section 3.1 and then present the results of the whole simulation time in Section 3.2.

3.1. The Steady State of Transport

We define the steady-state interval as the period from the first post-overshoot moment when the saltation concentration C sal falls within ±15% of the mean computed over the final 1.5 s of the record to the end of the record, since C sal saturates the latest among all the transport characteristics. The averaged values of several transport characteristics in the steady state of transport are calculated for all the Shields numbers and moisture contents. The saltation concentration ( C sal ) and mean saltation velocity ( U sal ) are taken as the height-integrated particle concentration in the saltation layer and the mean horizontal velocity of the saltating particles, respectively. The saltation height ( H 50 ) is the height below which 50% of transport occurs. Depicted in Figure 5, the steady-state transport rate, Q steady , does not seem to be altered by moisture remarkably due to the opposing effects on the saltation concentration ( C sal , steady ) and velocity ( U sal , steady ), which counterbalance each other. C sal , steady shows a decrease from dry to moist scenarios, suggesting that the ejection of new particles is restricted from a moist bed. In contrast, U sal , steady and H 50 , steady increase in the presence of moisture. The rise in U sal , steady is consistent with the wind-tunnel observations by [62], which reported saltating particles’ velocities 1.5–2 times higher over moist sand than over dry sand. Likewise, the moisture-induced thickening of the saltation layer agrees with field measurements [8], which found nearly double H 50 , steady on moist sand relative to dry under a similar range of wind shear velocity. Furthermore, among the moist bed conditions, the trend of these three characteristics with varying moisture content is not clearly apparent.

3.2. The Evolution of Transport

3.2.1. Temporal Evolution

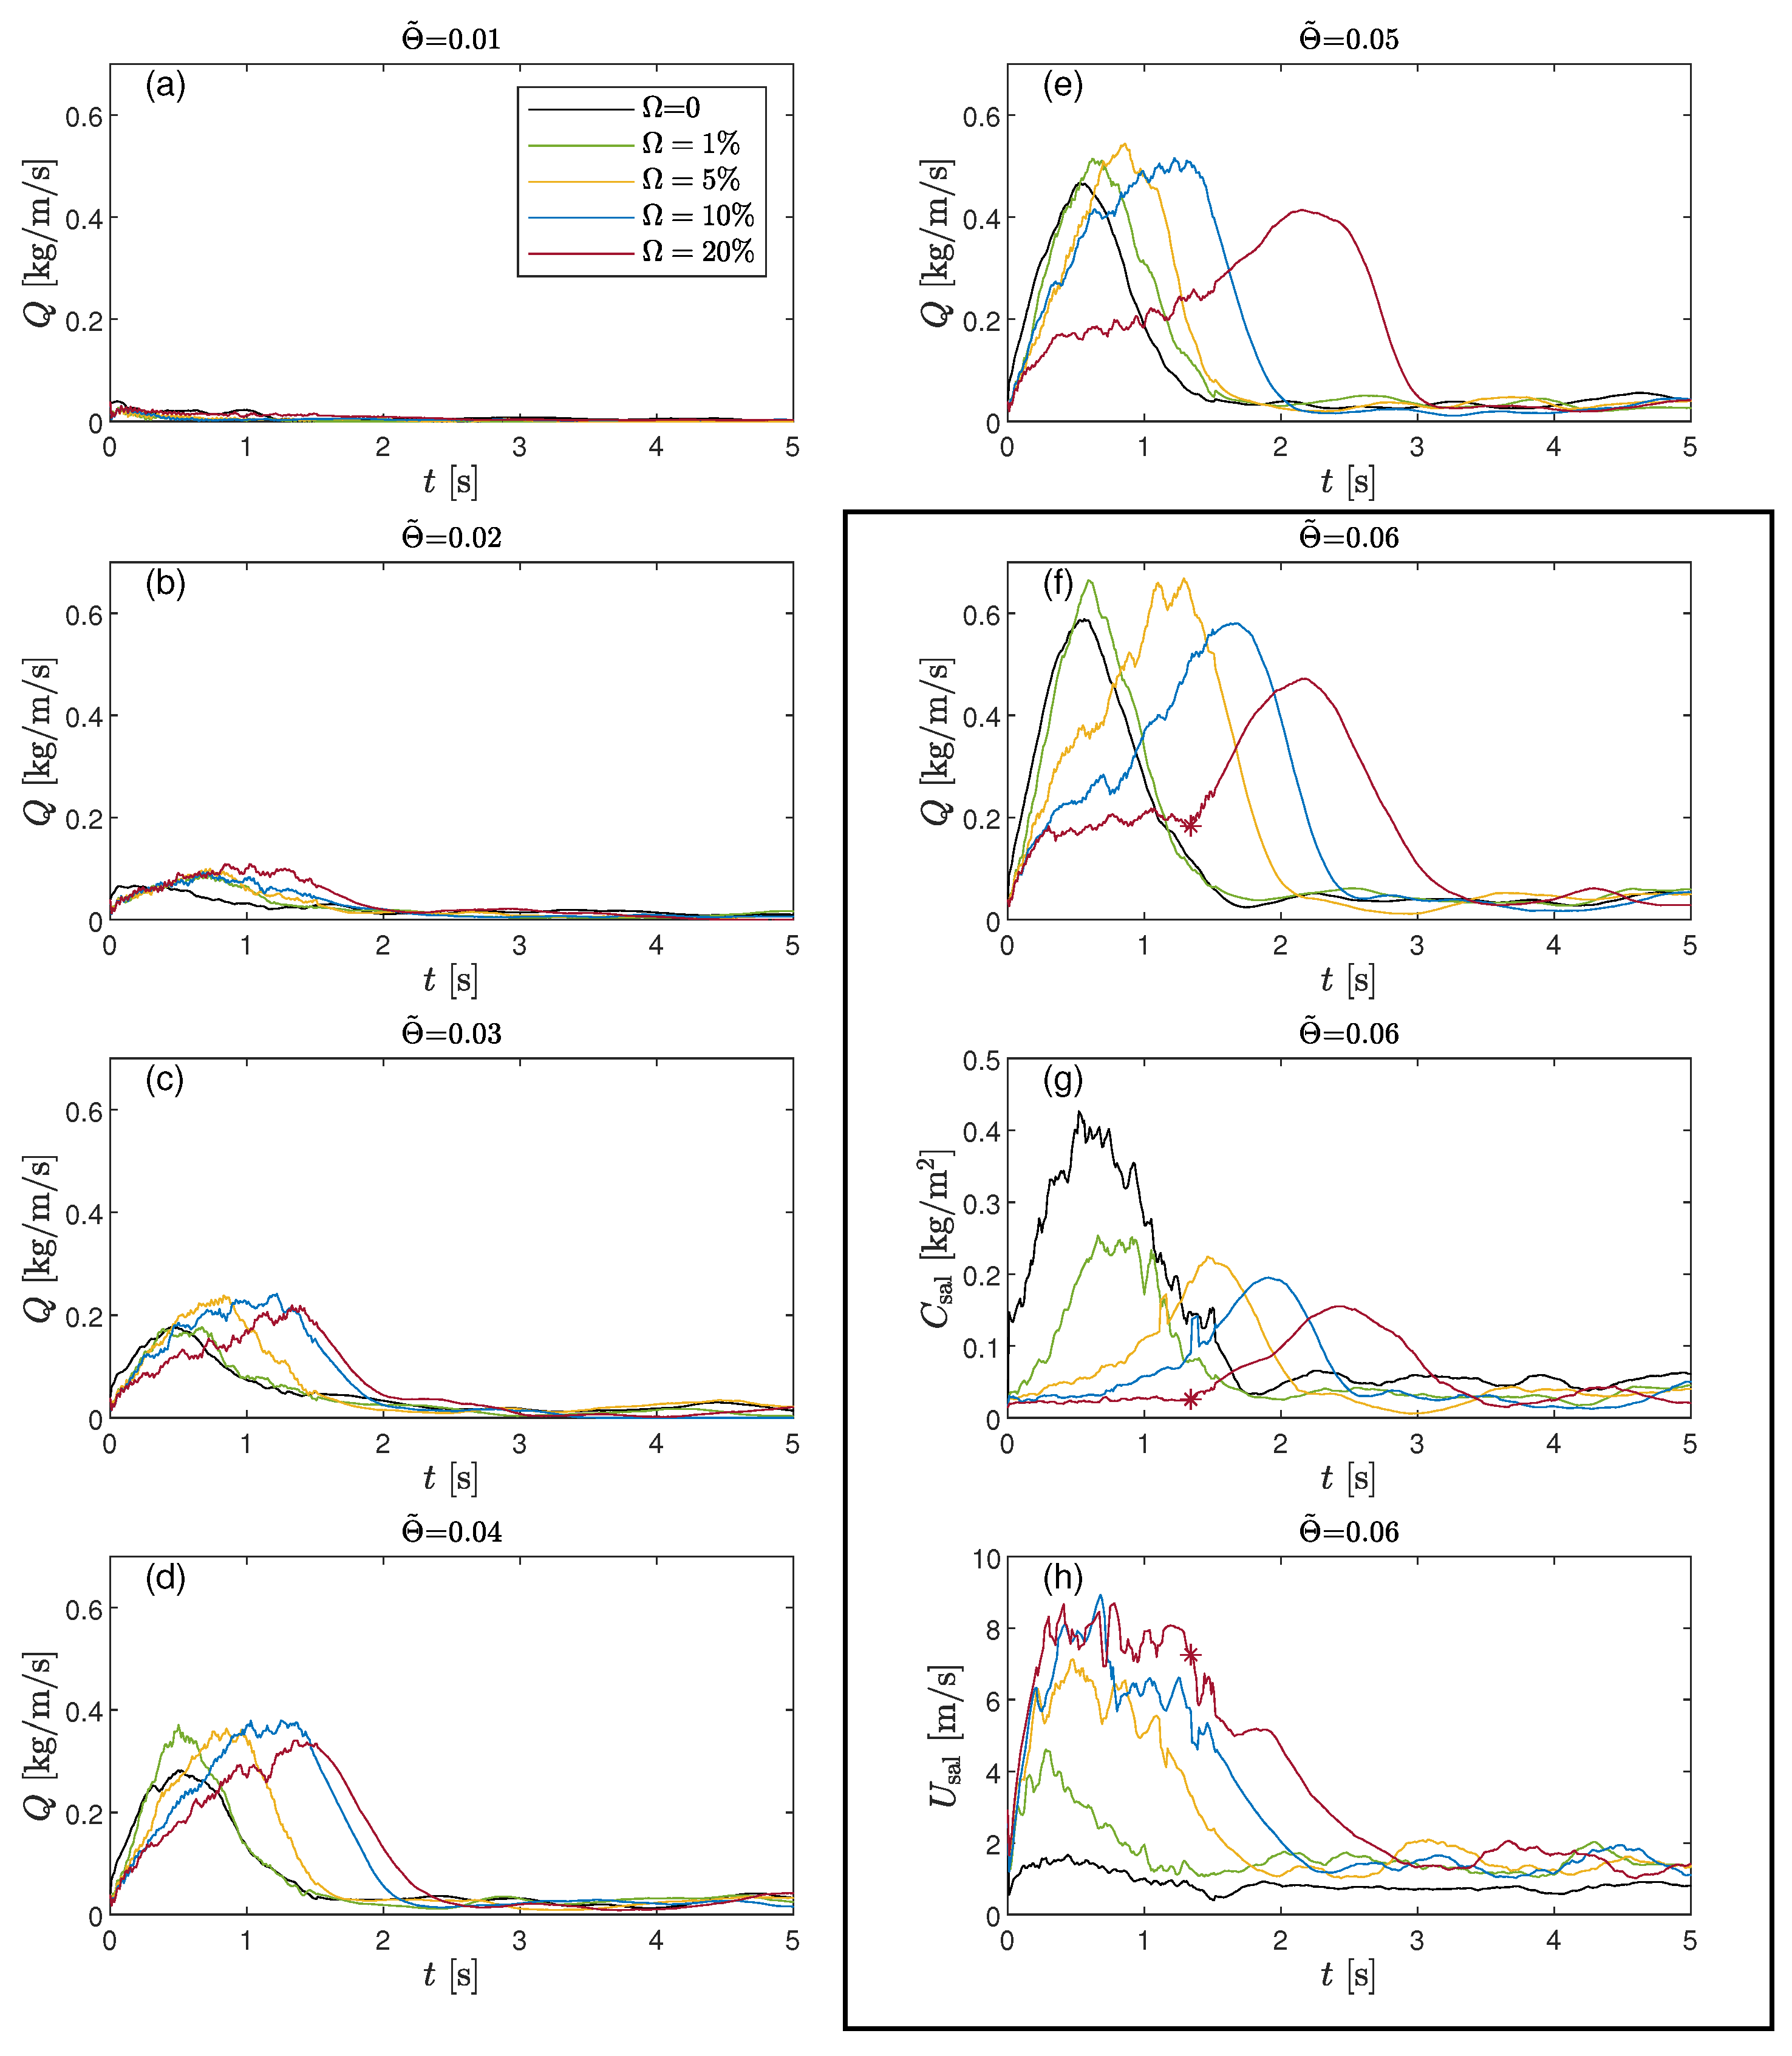
The temporal evolution of the transport rate is shown in Figure 6a–f for different moisture and wind shear conditions. The same pattern is observed for all the Shields numbers and moisture contents: the transport rate initially exhibits an overshoot, then stabilizes at a significantly lower rate corresponding to the steady-state value, consistent with observations [13,14,16]. As the Shields number increases, the overshoot becomes increasingly apparent, and the peak value rises. As the bed moisture content increases, the transport rate reaches the peak much later, forming a more complex shape with a slower growth phase of transport rate before the actual overshoot, qualitatively matching the finding in field conditions [16].
To unravel the mechanism of this difference between dry and moist conditions, we show in Figure 6g,h the saltation concentration ( C sal ) and the mean saltation velocity ( U sal ) versus time at the highest Shields number Θ ˜ = 0.06, where the difference is most visible. The results indicate that the peaks of C sal and U sal appear almost simultaneously for dry sediment. Conversely, under moist conditions, U sal peaks first, followed by C sal . Specifically, for the most moist case ( Ω = 20%) marked by the red curve in Figure 6f–h, there is a clear lag between the peaks of U sal and C sal , separated by the star at around t = 1.3 s. Until this point, C sal is almost constant near the initial value. Accordingly, the transport rate Q evolves in sync with U sal , increasing at the beginning and then showing a plateau. After this point, C sal rises significantly, showing an overshoot. Alongside the gradual decrease in U sal , the transport rate Q also exhibits a smooth overshoot.
To characterize the moisture effect on the temporal evolution of transport, the time scales for the growth phase of transport rate to reach its peak value ( T peak ) and the decline phase from the peak moment to the steady state ( T decline ) are extracted. T peak is the time duration until the maximum transport rate is reached, while T decline is the duration from the peak moment until the first moment when the transport rate falls within 15% of the steady-state value. We have checked that the trend of the results is insensitive to the arbitrary 15% criteria for defining T decline . Figure 7a shows that T peak clearly increases with both the moisture content and the Shields number. In contrast, Figure 7b shows that T decline decreases first and then increases with the increasing moisture content. This trend of T decline with the moisture content seems to be inversely related to that of the peak transport rate ( Q peak ) with the moisture content observed in Figure 7c.

3.2.2. Spatial Evolution

Figure 8 displays the spatial evolution of transport, projected from the temporal results via Equation (26), for all the Shields numbers and moisture contents. As stated in Section “Validation of the Transport Model at the Dry Limit”, under the dry condition, the evolution resembles the solution of a damped harmonic oscillator (see Figure 4a). In contrast, under moist conditions, it presents a more complicated shape, with its peak position shifting towards an increasing distance when the moisture content increases. A plateau is increasingly visible before the peak value is reached when there is more moisture in the bed, consistent with the observations on wet surfaces by [16].
To characterize the moisture effect on the spatial evolution of transport, we analyzed the spatial distances for the transport rate to reach its peak value, L peak . As expected, L peak increases with both the Shields number and moisture content. Here, we show the trend of L peak versus the wind shear velocity, u , for various moisture contents to relate to other studies [16,61]. Figure 9a suggests a linear correlation between L peak and u for all the moisture contents. It demonstrates a strong correlation coefficient ( R 2 = 0.91) and can be expressed using the following equation:
L peak = ( A Ω + B ) ( u u , t )
u , t = C Ω + D
with A = 205.79 s, B = 4.41 s, C = 0.22 m/s, and D = 0.22 m/s, respectively. u , t is the threshold shear velocity. In some field studies, the critical fetch distance is defined as the distance from a non-erodible boundary to where the maximum transport rate occurs [6,16,63,64]. A linear relation between the critical fetch distance and the shear velocity was hypothesized by [61] and adapted by [16] later using field-measured data (hereafter S24; we use “S24” to refer to both the field dataset and the empirical formula from that study). S24 expression is:
F c = 100   f moist δ sal + F c , t = 1.5 · 10 4 f moist d ref d 50 u u , t g + 63 u , t
where f moist is the moisture effect factor ( f moist = 1 for dry sediment and f moist > 1 for moist sand), δ sal is the saltation height of particles, d ref is a reference particle diameter with a value of 0.25 mm, and d 50 is the mean particle diameter. Indicated in the inset of Figure 9a, for dry sediment, L peak found by our model is clearly lower in value than the critical fetch distance predicted by Equation (30) for some reasons. First, in our simulations, the part of transport from the initiation of grain motion up to the point where our simulation starts is not modeled. Second, in field conditions, the surface is not perfectly dry, as assumed in our model simulations. Beyond these, the grain size, wind condition, and likely other factors may also play additional roles in the fetch distance in field conditions. In the moist scenarios, we found that L peak shows increasing sensitivity to u at higher moisture contents. This qualitatively matches the observations on wet surfaces by [16], shown in the inset in Figure 9a, and provides insights into the dependency of the critical fetch distance on the surface moisture content.
As stated before, we also run simulations with three different initial conditions, in which different numbers of particles are injected to the system, at Θ ˜ = 0.06. The results in Figure 9b indicate that the increase in L peak with moisture content remains consistent across different initial conditions. Furthermore, it can be seen that L peak is also a function of this initial particle flux under moist conditions, but it remains insensitive to it under dry conditions, matching the observations in [14]. With a higher particle flux fed into the system from upwind, the distance needed to reach the peak value and the steady state decreases. However, further study is needed to establish a comprehensive and detailed relationship between them.

4. Discussion

Our numerical outcomes indicate that steady-state transport rate is insensitive to bed moisture, supporting the claim by [65,66]. This insensitivity is due to the balance between the reduced concentration of saltating particles and their enhanced velocity under moist conditions. The reduced saltation concentration suggests that the ejection of particles is restricted on moist beds, consistent with previous observations [3,7,8,61]. However, the mechanism that leads to the observed increase in the mean saltation velocity under moist conditions still remains unclear. On the one hand, this may be attributed to the reduced number of saltating particles, which causes less deceleration to the wind flow, allowing them to accelerate to higher velocities. On the other hand, it could also be a result of a higher restitution coefficient from the rebounds on moist beds. Studies by [24,65] have shown that rebound dynamics are insensitive to cohesion, lending more support to the first explanation. Accordingly, the average saltation velocity remains almost constant within moist scenarios given an invariant saltation concentration. Even so, it still remains unclear what causes the steady-state saltation concentration to stay constant under moist conditions. To clarify these effects, we will conduct a detailed grain-scale analysis of rebound dynamics, which is the focus of our ongoing work. In addition, experimental studies that systematically measure saltation concentration, velocity, and layer thickness across increasing moisture contents in the steady state of transport are strongly encouraged for model validation.
Our model results support many field observations and empirical relations about transport evolution derived from previous studies. Under dry conditions, the spatial transport evolution projected from the model results is compatible with the solution of a damped harmonic oscillator proposed by [14]. Conversely, the evolution under moist conditions presents a more complicated shape, with an increasingly visible slower growth phase before the actual overshoot as the moisture content increases, qualitatively consistent with observations in the field [16]. Evidenced by previous studies and implied by our simulations, the ejection of new particles is restricted due to the presence of liquid bridges [15,16,27,67], but the mean saltation velocity is enhanced on moist beds. Accordingly, once the ten particles are released, they accumulate momentum from the wind flow gradually by bouncing over the moist surface constantly until their impact velocities reach the threshold for ejecting new particles from the bed. In the most moist case, the initiating particles travel much longer to build up their momentum. Moreover, as evidenced by the higher saltation height, the time required for these particles, once they have gained sufficient momentum, to descend from the air, impact the bed, and eject other particles is also extended. This leads to a more pronounced lag between the peaks of the mean saltation velocity and the saltation concentration. This may explain the slower growth phase of the transport rate before the actual overshoot observed in the transport evolution curves. On the other hand, moisture in the bed has a minimal influence on the particle dynamics in the air, which likely results in the observation that the time scale of the decline phase of transport shows a less clear trend with moisture content. However, the potential inverse relationship between the time scale of the decline phase of the transport rate and its peak value implies that moisture may indirectly influence the decline phase of transport through its impact on peak transport rate. Further investigation is required to confirm this connection.
By projecting the temporal results into a spatial representation, we found that the distance for reaching the peak transport rate, L peak , follows a linear scaling law with the wind shear velocity, consistent with the finding by [14] for dry sediment in wind-tunnel environments and by [16] in field conditions. When compared to the predicted critical fetch distance in field conditions [16], a noticeable difference is observed, the reasons for which have been discussed in Section 3.2.2. Notably, although the initiation of motion of the first grain is not modeled in our model, the distance from the initiation of grain motion up to the point where our model simulation starts could potentially increase with increasing bed moisture content and wind shear condition. For this reason, the found linear relation with a dependency on shear velocity is still plausible. In moist scenarios, our results indicate that this peak distance also increases with moisture content, matching many field observations on moist surfaces [6,11,15,16]. We further found that the dependency of this peak distance on shear velocity and critical shear velocity both present linear relations with moisture content, which puts forward a solid basis for quantifying the moisture effect on transport saturation. Due to the inevitable discrepancy between the simulated transport and real-world situations, which will be discussed later, we highly recommend further investigation on this issue in wind-tunnel and/or field environments.
Furthermore, our simulation results preliminarily suggest that this peak distance is insensitive to the initial particle flux under the dry condition, favoring the finding in the wind-tunnel environment [14]. In contrast, under moist conditions, it is found to decrease with the initial particle flux, which provides important insights into transport on a spatially inhomogeneous surface, e.g., a transition boundary between a dry surface and a moist surface. Extended study is encouraged to quantify the relationship between peak/saturation distance and upwind particle flux under moist conditions.
The periodic boundary conditions used in our model provide a compromising way to simulate an ‘infinite’ domain without having to model the enormous amount of particles, allowing for transport evolution until steady state. Even though compromised, the simulation time for each run still spans weeks. Different from that in the real world, the simulation maintains a uniform and consistent supply of sediment particles compared to a bounded domain where particles could accumulate. The continuous reintroduction of particles maintains a more uniform distribution of momentum across the domain, promoting faster stabilization of transport. Furthermore, in this work, the spatial evolution of transport was translated from the temporal evolution by interpreting the downwind distance as the time integral of the mean saltation velocity. First, the integration ignores the dispersion of individual particles’ velocities. Second, by tracking the modeled frame over the downwind distance, the saltation initiated by wind subsequently in the ‘upwind’ area is excluded. Despite these differences, our numerical results still qualitatively support many previous findings and provide many valuable insights into moisture effects on transport saturation.
In order to focus on the impact of moisture from liquid bridges on the evolution of transport dynamics upon the initiation of transport, evaporation was excluded in the current simulations. However, the estimations in Appendix D suggest that evaporation changes the water content of the sand bed surface and might be substantial under certain environmental conditions. For example, under highly favorable conditions for evaporation—air temperature of 30 °C and relative humidity of 50%—evaporation can deplete the liquid in the topmost particle layer of the sand bed (for the case Ω = 1 % ) within seconds to minutes, whereas typical coastal climates lengthen the timescale from tens of seconds to several minutes depending on the resistance to vapor transport. These results justify our omission for the present simulations but also highlight that the resistance parameter for vapor escape may affect the results. However, this is beyond the scope of this study. As mentioned in Section 2.4, wind-driven initiation of transport on moist beds is impossible at Shields numbers corresponding to typical aeolian conditions in our model simulations. This suggests that evaporation from the top sand layer can play a critical role in facilitating an aerodynamic entrainment, consistent with the field observations by [50], and thus should be included in the model for wind-driven initiation of transport. However, as the steady-state transport rate was found to be insensitive to variations in moisture content, it will likely not be affected much by evaporation. Relatedly, evaporation might be further enhanced by the drying of the saltating particles flying through the air after being ejected by particle impact, which might correspond to the dry deposits observed in sand strips, dry bedforms on top of a moist beach surface. However, the dominant effect of bed moisture found on aeolian transport is the inhibition of new grain entrainment by liquid bridges rather than a significant influence on the motion of grains already in saltation.
Other than evaporation, further processes governing moisture variation in the upper sand layers, such as capillary rise from the groundwater head, precipitation, and percolation [68,69], may also play a significant role in aeolian transport. Even at the same overall moisture content, the distribution of water within the sand packing can differ depending on the source. For example, precipitation may lead to a more heterogeneous distribution of liquid bridges compared to saturation from tidal submergence or groundwater fluctuations as rain may selectively wet some grains while leaving others dry. Future work should include these mechanisms, alongside dynamic evaporation, to extend the model’s realism and scope.

5. Conclusions

We presented a novel grain-scale numerical modeling framework, which adds a dynamic viscous force and an evolving migration rule to liquid bridges, for exploring the role of moisture with varying volume contents on the evolution of aeolian sediment transport from a few moving grains towards fully developed steady-state transport. In this work, we isolated the effect of moisture on sediment transport from those mechanisms that might modify the total amount of moisture in the sand bed (e.g., evaporation and groundwater supply). Simulations for a range of wind conditions (Shield numbers Θ ˜ = 0.01–0.06) and moisture content ( Ω = 0–20%) revealed that the amount of moisture has little impact on the magnitude of the sand transport rate in the steady-state phase because of its opposing effects on saltation concentration and mean saltation velocity. However, in the transient phase prior to the steady-state transport phase, characterized by the occurrence of a transport overshoot, moisture substantially affects the evolution of transport. It extends the time scale for the growth phase of the transport rate until the peak value of the transport overshoot but shows a less clear influence on the time scale of the transport decline phase. The slower growth phase prior to the onset of transport overshoot for moist cases could be explained by the finding that the sand concentration peaks increasingly later with increasing moisture content compared to the peak in the mean saltation velocity. By projecting the temporal delay in the transport rate overshoot to a spatial equivalent in terms of a downwind shifting of the position of the peak transport rate, the results show that this shift scales linearly with wind shear velocity, with increasing sensitivity to higher moisture content. A preliminary analysis suggests that, in moist conditions, transport saturation is also influenced by the initial particle flux, offering insights into transport behavior on surfaces with varying spatial properties. Moreover, the difficulty of aerodynamic entrainment on moist beds implies that evaporation is essential for modeling the initiation of transport solely by wind, while the steady-state transport rate is expected to remain insensitive to moisture content even if evaporation were included in the model.
This study demonstrates the ability of our grain-scale model to capture key features of transport patterns observed in laboratory and field campaigns, revealing the mechanisms through which moisture influences transport evolution and saturation. These findings help to explain the longer fetch observed on moist beach surfaces and provide a physics-based tool for predicting transport rates under variable moisture levels. While our model currently omits evaporation and groundwater replenishment, integrating these moisture-exchange processes and validating against longer wind-tunnel runs are important subsequent priorities.

Author Contributions

Conceptualization, X.W., G.H.P.C., T.W., A.R.T. and K.M.W.; methodology, X.W., G.H.P.C. and T.W.; software, X.W.; validation, X.W.; formal analysis, X.W.; investigation, X.W.; writing—original draft preparation, X.W.; writing—review and editing, G.H.P.C., T.W., A.R.T. and K.M.W.; visualization, X.W.; supervision, G.H.P.C., T.W., A.R.T. and K.M.W. All authors have read and agreed to the published version of the manuscript.

Funding

This research received no external funding.

Data Availability Statement

MercuryDPM (commit a9bf46b) used for running the simulations of aeolian sediment transport is available via BSD 3-Clause and developed openly in a fork of the main repository at Bitbucket (https://bitbucket.org/xiuqiwang/mercurydpm) (accessed on 19 June 2025). The code will soon be ported to the main repository of MercuryDPM and will be preserved at 4TU Research. The MATLAB (R2021a) code (commit 0982ac8) for the analysis and figure generation are developed openly at Github (https://github.com/XiuqiWang/DPMPaper) (accessed on 2 September 2025) under BSD 3-Clause. The scripts will also be preserved at 4TU Research.

Acknowledgments

We sincerely thank Stefan Luding for the invaluable help and insightful suggestions throughout the development of this work. We also appreciate Sierd de Vries and Caroline Hallin for their valuable discussions, which contributed to enhancing the quality of this research.

Conflicts of Interest

The authors declare no conflicts of interest.

Appendix A. Evolution of Wind Velocity Profile
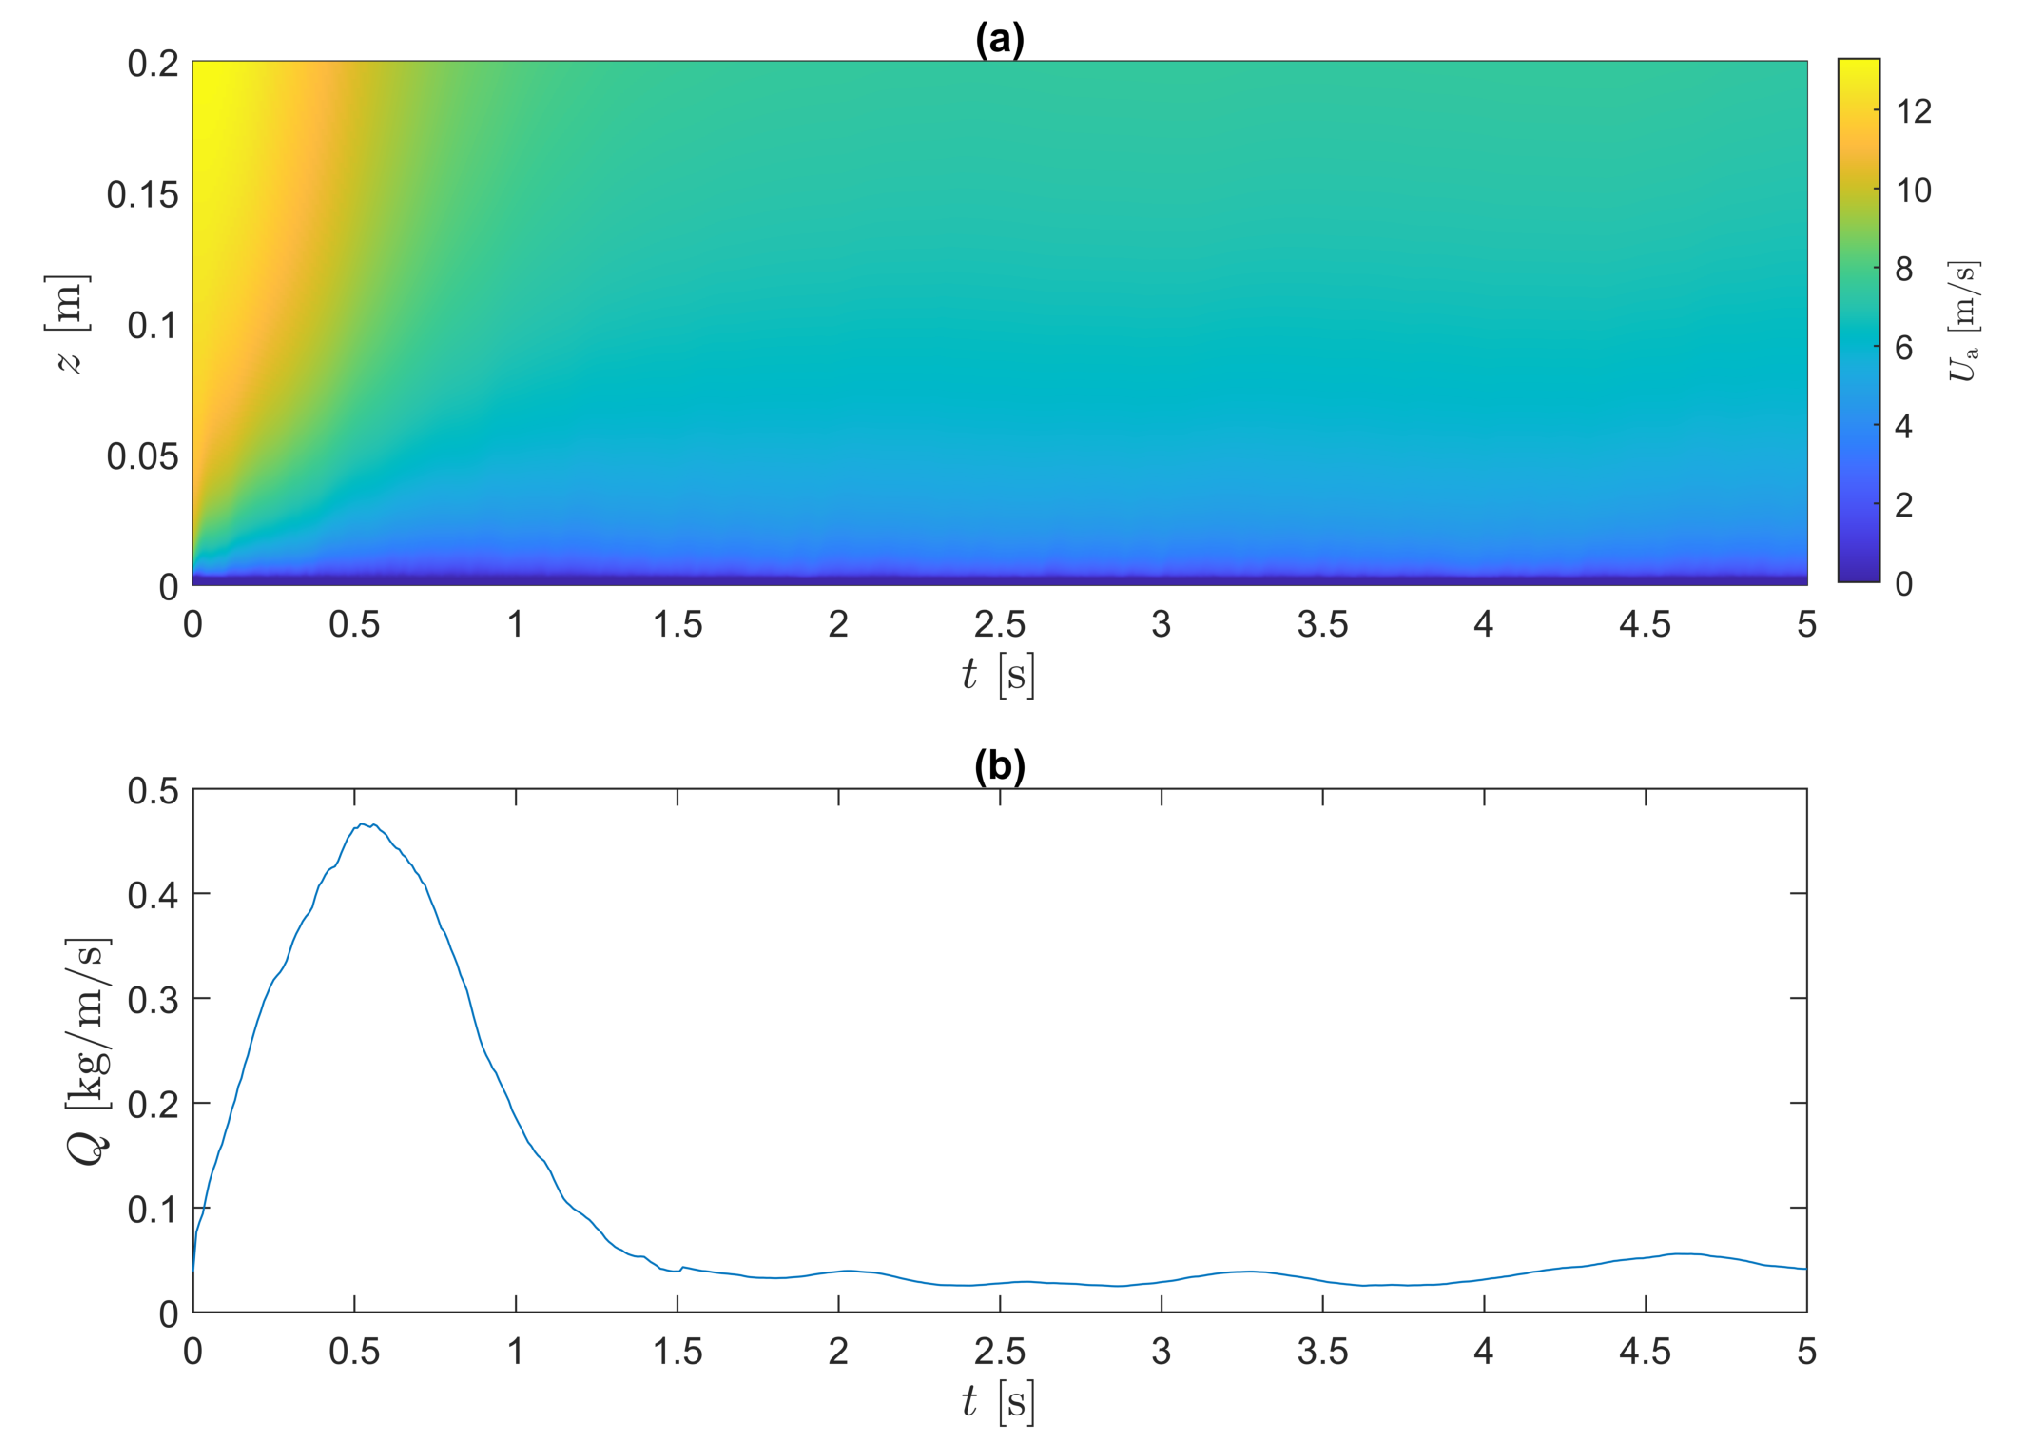
The temporal evolution of the wind velocity field, which adapts to the feedback from sediment transport, and the sediment transport rate are presented in Figure A1.
Figure A1. (a) The simulated wind velocity field ( U a ); (b) the transport rate (Q) versus time (t) at Θ ˜ = 0.05 and Ω = 0.
Jmse 13 01733 g0a1

Appendix B. Direct Shear Test of the Moist Sediment Bed

To ensure that the sediment bed in the transport simulations has reasonable cohesive behavior with increasing moisture content, we conducted DPM simulations of direct shear tests at five moisture contents, each under three confining pressures, following the approach of [46]. Detailed procedures in MercuryDPM can be found in [70]. The model parameters were identical to those used in the transport simulations, and moisture was inserted using the same procedure to ensure comparability. The resulting yield loci ( τ σ ), shown in Figure A2a, allow the extraction of the Coulomb cohesion c for each moisture content. Figure A2b shows that c increases with moisture content Ω and approaches a saturation value of approximately 120 Pa between 1% and 5% moisture. This saturation trend agrees with both experimental results for monodisperse glass beads and numerical findings by [46] despite the difference in grain sizes between our simulations and their work. This agreement confirms that the cohesive behavior of the sediment bed in our model is physically reasonable. The saturation of c suggests that the bulk cohesion becomes insensitive to further increases in moisture once the number of liquid bridges per particle reaches a maximum, supporting the validity of the liquid-distribution method adopted in our transport simulations.
Figure A2. (a) The yield loci τ σ for varying moisture contents of the bed ( Ω ); (b) the Coulomb cohesion (c) versus moisture content ( Ω ).
Jmse 13 01733 g0a2

Appendix C. An Overview of Different Initiation Conditions

Details of the three initial particle fluxes applied to initiate sediment transport are provided in Table A1.
Table A1. Particle information for different initial conditions (the y position for all the initiating particles is 2.5 × 10 4 m, and the particle velocity in y direction is 0).
Number of Initiating
Particles (Nip)
Particle IDPosition ×   10 3 [m]Velocity [m/s]Diameter [mm]
x z U p , x U p , z d p
10143.751−10.28
283.752−20.25
3123.753−30.22
4163.754−40.19
5203.755−50.16
6458−80.16
7856.4−6.40.19
81254.8−4.80.22
91653.2−3.20.25
102051.6−1.60.28
5143.92.10−2.100.27
284.13.34−3.340.24
3124.43.90−3.900.22
4164.63.44−3.440.24
5204.82.13−2.130.27
11124.42.92−2.920.25

Appendix D. An Estimation of Evaporation During Transport

Appendix D.1. Evaporation from the Bed

Evaporation from a bare soil surface consists of two stages: molecular diffusion of water vapor via the pores in the bed towards the bed surface and turbulent-enhanced diffusion mixing from the bed surface into the atmosphere. It can be estimated using the equation below, which was derived by [71] based on experiments with a 2 cm thick sand layer.
E = ρ a C E u a , 50 q ( T S ) q 1 + C E u a , 50 F ( θ w ) / D atm
in which E [kg/m2/s] is the evaporation rate, C E is the bulk coefficient of evaporation, u a , 50 [m/s] and q are the velocity and the specific humidity of the air at 50 cm above the soil surface, and q ( T S ) is the saturated specific humidity near the water front in soil pores at the soil temperature T S [K]. The specific humidity q can be calculated with the formula from [72] as follows:
q = 0.622 e vapor p 0.378 e vapor
where e vapor [hPa] is the partial water vapor pressure, and p = 1013.25 hPa is the atmospheric pressure. e vapor can be calculated from the saturation vapor pressure e vapor , s and the relative humidity RH in the air.
e vapor = RH e vapor , s
where e vapor , s is the saturation vapor pressure at the air temperature T a [K] and can be calculated through the following equation [73]:
e vapor , s = 6.1078 exp 17.27 ( T a 273.15 ) T a 35.86
F ( θ w ) [m] represents the resistance to water vapor diffusion from the internal pore surfaces within the soil to the soil bed surface. In unsaturated soils, moisture is primarily located in the deeper layers, leaving the upper layers relatively dry. As the bulk moisture content decreases, more pores in the upper layers become air-filled, increasing the distance the water vapor must travel to reach the surface. This results in a higher resistance to vapor diffusion. Introduced by [71], F ( θ w ) is a function of bulk volumetric soil moisture content θ w ,
F ( θ w ) = F 1 ( θ w , s θ w ) F 2
in which F 1 = 8.32 · 10 5 m and F 2 = 16.6 are empirical coefficients, and the saturation volumetric soil moisture content θ w , s = 0.392 is determined for sand in the experiment. θ w can be translated from the moisture content by volume in our study Ω through θ w = Ω / ( 1 + e void ) with the void ratio of the soil bed e void . D atm [m2/s] is the molecular diffusivity of water vapor and is formulated by [74]
D atm = D 0 T S 273.15 1.75
in which D 0 = 0.229 · 10 4 m2/s.
To reasonably estimate the evaporation from the sand bed simulated in our study using the chosen equation, we applied a relative humidity of RH = 50% and an air temperature of T a = 30 °C to the case with the lowest moisture content ( Ω = 1%), representing a favorable yet realistic condition for evaporation. An airflow velocity of 9 m/s was used, which corresponds to the highest Shields number used in our work, 0.06. A relatively high value of the bulk transfer coefficient, C E = 2.5·10−2, was adopted from the experimental work of [71]. The soil temperature was assumed equal to the air temperature as the topmost sand layer in our simulation is in direct contact with the air. In the referenced experiment, the sand layer is 2 cm, with relatively drier upper layers and moist bottom layers. In contrast, in our simulation, the liquid bridges are present even in the pores of the top layer, eliminating the diffusive transport path typical in unsaturated soils. To account for this difference and to better represent the lower vapor diffusion resistance in our model, we increased the bulk volumetric soil moisture content to the range θ w = 0.03–0.10, which corresponds to Ω = 5–15% assuming a void ratio of 0.5, much higher than the original 1%. This adjustment yields a corresponding range of diffusion resistance values F = 0.0019–0.034 m. Based on these conditions, the estimated evaporation rate is in the range E = 1.31 · 10 5 –2.17 · 10 4 kg/m2/s, resulting in a total evaporation time of 6.56–109.21 s for the liquid content in the top particle layer. It should be noted that, on the one hand, this estimate reflects an idealized scenario, where several conditions are optimized to favor evaporation. If typical environmental conditions for coastal beaches are to be applied, i.e., RH = 80% and T a = 15 °C [75], the evaporation time is in the range 44.91–751.51 s. Moreover, the calculation assumes a constant evaporation rate, implying a fixed resistance throughout the process. In reality, as vapor is removed from the topmost liquid bridges, the effective resistance for vapor transport from lower bridges, connecting particles across the top and second layers, increases. This progressive resistance would reduce the evaporation rate and extend the total evaporation time. On the other hand, the resistance value adopted in the calculation is not straightforward to validate. If the actual resistance is lower than assumed, the evaporation rate could be higher, resulting in a shorter total evaporation time. Therefore, the estimate serves only as a reference, and a more accurate quantification would require further investigation.

Appendix D.2. Evaporation on a Moist Saltating Particle

The evaporation on a saltating particle that carries moisture can be estimated through an evaporation equation of a water droplet in ambient air, given by [76,77]
d D drop d t = 4 M l D v D drop ρ l R T f Δ e vapor ( 1 + 0.276 R e 1 / 2 S c 1 / 3 )
in which D drop [m] is the diameter of a spherical water drop diameter in air, M l = 0.018 kg/mol is the molecular weight of the evaporating water, D v is the average diffusion coefficient for vapor molecules in the saturated film around the drop, ρ l = 1000 kg/m3 is the density of water, R = 8.3144 J/mol/K is the gas constant, T f [K] is the average absolute temperature in the film, Δ e vapor [Pa] is the difference between the vapor pressure near the drop and that in the ambient air, and R e and S c are the Reynolds’ number and the Schmidt’s number. They are calculated for the saturated film at temperature T a [K].
R e = ρ a D drop u r μ a
S c = μ a ρ a D v
in which ρ a = 1.225 kg/m3 is the air density, u r [m/s] is the velocity of the drop relative to the ambient air, and μ a [kg/m/s] is the dynamic air viscosity at temperature T a .
The viscosity and diffusion coefficient of air is related to the air temperature T a [°C] [77]:
μ a = ( 17.1 + 0.067 T a 0.0004 T a 2 ) · 10 6
D v = 21.2 · 10 6 ( 1 + 0.0071 T a )
The difference in the vapor pressure is expressed as follows:
Δ e vapor = e vapor , f e vapor , a RH
where the vapor pressure e vapor , f and e vapor , f can be calculated using Equation (A4) with the corresponding temperatures.
To estimate the moisture loss from a saltating particle in our simulations, we evaluated the relative moisture loss from a particle with a diameter of 0.25 mm during one hop. It is assumed that the water on a saltating particle is a spherical drop enveloping the particle. The droplet diameter is taken as the sum of the particle diameter and twice the thickness of the liquid film, calculated from the initial moisture content of the bed. For example, for the case where Ω = 1%, the particle initially carries liquid equivalent to 1% of its own volume at the start of the hop. Given the film’s minimal thickness, its temperature T f was assumed to be equal to the ambient air temperature T a . A relative velocity u r = 2 m/s was adopted as a representative value for saltating particles, and a particle hopping time of t hop = 0.3 s was assumed. A range of relative humidities and air temperatures were tested for the five moisture contents simulated in our study.
The relative evaporated liquid volume from a saltating particle during a single hop was calculated as the ratio of the evaporated volume V l , e to the initial liquid volume V l , i . As shown in Figure A3, the relative evaporated volume increases with air temperature and decreases with relative humidity for all moisture contents. Notably, under the same environmental conditions, particles with lower bed moisture content experience significantly greater relative evaporation. In particular, for the lowest simulated moisture content, the liquid completely dries out during a single hop under 75% of the tested conditions. This suggests that evaporation from moist saltating particles can be more pronounced than from the bed surface due to greater exposure to ambient air. However, it should be noted that the relative velocity between the saltating particle and the ambient wind is time-dependent, which affects the evaporation rate. The use of a constant relative velocity in the calculation may therefore lead to an overestimation of the actual evaporation. Furthermore, real sand particles are not ideally spherical and thus provide poorer wetting conditions than spherical particles [78]. Consequently, instead of a uniform film, the liquid is more likely to be stored as water drops within surface concavities, which reduces exposure to air and thus limits evaporation. As evidenced by a field measurement by [9], the sand grains in transport were moist even 300 s after being trapped from a wet sandy beach, which further supports that the evaporation on saltating grains can be minimal in field conditions.
Figure A3. The relative evaporated liquid volume for a saltating particle in one hopping time ( V l , e / V l , i ) versus air temperature ( T a ) and relative humidity (RH).
Jmse 13 01733 g0a3

References

  1. Belly, P.Y. Sand movement by wind. In USACE Technical Memorandum 01; U.S. Army Corps of Engineers: Washington, DC, USA, 1964. [Google Scholar]
  2. McKenna-Neuman, C.; Nickling, W.G. A theoretical and wind tunnel investigation of the effect of capillary water on the entrainment of sediment by wind. Can. J. Soil Sci. 1989, 69, 79–96. [Google Scholar] [CrossRef]
  3. Neuman, C.M.; Scott, M.M. A wind tunnel study of the influence of pore water on aeolian sediment transport. J. Arid. Environ. 1998, 39, 403–419. [Google Scholar] [CrossRef]
  4. Dong, Z.; Liu, X.; Wang, X. Wind initiation thresholds of the moistened sands. Geophys. Res. Lett. 2002, 29, 25-1–25-4. [Google Scholar] [CrossRef]
  5. Han, Q.; Qu, J.; Zhang, K.; Zu, R.; Niu, Q.; Liao, K. Wind tunnel investigation of the influence of surface moisture content on the entrainment and erosion of beach sand by wind using sands from tropical humid coastal southern China. Geomorphology 2009, 104, 230–237. [Google Scholar] [CrossRef]
  6. Davidson-Arnott, R.G.D.; Yang, Y.; Ollerhead, J.; Hesp, P.A.; Walker, I.J. The effects of surface moisture on aeolian sediment transport threshold and mass flux on a beach. Earth Surf. Processes Landforms J. Br. Geomorphol. Res. Group 2008, 33, 55–74. [Google Scholar] [CrossRef]
  7. Han, Q.; Qu, J.; Liao, K.; Zhu, S.; Zhang, K.; Zu, R.; Niu, Q. A wind tunnel study of aeolian sand transport on a wetted sand surface using sands from tropical humid coastal southern China. Environ. Earth Sci. 2011, 64, 1375–1385. [Google Scholar] [CrossRef]
  8. Rotnicka, J. Aeolian vertical mass flux profiles above dry and moist sandy beach surfaces. Geomorphology 2013, 187, 27–37. [Google Scholar] [CrossRef]
  9. Swann, C.; Lee, D.; Trimble, S.; Key, C. Aeolian sand transport over a wet, sandy beach. Aeolian Res. 2021, 51, 100712. [Google Scholar] [CrossRef]
  10. Davidson-Arnott, R.G.D.; Bauer, B.O. Aeolian sediment transport on a beach: Thresholds, intermittency, and high frequency variability. Geomorphology 2009, 105, 117–126. [Google Scholar] [CrossRef]
  11. Delgado-Fernandez, I.; Davidson-Arnott, R. Meso-scale aeolian sediment input to coastal dunes: The nature of aeolian transport events. Geomorphology 2011, 126, 217–232. [Google Scholar] [CrossRef]
  12. Bagnold, R. The Physics of Blown Sand and Desert Dunes; University of Arizona Press: Tucson, AZ, USA, 1941. [Google Scholar]
  13. Shao, Y.; Raupach, M. The overshoot and equilibration of saltation. J. Geophys. Res. Atmos. 1992, 97, 20559–20564. [Google Scholar] [CrossRef]
  14. Selmani, H.; Valance, A.; Ould El Moctar, A.; Dupont, P.; Zegadi, R. Aeolian sand transport in out-of-equilibrium regimes. Geophys. Res. Lett. 2018, 45, 1838–1844. [Google Scholar] [CrossRef]
  15. Delgado-Fernandez, I. A review of the application of the fetch effect to modelling sand supply to coastal foredunes. Aeolian Res. 2010, 2, 61–70. [Google Scholar] [CrossRef]
  16. Strypsteen, G.; Delgado-Fernandez, I.; Derijckere, J.; Rauwoens, P. Fetch-driven aeolian sediment transport on a sandy beach: A new study. Earth Surf. Processes Landforms 2024, 49, 1530–1543. [Google Scholar] [CrossRef]
  17. Haehnel, R.; Buck, N.; Song, A. Moisture effects on eolian particle entrainment. Environ. Fluid Mech. 2014, 14, 135–156. [Google Scholar] [CrossRef]
  18. Cundall, P.A.; Strack, O.D. A discrete numerical model for granular assemblies. Geotechnique 1979, 29, 47–65. [Google Scholar] [CrossRef]
  19. Gladkyy, A.; Schwarze, R. Comparison of different capillary bridge models for application in the discrete element method. Granul. Matter 2014, 16, 911–920. [Google Scholar] [CrossRef]
  20. Carneiro, M.V.; Pähtz, T.; Herrmann, H.J. Jump at the onset of saltation. Phys. Rev. Lett. 2011, 107, 098001. [Google Scholar] [CrossRef]
  21. Durán, O.; Andreotti, B.; Claudin, P. Numerical simulation of turbulent sediment transport, from bed load to saltation. Phys. Fluids 2012, 24, 103306. [Google Scholar] [CrossRef]
  22. Pähtz, T.; Durán, O. The cessation threshold of nonsuspended sediment transport across aeolian and fluvial environments. J. Geophys. Res. Earth Surf. 2018, 123, 1638–1666. [Google Scholar] [CrossRef]
  23. Pähtz, T.; Omeradžić, A.; Carneiro, M.V.; Araújo, N.A.; Herrmann, H.J. Discrete element method simulations of the saturation of aeolian sand transport. Geophys. Res. Lett. 2015, 42, 2063–2070. [Google Scholar] [CrossRef]
  24. Comola, F.; Gaume, J.; Kok, J.F.; Lehning, M. Cohesion-induced enhancement of aeolian saltation. Geophys. Res. Lett. 2019, 46, 5566–5574. [Google Scholar] [CrossRef]
  25. Jia, S.; Wang, Z. Simulation of aerodynamic entrainment with interparticle cohesions based on discrete element method. Earth Surf. Processes Landforms 2021, 46, 1410–1418. [Google Scholar] [CrossRef]
  26. Dun, H.; Yue, P.; Huang, N.; Zhang, J. Discrete Element Simulation on Sand-Bed Collision Considering Surface Moisture Content. Processes 2021, 10, 52. [Google Scholar] [CrossRef]
  27. Ralaiarisoa, V.; Dupont, P.; El Moctar, A.O.; Naaim-Bouvet, F.; Oger, L.; Valance, A. Particle impact on a cohesive granular media. Phys. Rev. E 2022, 105, 054902. [Google Scholar] [CrossRef]
  28. Roy, S.; Luding, S.; Weinhart, T. Liquid redistribution in sheared wet granular media. Phys. Rev. E 2018, 98, 052906. [Google Scholar] [CrossRef]
  29. Weinhart, T.; Orefice, L.; Post, M.; van Schrojenstein Lantman, M.P.; Denissen, I.F.; Tunuguntla, D.R.; Tsang, J.; Cheng, H.; Shaheen, M.Y.; Shi, H.; et al. Fast, flexible particle simulations—An introduction to MercuryDPM. Comput. Phys. Commun. 2020, 249, 107129. [Google Scholar] [CrossRef]
  30. Thornton, A.R.; Plath, T.; Ostanin, I.; Götz, H.; Bisschop, J.W.; Hassan, M.; Roeplal, R.; Wang, X.; Pourandi, S.; Weinhart, T. Recent advances in MercuryDPM. Math. Comput. Sci. 2023, 17, 13. [Google Scholar] [CrossRef]
  31. Luding, S. Collisions & contacts between two particles. In Physics of Dry Granular Media; Springer: Berlin/Heidelberg, Germany, 1998; pp. 285–304. [Google Scholar]
  32. Wu, D.; Zhou, P.; Zhao, B.; Howes, T.; Wang, G. Liquid redistribution upon the liquid-bridge rupture between two unequal particles with a minimal energy method. Powder Technol. 2019, 354, 165–173. [Google Scholar] [CrossRef]
  33. Hagen, T.; Luding, S.; van der Meer, D.; Magnanimo, V.; Jarray, A. Liquid migration in flowing granular materials. EPJ Web Conf. 2021, 249, 09001. [Google Scholar] [CrossRef]
  34. Mani, R.; Kadau, D.; Or, D.; Herrmann, H.J. Fluid depletion in shear bands. Phys. Rev. Lett. 2012, 109, 248001. [Google Scholar] [CrossRef]
  35. Mani, R.; Kadau, D.; Herrmann, H.J. Liquid migration in sheared unsaturated granular media. Granul. Matter 2013, 15, 447–454. [Google Scholar] [CrossRef]
  36. Willett, C.D.; Adams, M.J.; Johnson, S.A.; Seville, J.P.K. Capillary bridges between two spherical bodies. Langmuir 2000, 16, 9396–9405. [Google Scholar] [CrossRef]
  37. Adams, M.; Perchard, V. The cohesive forces between particles with interstitial liquid. In Proceedings of the Institute of Chemical Engineering Symposium, Perth, Australia, 25–28 August 1985; Volume 91, pp. 147–160. [Google Scholar]
  38. Lian, G.; Thornton, C.; Adams, M.J. Discrete particle simulation of agglomerate impact coalescence. Chem. Eng. Sci. 1998, 53, 3381–3391. [Google Scholar] [CrossRef]
  39. Anand, A.; Curtis, J.S.; Wassgren, C.R.; Hancock, B.C.; Ketterhagen, W.R. Predicting discharge dynamics of wet cohesive particles from a rectangular hopper using the discrete element method (DEM). Chem. Eng. Sci. 2009, 64, 5268–5275. [Google Scholar] [CrossRef]
  40. Campmans, G.H.P.; Wijnberg, K.M. Modelling the vertical grain size sorting process in aeolian sediment transport using the discrete element method. Aeolian Res. 2022, 57, 100817. [Google Scholar] [CrossRef]
  41. Van Driest, E.R. On turbulent flow near a wall. J. Aeronaut. Sci. 1956, 23, 1007–1011. [Google Scholar] [CrossRef]
  42. He, Y.; Liu, J.; Cai, F.; Li, B.; Qi, H.; Zhao, S. Aeolian sand transport influenced by tide and beachface morphology. Geomorphology 2022, 396, 107987. [Google Scholar] [CrossRef]
  43. Jia, S.; Wang, Z. A new ejection model for aeolian splash. Catena 2022, 213, 106191. [Google Scholar] [CrossRef]
  44. Wang, Z.; Li, Z.; Jia, S. Rheological sand bed generates non-rebounding particles. Sedimentology 2025, 72, 34–44. [Google Scholar] [CrossRef]
  45. Liu, Z.; Yu, X.; Wan, L. Influence of contact angle on soil–water characteristic curve with modified capillary rise method. Transp. Res. Rec. 2013, 2349, 32–40. [Google Scholar] [CrossRef]
  46. Richefeu, V.; El Youssoufi, M.S.; Radjai, F. Shear strength properties of wet granular materials. Phys. Rev. E—Stat. Nonlinear Soft Matter Phys. 2006, 73, 051304. [Google Scholar] [CrossRef] [PubMed]
  47. van Rijn, L.C. A fully predictive model for aeolian sand transport, part 2: Description and calibration of models and effect of moisture and coarse materials. Coast. Eng. 2022, 171, 104052. [Google Scholar] [CrossRef]
  48. Yang, R.; Zou, R.; Yu, A. Numerical study of the packing of wet coarse uniform spheres. AIChE J. 2003, 49, 1656–1666. [Google Scholar] [CrossRef]
  49. Davidson-Arnott, R.G.D.; MacQuarrie, K.; Aagaard, T. The effect of wind gusts, moisture content and fetch length on sand transport on a beach. Geomorphology 2005, 68, 115–129. [Google Scholar] [CrossRef]
  50. Wiggs, G.; Baird, A.J.; Atherton, R.J. The dynamic effects of moisture on the entrainment and transport of sand by wind. Geomorphology 2004, 59, 13–30. [Google Scholar] [CrossRef]
  51. Namikas, S.; Edwards, B.; Bitton, M.; Booth, J.; Zhu, Y. Temporal and spatial variabilities in the surface moisture content of a fine-grained beach. Geomorphology 2010, 114, 303–310. [Google Scholar] [CrossRef]
  52. Schmutz, P.P.; Namikas, S.L. Measurement and modeling of the spatiotemporal dynamics of beach surface moisture content. Aeolian Res. 2018, 34, 35–48. [Google Scholar] [CrossRef]
  53. Kok, J.F.; Parteli, E.J.; Michaels, T.I.; Karam, D.B. The physics of wind-blown sand and dust. Rep. Prog. Phys. 2012, 75, 106901. [Google Scholar] [CrossRef] [PubMed]
  54. Crüger, B.; Salikov, V.; Heinrich, S.; Antonyuk, S.; Sutkar, V.S.; Deen, N.G.; Kuipers, J. Coefficient of restitution for particles impacting on wet surfaces: An improved experimental approach. Particuology 2016, 25, 1–9. [Google Scholar] [CrossRef]
  55. Crüger, B.; Heinrich, S.; Antonyuk, S.; Deen, N.G.; Kuipers, J. Experimental study of oblique impact of particles on wet surfaces. Chem. Eng. Res. Des. 2016, 110, 209–219. [Google Scholar] [CrossRef]
  56. Zhang, L.; Wu, C.Y. Discrete element analysis of normal elastic impact of wet particles. Powder Technol. 2020, 362, 628–634. [Google Scholar] [CrossRef]
  57. Darabi, P.; Pougatch, K.; Salcudean, M.; Grecov, D. A novel coalescence model for binary collision of identical wet particles. Chem. Eng. Sci. 2009, 64, 1868–1876. [Google Scholar] [CrossRef]
  58. Creyssels, M.; Dupont, P.; El Moctar, A.O.; Valance, A.; Cantat, I.; Jenkins, J.T.; Pasini, J.M.; Rasmussen, K.R. Saltating particles in a turbulent boundary layer: Experiment and theory. J. Fluid Mech. 2009, 625, 47–74. [Google Scholar] [CrossRef]
  59. Iversen, J.D.; Rasmussen, K.R. The effect of wind speed and bed slope on sand transport. Sedimentology 1999, 46, 723–731. [Google Scholar] [CrossRef]
  60. Bagnold, R.A. The movement of desert sand. Proc. R. Soc. Lond. Ser. A-Math. Phys. Sci. 1936, 157, 594–620. [Google Scholar] [CrossRef]
  61. Van Rijn, L.C.; Strypsteen, G. A fully predictive model for aeolian sand transport. Coast. Eng. 2020, 156, 103600. [Google Scholar] [CrossRef]
  62. O’Brien, P.; Neuman, C.M.K. Effect of the surface water content on dry saltation cloud dynamics: A wind tunnel simulation with particle tracking velocimetry. Earth Surf. Processes Landforms 2023, 48, 3103–3114. [Google Scholar] [CrossRef]
  63. Gillette, D.A.; Herbert, G.; Stockton, P.H.; Owen, P. Causes of the fetch effect in wind erosion. Earth Surf. Processes Landforms 1996, 21, 641–659. [Google Scholar] [CrossRef]
  64. Zhang, C.; Wang, X.; Zou, X.; Shen, Y.; Wang, R.; Wang, H. Field investigation of the fetch effect and essential conditions for saturated sand flow. Earth Surf. Processes Landforms 2022, 47, 2299–2309. [Google Scholar] [CrossRef]
  65. Pähtz, T.; Liu, Y.; Xia, Y.; Hu, P.; He, Z.; Tholen, K. Unified model of sediment transport threshold and rate across weak and intense subaqueous bedload, windblown sand, and windblown snow. J. Geophys. Res. Earth Surf. 2021, 126, e2020JF005859. [Google Scholar] [CrossRef]
  66. Pähtz, T.; Tholen, K. Aeolian sand transport: Scaling of mean saltation length and height and implications for mass flux scaling. Aeolian Res. 2021, 52, 100730. [Google Scholar] [CrossRef]
  67. Selmani, H.; Besnard, J.B.; Ould El Moctar, A.; Dupont, P.; Valance, A. Experimental study of particle impact on cohesive granular packing. Phys. Rev. E 2024, 110, 014901. [Google Scholar] [CrossRef]
  68. Schmutz, P.P. Investigation of Factors Controlling the Dynamics of Beach Surface Moisture Content; Louisiana State University and Agricultural & Mechanical College: Baton Rouge, LA, USA, 2014. [Google Scholar]
  69. Hallin, C.; van IJzendoorn, C.; Homberger, J.M.; de Vries, S. Simulating surface soil moisture on sandy beaches. Coast. Eng. 2023, 185, 104376. [Google Scholar] [CrossRef]
  70. Thornton, A.; Nguyen, Q.; Polman, H.; Bisschop, J.; Weinhart-Mejia, R.; Vesal, M.; Weinhart, T.; Post, M.; Ostanin, I. Simulating industrial scenarios: With the open-source software MercuryDPM. In Proceedings of the 8th International Conference on Particle-Based Methods, PARTICLES 2023, Milan, Italy, 9–11 October 2023. [Google Scholar]
  71. Kondo, J.; Saigusa, N.; Sato, T. A parameterization of evaporation from bare soil surfaces. J. Appl. Meteorol. Climatol. 1990, 29, 385–389. [Google Scholar] [CrossRef]
  72. Wallace, J.M.; Hobbs, P.V. Atmospheric Science: An Introductory Survey; Elsevier: Amsterdam, The Netherlands, 2006; Volume 92. [Google Scholar]
  73. Murray, F.W. On the computation of saturation vapor pressure. J. Appl. Meteorol. Climatol. 1967, 6, 203–204. [Google Scholar] [CrossRef]
  74. Camillo, P.; Gurney, R.; Schmugge, T. A soil and atmospheric boundary layer model for evapotranspiration and soil moisture studies. Water Resour. Res. 1983, 19, 371–380. [Google Scholar] [CrossRef]
  75. Tuijnman, J.T.; Donker, J.J.; Schwarz, C.S.; Ruessink, G. Consequences of a storm surge for aeolian sand transport on a low-gradient beach. J. Mar. Sci. Eng. 2020, 8, 584. [Google Scholar] [CrossRef]
  76. Williamson, R.E.; Threadgill, E.D. A simulation for the dynamics of evaporating spray droplets in agricultural spraying. Trans. ASAE [Am. Soc. Agric. Eng.] 1974, 17, 254–261. [Google Scholar] [CrossRef]
  77. Holterman, H. Kinetics and Evaporation of Water Drops in Sir; IMAG: Saratoga, CA, USA, 2003; Number 2003-12. [Google Scholar]
  78. Li, J.; Zhang, H.; Li, Z.; Du, M.; Chen, J.; Xiong, Y.; Zhang, H.; Cheng, Y. Wetting characteristic and flow behavior of silicate binder at various sand particle-particle interfaces: Fine or coarse, circular or angular particles. J. Mater. Res. Technol. 2023, 26, 7166–7181. [Google Scholar] [CrossRef]
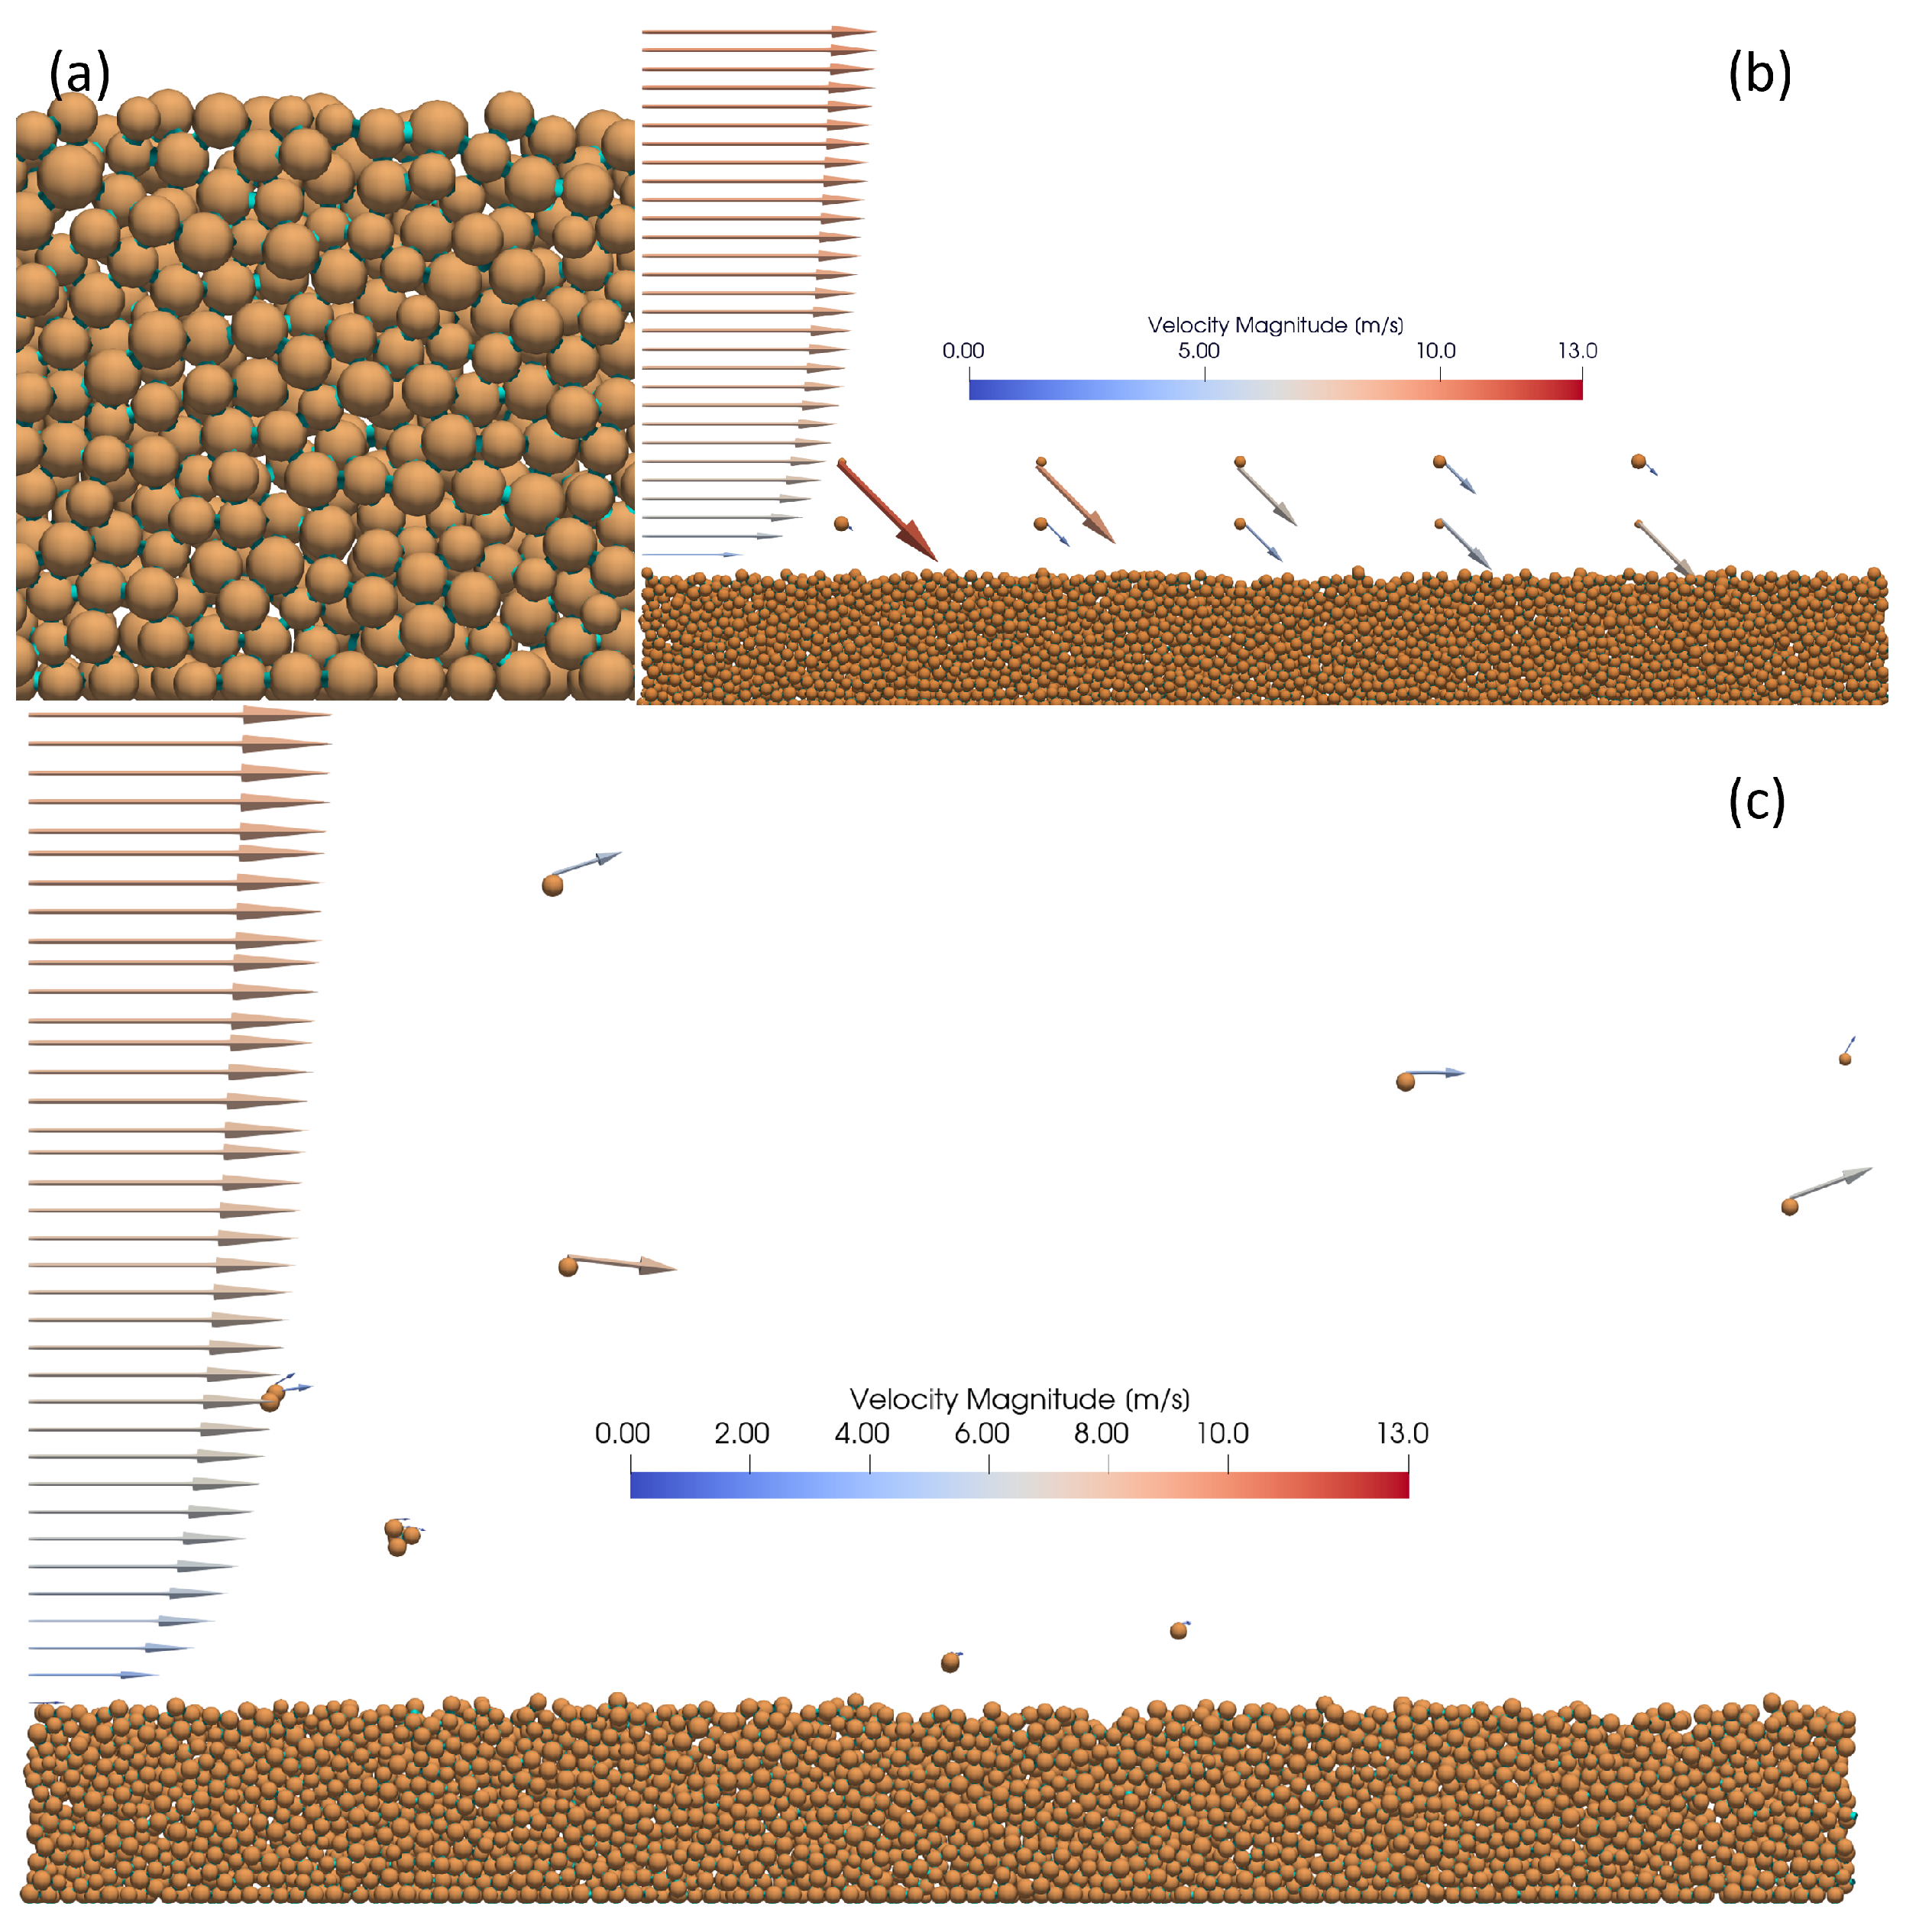
Figure 1. (a) A zoomed-in view of the bed with liquid bridges; (b) the initial conditions of the simulation: the bed configuration, velocities, and positions of the injected particles and the initial airflow velocity profile; (c) a model snapshot of the simulation for the Shields number ( Θ ˜ ) of 0.05 and the moisture content ( Ω ) of 20%. The group of arrows on the left in (b,c) indicates the streamwise wind velocity and the arrows attached to the particles indicate the particle velocities, the larger the size of the arrows, the higher the velocity is.
Jmse 13 01733 g001
Figure 2. Coefficient of restitution ( e collision ) versus impact velocity ( U impact ) compared to the experimental results from [54].
Jmse 13 01733 g002
Figure 3. (a) Transport rate (Q) versus time (t) under the dry condition ( Ω = 0); (b) normalized steady-state transport rate ( Q ˜ steady ) versus the Shields number ( Θ ˜ ) under the dry condition ( Ω = 0) compared to the experimental results by [58,59] and the empirical formulations proposed by [60,61].
Jmse 13 01733 g003
Figure 4. (a) Transport rate (Q) versus downwind distance (L) under the dry condition ( Ω = 0). The dashed curves represent the best fits using the solution of a damped harmonic oscillator, Equation (7) in [14]. (b) Normalized position of peak transport rate ( L ˜ peak ) versus the Shields number ( Θ ˜ ) under the dry condition ( Ω = 0) compared to the experimental results by [14] with two different upwind particle fluxes ( Q 0 ).
Jmse 13 01733 g004
Figure 5. (a) Steady-state transport rate ( Q steady ); (b) saltation concentration ( C sal , steady ); (c) mean saltation velocity ( U sal , steady ); (d) saltation height ( H 50 , steady ) versus bed moisture content ( Ω ) for various Shields numbers ( Θ ˜ ). The solid lines show the trend of the averaged values for different Shields numbers with varying moisture contents.
Jmse 13 01733 g005
Figure 6. (af) Transport rate (Q) versus time (t) for varying moisture contents of the bed ( Ω ) and varying Shields numbers ( Θ ˜ ); (g,h) the saltation concentration ( C sal ) and the mean saltation velocity ( U sal ) versus time (t) for various moisture contents at Θ ˜ = 0.06. The black box highlights the transport evolution for Θ ˜ = 0.06 in (fh), and the star symbols mark the onset of the transport overshoot for Ω = 20%.
Jmse 13 01733 g006
Figure 7. The time scales for (a) the growth phase of transport rate ( T peak ); (b) the decline phase of transport rate ( T decline ); and (c) the peak transport rate ( Q peak ) versus the bed moisture content ( Ω ) for various Shields numbers ( Θ ˜ ).
Jmse 13 01733 g007
Figure 8. Transport rate (Q) versus downwind distance (L) for varying moisture contents of the bed ( Ω ) and varying Shields numbers ( Θ ˜ ).
Jmse 13 01733 g008
Figure 9. (a) The position of the peak transport rate ( L peak ) versus the shear velocity ( u ) for various bed moisture contents ( Ω ). The circles and the dashed lines represent the simulated values and the predicted values by Equation (28), respectively. (Inset: blue crosses = S24 field data (wet surfaces); black solid line = S24 empirical formula for dry sand (Equation (30)). (b) The position of the peak transport rate ( L peak ) versus the bed moisture content ( Ω ) for various numbers of initiating particles ( N ip ) at Θ ˜ = 0.06 ( u = 0.56 m/s).
Jmse 13 01733 g009
Table 1. Model parameters used in the DPM-based model.
ParameterSymbolUnitValue
Particle contact parameters
Particle density ρ p kg/m32650
Normal stiffness k n kg/s25000 m g / d mean
Normal damping coefficient ν n kg/s4.7 m g d mean
Tangential stiffness k t kg/s20.29 k n
Tangential damping coefficient ν t kg/s0.29 ν n
Rolling stiffness k r kg/s20.4 k n
Rolling damping coefficient ν r kg/s0.4 ν n
Sliding friction coefficient μ t -0.5
Rolling friction coefficient μ r -0.5
Liquid parameters
Surface tension γ kg/s20.0728
Contact angle θ rad 65 · π 180
Liquid dynamic viscosity μ l kg/m/s0.001
Air parameters
Air density ρ a kg/m31.225
Air kinematic viscosity ν a m2/s1.46·10−5
Other parameters
Drag coefficient in the turbulent limit C d , -0.5
Critical particle Reynolds number R e p , c -24
Von Karman constant κ -0.4
Mixing length scaling parameter R c -7
Gravity accelerationgm/s29.81
Table 2. Parameters for the transport simulations.
ParameterSymbolUnitValue
Mean particle diameter d mean mm0.25
Standard deviation of particle diameter d std mm0.01
Cohesion number C o -113
Moisture content of the bed Ω %0, 1, 5, 10, 20
Shields number Θ ˜ -0.01, 0.02, 0.03, 0.04, 0.05, 0.06
Disclaimer/Publisher’s Note: The statements, opinions and data contained in all publications are solely those of the individual author(s) and contributor(s) and not of MDPI and/or the editor(s). MDPI and/or the editor(s) disclaim responsibility for any injury to people or property resulting from any ideas, methods, instructions or products referred to in the content.