Article

Hydrodynamic Effects and Scour Protection of a Geotextile Mattress with a Floating Plate

1
School of Environment and Architecture, University of Shanghai for Science and Technology, Shanghai 200093, China
2
School of Ocean and Civil Engineering, Shanghai Jiao Tong University, Shanghai 200240, China
3
College of Civil Engineering, Tongji University, Shanghai 200092, China
*
Author to whom correspondence should be addressed.
J. Mar. Sci. Eng. 2025, 13(12), 2215; https://doi.org/10.3390/jmse13122215
Submission received: 23 October 2025 / Revised: 17 November 2025 / Accepted: 19 November 2025 / Published: 21 November 2025
(This article belongs to the Special Issue Advanced Studies in Marine Structures)

Abstract

In this study, the evolution of the flow field near a Geotextile Mattress with a Floating Plate (GMFP) are numerically investigated, with a specific focus on the influence of the Froude number and the dynamic response of the floating plate. Key findings identify a critical Froude number that separates two protection regimes. Below this critical flow condition, the bottom vortex and the protective zone remain stable. Above it, the vortex contracts upstream, and the protection efficacy becomes substantial but diminished due to the competing effects of vortex development and a reduction in plate obstruction height. The bed shear stress over a considerable distance leeward of the GMFP is significantly reduced compared to unprotected conditions. Due to the blockage of the GMFP, upstream backup and downstream drawdown were observed in the water surface over the GMFP. These results provide valuable insights for the design and application of GMFPs, particularly in optimizing structural parameters to enhance protection effectiveness under varying flow conditions.

1. Introduction

In recent years, local scour has been frequently detected near marine structures situated on an erodible seabed, posing a substantial threat to the safety and stability of the structures. A survey in the United States [1] revealed that scour was the second most prevalent external cause of bridge failures between 1980 and 2012. Out of all 1062 cases investigated, 200 bridges were found to fail due to scour. Consequently, researchers and engineers have been seeking countermeasures to control local scour over the past few decades.
Scour protection methods can be conventionally categorized by their basic operating principles into two distinct types: active and passive measures. Active protection aims to intervene in the local flow field to redirect high-velocity bottom currents away from the seabed, thus reducing the potential for scour. Typical active measures include flow deflectors [2,3,4], groins [5,6,7], and submerged breakwaters [8,9,10,11]. Passive measures, which include engineered rock [12,13], solidified soil [14,15,16], and flexible mattresses [17,18,19], focus on enhancing the resistance of the seabed sediment to scour.
Floating flow deflectors are typical active scour countermeasures, which can be applied in various scenarios, including the prevention of local scour adjacent to marine structures [20], the protection of riverbed and seabed from erosion [21], and the enhancement of river bank stability. For some floating flow deflectors, stimulating sediment deposition by intercepting part of the sediment load also constitutes a protective function [21]. In the past two decades, much has been achieved on the protection mechanism and effects of the floating flow deflectors [22,23,24].
The geotextile mattress with floating plate (GMFP) was conceived to enhance the adaptability of previous floating flow deflectors in various scenarios [23]. The GMFP is composed of a geotextile mattress connected via strings to a lightweight plate (Figure 1a). The geotextile mattress serves as the foundation of the device. When subjected to steady currents, the floating plate inclines leeward, deflecting the near-bed flow. A vortex system is thus induced on the leeside of the GMFP. A bottom vortex, coupled with a low-velocity zone, creates an extended safe area along the seabed downstream of the structure. Within this area, the near-bottom velocity and thus the sediment transport capacity are remarkably reduced compared with the unprotected area, thereby mitigating seabed scour (Figure 1b). Comprehensive details on the design and operational principles of the device are available in previous works [23,25].
Recent investigations have discussed the hydrodynamic properties of the GMFP and the protection effects on adjacent marine structures. Zhu et al. [25] systematically revealed the parametric effects of the GMFP on the flow field leeward of the GMFP, including the plate height, the sloping angle of the plate and the height of the sand-pass opening. The optimal sloping angle for steady current cases was proposed. However, the sloping angle was considered independent of the flow velocity in [25]. Analysis of the seepage stability of the GMFP [23,24] examined the influence of GMFP design parameters and mattress length. The geotextile mattress was found to play a significant role in altering the local flow pattern [24]. The effectiveness of the GMFP in mitigating scour underneath submarine pipelines was confirmed and assessed in [20]. The installation of the GMFP substantially reduced the hydraulic gradient in the seabed under the pipeline.
Prior research has revealed the fundamental working principles of the GMFP. However, several critical aspects remain insufficiently analyzed. The key knowledge gaps addressed in this study are:
  • Dynamic GMFP-flow interaction. Previous studies have primarily treated the sloping angle of the plate as a static, independent parameter [23,25]. In fact, the angle is governed by the incoming flow velocity [22]. The lack of research on this coupled interaction has become a significant bottleneck in predicting GMFP performance in real-world, unsteady marine environments. While the rigid sloping curtain in [22] was analyzed, the distinct configuration of a rigid curtain and a GMFP leads to fundamentally different hydrodynamics response of the two structures [20,25], making their findings not directly transferable.
  • Effects on the water surface variation. The water surface profile is a main attribution to the pressure difference across the structure and a critical factor for assessing seepage failure risk [23]. Despite its critical role in the stability of the GMFP, the water surface profile and its influence factors have not been comprehensively examined before.
This study addresses this gap by systematically investigating the flow field around a GMFP under varying approach velocities, with the response of sloping angle to approaching velocity integral to the analysis. A numerical model was established and then validated against existing experimental data. A series of simulations were performed to analyze the response of flow field parameters to accelerating flow conditions, including the near-bottom velocity, the length of the bottom vortex, the shear stress, and the water surface profile. A key novelty of this work is the identification of a critical Froude number that demarcates regimes of optimal and diminished scour protection, which provides a quantitative basis for optimizing GMFP design—such as selecting plate buoyancy—to ensure structural resilience under site-specific flow conditions.
The paper is structured as follows: Section 2 outlines the numerical model, including the governing equations, computational setup, and model validation. Section 3 presents a comprehensive analysis of the local flow field transformation with increasing flow velocity. Section 4 discusses the implication of the results and offers suggestions on the practical application of the GMFP. Finally, Section 5 summarizes the principal conclusions of the study.

2. Numerical Model

In this section, a numerical model was established using the commercial computational fluid dynamics (CFD) software, Flow-3D (version 10.1), which employs a hybrid numerical approach combining the finite difference and finite volume methods [26]. The governing equations of the model are first presented, followed by the details of the model configuration and simulation cases. The model was then validated with experimental data in previous studies.

2.1. Governing Equations

The numerical model in this study simulates an incompressible and viscous flow within a Cartesian coordinate system. The mass continuity equation is written as follows:
x u A x + y v A y + z w A z = 0
where x, y, z = coordinate directions; u, v, w = velocity components; Ax, Ay, Az = area fractions for flow in three directions.
The momentum equations are the Navier–Stokes equations with extra terms, which are expressed below [26].
u t + 1 V F u A x u x + v A y u y + w A z u z = 1 ρ p x + G x + f x v t + 1 V F u A x v x + v A y v y + w A z v z = 1 ρ p y + G y + f y w t + 1 V F u A x w x + v A y w y + w A z w z = 1 ρ p z + G z + f z
where t = time; VF = fractional volume opens to flow; ρ = density; p = pressure; Gx, Gy, Gz = body acceleration components; fx, fy, fz = viscous acceleration components.
In this study, the turbulence transport was simulated using the Re-Normalization Group (RNG) k-ε model. This selection is supported by its successful application in previous numerical studies of hydrodynamic conditions adjacent to underwater structures [27,28,29], which demonstrated convincing and reliable results. The turbulent transport equations are as follows:
k T t + 1 V F u A x k T x + v A y k T y + w A z k T z = P T + Diff k T ε T
ε T t + 1 V F u A x ε T x + v A y ε T y + w A z ε T z = CDIS 1 ε T k T P T + Diff ε CDIS 2 ε T 2 k T
where kT = turbulent kinetic energy; PT = turbulent kinetic energy production; DiffkT = diffusion term of turbulent kinetic energy; εT = turbulent energy dissipation rate; CDIS1, CDIS2 = dimensionless parameters. A comprehensive description of the turbulence model can be found in [26].
The geometry of the structure within the flow field are defined with the FAVOR (Fractional Area/Volume Obstacle Representation) method [26], which enables an accurate resolution of the flow dynamics in the immediate vicinity of the floating plate. The water surface profile was predicted with the volume of fluid (VOF) algorithm [26,30]:
F t + 1 V F F A x u x + F A y v y + F A z w z = 0
where F = volume of fluid function.

2.2. Model Setup

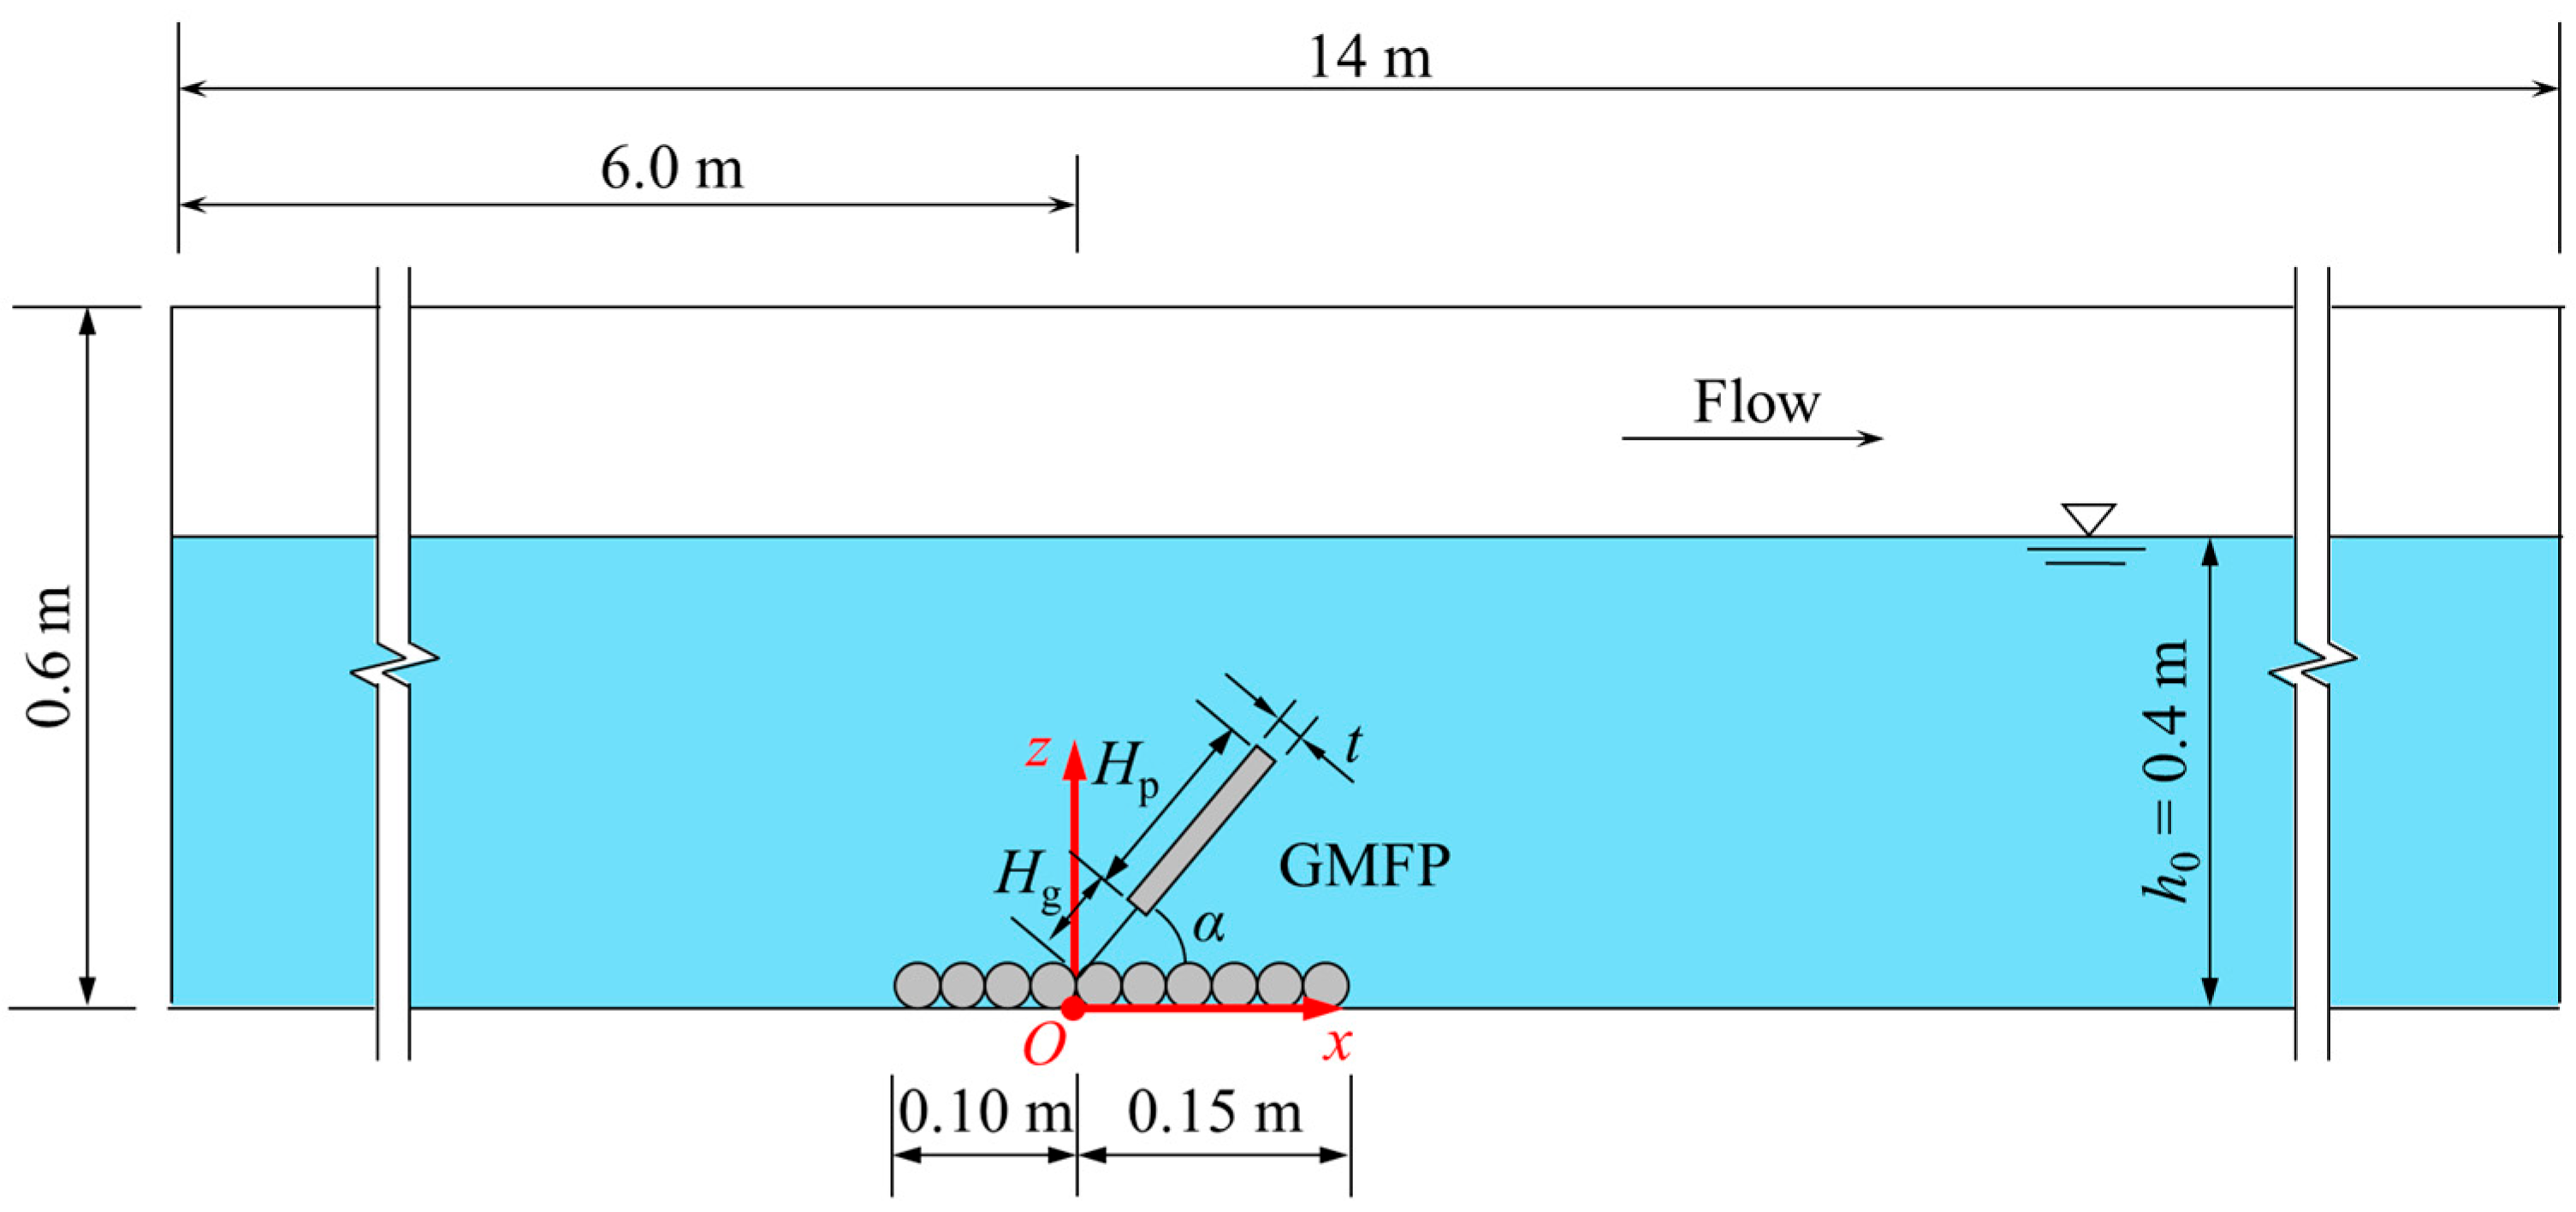
A rectangular numerical flume, measuring 14 m in length and 0.6 m in height (Figure 2), was designed to simulate the flow field around a GMFP. A Cartesian coordinate system was defined with its origin on the flume bottom, 6 m downstream from the flume entrance. The x-axis followed the streamwise direction and the z-axis was vertically upward. The y-axis was determined by the right-hand rule. The GMFP was placed on the flume bottom at x = 0, corresponding to 6 m (60 Hp, Hp = the height of the floating plate) from the flume entrance and 8 m (80 Hp) from the flume exit. These dimensions were selected to minimize boundary effects based on previous similar studies [24,27].
Two GMFP models were simulated, both featuring a plate height of 0.1 m but with different plate thickness (0.01 m and 0.015 m). The configuration of the mattress was identical for the two models, with a length of 0.25 m and a thickness of 0.025 m. The sand-pass opening was 0.03 m high. The sloping angle of the floating plate varied from 35° to 80° across different cases, which was determined based on flume test data from [24] and the empirical equation proposed by [22], subsequently validated for GMFP applications by [24]. Both the plate and the mattress were regarded as rigid bodies, and are fixed for each case. The overall GMFP dimensions were adopted from flume tests by [24] to ensure the result accuracy.
The boundary conditions are listed below.
  • Flume entrance (X Min): Specified velocity, with velocity values set per case and a fixed fluid elevation of 0.4 m.
  • Flume exit (X Max): Specified pressure, with a fixed fluid elevation of 0.4 m.
  • Flume bottom (Z Min): Wall, no-slip boundary.
  • Flume top (Z Max): Specified pressure, with a fluid fraction of 0.
  • Side walls (Y Min and Y Max): Symmetry.
The turbulence parameters at X min boundary, including the turbulent kinetic energy and its dissipation rate, were set as default using the software’s standard default models. In addition, the numerical flume incorporated a sufficiently long upstream distance (60 Hp) from the velocity inlet to the GMFP to ensure the complete development of the turbulent boundary layer of the approaching flow [24,27,31,32].
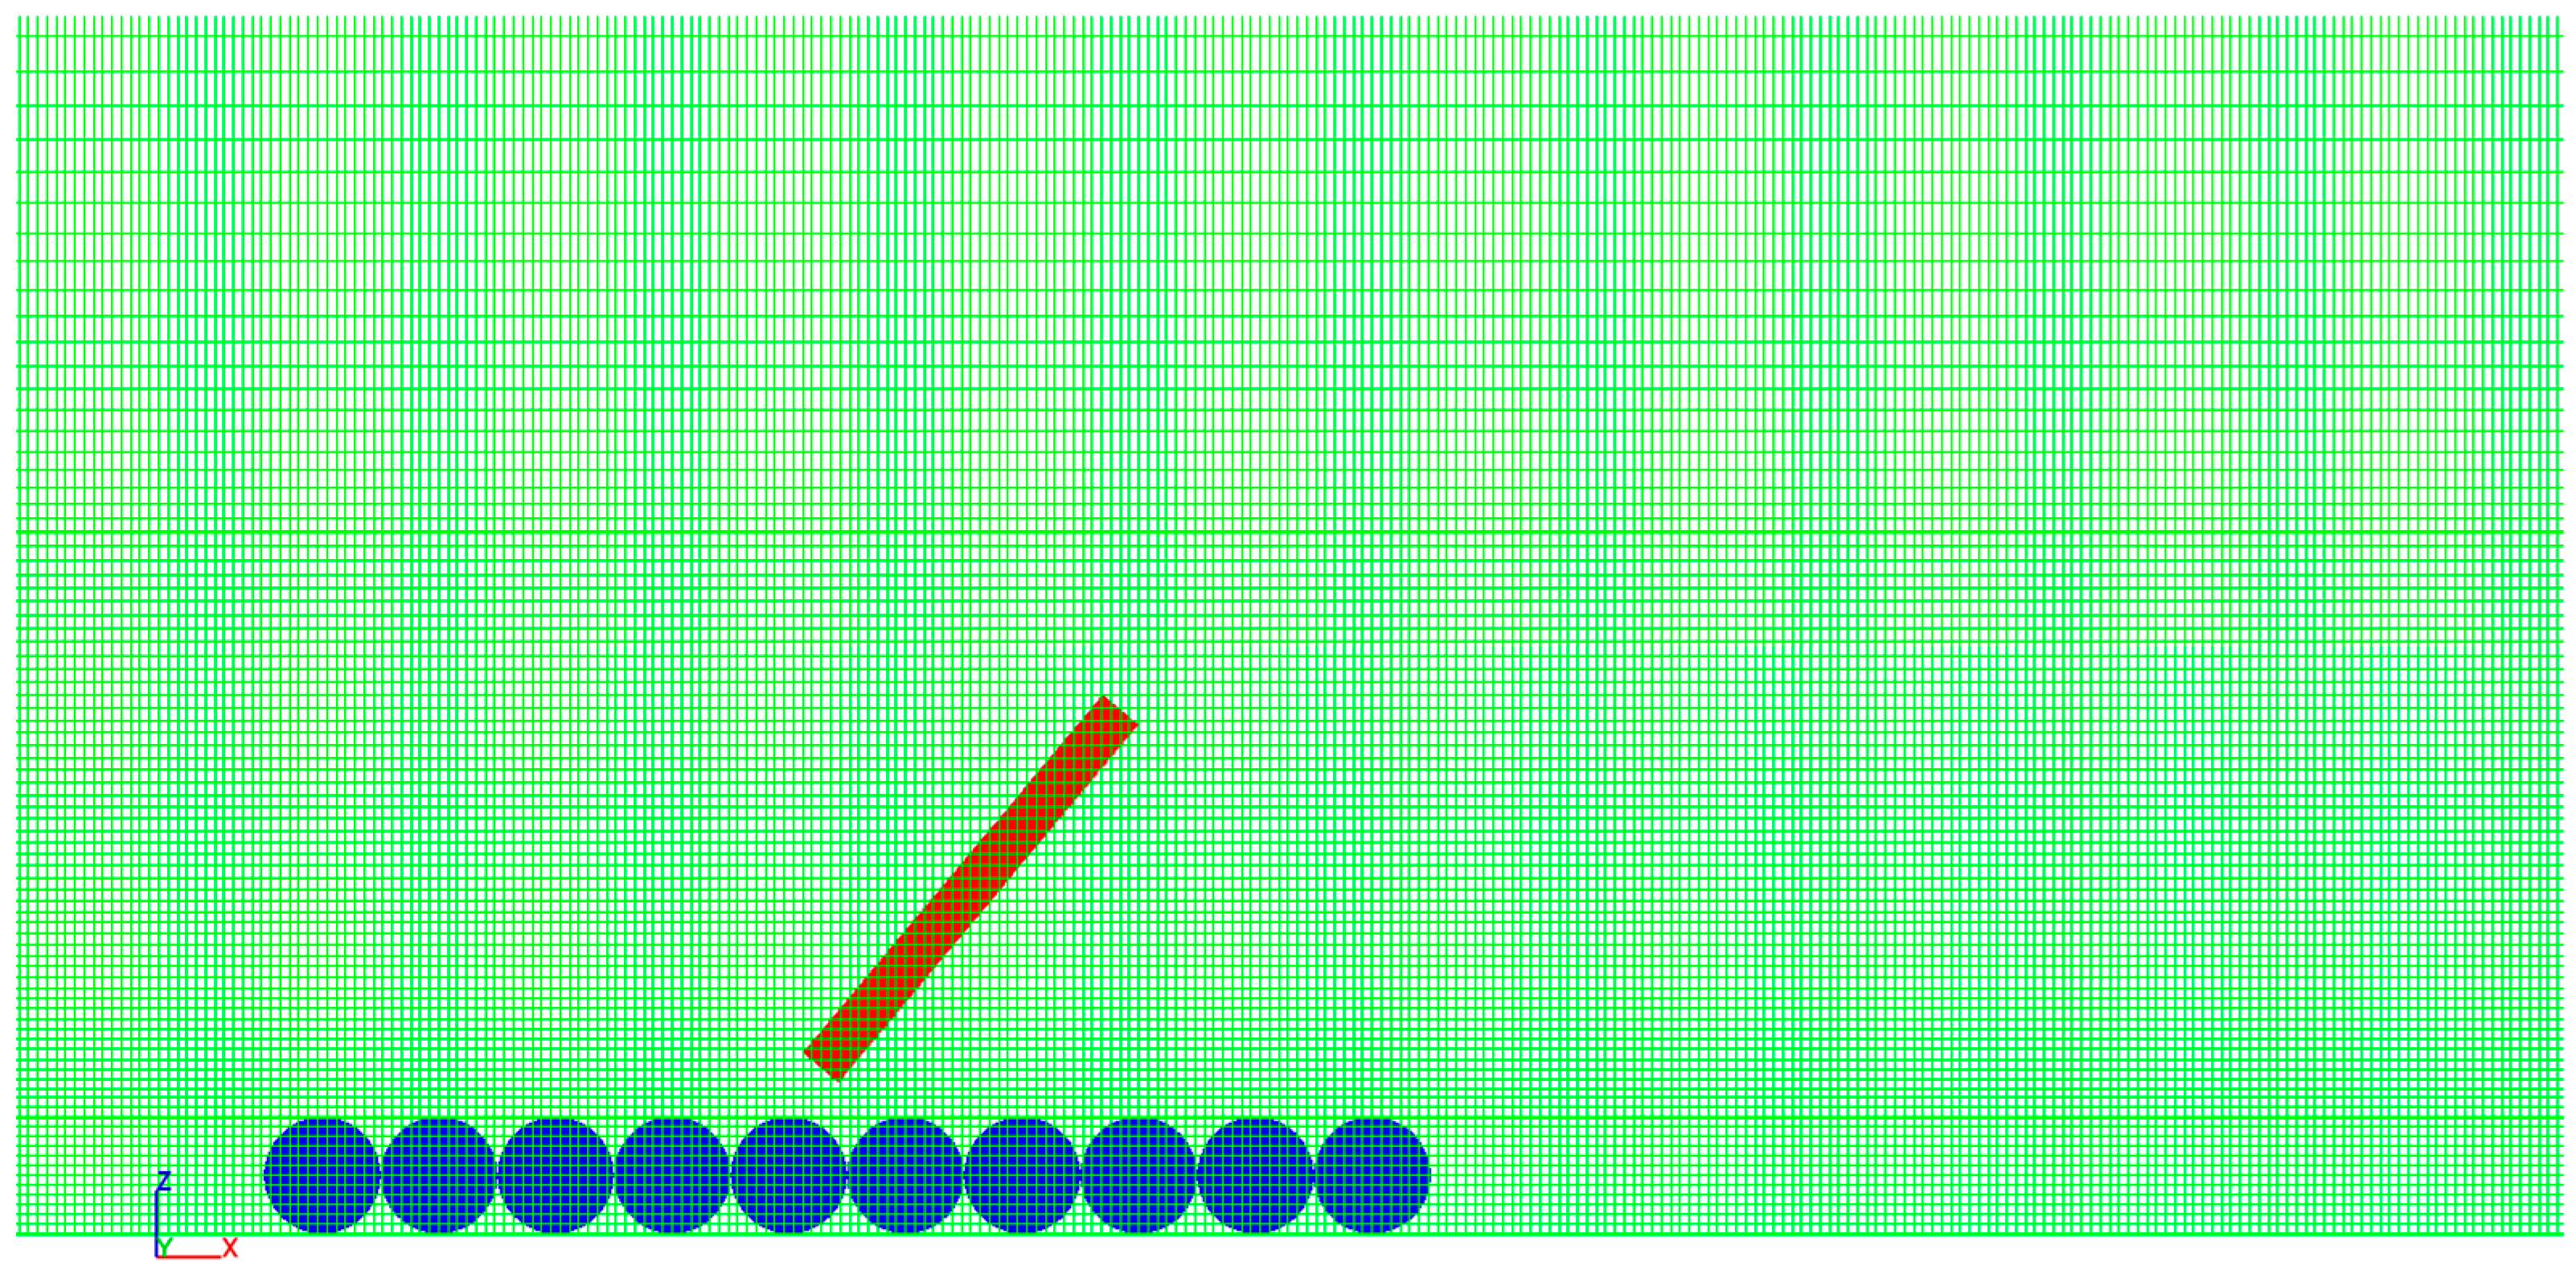
The numerical flume was discretized with a structured rectangular mesh. A biased mesh was employed to optimize computational cost while ensuring accuracy, with finer grids used near the GMFP and the anticipated bottom vortex region (Figure 3). The final mesh comprised approximately 1.4 × 10⁵ grids, with a minimum cell size of 0.0015 m. Simulations were run with a finish time of 50 s and an initial time step of 0.001 s. The time step was adjusted automatically by the solver based on convergence conditions. The simulation was completed on a computer with an Intel Core i7-3770 processor. The computation duration for each case varied between 8 and 12 h.

2.3. Simulation Cases

Table 1 presents the simulation cases designed to analyze the influence of the approaching velocity on the local flow field near the GMFP. The Froude number Fr of the approaching flow ranged from 0.051 to 0.273, which is calculated with the following equation.
F r = u 0 g h 0
where u0 = depth-averaged approaching flow velocity; g = gravitational acceleration (9.8 m/s2); h0 = undisturbed flow depth (=0.4 m across all cases). The sloping angle of the plate was determined through a hybrid approach to ensure modeling accuracy across the wide range of flow conditions. For Cases 04, 05, 06, 07, 14, 16, 17 and 18, the angles were assigned based on direct measurements from the flume tests of [24]. For the remaining cases, where experimental data was unavailable, the angle was calculated using the empirical equation from [22], which has been specifically validated for GMFP applications by [24]. The range of the sloping angle is from 35° to 80° across the cases. The sloping angle of the floating plate was fixed for each case. However, as the movement of floating plate was reported to be slight [22], the effect of this simplification is minor. Two floating plates with different thickness (0.01 m and 0.015 m) and thus buoyancy per unit width (FB = 9.8 N/m and 14.7 N/m) were simulated, while all other parameters remained constant.

2.4. Model Validation

2.4.1. Validation of the Local Flow Pattern

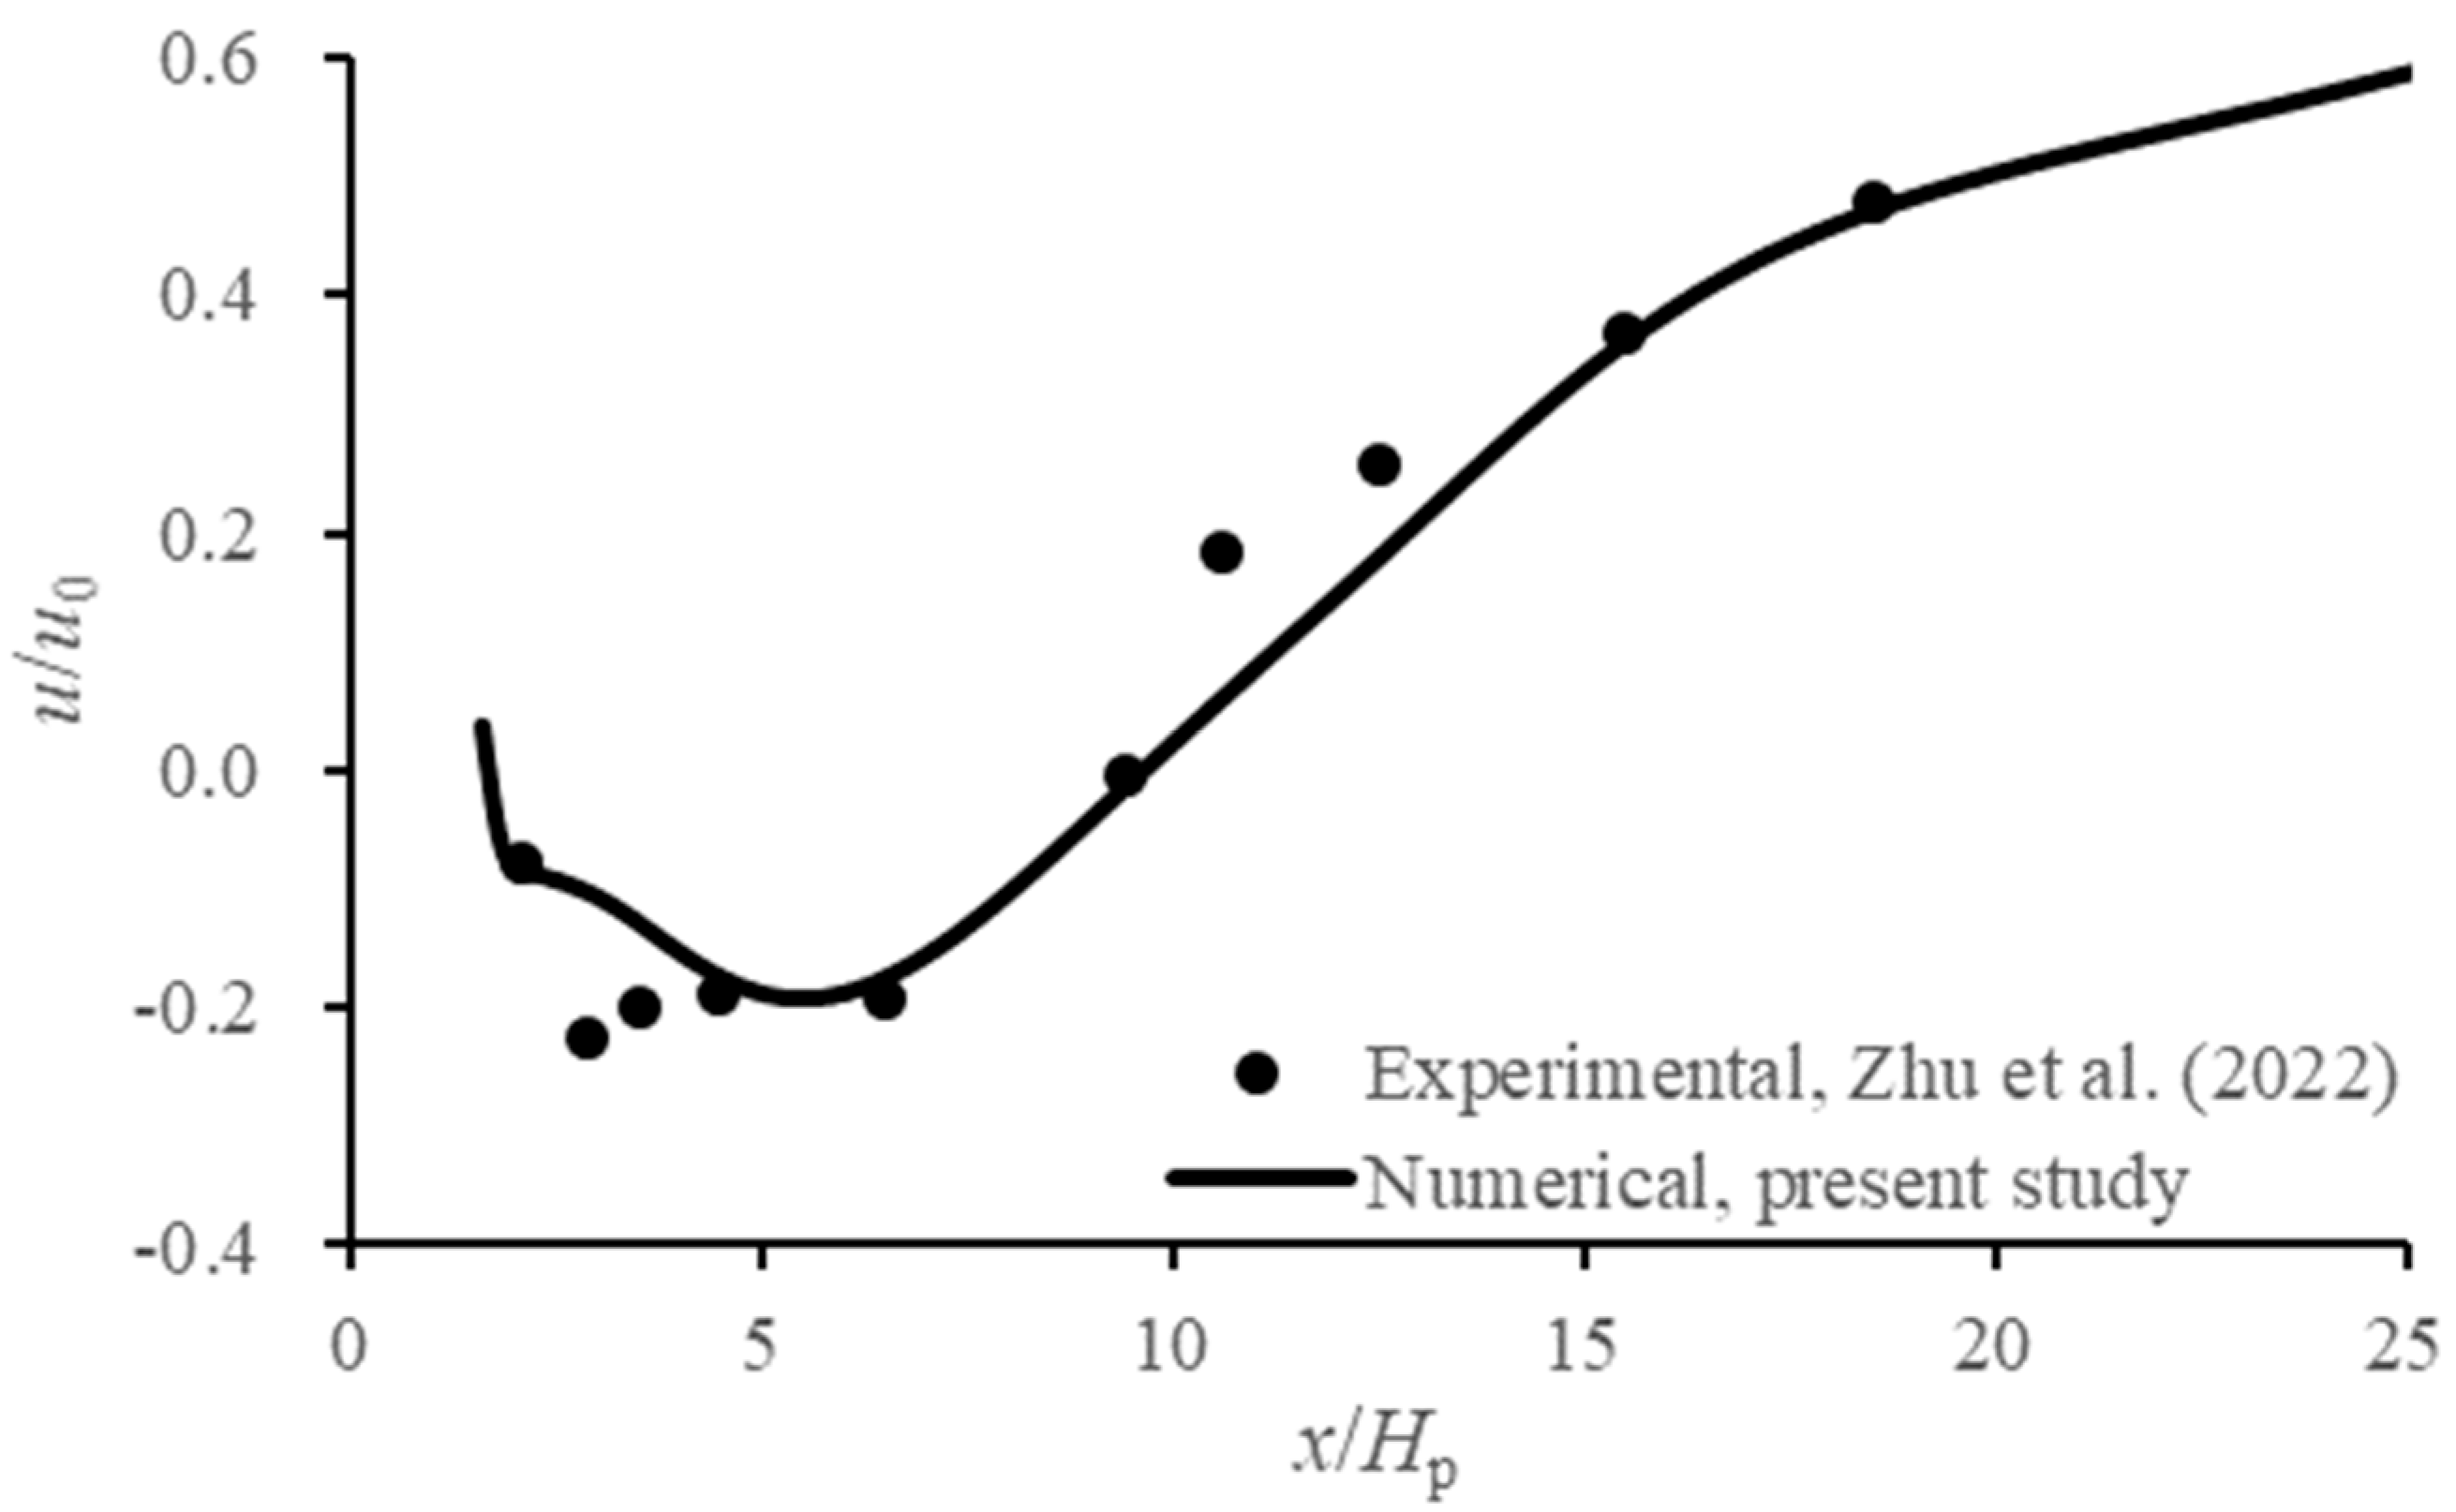
The numerical model was validated against flume test data of the near-bottom velocity downstream of a GMFP [25]. The experimental conditions involved a steady current with a velocity of 0.4 m/s and a depth of 0.4 m. The GMFP was configured with a plate height of 0.1 m, a constant sloping angle of 50°, a sand-pass opening height of 0.03 m, and a mattress length of 0.25 m. Velocity was measured 2.5 cm above the bed. The GMFP specifications in the validation model are identical to that of the flume test.
Figure 4 compares the simulated and experimentally measured near-bottom velocities on the leeward side of the GMFP. The horizontal axis denotes the non-dimensional distance from the structure x/Hp. The vertical axis represents the non-dimensional streamwise velocity u/u0, where u0 = 0.4 m/s. As shown in Figure 4, the measured and simulated near-bed velocities have a similar pattern and are in good agreement. The root mean square error (RMSE) of the predicted near bottom velocity at the measuring points is 0.09.
Notably, the numerical model successfully captured the reversed flow due to the bottom vortex next to the geotextile mattress. Slight difference between the measured and simulated results is found near the mattress (x/Hp = 4) and downstream to the bottom vortex (x/Hp = 12). These differences may be attributed to two primary factors. First, the flow pattern on the leeside of the floating flow deflectors is unsteady in some conditions [22,25], leading to natural variability in the near bottom velocity. Second, the flume test recorded a time-averaged velocity over a 60-s period, whereas the simulated data reflects an almost instantaneous flow field, thus bringing differences between the measured values and the predicted values.

2.4.2. Validation of Local Bed Pressure

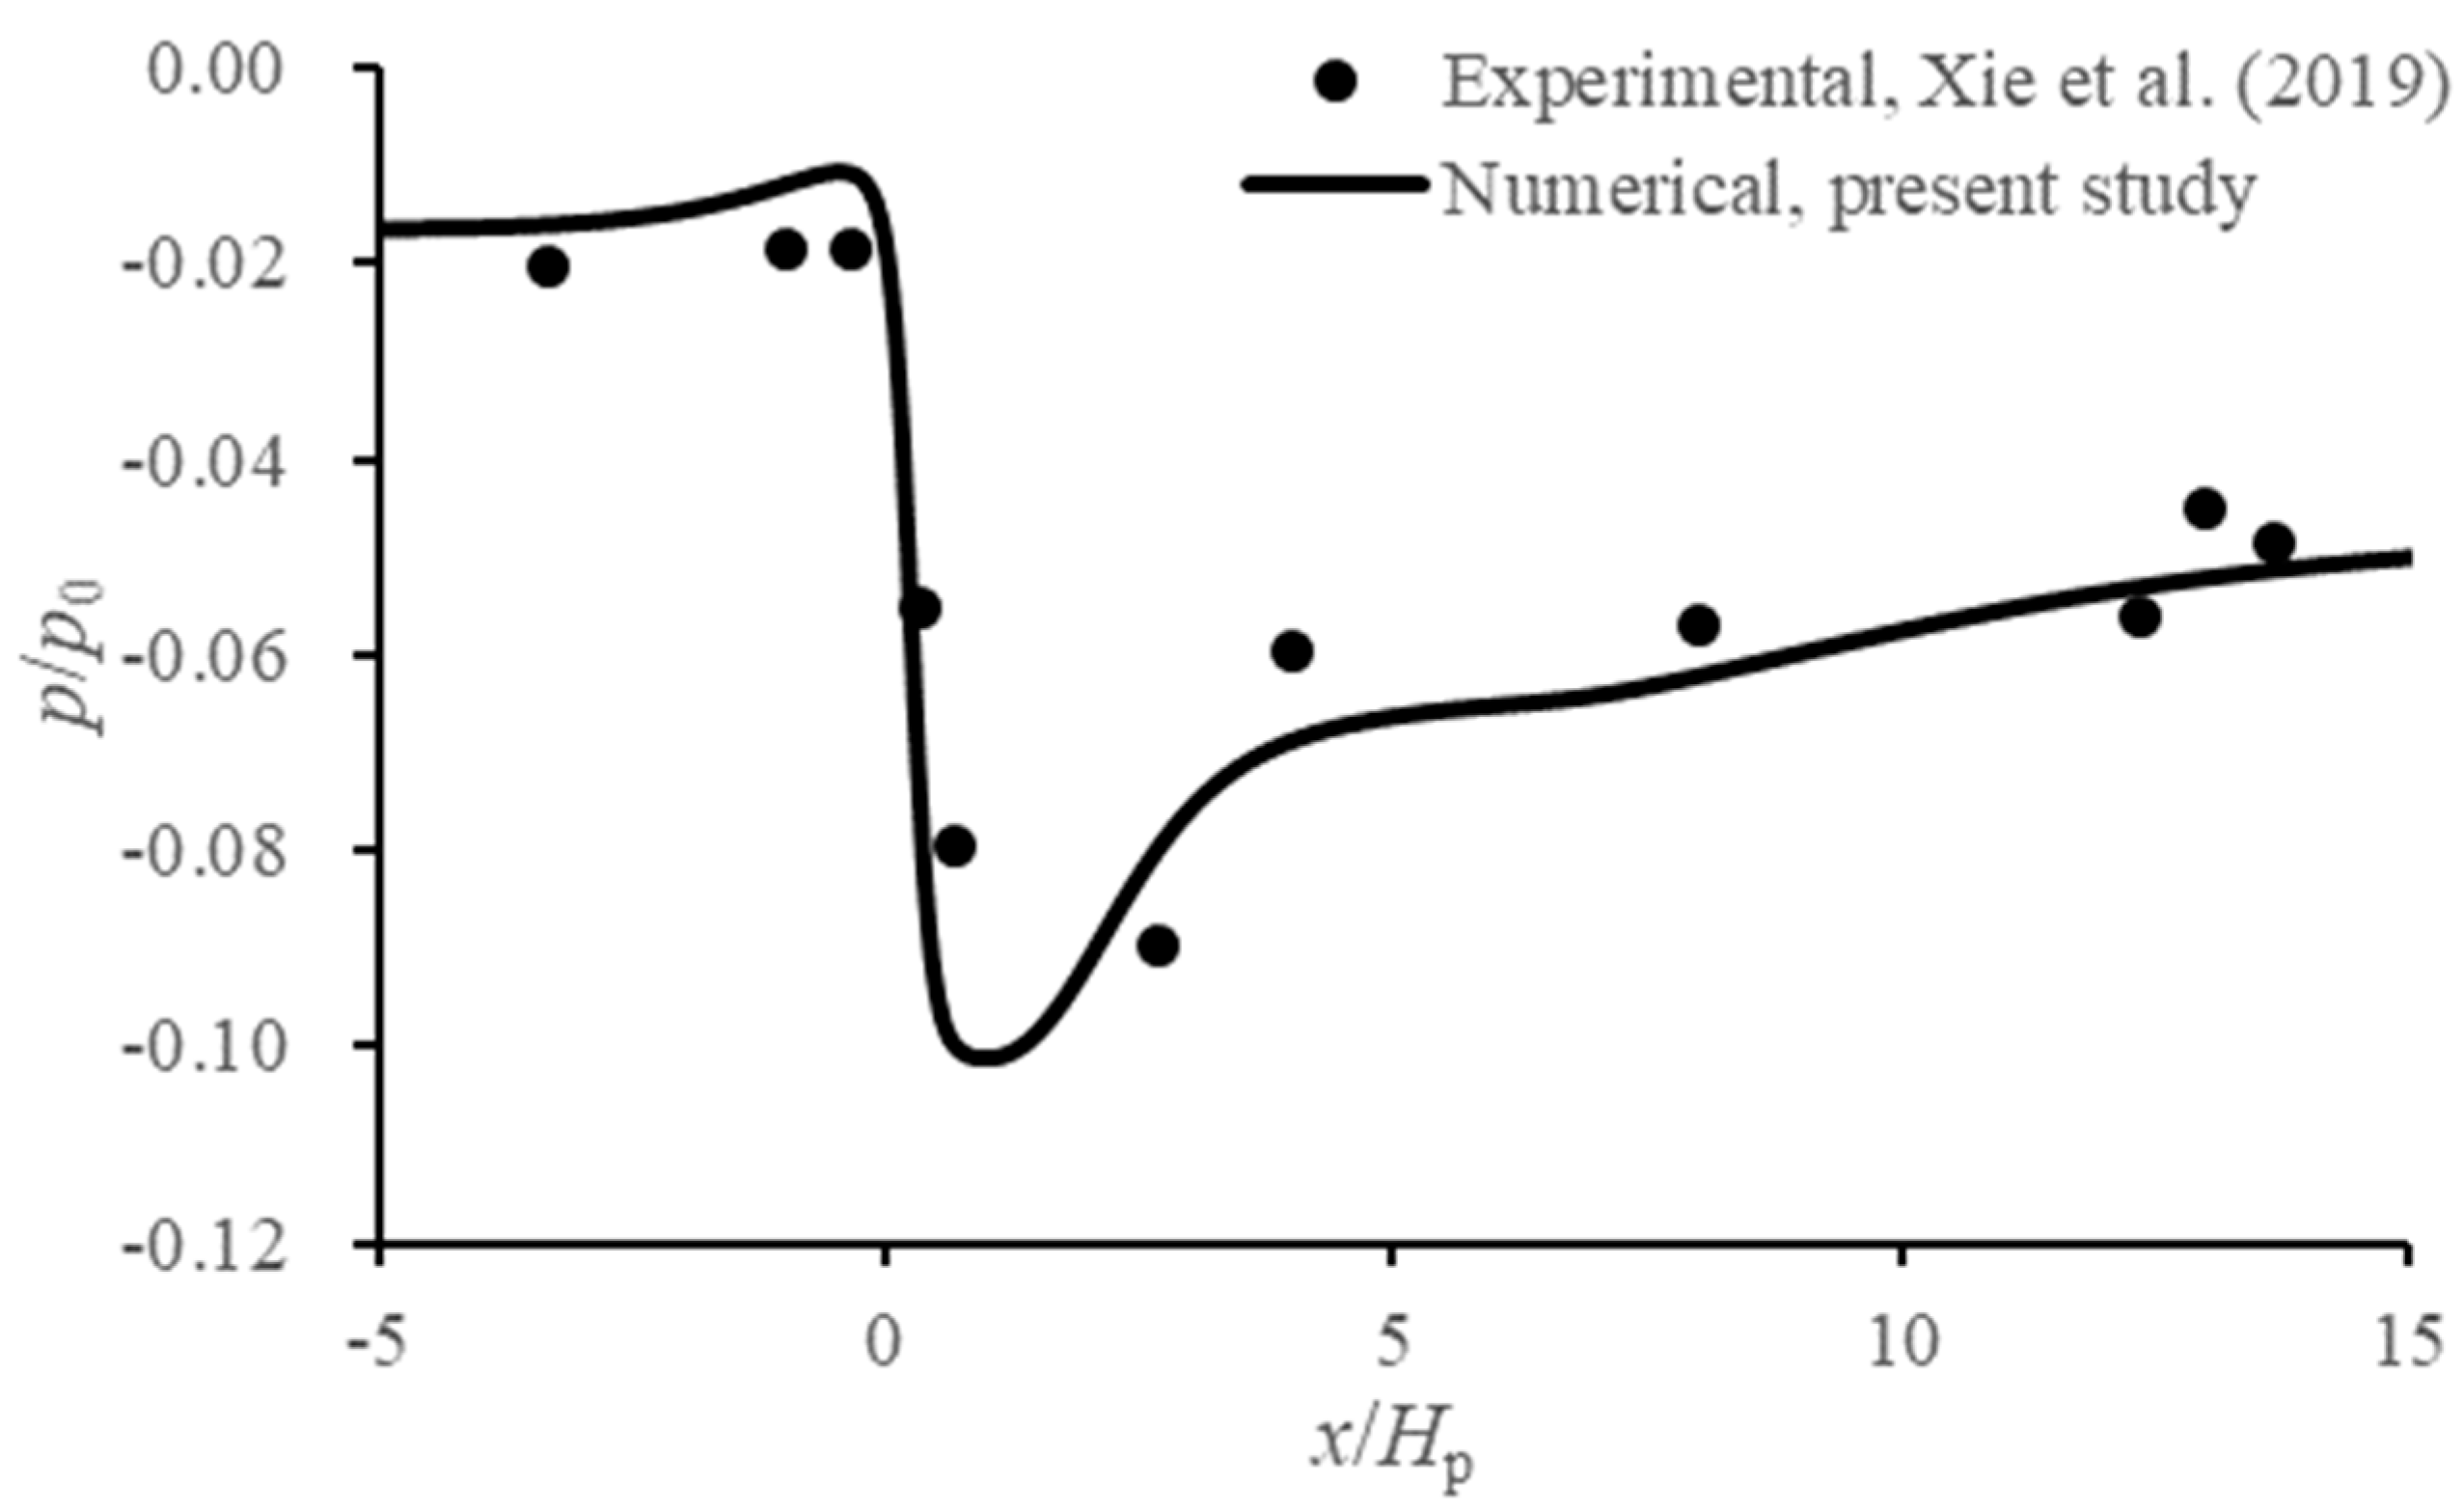
The blockage effect of the GMFP in steady currents causes an upstream rise and a downstream drop in water surface elevation. This variation in water level is directly reflected by the bed pressure in the vicinity of the structure [23]. Given the scarcity of experimental measurements of the water surface profile over a GMFP, the bed pressure data from flume tests by [23] serves as a reasonable alternative to validate the water surface profile predicted by the numerical model. The flume tests of [23] were performed in a steady current, with a velocity of 0.3 m/s and a depth of 0.1 m. The GMFP model had a plate height of 0.03 m, a constant sloping angle of 50°, and a sand-pass opening height of 0.01 m. It should be noted that the geotextile mattress was not modeled in the flume test. The GMFP specifications in the validation model are identical to that of the flume test.
A comparison between the experimental bed pressure measurements from [23] and the corresponding numerical predictions is presented in Figure 5. The horizontal axis is the non-dimensional distance from the structure x/Hp. The vertical axis is normalized with the hydrostatic bed pressure in still water p0 (=0.98 kPa). As illustrated in Figure 5, the predicted bed pressure nearly coincides with the measured results by [23]. The RMSE of the predicted bed pressure at the measuring points is 0.01. Thus, the accuracy of the present model is acceptable for this study.

2.4.3. Mesh and Time Step Dependence Check

The effects of mesh density and the initial time step on the results are examined with a series of models established based on Case 05. The study comprised four different mesh densities and four different initial time steps to simulate the leeside flow field of the GMFP under steady current.
The location of reattachment point x0, a key parameter characterizing the leeside hydrodynamics of floating flow deflectors [22,25], was selected as the variable for this assessment. The reattachment point of a GMFP marks the transition in a near-bottom flow direction at the mattress elevation, separating the flow heading upstream within the bottom vortex from the streamwise flow in its wake (Figure 1b).
The normalized x coordinate of the reattachment point x0/Hp predicted by the aforementioned models is presented in Table 2. The results indicate that the predictions from “fine mesh 1” and “fine mesh 2” differ by only 2.9%, demonstrating mesh convergence. Similarly, the simulations with the three smaller time steps yielded nearly identical results. Consequently, the configurations of “fine mesh 1” and “initial time step 2” were adopted for all cases in this study, providing an optimal balance between computational cost and accuracy.

3. Results: Effects of the Approaching Flow Velocity

A series of numerical simulations was conducted to investigate the hydrodynamic response around a GMFP on the approaching flow velocity. This section presents an analysis of the effects on key parameters, including the flow pattern, the near bottom velocity, the shear stress and the water surface profile.

3.1. Effect on the Flow Field

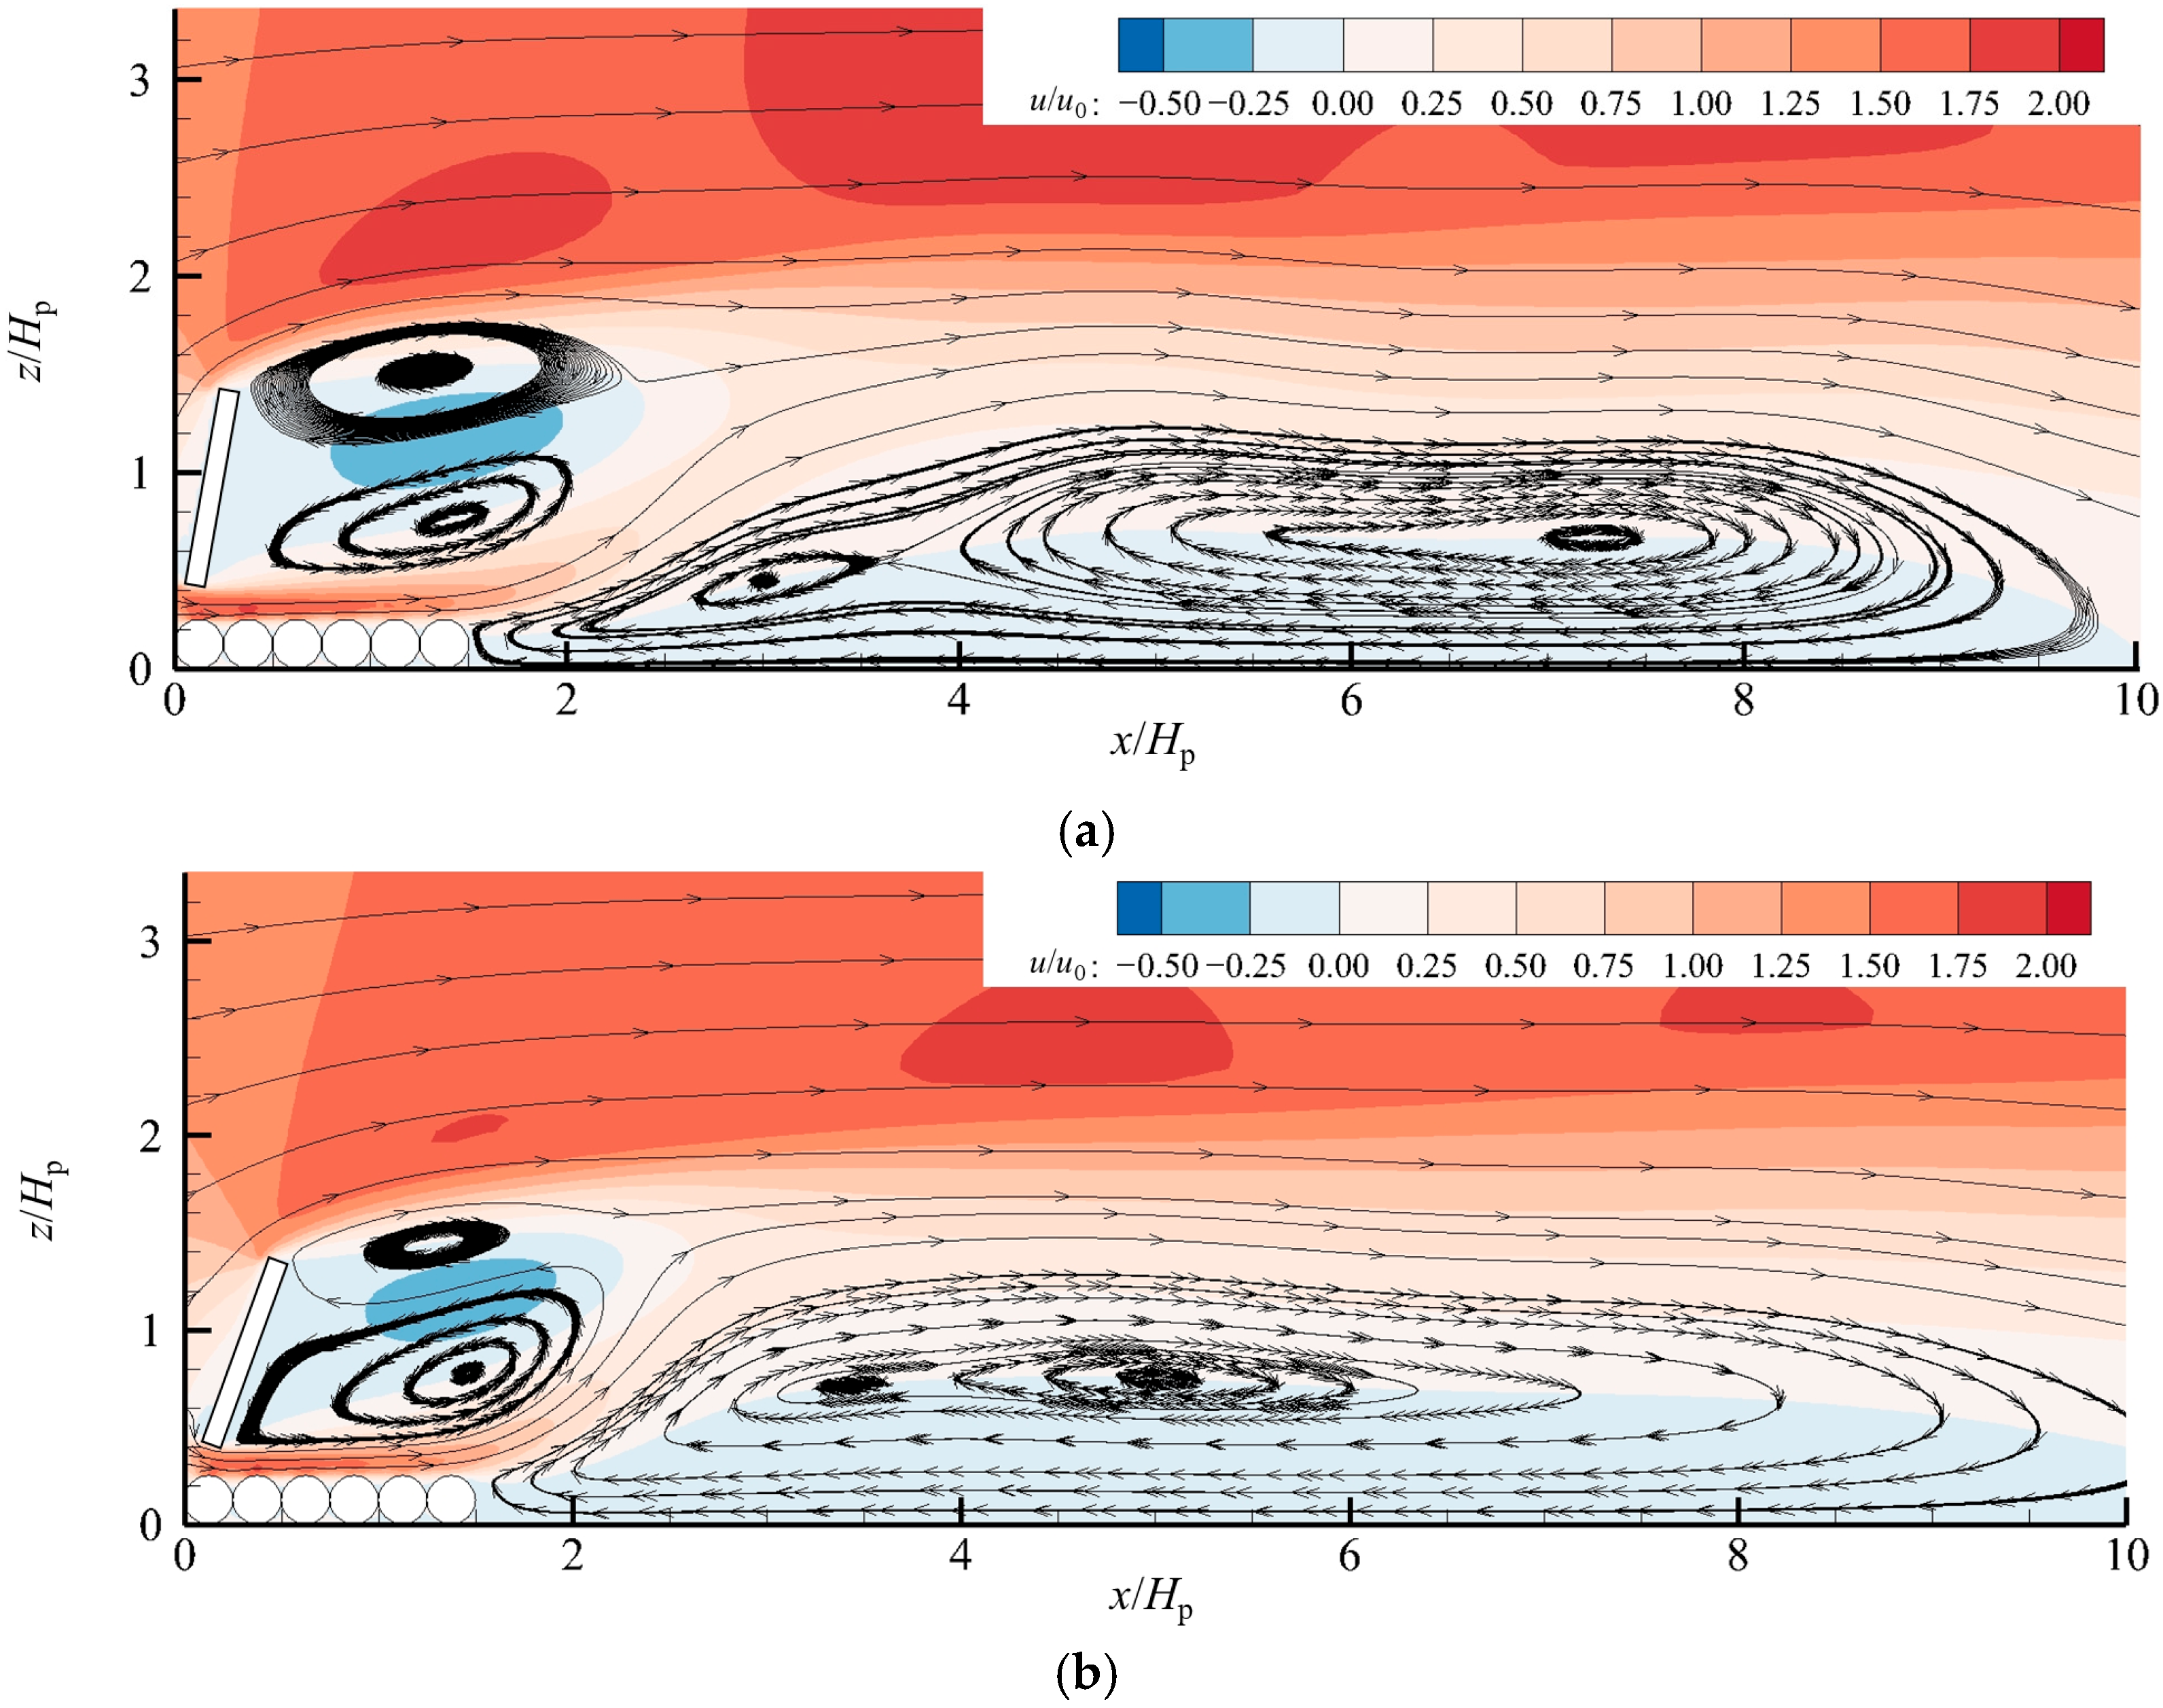
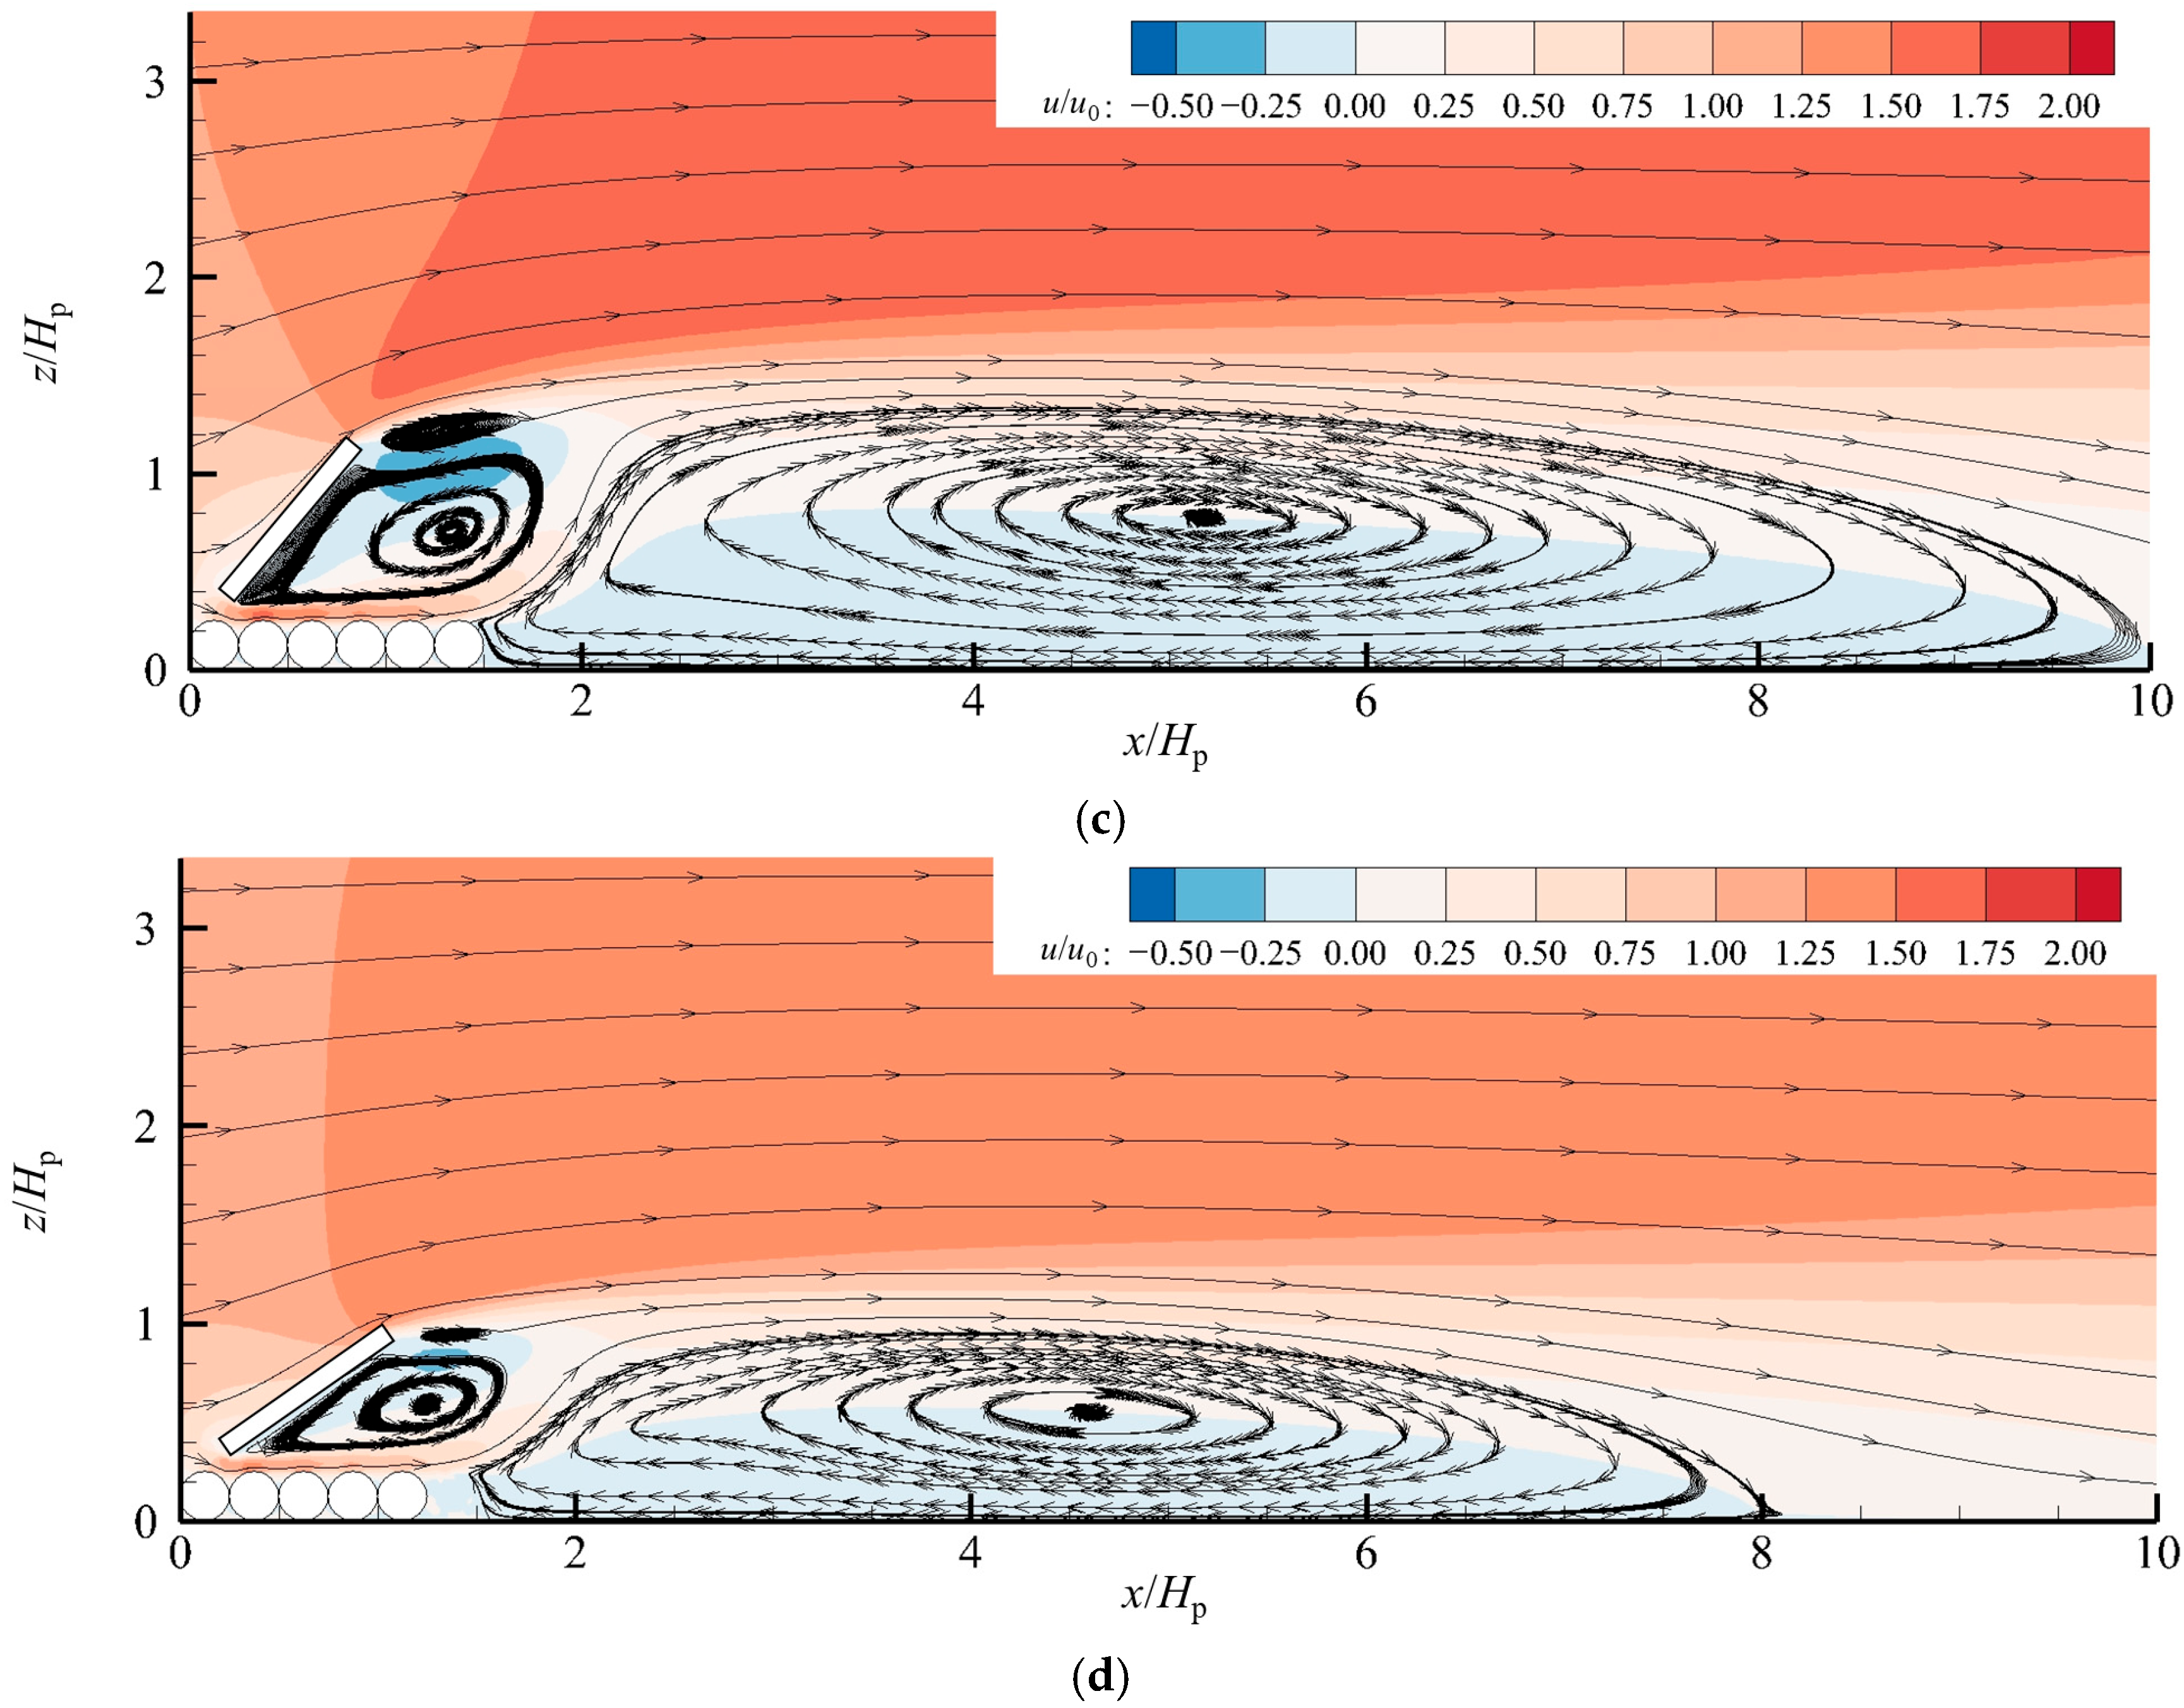
Figure 6 demonstrates the flow field around the GMFP under varying approach velocities, corresponding to Froude numbers of 0.051, 0.091, 0.177, and 0.237 for subplots 6a through 6d. Both the x and z coordinates are normalized by the plate height (Hp = 0.1 m); the velocity u is normalized by the approach velocity u0.
A key observation is the qualitatively consistent local flow pattern across the tested Froude numbers. In all 4 cases, spatial extent of this bottom vortex is considerable. The near bottom flow downstream of the GMFP is greatly decelerated, with a recirculation zone (bottom vortex) featuring reversed flow. The flow deceleration and reversal are critical for the protective efficacy.
However, quantitative changes in the vortex system and the flow above are evident. At lower Froude numbers (Fr = 0.051 and 0.091, Figure 6a,b), the bottom vortex exhibits a dual-core structure with notably winding streamlines, suggesting a less stable flow regime. As the Froude number increases, these cores merge into a single structure (Figure 6c). The streamlines of the bottom vortex become smoother, indicating a more developed and stabilized recirculation zone (bottom vortex).
The development of the bottom vortex with the accelerating approach flow can also be seen in the dimensions of the vortex. Both the horizontal and the vertical extent grows (Figure 6a–c). The developed and stabilized recirculation zone extends up to 10 Hp downstream of mattress at Fr = 0.177. Interestingly, at the highest Froude number (Fr = 0.237, Figure 6d), a moderate retreat is observed in the bottom vortex, implying a diminished protective effect in high-speed flows.
The top vortex zone near the top edge of the plate, comprising a clockwise vortex over a counter-clockwise one, also evolves with the Froude number. As Fr increases, the sloping angle decreases, and the entire top vortex zone weakens. The shrinkage is particularly pronounced for the clockwise vortex, which becomes negligible compared to its counterpart at Fr = 0.237 (Figure 6d).
Finally, distinct variations can be seen in the flow over the GMFP. At lower velocities (Fr = 0.051 and 0.091), several separate high-speed regions are present above the vortices. This phenomenon implies an unsteady and probably cyclical flow regime downstream of the device, which was previously noted in flume tests [22,25]. The underlying mechanism and critical conditions of the phenomenon remain to be investigated.

3.2. Effect on the Near-Bottom Velocity

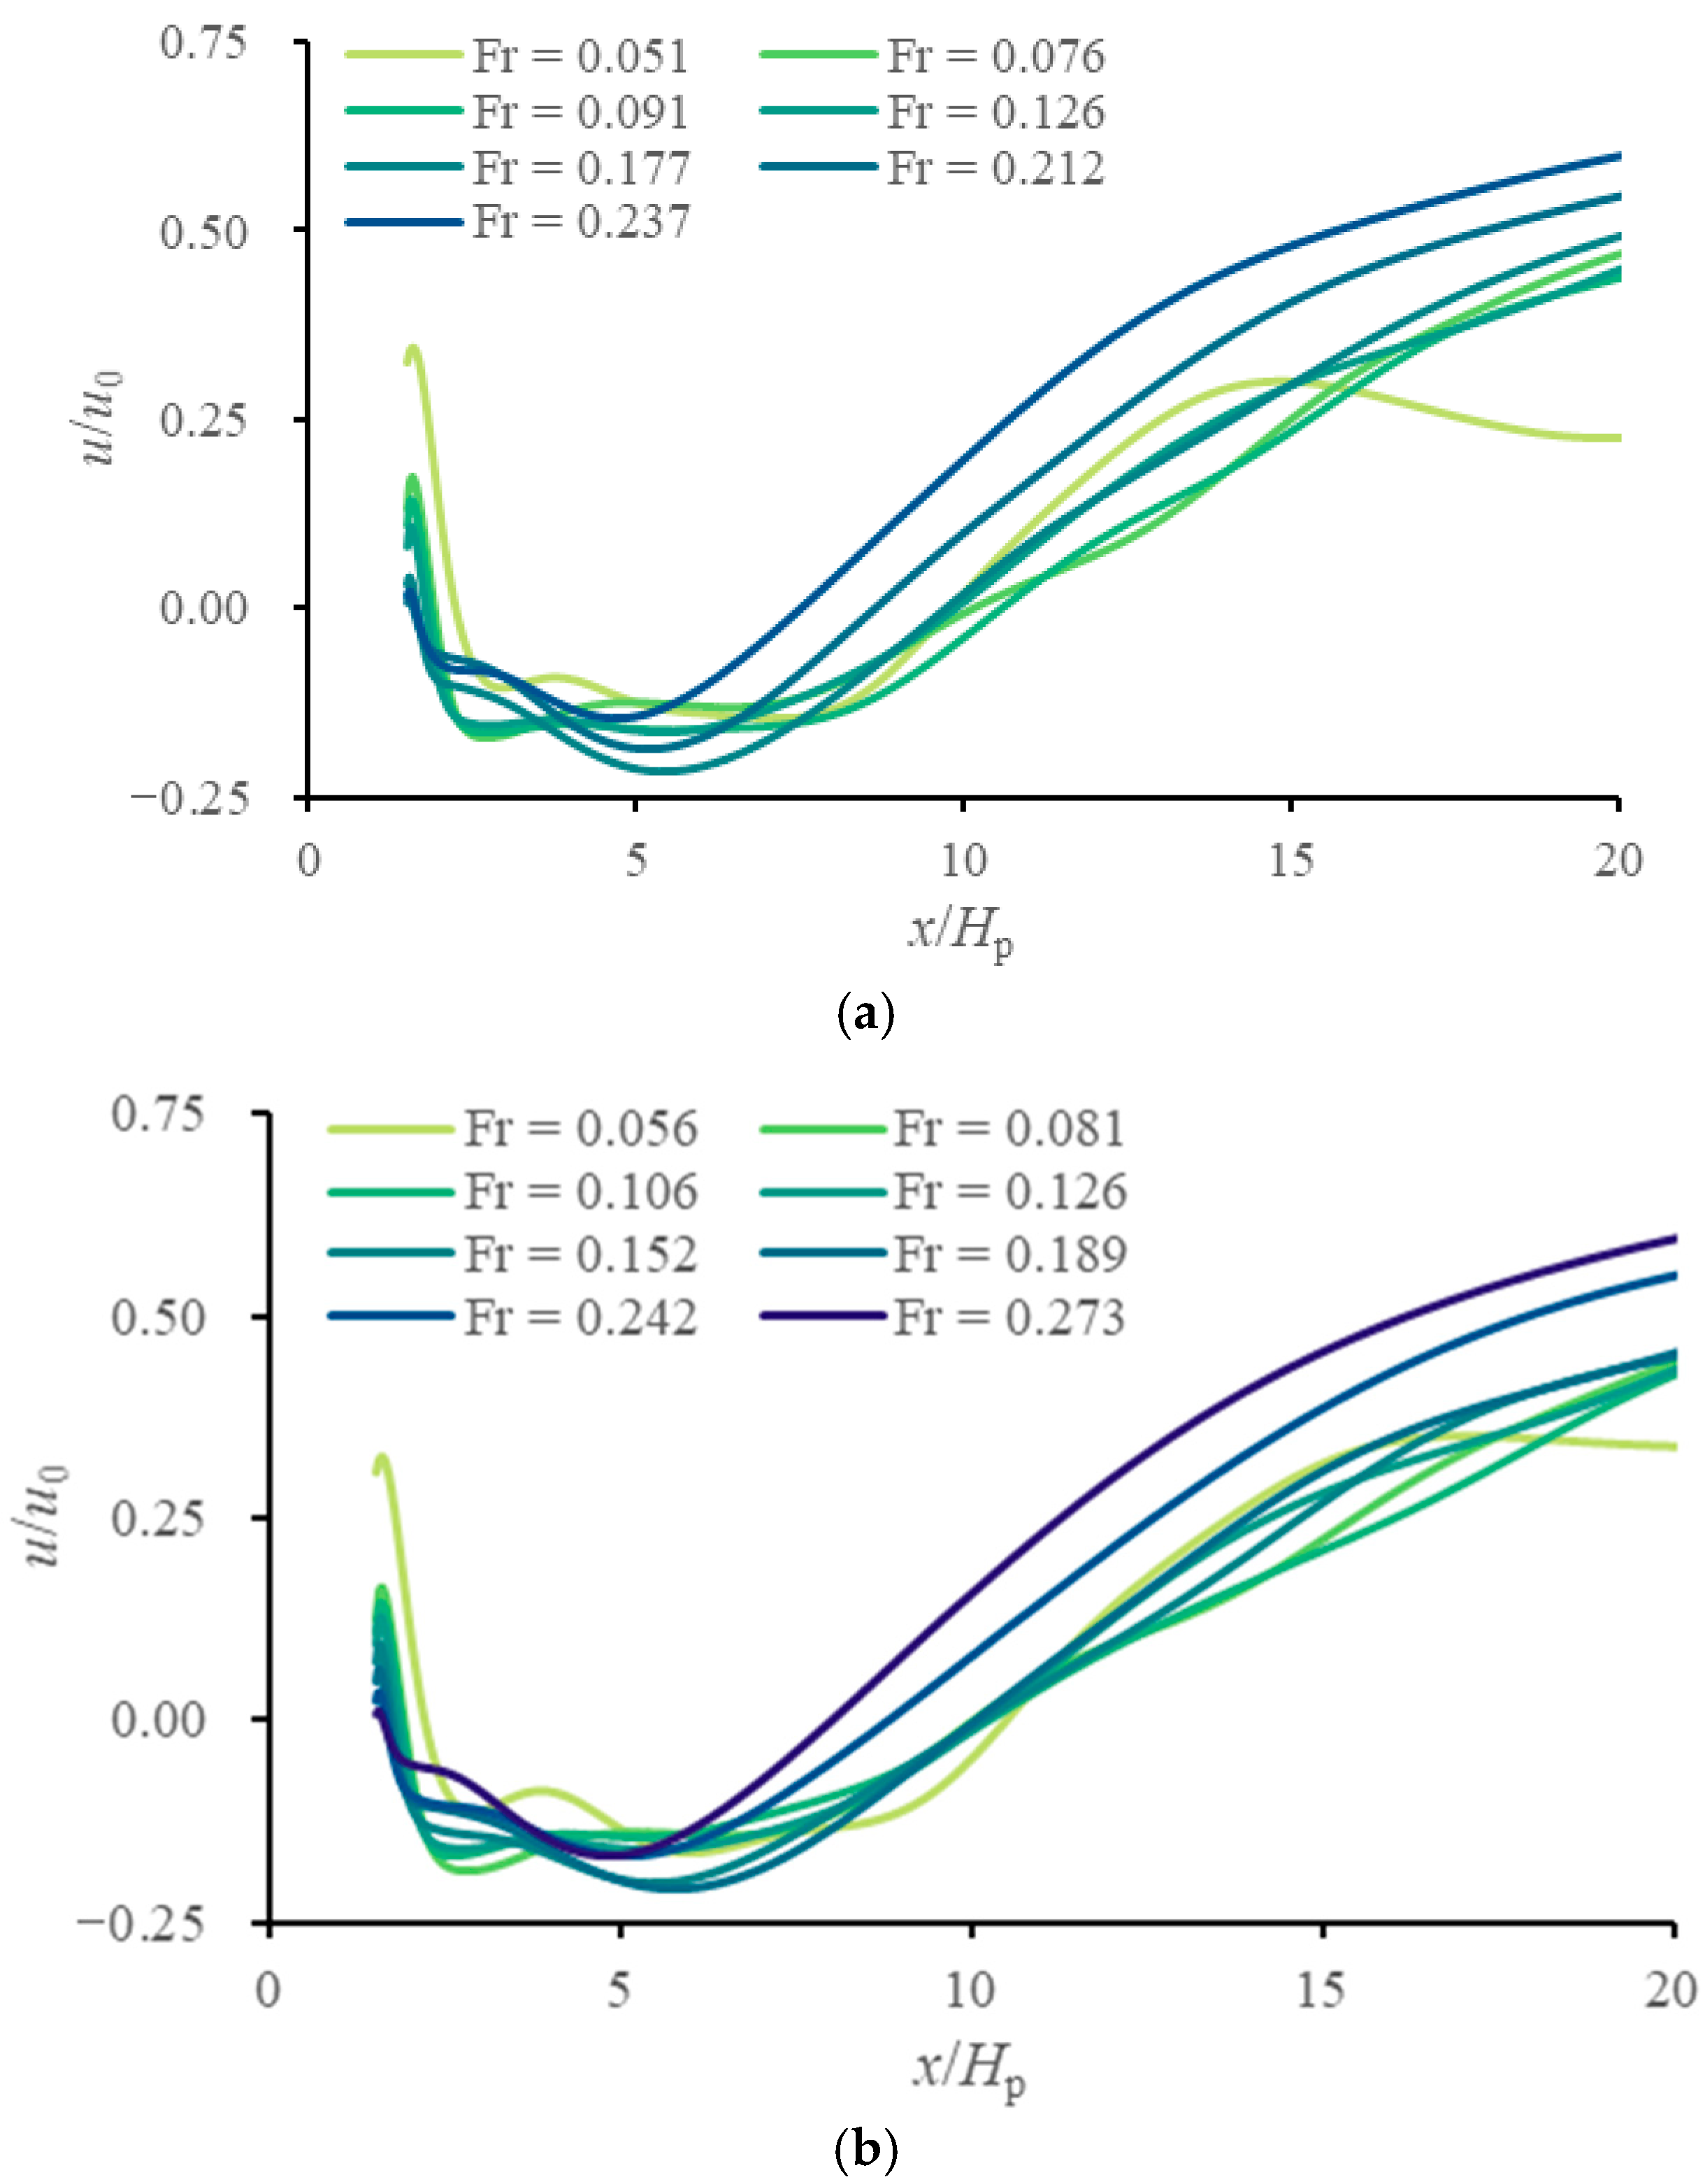
Figure 7 shows the distribution of the near-bottom velocity downstream of the GMFP for a range of Froude numbers. Figure 7a presents results for a floating plate with a buoyancy of FB = 9.8 N/m (Cases 01–07, Fr = 0.051–0.237), and Figure 7b corresponds to a buoyancy of 14.7 N/m (Cases 11–18, Fr = 0.056–0.273). Velocity was measured 2.5 cm above the bed, consistent with the experimental setup of [25]. The horizontal axis shows the normalized x coordinate (x/Hp); the vertical axis represents the normalized streamwise velocity (u/u0).
A consistent flow pattern is observed across all cases. Immediately downstream of the geotextile mattress, the near bottom flow becomes reversed. due to the influence of the bottom vortex. The maximum reversed flow velocity occurs at x/Hp = 5. The reversed flow slows down with the distance, and reaches zero at the reattachment point of the bottom vortex. Beyond this point, the flow direction returns to downstream, and the velocity subsequently recovers.
A critical condition is found at Fr = 0.18, with precise values of 0.177 and 0.189 for the two buoyancy configurations. For subsequent discussion, Fr = 0.18 is adopted as the representative threshold. For Fr ≤ 0.18, the coverage of the reversed flow remains stable, with the reattachment point nearly fixed near x/Hp = 10. At higher Froude numbers, this region contracts, and the reattachment point shifts upstream. A notable deceleration near x/Hp = 15 near low Froude numbers (Fr = 0.051) is associated with the unsteady flow mentioned in Section 3.1.
A localized leeward flow is observed near the mattress edge across the tested range of Froude numbers (Figure 7). The jet through the sand-pass opening [23,24] has the potential to trigger local scour. However, the velocity of the jet flow decreases markedly with increasing Froude number. Moreover, as visualized in Figure 6, the bed in this region is consistently encompassed by the low-velocity flow due to the bottom vortex across all cases, thereby protecting local bed from scour and ensuring structural stability.
A comparison between Figure 7a,b reveals that for an identical Froude number (e.g., Fr = 0.126), the velocity distribution is largely independent of the plate’s buoyancy. This implies that the Froude number is a more dominant factor of the local flow pattern than the buoyancy of the plate, within the parameter range investigated.
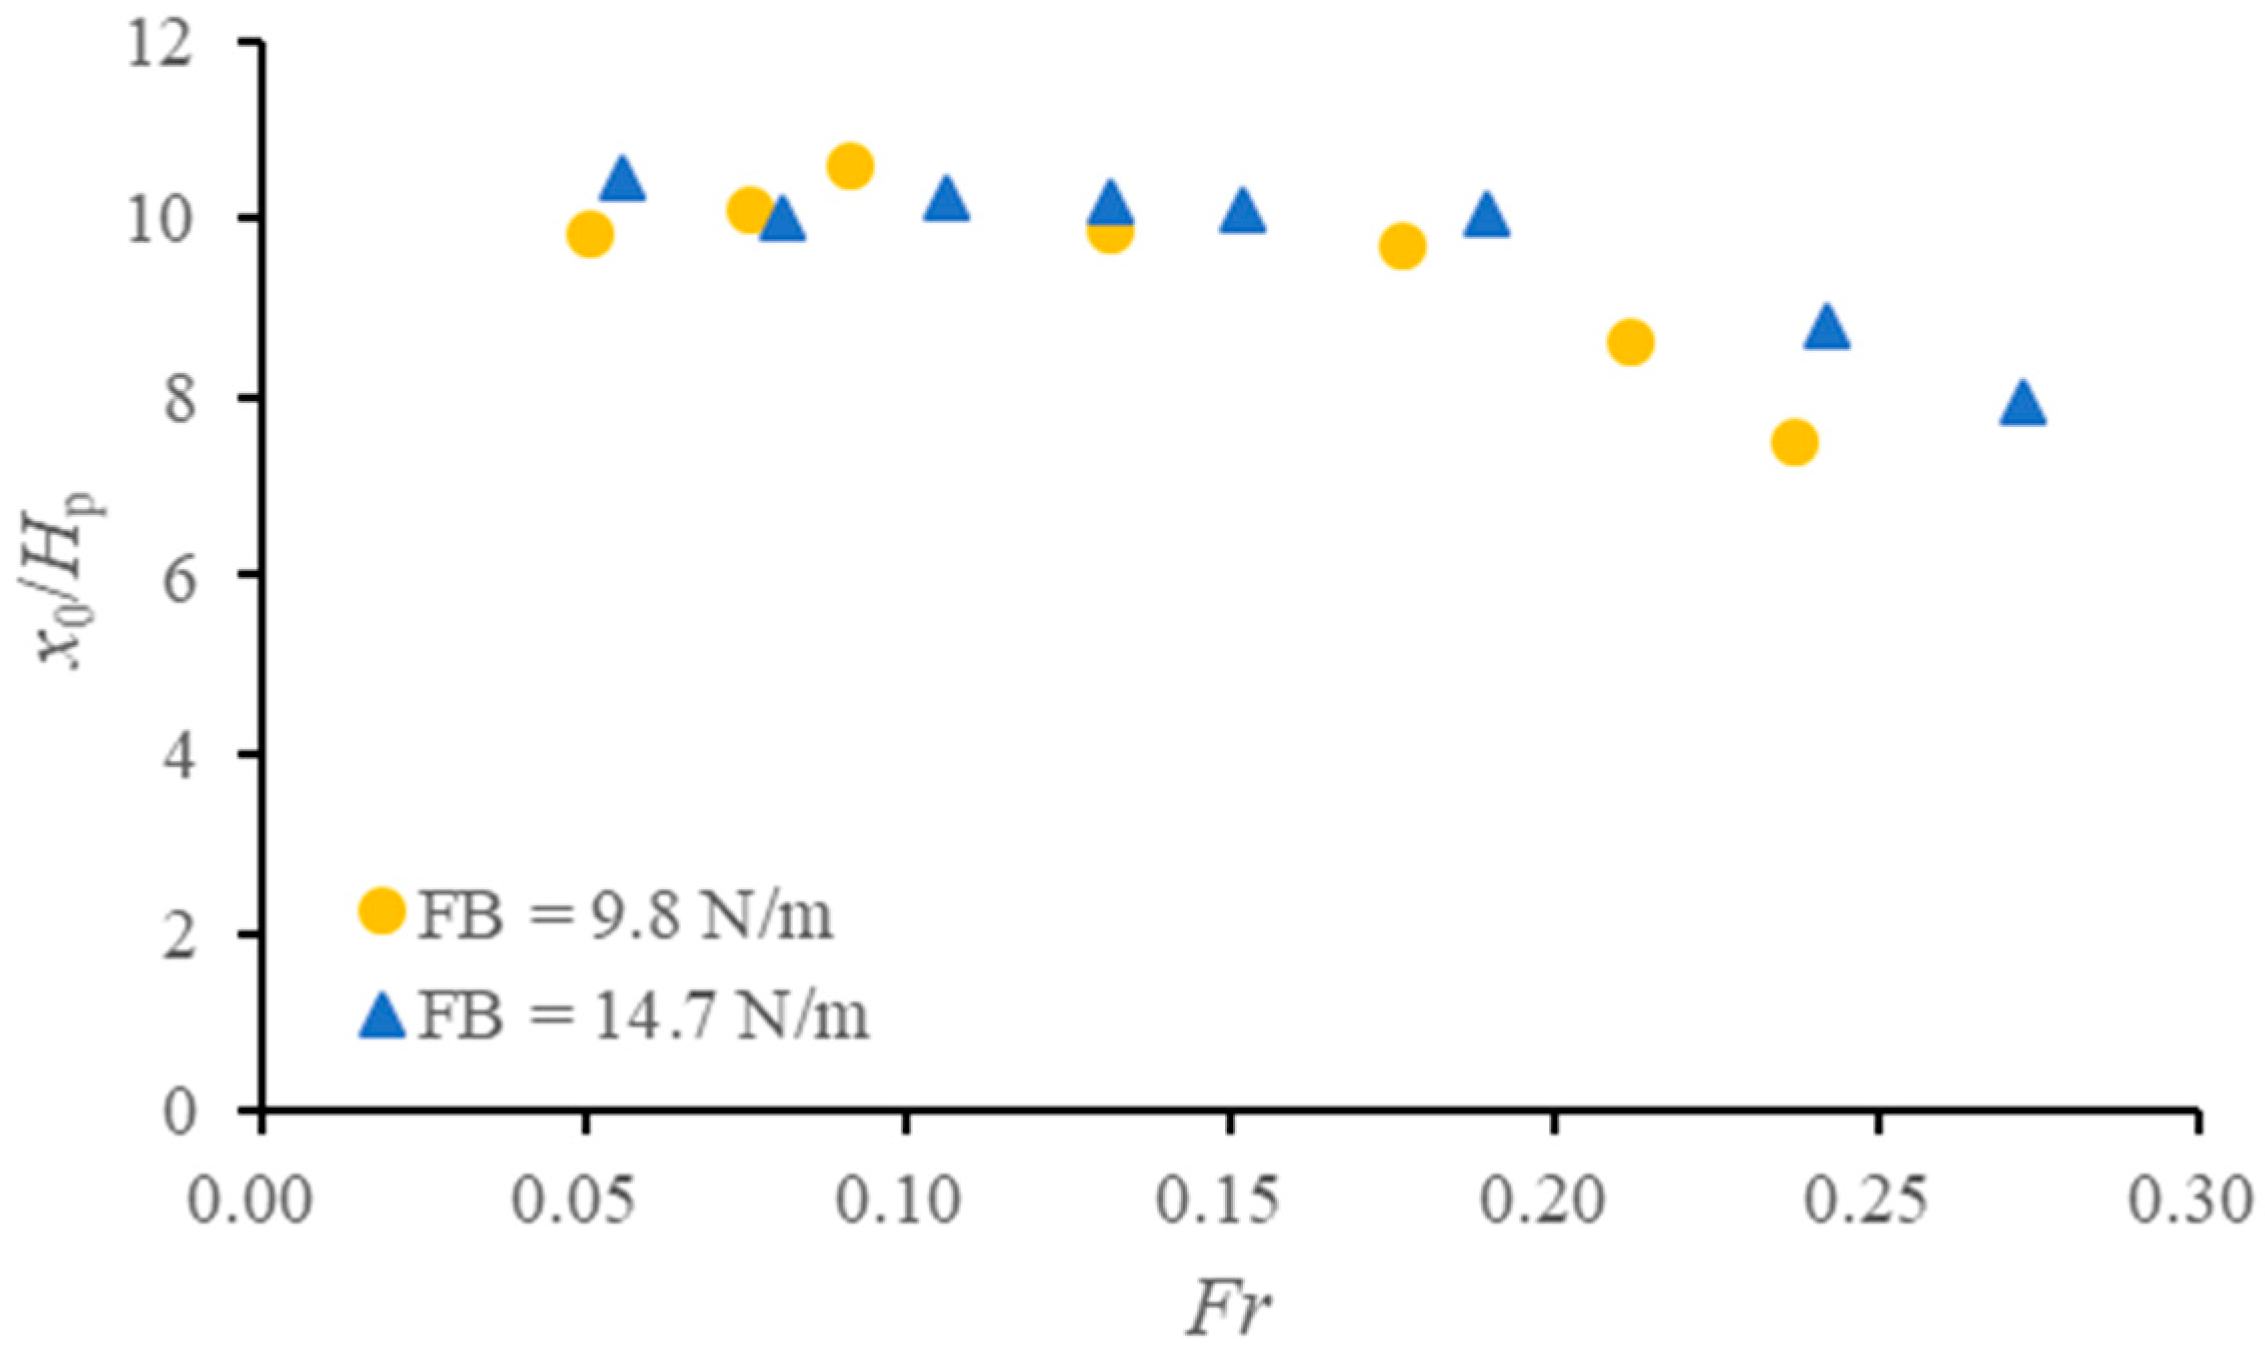
The position of the reattachment point x0 serves as a direct measure of the bottom vortex extent. Figure 8 plots the dimensionless reattachment point location x0/Hp versus the Froude number for both floating plate buoyancy configurations based on Figure 7. For Fr ≤ 0.18, the reattachment point remains constant near at x0/Hp = 10 with some slight fluctuations probably due to the unsteady flow regime. As the Froude number increases beyond this value, a pronounced and accelerating upstream migration of the reattachment point is witnessed. The movement pattern of the reattachment point with the Froude number will be discussed in detail in Section 4.

3.3. Effects on the Shear Stress

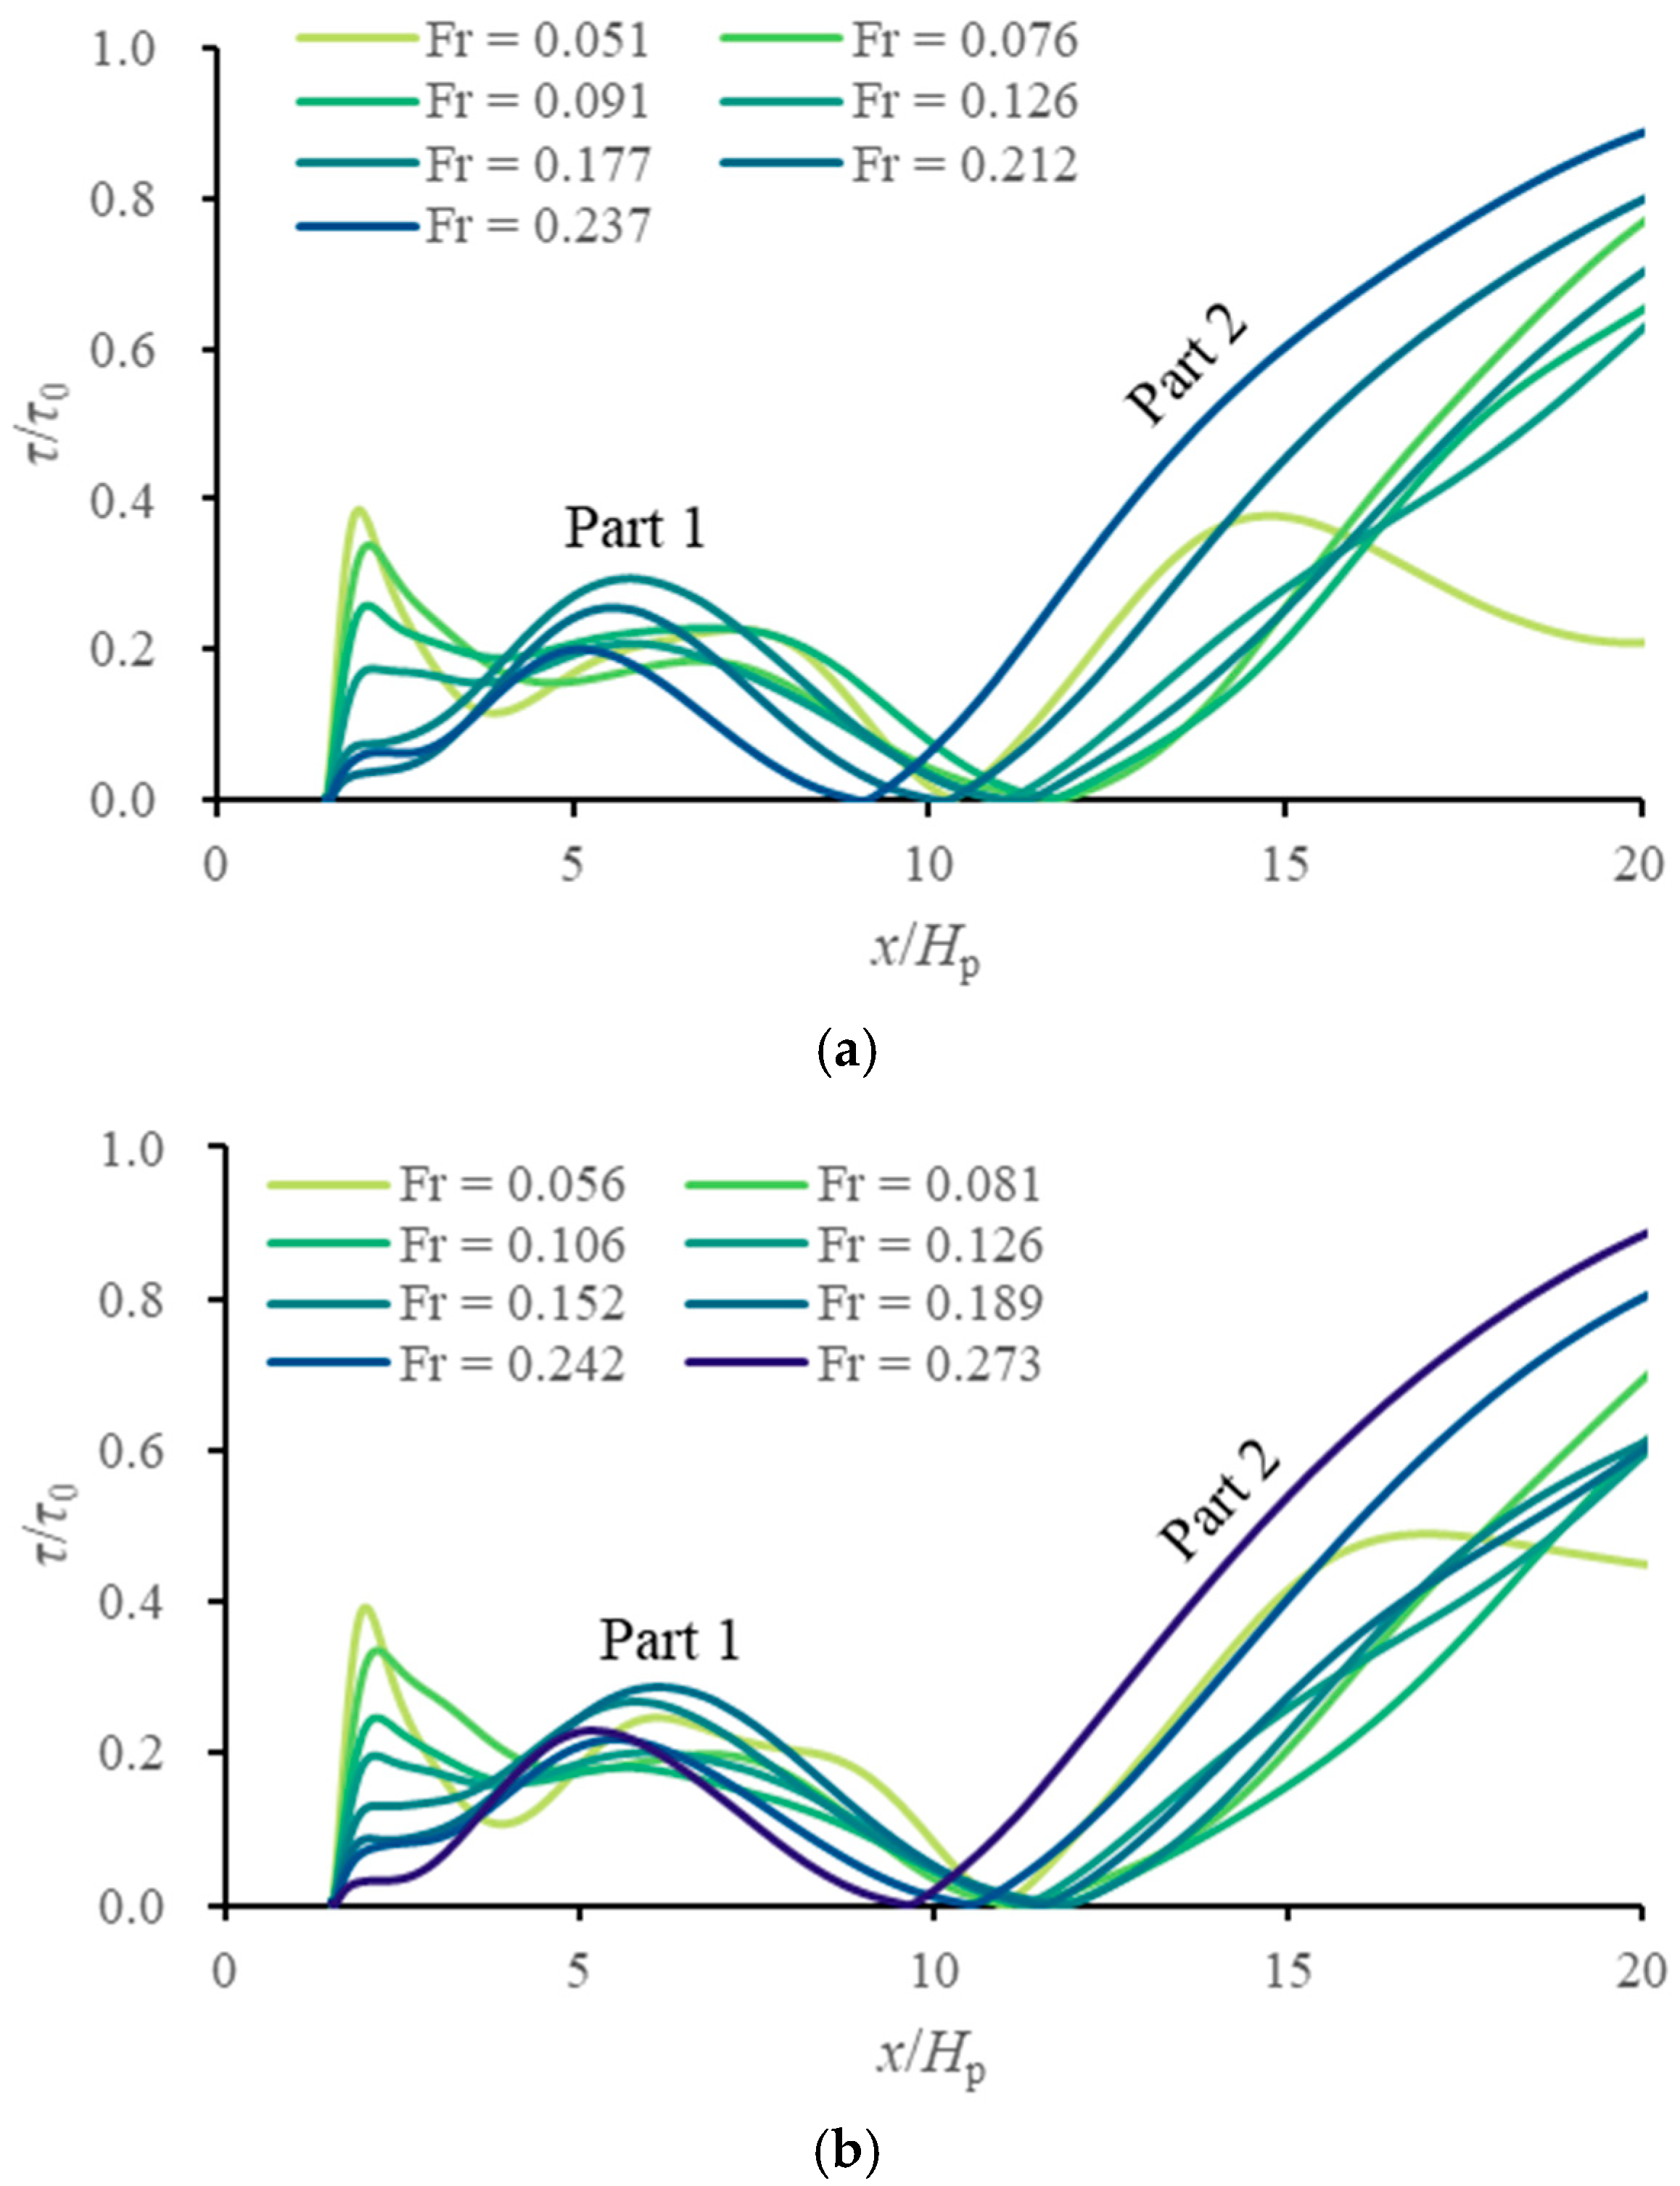
Figure 9 presents the distribution of normalized bed shear stress downstream of the GMFP for various Froude numbers. The bed shear stress τ is normalized with the undisturbed bed shear stress τ0, which was determined from separate simulations without the GMFP. Figure 9a,b correspond to floating plate buoyancies of FB = 9.8 N/m (Cases 01–07, Fr = 0.051–0.237) and FB = 14.7 N/m (Cases 11–18, Fr = 0.056–0.273), respectively.
The bed shear stress profiles exhibit a consistent structure across all simulated conditions. The profile is characterized by two distinct segments: Part 1 forms an arch-shaped curve, starting at the leeward mattress edge (x/Hp = 1.5), and ending near x/Hp = 10 where the shear stress reaches zero. Part 2 is the remainder of the curve, and features a monotonic increase in most cases. By comparing the two parts of the profiles with the flow field (Figure 6) and the near-bottom velocity (Figure 7), it can be inferred that Part 1 can be attributed to the bottom vortex, and Part 2 corresponds to the low-velocity lee wake of the bottom vortex (Figure 1b).
Critically, the protection area of the GMFP extends well beyond the bottom vortex. In all simulated cases, the normalized bed shear stress remains below 1.0 within 20 Hp downstream of the GMFP. This validates a significant reduction in scour potential compared with an unprotected bed, even under the highest velocity condition (Fr = 0.273).
Within the bottom vortex region (Part 1), the maximum bed shear stress is less than 40% of the value in the unprotected scenario across all flow conditions. For a typical case (Case 05), the maximum bed shear stress within Part 1 is 0.072 Pa, which is a reduction of over 70% compared to the maximum value of 0.248 Pa in the equivalent unprotected scenario. Minor fluctuations near the mattress at low Froude numbers are consistent with the previously observed unsteady flow pattern. In the lee wake region (Part 2), the bed shear stress rises steadily with distance to the GMFP. For Fr < 0.18, the protective efficacy is similar as the curves nearly collapse together. At higher Froude numbers (Fr > 0.18), the bed shear stress climbs more notably, indicating a gradual reduction in protection effects with increasing flow intensity. The reduction in bed shear stress within the safe area of GMFP can prevent sediment incipient motion and thus ensure the efficacy of scour mitigation. Further practical implications of these findings for engineering design will be presented in Section 4.

3.4. Effects on the Water Surface Profile

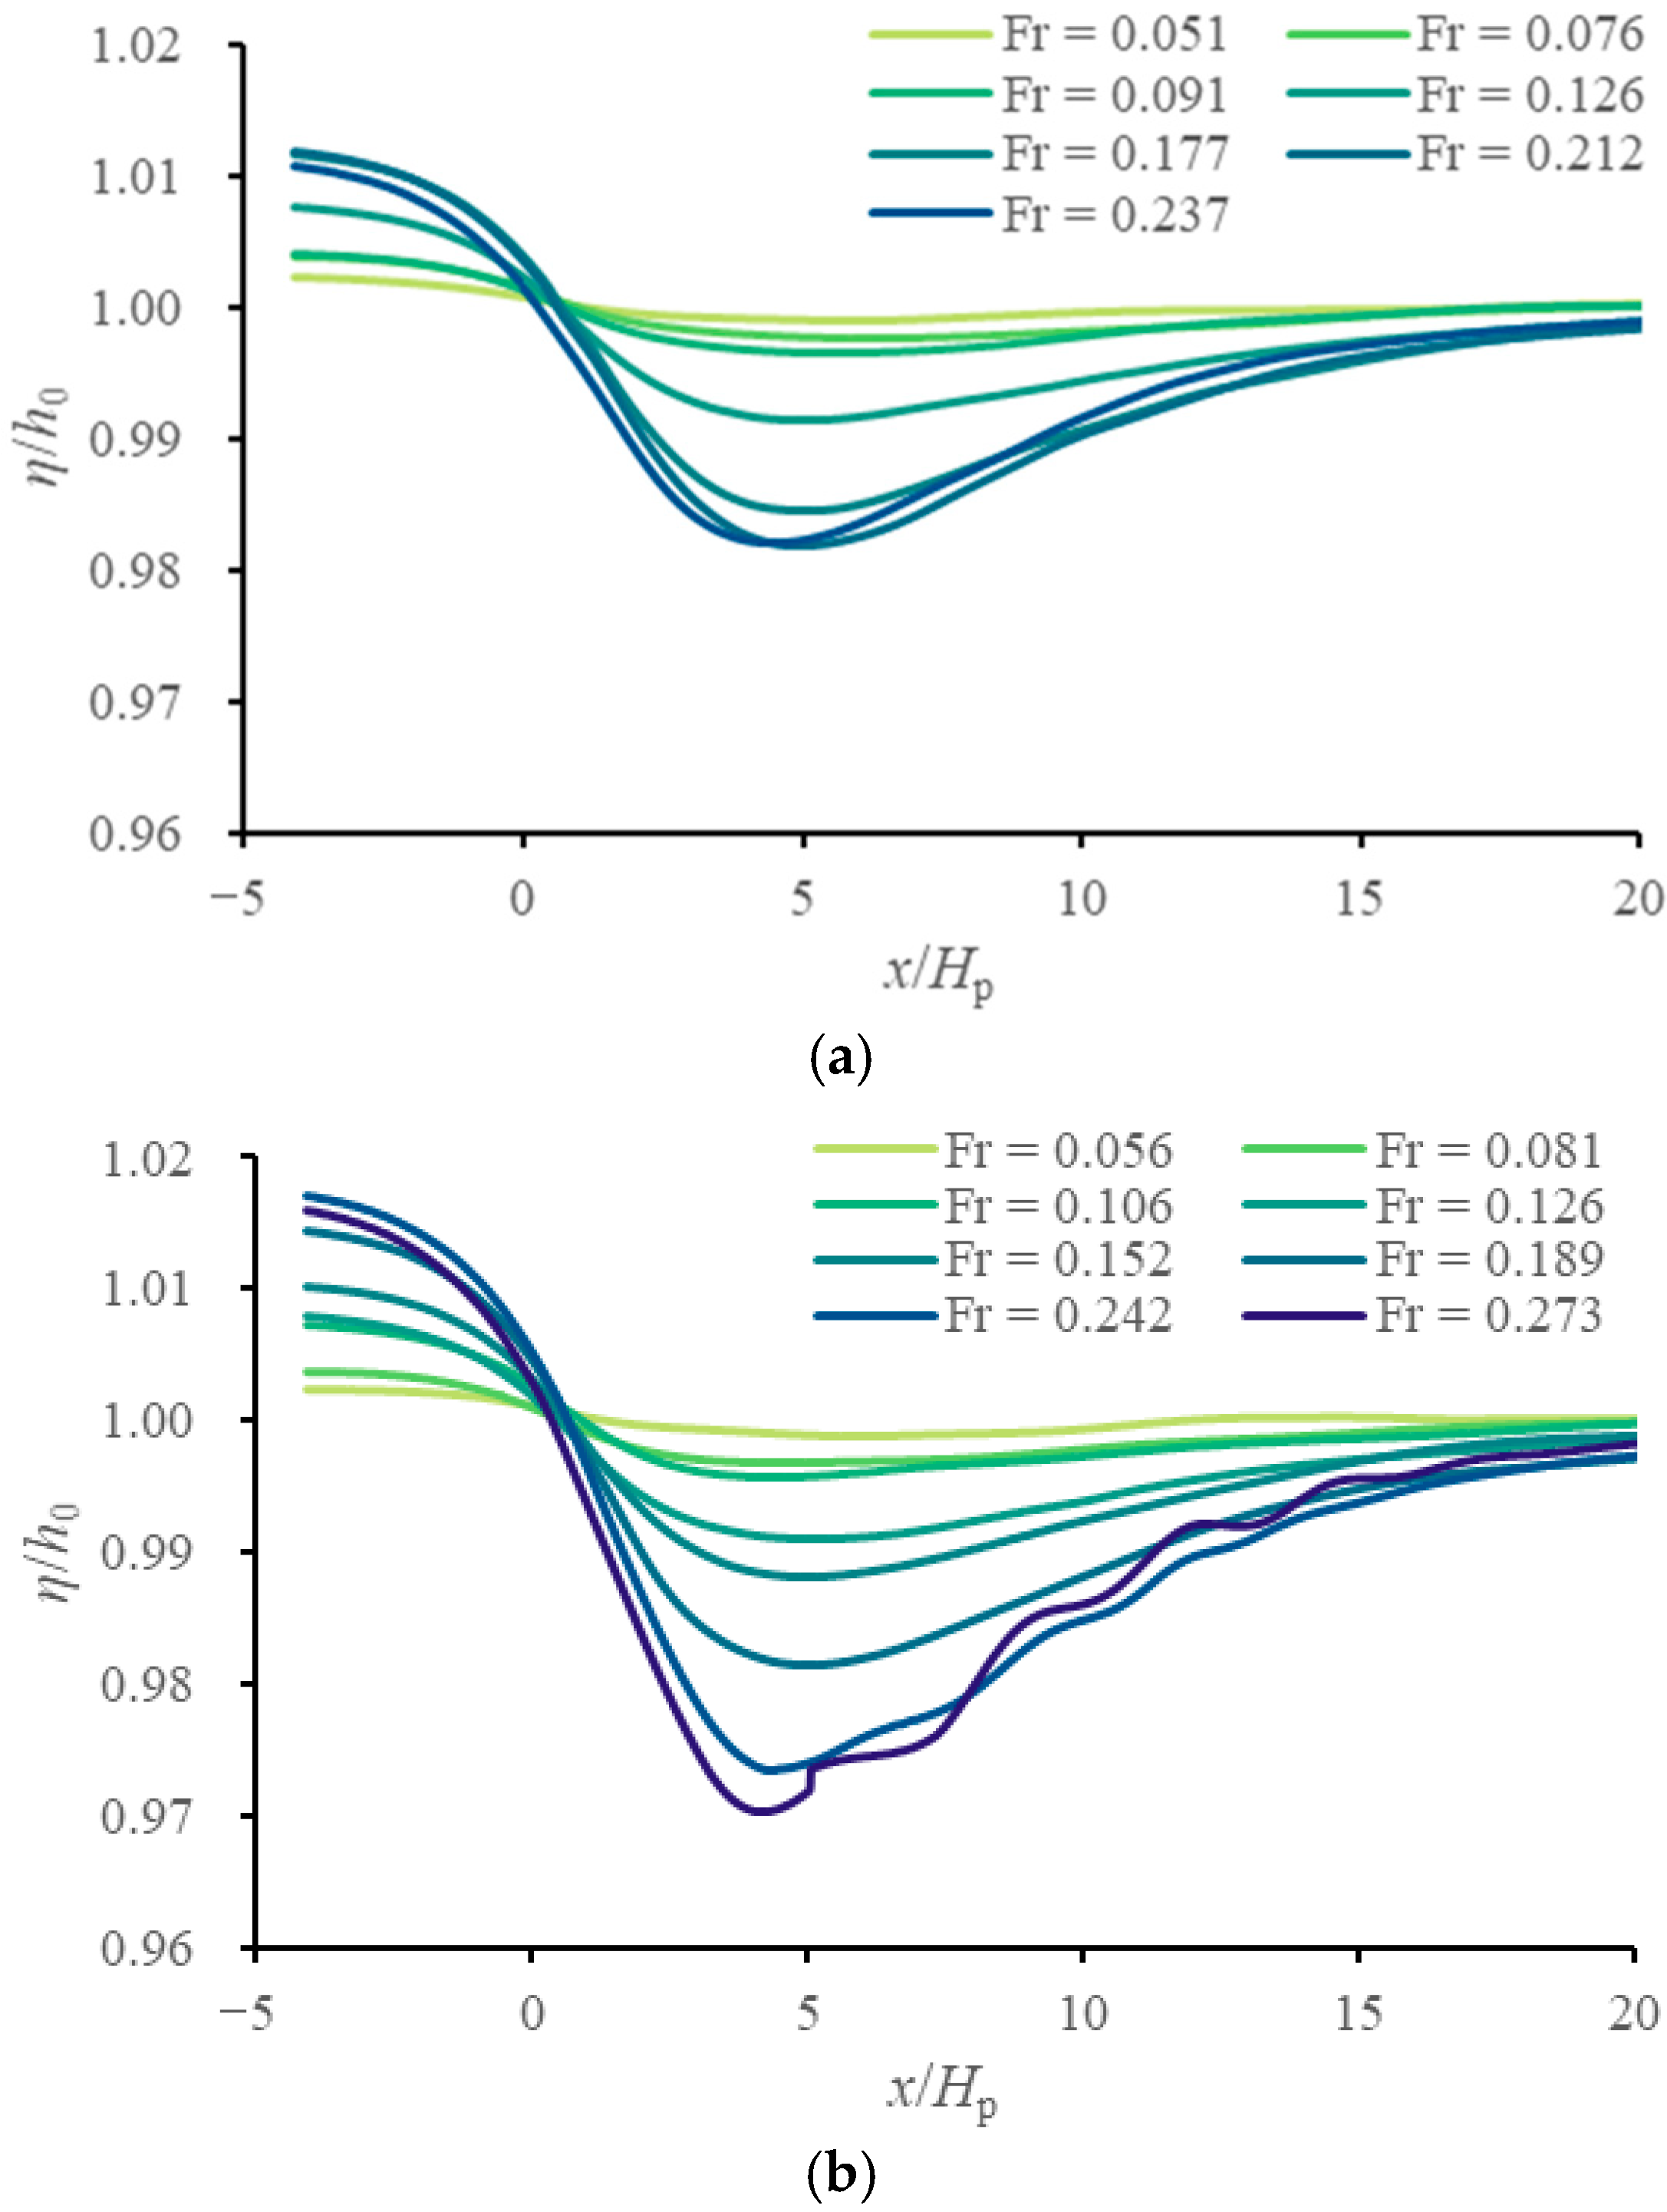
Figure 10 presents the water surface profiles over the GMFP under varying approach velocities. Figure 10a corresponds to the plate with a buoyancy of FB = 9.8 N/m (Cases 1–7, Fr = 0.051–0.237), and Figure 10b a buoyancy of 14.7 N/m (Cases 11–18, Fr = 0.056–0.273). The fluid elevation η is normalized with the undisturbed water depth h0 (=0.4 m).
A consistent shape of water surface profile is observed across all simulated conditions. The blockage effect of the GMFP causes a remarkable upstream backwater effect. The maximum rise in water surface within 5 Hp upstream is less than 2% of the flow depth. A more pronounced drawdown occurs over the structure, with the minimum elevation typically located near 5 Hp downstream, after which the water surface gradually recovers to the original depth.
The magnitude of the drawdown curve is dominantly affected by the Froude number. At low Fr values (specifically, Fr = 0.051, 0.076, 0.091, 0.056, 0.081 and 0.106), the drawdown is minimal, which is less than 1% of h0. This magnitude increases significantly with higher Froude numbers. Surface waves are observed in the recovery curve under the highest velocity condition (Fr = 0.273).
The drawdown curve is asymmetric both horizontally and vertically. In the horizontal direction, all profiles cross the undisturbed water level leeward of the device. Vertically, the magnitude of the water backup is greatly smaller than that of the drawdown. This asymmetry aligns with observations of the bed pressure distribution reported in [24].
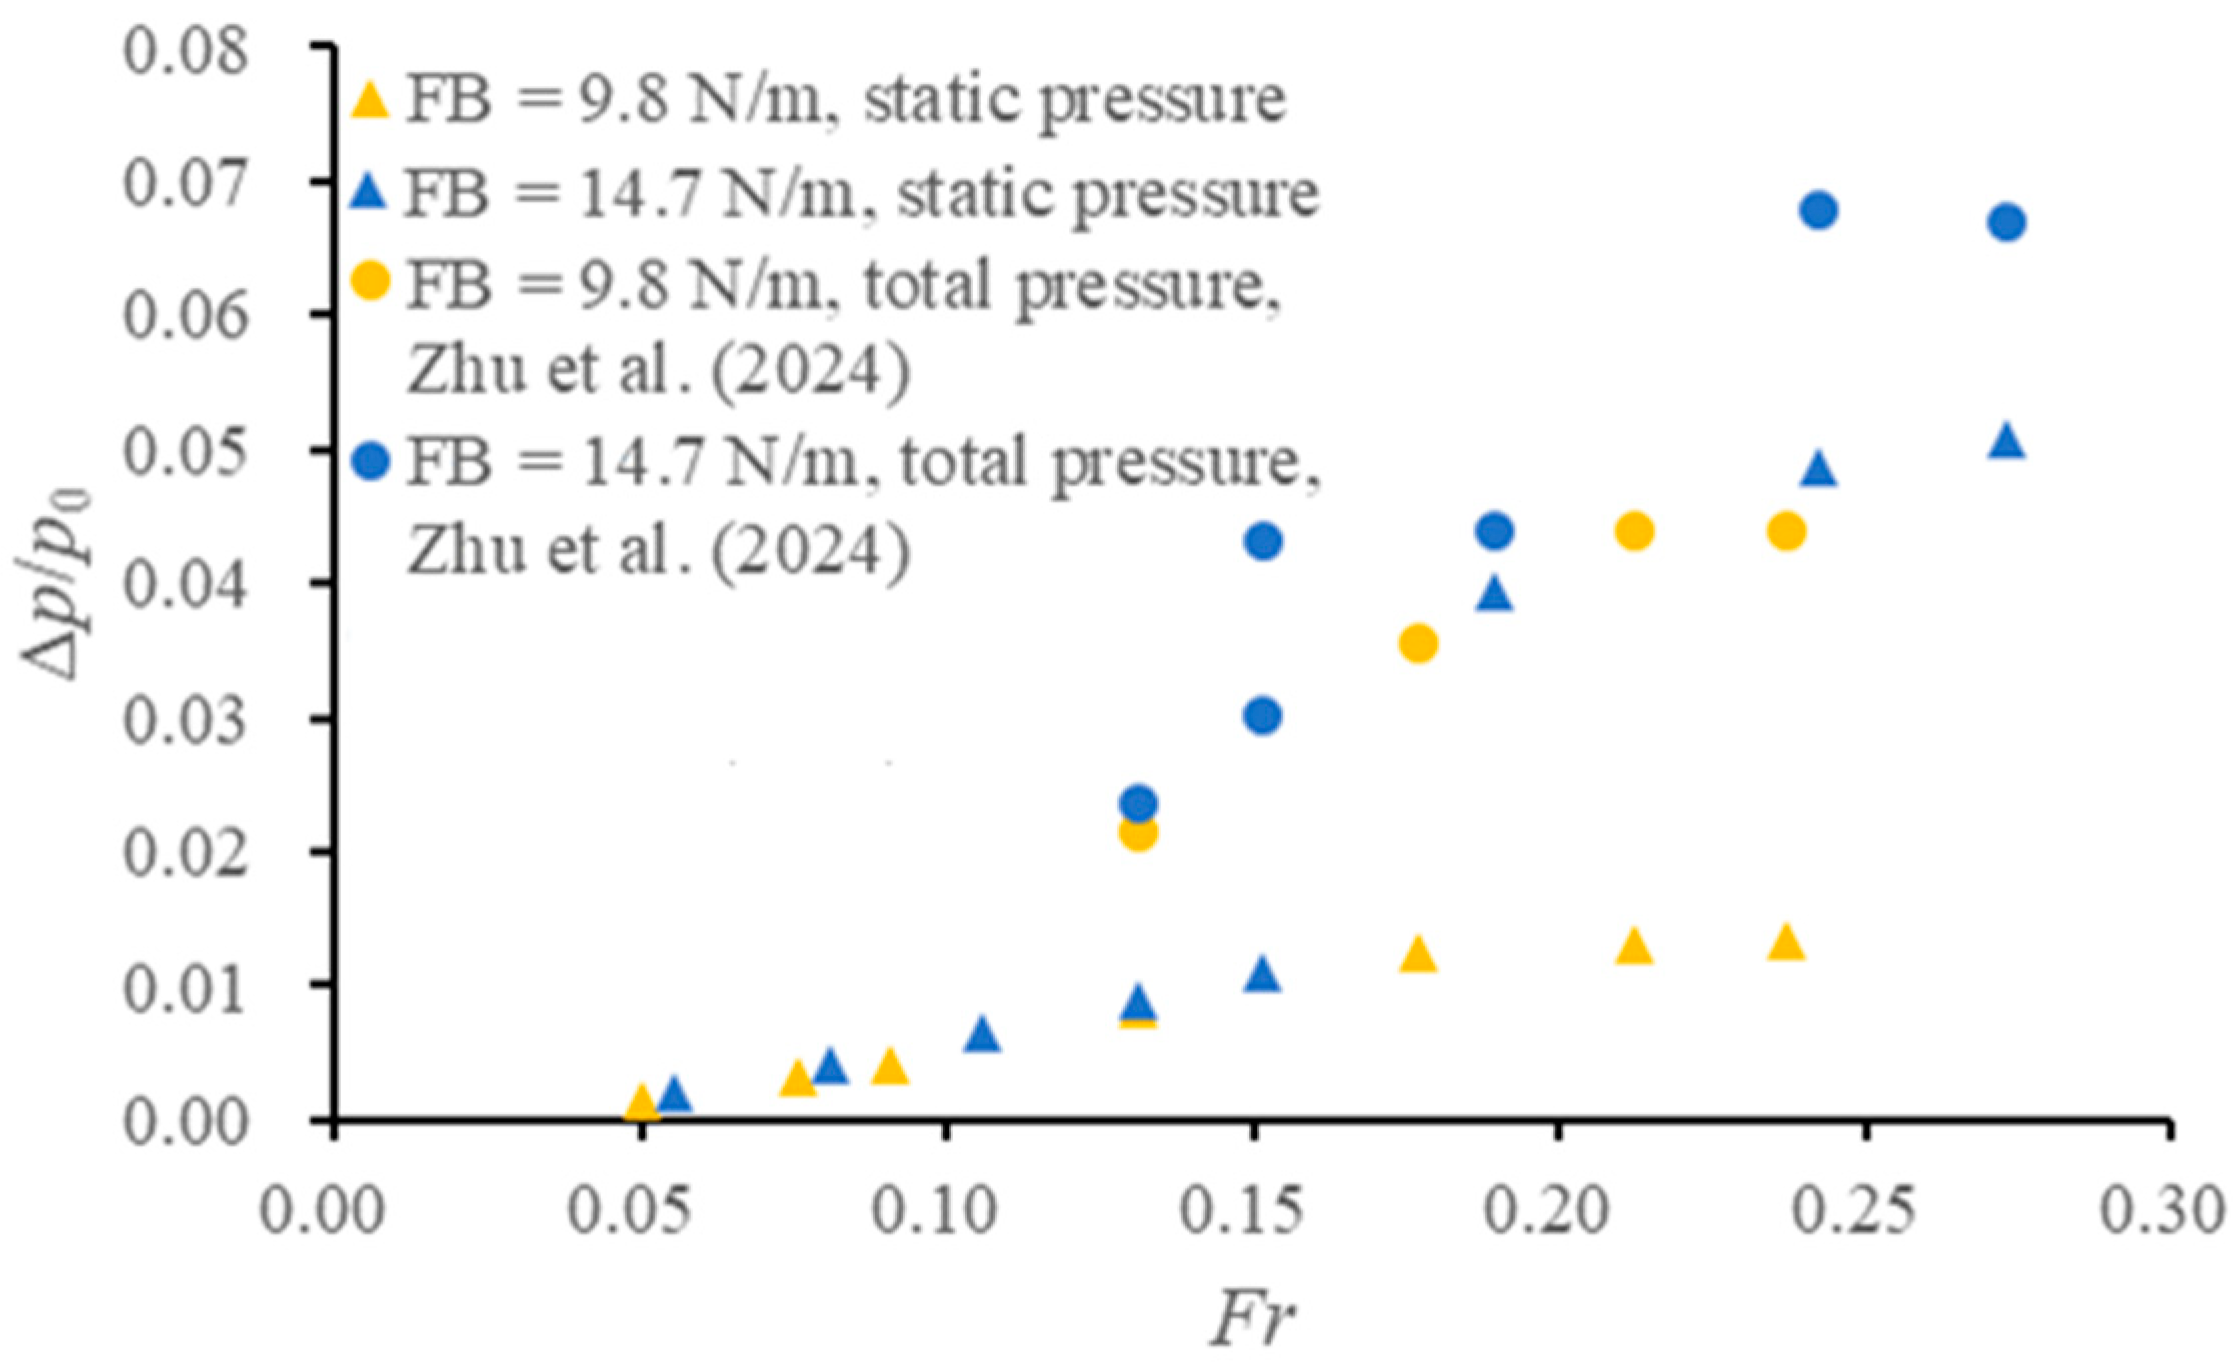
Figure 11 plots the pressure difference across the geotextile mattress, comparing the contributions from hydrostatic pressure (calculated from the present water surface data) and total pressure (derived from [24]). The pressure difference is normalized with the hydrostatic pressure under the undisturbed flow depth p0. The data reveal that both the hydrostatic and total pressure differences exhibit a similar upward trend with increasing Froude number. A comparison of their magnitudes demonstrates that the hydrostatic component, driven by water level variation, is the dominant contributor to the total bed pressure difference across the GMFP. This is particularly true in cases with high Froude numbers.

4. Discussion on the Protection Effect of the GMFP

4.1. Variation in the Reattachment Point with the Froude Number

The protective effects of the GMFP are reflected by the extent of the safe area, which contains two interconnected parts: the bottom vortex and the adjacent low velocity zone (Figure 1b). The extent of the safe area, an indicator of the GMFP protection effects, can thus be quantified by the position of the reattachment point. Leeward movement of the reattachment point can infer an enhanced protection effect of the GMFP, and vice versa.
As illustrated in Figure 8, the reattachment point remains nearly fixed at lower Froude numbers but starts to move upstream with a further increase in the Froude number beyond a critical value. This variation pattern is consistent across both tested buoyancy values (FB = 9.8 N/m and 14.7 N/m), with the transition occurring near Fr = 0.177 and 0.189, respectively.
This response can be expounded by the competition between two opposing mechanisms influenced by the Froude number. At low Froude numbers, the bottom vortex becomes increasingly developed and the adjacent flow gradually stabilizes. The developing bottom vortex promotes a slight leeward extension of the vortex. At the same time, the floating plate gradually inclines further with the rising flow velocity, reducing its obstruction height. The drop in the obstruction height inhibits the vortex development, and the vortex can thus retreat upstream [25]. As the flow velocity is relatively low, the plate is approximately vertical and the reduction in obstruction height is minimal. The opposite influence of the bottom vortex development and the obstruction height reduction are weak and nearly balanced. Consequently, the position of the reattachment point remains nearly constant.
When the flow intensifies beyond the critical Froude number, this balance is disrupted. The bottom vortex is now fully developed, and the potential for further leeward extension of the vortex is limited [25]. The effect of the obstruction height becomes dominant. The decline in the sloping angle and thus the obstruction height accelerates with increasing Froude number, overwhelming the extension trend of the vortex. Thus, the extent of the bottom vortex descends and the reattachment point moves upstream.
The analysis above suggests the existence of a critical flow condition for a given GMFP configuration. Below this critical flow intensity, the extension of the bottom vortex and thus the safe area remains nearly stable. Above it, the extension of both drops with increasing flow velocity. The present simulation results indicate that this critical condition is a function of the plate buoyancy, and can be obtained through flume experiments or numerical simulations. According to present results, when the floating plate buoyancy is higher, this critical flow intensity rises. For applications where flow depth is limited or is a dominant factor, the Froude number is an appropriate parameter to describe the critical condition. Otherwise, the near bottom velocity can be a better option.
The physical implication of the critical condition is the upper bound of the flow intensity at which a specific GMFP can provide optimal protection on its leeside. While the device continues providing scour mitigation at higher flow intensities, the protective performance can suffer remarkable reduction

4.2. Application to Practical Engineering Design

In practical engineering, the critical flow condition is a fundamental parameter in the engineering design of a GMFP. The floating plate buoyancy, a key design parameter, can be determined based on the functional relationship with the desired critical condition. Other GMFP parameters like plate thickness and plate density can be selected according to the plate buoyancy thereafter.
The selection of an appropriate critical condition should be guided by the aim of protection and historical hydrodynamic data at the deployment site. Under normal conditions, the flow intensity is sub-critical, and bed shear stress within the protected area is well below the threshold for sediment incipient motion, effectively preventing scour. During extreme events, the flow intensity is super-critical, and bed shear stress increases. The protection of the GMFP becomes diminished, yet still substantial. As shown in Figure 9, the shear stress remains significantly lower than in an unprotected scenario. This reduction in erosive capacity mitigates bed scour, enhancing the survival probability of the structures to be protected. Furthermore, the GMFP is resilient, as the plate nearly lies down on the bed in high-speed flow and the hydrodynamic load on the device is reduced. After the extreme event, the GMFP can quickly resume its optimal functioning state.
In the regions with adequate sediment supply, the protection efficacy of the GMFP can be further enhanced. Under normal conditions, the reduced flow intensity promotes sediment deposition within the safe area, forming an extra layer of sediment. During extreme events, the previously deposited sediment can be scoured, shielding the original bed and the structures. Afterwards, the GMFP can recover and start the sediment trapping again, and thus the remediation can be automatically completed by the GMFP. This creates a self-sustaining cycle where the GMFP facilitates its own recovery through natural sediment processes, reducing long-term maintenance needs.
As the present study is fundamental in nature, focusing more on the primary flow mechanisms, not all factors of the protection efficacy were investigated. The dynamic response of sloping angle in a single case was not considered. Future studies will emphasize other factors, including the GMFP design parameters. In addition, advanced techniques, like the Adaptive Neuro-fuzzy Inference System (ANFIS), could be employed in subsequent studies to quantitatively rank the influence of various parameters on bottom vortex development.

5. Conclusions

This numerical investigation examined the hydrodynamic behavior around a Geotextile Mattress with a Floating Plate (GMFP), revealing the influence of the Froude number. The response of the sloping angle of the plate to the flow velocity was considered. The main findings are listed below.
  • The bottom vortex shows a two-stage response to increasing Froude numbers. The reattachment point remains stable at lower flow intensities but moves upstream when the Froude number exceeds a critical value, which can be attributed to competing influences of bottom vortex development and the reduction in the effective obstruction height of the plate.
  • The critical condition of the bottom vortex response, which is dependent on the plate’s buoyancy, demarcates a regime of stable, optimal protection from one where the bottom vortex contracts and protection effect is substantial but diminished. This condition provides a central design criterion for ensuring structural resilience under varying flow conditions.
  • The GMFP is capable of reducing bed shear stress, providing effective scour protection over a significant downstream distance. The extent of bed shear stress within the bottom vortex is less than 40% of that in the unprotected conditions.
  • Asymmetric water backup and drawdown are observed over the GMFP due to the blockage effect, constituting the dominant component of the bed pressure difference across the GMFP. The magnitude of upstream backup is much smaller than that of the drawdown on the leeside.
  • As the Froude number increases, the flow regime evolves from a complex, unsteady state with a complex dual-core structure at lower Froude numbers to a consolidated and stable vortex system at higher Fr values, accompanied by a remarkable shrinkage of the vortices in the top vortex zone.
These findings offer a fundamental basis for optimizing GMFP design. As the present study focuses on basic mechanisms, details like dynamic coupling of the plate’s angle is considered secondary. A broader range of structural parameters will be investigated in future work for comprehensive practical application.

Author Contributions

Conceptualization, Y.Z.; methodology, Y.Z.; validation, Y.Z.; formal analysis, Y.Z.; investigation, Y.Z.; resources, Y.Z., L.X. and Y.L.; writing—original draft preparation, Y.Z.; writing—review and editing, Y.Z. and L.X.; visualization, Y.Z.; project administration, Y.Z., L.X. and Y.L.; funding acquisition, L.X. and Y.Z. All authors have read and agreed to the published version of the manuscript.

Funding

This research was funded by National Natural Science Foundation of China, grant numbers 11172213 and 51479137, and the China Scholarship Council, grant number 201806260166.

Data Availability Statement

The original contributions presented in the study are included in the article material. Further inquiries can be directed to the corresponding author.

Conflicts of Interest

The authors declare no conflicts of interest. The funders had no role in the design of the study; in the collection, analyses, or interpretation of data; in the writing of the manuscript; or in the decision to publish the results.

References

  1. A Study of U.S. Bridge Failures (1980–2012). Available online: https://www.buffalo.edu/mceer/catalog.host.html/content/shared/www/mceer/publications/MCEER-13-0008.detail.html (accessed on 12 August 2025).
  2. Rashidi, H.; Najarchi, M.; Hezaveh, S.M.M. Investigating and modeling of the scour downstream of a tree trunk deflector in a straight channel. Water 2023, 15, 3483. [Google Scholar] [CrossRef]
  3. Liu, X.; Wang, X.; Zhao, F.; Sheng, H. Effect of flow deflectors on local scour around artificial reefs under steady current: Experimental and numerical investigations. Appl. Ocean Res. 2025, 157, 104509. [Google Scholar] [CrossRef]
  4. Bahrami-Yarahmadi, M.; Erick, R.; Shafai-Bejestan, M.; Mosselman, E. A laboratory-scale numerical study of the effects of bank-attached vane submergence on flow pattern and bed shear stress distribution. J. Hydraul Res. 2025, 63, 15–31. [Google Scholar] [CrossRef]
  5. Esmaeli, P.; Boudaghpour, S.; Rostami, M.; Mirzaee, M. Experimental investigation of permeability and length of a series of spur dikes effects on the control of bank erosion in the meandering channel. Ain Shams Eng. J. 2022, 13, 101701. [Google Scholar] [CrossRef]
  6. Aung, H.; Zhang, M.; Oliveto, G.; Onorati, B.; Yu, G. Reattachment length of flow at the lee side of a vertical spur dike in an open channel. J. Waterw. Port Coast. Ocean Eng. 2024, 150, 04024012. [Google Scholar] [CrossRef]
  7. Guguloth, S.; Chaudhuri, A.R.; Shafighi, N.; Kumar, S. Influence of submergence ratio on scour morphology around spur dike: Experimental and numerical analysis. Acta Geophys. 2025, 73, 6051–6066. [Google Scholar] [CrossRef]
  8. Fan, J.; Kuang, C.; Li, H.; Mao, X.; Gong, L.; Zhang, J. Influence mechanisms of the submerged sand engine on coastal protection as the extension of beach nourishment. Ocean Eng. 2025, 316, 119970. [Google Scholar] [CrossRef]
  9. Muroi, S.; Bertone, E.; Cartwright, N.; Alvarez, F. Hybrid one-line/2DH model of submerged breakwater for coastal protection. Environ. Model. Softw. 2024, 172, 105897. [Google Scholar] [CrossRef]
  10. Muroi, S.; Bertone, E.; Cartwright, N.; Alvarez, F. Machine learning methods for predicting shoreline change from submerged breakwater simulations. Eng. Appl. Artif. Intell. 2025, 152, 110726. [Google Scholar] [CrossRef]
  11. Peng, M.; Zhang, J.; Zhu, Y.; Gao, L.; Li, S.; Pan, X. Experimental study on wave attenuation and stability of ecological dike system composed of submerged breakwater, mangrove, and dike under storm surge. Appl. Ocean Res. 2024, 151, 104144. [Google Scholar] [CrossRef]
  12. Broekema, Y.; van Steijn, P.; Wu, M.; Robijns, T. Predicting loose rock scour protection deformation around monopiles using the relative mobility number and the Keulegan-Carpenter number. Ocean Eng. 2024, 300, 117475. [Google Scholar] [CrossRef]
  13. Menéndez-Vicente, C.; López-Querol, S.; Harris, J.; Tavouktsoglou, N. Numerical study on the stiffening properties of scour protection around monopiles for offshore wind turbines. Eng. Geol. 2025, 345, 107835. [Google Scholar] [CrossRef]
  14. Hu, R.; Lu, Y.; Leng, H.; Liu, H.; Shi, W. A novel countermeasure for preventing scour around monopile foundations using ionic soil stabilizer solidified slurry. Appl. Ocean Res. 2022, 121, 103121. [Google Scholar] [CrossRef]
  15. Hu, R.; Wang, X.; Liu, H.; Leng, H. Scour protection of submarine pipelines using ionic soil stabilizer solidified soil. J. Mar. Sci. Eng. 2022, 10, 76. [Google Scholar] [CrossRef]
  16. Wang, C.; Jin, L.; Qian, Y.; Wu, Y.; Liang, F. Investigation of the protection mechanism and failure modes of solidified soil utilized for scour mitigation. Constr. Build. Mater. 2025, 472, 140858. [Google Scholar] [CrossRef]
  17. Yang, H.; Lu, Y.; Zuo, L.; Yuan, C.; Lu, Y.; Zhu, H. Numerical analysis of interaction between flow characteristics and dynamic response of interlocked concrete block mattress during sinking process. Ocean Eng. 2023, 286, 115574. [Google Scholar] [CrossRef]
  18. Gao, Y.; Chen, W.; Zhou, P.; Du, F.; Wang, L. Experimental investigation on scour development and scour protection for offshore converter platform. Mar. Struct. 2023, 90, 103440. [Google Scholar] [CrossRef]
  19. Wang, G.; Xu, S.; Zhang, Q.; Zhang, J. An Experimental study of the local scour protection methods around the monopile foundation of offshore wind turbines. Ocean Eng. 2023, 273, 113957. [Google Scholar] [CrossRef]
  20. Zhu, Y.; Xie, L.; Su, T.-C. Scour Protection effects of a geotextile mattress with floating plate on a pipeline. Sustainability 2020, 12, 3482. [Google Scholar] [CrossRef]
  21. Xie, L.; Huang, W.; Yu, Y. Experimental study of sediment trapping by geotextile mattress installed with sloping curtain. Geosynth. Int. 2013, 20, 389–395. [Google Scholar] [CrossRef]
  22. Wang, H.; Si, F.; Lou, G.; Yang, W.; Yu, G. Hydrodynamic characteristics of a suspended curtain for sediment trapping. J. Waterw. Port Coast. Ocean. Eng. 2015, 141, 04014030. [Google Scholar] [CrossRef]
  23. Xie, L.; Zhu, Y.; Li, Y.; Su, T.-C. Experimental study on bed pressure around geotextile mattress with sloping plate. PLoS ONE 2019, 14, e0211312. [Google Scholar] [CrossRef]
  24. Zhu, Y.; Wang, Q.; Wu, G.; Li, Y.; Xie, L. Effects on the potential for seepage failure under a geotextile mattress with floating plate. J. Mar. Sci. Eng. 2024, 12, 1975. [Google Scholar] [CrossRef]
  25. Zhu, Y.; Xie, L.; Su, T.-C. Flow characteristics on the leeside of a geotextile mattress with floating plate. Ocean Eng. 2022, 265, 112624. [Google Scholar] [CrossRef]
  26. Flow Science Inc. FLOW-3D Documentation; Release 10.1.0; Flow Science, Inc.: Santa Fe, NM, USA, 2012; pp. 76–206. [Google Scholar]
  27. Xia, Y.; Liu, J.; Yang, S.; Wang, S.; Li, L. Scour depth around cylinders under combined effects of river flow and tidal currents. J. Mar. Sci. Eng. 2025, 13, 1114. [Google Scholar] [CrossRef]
  28. Lu, Y.; Wang, Z.; Zhao, Z.; Zhao, D.; Zhang, Y. Hydraulic Characteristics of a new vertical slot fishway with staggered baffles configuration. Water 2025, 17, 809. [Google Scholar] [CrossRef]
  29. Valizadeh, R.; Arman, A.; Ghobadian, R. Controlling the local scouring of the bottom of the protective inclined apron in a 90-degree mild bend using a numerical model. Ocean Eng. 2024, 307, 118177. [Google Scholar] [CrossRef]
  30. Hirt, C.W.; Nichols, B.D. Volume of fluid (VOF) method for the dynamics of free boundaries. J. Comput. Phys. 1981, 39, 201–225. [Google Scholar] [CrossRef]
  31. Bina, K.; Rikhtehgarmashhad, S.; Hosseini, K.; Karami, H. Numerical estimation of discharge coefficient for non-circular bottom intake racks. Appl. Water Sci. 2024, 14, 103. [Google Scholar] [CrossRef]
  32. Al-Jubouri, M.; Ray, R.P.; Abbas, E.H. Advanced Numerical Simulation of Scour around Bridge Piers: Effects of Pier Geometry and Debris on Scour Depth. J. Mar. Sci. Eng. 2024, 12, 1637. [Google Scholar] [CrossRef]
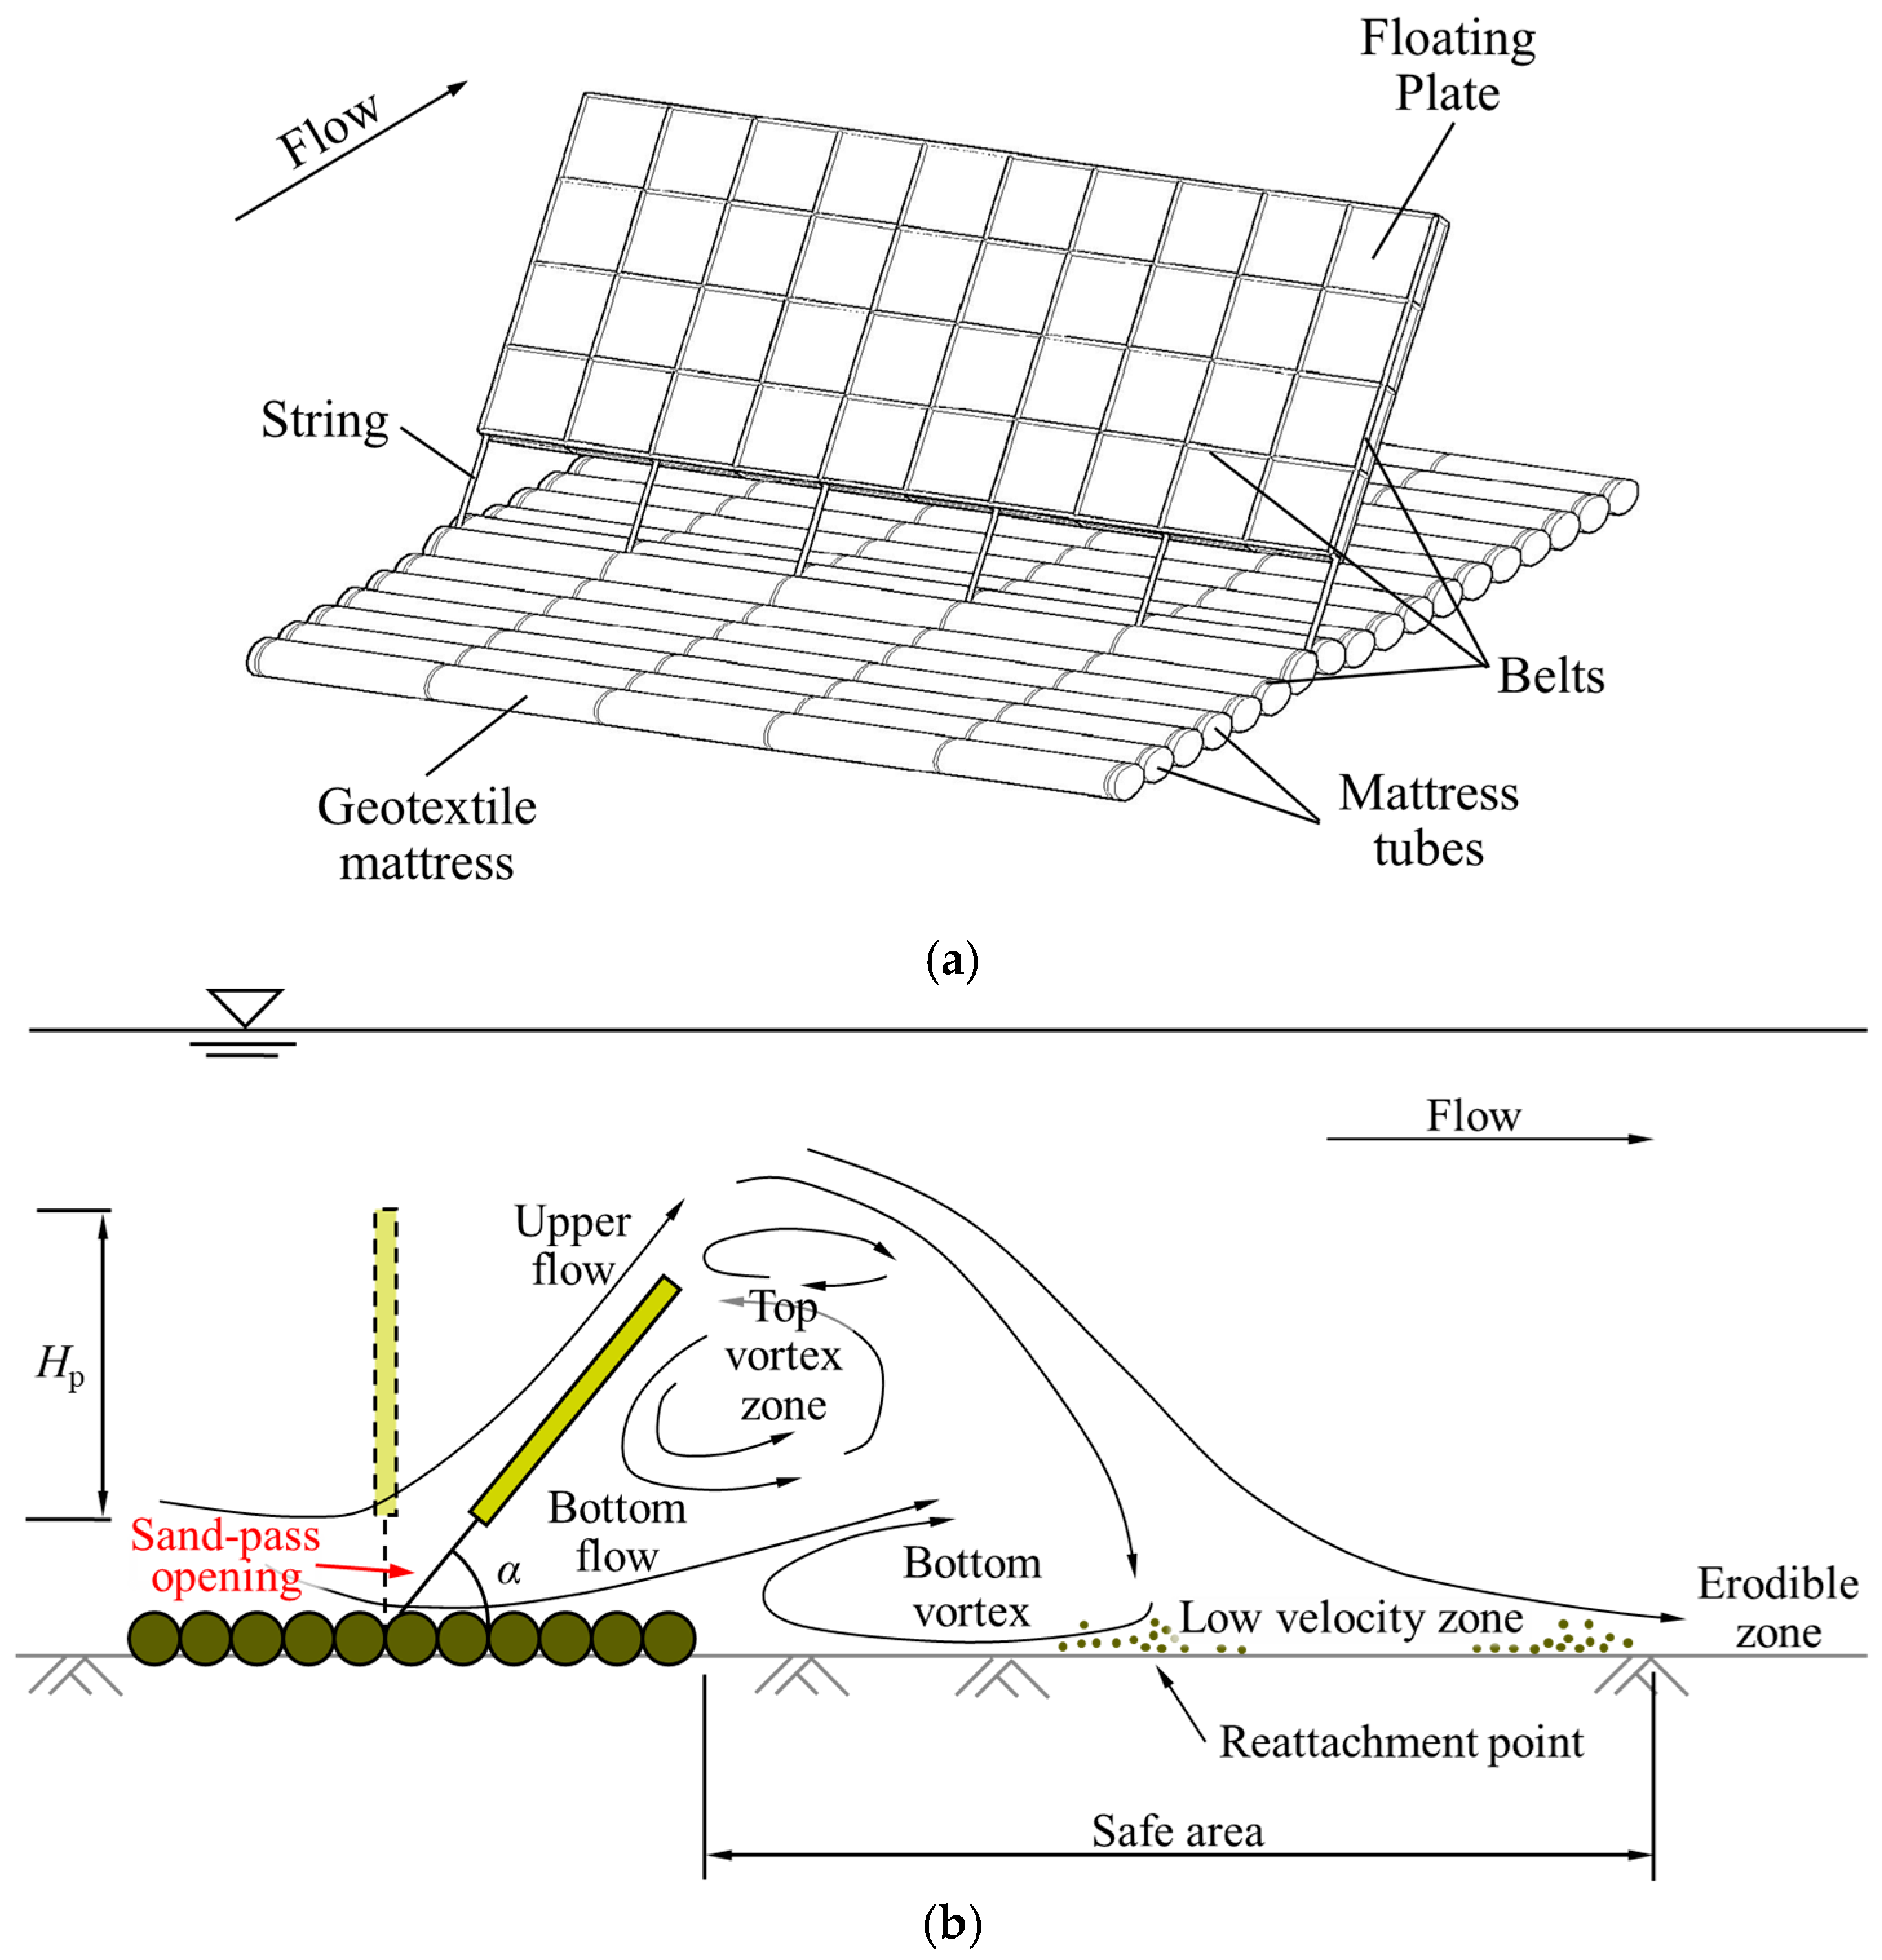
Figure 1. The Geotextile Mattress with Floating Plate (GMFP) (reproduced from [20]): (a) Schematic diagram of the GMFP; (b) Illustration of the fundamental working principle of the GMFP (not to scale).
Jmse 13 02215 g001
Figure 2. Sketch of the numerical flume (not to scale).
Jmse 13 02215 g002
Figure 3. Computational mesh near the GMFP.
Jmse 13 02215 g003
Figure 4. Comparison between experimental [25] and present numerical results for near bottom velocity downstream of a GMFP in a steady current.
Jmse 13 02215 g004
Figure 5. Comparison between experimental [23] and present numerical results for bed pressure downstream of a GMFP in a steady current.
Jmse 13 02215 g005
Figure 6. Flow field near the GMFP at different Froude numbers: (a) Fr = 0.051 (Case 01, sin α = 0.985); (b) Fr = 0.091 (Case 03, sin α = 0.940); (c) Fr = 0.177 (Case 05, sin α = 0.766); (d) Fr = 0.237 (Case 07, sin α = 0.574).
Jmse 13 02215 g006aJmse 13 02215 g006b
Figure 7. Near-bottom velocity leeward of the GMFP as a function of Froude number for two buoyancy values: (a) FB = 9.8 N/m; (b) FB = 14.7 N/m.
Jmse 13 02215 g007
Figure 8. Movement of the reattachment point with the Froude number.
Jmse 13 02215 g008
Figure 9. Bed shear stress leeward of the GMFP as a function of Froude number for two buoyancy values: (a) FB = 9.8 N/m; (b) FB = 14.7 N/m.
Jmse 13 02215 g009
Figure 10. Water surface profile over the GMFP as a function of Froude number for two buoyancy values: (a) FB = 9.8 N/m; (b) FB = 14.7 N/m.
Jmse 13 02215 g010
Figure 11. Difference in total and hydrostatic pressure across the GMFP [24].
Jmse 13 02215 g011
Table 1. Key simulation parameters for the cases.
Caseu0 (m/s)Frsin αFB (N/m)
010.1000.0510.9859.8
020.1500.0760.9669.8
030.1800.0910.9409.8
040.2600.1260.8669.8
050.3500.1770.7669.8
060.4200.2120.6439.8
070.4700.2370.5749.8
110.1100.0560.98514.7
120.1600.0810.96614.7
130.2100.1060.94014.7
140.2600.1260.90614.7
150.3000.1520.86614.7
160.3750.1890.81914.7
170.4800.2420.64314.7
180.5400.2730.57414.7
Table 2. Effects of mesh density and initial time step on the results.
Model NumberMinimum Grid Size (m)Total Grid NumberInitial Time Step (s)x0/Hp
Coarse mesh4.5 × 10−34.7 × 1040.0018.59
Medium mesh3.0 × 10−38.4 × 1049.05
Fine mesh 11.5 × 10−31.4 × 1059.70
Fine mesh 21.0 × 10−32.1 × 1059.42
Initial time step 11.5 × 10−31.4 × 1050.0029.65
Initial time step 20.0019.70
Initial time step 30.000759.71
Initial time step 40.00059.70
Disclaimer/Publisher’s Note: The statements, opinions and data contained in all publications are solely those of the individual author(s) and contributor(s) and not of MDPI and/or the editor(s). MDPI and/or the editor(s) disclaim responsibility for any injury to people or property resulting from any ideas, methods, instructions or products referred to in the content.