Article

Cyclostratigraphic Analysis and Depositional Environment Evolution of the Third Member of Eocene Shahejie Formation in the Laizhou Bay Sag, Southern Bohai Bay

1
CNOOC Research Institute Co., Ltd., Beijing 100028, China
2
State Key Laboratory of Offshore Oil and Gas Exploitation, Beijing 100028, China
3
School of GeoSciences, Yangtze University, Wuhan 430100, China
*
Authors to whom correspondence should be addressed.
J. Mar. Sci. Eng. 2025, 13(11), 2208; https://doi.org/10.3390/jmse13112208
Submission received: 13 October 2025 / Revised: 14 November 2025 / Accepted: 17 November 2025 / Published: 20 November 2025
(This article belongs to the Section Geological Oceanography)

Abstract

This study conducts a cyclostratigraphic analysis of the third member of the Eocene Shahejie Formation (Es3) in the Laizhou Bay Sag, Bohai Bay Basin, to investigate the influences of astronomically driven climate variations on sea-level changes, sedimentation rates, and depositional environments. We integrated high-resolution geophysical well logs, ostracod fossils, and palynological data from Well B-2 for cyclostratigraphic and paleoclimate analyses. Time series analysis identified orbital cyclicity in the natural gamma-ray (GR) log, with its significance confirmed by correlation coefficients and statistical significance tests. By tuning the GR log to the 405 kyr eccentricity cycle, we constructed a ~7.695 Myr floating astronomical timescale. Integrating the preliminary biostratigraphic framework (based on ostracods and palynology) with the La2010d astronomical solution yielded a high-resolution absolute astronomical timescale for the 1317–2594 m interval of Well B-2, spanning from 33.9 to 41.6 Ma. Sedimentary noise modeling reconstructed the Eocene sea-level curve in the study area, revealing that the 1.2 Myr obliquity modulation cycle was a key driver of sea-level fluctuations. The δ13C and δ18O records confirm the presence of the Middle Eocene Climatic Optimum (MECO), indicating that its stratigraphic signature constitutes a robust marker for regional stratigraphic subdivision in the southern Bohai Bay Basin. Our findings provide new insights into the climatic evolution of the Es3 member in the southern Bohai Bay Basin.

1. Introduction

The Bohai Bay Basin, located on the eastern continental margin of China, is a large Cenozoic rift basin developed on the North China Platform, bounded by the Jiaoliao Uplift to the east, the Taihang Uplift to the west, the Luxi Uplift to the south, and the Yanshan Fold Belt to the north [1,2]. The basin comprises three major geographic units: the Bohai Sea, the North China Plain, and the Lower Liaohe Plain [3,4,5,6,7,8]. A stable Upper Proterozoic–Paleozoic basement underlies the basin, which is filled with Mesozoic–Cenozoic intracontinental rift deposits [9,10,11,12,13,14,15]. As one of the most productive petroleum basins in eastern China, the Bohai Bay Basin holds significant geological and research value [4,5]. The Laizhou Bay Sag in southern Bohai is dominated by deltaic deposits that offer favorable reservoir space [4,16]. The Shahejie Formation serves as one of the principal reservoirs in the region. During the deposition of its third member, the Laizhou Bay Sag was a stable faulted depression, with the fault-controlled lake basin reaching its maximum extent and accumulating thick strata [2]. However, its complex structural setting and prolonged depositional history complicate cyclostratigraphic and paleoenvironmental analyses of the third member. Consequently, the debated chronological framework limits a deeper understanding of sedimentary evolution and hydrocarbon accumulation in southern Bohai.
The southern Laizhou Bay Sag has been strongly influenced by the Tan–Lu strike-slip fault zone and salt tectonics, leading to pronounced deformation and substantial erosion [2]. Frequent depocenter migration during the initial rifting stage caused marked stratigraphic variations among the three structural units, complicating regional stratigraphic correlation. As a result, cyclostratigraphic studies in this area remain scarce. Previous tectonic evolution studies suggest that a complete Paleogene Eocene stratigraphic succession is preserved in the southern Laizhou Bay Sag. The third member of the Shahejie Formation (Es3) was deposited during the early Eocene. Drilling data from more than 20 wells in the Laizhou Bay Sag show that the upper part of the Es3 member consists of interbedded sandstone and mudstone, locally displaying angular unconformities [17,18]. The middle part is dominated by thick, widespread dark mudstones, which serve as a regionally recognizable marker layer. Biostratigraphic analyses reveal abundant ostracod fossils in the Es3 member, dominated by the genera Huabeinia, Candona, and Camarocypris. Charophyte fossils, such as Shandongochara and Linyiechara, are relatively rare. The palynological assemblage is dominated by Pinus–Quercus–Ephedra [19,20].
The astronomical cycle theory, also known as the Milankovitch cycle, interprets the periodic variations in Earth’s orbital parameters—eccentricity, obliquity, and precession—as the primary drivers of changes in solar insolation received at Earth’s surface. These orbital fluctuations regulate climatic conditions such as precipitation and monsoon intensity, which in turn generate cyclic variations in sedimentary characteristics recorded in stratigraphic successions [21,22,23]. Cyclostratigraphy examines stratigraphic cycles controlled by astronomical periodicities, providing continuous astronomical timescales. Eccentricity cycles, unaffected by Earth–Moon distance, include the stable and distinct 405 kyr long-eccentricity cycle, which arises from gravitational interactions between Venus and Jupiter [24,25,26,27]. This 405 kyr cycle is the most stable orbital parameter and is regarded as the astronomical “metronome” for geological time calibration [27,28,29,30]. Previous studies suggest that fourth-order sequences are paced by the 405 kyr long-eccentricity cycle, whereas fifth-order sequences are controlled by the ~100 kyr short-eccentricity cycle. Higher-resolution sequences are further controlled by obliquity and precession cycles. Astrochronology and cyclostratigraphy have been widely applied in the Bohai Bay Basin [31,32,33,34,35]. For example, Yao et al. (2002) [36] applied electron spin resonance (ESR) dating to quartz from the Paleogene Kongdian and Dongying formations in the Dongying Sag, constraining the ages of key intervals within the Shahejie Formation. Xu (2011) [37] performed systematic high-frequency cyclostratigraphic analyses of the middle Es3 in well Niu-38 and the lower Es3 and upper Es4 in well Haoke-1. Using the base of the middle Es3 (38.975 Ma) as an anchor point, Xu recalibrated the basal boundary age of the Shahejie Formation. Liu et al. (2018) [38] established an astronomical timescale for the Paleogene strata of the Bohai Bay Basin, refining the boundary ages of the Es3 and Es4. Shi et al. (2019) [39] analyzed Milankovitch cyclicity in well Fanye-1, Dongying Sag, and determined key boundary ages: top of the lower Es3 at 39.23 Ma, base at 41.38 Ma, and base of the upper Es4 at 43.27 Ma.
These studies have improved our understanding of the tectonic evolution and climate history of the Bohai Bay Basin [40,41,42,43]. Moreover, they highlight the broad applicability and scientific value of cyclostratigraphy and astrochronology for analyzing complex sedimentary systems. However, the accuracy of astrochronological studies strongly depends on the selection of proxy indicators in time-series analysis. Reliable astrochronological results require proxies that faithfully record astronomical forcing signals. Therefore, careful selection of appropriate proxies is critical to ensuring the accuracy of astrochronological studies.
Gamma-ray (GR) logging data from well B-2 in the southern Laizhou Bay Sag were selected for cyclostratigraphic analysis. A biostratigraphic age framework for the third member of the Shahejie Formation (Es3) was constructed using integrated palynological and ostracod fossil evidence from the study area. Time-series analysis was applied to develop a high-resolution floating astronomical timescale for the Shahejie Formation. This floating timescale was integrated with theoretical astronomical solutions and the biostratigraphic framework to construct a high-precision astronomical timescale. Additionally, a sedimentary noise model was used to reconstruct the sea-level change curve during the deposition of the Es3 member. This approach enabled further investigation of astronomical forcing on sea-level fluctuations during this period. This study aims to refine the chronostratigraphic framework of the Es3 member, providing robust evidence to support future hydrocarbon exploration and paleoclimate research in the Laizhou Bay Sag.

2. Regional Geological Features

The Laizhou Bay Sag, located in the southern Bohai Sea and eastern Jiyang Depression, covers an area of approximately 1780 km2. It is a rhomboid-shaped sag situated within the Tan–Lu fault zone in the southeastern Bohai Bay Basin [2,40]. Developed upon a Mesozoic basement, it represents a typical half-graben structure characterized by fault-controlled subsidence in the north and onlap sedimentation in the south. It is bounded by the Ludong uplift to the east, the Kendong uplift to the west, the Laibei No.1 fault and the Laibei low uplift to the north, and connects with the Weibei uplift to the south.
The present study area, covering approximately 920 km2, is situated in the southern Laizhou Bay Sag. It comprises three structural units: the Laidong strike-slip zone, the southern Laizhou Bay sub-sag, and the central uplift belt (Figure 1A). The Laidong strike-slip structural zone defines the eastern boundary of the sag. The central uplift belt, situated between the northern and southern sub-sags, consists of the central low uplift and a rollover anticline belt along its northern slope. The southern sub-sag exhibits a typical half-graben geometry characterized by fault-controlled subsidence in the north and sedimentary onlap towards the south.
During the Paleogene, the southern Laizhou Bay Sag entered a fault-controlled subsidence phase, exhibiting prominent regional depression features. In the southern Bohai Sea area, the sedimentary period of the Es3 Member was characterized by combined dextral strike-slip movement and intense horizontal extension, leading to vigorous rifting activity. In the southern Bohai Sea area, the sedimentary period of the Es3 member was characterized by combined dextral strike-slip movement and intense horizontal extension, leading to vigorous rifting activity [44,45,46]. At the end of Es3 deposition, the Laizhou Bay Sag underwent tectonic uplift and inversion, resulting in erosion of the uppermost Es3 strata. Locally, this erosional event is evidenced by angular unconformities.
Based on drilling, seismic, and testing data (Figure 1B), the stratigraphic succession in the southern Laizhou Bay area comprises the Kongdian, Shahejie, Dongying, Guantao, Minghuazhen, and Quaternary Pingyuan formations [2,4,33,34]. The Eocene Shahejie Formation is subdivided into two members: the lower member is characterized by coarse clastic rocks interbedded with gray salt rocks and gypsum, while the upper member consists primarily of thick dark mudstones intercalated with sandstones. An unconformity marks the top of the Es3 Member. Well-log lithologies indicate deposition in deep to semi-deep lacustrine environments transitioning into marginal-shallow lake deltaic settings, characterized by extensive dark mudstones and oil shales interspersed with minor sandstone. The upper intervals of interbedded sandstones and mudstones constitute favorable reservoir units. Well B-2 is located within the central depocenter of the study area, where sedimentary conditions remained relatively stable. Such stable sedimentary conditions during this period provide an ideal context for investigating the characteristics and periodicities of astronomical forcing preserved in the stratigraphic record. Consequently, this allows for establishing a robust link between sedimentary responses and controlling paleoclimatic factors.

3. Materials and Methods

3.1. Astronomical Orbital Parameters

Earth’s orbital parameters—eccentricity, obliquity, and precession—control long-term variations in solar insolation, which in turn influence sedimentary cyclicity recorded in stratigraphic successions [47,48,49,50,51,52,53,54,55].
The Eocene stratigraphic record clearly preserves the stable ~405 kyr long eccentricity cycle. Theoretical orbital periodicities and their relative contributions during the Eocene were calculated using the Milankovitch Calculator module in Acycle [56], based on the models of Berger [57,58,59,60,61,62,63,64,65]. and Laskar (2011) [66]. This study focuses on the ~405 kyr eccentricity signal as the primary target for astronomical cycle analysis. A Gaussian bandpass filter was applied to the untuned natural gamma-ray log to extract the ~405 kyr eccentricity cycle from the drilling profile and construct a high-resolution astronomical timescale [67,68,69]. The extracted astronomical periodicities were then compared with the theoretical Jurassic orbital solutions calculated by Laskar (2011) [66]. According to Laskar (2011) [66], the theoretical Eocene (33–42 Ma) orbital parameters include: very long eccentricity (~2.6 Ma), long obliquity (~1.3 Ma), long eccentricity (~405 kyr), short eccentricity (~100 kyr), obliquity (~40 kyr), and precession (~20 kyr156) (Figure 2).

3.2. Data Selection and Time Series Analysis

Natural gamma-ray logging (GR, in API units) measures the intensity of gamma radiation from the decay of radioactive elements in strata, typically concentrated in clay minerals. Climatic changes affect the concentration of these radioactive elements in clay minerals [70,71,72]. Numerous studies demonstrate that GR logs are effective proxies for paleoclimate reconstruction. GR logs offer accessibility, continuity, and high sensitivity to clay and organic matter variations, effectively capturing climate and paleoenvironmental changes [73,74]. Higher GR values generally indicate higher clay content, whereas lower values correspond to greater proportions of sandstone or limestone. Cold, arid climates tend to produce lower GR values, whereas warm, humid climates enhance clay and organic matter accumulation, leading to higher values [75,76]. Therefore, GR logs effectively record cyclic climate variations during sedimentation. In this study, high-resolution cyclostratigraphic analysis was performed on GR data from well B-2 in the southern Laizhou Bay Sag. The analyzed interval spans 1317–2594 m, with a sampling resolution of 0.1 m.
This study employs ostracod fossil assemblages and palynological data for biostratigraphic dating and paleoclimate reconstruction. Ostracod-based age determinations follow the frameworks of Berggren (1995) [77], Speijer et al. (2020) [78], the Geological Time Scale 2020 (GTS2020), and the regional ostracod zonation for the Bohai area proposed by Liu et al. (2018) [38]. In parallel, variations in palynological assemblages were analyzed to reconstruct paleoclimate conditions. On this basis, total organic carbon (TOC) content and selected geochemical element ratios were examined to validate the inferred paleoclimate and sea-level fluctuations during Es3 deposition in the Laizhou Bay Sag. However, we acknowledge that ostracods provide only broad temporal constraints due to limited global calibration potential. Therefore, the high-resolution chronologic framework of this study is primarily established through astronomical tuning of the GR series, with the fossil data serving as independent age control and validation.
Time-series analysis uses paleoclimate proxies to extract sequential records of environmental and climatic variations preserved in stratigraphic successions [32,33,34,39,79]. The workflow of cyclostratigraphic time-series analysis includes preprocessing, spectral analysis, filtering, tuning, and astronomical timescale (ATS) construction. Acycle integrates these functions into a single platform, making it an effective tool for astronomical cycle analysis [7,80]. In this study, the “Locally Weighted Regression” (Lowess) function in Acycle v2.8 was used to remove 35% of the long-term trend from the GR log data. The detrended GR data were analyzed using the multitaper method (MTM) and FFT-based evolutionary spectral analysis to identify the ~405 kyr eccentricity signal and extract a high-resolution power spectrum. A uniform window length of 1.5π was applied in all spectral analyses. Spectral peaks were statistically evaluated, and the correlation coefficient (COCO) method was used to assess the correlation between the astronomical signal spectrum and the paleoclimate proxy spectrum by testing different sedimentation rates [12,13,67]. The highest COCO peak likely represents the optimal sedimentation rate. The evolutionary correlation coefficient method (eCOCO), using a sliding window approach, was applied to track sedimentation rate variations over time [14,15]. The optimal sedimentation rate determined by COCO was used to validate the cyclostratigraphic interpretation and further assessed using the accumulation rate derived from eCOCO. The Berger89 [81] orbital solution served as the reference for COCO testing. A Gaussian bandpass filter was applied to extract the ~405 kyr eccentricity signal. The depth-domain paleoclimate proxy data were transformed into the time domain for orbital tuning, enabling construction of a high-resolution astronomical timescale.
Sea-level reconstruction is a key aspect of cyclostratigraphy, essential for understanding how climate change drives global sea-level fluctuations [41,82,83]. Orbital forcing is recognized as a primary mechanism regulating Earth’s climate system [46]. In reconstructions based on the Sedimentary Noise Model, the orbitally tuned Dynamic Noise after Orbital Tuning (DYNOT) method enables precise identification and analysis of sea-level change trends.

4. Results

4.1. Biostratigraphic Framework

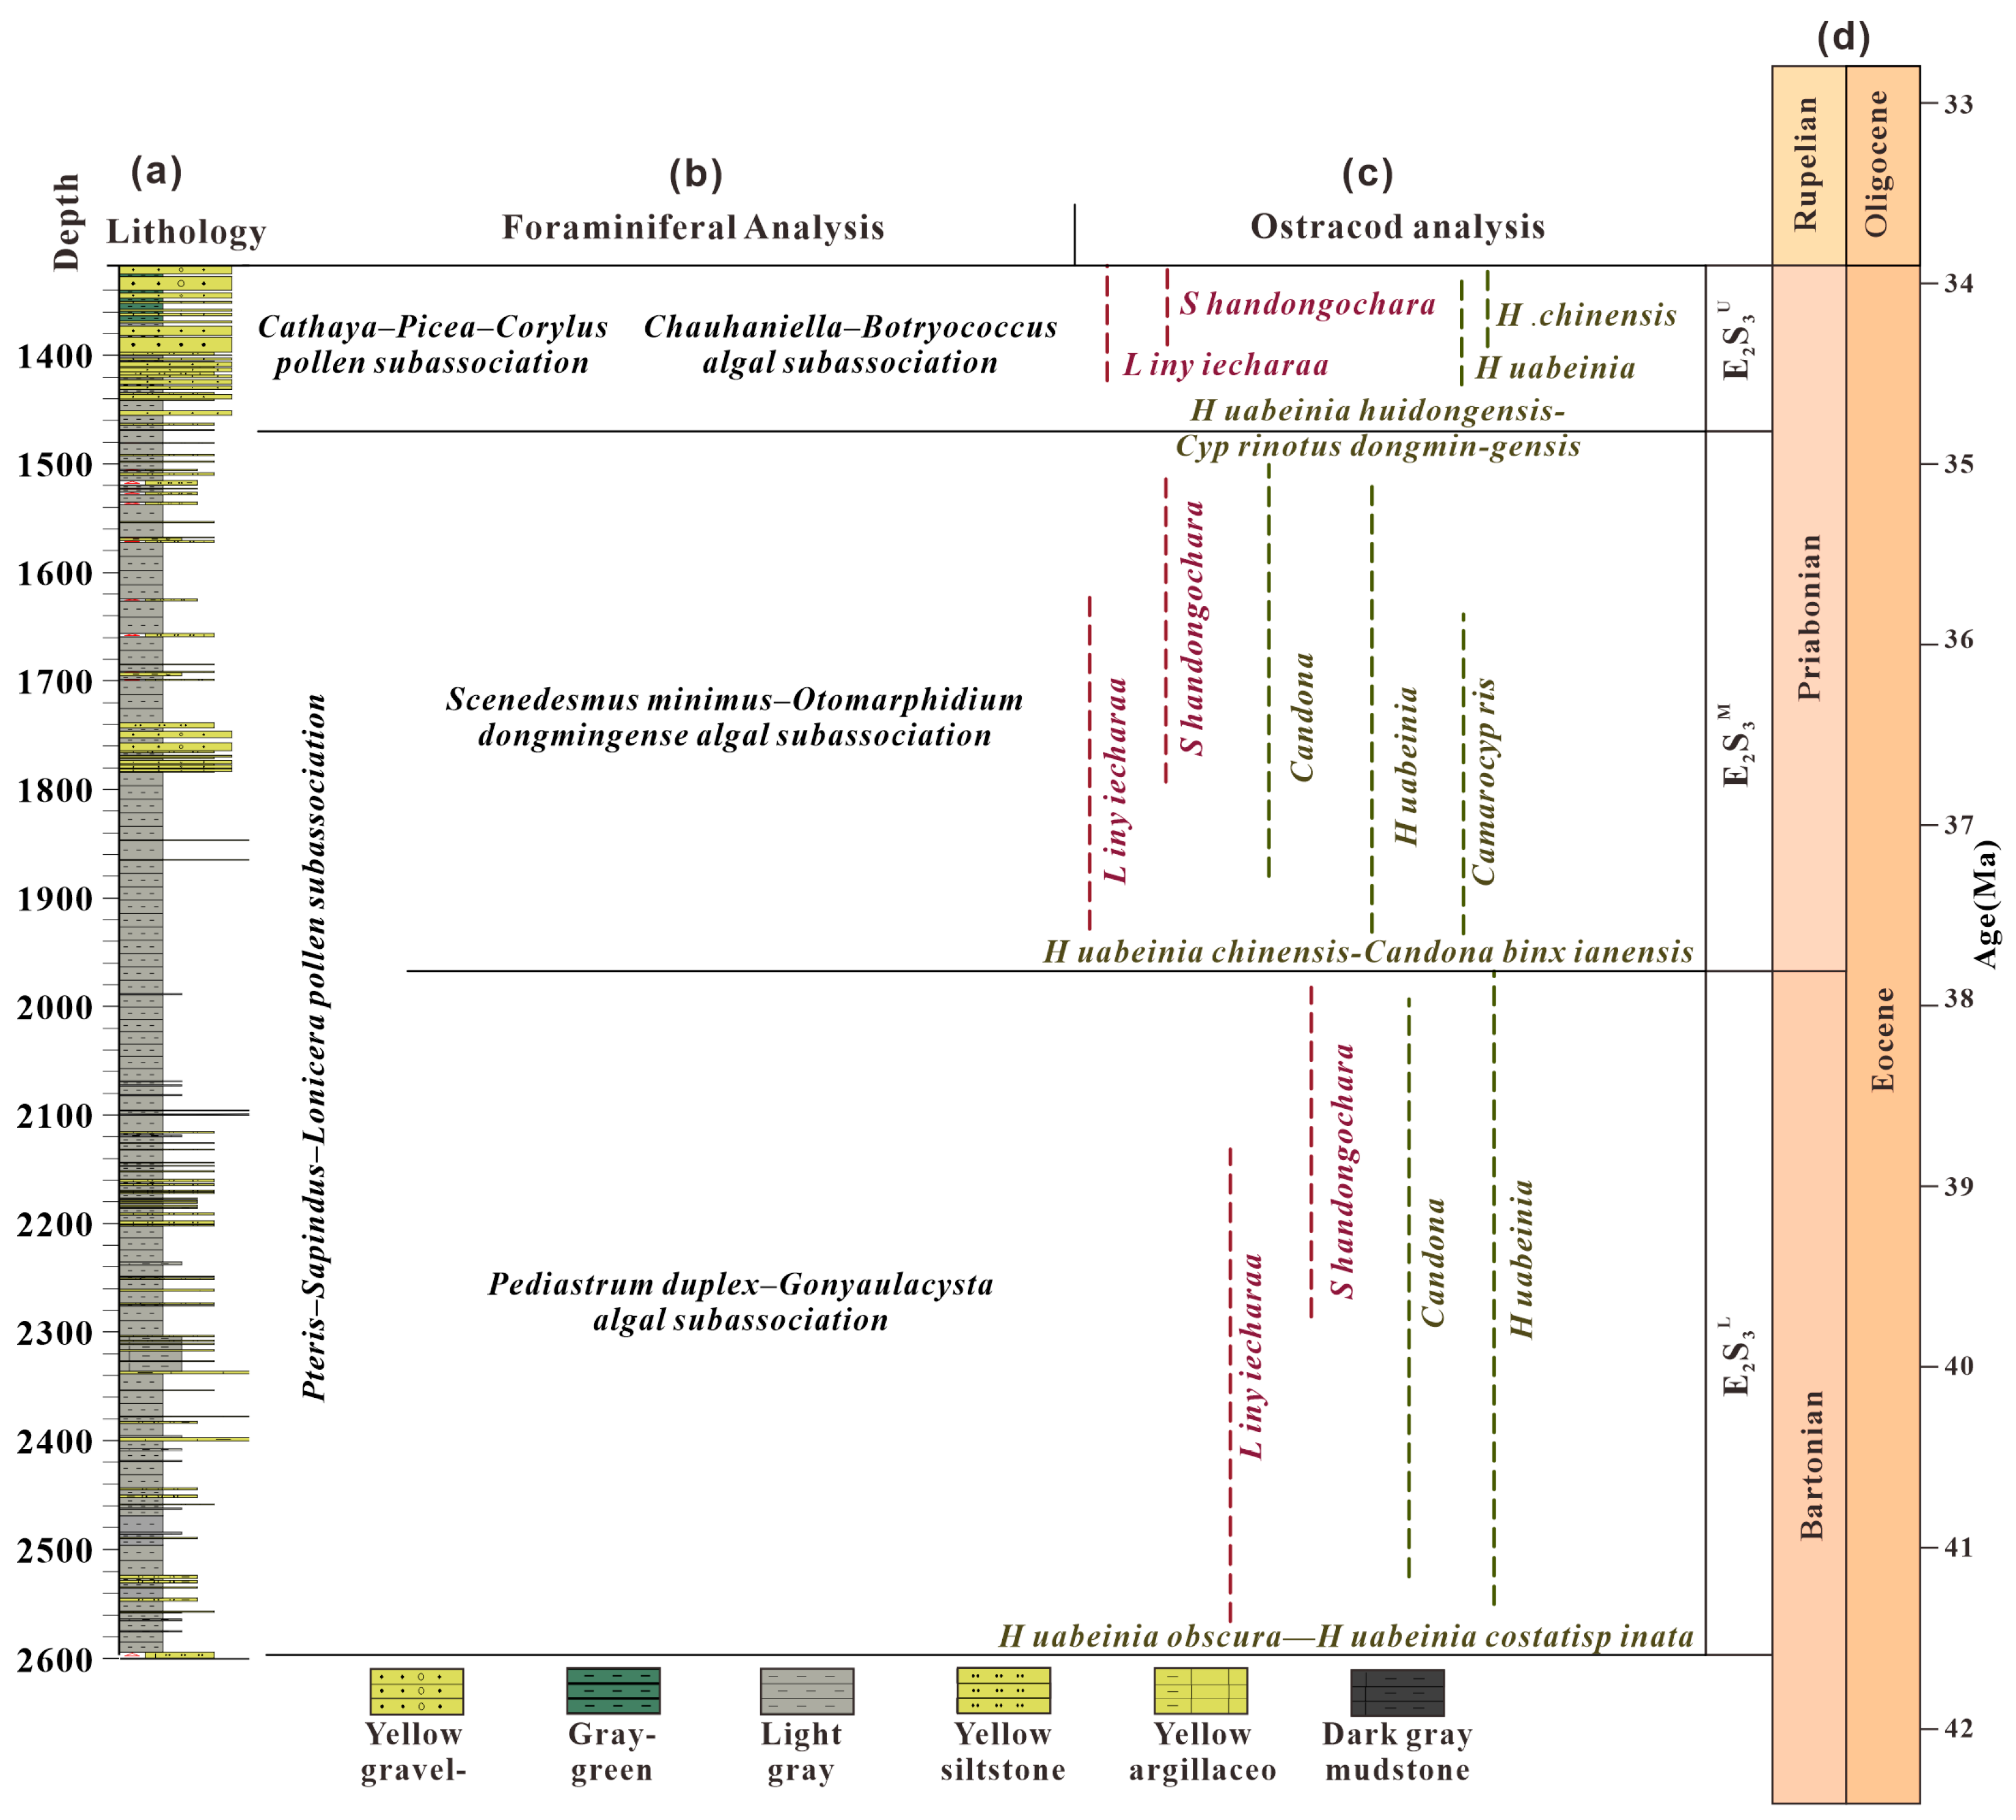
Fossil samples from the southern Laizhou Bay Sag (33–42 Ma) reveal abundant ostracod and charophyte assemblages (Figure 3c).
The Es3 Member is characterized by widespread Huabeinia and abundant Candona, notable for both species diversity and individual abundance. Other genera, including Ilyocyprimorpha, Eucypris, Virgatocypris, Pseudocypris, Cyprois, and Cyprinotus, occur occasionally in low abundance. The lower Es3 Member is dominated by lacustrine deposits, with ostracod assemblages composed mainly of Huabeinia and Candona, and minor occurrences of Cyprois, Eucypris, Ilyocyprimorpha, Candoniella, Limnocythere, and Cyprinotus. This assemblage is classified as the Huabeinia obscura–Hcostatispinata subassemblage, equivalent to the H. obscura subassemblage in the coastal Bohai Basin. Both share early North China ostracod fauna elements, including H. obscura, Candona distensa, Cadulta, and Hprimitiva. In the middle Es3 Member, Huabeinia, Candona, and Camarocypris dominate, with representative species such as H. chinensis, H. trapezoidea, H. yonganensis, and H. unispinata. This assemblage is defined as the H. chinensisCandona binxianensis subassemblage, equivalent to the “spined North China ostracod” assemblage in the coastal Bohai Basin. A key feature is the dominance of H. chinensis, with H. obscura and H. primitiva absent. The upper Es3 Member contains abundant ostracods, including H. chinensis, H. huidongensis, Candona distensa, C. aequalis, and C. wangxuzhuangensis. This assemblage is identified as the H. huidongensis–Cyprinotus dongmingensis subassemblage, equivalent to the H. huidongensis assemblage in the Bohai coastal Basin. Both are characterized by dominant H. huidongensis and common H. chinensis. Charophytes in the Es3 Member are dominated by Shandongochara and Linyiechara.
A total of 45 palynological samples were analyzed from depths of 1300 m to 2600 m in the southern Laizhou Bay Sag. The results indicate consistent palynological assemblages throughout the interval (Figure 3b). Based on compositional changes, two primary subassemblages were identified: the PterisSapindusLonicera subassemblage and the CycadopitesPinusJuglanspollis subassemblage. The early interval is characterized by relatively high percentages of Ephedripites (12.73%) and Pteris (4.68%), while the late interval exhibits a significant increase in Quercus pollen (24.6%) and a notable rise in tricolpate pollen types. These features are consistent with observations from the Shahejie Formation in the western Liaoxi Sag, where a decline in Ephedripites and coniferous pollen is accompanied by an increase in thermophilic and hygrophilous taxa such as Myrtaceidites, Sapindus, and Ilex. Moreover, the proportions of angiosperm pollen (56.2%), gymnosperm pollen (30.3%), and fern spores (13.5%) in these assemblages align well with those reported from the same stratigraphic interval in the Tanhai area of the Huanghua Depression [41,42]. Overall, the palynological data suggest a warm and humid paleoclimate during the deposition of the Es3 member, consistent with lithological characteristics and core color observations from the same interval.
In summary, biostratigraphic analysis reveals that the Es3 member is characterized by the abundant occurrence of Huabeinia and Candona, which serves as a reliable marker for identifying the lower boundary of the Es3 member. The coexistence of large-sized Candona specimens with the North China ostracod assemblage is a distinctive biostratigraphic feature of the Es3 interval. Charophyte fossils, such as Shandongochara, are generally restricted to the Es3 member and may serve as biostratigraphic indicators for the boundary between the Es3 and Es4 members. Palynological assemblages reflect a climatic transition within the Es3 member—from arid conditions in the early stage to warm and humid conditions in the later stage—suggesting that deposition likely occurred in a semi-deep to marginal-shallow lacustrine environment.

4.2. Time Series Analysis

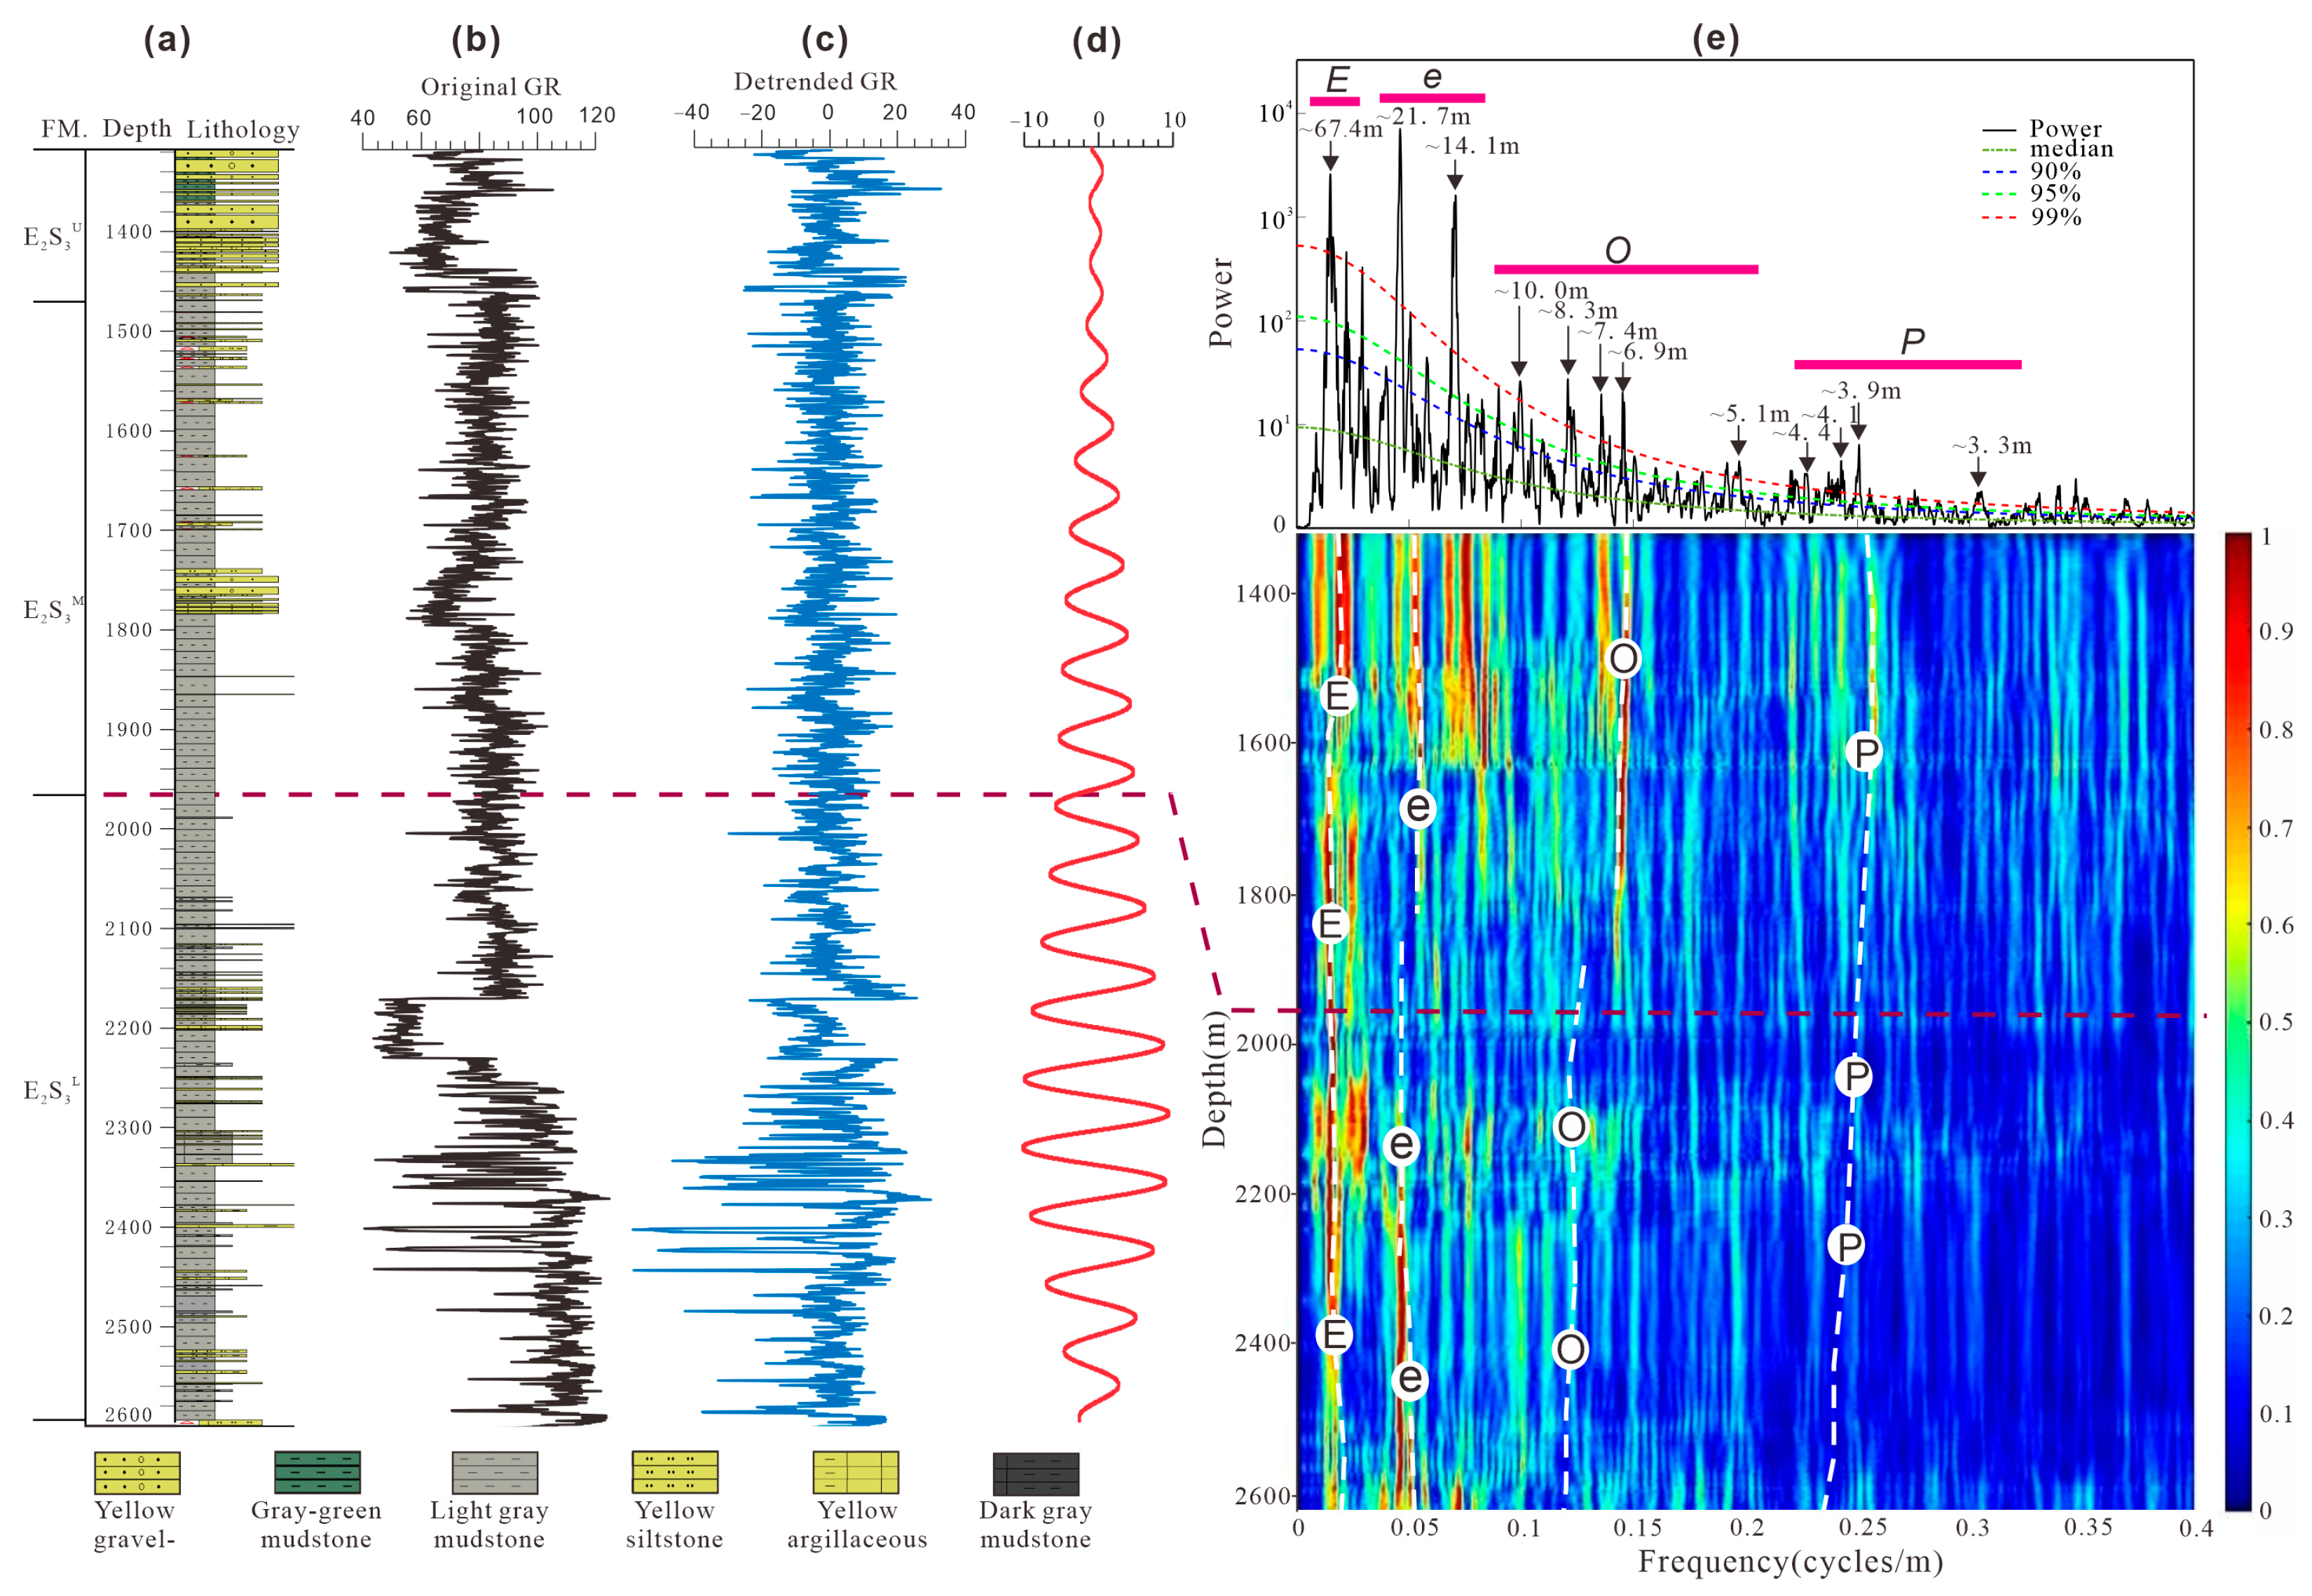
After detrending the GR logging data from well B-2 (1317–2594 m), multitaper method (MTM) spectral analysis and evolutionary fast Fourier transform (eFFT) spectral analysis were performed (Figure 4). The results reveal spectral peaks with confidence levels exceeding 99% at wavelengths of approximately 67.5 m, 21.7 m, 14.1 m, 10.0 m, 8.3 m, 7.4 m, 6.9 m, 5.1 m, 4.4 m, 4.1 m, 3.9 m, and 3.3 m. The ratios of 67.5 m: 21.7–14.1 m: 10.0–5.1 m: 4.4–3.3 m closely approximate the theoretical Milankovitch cycle ratio of 405 kyr (long eccentricity): 125 kyr (short eccentricity): 40 kyr (obliquity): 22 kyr (precession), or roughly 20:5:2:1. These ratios are consistent with those of the latest theoretical astronomical solution for orbital parameters proposed by Laskar et al. (2011) [66]. Accordingly, the ~67.5 m cycle is preliminarily interpreted as corresponding to the 405 kyr long eccentricity cycle, the ~21.7 m cycle to the 125 kyr short eccentricity cycle, and the ~10 m cycle to the ~39 kyr obliquity cycle.
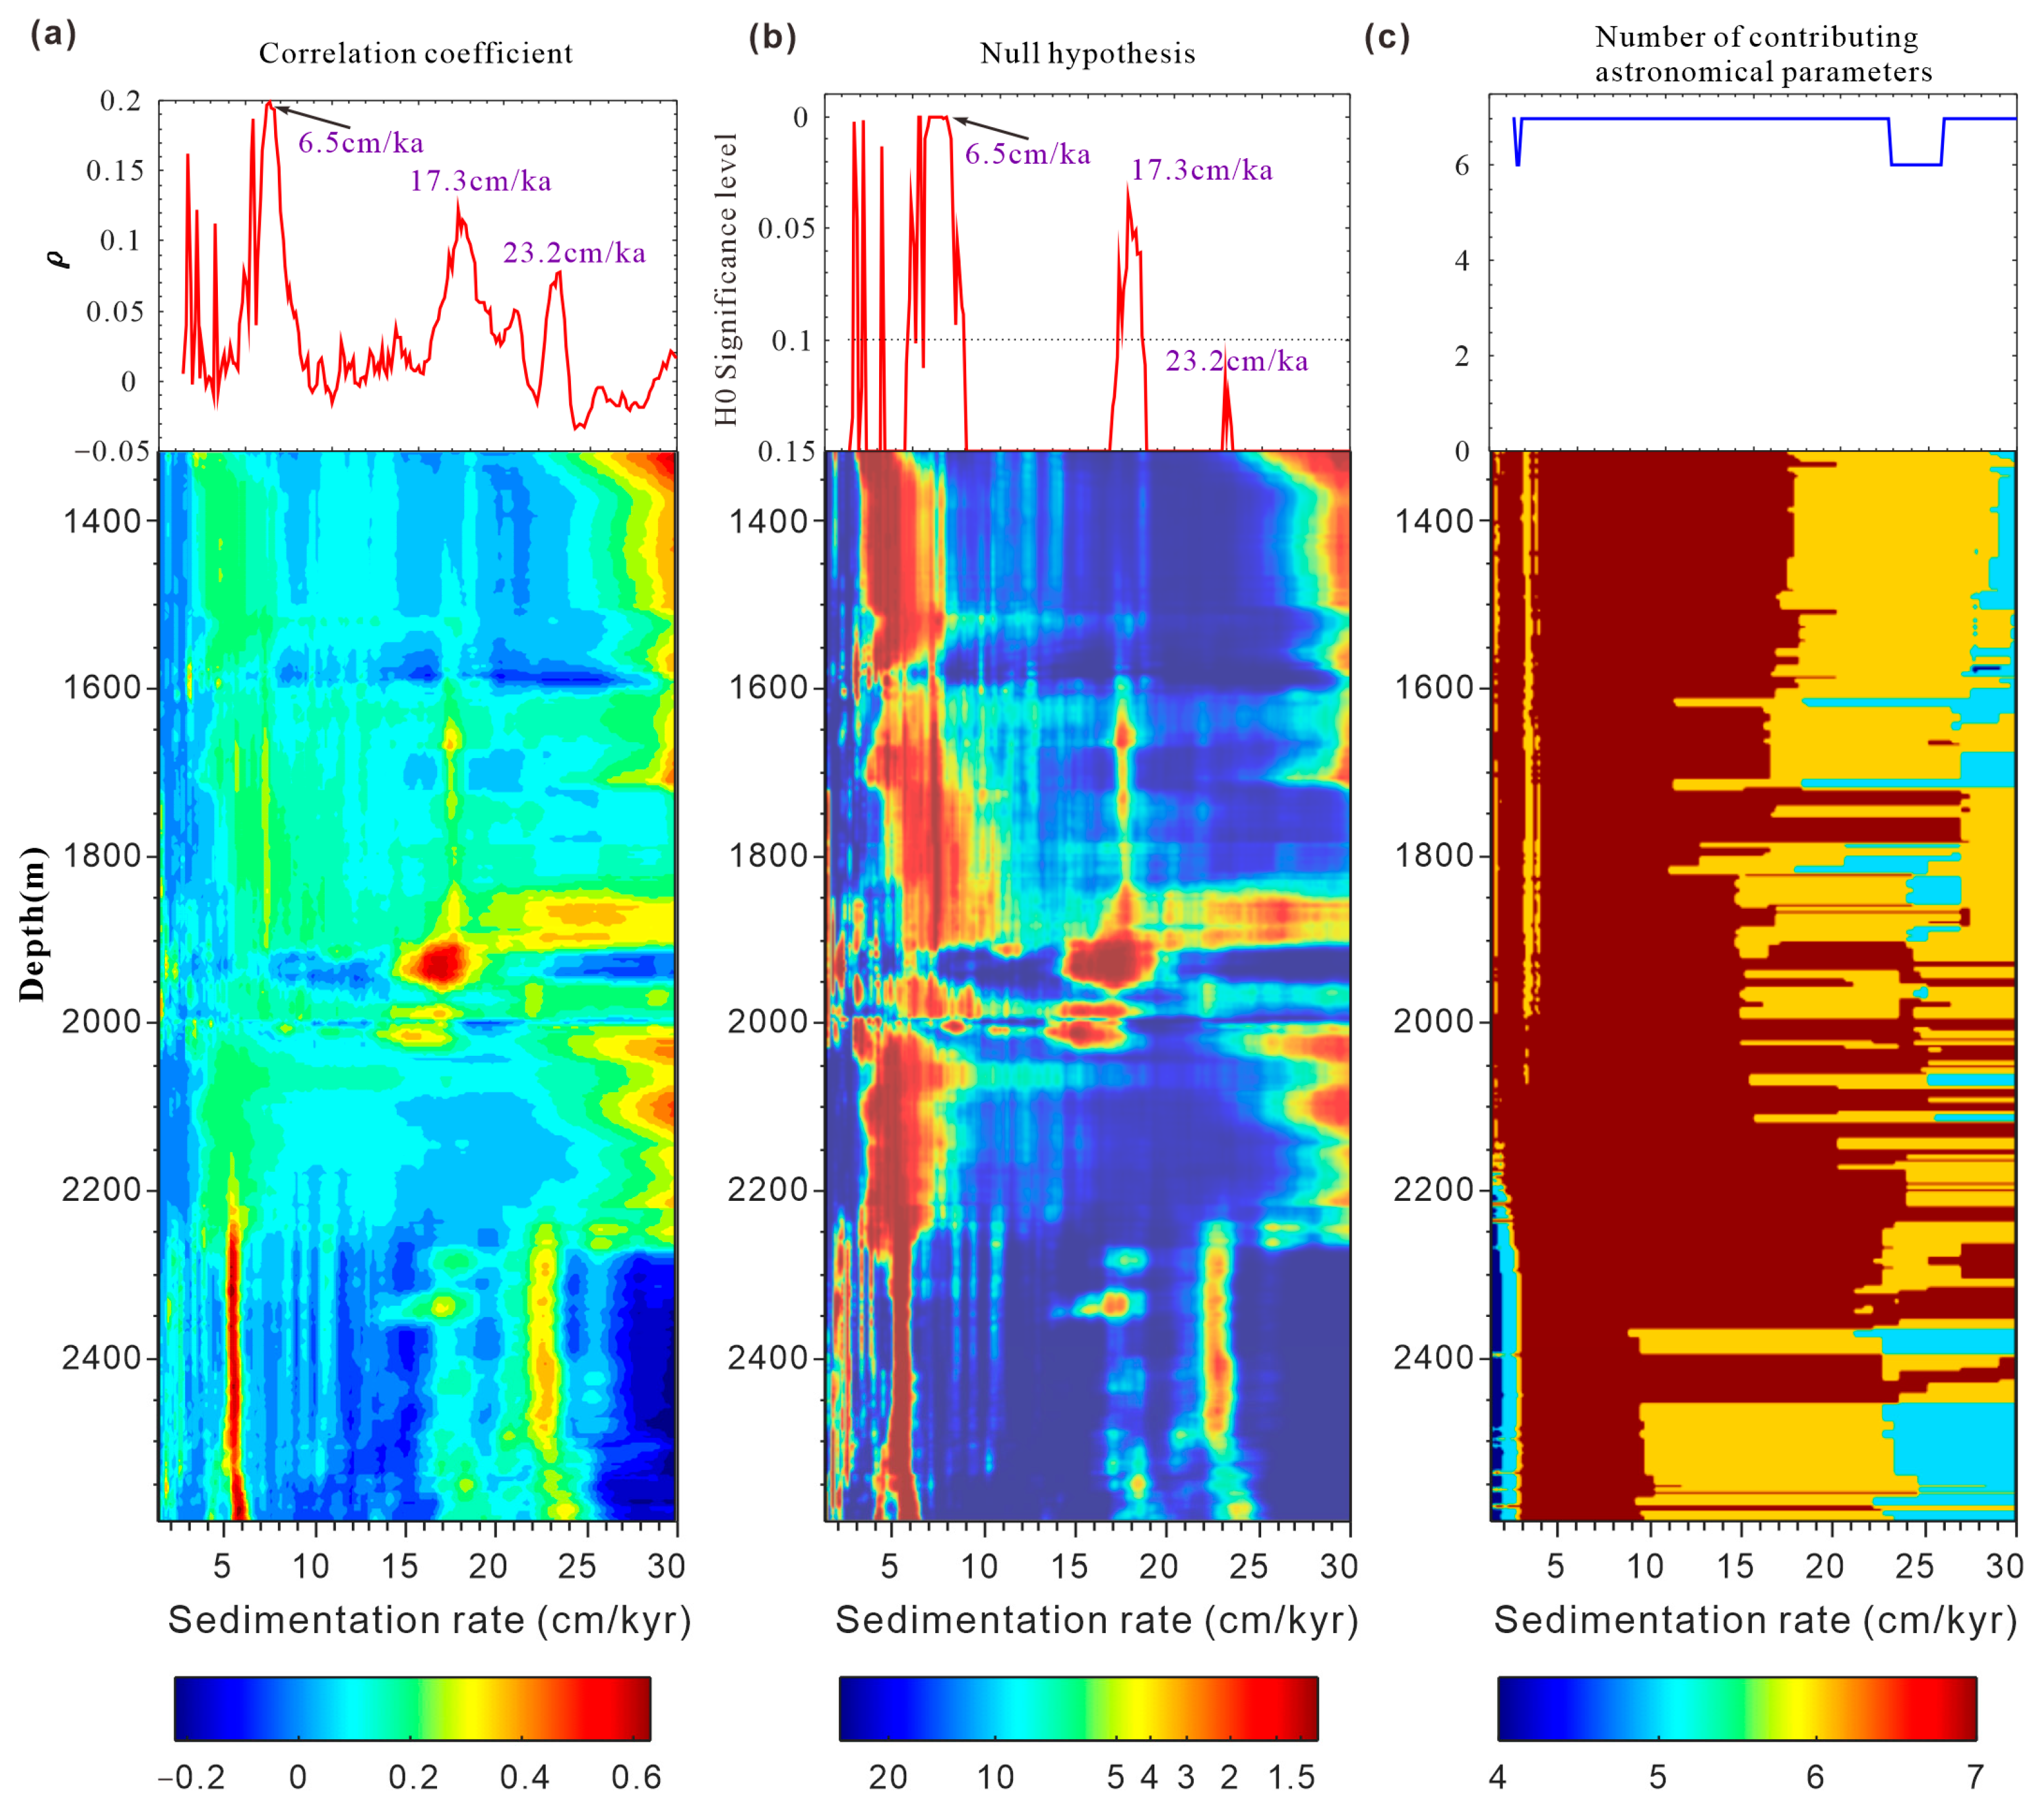
To further investigate, correlation coefficient analysis (COCO/eCOCO) was applied to the GR data. A total of 5000 Monte Carlo simulations were conducted over a sedimentation rate range of 1–30 cm/ka. The results reveal two prominent peaks in sedimentation rate at 3.5~6.5 cm/ka and 17.3 cm/ka (Figure 5a,b), both exceeding the H0 significance threshold of 0.05%. The optimal sedimentation rate was determined based on the number of orbital cycle matches and the maximum correlation coefficient. The eCOCO analysis reveals that the estimated evolutionary sedimentation rate closely aligns with the COCO-derived optimal value, and exhibits the highest correlation within that range. This supports the reliability of using astronomical cycle ratio matching to determine sedimentation rates. However, the correlation coefficient for the 17.3 cm/ka rate is lower than that for 3.5~6.5 cm/ka (Figure 5c), indicating a relatively poor match. Therefore, it is not considered the optimal sedimentation rate.
A ~67.4 m cycle thickness was used to filter the data, and tuning to the 405 kyr eccentricity cycle was applied to establish an astronomical age model. The depth-domain data series was then converted into a time-domain series through orbital tuning (Figure 6c). This resulted in a gamma-ray (GR) time series tuned to the 405 kyr eccentricity cycle. Subsequent spectral analysis of the tuned series (Figure 6a) clearly identified orbital signals corresponding to the 405 kyr, 125 kyr, 40 kyr, and 22 kyr cycles. Sedimentary cycles representing the 405 kyr long eccentricity and 125 kyr short eccentricity were extracted from each segment using bandpass filtering (Figure 6c; red curve represents 405 kyr, green curve represents 125 kyr). In addition, wavelet power spectral analysis was conducted on the tuned data. Given the variation in sedimentation rates and the large dataset, the sequence was divided into two segments at the base of the middle Es3 Member for separate wavelet transformation, based on correlation coefficient results. The results demonstrate strong astronomical forcing signals in well B-2, further confirming the reliability of the orbital signals embedded in the sequence (Figure 6d,e).
Based on this analysis, the floating astronomical age span of the Es3 member interval (1317–2594 m) in well B-2 is approximately 7.695 ± 0.2 Ma.

4.3. Astronomical Chronology Analysis

Based on ostracod and palynological fossil evidence, the Es3 member in well B-2 is chronologically constrained to the early Bartonian through Priabonian stages [84]. The top of the Es3 member corresponds to the Eocene–Oligocene boundary. According to the International Chronostratigraphic Chart (GTS2020), the absolute age of the top Eocene boundary at 1317 m in well B-2 is 33.9 Ma. Using this as a temporal anchor, an absolute astronomical time scale (ATS) was established for the Es3 member of the Shahejie Formation in the southern Laizhou Bay Sag (Figure 7). The base of the Es3 member was thereby constrained to an absolute age of 41.595 Ma.
According to the astronomical solution proposed by Laskar (2011) [66], the 405 kyr long eccentricity and the 125 kyr short eccentricity represent the dominant orbital cycles during the Eocene [85,86]. Moreover, the astronomical time series derived from the tuned GR data exhibits an evolutionary pattern that is broadly consistent with that of the untuned GR dataset. Specifically, the interval between approximately 33 and 42 Ma is primarily governed by the 405 kyr long eccentricity and the 125 kyr short eccentricity cycles. This indicates that the prominent orbital signals identified in well B-2 are stable and that the astronomical tuning process has not significantly altered the intrinsic astronomical characteristics of the dataset.
Based on the time-series results, we were surprised to find that the Priabonian stage contains approximately 9.5 cycles of the 405 kyr long eccentricity, indicating a duration of 3.85 ± 0.2 Ma. This is in complete agreement with the timescale provided by the International Chronostratigraphic Chart (GTS2020), thereby validating the accuracy of the astronomical tuning (Figure 7h). Furthermore, we compared our results with previous studies of the Shahejie Formation in the southern Bohai region. For example, Shi et al. (2019) [80] established a high-resolution astronomical timescale for members Es3 and Es4 using paleomagnetic boundary ages as initial time anchors. Their results indicate that the top boundary of the Es3 member is dated at 34.53 Ma, the base of the upper Es3 at 35.69 Ma, the base of the middle Es3 at 39.44 Ma, and the base of the lower Es3 at 41.38 Ma. In the present study, the duration of the Es3 member is estimated at 7.695 Ma. This value closely matches the astronomical timescale proposed by Liu et al. (2018) [38] for the Dongying Sag. This similarity suggests that adjacent sags may share comparable sedimentary characteristics, which likely accounts for the minimal discrepancy between results and further supports the reliability of the astronomical timescale established for the southern Laizhou Bay Sag.

4.4. Sedimentary Noise Models and Astronomical Forcing

A sedimentary noise model was applied to the tuned GR curve to reconstruct the paleo-sea level variation in the Es3 member in the southern Laizhou Bay Sag. The DYNOT and ρ1 models have been demonstrated to be objective and effective tools for reconstructing paleo-sea level or paleolake level fluctuations [87]. In this study, both the DYNOT and ρ1 models were employed. The results indicate that the Es3 member in well B-2 experienced approximately seven transgressive–regressive (sea-level rise and fall) cycles during its deposition.
Figure 7. Astronomical time-scale analysis of the Es3 member in well B-2. (a) Lithostratigraphy and lithology (legend as in Figure 4). (b) GR data series detrended using a LOESS filter to remove a 440 m trend. (c) Gaussian bandpass-filtered cyclic series (filter centered at ~67.4 m; bandwidth = 0.0134–0.0158). (d) Gaussian bandpass-filtered curve of the 125 kyr component from the 405 kyr-tuned GR time series. (e) Gaussian bandpass-filtered curve of the 405 kyr component from the 405 kyr-tuned GR time series. (f) Gaussian bandpass-filtered 405 kyr ETP curve from the Laskar (2004) [88] astronomical solution (33–42 Ma). (g) Eccentricity curve (33–42 Ma) from the Laskar (2004) [88] astronomical solution. (h) International Chronostratigraphic Chart for 33–42 Ma.
Jmse 13 02208 g007
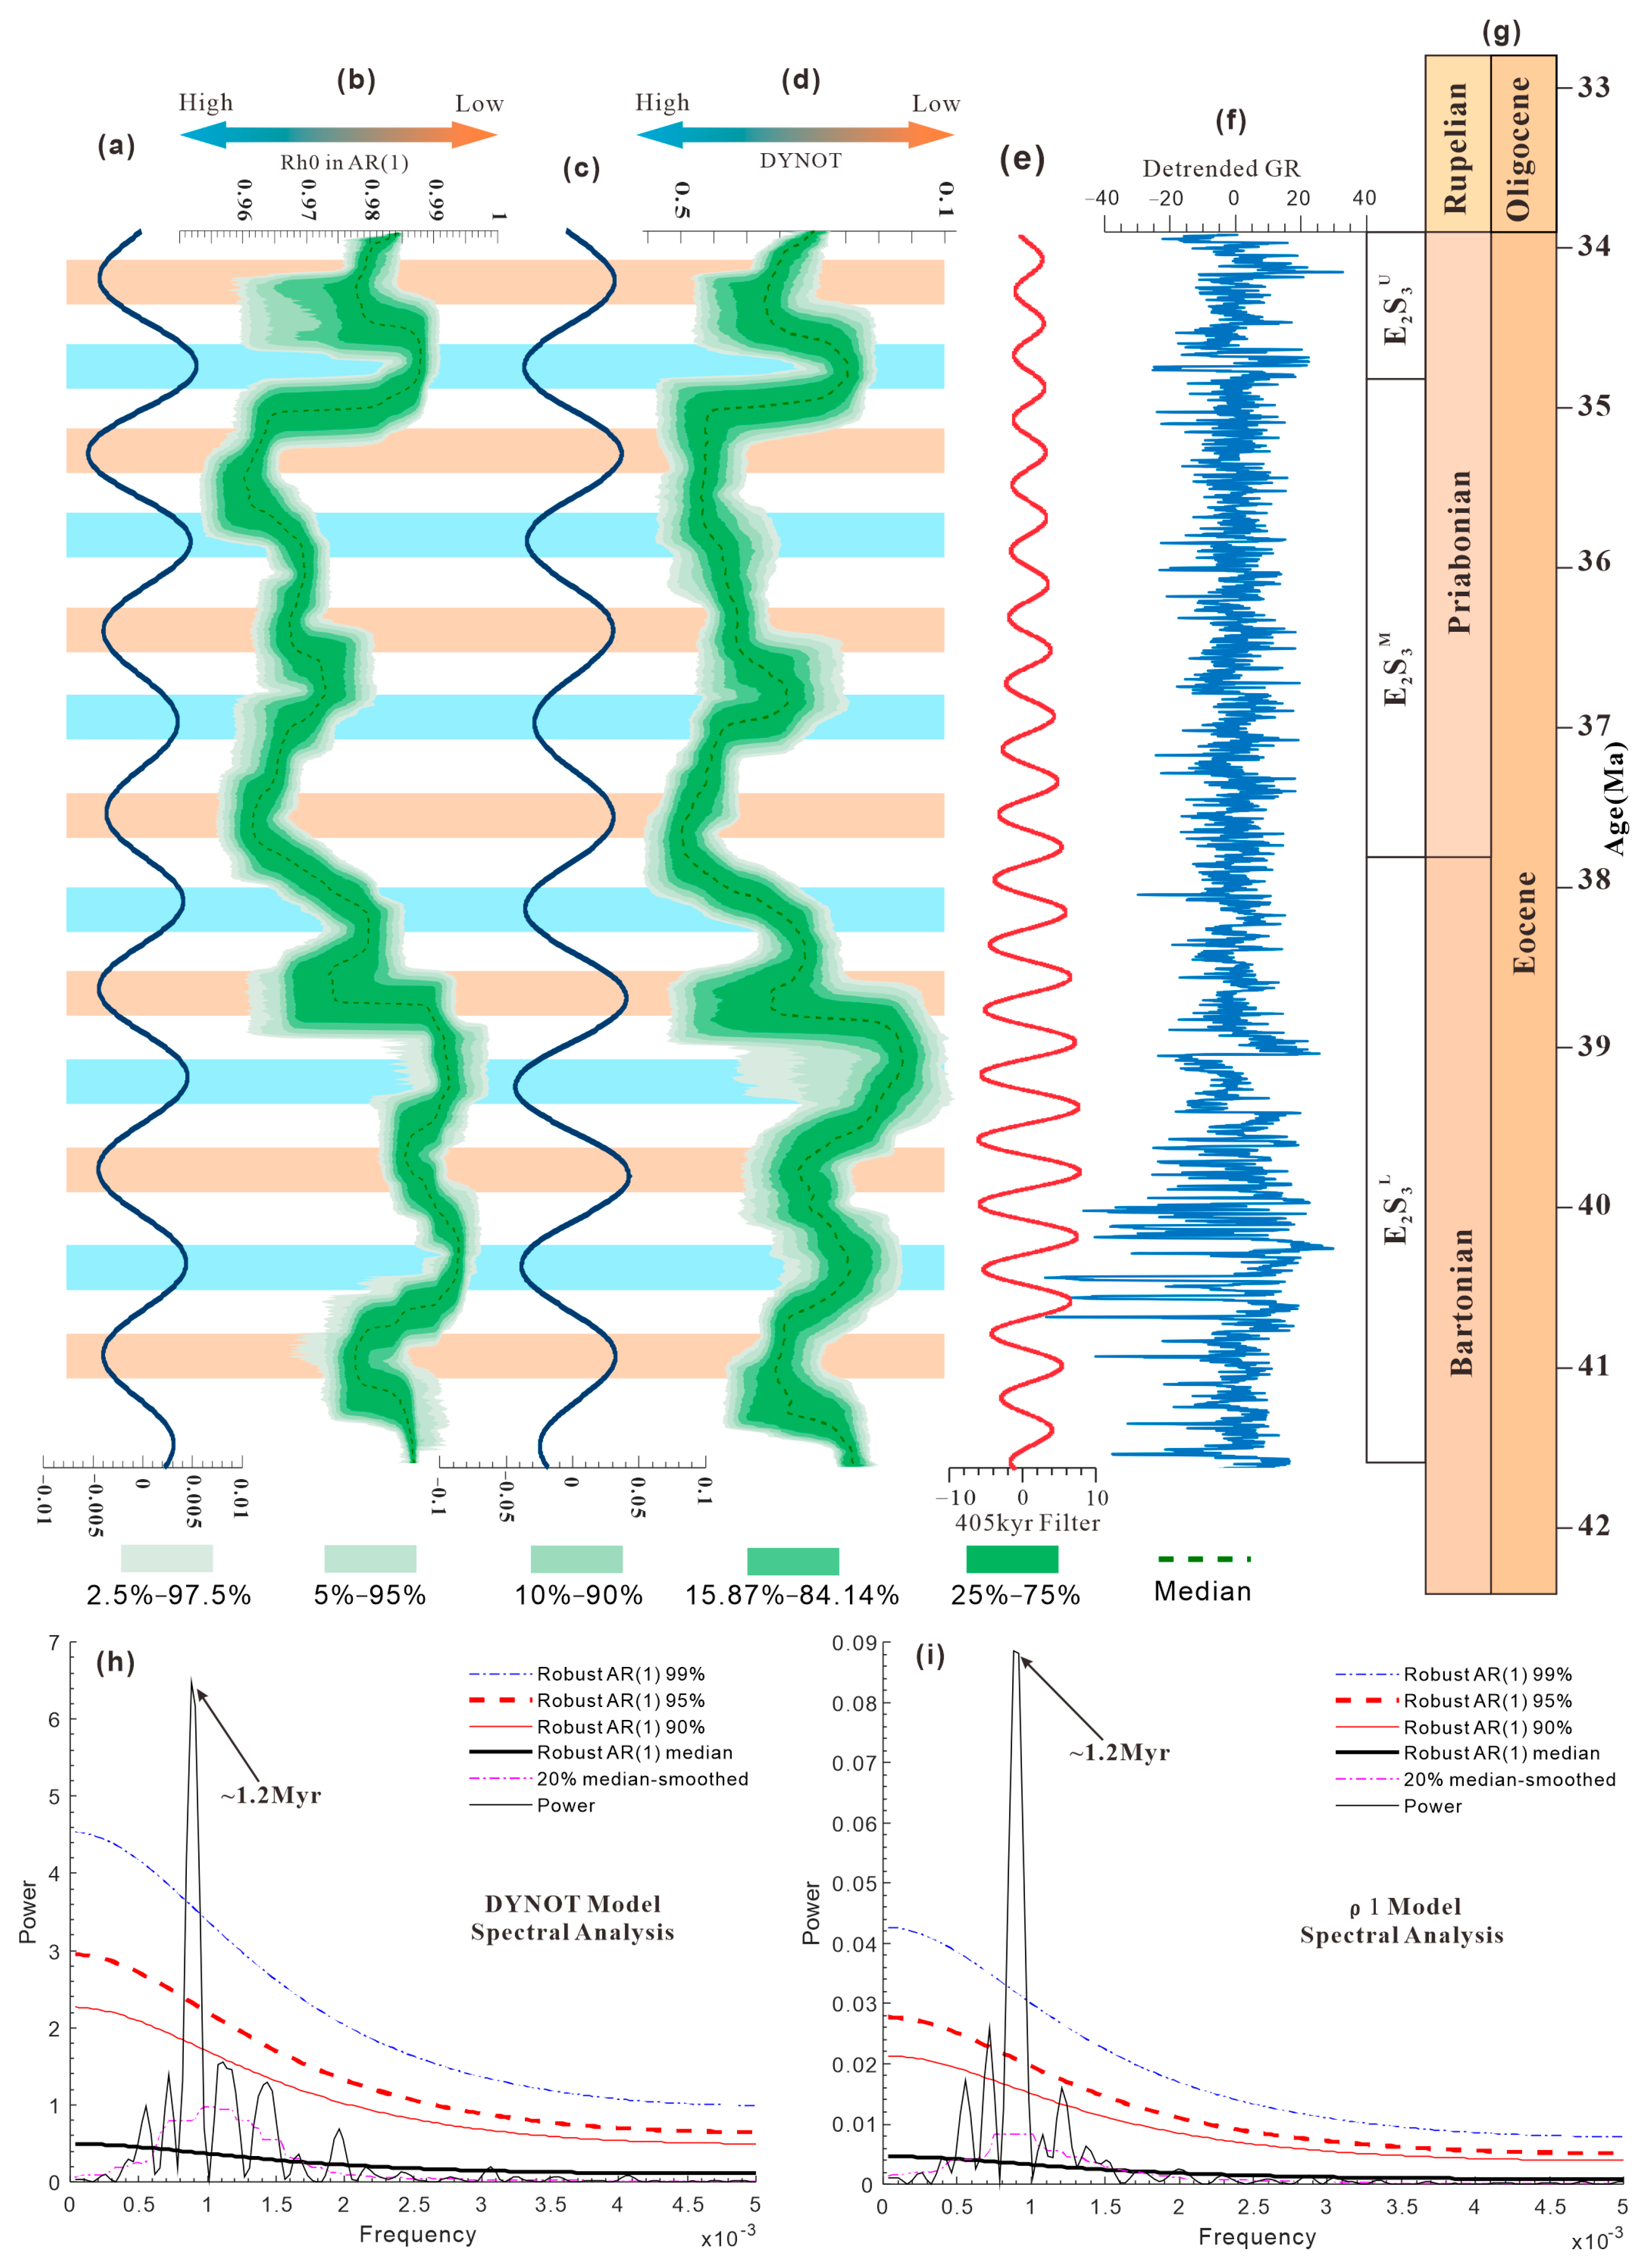
Further multi-window spectral analysis of the DYNOT and ρ1 models identified a 1.2 Myr long obliquity cycle (Figure 8h,i). Gaussian filtering was applied to isolate the 1.2 Myr components from the DYNOT and ρ1 time series. The results indicate that approximately seven 1.2 Myr cycles occurred during the deposition of the Es3 member. Comparison of the long obliquity cycle with the reconstructed sea-level variation curves (Figure 8a–d) reveals that sea-level changes were strongly modulated by the ~1.2 Myr periodicity. This pattern underscores the significant astronomical forcing on sea-level fluctuations during the deposition of the Es3 member and further confirms the presence of orbital cyclicity within the stratigraphic record.

5. Discussion

5.1. Response Characteristics of the Middle Eocene Climatic Optimum (MECO)

The Paleogene climate experienced a gradual transition from a “greenhouse” to an “icehouse” state. Based on marine carbon and oxygen isotope records, Jiang et al. (2012) [89] divided this evolution into three stages: an early warming phase, a middle stage of stable cooling, and a late-stage icehouse climate. Each stage was characterized by distinct paleoclimatic events, including the Paleocene–Eocene Thermal Maximum (PETM), the Early Eocene Climatic Optimum (EECO), and the Middle Eocene Climate Optimum (MECO).
The MECO (Middle Eocene Climatic Optimum) occurred during a period of stable cooling in the middle Paleogene, characterized by a decrease in δ18O, representing a significant but short-lived warming event. Bohaty et al. (2009) [83] analyzed carbon and oxygen isotopes from five Ocean Drilling Program (ODP) sites spanning 32–50 Ma, identifying a negative oxygen isotope excursion around 41.5 Ma. They interpreted this event as a major climatic reversal during the middle-to-late Eocene cooling trend, specifically the MECO. This event is directly recorded at multiple ODP sites across the Indian, Atlantic, and Pacific Oceans. Westerhold et al. (2014) [84] analyzed iron records from ODP Site 1260 in the western Atlantic and constrained the duration of the MECO to approximately 40.05–40.5 Ma.
Tuning of the δ13C and δ18O sequences to the 405 kyr cycle (Figure 9g,h) revealed distinct excursions in both isotopes within the lower member of the third Shahejie Formation (2091–2258 m). This event is inferred to have lasted approximately 400 kyr, occurring between 40.1 and 40.5 Ma, which aligns perfectly with the research of Westerhold et al. [84]. The characteristics of this event in the target interval are consistent with global sedimentary responses, exhibiting a trough configuration associated with the 405 kyr long eccentricity cycle. It induced a period of arid climate, leading to the dominant development of thin-bedded yellow calcareous siltstones and gray calcareous mudstones, which are correlatable across parts of the Laizhou Bay Sag.

5.2. Astronomically Forced Sea-Level Variations

Global sea-level fluctuations are closely linked to astronomical forcing. When Earth’s axial tilt (obliquity) increases, the Northern Hemisphere receives more solar insolation, accelerating the melting of continental ice sheets and resulting in sea-level rise [87]. Conversely, a decrease in obliquity reduces solar insolation in the Northern Hemisphere, promoting the preservation of continental ice sheets and leading to sea-level fall (Figure 9l,m).
In this study, we reconstructed ancient sea-level changes during the deposition of Member 3 of the Shahejie Formation using a 405 kyr-tuned GR (gamma-ray) time series, in combination with the DYNOT and ρ1 sediment noise models (Figure 9d,f). Spectral analyses of the median values from the DYNOT and ρ1 models (Figure 9c,e) revealed a significant ~1.2 Myr periodicity, which we interpret as the obliquity modulation cycle that dominated sea-level fluctuations in the study area (highlighted by blue and orange bands in Figure 8). To assess the relationship between local and global sea-level changes, and their astronomical drivers, we used global sea-level data spanning 33–40 Ma (Figure 9j), alongside the theoretical astronomical solution ETP derived from the La2010d model for the same interval (Figure 9a). Approximately seven distinct sea-level rise and fall cycles were observed during the deposition of Member 3 (Figure 9d,f), which correspond well with the global sea-level fluctuations over the same period (Figure 9j).
Furthermore, geochemical proxies were examined. Both Sr/Ba and V/(V + Ni) ratios serve as reliable geochemical indicators of paleoenvironmental changes associated with lake-level fluctuations. The Sr/Ba ratio primarily reflects variations in water salinity and basin depth, with higher values indicating stronger evaporation and higher salinity under relatively deeper or more stable lacustrine conditions. In contrast, the V/(V + Ni) ratio records redox changes in the bottom water; elevated values suggest enhanced reducing conditions, commonly developed during highstand phases with greater water depth and organic matter preservation. Although these proxies are governed by different geochemical mechanisms, their synchronous variations indicate consistent responses of both salinity and redox conditions to climatic and hydrological changes. The Sr/Ba ratio, commonly used to infer paleosalinity, ranged from 0.25 to 1.20, while the redox-sensitive V/(V + Ni) ratio ranged from 0.61 to 1.05. concurrent increases (or decreases) in Sr/Ba and V/(V + Ni) ratios correspond to lake-level rise (or fall) events, reflecting the integrated geochemical response of the Es3 Member to orbital-scale climate fluctuations. When the Sr/Ba and V/(V + Ni) curves converge, it corresponds to a lake-level fall; conversely, when they diverge, it indicates a lake-level rise event (Figure 9i).
These findings support the conclusions derived from our sediment noise models and provide compelling evidence that global sea-level fluctuations were modulated by the ~1.2 Myr obliquity pacing cycle. Moreover, the strong correspondence among global sea-level records, theoretical astronomical solutions, and sediment noise models validates the astronomical time scale framework we established for Member 3 of the Shahejie Formation.
However, due to the inherent complexity of the Earth system, sea-level fluctuations are influenced by multiple factors. At long periodicities, astronomical forcing exerts a pronounced control on sea-level variations; however, the extent to which these orbital cycles influence sea-level changes on shorter timescales remains uncertain and warrants further investigation. The resolution of sea-level reconstruction using the DYNOT sediment noise model can be adjusted by modifying the sliding window size during modeling. Smaller window sizes enhance temporal resolution but may reduce the variance of low-frequency signals, thereby increasing the uncertainty in astronomical signal interpretation. Consequently, investigations of sea-level variability on shorter timescales are currently constrained by methodological limitations.

5.3. Sedimentation Rate Control and Depositional Architecture

Astronomically driven climate variations influence sedimentation rates, thereby exerting control over organic matter accumulation. Climate fluctuations directly affect weathering processes as well as erosion and sediment transport dynamics [22,86]. They also regulate sea-level fluctuations, sediment supply, and the carbon cycle, which in turn modulate sedimentation rates [83]. These processes are clearly recorded in high-resolution sedimentary archives, offering critical insights into how sedimentation rates influence stratigraphic development.
Sedimentation rate plays a critical role in organic matter preservation. In the southern Laizhouwan Sag, the lower part of Member 3 is characterized by relatively high sedimentation rates (Figure 5), which coincide with elevated TOC concentrations. In contrast, the middle and upper parts of Member 3 exhibit reduced sedimentation rates, accompanied by a marked decline in TOC content (Figure 9i).
The sedimentary development of Member 3 exhibits a pronounced periodic relationship with astronomical cycles, with both the ~1.2 Myr and 405 kyr cycles jointly controlling climate variations during the Eocene. These cyclic variations influence sea-level fluctuations and sedimentation rates, thereby governing depositional patterns. Based on these findings, we propose an astronomically driven climate evolution model for Member 3 of the Laizhouwan Sag. When orbital obliquity is high (Figure 9l), increased solar insolation in the Northern Hemisphere accelerates glacial melting, leading to a rise in sea level. Elevated temperatures enhance evaporation and intensify the hydrological cycle, resulting in increased precipitation and favorable conditions for thermophilic and hygrophilous species. Concurrently, the melting of alpine glaciers increases river discharge, delivering larger volumes of freshwater to marine or lacustrine environments and further promoting the proliferation of specific biotic assemblages. In contrast, during periods of low obliquity (Figure 9m), reduced insolation in the Northern Hemisphere favors ice sheet preservation and results in substantial sea-level regression. Lower temperatures favor cold- and drought-tolerant species, while reduced precipitation weakens the hydrological cycle. The decrease in fluvial input significantly reduces river and lake water levels, potentially causing river desiccation or lake drying under extreme conditions.

6. Conclusions

(1)
Using well B-2 as a case study, this paper conducts an astronomical cycle analysis based on gamma-ray (GR) data. Sedimentation rates were quantitatively constrained by integrating spectral peak ratio analysis, correlation coefficient methods, and null hypothesis (H0) significance testing. we identified the optimal sedimentation rate of the Member 3 of the Shahejie Formation in well B-2 to be 3.5~6.5 cm/kyr. The age model for Member 3 was initially constrained using biostratigraphic data and further refined using the La2010d astronomical solution. This enabled the establishment of an absolute astronomical timescale ranging from 33.9 to 41.6 ± 0.2 Ma for Member 3 in well B-2.
(2)
Sea-level fluctuations during the deposition of Member 3 were analyzed using DYNOT and ρ1 sediment noise models in combination with geochemical proxies. The analysis identified the ~1.2 Myr obliquity modulation cycle as a critical driver of long-term sea-level variation. Furthermore, analysis of δ13C and δ18O records revealed the occurrence of the Middle Eocene Climatic Optimum (MECO) event. These findings suggest that the MECO response can serve as a reliable stratigraphic marker for regional correlation in the southern Laizhouwan Sag.
(3)
A climate-controlled depositional model for Member 3 of the Eocene in the southern Bohai Sea was established. The model highlights the dominant role of orbital cyclicity in driving coupled climate responses—such as temperature, sea level, and precipitation—in mid- to low-latitude regions. Phase-specific astro–climate–sedimentation response models were developed for different stages of Member 3 evolution.

Author Contributions

Conceptualization, T.Y. and J.-E.N.; methodology, J.-E.N. and T.Y.; software, J.-E.N., C.Z. and Z.S.; validation, J.-E.N. and Y.Z.; formal analysis, J.-E.N.; investigation, J.-E.N. and P.L.; resources, T.Y.; data curation, J.-E.N. and Y.Z.; writing—original draft preparation, J.-E.N. and C.Z.; writing—review and editing, J.-E.N., T.Y. and C.Z.; visualization, P.L.; supervision, T.Y. and Z.S.; project administration, J.-E.N. and Y.Z.; funding acquisition, T.Y. and Z.S. All authors have read and agreed to the published version of the manuscript.

Funding

This research was funded by the National Natural Science Foundation of China (No. 42572144, 42202120).

Data Availability Statement

All data and materials are available on request from the corresponding author. The data are not publicly available due to ongoing studies using a part of the data.

Conflicts of Interest

Jun-E Ni, Yu-qing Zhang and Peng Liu were employed by the CNOOC Research Institute Co., Ltd. The remaining authors declare that the research was conducted in the absence of any commercial or financial relationships that could be construed as a potential conflict of interest.

References

  1. Xu, C.; Yang, H.; Wang, D.; Zhao, D.; Wang, L. Formation conditions of Neogene large-scale high-abundance lithologic reservoir in the Laibei low uplift, Bohai Sea, East China. Pet. Explor. Dev. 2021, 48, 15–29. [Google Scholar] [CrossRef]
  2. Duan, Y.; Xie, J.; Su, Y.; Liang, H.; Hu, X.; Wang, Q.; Pan, Z. Application of the Decision Tree Method to Lithology Identification of Volcanic Rocks-Taking the Mesozoic in the Laizhouwan Sag as an Example. Sci. Rep. 2020, 10, 19209. [Google Scholar] [CrossRef]
  3. Niu, C.; Yang, H.; Zhao, D.; Zhang, C.; Peng, J. Study on the Ultra-Late Hydrocarbon Accumulation and Migration Lagging Effect in Laizhouwan Sag, Bohai Sea. Earth Sci. 2022, 47, 464–478. [Google Scholar] [CrossRef]
  4. Zhu, X.; Li, S.; Liu, Q.; Zhang, Z.; Xu, C.; Du, X.; Li, H.; Shi, W. Source to Sink Studies between the Shaleitian Uplift and Surrounding Sags: Perspectives on the Importance of Hinterland Relief and Catchment Area for Sediment Budget, Western Bohai Bay Basin, China. Interpretation 2017, 5, ST65–ST84. [Google Scholar] [CrossRef]
  5. Yin, J.; Xu, C.; Hao, F.; Wang, Q.; Miao, Q.; Wang, Z.; Zou, H. Controls on Organic Matter Enrichment in Source Rocks of the Shahejie Formation in the Southwestern Bozhong Sag, Bohai Bay Basin, China. Palaeogeogr. Palaeoclimatol. Palaeoecol. 2020, 560, 110026. [Google Scholar] [CrossRef]
  6. Zhao, Q.; Zhu, H.; Zhang, X.; Liu, Q.; Qiu, X.; Li, M. Geomorphologic Reconstruction of an Uplift in a Continental Basin with a Source-to-Sink Balance: An Example from the Huizhou-Lufeng Uplift, Pearl River Mouth Basin, South China Sea. Mar. Pet. Geol. 2021, 128, 104984. [Google Scholar] [CrossRef]
  7. Xue, Y.; Zhao, M.; Liu, X. Reservoir Characteristics and Controlling Factors of the Metamorphic Buried Hill of Bozhong Sag, Bohai Bay Basin. J. Earth Sci. 2021, 32, 919–926. [Google Scholar] [CrossRef]
  8. Zhu, H.; Yang, X.; Liu, K.; Zhou, X. Seismic-Based Sediment Provenance Analysis in Continental Lacustrine Rift Basins: An Example from the Bohai Bay Basin, China. Bulletin 2014, 98, 1995–2018. [Google Scholar] [CrossRef]
  9. Wang, H.; Hu, J.; Zhou, M.; He, M.; Wang, S.; Tang, H. Volcanic Facies Models and Reservoir Characteristics of Mesozoic Volcanic Rocks in the Southern Slope of Laizhou Bay Depression, Bohai Bay Basin. Acta 2024, 98, 1814–1828. [Google Scholar] [CrossRef]
  10. Du, X.; Zhang, S.; Guan, D.; Wang, Y.; Su, W.; Su, A. The Effect of Thermal Fluid Activity in the W16 Structure, Laizhou Bay Depression, Bohai Bay Basin on Reservoir Modification. Earth Sci. 2024, 49, 3459–3470. [Google Scholar]
  11. Xu, S.; Cong, F.; Hao, F.; Xu, C.; Zou, H.; Zhang, X.; Xu, S. Shelf-Edge Trajectory and Sediment Dispersal in a Lacustrine Setting: A Case Study from Qinnan Depression, Bohai Bay Basin, China. Mar. Pet. Geol. 2018, 91, 562–575. [Google Scholar] [CrossRef]
  12. Xu, C.; Du, X.; Zhu, H.; Jia, D.; Xu, W.; Lu, H. Source-to-Sink System and Its Sedimentary Records in the Continental Rift Basins: An Example from the Paleogene in the Bohai Sea Area, China. Interpretation 2017, 5, ST35–ST51. [Google Scholar] [CrossRef]
  13. Xia, S.; Liu, J.; Liu, Z.; Ye, D.; Chang, Y.; Gao, N.; Li, H.; Liang, X. The Geophysical Identification, Characteristics, and Petroliferous Significance of Sublacustrine Fan Deposits in the Second Member of Dongying Formation in Liaozhong Depression, Bohai Bay Basin. Geol. J. 2018, 53, 692–706. [Google Scholar] [CrossRef]
  14. Zhu, H.; Yang, X.; Zhou, X.; Liu, K. Three-Dimensional Facies Architecture Analysis Using Sequence Stratigraphy and Seismic Sedimentology: Example from the Paleogene Dongying Formation in the BZ3-1 Block of the Bozhong Sag, Bohai Bay Basin, China. Mar. Pet. Geol. 2014, 51, 20–33. [Google Scholar] [CrossRef]
  15. Yang, H.; Shi, W.; Zhang, Z.; Wang, Q.; Wang, H.; Liang, X. Enrichment Mechanism of Shallow Stratigraphic Oil Reservoirs and New Discoveries of Billion-Ton-Scale Oilfields in the Laizhou Bay Depression Belt—A Case Study of Kenli 10-2 Oilfield. China Offshore Oil Gas. 2024, 36, 23–36. [Google Scholar]
  16. Duan, Y.; Xie, J.; Li, B.; Wang, M.; Zhang, T.; Zhou, Y. Lithology Identification and Reservoir Characteristics of the Mixed Siliciclastic-Carbonate Rocks of the Lower Third Member of the Shahejie Formation in the South of the Laizhouwan Sag, Bohai Bay Basin, China. Carbonates Evaporites 2020, 35, 55. [Google Scholar] [CrossRef]
  17. Wang, R.; Xie, J.; Ran, A.; Wang, S.; Wang, J.; Hu, X.; Cai, W.; Zhou, Y. Comparison of INPEFA Technology and Wavelet Transform in Sequence Stratigraphic Division of Mixed Reservoir: A Case Study of Lower Es3 of KL Oilfield in Laizhouwan Sag. J. Pet. Explor. Prod. Technol. 2022, 12, 3213–3225. [Google Scholar] [CrossRef]
  18. Liu, M.; Hao, F.; Wang, Q.; Niu, C.; Tian, J. Light Hydrocarbon Geochemical Characteristics and Geological Significance of Buried Hill Condensate Oil in Bozhong 19-6 Structural Belt. Earth Sci. 2021, 46, 3645–3656. [Google Scholar] [CrossRef]
  19. Niu, C. Tectonic evolution and hydrocarbon accumulation of Laizhouwan depression in southern Bohai Sea. Oil Gas Geol. 2012, 33, 424–431. [Google Scholar]
  20. Plancq, J.; Mattioli, E.; Pittet, B.; Baudin, F.; Duarte, L.V.; Boussaha, M.; Grossi, V. A Calcareous Nannofossil and Organic Geochemical Study of Marine Palaeoenvironmental Changes across the Sinemurian/Pliensbachian (Early Jurassic, ~191 Ma) in Portugal. Palaeogeogr. Palaeoclimatol. Palaeoecol. 2016, 449, 1–12. [Google Scholar] [CrossRef]
  21. Zhang, R.; Kemp, D.B.; Thibault, N.; Jelby, M.E.; Li, M.; Huang, C.; Sui, Y.; Wang, Z.; Liu, D.; Jia, S. Astrochronology and Sedimentary Noise Modeling of Pliensbachian (Early Jurassic) Sea-Level Changes, Paris Basin, France. Earth Planet. Sci. Lett. 2023, 614, 118199. [Google Scholar] [CrossRef]
  22. Ruhl, M.; Hesselbo, S.P.; Hinnov, L.; Jenkyns, H.C.; Xu, W.; Riding, J.B.; Storm, M.; Minisini, D.; Ullmann, C.V.; Leng, M.J. Astronomical Constraints on the Duration of the Early Jurassic Pliensbachian Stage and Global Climatic Fluctuations. Earth Planet. Sci. Lett. 2016, 455, 149–165. [Google Scholar] [CrossRef]
  23. Liu, J.; Shi, J.; Lu, Y.; Fan, X.; Zhang, Z.; Zhang, R.; Wang, Z.; Xu, K.; Xiao, A.; Kemp, D.B.; et al. Astronomical Forcing of Terrestrial Organic Carbon Burial in East Asia during the Eocene. Earth Planet. Sci. Lett. 2024, 646, 119014. [Google Scholar] [CrossRef]
  24. Li, M.; Li, C.; Xie, L.; Huang, W.; Zheng, Q.; Tan, K.; Hong, Y. Astronomical Tide and Storm Surge Signals Observed in an Isolated Inland Maar Lake Near the Coast. J. Mar. Sci. Eng. 2021, 9, 485. [Google Scholar] [CrossRef]
  25. Zhang, C.; Zhang, W.; Zhang, C.; Zheng, L.; Yan, S.; Ma, Y.; Dang, W. Astronomical Time Scale of the Late Pleistocene in the Northern South China Sea Based on Carbonate Deposition Record. J. Mar. Sci. Eng. 2024, 12, 438. [Google Scholar] [CrossRef]
  26. Aguado, R.; O’Dogherty, L.; Sandoval, J. Calcareous Nannofossil Assemblage Turnover in Response to the Early Bajocian (Middle Jurassic) Palaeoenvironmental Changes in the Subbetic Basin. Palaeogeogr. Palaeoclimatol. Palaeoecol. 2017, 472, 128–145. [Google Scholar] [CrossRef]
  27. Brazier, J.-M.; Suan, G.; Tacail, T.; Simon, L.; Martin, J.E.; Mattioli, E.; Balter, V. Calcium Isotope Evidence for Dramatic Increase of Continental Weathering during the Toarcian Oceanic Anoxic Event (Early Jurassic). Earth Planet. Sci. Lett. 2015, 411, 164–176. [Google Scholar] [CrossRef]
  28. Sell, B.; Ovtcharova, M.; Guex, J.; Bartolini, A.; Jourdan, F.; Spangenberg, J.E.; Vicente, J.-C.; Schaltegger, U. Evaluating the Temporal Link between the Karoo LIP and Climatic–Biologic Events of the Toarcian Stage with High-Precision U–Pb Geochronology. Earth Planet. Sci. Lett. 2014, 408, 48–56. [Google Scholar] [CrossRef]
  29. Peng, C.; Zou, C.; Zhang, S.; Shu, J.; Wang, C. Geophysical Logs as Proxies for Cyclostratigraphy: Sensitivity Evaluation, Proxy Selection, and Paleoclimatic Interpretation. Earth-Sci. Rev. 2024, 252, 104735. [Google Scholar] [CrossRef]
  30. Tang, W.; Zhang, D.; Zhou, Y.; Liu, Y.; Wu, K.; Zhang, P.; Han, Q.; Li, F.; Ma, C. Astronomical Forcing in the Coal-Bearing Middle Jurassic Dameigou Formation, Qaidam Basin, Northwestern China. Ore Geol. Rev. 2023, 161, 105663. [Google Scholar] [CrossRef]
  31. Xu, K.; Ren, J.; Kemp, D.B.; Lei, C.; Zhu, H.; Zheng, J.; Sun, Z. Astronomical Pacing of Third-Order Sea-Level Sequences during the Middle Miocene in the Northern South China Sea. Mar. Pet. Geol. 2023, 154, 106335. [Google Scholar] [CrossRef]
  32. Guo, D.; Jin, Z. Astronomical Time Scale of a Middle Eocene Lacustrine Sequence from the Dongpu Sag, Bohai Bay Basin, Eastern China. J. Asian Earth Sci. 2021, 214, 104747. [Google Scholar] [CrossRef]
  33. Song, C.; Lv, D.; Chang, J.; Ejembi, J.I.; Tang, L.; Raji, M.; Chen, W.; Zhang, Z. Astronomically Forced Saline Lake Deposition and Paleoclimatic Response in the Huanggang Basin during the Paleogene, Eastern China. Ore Geol. Rev. 2023, 158, 105506. [Google Scholar] [CrossRef]
  34. Zhao, X.; Liu, X.; Liu, H.; Jin, F.; Pu, X.; Sun, B.; Shi, Z. High-Resolution Astronomical Records of Shale Strata in Faulted Lake Basins and Implications for the Sedimentary Process of Laminated Sediments. Geosci. Front. 2024, 16, 101974. [Google Scholar] [CrossRef]
  35. Williams, R.D.; Brasington, J.; Hicks, D.M. Numerical Modelling of Braided River Morphodynamics: Review and Future Challenges. Geogr. Compass 2016, 10, 102–127. [Google Scholar] [CrossRef]
  36. Yao, Y.; Xiu, S.; Wei, X.; Meng, S.; Ye, Y.; Diao, S. ESR Dating Study of the Lower Tertiary in the Dongying Depression. Pet. Geol. Recover. Effic. 2002, 3, 31–34. [Google Scholar]
  37. Xu, W. Identification of High-Frequency Cycles in the Third and Fourth Members of the Shahejie Formation, Dongying Sag and Their Geological Significance. Master’s Thesis, China University of Geosciences, Wuhan, China, 2011. [Google Scholar]
  38. Liu, Z.; Huang, C.; Algeo, T.J.; Liu, H.; Hao, Y.; Du, X.; Lu, Y.; Chen, P.; Guo, L.; Peng, L. High-Resolution Astrochronological Record for the Paleocene-Oligocene (66–23 Ma) from the Rapidly Subsiding Bohai Bay Basin, Northeastern China. Palaeogeogr. Palaeoclimatol. Palaeoecol. 2018, 510, 78–92. [Google Scholar] [CrossRef]
  39. Shi, J.; Jin, Z.; Liu, Q.; Huang, Z.; Zhang, R. High-frequency sequence quantitative division of lacustrine fine-grained sedimentary rocks based on Milankovitch theory. Pet. Nat. Gas. Geol. 2019, 40, 1205–1214. [Google Scholar]
  40. Zhang, Q.; Fu, X.; Wang, J.; Mansour, A.; Wei, H.; Zhang, T.; Wang, M. Orbitally-Paced Climate Change during the Carnian Pluvial Episode. Earth Planet. Sci. Lett. 2024, 626, 118546. [Google Scholar] [CrossRef]
  41. Zhang, T.; Li, Y.; Fan, T.; Da Silva, A.-C.; Shi, J.; Gao, Q.; Kuang, M.; Liu, W.; Gao, Z.; Li, M. Orbitally-Paced Climate Change in the Early Cambrian and Its Implications for the History of the Solar System. Earth Planet. Sci. Lett. 2022, 583, 117420. [Google Scholar] [CrossRef]
  42. Liu, X.; Ge, J.; Qu, H.; Ma, C. Sequence Stratigraphy Driven by Tectonic Subsidence and Astronomical Forcing: A Case Study from the Miocene Pearl River Mouth Basin, South China Sea. Mar. Pet. Geol. 2024, 169, 107074. [Google Scholar] [CrossRef]
  43. Li, S.; Zhu, H.; Yang, X.; Xu, C. Seismic Geomorphology, Architecture and Genesis of Unusual Confined and Semiconfined Sedimentary Units on the Northern Slope of the Bonan Uplift, Bohai Bay Basin, China. J. Pet. Sci. Eng. 2021, 196, 107696. [Google Scholar] [CrossRef]
  44. Du, W.; Ji, Y.; Chen, G.; Wu, H.; Gao, C.; Li, S.; Zhang, Y. Cyclostratigraphy and Astronomical Tuning during the Oligocene in the Jizhong Depression, Bohai Bay Basin, Northeastern China. Palaeogeogr. Palaeoclimatol. Palaeoecol. 2020, 554, 109803. [Google Scholar] [CrossRef]
  45. Zhao, S.; Li, Y.; Xu, Y.; Zhang, T.; Mu, L.; Wu, X.; Pu, X.; Yang, P.; Yuan, X. Depositional Model of Clastic and Carbonate Rocks in a Continental Rift Basin: A Case Study of the Paleogene Shahejie Formation in the Cangdong Depression, Bohai Bay Basin. Geomech. Geophys. Geo-Energy Geo-Resour. 2023, 9, 117. [Google Scholar] [CrossRef]
  46. Li, Q.; Xu, S.; Li, J.; Guo, R.; Wang, G.; Wang, Y. Effects of Astronomical Cycles on Laminated Shales of the Paleogene Shahejie Formation in the Dongying Sag, Bohai Bay Basin, China. Energies 2023, 16, 3624. [Google Scholar] [CrossRef]
  47. Jerrett, R.M.; Hodgson, D.M.; Flint, S.S.; Davies, R.C. Control of Relative Sea Level and Climate on Coal Character in the Westphalian C (Atokan) Four Corners Formation, Central Appalachian Basin, U.S.A. J. Sediment. Res. 2011, 81, 420–445. [Google Scholar] [CrossRef]
  48. Mansour, A.; Geršlová, E.; Sýkorová, I.; Vöröš, D. Hydrocarbon Potential and Depositional Paleoenvironment of a Middle Jurassic Succession in the Falak-21 Well, Shushan Basin, Egypt: Integrated Palynological, Geochemical and Organic Petrographic Approach. Int. J. Coal Geol. 2020, 219, 103374. [Google Scholar] [CrossRef]
  49. Fielding, C.R. Late Palaeozoic Cyclothems—A Review of Their Stratigraphy and Sedimentology. Earth-Sci. Rev. 2021, 217, 103612. [Google Scholar] [CrossRef]
  50. Valero, L.; Cabrera, L.; Sáez, A.; Garcés, M. Long-Period Astronomically-Forced Terrestrial Carbon Sinks. Earth Planet. Sci. Lett. 2016, 444, 131–138. [Google Scholar] [CrossRef]
  51. Diessel, C.; Boyd, R.; Wadsworth, J.; Leckie, D.; Chalmers, G. On Balanced and Unbalanced Accommodationrpeat Accumulation Ratios in the Cretaceous Coals from Gates Formation, Western Canada, and Their Sequence-Stratigraphic Significance. Int. J. Coal Geol. 2000, 43, 143–186. [Google Scholar] [CrossRef]
  52. Bao, X.; Hu, Y.; Scotese, C.R.; Li, X.; Guo, J.; Lan, J.; Lin, Q.; Yuan, S.; Wei, M.; Li, Z.; et al. Quantifying Climate Conditions for the Formation of Coals and Evaporites. Natl. Sci. Rev. 2023, 10, nwad051. [Google Scholar] [CrossRef]
  53. Bazhenov, M.L.; Burtman, V.S.; Levashova, N.L. Lower and Middle Jurassic Paleomagnetic Results from the South Lesser Caucasus and the Evolution of the Mesozoic Tethys Ocean. Earth Planet. Sci. Lett. 1996, 141, 79–89. [Google Scholar] [CrossRef]
  54. Yang, Z.Y.; Besse, J.; Sutheetorn, V.; Bassoullet, J.P.; Fontaine, H.; Buffetaut, E. Lower-Middle Jurassic Paleomagnetic Data from the Mae Sot Area (Thailand): Paleogeographic Evolution and Deformation History of Southeastern Asia. Earth Planet. Sci. Lett. 1995, 136, 325–341. [Google Scholar] [CrossRef]
  55. Steiner, M.B. Magnetic Polarity during the Middle Jurassic as Recorded in the Summerville and Curtis Formations. Earth Planet. Sci. Lett. 1978, 38, 331–345. [Google Scholar] [CrossRef]
  56. Li, M.; Hinnov, L.; Kump, L. Acycle: Time-Series Analysis Software for Paleoclimate Research and Education. Comput. Geosci. 2019, 127, 12–22. [Google Scholar] [CrossRef]
  57. Li, Y.; Liu, X.; Chen, W.; Yi, L. Magnetic Properties and Initiation of Biogenic Reefs in Xisha Islands, South China Sea, at the Oligo–Miocene Boundary. J. Mar. Sci. Eng. 2021, 9, 1031. [Google Scholar] [CrossRef]
  58. Gao, Y.; Zhang, S.; Zhao, H.; Ren, Q.; Yang, T.; Wu, H.; Li, H. North China Block Underwent Simultaneous True Polar Wander and Tectonic Convergence in Late Jurassic: New Paleomagnetic Constraints. Earth Planet. Sci. Lett. 2021, 567, 117012. [Google Scholar] [CrossRef]
  59. Li, M.; Huang, C.; Hinnov, L.; Ogg, J.; Chen, Z.-Q.; Zhang, Y. Obliquity-Forced Climate during the Early Triassic Hothouse in China. Geology 2016, 44, 623–626. [Google Scholar] [CrossRef]
  60. Pinault, J.-L. Resonantly Forced Baroclinic Waves in the Oceans: A New Approach to Climate Variability. J. Mar. Sci. Eng. 2020, 9, 13. [Google Scholar] [CrossRef]
  61. Otofuji, Y.; Mu, C.L.; Tanaka, K.; Miura, D.; Inokuchi, H.; Kamei, R.; Tamai, M.; Takemoto, K.; Zaman, H.; Yokoyama, M. Spatial Gap between Lhasa and Qiangtang Blocks Inferred from Middle Jurassic to Cretaceous Paleomagnetic Data. Earth Planet. Sci. Lett. 2007, 262, 581–593. [Google Scholar] [CrossRef]
  62. Jackson, M.; Sienra, G.; Santoro, P.; Fossati, M. Temporal and Spatial Variability Scales of Salinity at a Large Microtidal Estuary. J. Mar. Sci. Eng. 2021, 9, 860. [Google Scholar] [CrossRef]
  63. Krencker, F.-N.; Bodin, S.; Suan, G.; Heimhofer, U.; Kabiri, L.; Immenhauser, A. Toarcian Extreme Warmth Led to Tropical Cyclone Intensification. Earth Planet. Sci. Lett. 2015, 425, 120–130. [Google Scholar] [CrossRef]
  64. Vickers, M.L.; Fernandez, A.; Hesselbo, S.P.; Price, G.D.; Bernasconi, S.M.; Lode, S.; Ullmann, C.V.; Thibault, N.; Hougaard, I.W.; Korte, C. Unravelling Middle to Late Jurassic Palaeoceanographic and Palaeoclimatic Signals in the Hebrides Basin Using Belemnite Clumped Isotope Thermometry. Earth Planet. Sci. Lett. 2020, 546, 116401. [Google Scholar] [CrossRef]
  65. Ferreira, J.; Mattioli, E.; Sucherás-Marx, B.; Giraud, F.; Duarte, L.V.; Pittet, B.; Suan, G.; Hassler, A.; Spangenberg, J.E. Western Tethys Early and Middle Jurassic Calcareous Nannofossil Biostratigraphy. Earth-Sci. Rev. 2019, 197, 102908. [Google Scholar] [CrossRef]
  66. Laskar, J.; Fienga, A.; Gastineau, M.; Manche, H. La2010: A New Orbital Solution for the Long-Term Motion of the Earth. Astron. Astrophys. 2011, 532, A89. [Google Scholar] [CrossRef]
  67. Shang, X.; Duan, T.; Hou, J.; Li, Y. Spatial Configuration of Sand and Mud in the Lacustrine Nearshore Sand Bar Deposits and Its Geological Implications. Pet. Explor. Dev. 2019, 46, 954–968. [Google Scholar] [CrossRef]
  68. Karayigit, A.I.; Bircan, C.; Oskay, R.G.; Türkmen, İ.; Querol, X. The Geology, Mineralogy, Petrography, and Geochemistry of the Miocene Dursunbey Coal within Fluvio-Lacustrine Deposits, Balıkesir (Western Turkey). Int. J. Coal Geol. 2020, 228, 103548. [Google Scholar] [CrossRef]
  69. Zheng, T.; Zieger, L.; Baniasad, A.; Grohmann, S.; Hu, T.; Littke, R. The Shahejie Formation in the Dongpu Depression, Bohai Bay Basin, China: Geochemical Investigation of the Origin, Deposition and Preservation of Organic Matter in a Saline Lacustrine Environment during the Middle Eocene. Int. J. Coal Geol. 2022, 253, 103967. [Google Scholar] [CrossRef]
  70. Liang, J.; Wang, Y.; Zhang, S.; Liang, Y.; Gong, G.; Han, R. Astronomical Chronology Framework of the Lingshui Formation (Oligocene) in the Northern South China Sea. J. Mar. Sci. Eng. 2025, 13, 86. [Google Scholar] [CrossRef]
  71. Zeng, Z.; Zhu, H.; Mei, L.; Du, J.; Zeng, H.; Xu, X.; Dong, X. Multilevel Source-to-Sink (S2S) Subdivision and Application of an Ancient Uplift System in South China Sea: Implications for Further Hydrocarbon Exploration. J. Pet. Sci. Eng. 2019, 181, 106220. [Google Scholar] [CrossRef]
  72. Zhang, B.; Liu, S.; Lin, C.; Wang, Y.; Wang, Z.; Fang, M.; Shen, W. Source-to-Sink System Reconstruction in the Northern Jiaolai Basin, Eastern China, by Multiproxy Provenance Methods and Implications for Exhumation of the Sulu Orogen. Tectonophysics 2019, 754, 18–32. [Google Scholar] [CrossRef]
  73. Abdul Aziz, H.; Hilgen, F.; Krijgsman, W.; Sanz, E.; Calvo, J.P. Astronomical Forcing of Sedimentary Cycles in the Middle to Late Miocene Continental Calatayud Basin (NE Spain). Earth Planet. Sci. Lett. 2000, 177, 9–22. [Google Scholar] [CrossRef]
  74. Westerhold, T.; Marwan, N.; Drury, A.J.; Liebrand, D.; Agnini, C.; Anagnostou, E.; Barnet, J.S.K.; Bohaty, S.M.; De Vleeschouwer, D.; Florindo, F.; et al. An Astronomically Dated Record of Earth’s Climate and Its Predictability over the Last 66 Million Years. Science 2020, 369, 1383–1387. [Google Scholar] [CrossRef] [PubMed]
  75. Li, Y.; Yang, R.; Fan, A.; Chen, J.; Bilal, A.; Wang, Z. Establishment of a High-Resolution Astronomical Time Scale and High-Frequency Sequence Framework of Paleogene Lacustrine Fine-Grained Sediments Using Logging Data: A Case Study from the Bohai Bay Basin, East China. Mar. Pet. Geol. 2025, 172, 107220. [Google Scholar] [CrossRef]
  76. Xu, T.-Y.; Peng, J.; Yu, L.-D.; Han, H.-D.; Yang, Y.-M.; Zeng, Y.; Wang, Y.-B. The Control of Astronomical Cycles on Lacustrine Fine-Grained Event Sedimentation—A Case Study of the Chunshang Sub-Member of the Upper Es4 in the Dongying Sag. Pet. Sci. 2023, 20, 1395–1410. [Google Scholar] [CrossRef]
  77. Berggren, W.A.; Kent, D.V.; Swisher, C.C.; Aubry, M.-P. A Revised Cenozoic Geochronology and Chronostratigraphy. In Geochronology, Time Scales and Global Stratigraphic Correlation; SEPM Society for Sedimentary Geology: Claremore, OK, USA, 1995; ISBN 978-1-56576-091-2. [Google Scholar]
  78. Speijer, R.P.; Pälike, H.; Hollis, C.J.; Hooker, J.J.; Ogg, J.G. The Paleogene Period. In Geologic Time Scale 2020; Elsevier: Amsterdam, The Netherlands, 2020; pp. 1087–1140. ISBN 978-0-12-824360-2. [Google Scholar]
  79. Huang, H.; Gao, Y.; Ma, C.; Niu, L.; Dong, T.; Tian, X.; Cheng, H.; Hei, C.; Tao, H.; Wang, C. Astronomical Constraints on the Development of Alkaline Lake during the Carboniferous-Permian Period in North Pangea. Glob. Planet. Change 2021, 207, 103681. [Google Scholar] [CrossRef]
  80. Shi, J.; Jin, Z.; Liu, Q.; Zhang, R.; Huang, Z. Cyclostratigraphy and Astronomical Tuning of the Middle Eocene Terrestrial Successions in the Bohai Bay Basin, Eastern China. Glob. Planet. Change 2019, 174, 115–126. [Google Scholar] [CrossRef]
  81. Berger, A.; Loutre, M.F.; Dehant, V. Influence of the Changing Lunar Orbit on the Astronomical Frequencies of pre-Quaternary Insolation Patterns. Paleoceanography 1989, 4, 555–564. [Google Scholar] [CrossRef]
  82. Liu, Z.; Algeo, T.J.; Guo, X.; Fan, J.; Du, X.; Lu, Y. Paleo-Environmental Cyclicity in the Early Silurian Yangtze Sea (South China): Tectonic or Glacio-Eustatic Control? Palaeogeogr. Palaeoclimatol. Palaeoecol. 2017, 466, 59–76. [Google Scholar] [CrossRef]
  83. Bohaty, S.M.; Zachos, J.C.; Florindo, F.; Delaney, M.L. Coupled Greenhouse Warming and Deep-sea Acidification in the Middle Eocene. Paleoceanography 2009, 24, 2008PA001676. [Google Scholar] [CrossRef]
  84. Westerhold, T.; Röhl, U.; Pälike, H.; Wilkens, R.; Wilson, P.A.; Acton, G. Orbitally Tuned Timescale and Astronomical Forcing in the Middle Eocene to Early Oligocene. Clim. Past 2014, 10, 955–973. [Google Scholar] [CrossRef]
  85. Lisiecki, L.; Stern, J. Regional and global benthic δ18O stacks for the last glacial cycle. Paleoceanogr. Paleoclimatology 2016, 31, 1368–1394. [Google Scholar] [CrossRef]
  86. Maher, K.; Chamberlain, C.P. Hydrologic Regulation of Chemical Weathering and the Geologic Carbon Cycle. Science 2014, 343, 1502–1504. [Google Scholar] [CrossRef] [PubMed]
  87. Li, M.; Hinnov, L.A.; Huang, C.; Ogg, J.G. Sedimentary noise and sea levels linked to land-ocean water exchange and obliquity forcing. Nat. Commun. 2018, 9, 1004. [Google Scholar] [CrossRef] [PubMed]
  88. Laskar, J.; Robutel, P.; Joutel, F.; Gastineau, M.; Correia, A.C.M.; Levrard, B. A long-term numerical solution for the insolation quantities of the Earth. Astron. Astrophys. 2004, 428, 261–285. [Google Scholar] [CrossRef]
  89. Jiang, T.; Jia, J.; Deng, L.; Wan, X. Significant Climate Events in Paleogene and Their Biotic Response. Geol. Sci. Technol. Inf. 2012, 31, 31–38. [Google Scholar]
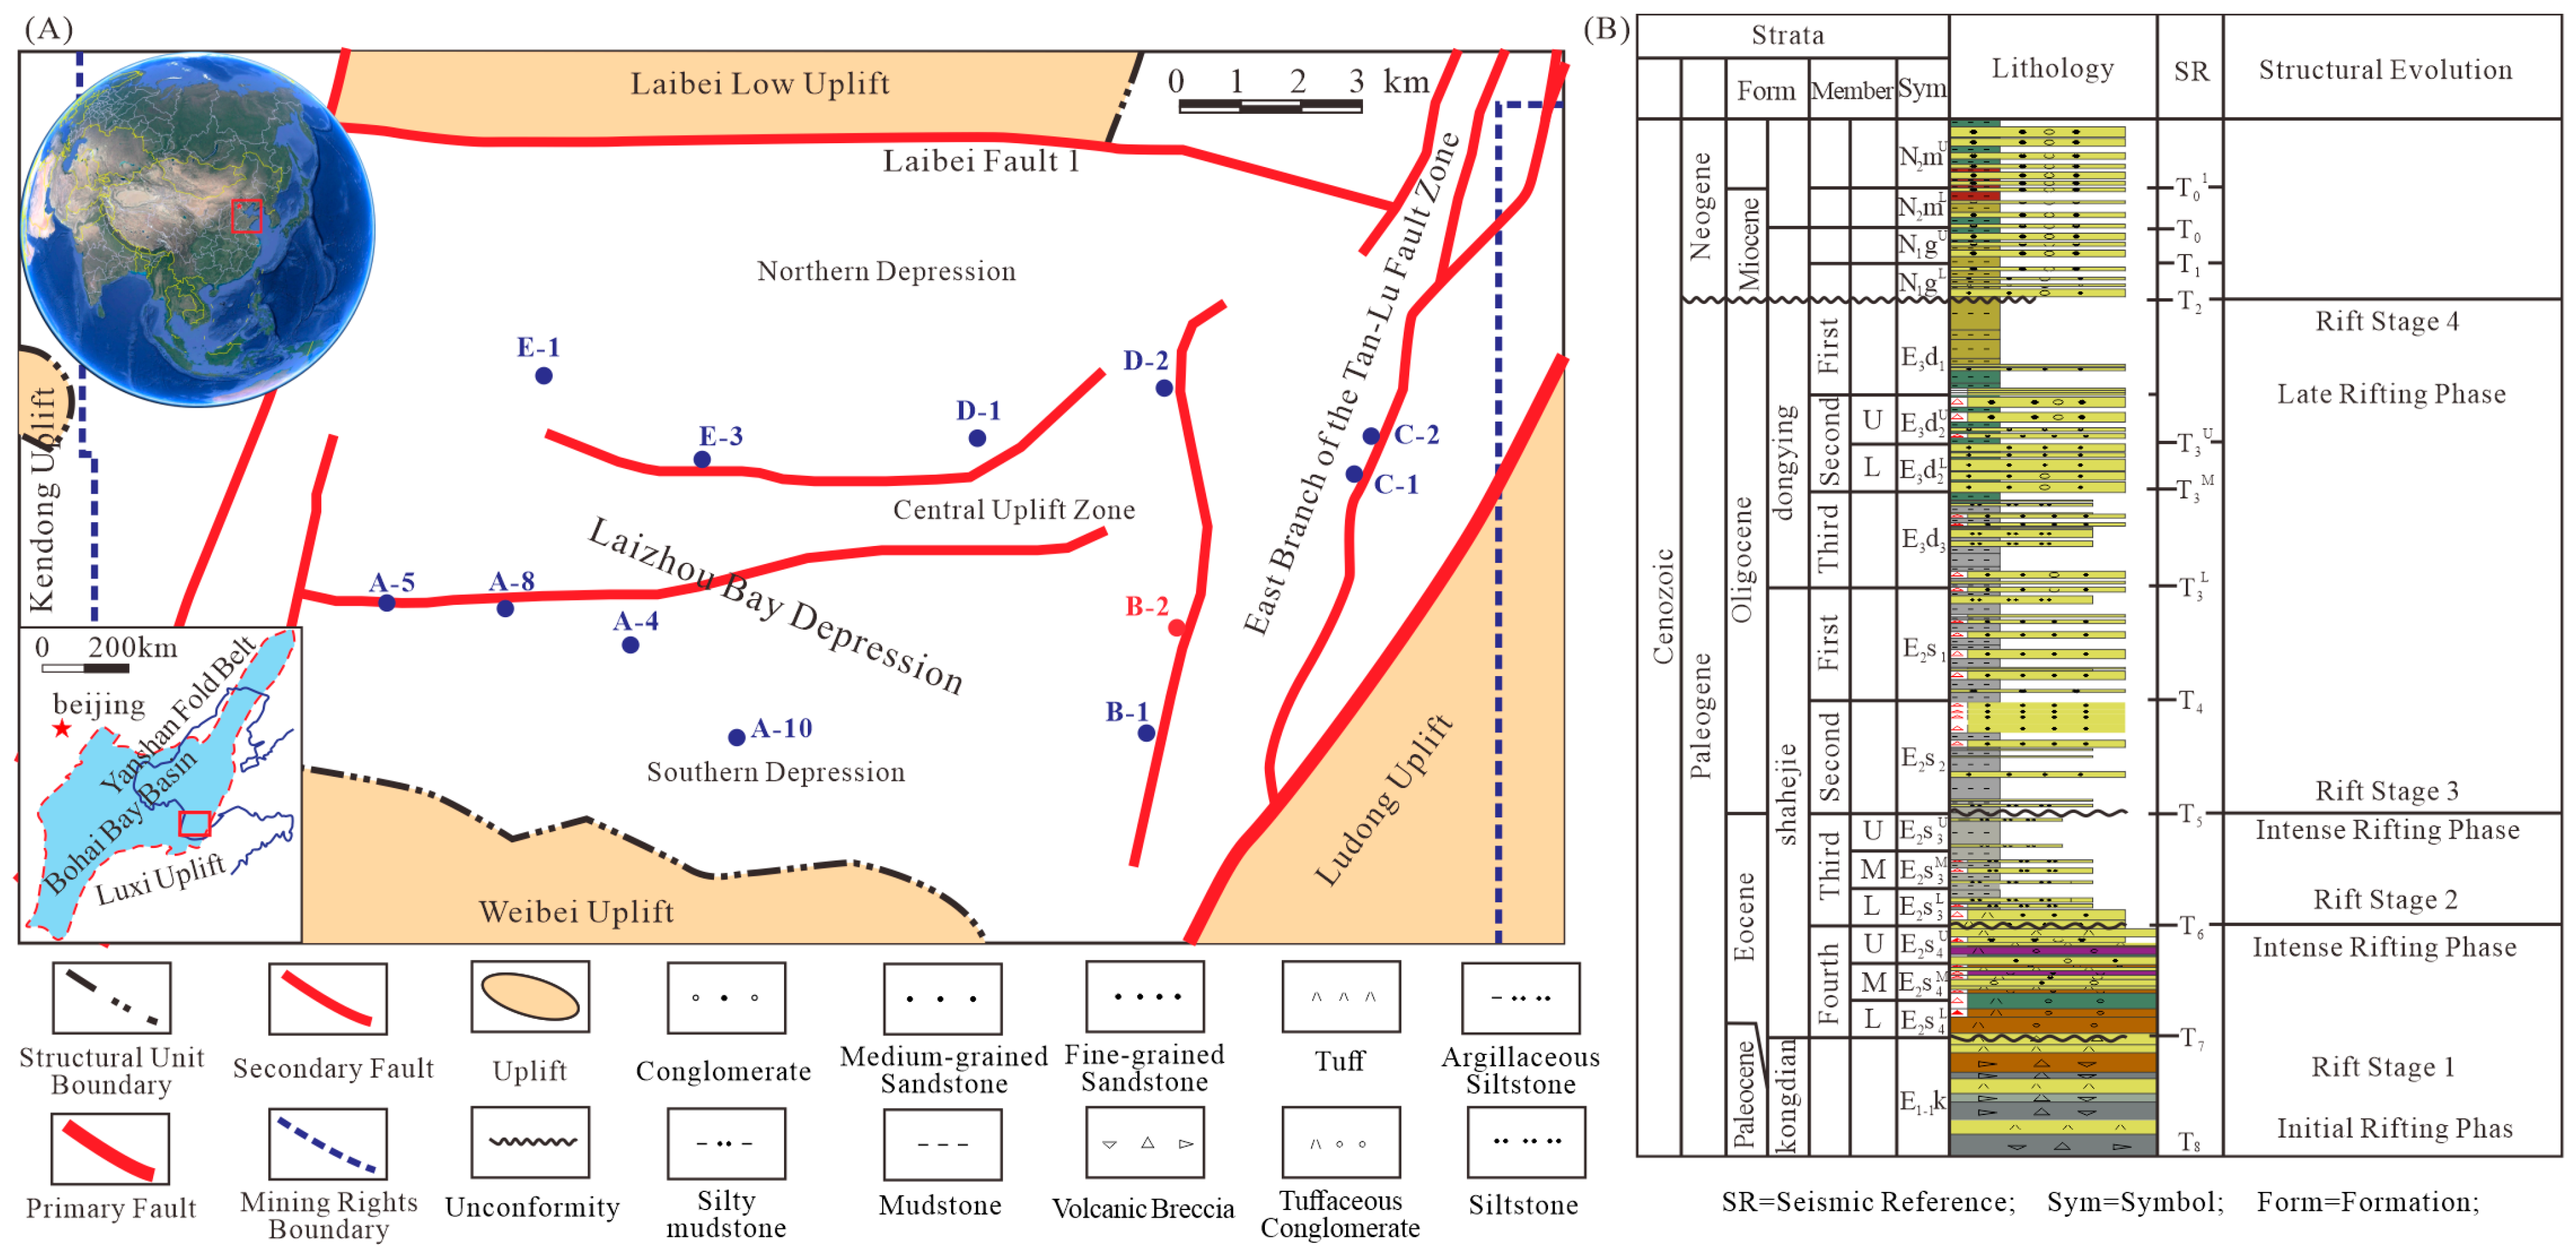
Figure 1. The position of the study area. (A) Structural units of the Laizhou Bay Sag, Bohai Bay Basin. (B) Generalized stratigraphic column of the Bohai Bay Basin.
Jmse 13 02208 g001
Figure 2. Theoretical ETP orbital periodicities. (a) Theoretical orbital parameters for 33–42 Ma based on Laskar (2011) [66]. (b) 2π-MTM spectral analysis of the theoretical orbital periodicities for 33–42 Ma. Le, Lo, E, e, O, and P represent the signals of very long eccentricity, long obliquity, long eccentricity, short eccentricity, obliquity, and precession, respectively.
Jmse 13 02208 g002
Figure 3. Lithostratigraphic and biostratigraphic correlations from well B-2. (a) Lithostratigraphy and lithology. (b) Dominant palynological assemblages. (c) Distribution of key ostracod and charophyte fossils. (d) International chronostratigraphic chart.
Jmse 13 02208 g003
Figure 4. Depth-domain analysis of GR data from well B-2. (a) Lithostratigraphy and lithology. (bd) Original GR data series, LOESS-detrended GR data with a 440 m trend removed, and Gaussian bandpass-filtered cyclic signal (filter center ~67.4 m, bandwidth 0.0134–0.0158). (e) Results of 2π multitaper method (MTM) spectral analysis (top) and evolutionary fast Fourier transform (eFFT) spectrogram (bottom) of the detrended GR series (sliding window: 255 m; step size: 2.2 m).
Jmse 13 02208 g004
Figure 5. COCO and eCOCO analysis results from well B-2. (a) COCO analysis (top) and eCOCO analysis (bottom) for well B-2. Sedimentation rates ranging from 1 to 30 cm/ka were tested at 0.1 cm/ka increments, with 5000 Monte Carlo iterations. (b) Null hypothesis test (top) and evolutionary H0 significance level analysis (bottom). (c) Number of orbital cycle matches (top) and evolutionary orbital match count (bottom) for well B-2.
Jmse 13 02208 g005
Figure 6. Time-domain analysis of GR data from well B-2. (a) 2π multitaper method (MTM) power spectrum of the 405 kyr-tuned GR time series. (b) Evolutionary fast Fourier transform (eFFT) spectrogram of the 405 kyr-tuned GR time series. (c) 405 kyr-tuned GR time series (blue), with Gaussian bandpass-filtered curves highlighting the 405 kyr (red) and 125 kyr (green) eccentricity components. (d) Wavelet power spectrum of the 405 kyr-tuned GR time series for the upper and middle Es3 members. (e) Wavelet power spectrum of the 405 kyr-tuned GR time series for the lower Es3 member.
Jmse 13 02208 g006
Figure 8. Astronomical forcing analysis of sedimentary noise models. (a) ~1.2 Myr Gaussian bandpass-filtered curve of the median ρ1 model; (b) ρ1 model subjected to 2000 Monte Carlo simulations; (c) ~1.2 Myr Gaussian bandpass filter of the median DYNOT model; (d) DYNOT model subjected to 2000 Monte Carlo simulations; (e) 405 kyr Gaussian bandpass-filtered curve of the 405 kyr-tuned GR time series; (f) 405 kyr-tuned GR time series; (g) International chronostratigraphic chart; (h) Lomb-Scargle multitaper spectral analysis of the median DYNOT model; (i) Lomb-Scargle multitaper spectral analysis of the median ρ1 model.
Jmse 13 02208 g008
Figure 9. Integrated comparison of sediment noise models and paleoclimatic events for Es3 Formation in the Laizhouwan Sag. Blue arrows indicate sea-level rise, orange arrows denote sea-level fall, and the orange dashed band marks the duration of the Middle Eocene Climatic Optimum (MECO). (a) Eccentricity solution (33–42 Ma) from the Laskar (2004) [88] astronomical model. (b) 405 kyr Gaussian band-pass filtered curve of the 405 kyr-tuned GR (gamma-ray) time series. (c) ~1.2 Myr Gaussian band-pass filtered curve of the ρ1 model median values. (d) ρ1 model results based on 2000 Monte Carlo simulations. (e) ~1.2 Myr Gaussian band-pass filtered curve of the DYNOT model median values. (f) DYNOT model results based on 2000 Monte Carlo simulations. (g) δ13C record astronomically tuned to 405 kyr cycles. (h) δ18O record astronomically tuned to 405 kyr cycles. (i) Total Organic Carbon (TOC) content and associated geochemical proxies for Es3 Formation. (j) Global sea-level curve. (k) International chronostratigraphic chart. (l) Astronomically forced depositional model for the middle and upper parts of Es3 Formation. (m) Astronomically forced depositional model for the lower part of Es3 Formation.
Jmse 13 02208 g009
Disclaimer/Publisher’s Note: The statements, opinions and data contained in all publications are solely those of the individual author(s) and contributor(s) and not of MDPI and/or the editor(s). MDPI and/or the editor(s) disclaim responsibility for any injury to people or property resulting from any ideas, methods, instructions or products referred to in the content.