Article

MASS-LSVD: A Large-Scale First-View Dataset for Marine Vessel Detection

1
College of Marine Electrical Engineering, Dalian Maritime University, Dalian 116026, China
2
Key Laboratory of Technology and System for Intelligent Ships of Liaoning Province, 1 Linghai Road, Dalian 116026, China
3
Shanghai Ship and Shipping Research Institute Co., Ltd., Shanghai 200135, China
4
Dalian COSCO Shipping Heavy Industry Co., Ltd., Shanghai 200135, China
5
Navigation College, Dalian Maritime University, Dalian 116026, China
*
Author to whom correspondence should be addressed.
J. Mar. Sci. Eng. 2025, 13(11), 2201; https://doi.org/10.3390/jmse13112201
Submission received: 30 September 2025 / Revised: 16 October 2025 / Accepted: 18 October 2025 / Published: 19 November 2025
(This article belongs to the Section Ocean Engineering)

Abstract

In this paper, we release a new large-scale dataset containing multiple categories of ships and floating objects at sea, which we call MASS-LSVD. It is used to train and validate target detection algorithms and future large models for ship autopiloting. The dataset was captured by a visible light camera installed aboard the world’s first intelligent research, teaching, and training ship, “Xinhongzhuan”. This MASS (maritime autonomous surface ship) was operated by Dalian Maritime University, China. We have collected more than 4000 h of video of the “Xinhongzhuan” vessel’s voyage in the Bohai Sea and other areas, which are carefully classified and filtered to cover as much as possible the various types of sample data in the marine environment, such as light intensity, weather, hull shading, data from ocean-going voyages, entering and exiting ports, etc. The dataset contains 64,263 1K-resolution images captured from video footage, covering four main ship types: Fishing Boat, Bulk Carrier, Cruise Ship, Container ship, and an ‘Other Ships’ class, for vessels that cannot be specifically classified. The dataset currently contains 64,263 pairs of 1K-resolution images covering four common ship types (fishing boat, bulk carrier, cruise ship, container, and other ship, where no specific ship type can be determined). All the images have been labeled with high-precision manual bounding boxes. In this paper, the MASS-LSVD dataset is used as the basis for training various target detection algorithms and comparing them with other datasets, which compensates for the lack of first-view images in the vessel target detection dataset, and MASS-LSVD is expected to be used to facilitate the research and application of autonomous ship navigation models in the framework of computer vision.

1. Introduction

Maritime target detection, as a core technology for maritime surveillance and monitoring, plays a key role in both the civil and defense sectors. On the civil side, this technology is essential for traffic management, monitoring shipping logistics, enforcing environmental regulations, and combating illegal activities. On the defense side, advanced surveillance systems enhance coastal and off-shore security by obtaining information on the precise location, size, course, and speed of targets and effectively identifying potential territorial sea violations and suspicious maneuvers.
However, traditional maritime surveillance largely relies on continuous manual observation, which is inefficient, resource-intensive, and prone to human error. Especially in the dynamic and ever-changing maritime environment, prolonged screen monitoring leads to fatigue, significantly reducing detection accuracy and causing critical information to be missed. Although computer-assisted multimodal maritime detection methods have greatly reduced human labor, early paradigms still depend on handcrafted features. Whether they are based on edges and corners [1], shape and texture [2], or spectral characteristics [3], these methods perform stably under ideal sea conditions. However, under complex interferences such as waves, clouds, rain, fog, and reflections, the robustness of the extracted low-level features is insufficient [4]. Moreover, manual feature selection is time-consuming and highly dependent on domain-specific expertise and dataset characteristics.
In addition to serving as a benchmark for maritime object detection, the MASS-LSVD dataset provides a crucial perceptual foundation for implementing the International Regulations for Preventing Collisions at Sea (COLREG), particularly Rule 5 (Look-Out), Rule 7 (Risk of Collision Assessment), and Rule 8 (Action to Avoid Collision).
According to Rule 5, every vessel must maintain a proper look-out using sight and hearing. The first-person perspective of MASS-LSVD directly supports this requirement by enabling autonomous systems to simulate continuous look-out behavior through onboard vision. For Rule 7, which concerns assessing the risk of collision, MASS-LSVD provides temporally continuous and multi-environmental imagery that can be integrated into data-driven collision risk inference frameworks. By combining visual detection results with relative motion estimation, autonomous vessels can evaluate potential collision threats in real time. For Rule 8, which mandates effective and timely action to avoid collision, the detection models trained on MASS-LSVD can be coupled with decision-making modules compliant with COLREG. As demonstrated in “Collision risk inference system for maritime autonomous surface ships using COLREG rules compliant collision avoidance”, integrating our perception framework with rule-based collision avoidance strategies can bridge visual perception and autonomous maneuvering, forming a complete COLREG-compliant perception–decision–action pipeline.
Consequently, MASS-LSVD not only advances maritime object detection research but also provides an essential visual basis for intelligent ship navigation systems that operate in accordance with international maritime collision avoidance standards.
In recent years, convolutional neural networks (CNNs) have achieved breakthrough progress in ship object detection [5,6,7,8] thanks to their powerful ability to automatically learn multi-layer, highly discriminative visual features. As a data-driven paradigm, however, the performance and generalization ability of CNNs heavily depend on large-scale, high-quality training data. Although general-purpose datasets like ImageNet-D [9], PASCAL VOC [10] and COCO [11] have driven overall advances in object detection, they were not constructed specifically for maritime environments or ship characteristics, and their performance in complex maritime scenes is often unsatisfactory. By contrast, specialized datasets have emerged and accelerated development in specific domains, such as face recognition [12,13], pedestrian detection [14,15], and underwater object detection [16,17], but a large-scale public dataset specifically for maritime ship detection remains extremely scarce. This shortage has, to some extent, hindered further innovation and maturity of algorithms in this field.
To address this gap, we propose MASS-LSVD, a new large-scale dataset containing multiple classes of ships and floating objects. The dataset covers four major ship types: fishing boat, bulk carrier, cruise ship, container ship, and other ships of indeterminate type, encompassing 64,263 1K-resolution images. Every image in the MASS-LSVD dataset is precisely annotated with object labels and bounding boxes. We collected over 4000 h of navigation video of the vessel Xinhongzhuan in the Bohai Sea and other waters; these videos were carefully categorized and filtered to cover as many types of sample data in marine environments as possible (e.g., illumination intensity, weather, ship occlusion, deep-sea navigation, port entry, and exit). To further diversify the dataset and include all possible scenarios, the selected images cover various characteristics, including different ship types, sizes, viewpoints, lighting conditions, and degrees of occlusion in complex environments. Notably, MASS-LSVD is captured entirely from a ship’s first-person perspective, filling the gap of missing first-person views in existing ship detection datasets.
We compare the MASS-LSVD dataset with existing ship object detection datasets, including VAIS [18], MarDCT [19], IPATCH [20], SeaShips [21], and SMD [22], see Table 1.
To evaluate the use of the MASS-LSVD dataset, we conducted experiments using six baseline detectors on MASS-LSVD. Based on the experimental results, we summarize the advantages and disadvantages of each detector. And regarding cross-over experiments, the experiments show that MASS-LSVD has a better effect. Section 2 describes the ship dataset and related work on target detection algorithms. Section 3 describes the acquisition and annotation process of ship images, and the diversity analysis also describes the detailed dataset design and analyzes the statistical data of the newly generated dataset. The experimental results of the six baseline detection algorithms on our dataset are given in Section 4.

2. Relevant Work

2.1. Maritime Target Detection Datasets

In maritime object detection, high-quality specialized datasets are the cornerstone for advancing deep learning models. Existing maritime datasets each have their own characteristics and limitations. The VAIS dataset [18] contains over 10,000 pairs of visible and infrared images, covering pitch, roll, and yaw six-axis attitudes and including various vessel types such as medium-sized ships, tugboats, and small boats. These images are large in scale and diverse, satisfying maritime image recognition needs; they are all collected from real ocean scenes under a variety of complex environmental and weather conditions. Each image in VAIS provides precise annotations, including vessel type, location, and size. The MARVEL dataset [19] was collected from a community website; its data include ship identity, type, photo category, year built, etc., and targets are subdivided into 29 ship categories. However, both VAIS and MARVEL are limited by the number of bounding boxes, which severely affects their usefulness for training deep learning models.
The IPATCH dataset [20] was collected in April 2015 off the Brest coast of France, containing 14 sets of multi-sensor recordings. The original project aimed to provide non-military protection measures for commercial ships against piracy through advanced sensors and data fusion to provide threat assessments, but it was not constructed as a general dataset specifically for maritime object detection.
Targets are available in visible and near-infrared spectra. The SeaShips dataset comprises 31,455 annotated images divided into six ship types: ore carrier, bulk carrier, general cargo, container ship, fishing boat, and passenger ship. Although this taxonomy covers the most common ship types in maritime surveillance, it still excludes other important categories such as oil tankers, barges, and military vessels. Moreover, the SeaShips dataset contains relatively few passenger ship samples, which may affect model performance on that class.

2.2. Maritime Target Detection Model

Maritime target detection has received extensive attention in recent years. Unlike other scenes, the complex sea conditions and the uncertainty of target sizes mean that traditional methods, constrained by handcrafted features, struggle to adapt to the complex ocean surface environment and varying object shapes [23,24,25]. Maritime visual images are better suited for deep learning methods to perform multi-scale object detection against complex ocean backgrounds.
For example, Liu et al. [26] developed the reverse depthwise separable convolution (RDSC) and integrated it into the YOLOv4 backbone and feature fusion network, proposing a novel YOLOv4-based maritime surface target detection algorithm that significantly improved detection speed and accuracy. Considering limited computational resources, Yang et al. [27] used YOLOv5 as a baseline, employed an improved Shuffle Net v2 for feature extraction, and optimized the feature fusion module, significantly reducing computational complexity while improving accuracy. To address the uncertainty of target sizes, Sun et al. proposed a YOLO-based ship detection model tailored to the characteristics of numerous large-sized objects in ocean surface images. To improve ship detection performance in complex backgrounds, Guo et al. [28] designed a CenterNet-based detector with a feature pyramid fusion module and a head enhancement module. Zhang et al. [29] proposed an efficient cross-layer feature aggregation network (CFA-Net) for drone images, achieving fast and accurate object detection and classification. In the field of remote sensing image multi-scale target detection, a persistent challenge has been the insufficient use of target feature information and low accuracy for multi-scale objects. To address this, Zhang et al. [30] proposed a semantic fusion and scale-adaptive algorithm (SFSA-Net) for remote sensing image object detection.
In summary, although substantial progress has been made in advancing object detection on ocean surface imagery, these methods all require high-quality training data as support. It is generally believed that the recent success of detection models is a product of the availability of larger-scale training data. Therefore, we are committed to constructing a new maritime object detection dataset of SMD level to promote the development of maritime object detection. In contrast, the Singapore Maritime Dataset (SMD) [22] and the SeaShips dataset [21] provide richer annotated image resources with complete bounding box information. The SMD dataset contains 240,842 object labels from 81 videos, covering 10 different ship categories. Despite its considerable size, SMD has several limitations: first, many target objects occupy a small proportion of the image, meaning the surrounding background may interfere with training; second, there is an imbalance among the 10 object categories, with some categories having very few samples; and third, there are only 534 isolated objects.

3. Data Acquisition

We collected first-person-view images for the MASS-LSVD dataset using onboard monitoring video cameras on the vessel Xinhongzhuan. Two types of sensing equipment were installed on the ship: an infrared thermal imager and a high-performance dual-spectrum camera. These cameras recorded the ship’s entire voyage, including leaving port, entering port, and deep-sea navigation. The data collection covered all of China’s five maritime domains—the Bohai Sea, Yellow Sea, East China Sea, and South China Sea—over a total coastal navigation distance of approximately 9000 km. We segmented the collected navigation videos and extracted original images to form the MASS-LSVD dataset.

3.1. Video Data Acquisition

We installed an infrared thermal imager and an HD dual-spectrum camera near the ship’s main mast, equipped with a gyro-stabilization platform and vibration-damping mount to reduce the impact of ship sway on image quality. The device integrates thermal imaging and visible-light recognition functions, providing up to 4× optical thermal zoom and 30× high-definition color zoom. The dual-spectrum camera uses a double-layer stacked structure, mounted in front of the main mast. It integrates six 400W fixed-focus visible-light lenses and six 1280 × 1024 fixed-focus thermal imaging sensors, which are stitched together to form a 360-degree panoramic visible + infrared multispectral imaging system, supporting all-weather (day/night) imaging. This deployment ensures full horizontal panorama coverage, helping to obtain ship target information from different perspectives.
The vessel Xinhongzhuan is the world’s first dual-purpose ship integrating intelligent research with teaching and practical training. Measuring 69.83 m in length overall, it is designed for a maximum speed of 18 knots and features all-electric propulsion with intelligent navigation capabilities. The vessel is equipped with multiple sets of round-the-clock sensing equipment. Rotating the gimbal and adjusting zoom, each camera can collect video at 30 frames per second, and data are stored to the onboard data center hourly. For example, on 19 November 2024, the Xinhongzhuan arrived at Victoria Harbour, Hong Kong, covering over 4000 nautical miles and collecting about 1.5 million images. Our collection plan covered multiple environmental conditions, including different times of day (daytime, dusk, dawn) and weather conditions (clear, overcast, foggy), as well as near-port, off-shore, and complex current areas, ensuring environmental diversity in the data. Figure 1 shows our navigation vessels and sensing modules.

3.2. Data Collection Challenges

The quality of the dataset directly affects the performance of deep learning algorithms, and maritime data collection is constrained by many factors. Existing datasets have endeavored to mitigate related issues, but their data diversity remains limited. Therefore, in our dataset, we emphasize the following three aspects:
  • First-person perspective acquisition: Our dataset captures video from the ship’s bridge or bow to obtain first-person perspective images of ships. Unlike land-based or satellite imaging (as in SeaShips, SMD), shipborne first-person perspective collection is more aligned with the navigator’s visual perception, with stronger view-dependent relevance and realism. This provides training samples that are closer to real conditions for developing autonomous ship vision systems.
  • All-weather, all-hour collection: Data collection spans daytime, dusk, and night, with different weather conditions including clear, overcast, and haze, and it covers complex navigation environments. This provides a rich training basis for target detection under adverse conditions such as night navigation and fog navigation, enhancing model generalization under extreme conditions. It also fills the gap left by existing public datasets, which are mostly concentrated in daytime and calm seas, and significantly improves model robustness in real sea conditions.
  • Multimodal data collection: We simultaneously collected infrared images corresponding to the same times, providing a training data foundation for vision-based unmanned surface vessel (USV) systems. This further builds a multimodal perception capability and provides usable data standards for algorithm development, engineering practice, and industrial applications in intelligent shipborne systems.

3.3. Dataset Diversity

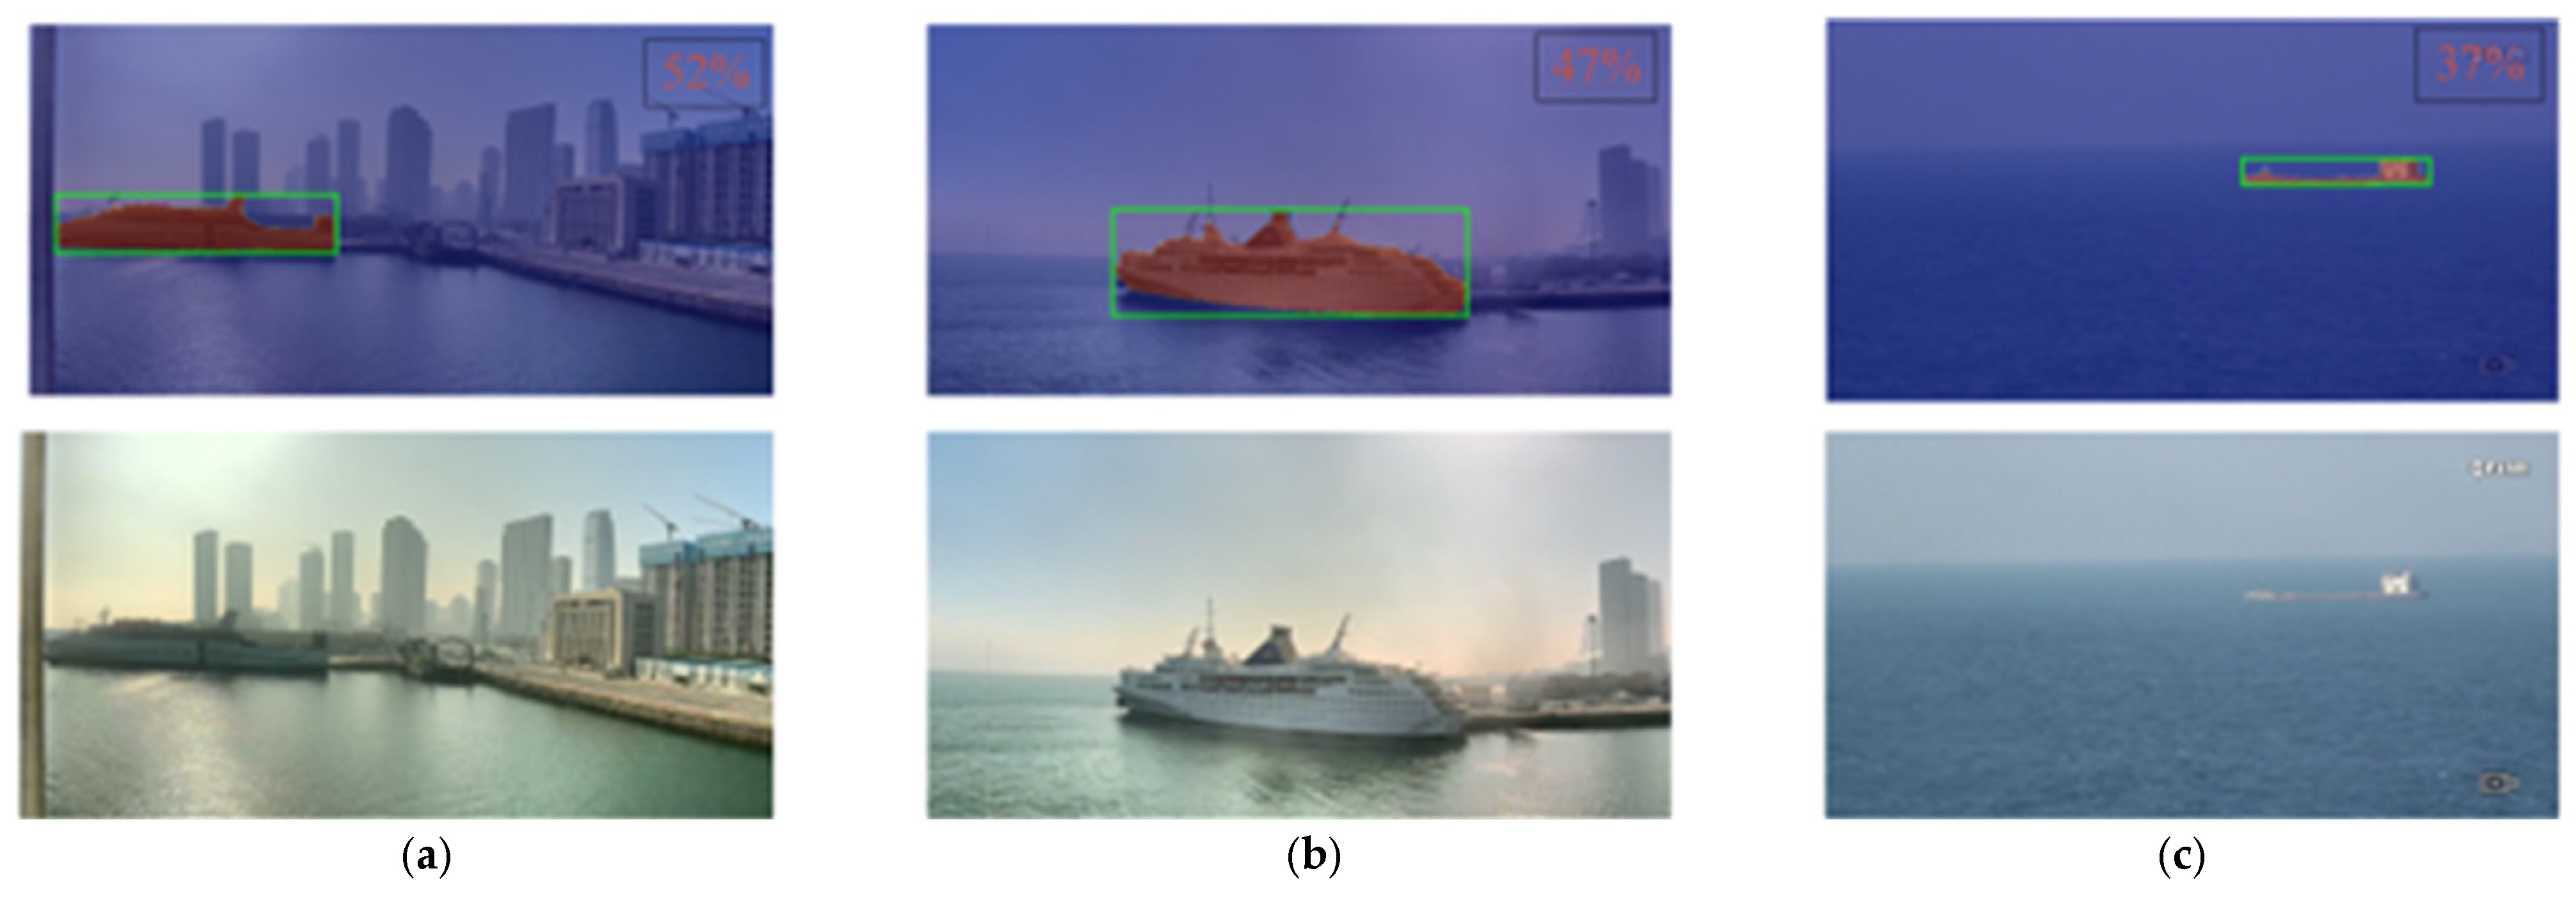
Different datasets often yield models with poor generalization, due to significant differences in ocean conditions in different regions, background clutter affecting detection, and irregular ship shapes—leading to bounding boxes that often include much background information. As shown in Figure 2, especially for small distant targets, background pixels in the bounding box may exceed half of the box. Existing methods have analyzed the pixel proportions of background and target via set segmentation, but background information is still easily misidentified as target features by models, reducing detection accuracy. Although some studies attempt to augment datasets through image enhancement, this often introduces many false positives. Because real samples are difficult to obtain, we ensure data diversity in our dataset through the following approaches:
  • First-person high-definition capture: All MASS-LSVD images were captured using the shipborne high-definition visible-light camera on Dalian Maritime University’s Xinhongzhuan. Unlike land-based or satellite datasets, shipborne first-person perspective captures dynamic features such as pitch, heading changes, and occlusions as the ship maneuvers. This not only trains models to more effectively recognize ships from the navigation viewpoint but also provides directly relevant training data for future autonomous ship vision systems.
  • Extensive coverage of conditions: We collected over 4000 h of Xinhongzhuan navigation video in the Bohai Sea and other waters, covering multiple weather conditions (sunny, rainy, nighttime, haze) and various ship states (entering/exiting port, off-shore navigation, etc.),as can be seen from Figure 3. Ultimately, we selected 64,263 clear 1K-resolution images. This all-hours, all-weather sampling strategy ensures that the dataset has a high degree of generalization across visibility, illumination changes, and sea state complexity.
  • Target-focused framing: We used the pan-tilt system to keep the target ship as centered as possible in the image and adjusted the focus (manually or automatically) to obtain clearer images of the targets.
  • Multimodal sample synchronization: We also collected corresponding infrared images at the same moments, providing training samples for vision-based USV systems. This further builds a multimodal perception capability and supplies the data needed for algorithm support and engineering practice in intelligent shipborne systems.

3.4. Annotation

We annotated the collected images manually, following the standards below to improve annotation accuracy and effectiveness.
  • We categorized the collected video into two scenarios: in-transit and near-port. For in-transit video, we extracted one image every 600 frames (about 20 s). For near-port (docked) video, where scenes change more slowly, we extracted one image every 1500 frames (about 50 s). After processing, we obtained 576,324 raw PNG images.
  • The raw images were extracted from the video, many of which contain no ships, or the ship position and orientation in adjacent frames changed very little, producing a large number of redundant images. To reduce manual annotation workload, we filtered the raw images and ultimately retained 64,263 images.
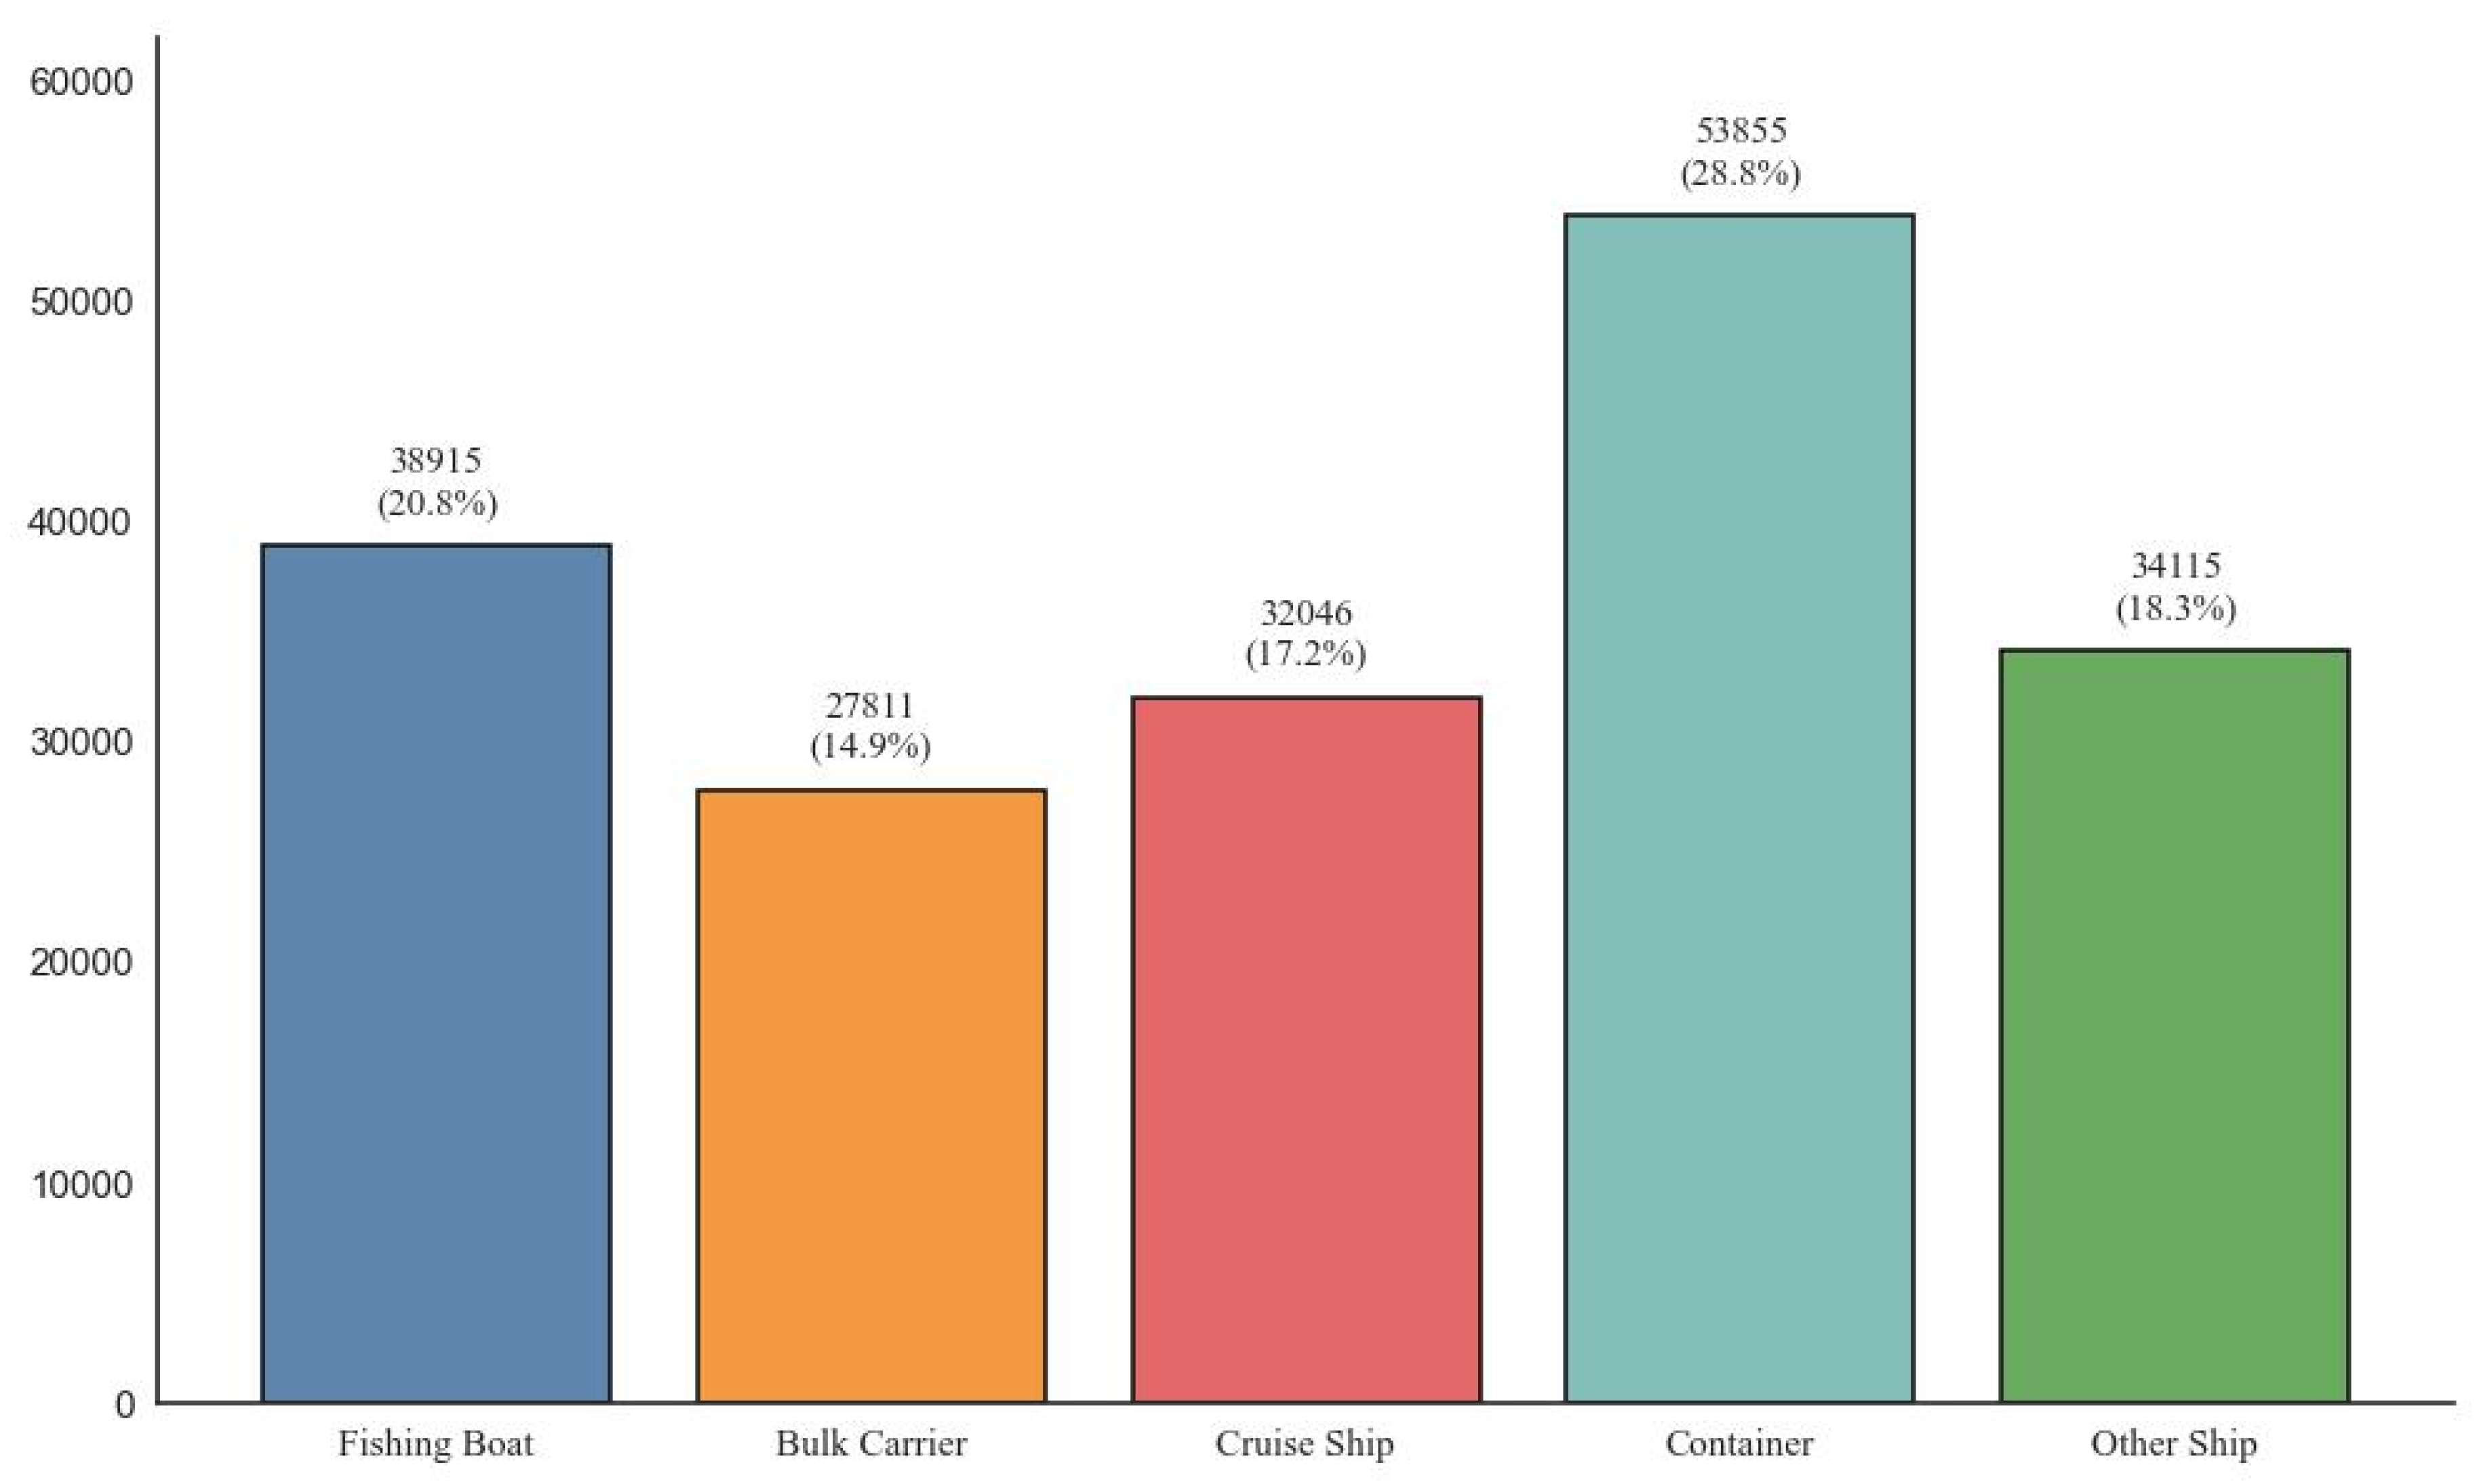
  • For each retained image, we manually drew bounding boxes around vessels using the label annotation tool. Each image underwent double-blind cross-annotation to ensure the accuracy of every annotated box, with all annotation data being uniformly saved as text files compliant with the COCO dataset format. Upon completion, a total of 186,742 object bounding boxes were obtained. The dataset was then split into training and testing sets at an 8:2 ratio, maintaining the same proportion of annotated boxes across both sets wherever possible. All steps described above were performed manually. Figure 4 illustrates the number and proportion of bounding boxes for each vessel type in the dataset.

4. Experiments on the MASS-LSVD Dataset

To verify the adaptability and effectiveness of the constructed MASS-LSVD ship detection dataset under different detection frameworks, and to provide authoritative, systematic benchmark evaluation results for future research, we selected six representative advanced object detection algorithms for training and testing. These algorithms cover the current mainstream one-stage detectors as well as Transformer-based end-to-end detectors. We also conducted generalization experiments across different datasets.
Specifically, we retrained the following six models on MASS-LSVD: YOLOv5 [31], YOLOv8 [2], YOLOv10 [32], YOLOv11 [33], YOLOv12 [34], and RT-DETR [35]. To further highlight the specialization of MASS-LSVD, we also compared the detection performance of MASS-LSVD with that of two widely-used ship detection datasets (SeaShips and SMD), emphasizing the practical application value and model transferability of our dataset.

4.1. Ship Detection Algorithms

These are representative one-stage detection architectures. Thanks to their end-to-end structure and efficient inference, they are widely used in industrial scenarios. They incorporate mechanisms such as Mosaic data augmentation [36] and Ciou loss function, and automatic anchor generation, significantly improving detection accuracy while maintaining real-time performance. YOLOv8 follows the overall framework of YOLOv5 and introduces a new C2f module in its feature network. This module enhances feature expression diversity via split paths and cross-stage connections, increasing perceptual capability while controling model complexity. YOLOv8 also integrates advanced data augmentation methods such as MixUp [37] and CopyPaste [38], further improving the model’s generalization performance.
The core goal of YOLOv10 is to significantly improve end-to-end inference speed and model deployment efficiency while maintaining high detection accuracy. YOLOv10 achieves true end-to-end training for the first time, eliminating cumbersome post-processing steps such as non-maximum suppression (NMS), resulting in a more concise and efficient inference process. The model introduces a flexible omni-dynamic head (OD-Head) detection head, which dynamically adjusts the depth and width of the structure according to the task, achieving a balance between accuracy and speed. In addition, its label assignment strategy is borrowed from the Hungarian matching mechanism in the DETR series, which completely frees the anchor-based structure from the dependence on a priori frame design.
YOLOv11 is deeply structured and optimized on the basis of YOLOv8 and introduces some Transformer mechanisms. The model integrates a cross-layer attention module in the backbone network to enhance the long-range dependency and global context modeling capabilities; meanwhile, by streamlining the network structure and optimizing the design of the loss function, the model achieves better performance density on different hardware platforms. YOLOv11 continues to adopt the anchor-free framework and incorporates an improved confidence modeling strategy in the prediction phase, which enables the model to output more robust bounding box predictions without complicated post-processing. YOLOv11 employs local attention and dynamic convolution modules in the feature fusion stage, which improves the model’s adaptive capability in detecting both small and dense targets.
YOLOv12 further improves the comprehensive performance of the model in terms of accuracy, convergence speed, and deployment efficiency. Structurally, YOLOv12 retains the efficient attention mechanism of YOLOv11, and adds the RepOptimizer optimizer and EMA-BN (exponential sliding mean batch normalization) strategy, which effectively improves the model stability and convergence efficiency in the training phase. Meanwhile, YOLOv12 introduces the multi-scale attention mechanism in the feature fusion module, which makes the model more perceptive in the small target detection task, and it continues to maintain the anchor-free and end-to-end design, which reduces the inference delay and improves the ease of deployment.
RT-DETR (real-time detection Transformer) is a target detector based on the Transformer architecture. Compared with traditional anchor-based or two-stage detectors, RT-DETR adopts a unified Transformer encoding–decoding structure, which uses the global attention mechanism to model image features and directly predicts the target location and category, achieving a fully end-to-end detection process. The model introduces a lightweight decoder in the structure, which significantly reduces the inference latency of the DETR family; meanwhile, an improved Hungarian matching strategy is used for label assignment, which effectively improves the training efficiency and stability.
Table 2 summarizes the differences between these algorithms. The above six algorithms have their own advantages in terms of structural design, label allocation mechanism, training paradigm, and deployment performance and constitute representatives of the mainstream model systems in the current target detection field. Through systematic evaluation on the MASS-LSVD dataset, this paper will deeply analyze their performance differences, advantages, and challenges in multi-scale ship detection tasks and then provide technical references for the design and algorithmic research of the subsequent ship automatic identification system.

4.2. Evaluation Protocol

To evaluate the performance of ship detection models on the given test set, we use a series of common quantitative metrics. The evaluation follows the standard scheme of PASCAL VOC. Below, we briefly describe the metrics.
Intersection over union (IoU) measures the overlap between two bounding boxes. It is defined as the ratio of the area of their intersection to the area of their union, quantifying the consistency between a predicted box and the ground-truth box:
I o U = B g t B p B g t B p
where B g t is the area of the ground-truth box and B p is the area of the predicted box.
By setting an overlap threshold, a detector decides whether a candidate box is considered a correct detection or background based on the iou.
By setting an overlap threshold, the detector will determine whether the candidate box belongs to the background region based on Equation (2):
c l a s s = 0 , i f   I o U < t h r e s h o l d i , i f   I o U > t h r e s h o l d
Under a given iou threshold, two common metrics in object detection are recall and precision. Recall is the ratio of correctly detected target boxes to the total number of ground-truth boxes, while precision is the ratio of correctly detected target boxes to the total number of boxes predicted by the model. For each object class, a precision–recall (P–R) curve can be plotted over different precision and recall values. The average precision (AP) is defined as the area under the P–R curve, providing a comprehensive measure of a model’s accuracy and stability, as shown in Equation (3):
A P = 0 1 P ( R ) d R
Each class i has a corresponding AP value A P i . The m A P metric is the mean of these AP values across all classes:
m A P = 1 n i = 1 * A P i
where n is the number of classes in the dataset.
In addition to detection accuracy, we compare the runtime speed of each detector. FPS indicates the number of imaged frames the detector can process per second, and it is an important indicator of detection speed. We use this metric to evaluate the inference efficiency of each model.

4.3. Analysis of Experimental Results

In all model training, we uniformly resized inputs to 640 × 640 pixels. For the YOLO series models, we used SGD (momentum = 0.937) as the optimizer; for RT-DETR, we used Adam W [39] (β1 = 0.9, β2 = 0.999) as the optimizer. The initial learning rate was set to 0.01, with a cosine decay learning rate schedule. The batch size was fixed at 128, and all models were trained for 300 epochs until convergence. During training, we monitored the validation loss to avoid overfitting. All experiments were conducted using PyTorch and accelerated on two Nvidia A40 GPUs.
Table 3 lists the mAP values of the six baseline detection models on different ship categories and the overall average mAP, as well as their real-time inference speeds (FPS) on the Nvidia A40 GPU.
We observe significant differences among the models in different ship categories and overall performance. From the category performance, we see that the “fishing boat” class is the most challenging. All models achieve lower mAP on fishing boats compared with bulk carrier, cruise ship, container, and other ship. For example, YOLOv5 attains an mAP of only 0.713 on fishing boats, while YOLOv12 reaches 0.778—still noticeably lower than its performance on other classes (e.g., 0.938 on other ship, 0.923 on cruise ship). This phenomenon may stem from class imbalance and appearance differences: the number of fishing boat samples is usually much smaller than that of bulk carriers or container ships, and fishing boats are often smaller, more varied in shape, and easily confused with sea textures. As a result, the fishing boat samples are underrepresented during training, making them prone to overfitting and poor generalization [40].
Looking at overall performance, YOLOv12 achieves the highest average mAP of 0.889 across the five ship classes, far exceeding RT-DETR and YOLOv5. YOLOv12’s advantage is not only in its higher mean mAP, but also in its more consistent performance across classes, balancing the trade-off between hard-to-detect and easy-to-detect categories. Although YOLOv10 comes close to YOLOv12 on the fishing boat class (mAP 0.774), it is slightly lower on container ships, resulting in a slightly lower overall mAP. YOLOv8 and YOLOv11 perform well on the cruise ship and other ship categories, but their precision on bulk carrier and fishing boat is slightly lower, indicating that these models have some difficulty detecting small objects or classes with scarce samples. Additionally, the dataset may contain near-shore and off-shore scenes. In near-shore scenarios, background clutter such as docks and buildings can interfere with the model’s ability to distinguish ships from background, which may explain why two-stage detectors like RT-DETR perform poorly in these scenes.
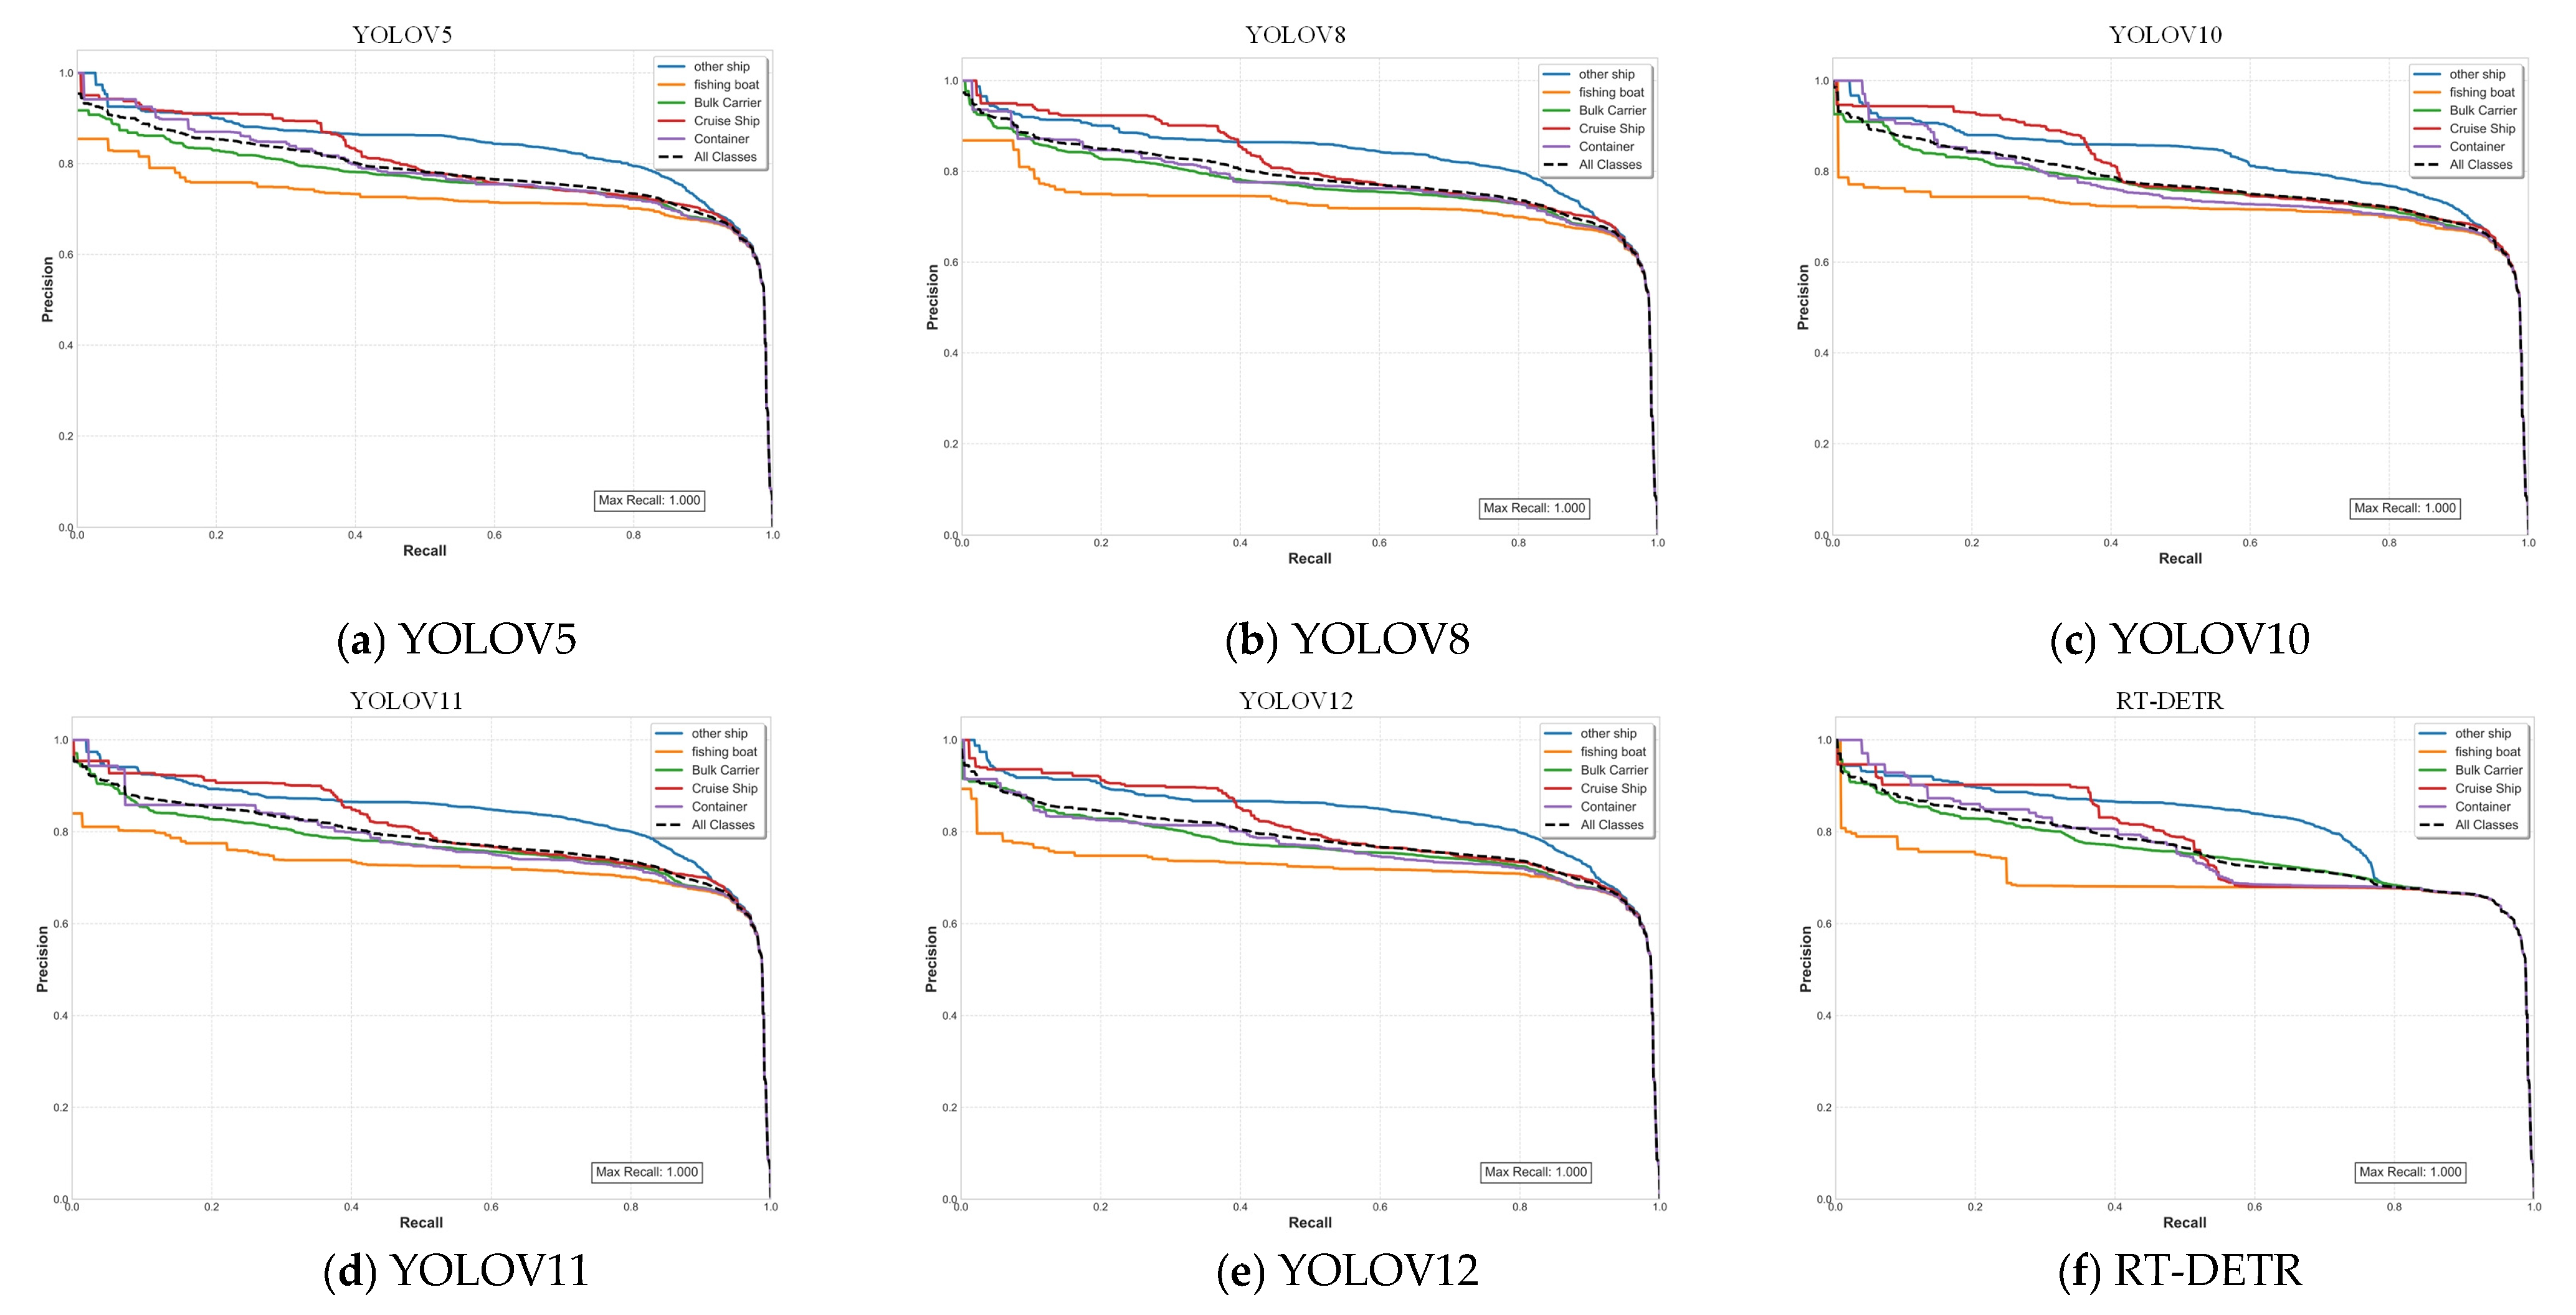
Figure 5 shows the precision–recall (P–R) curve performance of the six target detection models in each category and overall, which is used to further evaluate the precision stability and detection capability of each model under different recall rates. From the figure, it can be seen that the different models all exhibit a high level of precision in general and can maintain a good detection capability when the recall rate is close to 1.0. Specifically, in terms of overall detection performance (all classes), YOLOv12 and YOLOv8 perform relatively better, with smoother P–R curves and higher precision in high recall intervals, which indicates that they have better balance and generalization ability, followed by YOLOv11 and YOLOv10, whose precision in high recall intervals is slightly lower than that of the previous two models but with a stable trend overall. YOLOv5 performs moderately well, while the P–R curve of RT-DETR is significantly lower than that of the YOLO series models, and the decrease in precision is more significant in the high recall region, which indicates that it is not robust enough to difficult targets.
In terms of different categories, “Other Ship” and “Cruise Ship” generally have higher precision, and the P–R curve increases and fluctuates less; meanwhile, “Bulk Carrier” and “Fishing Boat” have higher precision, and the P–R curve increases and fluctuates less. The “bulk carrier” and “fishing boat” categories show a significant decrease in precision under high recall, suggesting that there are still some challenges in the detection of these categories.
Overall, YOLOv12 and YOLOv8 demonstrate superior overall performance and category balance on the P–R curve. Meanwhile, the higher recall models YOLOv10 and YOLOv11 remain well suited for large-scale object recognition tasks, further validating their exceptional detection accuracy and stability in practical object detection applications.
Figure 6 shows the trend of mAP@0.5 and mAP@0.5–0.95 with epochs during the training process of different target detection models. From the figure, it can be clearly observed that the performance of each model improves rapidly at the initial training stage and stabilizes after about 200–250 epochs, indicating that the training has sufficiently converged. Under the mAP@0.5 metric (right figure), YOLOv12 reaches the highest peak, and its final mAP@0.5 is higher than the other versions, which shows the optimal coarse-grained target detection ability; it is followed by YOLOv11, YOLOv8, and RT-DETR, which have similar performances, while YOLOv5 is the second most stable, and YOLOv10 lags behind, with a slow convergence and high performance for RT-DETR. The highest value of mAP@0.5 is also lower than the other algorithms. In the more stringent mAP@0.5:0.95 metric, YOLOv8 achieves the best performance, with its final mAP@0.5:0.95 reaching about 0.58, ahead of YOLOv11 and YOLOv12, reflecting its better localization accuracy and generalization ability under higher iou thresholds than the latter; RT-DETR also performs poorly, with an even bigger gap than the YOLO series. It is worth noting that YOLOv12 is slightly inferior to YOLOv8 under high iou conditions but still has an advantage in detection recall (as reflected by mAP@0.5), indicating that it has improved its overall detection capability through the introduction of the attention-centric architecture; meanwhile, YOLOv8 enhances multi-scale feature fusion at high iou conditions due to the introduction of the C2f module, thus improving its overall detection capability at high iou conditions. YOLOv8, on the other hand, has enhanced multi-scale feature fusion with the introduction of the C2f module, thus taking the lead in the high accuracy index. On the whole, YOLOv12 has the best performance in coarse-grained detection (mAP@0.5), which is suitable for applications with high tolerance of missed targets, while YOLOv8 has a more balanced performance in high accuracy conditions (mAP@0.5∶0.95), which is suitable for tasks requiring higher localization accuracy, and YOLOv11 shows a stable performance between the two metrics but does not outperform the former two; RT-DETR has the best performance in the high accuracy metric. The training speed and performance of RT-DETR is lower than that of YOLO series models.
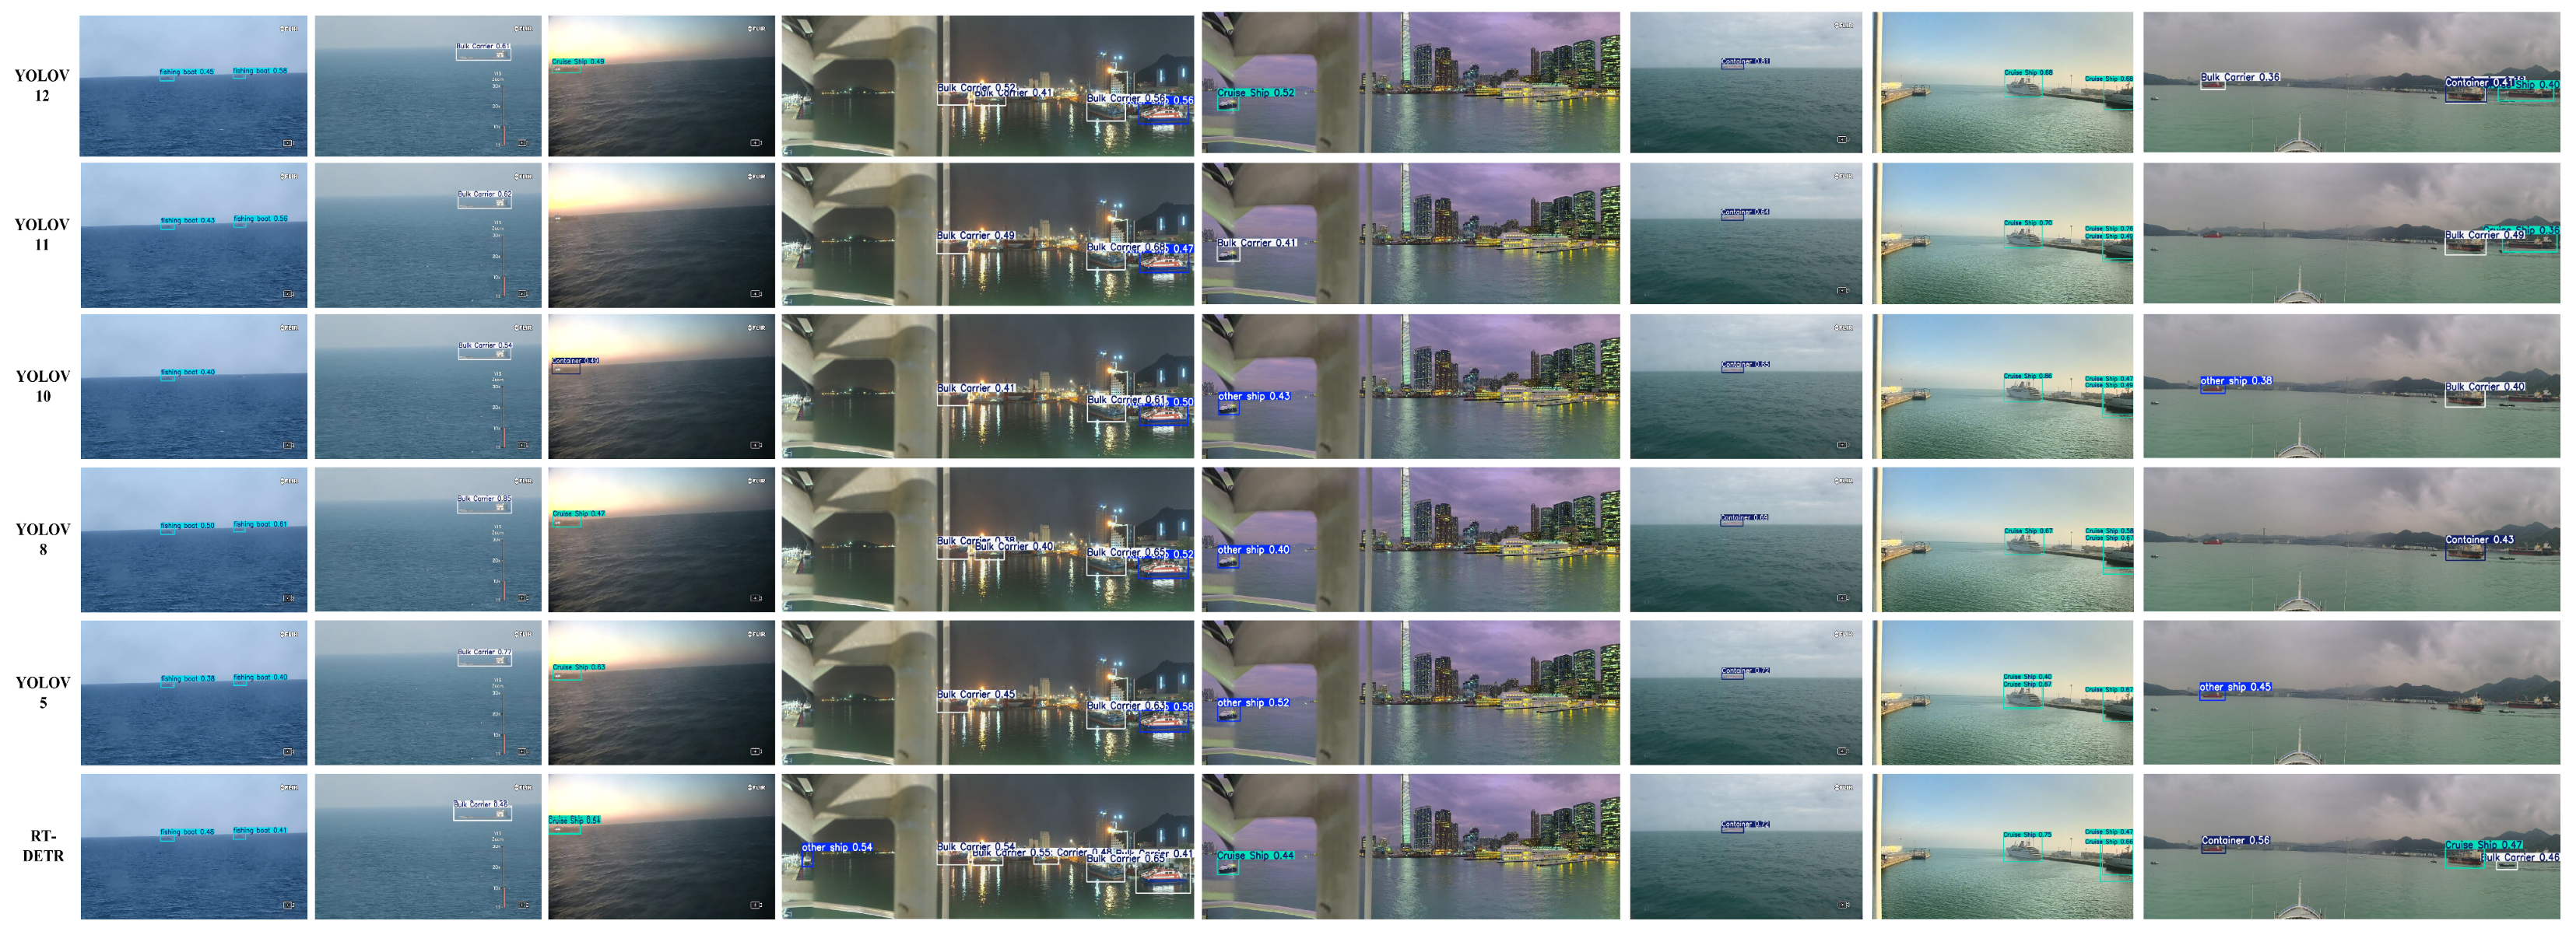
In Figure 7, we visualize some qualitative detection results from the algorithms, including examples of distant small ships, foggy conditions, occluded ships, low-light environments, extreme weather, light reflections, and complex port scenes. Most detection algorithms achieve good performance, but some misses and overlapping detections still occur. For example, in the third row first column and the fourth column, there are some ships affected by the environment that were not detected; in the seventh column, some detectors produce overlapping boxes. In summary, the chosen algorithms achieve excellent detection performance for adverse conditions and small ships, though challenges remain in the most difficult cases.

4.4. Generalization and Real-Time Analysis

Finally, we selected YOLOv12—being the best-performing model on MASS-LSVD—as the baseline model. We conducted cross-dataset training and validation experiments among our MASS-LSVD dataset, the SeaShips dataset, and the SMD dataset to demonstrate our model’s generalization capability. We used the same training parameters and procedures and evaluated the mAP at iou = 0.50. Because the annotated classes differ across these datasets, we treated the detection task in all cases as a single class (ignoring ship sub-categories) to ensure a fair comparison. The cross-dataset detection results are shown in Table 4.
Comprehensively, both YOLOv12 and YOLOv8 show better overall performance and balance of each category on the P–R curve, further verifying their superior detection accuracy and stability in real target detection tasks.
From Table 4, we see that the model trained on MASS-LSVD achieves better generalization. This is due to our data being collected from real navigation: by sailing at sea, we capture more diverse ship appearances. In contrast to data collected from land, MASS-LSVD contains ship images from more viewing angles.

5. Conclusions

In this work, we have innovatively constructed the MASS-LSVD dataset for maritime ship detection; it is the first large-scale ship detection dataset captured from a vessel’s first-person perspective, filling the gap of absent shipborne visible and infrared multimodal multi-view samples. The dataset was collected over one year using the onboard sensor system of the Dalian Maritime University’s vessel Xinhongzhuan, yielding 64,263 high-resolution images. It covers four major Chinese maritime domains (Bohai Sea, Yellow Sea, East China Sea, and South China Sea) under a variety of complex weather and sea conditions—including sunny, rainy, nighttime, and haze scenes—thus fully reflecting the variations in illumination, water reflections, and background diversity of real navigation environments. All images were jointly annotated by senior maritime experts and computer vision experts to produce precise COCO-format bounding boxes. Strict cross-validation was used to ensure high annotation fidelity for ship hulls, even for small or occluded targets.
The MASS-LSVD dataset provides a rich data foundation for maritime target detection research and holds broad application prospects. Simultaneously, it serves as a fundamental resource for autonomous navigation and collision avoidance studies based on COLREG. In scenarios such as intelligent port surveillance, maritime traffic situational awareness, unmanned surface vessel navigation, and maritime emergency response, this dataset can function as a standardized benchmark to facilitate the evaluation and optimization of detection systems. Despite its large scale and diverse content, the MASS-LSVD dataset exhibits several inherent biases. The dataset primarily covers China’s coastal waters, potentially limiting its geographic generalization capabilities. Some categories were collected less frequently, resulting in class imbalance. Future work will advance along two pathways: On the one hand, we will explore multimodal fusion by designing a multispectral object detection network tailored for shipborne first-person view cameras. This approach aims to organically integrate visible and infrared information, further enhancing model robustness in complex maritime conditions. Second, we will investigate methods to reduce annotation costs by exploring weakly supervised and semi-supervised labeling techniques to minimize manual annotation efforts and expand the dataset scale. Through continuous supplementation of multi-platform, multi-perspective samples, we are committed to providing an increasingly robust theoretical and practical foundation for the development and deployment of autonomous vessel visual perception systems.

Author Contributions

Conceptualization, Y.F. and D.J.; methodology, D.J. and L.N.; software, F.S.; validation, L.S., D.J. and Y.F.; writing—original draft preparation, Z.G.; writing—review and editing, D.M.; visualization, B.H. All authors have read and agreed to the published version of the manuscript.

Funding

This research was supported by the Key Program for Basic Research of China (Grant number JCKY2023206B026); National Key Research and Development Program of China (Grant number 2022YFB4301401); National Natural Science Foundation of China (Grant number 61976033); Pilot Base Construction and Pilot Verification Plan Program of Liaoning Province of China (Grant number 2022JH24/10200029); Program of Graduate Education and Teaching Reform (Grant number LNYJG2024142, YJG2024707); Fundamental Research Funds for the Central Universities (Grant number 3132023512); China Postdoctoral Science Foundation (Grant number 2022M710569); Liaoning Province Doctor Startup Fund (Grant number 2022-BS-094); and Shanghai Science and Program of Shanghai Academic/Technology Research Leader (23XD1431000).

Data Availability Statement

The original data presented in the study are openly available in https://github.com/1colorworker/MASS-LSVD-A-Large-Scale-First-View-Dataset-for-Vessel-De-tection.git (accessed on 17 October 2025).

Conflicts of Interest

Author Bing Han was employed by the company Shanghai Ship and Shipping Research Institute Co., Ltd. Author Feng Sun was employed by the company Dalian COSCO Shipping Heavy Industry Co., Ltd. The remaining authors declare that the research was conducted in the absence of any commercial or financial relationships that could be construed as a potential conflict of interest.

Abbreviations

The following abbreviations are used in this manuscript:
MASSMulti-Access Semi-Autonomous Ship
CNNConvolutional Neural Network
YOLOYou Only Look Once

References

  1. Xu, S.; Fan, J.; Jia, X.; Chang, J. Edge-Constrained Guided Feature Perception Network for Ship Detection in SAR Images. IEEE Sens. J. 2023, 23, 26828–26838. [Google Scholar] [CrossRef]
  2. Varghese, R.; M., S. YOLOv8: A Novel Object Detection Algorithm with Enhanced Performance and Robustness. In Proceedings of the 2024 International Conference on Advances in Data Engineering and Intelligent Computing Systems (ADICS), Chennai, India, 18–19 April 2024; pp. 1–6. [Google Scholar]
  3. Er, M.J.; Zhang, Y.; Chen, J.; Gao, W. Ship Detection with Deep Learning: A Survey. Artif. Intell. Rev. 2023, 56, 11825–11865. [Google Scholar] [CrossRef]
  4. Shi, Z.; Yu, X.; Jiang, Z.; Li, B. Ship Detection in High-Resolution Optical Imagery Based on Anomaly Detector and Local Shape Feature. IEEE Trans. Geosci. Remote Sens. 2014, 52, 4511–4523. [Google Scholar] [CrossRef]
  5. Development and Application of Ship Detection and Classification Datasets: A Review | IEEE Journals & Magazine | IEEE Xplore. Available online: https://ieeexplore.ieee.org/document/10681575 (accessed on 5 August 2025).
  6. Wang, N.; Wang, Y.; Feng, Y.; Wei, Y. MDD-ShipNet: Math-Data Integrated Defogging for Fog-Occlusion Ship Detection. IEEE Trans. Intell. Transp. Syst. 2024, 25, 15040–15052. [Google Scholar] [CrossRef]
  7. Tan, X.; Leng, X.; Ji, K.; Kuang, G. RCShip: A Dataset Dedicated to Ship Detection in Range-Compressed SAR Data. IEEE Geosci. Remote Sens. Lett. 2024, 21, 4004805. [Google Scholar] [CrossRef]
  8. Zhao, C.; Liu, R.W.; Qu, J.; Gao, R. Deep Learning-Based Object Detection in Maritime Unmanned Aerial Vehicle Imagery: Review and Experimental Comparisons. Eng. Appl. Artif. Intell. 2024, 128, 107513. [Google Scholar] [CrossRef]
  9. Zhang, C.; Pan, F.; Kim, J.; Kweon, I.S.; Mao, C. ImageNet-D: Benchmarking Neural Network Robustness on Diffusion Synthetic Object. In Proceedings of the 2024 IEEE/CVF Conference on Computer Vision and Pattern Recognition (CVPR), Seattle, WA, USA, 17–21 June 2024; IEEE Computer Soc: Los Alamitos, CA, USA, 2024; pp. 21752–21762. [Google Scholar]
  10. Everingham, M.; Van Gool, L.; Williams, C.K.I.; Winn, J.; Zisserman, A. The Pascal Visual Object Classes (VOC) Challenge. Int. J. Comput. Vis. 2010, 88, 303–338. [Google Scholar] [CrossRef]
  11. Lin, T.-Y.; Maire, M.; Belongie, S.; Hays, J.; Perona, P.; Ramanan, D.; Dollar, P.; Zitnick, C.L. Microsoft COCO: Common Objects in Context. In Proceedings of the Computer Vision—ECCV 2014, Zurich, Switzerland, 6–12 September 2014; Fleet, D., Pajdla, T., Schiele, B., Tuytelaars, T., Eds.; Springer International Publishing Ag: Cham, Switzerland, 2014. Part IV. Volume 8693, pp. 740–755. [Google Scholar]
  12. Gao, W.; Cao, B.; Shan, S.; Chen, X.; Zhou, D.; Zhang, X.; Zhao, D. The CAS-PEAL Large-Scale Chinese Face Database and Baseline Evaluations. IEEE Trans. Syst. Man Cybern. Part A-Syst. Hum. 2008, 38, 149–161. [Google Scholar] [CrossRef]
  13. Zheng, T.; Deng, W. Cross-Pose LFW: A Database for Studying Cross-Pose Face Recognition in Unconstrained Environments. arXiv 2018, arXiv:1708.08197. [Google Scholar]
  14. Shao, S.; Zhao, Z.; Li, B.; Xiao, T.; Yu, G.; Zhang, X.; Sun, J. CrowdHuman: A Benchmark for Detecting Human in a Crowd. arXiv 2018, arXiv:1805.00123. [Google Scholar] [CrossRef]
  15. Neumann, L.; Karg, M.; Zhang, S.; Scharfenberger, C.; Piegert, E.; Mistr, S.; Prokofyeva, O.; Thiel, R.; Vedaldi, A.; Zisserman, A.; et al. NightOwls: A Pedestrians at Night Dataset. In Proceedings of the Computer Vision—ACCV 2018, Perth, Australia, 2–6 December 2018; Jawahar, C.V., Li, H., Mori, G., Schindler, K., Eds.; Springer International Publishing Ag: Cham, Switzerland, 2019. Part I. Volume 11361, pp. 691–705. [Google Scholar]
  16. Fu, C.; Liu, R.; Fan, X.; Chen, P.; Fu, H.; Yuan, W.; Zhu, M.; Luo, Z. Rethinking General Underwater Object Detection: Datasets, Challenges, and Solutions. Neurocomputing 2023, 517, 243–256. [Google Scholar] [CrossRef]
  17. Liu, C.; Li, H.; Wang, S.; Zhu, M.; Wang, D.; Fan, X.; Wang, Z. A Dataset and Benchmark of Underwater Object Detection for Robot Picking. In Proceedings of the 2021 IEEE International Conference on Multimedia & Expo Workshops (ICMEW), Shenzhen, China, 5–9 July 2021; IEEE: New York, NY, USA, 2021. [Google Scholar]
  18. Zhang, M.M.; Choi, J.; Daniilidis, K.; Wolf, M.T.; Kanan, C. VAIS: A Dataset for Recognizing Maritime Imagery in the Visible and Infrared Spectrums. In Proceedings of the 2015 IEEE Conference on Computer Vision and Pattern Recognition Workshops (CVPRW), Boston, MA, USA, 7–12 June 2015; IEEE: New York, NY, USA, 2015. [Google Scholar]
  19. Gundogdu, E.; Solmaz, B.; Yucesoy, V.; Koc, A. MARVEL: A Large-Scale Image Dataset for Maritime Vessels. In Proceedings of the Computer Vision—ACCV 2016, Taipei, Taiwan, 20–24 November 2016; Lai, S.H., Lepetit, V., Nishino, K., Sato, Y., Eds.; Springer International Publishing Ag: Cham, Switzerland, 2017. Part V. Volume 10115, pp. 165–180. [Google Scholar]
  20. Patino, L.; Cane, T.; Vallee, A.; Ferryman, J. PETS 2016: Dataset and Challenge. In Proceedings of the 29th IEEE Conference on Computer Vision and Pattern Recognition Workshops (CVPRW 2016), Las Vegas, NV, USA, 1–26 July 2016; IEEE: New York, NY, USA, 2016; pp. 1240–1247. [Google Scholar]
  21. Shao, Z.; Wu, W.; Wang, Z.; Du, W.; Li, C. SeaShips: A Large-Scale Precisely Annotated Dataset for Ship Detection. IEEE Trans. Multimed. 2018, 20, 2593–2604. [Google Scholar] [CrossRef]
  22. Moosbauer, S.; Koenig, D.; Jaekel, J.; Teutsch, M. A Benchmark for Deep Learning Based Object Detection in Maritime Environments. In Proceedings of the 2019 IEEE/CVF Conference on Computer Vision and Pattern Recognition Workshops (CVPRW 2019), Long Beach, CA, USA, 16–17 June 2019; IEEE: New York, NY, USA, 2019; pp. 916–925. [Google Scholar]
  23. Shi, D.; Guo, Y.; Wan, L.; Huo, H.; Fang, T. Fusing Local Texture Description of Saliency Map and Enhanced Global Statistics for Ship Scene Detection. In Proceedings of the 2015 IEEE International Conference on Progress in Informatcs and Computing (IEEE PIC), Nanjing, China, 18–20 December 2015; Xiao, L., Wang, Y., Eds.; IEEE: New York, NY, USA, 2015; pp. 311–316. [Google Scholar]
  24. Zhu, C.; Zhou, H.; Wang, R.; Guo, J. A Novel Hierarchical Method of Ship Detection from Spaceborne Optical Image Based on Shape and Texture Features. IEEE Trans. Geosci. Remote Sensing 2010, 48, 3446–3456. [Google Scholar] [CrossRef]
  25. Yang, F.; Xu, Q.; Gao, F.; Hu, L. Ship Detection from Optical Satellite Images Based on Visual Search Mechanism. In Proceedings of the 2015 IEEE International Geoscience and Remote Sensing Symposium (IGARSS), Milan, Italy, 26–31 July 2015; IEEE: New York, NY, USA, 2015; pp. 3679–3682. [Google Scholar]
  26. Liu, T.; Pang, B.; Zhang, L.; Yang, W.; Sun, X. Sea Surface Object Detection Algorithm Based on YOLO v4 Fused with Reverse Depthwise Separable Convolution (RDSC) for USV. J. Mar. Sci. Eng. 2021, 9, 753. [Google Scholar] [CrossRef]
  27. Yang, C.; Wang, Y.; Zhang, J.; Zhang, H.; Wei, Z.; Lin, Z.; Yuille, A. Lite Vision Transformer with Enhanced Self-Attention. In Proceedings of the 2022 IEEE/CVF Conference on Computer Vision and Pattern Recognition (CVPR), New Orleans, LA, USA, 18–24 June 2022; IEEE Computer Soc: Los Alamitos, CA, USA, 2022; pp. 11988–11998. [Google Scholar]
  28. Guo, W.; Xia, X.; Wang, X. A Remote Sensing Ship Recognition Method Based on Dynamic Probability Generative Model. Expert Syst. Appl. 2014, 41, 6446–6458. [Google Scholar] [CrossRef]
  29. Zhang, Y.; Wu, C.; Guo, W.; Zhang, T.; Li, W. CFANet: Efficient Detection of UAV Image Based on Cross-Layer Feature Aggregation. IEEE Trans. Geosci. Remote Sens. 2023, 61, 5608911. [Google Scholar] [CrossRef]
  30. Zhang, Y.; Liu, T.; Yu, P.; Wang, S.; Tao, R. SFSANet: Multiscale Object Detection in Remote Sensing Image Based on Semantic Fusion and Scale Adaptability. IEEE Trans. Geosci. Remote Sens. 2024, 62, 4406410. [Google Scholar] [CrossRef]
  31. What Is YOLOv5: A Deep Look into the Internal Features of the Popular Object Detector. Available online: https://arxiv.org/abs/2407.20892 (accessed on 31 July 2025).
  32. Wang, A.; Chen, H.; Liu, L.; Chen, K.; Lin, Z.; Han, J.; Ding, G. YOLOv10: Real-Time End-to-End Object Detection. In Proceedings of the 38th International Conference on Neural Information Processing Systems, Vancouver, BC, Canada, 10–15 December 2024. [Google Scholar]
  33. Khanam, R.; Hussain, M. YOLOv11: An Overview of the Key Architectural Enhancements. arXiv 2024, arXiv:2410.17725. [Google Scholar] [CrossRef]
  34. Tian, Y.; Ye, Q.; Doermann, D. YOLOv12: Attention-Centric Real-Time Object Detectors. arXiv 2025, arXiv:2502.12524. [Google Scholar]
  35. Zhao, Y.; Lv, W.; Xu, S.; Wei, J.; Wang, G.; Dan, Q.; Liu, Y.; Chen, J. DETRs Beat YOLOs on Real-Time Object Detection. In Proceedings of the 2024 IEEE/CVF Conference on Computer Vision and Pattern Recognition (CVPR), Seattle, WA, USA, 17–21 June 2024; IEEE Computer Soc: Los Alamitos, CA, USA, 2024; pp. 16965–16974. [Google Scholar]
  36. Zeng, G.; Yu, W.; Wang, R.; Lin, A. Research on Mosaic Image Data Enhancement for Overlapping Ship Targets. arXiv 2024, arXiv:2410.17725. [Google Scholar]
  37. Zhang, H.; Cisse, M.; Dauphin, Y.N.; Lopez-Paz, D. Mixup: Beyond Empirical Risk Minimization. arXiv 2021, arXiv:2105.05090. [Google Scholar]
  38. Ghiasi, G.; Cui, Y.; Srinivas, A.; Qian, R.; Lin, T.-Y.; Cubuk, E.D.; Le, Q.V.; Zoph, B. Simple Copy-Paste Is a Strong Data Augmentation Method for Instance Segmentation. arXiv 2021, arXiv:2012.07177. [Google Scholar] [CrossRef]
  39. Adam: A Method for Stochastic Optimization. Available online: https://arxiv.org/abs/1412.6980 (accessed on 1 August 2025).
  40. Namgung, H.; Kim, J.-S. Collision Risk Inference System for Maritime Autonomous Surface Ships Using COLREGs Rules Com pliant Collision Avoidance. IEEE Access 2021, 9, 7823–7835. [Google Scholar] [CrossRef]
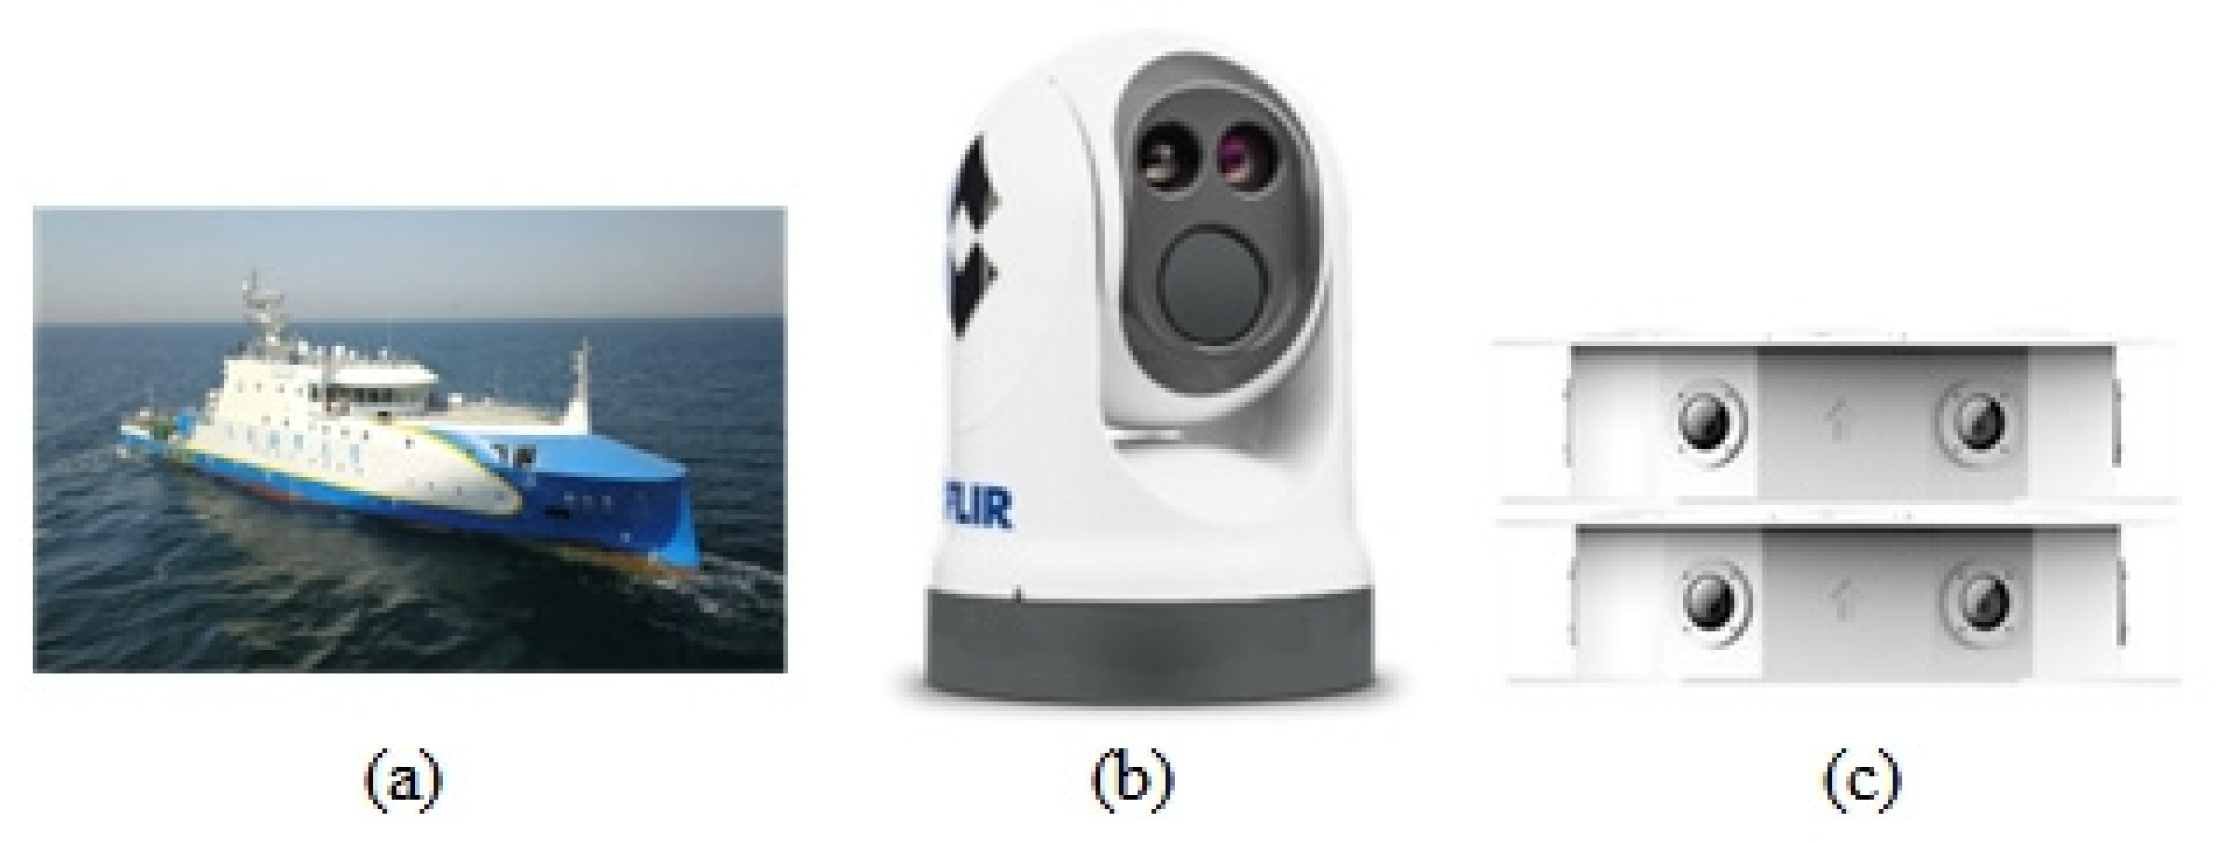
Figure 1. (a) Vessel used for data collection; (b) diagram of the infrared imaging sensor; (c) diagram of the high-performance dual-spectrum camera.
Jmse 13 02201 g001
Figure 2. Proportion of the ratio of the number of pixels belonging to the ship versus the total pixels in its bounding box. Among them, (ac) represent three typical case groups.
Jmse 13 02201 g002
Figure 3. (a,b) Special environmental data within the dataset (encompassing anomalous weather, overexposure, sea surface light reflections, and low-light conditions), (c) instances where background and vessel hulls exhibit excessive similarity, and (d) high-resolution data samples obtained through zoom processing by our perception module.
Jmse 13 02201 g003
Figure 4. The number and proportion of various annotated boxes contained within the dataset.
Jmse 13 02201 g004
Figure 5. Receiver operating characteristic curves for six benchmark algorithms on the MASS-LSVD dataset.
Jmse 13 02201 g005
Figure 6. Visualization results of mAP@0.5A and mAP@0.5–0.95B during the training process of six benchmark algorithms.
Jmse 13 02201 g006
Figure 7. Detection results for six algorithms (including instances of partial failure). We selected photographs captured by different cameras under varying environmental conditions. Each row represents the detection outcome for a specific algorithm.
Jmse 13 02201 g007
Table 1. Differences among various maritime ship detection datasets (annotated image count, type, and bounding box availability).
DatasetAnnotated ImagesTypeBounding Box
VAIS [18]2856singleAvailable
MarDCT [19]6743singleAvailable
IPATCH [20]30,418singleAvailable
SeaShips [21]31,455variousAvailable
SMD [22]240,842variousAvailable
MASS-LSVD64,263variousAvailable
Table 2. Differences of different object detection algorithms (core type, anchor usage, NMS usage, end-to-end capability, and notable features), ✓ indicates inclusion, ✗ indicates exclusion.
ModelTypeAnchor-FreeNMS-FreeEnd-to-EndNotable Features
YOLOv5CNN (One-Stage)Mosaic Aug., Anchor-Based, Ciou Loss
YOLOv8CNN (One-Stage)C2f Module, MixUp, CopyPaste
YOLOv10CNN (Unified)OD-Head, Hungarian Matching
YOLOv11CNN + AttentionCross-layer Attention, Dynamic Conv
YOLOv12CNN + AttentionRepOptimizer, EMA-BN, Multi-Scale Attention
RT-DETRTransformerGlobal Attention, AIFI+CCFM, iou-Aware Query
Table 3. Performance of different object detection algorithms on MASS-LSVD.
ModelFishing BoatBulk CarrierCruise ShipContainerOther ShipAverage MapFPS (A40)
YOLOv50.7130.8770.9080.8910.9160.86147
YOLOv80.7220.8590.9260.9030.9270.86763
YOLOv100.7740.8630.8860.9120.9220.87177
YOLOv110.7310.8720.9100.9080.9300.87349
YOLOV120.7780.8850.9230.9210.9380.88980
RT-DERT0.7060.8250.8910.8430.9060.83442
Table 4. Cross-dataset generalization results (mAP@iou = 0.50) when training and testing on different datasets (all treated as a single “ship” class).
Train SetmAP@50
MASS-LSVDSeaShipsSMD
MASS-LSVD92.6048.7352.64
SeaShips58.4499.2647.98
SMD31.4928.5698.70
Disclaimer/Publisher’s Note: The statements, opinions and data contained in all publications are solely those of the individual author(s) and contributor(s) and not of MDPI and/or the editor(s). MDPI and/or the editor(s) disclaim responsibility for any injury to people or property resulting from any ideas, methods, instructions or products referred to in the content.