Abstract
Submarine methane-rich fluids migrating through geological conduits significantly influence gas hydrate production during depressurization. However, the coupled effects of methane, water, and heat delivered by these fluids on hydrate dissociation and methane recovery remain unclear. This study establishes a conceptual coupled numerical model of “pressure reduction–fluid response–reservoir evolution” based on reservoir parameters from Well W11 in the Shenhu area, South China Sea (SCS), and representative conduit characteristics. Hydrate dissociation and gas production are simulated under steady pressure reduction conditions with varying fluid invasion scenarios. Results show that the invasion of methane-rich fluid into gas hydrate systems exhibits a three-phase impact on gas production dynamics. Initially, the invasion has little effect on gas production; in the intermediate stage, it temporarily inhibits gas production; and under sustained invasion, it significantly enhances gas production. Limited water inflow with enhanced heat input promotes efficient hydrate-derived gas recovery. High methane flux enhances gas production while limiting hydrate dissociation. Excessive methane input may induce secondary hydrate formation, with the amount of newly formed hydrate exceeding that of the dissociated hydrate in the reservoir. A strong synergistic “1 + 1 > 2” effect occurs under low water or methane invasion, increasing gas output up to 4.3 times compared with a no-invasion case. These findings enhance understanding of dynamic hydrate exploitation systems and support the safe and efficient co-production of gas hydrates and associated deep gas.
1. Introduction
Natural gas hydrates are widely distributed in marine and permafrost regions, including the Gulf of Mexico in the USA, the Nankai Trough in Japan, the South China Sea in China, and the Arctic margins, and are characterized by abundant reserves and environmentally friendly characteristics [1,2]. As the largest global reservoir of organic carbon, they are recognized as a promising unconventional energy resource with great potential to contribute to future low-carbon energy supply and climate change mitigation [3,4].
Marine gas hydrates are mainly composed of methane, and their occurrence and stability are dynamically controlled by temperature, pressure, sedimentary environment, and deep fluid migration [5,6]. While numerous studies have investigated hydrate stability under static thermodynamic conditions or assessed individual factors (e.g., pressure, temperature, and tectonic activity) controlling hydrate distribution and dissociation [7,8,9,10,11,12], few have systematically examined how fluid conduits regulate marine gas hydrate systems under multiphysical coupling dynamics. In particular, the influence of fluid conduits in hydrate-bearing reservoirs on gas production and reservoir evolution during depressurization, a method currently regarded as the most effective method for marine gas hydrate exploitation, remains poorly understood.
In nature, fluid conduit-associated gas hydrate systems are widespread and typically exhibit high accumulation efficiency and hydrate saturation (Figure 1) [13,14,15]. In this dynamic system, fluid conduits act as expressways, transporting deep methane-rich fluids into the hydrate stability zone, regulating methane supply and entrapment efficiency [16]. When gas pressure beneath the hydrate-bearing reservoir exceeds its sealing threshold, gas rapidly migrates through these conduits toward the seafloor, potentially triggering methane seepage or secondary hydrate formation [17,18,19,20,21]. These observations indicate that the properties of fluids within these conduits control the dynamic evolution of hydrate systems. Although several studies have investigated fluid migration in such conduits, they mostly adopt a single-factor perspective, focusing on methane flux [17,22]. In hydrate production, previous studies have revealed that the combined effect of low pressure at the production well and high pressure within the conduits can induce methane accumulation near the wellhead, thereby reducing direct methane leakage [23]. Physical simulations have further shown that when high-temperature and high-pressure deep natural gas rapidly invades the hydrate reservoir through gas chimneys, only a small portion of the energy is utilized for hydrate dissociation [24]. In real geological settings, methane, water, and heat within fluids often act together to drive hydrate dissociation, reformation, and re-accumulation. Such interactions are critical for depressurization-induced production, where external fluxes strongly affect methane recovery. However, existing studies generally neglect the co-evolving interactions among methane, water, and heat, and how different methane, water, and heat fluxes within conduits control hydrate behavior during depressurization remains unclear.
In the northern South China Sea, widespread faults and gas chimneys act as critical fluid conduits for the upward migration of methane-rich fluids (Figure 1), exerting a significant influence on the evolution of hydrate reservoirs in response to pressure changes [25]. To investigate the response mechanisms of fluid conduit-controlled gas hydrate systems during depressurization, this study focuses on the hydrate-bearing reservoir of Well W11 in the Shenhu area, South China Sea. Based on in situ measured reservoir parameters (e.g., porosity, permeability, hydrate saturation) and key physical parameters representative of typical fluid conduits, a two-dimensional conceptual coupled numerical model of “pressure reduction–fluid response–reservoir evolution” was developed. Distinct from previous single-factor studies centered on methane flux, our model systematically introduces the co-evolution of methane, water, and heat within fluids, simulating their influence on hydrate dissociation and gas production under depressurization-induced production scenarios. Our study sequentially explores (i) the controlling effect of fluid conduit presence/absence on gas production and reservoir evolution; (ii) the regulatory mechanisms of methane, water, and heat supply intensity on reservoir evolution and gas production; and (iii) the key parameters controlling gas production from hydrate dissociation under depressurization. The insights obtained provide critical guidance for assessing hydrate production potential in highly dynamic zones and for optimizing depressurization strategies in conduit-associated gas hydrate systems.

Figure 1.
Gas hydrate reservoirs associated with methane-rich fluid conduits at (a) W09, (b) W03, and (c) W08 in the Qiongdongnan Basin (modified from [26,27,28,29]), and (d) on the Norwegian continental slope (adapted from [30]). Abbreviations: MTD—mass transport deposit; HAR—high amplitude reflection; GHSZ—gas hydrate stability zone; BGHSZ—base of gas hydrate stability zone; BSR—bottom-simulating reflection; SW—Southwest; NE—Northeast. W09, W03, and W08 indicate well locations.

2. Simulation Methodology
2.1. Reservoir Background and Initial Conditions
The gas hydrate-bearing reservoir modeled in this study was conceptualized using geological parameters from the Shenhu area of the SCS (Figure 2), a region characterized by well-developed fault systems [25,31]. The reservoir properties, including the physical and geological characteristics, were derived from published data of Well W11 in the Shenhu area (Figure 2b,c) [32,33], ensuring a representative and realistic model for simulation purposes. In the established numerical model, the initial temperature and pressure conditions of the reservoir were set at 14.28 °C and 15.76 MPa, respectively, which reflect the typical conditions of the gas hydrate stability zone in this area. The hydrate-bearing reservoir was defined with a permeability of 0.22 mD (equivalent to 2.20 × 10⁻¹⁶ m2), a porosity of 34.5%, and an initial hydrate saturation of 34.0%.
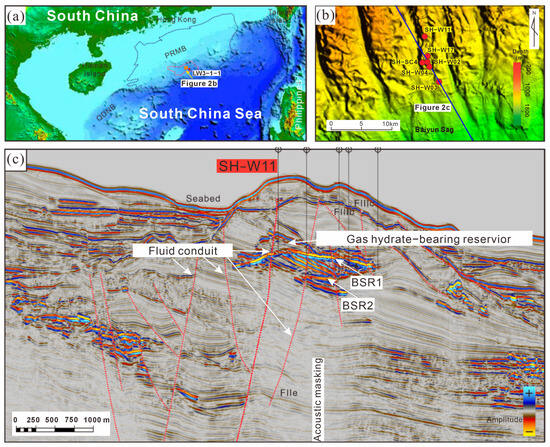
Figure 2.
(a) Location of the study area in the Baiyun Sag, Pearl River Mouth Basin (PRMB), northern South China Sea; (b) Submarine geomorphology and borehole distribution in the Shenhu gas hydrate reservoir; (c) Schematic of the fluid conduit-associated gas hydrate system in Well W11 (modified from [25]). Abbreviations: QDNB—Qiongdongnan Basin; FII—Fault; BSR—bottom-simulating reflection. Wells such as SH-W11, SH-W17, and LW3-1-1 indicate the borehole locations.
2.2. Simulation Code
The pressure reduction-driven dissociation process was simulated using the TOUGH + Hydrate v1.5 (Lawrence Berkeley National Laboratory, Berkeley, CA, USA) [34]. This simulator implements dual modeling approaches for gas hydrate behavior, combining thermodynamic equilibrium principles with kinetic reaction analysis. This computational tool evaluates heat transfer phenomena and tracks four primary components (H2O, CH4, hydrate, and water-soluble inhibitors such as salts or alcohols) distributed across gas phase, liquid phase, ice phase, and hydrate phase. It comprehensively simulates phase transition dynamics, associated thermal effects, and inhibitor impacts, while modeling various dissociation methods including depressurization, thermal stimulation, salting-out effects, and inhibitor-induced effects [35].
2.3. Model Construction, Fluid Invasion Flux and Depressurization Simulation
Considering that reservoirs such as those at the Norwegian continental slope and Well W11 commonly contain multiple fault or gas chimney clusters, this conceptual model assumes that the physical fields in the reservoir between these conduit clusters are treated as mirrored (or symmetric) for modeling simplification.
Based on this assumption, a 2D numerical model of fluid conduit-associated gas hydrate system was constructed with dimensions of 50 m (x) × 50 m (y) × 1 m (z) (Figure 3). The grid spacing along both the x- and y-axes ranged from 0.1 to 0.5 m, yielding a total of 247 × 247 = 61,009 grid cells. The 1 m thickness in the z-direction defines a computational layer only and does not participate in fluid or heat transport. All four lateral faces are treated as constant-temperature, impermeable boundaries, with no fluid or heat exchange across them. Pressure evolution is governed entirely by the internal reservoir dynamics.

Figure 3.
(a) Schematic of fluid invasion and depressurization-driven gas hydrate production in the x–z profile; (b) Schematic of fluid invasion and depressurization-driven gas hydrate reservoir evolution in the x–y plane; (c) Conceptual 2D coupled model of “pressure reduction–fluid response–reservoir evolution” with a 1 m computational layer in the z-direction (no fluid or heat transfer) and four lateral faces set as constant-temperature and impermeable boundaries. The green point denotes the pressure reduction point, the orange point indicates the methane-rich fluid invasion point, and the distance between them is 12 m. All arrows in the figure indicate the direction of fluid movement.
The pressure reduction point and methane-rich fluid invasion point were located 12 m apart (Figure 3c), with the pressure reduction point maintained at a target pressure of 4.5 MPa. The current approximation for high-permeability fluid conduits is a simplistic conceptualization, but it enables direct fluid leakage. Methane was introduced as a dissolved phase through the methane-rich fluid invasion point. The model’s key parameters, including reservoir parameters, fluid conduit characteristics, and pressure reduction point parameters, are detailed in Table 1.

Table 1.
Physical model parameters [32,33].
In this study, Case 1 represents the pressure reduction-only dissociation scenario, while Case 2 serves as the baseline case involving both pressure reduction and methane-rich fluids invasion. In Case 2, high-temperature methane-rich fluid was invaded at rates of 1.54 × 10⁻⁴ kg/s for CH4 (equivalent to 19.60 ST m3/day) and 1.00 × 10⁻³ kg/s for H2O, accompanied by a heat supply input of 1.20 × 10³ W.
A sensitivity analysis was performed to assess the influence of varying invasion characteristics, including water invasion rate, methane invasion rate, and heat supply rate. The specific sensitivity cases are presented in Table 2. In Cases W1–W12, the water invasion rate ranged from 2.00 × 10⁻⁵ to 1.60 × 10⁻³ kg/s; in Cases M1–M18, the methane invasion rate varied between 1.00 × 10⁻⁶ and 1.60 × 10⁻³ kg/s; and in Cases H1–H13, the heat supply rate was adjusted from 1.60 × 10³ to 1.00 × 101 W.
Table 2.
Simulation case design involving pressure reduction and methane-rich fluid invasion.
The selected fluid fluxes exceed natural measurements [17,23], primarily to simulate the transient increase in conduit flow that occurs during pressure reduction in actual geological systems.
3. Results and Discussion
3.1. Effect of Methane-Rich Fluid Invasion
By comparing Cases 1 and 2, this section analyzes how methane-rich fluid invasion affects reservoir physical property evolution and gas production behavior during depressurization, and investigates the mechanisms behind the observed gas production patterns.
3.1.1. Reservoir Physical Fields Evolution
The time-dependent reservoir evolution of physical fields in Case 1 is presented in Figure S1 in the Supplementary Material. As shown in Figure S1a,b, a circular low-pressure and low-temperature zone forms around the pressure reduction point in the hydrate reservoir under depressurization conditions. The circular low-pressure zone progressively expands with continued pressure reduction (Figure S1a). Initially, the circular low-temperature zone exhibits a “moderate-low-moderate-high” radial thermal gradient extending from the pressure reduction point (Figure S1b). After t = 60 days, the temperature distribution evolves into a “low–moderate–high” gradient, likely due to the endothermic effect associated with hydrate dissociation. In addition to significant changes in reservoir temperature and pressure, the hydrate saturation around the pressure reduction point declines markedly due to hydrate dissociation (Figure S1c). Gas and water released from hydrate dissociation increase gas and water saturations around the pressure reduction point (Figure S1d,e).
The time-dependent evolution of reservoir physical fields in Case 2 is shown in Figure 4. The reservoir pressure around the pressure reduction point decreases under depressurization conditions (Figure 4a). The low-pressure zone progressively expands as depressurization continues until t = 60 days. Meanwhile, pressure near the methane-rich fluid invasion point increases due to continuous fluid invasion. After t = 120 days, the low-pressure zone near the pressure reduction point contracts significantly due to methane-rich fluid invasion. By t = 360 days, pressure around the methane-rich fluid invasion point also declines.
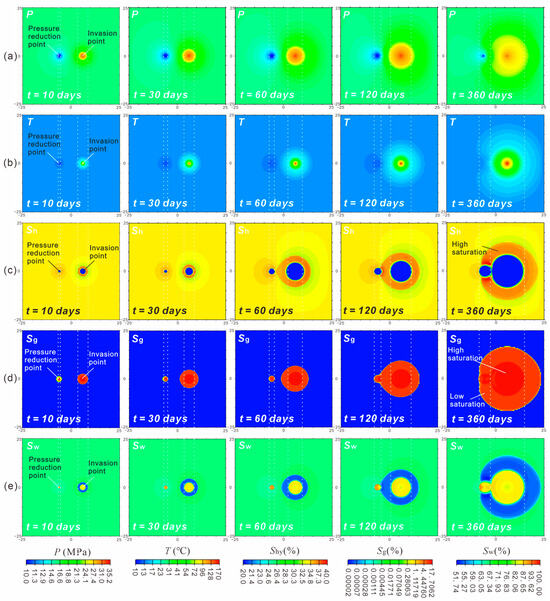
Figure 4.
Evolution of reservoir properties in Case 2 (50 m × 50 m): (a) pressure (P), (b) temperature (T), (c) hydrate saturation (Sh), (d) gas saturation (Sg), and (e) water saturation (Sw).
During the early pressure reduction, the temperature around the pressure reduction point dropped significantly (Figure 4b). As depressurization progressed, the low-temperature zone surrounding this point expanded gradually. The temperature around the methane-rich fluid invasion point remained relatively high, and the high-temperature zone continued to grow. By t = 60 days, the circular low-temperature region around the pressure reduction point was strongly influenced by the invading high-temperature methane-rich fluid. After t = 120 days, the high-temperature zone surrounding the fluid invasion point became irregular in shape. This change was caused by the combined effects of depressurization.
With the continuous depressurization, the hydrate dissociation zone around the pressure reduction point expanded (Figure 4c). Significant hydrate dissociation also occurred around the methane-rich fluid invasion point, whose dissociation zone grew progressively. Comparatively, the extent of hydrate dissociation at the methane-rich fluid invasion point exceeded that around the pressure reduction point. By t = 360 days, the hydrate dissociation zones driven by pressure reduction and methane-rich fluid invasion merged into a connected region. Notably, a ring-shaped zone of high hydrate saturation appears at the outer boundary of the dissociation area near the methane-rich fluid invasion point, indicating secondary hydrate formation. This secondary hydrate formation is promoted by the relatively low temperature and elevated pressure caused by fluid invasion.
As hydrate dissociation progressed, methane accumulated around both the pressure reduction and methane-rich fluid invasion points, forming radial concentration gradients (Figure 4d), and gradually expanded with prolonged fluid invasion. After t = 120 days, methane from the invasion point migrated to the pressure reduction point.
The water saturation surrounding the pressure reduction point remained relatively high due to hydrate dissociation (Figure 4e). Near the methane-rich fluid invasion point, water saturation also increased markedly due to hydrate dissociation and fluid invasion, forming a distinct concentric “high–low–high” saturation pattern radiating outward. After t = 120 days, the low-water-saturation zone near the invasion point expanded into the pressure reduction-controlled region. The formation of secondary hydrate consumed water and methane, resulting in an annular zone of low water and gas saturation (Figure 4d,e).
3.1.2. Gas Production Behavior
As shown in Figure 5, the gas production rate in Case 1 follows a pattern of “rapid short-term decline followed by gradual long-term reduction”. Correspondingly, the cumulative gas production in Case 1 increases steadily (Figure 5b). In contrast, Case 2 exhibits more complex gas production behavior (Figure 5a), characterized by an initial sharp decline, a gradual reduction during the intermediate stage, and a progressive increase under prolonged depressurization. Correspondingly, the cumulative gas production in Case 2 rises significantly (Figure 5b).
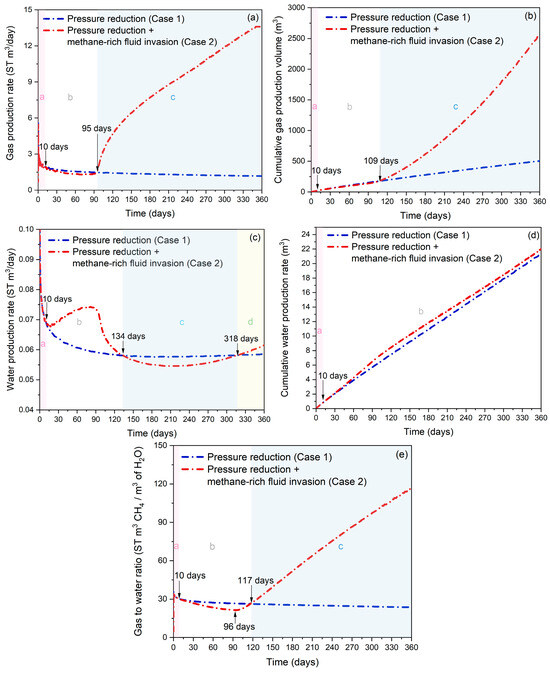
Figure 5.
Evolution of (a) gas production rate, (b) gas production volume, (c) water production rate, (d) water production volume, and (e) gas–water ratio during the depressurization-induced dissociation process in Cases 1 and 2. The letters a, b, c, and d in the figure represent different blocks (shown in red, white, blue, and yellow, respectively). The main purpose of dividing these blocks is to illustrate the changes in gas and water production relationships between Case 1 and Case 2. “+” indicates the simultaneous presence of both depressurization and methane-rich fluid invasion processes.
The water production rate in Case 1 follows a pattern of “rapid decline–gradual reduction–slow increase” pattern under reduced-pressure conditions (Figure 5c), resulting in a steady rise in cumulative water production (Figure 5d). In contrast, Case 2 displays a W-shaped variation in rate (“rapid decline–significant increase–sharp decrease-gradual rise” in Figure 5c), driving a continuous increase in cumulative water production (Figure 5d).
The gas–water ratio in Case 1 declines gradually throughout the pressure reduction period (Figure 5e). In contrast, Case 2 exhibits an initial decrease followed by a sharp increase after t = 96 days.
The gas and water production rates of Cases 1 and 2 were essentially similar before t = 10 days (Figure 5a,c). This behavior is primarily because, from t = 10 days onward, the invading methane-rich fluid began to influence the reservoir’s physical fields around the pressure reduction point, affecting gas and water production from hydrate dissociation (Figure S2).
After t = 10 days, Case 2 exhibits distinct production characteristics compared with Case 1 during prolonged pressure reduction: (1) the gas production rate remains lower than that of Case 1 between t = 10–95 days but surpasses it after t = 95 days (Figure 5a); (2) the water production rate exceeds that of Case 1 between t = 10–134 days and after t = 318 days (Figure 5c). This behavior is primarily attributed to the invasion of high-temperature methane-rich fluids in Case 2. As exemplified by the reservoir conditions at t = 30 days, the reservoir properties surrounding the pressure reduction point in Case 2—including pressure, temperature, gas saturation, and water saturation—exhibit significant changes due to the invasion of methane-rich fluids (Figure S3b). In Case 2, the high gas saturation zone around the pressure reduction point in the hydrate reservoir is significantly decreased under the condition of methane-rich fluid invasion.
After t = 95 days, the high gas saturation zone surrounding the methane-rich fluid invasion point in Case 2 connected with the high gas saturation zone near the pressure reduction point (Figure 6a). The methane from the methane-rich fluid invasion point is extensively extracted due to depressurization effects, resulting in significant enhancement of gas production. The enhanced gas production in Case 2 induces reduction in water output. Moreover, capillary forces within the hydrate-bearing formation are enhanced under continuously increased hot methane invasion. Both dissociated hydrate water and invaded water are dominantly retained as irreducible saturation in pore spaces, thereby reducing water production while improving gas recovery efficiency [37]. Consequently, Case 2 exhibits a pronounced decline in water production rate after t = 95 days, ultimately dropping below Case 1 after t = 134 days.
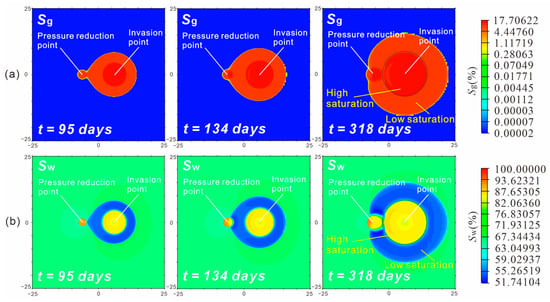
Figure 6.
Spatial distributions of (a) gas saturation (Sg) and (b) water saturation (Sw) in Case 2 at t = 95, 134, and 318 days (50 m × 50 m).
After t = 318 days, the water production rate of Case 2 again exceeds that of Case 1. This increase is mainly due to the spatially heterogeneous water saturation distribution, which shows a distinct “high–low–high” transitional pattern extending from the methane-rich fluid invasion point toward the reservoir interior. With continuous invasion of methane-rich fluids, the extent of high-water-saturation zones surrounding the invasion point exhibits expansion. Before t = 318 days, only the low-water-saturation zones connect with the high-water-saturation zones near the pressure reduction point (Figure 6b). After t = 318 days, connectivity is established between the high-water-saturation zones and those surrounding the pressure reduction point, further enhancing water production in Case 2 and ultimately exceeding that of Case 1.
Although the water production rate in Case 2 is lower than Case 1 during the t = 134–318 days period (Figure 5c), the cumulative water production in Case 2 consistently higher than Case 1 after t = 10 days (Figure 5d). After t = 109 days, the disparity in gas production between Case 2 and Case 1 becomes more obvious compared to their water production differential (Figure 5b). Consequently, the gas–water ratio in Case 2 stays higher than in Case 1 after t = 117 days (Figure 5e).
3.1.3. Free Methane Volume in the Reservoir and Residual Hydrate Mass
Both Cases 1 and 2 show increased methane release from the hydrate-bearing reservoir during depressurization (Figure 7a). In comparison, Case 2 exhibits a more pronounced enhancement in cumulative methane release, increasing by more than ten times. The remaining mass of hydrate in the reservoir gradually decreases in both cases (Figure 7b). In Case 1, only a minor reduction occurs in hydrate mass (from 2.69 × 10⁵ to 2.66 × 10⁵ kg), whereas Case 2 shows a clear linear decline from 2.69 × 10⁵ to 2.46 × 10⁵ kg. The dissociation rate in Case 2 is 7.67 times higher than that in Case 1. During depressurization, the volume of free methane in the reservoir increases in both cases, with Case 2 displaying a more substantial cumulative enhancement (Figure 7b).
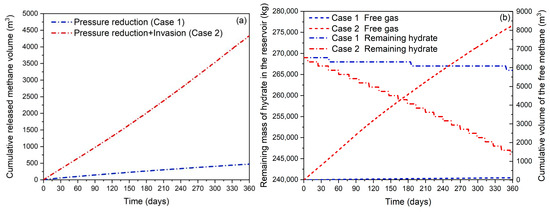
Figure 7.
Evolution of (a) cumulative released methane volume (m3) and (b) cumulative volume of free methane in the reservoir (m3) and the remaining mass of hydrate in the reservoir (kg) for Case 1 and Case 2.
3.2. Effect of Methane-Rich Fluid Flux
To clarify the individual effects of water, methane, and heat on hydrate dissociation and gas production, 40 simulation cases were designed (Table S1 in the Supplementary Material), covering water-only, methane-only, and heat-only invasion scenarios. Comparative analysis of single-factor simulations (Figures S4–S6) and the multi-factor simulations in this section indicates that the influence mechanisms of water, methane, and heat are largely independent, forming the basis for the following discussion of their respective effects.
3.2.1. Effect of Water Invasion Rate
Compared to Case 1 (without methane-rich fluid invasion), the methane and water production rates, as well as the gas-to-water ratio in Cases W1–W12 and Case 2, exhibit distinct evolutionary trends (Figure 8). Although the water invasion rate influences methane and water production, the overall trend remains similar across cases. In the early stage (t < 83 days), increasing the water invasion rate exerts little influence on gas production, indicating a delayed response of hydrate dissociation to water influx. After t = 83–103 days, when the gas production rates in Cases W1~W12 and Case 2 surpass that of Case 1, the gas production rate gradually decline with increasing water invasion rate (Figure 8a), with higher invasion rates causing a later crossover. The specific time at which the gas production rate significantly increases and exceeds that of Case 1 under different water invasion rates is shown in Table S2 in the Supplementary Material. Conversely, the water production rate shows a positive correlation with the water invasion rate (Figure 8b). At excessive water invasion rates (Cases W11 and W12), water production becomes dominant from approximately t = 15 days onward and remains consistently higher than in Case 1 throughout the simulation. For the gas-to-water ratio, sensitivity to water invasion rate is low before t = 90 days, but after this period, lower water invasion rates lead to earlier and more pronounced increases (Figure 8c).
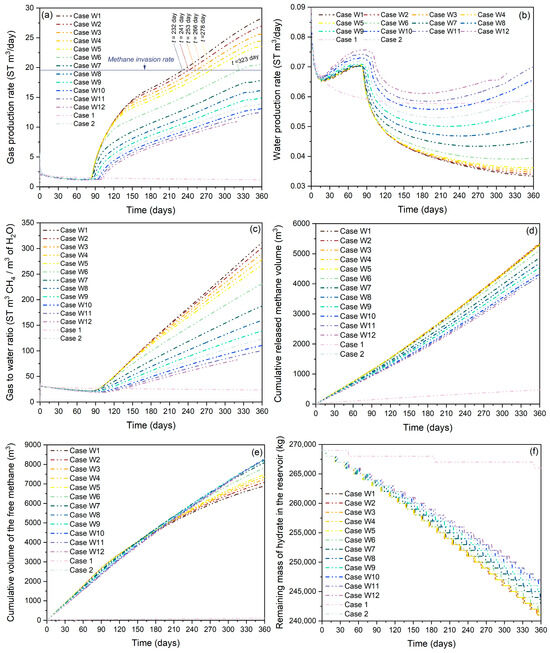
Figure 8.
Evolution of (a) gas production rate (m3/day) at the pressure reduction point, (b) water production rate (m3/day) at the pressure reduction point, (c) gas-to-water ratio at the pressure reduction point, (d) cumulative released methane volume (m3), (e) cumulative volume of the free methane (m3) and (f) remaining mass of hydrate in the reservoir (kg) for Cases 1, 2, and W1~W12.
As shown in Figure 8d,e, regardless of the water invasion rate, both the gas production from hydrate dissociation and the free methane in the reservoir in Cases W10~W12 and Case 2 consistently exceed those in Case 1. However, the gas production from the hydrate reservoir decreases with increasing water invasion rate. The free methane in the reservoir exhibits a similar decreasing trend with increasing water invasion rate only before t = 180 days; after t = 180 days, it increases with higher water invasion rates. For Cases W10–W12 and Case 2, the remaining hydrate mass is lower than in Case 1 but increases with higher water invasion rates (Figure 8f).
As mentioned above, a high-water invasion rate decreases hydrate dissociation and gas production. The decrease in hydrate dissociation under high water invasion rates is mainly due to the following factors: high water invasion induces a stronger pressure increase in the reservoir (Figure 9a,f), inhibiting dissociation near the invasion point [38]. It also lowers the temperature near the invasion front (Figure 9b,g). Since hydrate dissociation is endothermic, the lower temperature further slows the process. Consequently, the hydrate dissociation zone near the fluid invasion area is smaller under high water invasion compared to low invasion rates (Figure 9c,h). Although the dissociation zone near the pressure reduction front is larger under high water invasion, the contrast in dissociation zone size is more pronounced near the fluid invasion front. As a result, less hydrate dissociates under high water invasion rates.
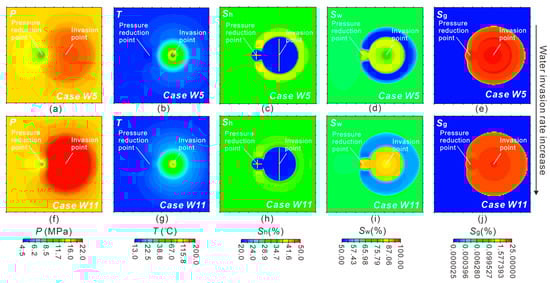
Figure 9.
Comparison of physical fields between Cases W5 (water invasion rate of 1.00 × 10⁻⁴ kg/s) and W11 (water invasion rate of 1.40 × 10⁻³ kg/s) at t = 360 days. (a) Case W5: pressure, (b) Case W5: temperature, (c) Case W5: hydrate saturation, (d) Case W5: water saturation, (e) Case W5: gas saturation, (f) Case W11: pressure, (g) Case W11: temperature, (h) Case W11: hydrate saturation, (i) Case W11: water saturation, and (j) Case W11: gas saturation. To quantitatively compare the spatial extent of hydrate dissociation between figures (c,h), equidistant yellow lines were employed.
High water invasion rates reduce gas production due to several factors. At low water invasion rates, weak connectivity between the pressure reduction front and the invasion zone limits gas–water pathways, allowing methane to migrate more easily than water, resulting in high methane and low water saturation near the front (Figure 9c–e). In contrast, high water invasion improves connectivity, enhancing water influx and increasing water saturation and production (Figure 9h,i). Additionally, greater water invasion lowers gas fugacity and forms a protective water layer over hydrates, reducing gas diffusion and transfer rates [38,39,40]. Therefore, higher water invasion rates significantly reduce gas production.
3.2.2. Effect of Methane Invasion Rate
Comparing Cases M1~M18 with Cases 1 and 2 shows that methane invasion rates significantly affect gas production, water production, and gas-to-water ratio (Figure 10a–c). Specifically, higher methane invasion rates lead to greater gas production and gas-to-water ratios, with the onset of significant production enhancement occurring earlier for larger invasion rates (Figure 10a,c). For lower methane invasion rates (Cases M1~M10, 1.00 × 10⁻⁶–1.80 × 10⁻⁵ kg/s), significant gas production enhancement occurs around at t = 133–140 days; for moderate methane invasion rates (Cases M11~M14, 1.00 × 10⁻⁴–1.80 × 10⁻⁴ kg/s), it occurs between 88 and 106 days; and for higher methane invasion rates (Cases M15~M18, 1.00 × 10⁻³–1.60 × 10⁻³ kg/s), it occurs between 31 and 41 days (Table S2 in the Supplementary Material). As shown in the comparative analysis of water production rates between Case 1 and other cases (Figure 10b), when the methane invasion rate exceeds 1.80 × 10⁻⁵ kg/s (Case M10), the pressure reduction point maintains significantly lower water production rates than Case 1 over an extended period (t = 150–270 days). Higher methane invasion rates not only trigger earlier suppression of water production but also extend the duration of this inhibitory effect, demonstrating a clear timing-dependent relationship between methane invasion rate and water production behavior.
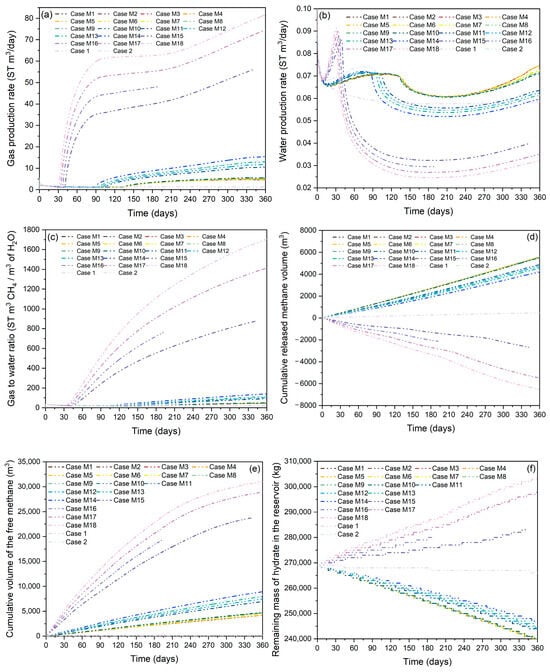
Figure 10.
Evolution of (a) gas production rate (m3/day) at the pressure reduction point, (b) water production rate (m3/day) at the pressure reduction point, (c) gas-to-water ratio at the pressure reduction point, (d) cumulative released methane volume (m3), (e) cumulative volume of the free methane (m3) and (f) remaining mass of hydrate in the reservoir (kg) for Cases 1, 2, and M1~M18.
Regardless of the methane invasion rate, the cumulative volume of free methane in Cases M1~M18 and Case 2 consistently exceeds that in Case 1 (Figure 10e) and shows a positive correlation with the methane invasion rate. However, the cumulative volume of released methane decreases as the methane invasion rate increases (Figure 10d). Notably, when the methane invasion rate exceeds 1.00 × 10⁻³ kg/s (as in Case M15), hydrate-derived gas production becomes negative. Meanwhile, the remaining hydrate mass in the reservoir increases with higher methane invasion rates (Figure 10f).
As discussed above, high methane invasion rates enhance gas output. When the invasion rate is below 1.00 × 10⁻³ kg/s (e.g., Cases M10 and M11), methane experiences lower flow resistance than water in the hydrate-bearing reservoir. This allows both invading and dissociated methane to migrate easily to the depressurization front, as supported by the lower water saturation near the pressure reduction point under high invasion rates (Figure 11d,i). When the invasion rate exceeds 1.00 × 10⁻³ kg/s (Case M18), secondary hydrate forms and narrows the high-permeability zone. Despite this, methane can still reach the pressure reduction point through narrow pathways, sustaining higher gas production.

Figure 11.
Comparison of physical fields between Case M10 (methane invasion rate of 1.80 × 10⁻⁵ kg/s), Case M11 (methane invasion rate of 1.00 × 10⁻⁴ kg/s), and Case M18 (methane invasion rate of 1.60 × 10⁻³ kg/s) at t = 360 days. (a) Case M10: pressure, (b) Case M10: temperature, (c) Case M10: hydrate saturation, (d) Case M10: water saturation, (e) Case M10: gas saturation, (f) Case M11: pressure, (g) Case M11: temperature, (h) Case M11: hydrate saturation, (i) Case M11: water saturation, and (j) Case M11: gas saturation, (k) Case M18: pressure, (l) Case M18: temperature, (m) Case M18: hydrate saturation, (n) Case M18: water saturation, and (o) Case M18: gas saturation.
High methane flux inhibits hydrate dissociation while promoting external methane accumulation in reservoir pores. Excessive methane input may trigger secondary hydrate formation exceeding the dissociation amount (Figure 10d–f). This results from a pressure rise near the invasion point with increasing methane injection (Figure 11). Under high-pressure conditions, secondary hydrate forms at the outer edge of the dissociation zone around the methane-rich fluid invasion point, with higher injection rates causing more extensive formation. When the methane invasion rate exceeds 1.00 × 10⁻³ kg/s (Case M18), methane cannot be produced efficiently, leading to secondary hydrate near the pressure reduction front (Figure 11m). Over time, dissociation near the fluid invasion point stabilizes, while dissociation near the pressure reduction point decreases with increasing methane invasion. Additionally, high-temperature methane increases gas fugacity in the reservoir pores, which weakens the diffusion of gas through the liquid film surrounding the hydrates and thus inhibits hydrate dissociation. Although the liquid film thins under high temperature, it still impedes gas diffusion, further reducing the driving force for dissociation [24]. Collectively, these effects reduce hydrate dissociation under high methane invasion compared to low rates.
3.2.3. Effect of Heat Supply Rate
Except for Cases H1~H4 and Case 2 (Figure 12, with a heat supply rate of 1.00 × 10³ to 1.80 × 10³ W), the other cases did not converge and are not discussed in detail in this section.
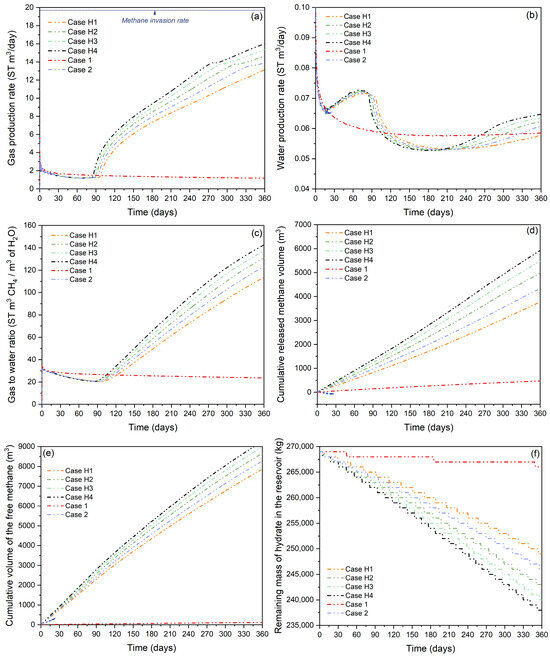
Figure 12.
Evolution of (a) gas production rate (m3/day) at the pressure reduction point, (b) water production rate (m3/day) at the pressure reduction point, (c) gas-to-water ratio at the pressure reduction point, (d) cumulative released methane volume (m3), (e) cumulative volume of the free methane (m3) and (f) remaining mass of hydrate in the reservoir (kg) for Cases 1, 2, and H1~H4.
Comparative analysis of Cases H1~H4 and Case 2 shows that the heat supply rate significantly influences the gas production rate, water production rate, and gas-to-water ratio at the pressure reduction point (Figure 12a–c). All these cases exhibit consistent evolutionary trends for these parameters, but the trends differ distinctly from those in Case 1. As shown in Figure 12a, before the gas production rates in Cases H1~H4 exceed those in Case 1, gas production is relatively insensitive to the heat supply rate. Around t = 85–98 days, the gas production rate begins to increase with higher heat supply rates, which trigger an earlier onset of significant enhancement (Table S2 in the Supplementary Material). The water production rate first remains nearly unchanged, then increases, decreases, and finally rises again with increasing heat supply rate (Figure 12b). For the gas-to-water ratio, sensitivity to heat supply rate is low before t = 104–122 days, but after this period, higher heat supply rates lead to earlier and more pronounced increases (Figure 12c).
As shown in Figure 9d,e, the cumulative released methane volume and free methane in the reservoir for Cases H1~H4 and 2 exceed those in Case 1 and increase with rising heat supply rate. Meanwhile, the remaining hydrate in the reservoir for these cases is significantly lower than in Case 1 and decreases further as the heat supply rate increases (Figure 12f).
As mentioned above, higher heat supply rates at the methane-rich fluid invasion point enhance hydrate dissociation and gas production. This thermal stimulation creates a positive feedback by increasing pressure and temperature near the invasion zone (Figure 13a,b,f,g), promoting secondary hydrate formation and expanding the hydrate dissociation extent (Figure 13c,h). Under identical methane and water invasion, greater hydrate dissociation leads to higher methane accumulation and expands gas–water migration pathways, significantly increasing methane flux toward the pressure reduction point (Figure 13j).
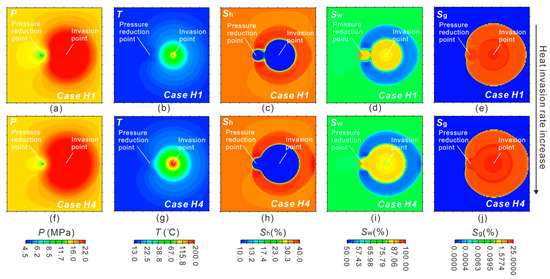
Figure 13.
Comparison of physical fields between Cases H1 (heat supply of 1.00 × 10³ W) and H4 (heat supply of 1.80 × 10³ W) at t = 360 days. (a) Case H1: pressure, (b) Case H1: temperature, (c) Case H1: hydrate saturation, (d) Case H1: water saturation, (e) Case H1: gas saturation, (f) Case H4: pressure, (g) Case H4: temperature, (h) Case H4: hydrate saturation, (i) Case H4: water saturation, and (j) Case H4: gas saturation.
3.3. Synergistic Enhancement of Gas Production by Methane-Rich Fluid Invasion (“1 + 1 > 2” Effect)
Figure 8a compares gas production rates at the pressure reduction point versus methane invasion rates under different water invasion rates. The results show that when the water invasion rate is below 2.00 × 10⁻⁴ kg/s (Case W6), the gas production rate exceeds the methane invasion rate (1.54 × 10⁻⁴ kg/s), and as the water invasion rate decreases, this crossover occurs at an earlier stage. Table S3 in the Supplementary Material shows that when the methane invasion rate is below 1.80 × 10⁻⁵ kg/s (Case M10), the actual gas production rate also exceeds the methane invasion rate. Notably, this phenomenon presents since the invasion of methane-rich fluids into the reservoir. In contrast, Figure 12a demonstrates that varying the heat supply rate alone does not enable the actual gas production rate to surpass the methane invasion rate.
To evaluate the potential enhancement effect of methane-rich fluid invasion, we compare the actually measured gas production during fluid invasion with the theoretical gas production (sum of injected methane and hydrate-derived gas under conditions without methane-rich fluid invasion). Both values are evaluated over the same pressure reduction period for accurate comparison, using t = 360 days as a representative case. When the measured production exceeds the theoretical value, it confirms that methane-rich fluid invasion enhances hydrate reservoir gas production, demonstrating a synergistic “1 + 1 > 2” effect.
As illustrated in Figure 14, the actual gas production rate consistently remains below theoretical values under high-temperature methane-rich fluid invasion, regardless of heat supply rate variations (Figure 14c). In contrast, when water or methane invasion rates are maintained at low invasion rates, the acutal production rates exceed theoretical values (Figure 14a,b), demonstrating a distinct “1 + 1 > 2” synergistic effect where fluid invasion significantly enhances gas production. Under optimal conditions, the actual gas production rate achieves a 3.76-fold increase over the theoretical value, with overall gas production capacity showing a 4.29-fold enhancement compared to non-invasion scenarios. However, progressive increases in water or methane invasion rates eventually reverse this trend, causing actual production rates to fall below theoretical values. Higher invasion rates lead to greater discrepancies between actual and theoretical values. This phenomenon is primarily related to the gas production rate decreases with increasing water invasion rate (Figure 8a), and higher methane invasion rates promote methane retention within the reservoir and enhance hydrate formation (Figure 10f).
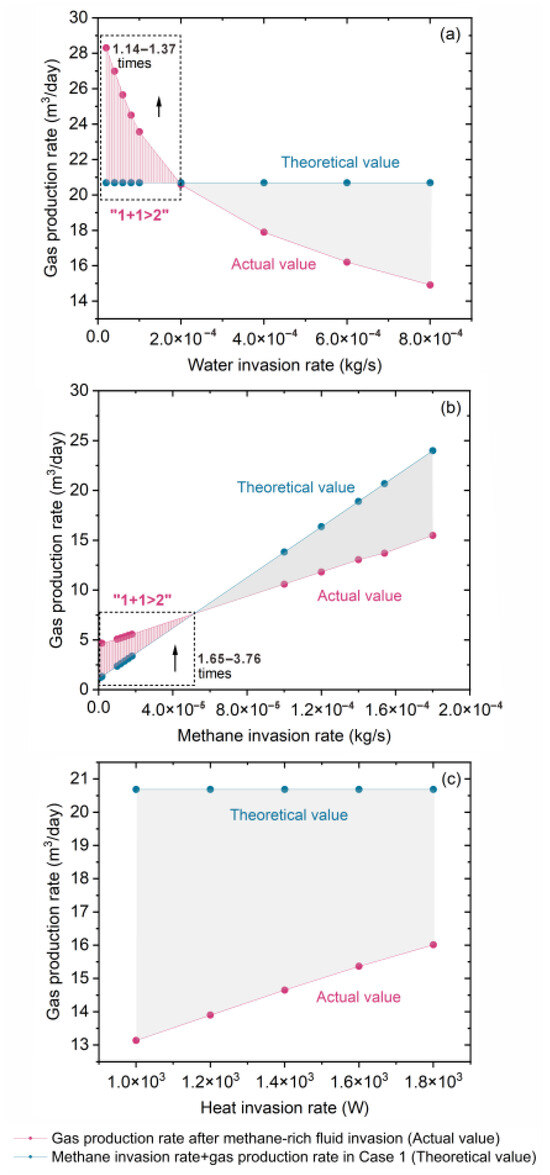
Figure 14.
Comparison of actual gas production rates in Cases W1–W12, M1–M18, H1–H4, and Case 2 under methane-rich fluid invasion (actual value, m3/day) with the theoretical values (sum of methane invasion rate and gas production rate in Case 1) at t = 360 days. (a) Gas production rate for different water invasion rates, (b) gas production rate for different methane invasion rates, and (c) gas production rate for different heat invasion rates.
This study employs a conceptual two-dimensional model to simulate the coupled processes of well depressurization and methane-rich fluid invasion in gas hydrate reservoirs. Although the representation of high-permeability conduits is simplified, it enables direct fluid invasion and provides insights into fluid–hydrate interactions. The model domain is small and the vertical thickness defines a computational layer only, with constant-temperature, impermeable lateral boundaries. Consequently, absolute gas and water production values are indicative rather than predictive, and long-term or high-intensity fluid injection may cause pressure disturbances at the boundaries. The model reflects the evolution of a single well or representative unit and cannot directly represent large-scale reservoirs or well-field systems. Despite these limitations, the model reliably captures relative trends in hydrate dissociation, gas and water production, and the effects of fluid invasion, making it suitable primarily as a conceptual tool for mechanism exploration.
4. Conclusions and Outlook
The main findings and future perspectives of this study are summarized as follows:
- (1)
- The invasion of methane-rich fluid into gas hydrate systems exhibits a three-phase impact on gas production dynamics. In the initial stage, the invasion shows no significant effect. After a certain period, it begins to enhance hydrate dissociation but temporarily inhibits gas production. Under sustained invasion, it significantly promotes hydrate dissociation and increases gas production. Future studies should focus on quantifying the critical transition thresholds between the inhibition and promotion phases of gas production under field-scale conditions; this is essential for optimizing depressurization strategies and improving production efficiency.
- (2)
- Low water invasion and elevated heat supply enhance hydrate dissociation and promote gas production. In contrast, high methane flux reduces hydrate dissociation and increases external methane accumulation in reservoir pores. Notably, excessive methane input may lead to the formation of new hydrate exceeding the amount of dissociated hydrate in the reservoir. Therefore, in future field development site selection, priority should be given to fluid conduit-associated gas hydrate systems characterized by high methane flux, high heat flux, and low water invasion rates, as these conditions are more favorable for efficient and stable gas recovery.
- (3)
- When the actual gas production exceeds the theoretical value, it confirms that methane-rich fluid invasion enhances hydrate-reservoir gas production, exhibiting a synergistic “1 + 1 > 2” effect, particularly at low water or methane invasion rates. Controlled methane-rich fluid injection at optimally low rates may serve as an effective stimulation technique to enhance gas recovery while maintaining reservoir stability. Future studies should focus on the coupled effects of methane and water invasion under depressurization to determine optimal invasion rate combinations for maximizing the synergistic enhancement. Establishing quantitative criteria to identify the onset and intensity of this effect will be crucial for guiding real-time production control and intelligent operation strategies. Additionally, developing advanced monitoring and control technologies to regulate multiphase fluid fluxes, together with long-term assessments of reservoir stability and environmental safety, will support adaptive, high-efficiency, and environmentally sustainable gas production strategies in the SCS and other continental margins.
Supplementary Materials
The following supporting information can be downloaded at https://www.mdpi.com/article/10.3390/jmse13112166/s1. Figure S1. Evolution of reservoir properties in Case 1 (35 m × 30 m): (a) pressure (P), (b) temperature (T), (c) hydrate saturation (Sh), (d) gas saturation (Sg), and (e) water saturation (Sw). Figure S2. Spatial distributions of (a) gas saturation (Sg) and (b) water saturation (Sw) at t = 10 days for Case 2 (30 m × 10 m). Figure S3. Reservoir physical field distributions for (a) Case 1 and (b) Case 2 at t = 30 days (50 m × 50 m). Table S1. Cases setup. Figure S4. Evolution of (a) gas production rate, (b) water production rate, (c) gas-to-water ratio, (d) cumulative volume of the released gas, (e) cumulative volume of the free gas in the domain, and (f) remaining mass of hydrate in the reservoir for Cases 1, a, and a–1~a–9. Figure S5. Evolution of (a) gas production rate, (b) water production rate, (c) gas-to-water ratio, (d) cumulative volume of the released gas, (e) cumulative volume of the free gas in the domain, and (f) remaining mass of hydrate in the reservoir for Cases 1, b, and b–1~b–18. Figure S6. Evolution of (a) gas production rate, (b) water production rate, (c) gas-to-water ratio, (d) cumulative volume of the released gas, (e) cumulative volume of the free gas in the domain, and (f) remaining mass of hydrate in the reservoir for Cases 1, c, and c–1~c–10. Table S2. Times at which the gas production rate significantly increases and exceeds that of Case 1 under different water, methane, and heat input rates. Table S3. Methane invasion rate and actual gas production rate at t = 360 day in Cases M1~M18 and Case 2.
Author Contributions
Conceptualization, P.M.; methodology, P.M.; data curation, P.M.; writing—original draft preparation, P.M.; funding acquisition, P.M.; reviewing and editing, W.L., Y.W. and N.W.; supervision, W.L. and N.W. All authors have read and agreed to the published version of the manuscript.
Funding
This research was funded by the National Natural Science Foundation of China (grant number: 42506218, 42476252), the Postdoctoral Fellowship Program of CPSF (grant number: GZB20230682), and the China Postdoctoral Science Foundation (grant number: 2023M743295).
Institutional Review Board Statement
Not applicable.
Informed Consent Statement
Not applicable.
Data Availability Statement
Research data to this article can be found online at https://figshare.com/account/home#/projects/262501 (accessed on 1 September 2025).
Conflicts of Interest
The authors declare no conflicts of interest. The funders had no role in the design of the study; in the collection, analyses, or interpretation of data; in the writing of the manuscript; or in the decision to publish the results.
Abbreviations
The following abbreviations are used in this manuscript:
| SCS | South China Sea |
| H2O | Water |
| CH4 | Methane |
| MTD | Mass transport deposit |
| HAR | High amplitude reflection |
| GHSZ | Gas hydrate stability zone |
| BGHSZ | Base of gas hydrate stability zone |
| BSR | Bottom-simulating reflections |
| PRMB | Pearl River Mouth Basin |
| QDNB | Qiongdongnan Basin |
| FII | Fault |
| SW | Southwest |
| NE | Northeast |
References
- Wu, N.; Li, Y.; Wan, Y.; Sun, J.; Huang, L.; Mao, P. Prospect of Marine Natural Gas Hydrate Stimulation Theory and Technology System. Nat. Gas Ind. B 2021, 8, 173–187. [Google Scholar] [CrossRef]
- Wu, P.; Li, Y.; Yu, T.; Wu, Z.; Huang, L.; Wang, H.; Song, Y. Microstructure Evolution and Dynamic Permeability Anisotropy during Hydrate Dissociation in Sediment under Stress State. Energy 2023, 263, 126126. [Google Scholar] [CrossRef]
- Kvenvolden, K.A. Gas Hydrates-Geological Perspective and Global Change. Rev. Geophys. 1993, 31, 173–187. [Google Scholar] [CrossRef]
- Wu, P.; Dong, Z.; Huang, Z.; Zhi, Y.; Li, Y.; Song, Y. A Novel High-Pressure and Low-Temperature Ring Shear Apparatus for Large-Scale Deformation of Hydrate-Bearing Sediment. Energy Fuels 2025, 39, 18870–18879. [Google Scholar] [CrossRef]
- Li, X.-Y.; Feng, J.-C.; Li, X.-S.; Wang, Y.; Hu, H.-Q. Experimental Study of Methane Hydrate Formation and Decomposition in the Porous Medium with Different Thermal Conductivities and Grain Sizes. Appl. Energy 2022, 305, 117852. [Google Scholar] [CrossRef]
- Li, A.; Wu, N.; Li, Q.; Wang, Z.; Wan, Y.; Cai, F.; Sun, Z.; Feng, D. Methane Seepage Caused by Gas Hydrate Dissociation in the Mid-Okinawa Trough Since the Last Glacial Maximum. Geophys. Res. Lett. 2023, 50, e2023GL103375. [Google Scholar] [CrossRef]
- Phrampus, B.J.; Hornbach, M.J. Recent Changes to the Gulf Stream Causing Widespread Gas Hydrate Destabilization. Nature 2012, 490, 527–530. [Google Scholar] [CrossRef]
- Berndt, C.; Feseker, T.; Treude, T.; Krastel, S.; Liebetrau, V.; Niemann, H.; Bertics, V.J.; Dumke, I.; Dünnbier, K.; Ferré, B.; et al. Temporal Constraints on Hydrate-Controlled Methane Seepage off Svalbard. Science 2014, 343, 284–287. [Google Scholar] [CrossRef] [PubMed]
- Skarke, A.; Ruppel, C.; Kodis, M.; Brothers, D.; Lobecker, E. Widespread Methane Leakage from the Sea Floor on the Northern US Atlantic Margin. Nat. Geosci. 2014, 7, 657–661. [Google Scholar] [CrossRef]
- Portnov, A.; Vadakkepuliyambatta, S.; Mienert, J.; Hubbard, A. Ice-Sheet-Driven Methane Storage and Release in the Arctic. Nat. Commun. 2016, 7, 10314. [Google Scholar] [CrossRef]
- Ruppel, C.D.; Kessler, J.D. The Interaction of Climate Change and Methane Hydrates. Rev. Geophys. 2017, 55, 126–168. [Google Scholar] [CrossRef]
- Kim, B.; Zhang, Y.G. Methane Hydrate Dissociation across the Oligocene–Miocene Boundary. Nat. Geosci. 2022, 15, 203–209. [Google Scholar] [CrossRef]
- Tréhu, A.M.; Long, P.E.; Torres, M.E.; Bohrmann, G.; Rack, F.R.; Collett, T.S.; Goldberg, D.S.; Milkov, A.V.; Riedel, M.; Schultheiss, P.; et al. Three-Dimensional Distribution of Gas Hydrate beneath Southern Hydrate Ridge: Constraints from ODP Leg 204. Earth Planet. Sci. Lett. 2004, 222, 845–862. [Google Scholar] [CrossRef]
- Collett, T.S.; Lee, M.W.; Zyrianova, M.V.; Mrozewski, S.A.; Guerin, G.; Cook, A.E.; Goldberg, D.S. Gulf of Mexico Gas Hydrate Joint Industry Project Leg II Logging-While-Drilling Data Acquisition and Analysis. Mar. Pet. Geol. 2012, 34, 41–61. [Google Scholar] [CrossRef]
- Ishizu, K.; Oda, A.; Goto, T.; Kasaya, T.; Watanabe, T.; Machiyama, H. Electrical Resistivity Tomography Combined with Seismic Data Estimates Heterogeneous Distribution of Near-Seafloor Concentrated Gas Hydrates within Gas Chimneys. Sci. Rep. 2024, 14, 15045. [Google Scholar] [CrossRef] [PubMed]
- Solomon, E.A.; Kastner, M.; Jannasch, H.; Robertson, G.; Weinstein, Y. Dynamic Fluid Flow and Chemical Fluxes Associated with a Seafloor Gas Hydrate Deposit on the Northern Gulf of Mexico Slope. Earth Planet. Sci. Lett. 2008, 270, 95–105. [Google Scholar] [CrossRef]
- Liu, J.; Haeckel, M.; Rutqvist, J.; Wang, S.; Yan, W. The Mechanism of Methane Gas Migration Through the Gas Hydrate Stability Zone: Insights From Numerical Simulations. J. Geophys. Res. Solid. Earth 2019, 124, 4399–4427. [Google Scholar] [CrossRef]
- Flemings, P.B.; Liu, X.; Winters, W.J. Critical Pressure and Multiphase Flow in Blake Ridge Gas Hydrates. Geology 2003, 31, 1057. [Google Scholar] [CrossRef]
- Liu, X.; Flemings, P.B. Dynamic Multiphase Flow Model of Hydrate Formation in Marine Sediments. J. Geophys. Res. 2007, 112, b03101. [Google Scholar] [CrossRef]
- Dugan, B.; Flemings, P.B. Overpressure and Fluid Flow in the New Jersey Continental Slope: Implications for Slope Failure and Cold Seeps. Science 2000, 289, 288–291. [Google Scholar] [CrossRef] [PubMed]
- Davies, R.J.; Yang, J.; Ireland, M.T.; Berndt, C.; Maqueda, M.Á.M.; Huuse, M. Long-Distance Migration and Venting of Methane from the Base of the Hydrate Stability Zone. Nat. Geosci. 2024, 17, 32–37. [Google Scholar] [CrossRef]
- You, K.; Flemings, P.B. Methane Hydrate Formation in Thick Sandstones by Free Gas Flow. J. Geophys. Res. Solid Earth 2018, 123, 4582–4600. [Google Scholar] [CrossRef]
- Liu, H.; Zhan, L.; Zhang, J.; Shang, S.; Lu, H. Numerical Investigation on Environmental Effect Associated with Gas-Hydrate Exploitation. Geoenergy Sci. Eng. 2023, 227, 211857. [Google Scholar] [CrossRef]
- Shi, K.; Wei, K.; Jiang, Z.; Fan, Q.; Li, Q.; Leng, S.; Zhou, Y.; Zhang, L.; Liu, Y.; Zhao, J.; et al. Optimization of Energy Efficiency in Gas Production from Hydrates Assisted by Geothermal Energy Enriched in the Deep Gas. Int. J. Heat Mass Transf. 2024, 234, 126122. [Google Scholar] [CrossRef]
- Zhang, W.; Liang, J.; Su, P.; Meng, M.; Huang, W.; Liu, P.; Yuan, S.; Ji, C. Dynamic Accumulation of a High-Grade Gas Hydrate System: Insights from the Trial Production Gas Hydrate Reservoir in the Shenhu Area, Northern South China Sea. Front. Mar. Sci. 2024, 11, 1418716. [Google Scholar] [CrossRef]
- Chen, Z.; Jiang, T.; Kuang, Z.; Cheng, C.; Xiong, P.; Chen, Y. Accumulation characteristics of gas hydrate-shallow gas symbiotic system in Qiongdongnan Basin. Earth Sci. 2022, 47, 1619–1634. [Google Scholar] [CrossRef]
- Wang, J.; Li, A.; Wang, L.H.; Wu, S.; Li, Q. Submarine Fluid Flow System Feeding Methane Emission in the Northern South China Sea. Basin Res. 2024, 36, e12839. [Google Scholar] [CrossRef]
- Wu, S.; Sun, J.; Li, Q.; Ma, Y.; Lüdmann, T. Potential on Joint Development of Three-Gas Reservoirs in the Qiongdongnan Basin. Innov. Geosci. 2024, 2, 100065. [Google Scholar] [CrossRef]
- Wu, S.; Wu, S.; Sun, J.; Li, Q.; Chen, J.; Chen, Y.; Zhou, X.; Khan, U. The Spatial Coupling of Fluid Pathways with Gas Hydrates and Shallow Gas Reservoirs: A Case Study in the Qiongdongnan Basin, South China Sea. J. Mar. Sci. Eng. 2024, 12, 659. [Google Scholar] [CrossRef]
- Hustoft, S.; Mienert, J.; Bünz, S.; Nouzé, H. High-Resolution 3D-Seismic Data Indicate Focussed Fluid Migration Pathways above Polygonal Fault Systems of the Mid-Norwegian Margin. Mar. Geol. 2007, 245, 89–106. [Google Scholar] [CrossRef]
- Wang, X.; Sun, Q.; Wang, H.; Yin, S.; Wan, X.; Chen, J.; Hernández-Molina, F.J. Flow Conditions of the Quaternary Deep-Water Current Reconstructed by Sediment Waves in the Northeastern South China Sea. Mar. Geol. 2024, 477, 107414. [Google Scholar] [CrossRef]
- Zhang, W.; Liang, J.; Wei, J.; Lu, J.; Su, P.; Lin, L.; Huang, W.; Guo, Y.; Deng, W.; Yang, X.; et al. Geological and Geophysical Features of and Controls on Occurrence and Accumulation of Gas Hydrates in the First Offshore Gas-Hydrate Production Test Region in the Shenhu Area, Northern South China Sea. Mar. Pet. Geol. 2020, 114, 104191. [Google Scholar] [CrossRef]
- Mao, P.; Wan, Y.; Sun, J.; Li, Y.; Hu, G.; Ning, F.; Wu, N. Numerical Study of Gas Production from Fine-Grained Hydrate Reservoirs Using a Multilateral Horizontal Well System. Appl. Energy 2021, 301, 117450. [Google Scholar] [CrossRef]
- Moridis, G. User’s Manual of the TOUGH+ Core Code v1.5: A General-Purpose Simulator of Non-Isothermal Flow and Transport Through Porous and Fractured Media; LBNL-6871E; LBL Publications: Berkeley, CA, USA, 2014; p. 1165988. [Google Scholar]
- Yin, Z.; Zhang, S.; Koh, S.; Linga, P. Estimation of the Thermal Conductivity of a Heterogeneous CH4-Hydrate Bearing Sample Based on Particle Swarm Optimization. Appl. Energy 2020, 271, 115229. [Google Scholar] [CrossRef]
- van Genuchten, M.T. A Closed-Form Equation for Predicting the Hydraulic Conductivity of Unsaturated Soils. Soil Sci. Soc. Am. J. 1980, 44, 892–898. [Google Scholar] [CrossRef]
- Zhao, Q.; Li, X.-S.; Chen, Z.-Y.; Li, Q.-P.; He, J. Dynamic Competitive Co-Production Behaviors between Natural Gas Hydrate and Higher-Pressure Shallow Gas under Wellbore Interference: An Experimental Study. Appl. Energy 2025, 384, 125474. [Google Scholar] [CrossRef]
- Yu, J.; Zhuo, L.; Chen, Y.; Sun, W.; Liu, Y. Production Performance Analysis of Class II Hydrate-Bearing Layers Based on an Analytic Aquifer Model. Front. Energy Res. 2021, 9, 702456. [Google Scholar] [CrossRef]
- Yang, L.; Falenty, A.; Chaouachi, M.; Haberthür, D.; Kuhs, W.F. Synchrotron X-Ray Computed Microtomography Study on Gas Hydrate Decomposition in a Sedimentary Matrix. Geochem. Geophys. Geosyst. 2016, 17, 3717–3732. [Google Scholar] [CrossRef]
- He, Y.; Liang, J.; Shi, W.; Kuang, Z.; Deng, W.; Wang, R.; Xu, L.; Du, H. Influencing factors and accumulation modes of gas hydrate in south low uplift and its surrounding area of Qiongdongnan Basin. Earth Sci. 2022, 47, 1711. [Google Scholar] [CrossRef]


Disclaimer/Publisher’s Note: The statements, opinions and data contained in all publications are solely those of the individual author(s) and contributor(s) and not of MDPI and/or the editor(s). MDPI and/or the editor(s) disclaim responsibility for any injury to people or property resulting from any ideas, methods, instructions or products referred to in the content. |
© 2025 by the authors. Licensee MDPI, Basel, Switzerland. This article is an open access article distributed under the terms and conditions of the Creative Commons Attribution (CC BY) license (https://creativecommons.org/licenses/by/4.0/).