Article

Investigation of Cavitation Flow Field and Flow Loss in Shaftless Water-Jet Propulsion Pump Under Different Acceleration Conditions

by
Jianing Lei
1,
Yong Wang
1,2,
Houlin Liu
1,*,
Ming Li
1 and
Qing Pi
1
1
Research Center of Fluid Machinery Engineering and Technology, Jiangsu University, Zhenjiang 212013, China
2
Department of Precision Manufacturing Engineering, Suzhou Vocational Institute of Industrial Technology, Suzhou 215104, China
*
Author to whom correspondence should be addressed.
J. Mar. Sci. Eng. 2025, 13(11), 2165; https://doi.org/10.3390/jmse13112165
Submission received: 15 October 2025 / Revised: 6 November 2025 / Accepted: 8 November 2025 / Published: 17 November 2025
(This article belongs to the Section Ocean Engineering)

Abstract

This study discusses the effect of different acceleration modes on the shaftless water-jet propulsion pump’s operational performance. Following the usage of Renault-time-mean Navier–Stokes (N-S) equations combined with an application of the shear stress transport (SST) k-ω turbulence mode and reinforced by an experimental test platform, the research explores internal energy loss shaftless water-jet propulsion pump flow behavior under exponential and linear acceleration processes. The results indicate that, compared to linear acceleration, the cavity volume within the impeller is marginally greater during the initial phase of exponential acceleration; however, this trend reverses in the subsequent stages; The amplitude of fluctuations in the pressure pulsation coefficient at both the mid-span and root regions of the blade, along with the amplitude corresponding to the primary frequency of the pressure pulsation, are comparatively reduced. Turbulent entropy production at the rim constitutes a significant component of energy loss; however, the total entropy production exceeds this contribution.

1. Introduction

The shaftless water-jet propulsion pump is an advanced marine system that generates thrust using high-speed water jets [1,2]. Unlike conventional shaft-driven propellers, its unique configuration eliminates the mechanical shaft, reducing frictional losses and wear while enhancing propulsion efficiency and operational reliability [3,4]. However, these pumps often operate under transient conditions, such as during ship acceleration, where rapid changes in inflow parameters may provoke cavitation. This phenomenon not only degrades hydraulic performance but also induces significant energy loss, ultimately compromising the system’s propulsive capacity [5]. Thus, a thorough investigation into the transient behavior of shaftless pumps under accelerated conditions is of significant theoretical and practical importance
Experimental approaches have been widely employed to examine the performance and internal flow characteristics of water-jet propulsion pumps. For instance, Miorini et al. [6] used flow visualization to study cavitation processes and observed that cavitation initiates when tip-leakage vortices reach a critical scale. Jiao et al. [7] developed a novel direct thrust measurement system and reported strong periodic fluctuations in transient thrust, dominated by low-frequency pulsations. Gong et al. [8] found that cavitation development enhances the tip-leakage vortex, which spreads towards the blade pressure surface and reduces pump efficiency. Dong et al. [9] investigated the effect of cavitation on pressure pulsation through a cavitation water tunnel experiment, revealing that the circumferential pulsating pressure caused by cavitation is primarily concentrated in low-velocity regions near the inlet channel and impeller hub.
With advancements in computational fluid dynamics (CFD), numerical simulation has become indispensable for analyzing complex internal flow structures. Yang et al. [10] and Gong et al. [11] applied CFD to study azimuth propulsion pumps and stern-jet wake topologies, respectively. Liu et al. [12], Zhu et al. [13], Du et al. [14], and Wang et al. [15] systematically compared shaftless and shafted configurations, demonstrating the superior efficiency and operational range of shaftless designs, especially at high speeds. However, traditional evaluation methods based on the first law of thermodynamics fail to capture the influence of local non-equilibrium flow structures on energy loss [16]. In this context, entropy production theory has emerged as an effective approach for quantifying irreversible energy losses in fluid systems [17]. For example, Ji et al. [18] applied entropy production theory to investigate the effect of impeller tip clearance on hydraulic losses in a mixed-flow pump, finding a significant impact under design conditions. Similarly, Shen et al. [19] used this method to identify the impeller and guide vanes as the main sources of energy dissipation in axial-flow pumps. These studies confirm the utility of entropy production theory in diagnosing loss mechanisms in rotating machinery.
While previous research has extensively examined axial water-jet propulsion pumps, studies on shaftless configurations under accelerated inflow conditions remain limited. More critically, the physical justification for comparing different acceleration profiles has not been clearly established. Physically, linear acceleration represents a theoretical benchmark with a constant loading rate, imposing abrupt fluid and mechanical stresses, whereas exponential acceleration reflects a more realistic operational strategy with smoothly varying load, mimicking the response of actual marine propulsion control systems. The distinct transient loading characteristics of these two profiles are hypothesized to fundamentally alter cavitation dynamics and energy dissipation pathways, necessitating a systematic comparison. Therefore, this study employs numerical simulations to investigate the cavitation flow field and energy loss in a shaftless water-jet propulsion pump under linear and exponential acceleration conditions. The objectives are to (1) validate the numerical methods with experimental data, (2) compare the cavitation flow field and pressure pulsation under different acceleration profiles, and (3) quantify energy loss using entropy production theory to compare cavitation flow loss between the profiles.

2. Numerical Method and Entropy Production Theory

2.1. Governing Equations

The internal flow within the shaftless water-jet propulsion pump is governed by the fundamental laws of conservation of energy, mass, and flow continuity. Therefore, the set of governing equations for the cavitating flow is as follows:
Continuity equation:
t α l ρ l + α l ρ l u l = M c M v
t α v ρ v + α v ρ v u v = M v M c
α l + α v = 1
where α denotes the volume fraction of the fluid medium, subscript l denotes the liquid phase, subscript v denotes the vapor phase, ρ denotes the density of the fluid medium, Mc denotes the vapor condensation rate (mass transfer from vapor to liquid, kg/(m3·s)), and Mv denotes the vaporization rate (mass transfer from liquid to vapor, kg/(m3·s)).
Momentum equation:
t α l ρ l u l + α l ρ l u l u l = α l p + α l μ l ( u l + ( u l ) T ) + F D l F T D v F T D p + M c u v M v u l
t α v ρ v u v + α v ρ v u v u v = α v p + α v μ v ( u v + ( u v ) T ) + F D v + F T D v + M v u l M c u v
where u denotes the velocity vector of the fluid medium, p denotes the pressure on the fluid medium, μ denotes the viscosity coefficient of the fluid medium, FD denotes the interphase drag force, and FTD denotes the turbulent diffusion force.

2.2. Turbulence Model

The Shear Stress Transport (SST) k-ω turbulence model is employed for the numerical calculations in this study. This model was selected due to its well-established accuracy in predicting flows with strong adverse pressure gradients and flow separation, which are critical for capturing the cavitation dynamics on the suction side of the impeller blades. It performs robustly in simulating flow within turbulent boundary layers, near walls, and in free-stream turbulence, making it well-suited for the computational analysis of the shaftless water-jet propulsion pump. The turbulent kinetic energy k equation and the turbulent frequency ω equation are, respectively:
ρ m k t + x j ( ρ m k u j ) = P k D k μ m + μ t σ k k x j
( ρ m ω ) t + x j ( ρ m ω u j ) = C ω P m β ω ρ ω ω 2 + x j μ m + μ t σ k ω x j + 2 ρ m ( 1 F 1 ) σ ω 1 ω k x j ω x j
where Pk denotes the production term of turbulent kinetic energy, Dk denotes the dissipation term, and σk and σω are the corresponding correction coefficients for each equation.

2.3. Cavitation Model

The Zwart–Gerber–Belamri (ZGB) model proposed by Zwart et al. is employed to simulate cavitation. This model has been extensively applied in numerical simulations of cavitating flows [20,21,22], making it a suitable choice for simulating the cavitating flows in the shaftless water-jet propulsion pump. The equations are as follows:
ρ v , c l i p φ v t + ρ v , c l i p φ v u j x j = m
m ˙ + = F v a p 3 α n u c 1 α v ρ v R B 2 3 p v p ρ l ,   p ρ v
m ˙ = F c o n d 3 α v ρ v R B 2 3 p p v ρ l ,   p > ρ v
where ρv,clip denotes the vapor density calculated from the maximum density ratio; pv denotes the vaporization pressure; αv denotes the vapor phase volume fraction; αnuc denotes the volume fraction of the cavitating nucleon, which is 5 × 10⁻⁴; RB denotes the cavity radius with valve of 2 × 10⁻⁶ m; and the constants Fvap and Fcond are 50 and 0.01, respectively.
Standard RANS models can over-predict the eddy viscosity in the two-phase cavity region. To mitigate this effect and enhance the cavitation simulation, the turbulent kinetic energy is incorporated to correct the local vaporization pressure in the cavitation model, as detailed in Equation (11). This combined approach of the SST k-ω model with turbulence correction has been widely validated for cavitating flows in hydraulic machinery [23,24]. Accordingly, the vaporization pressure is well corrected by incorporating the turbulent kinetic energy as follows:
p v = p s a t + 0.195 ρ l k l
where psat denotes the saturated vapor pressure (Pa) and kl denotes the local turbulent kinetic energy in the liquid phase (m2/s2). This empirical modification has been extensively validated [25].

2.4. Simulation Setup

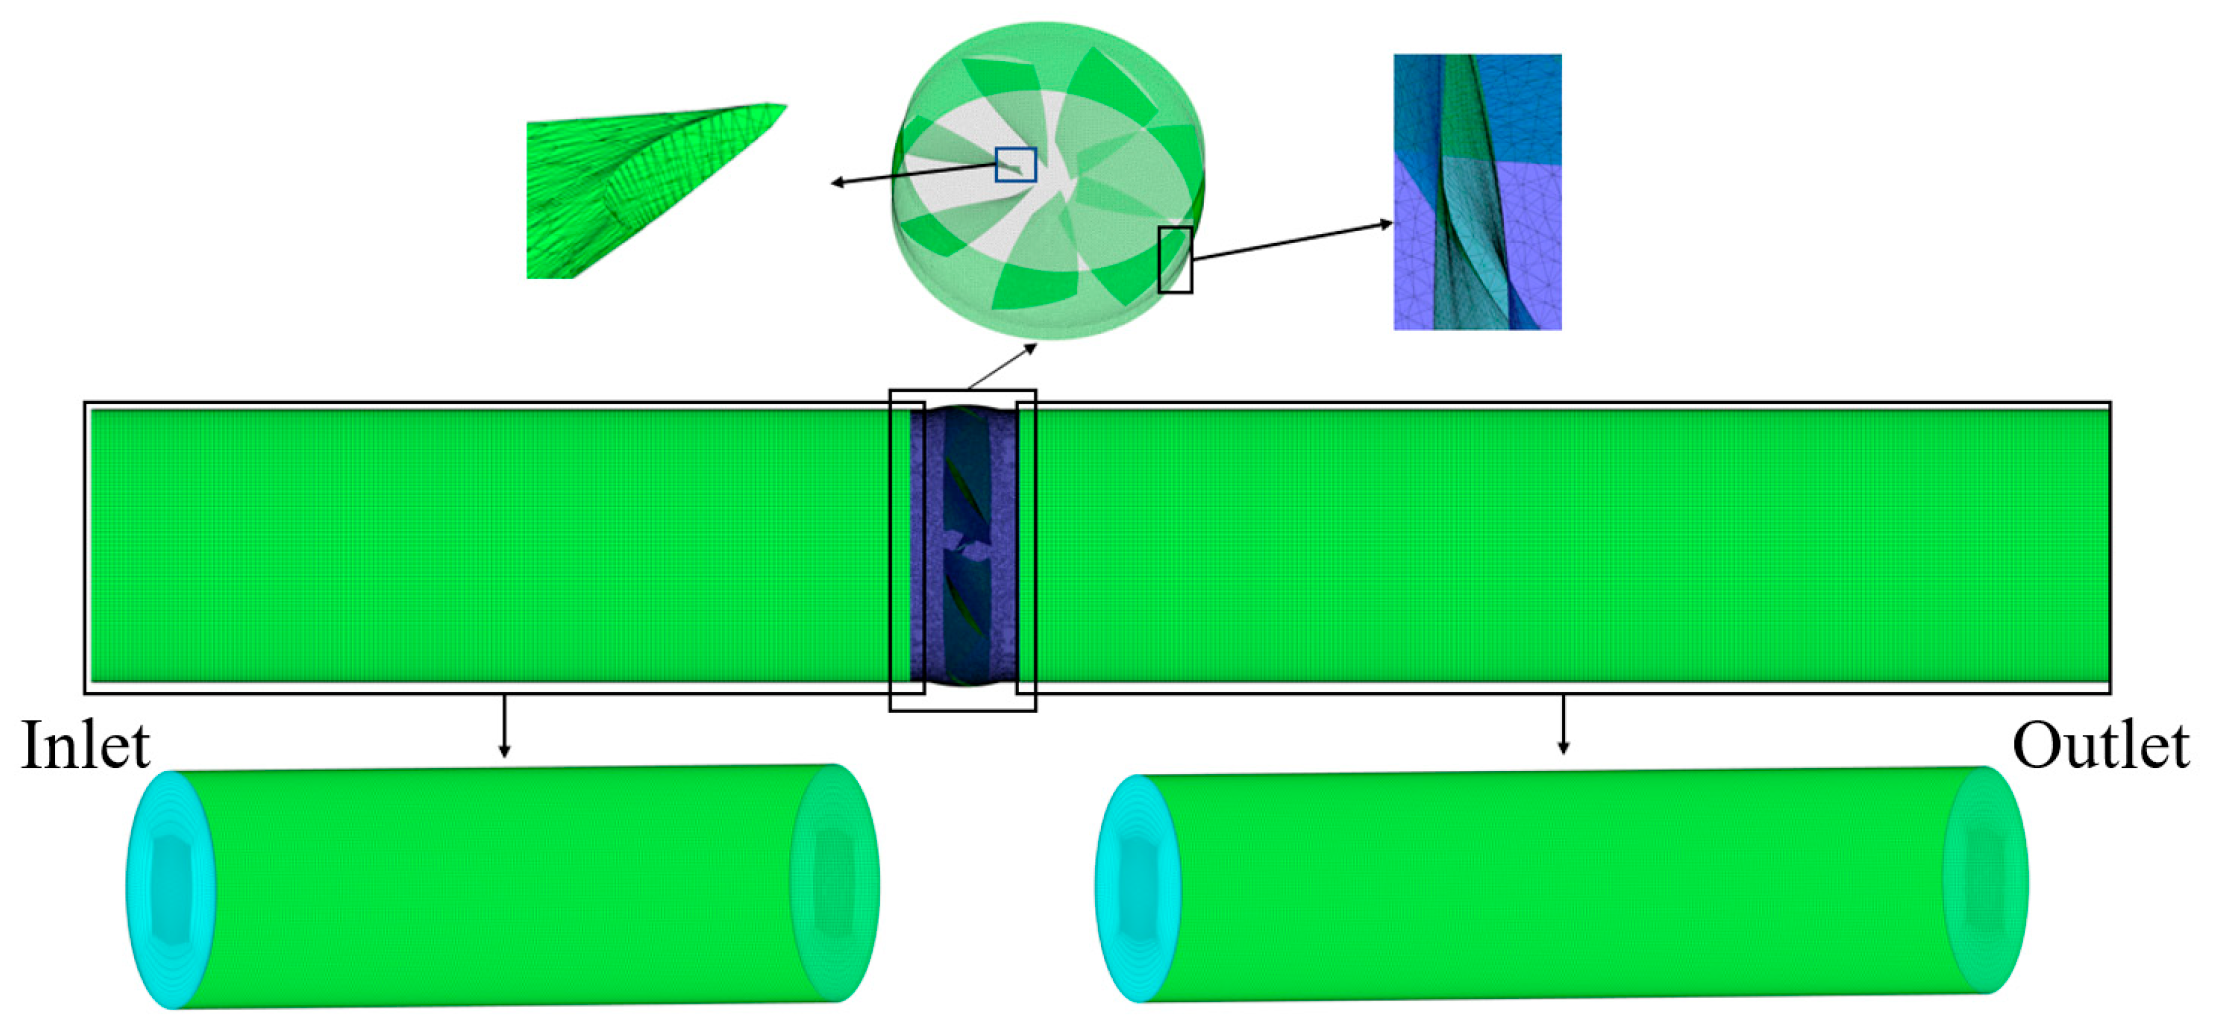
The computational domain of the shaftless water-jet propulsion pump is shown in Figure 1. It comprises three sequential sections: the inlet channel, the impeller, and the outlet channel. The inlet and outlet channels share the same diameter as the impeller, with lengths of 3 and 4 times the impeller diameter, respectively. The key hydraulic parameters are summarized in Table 1.
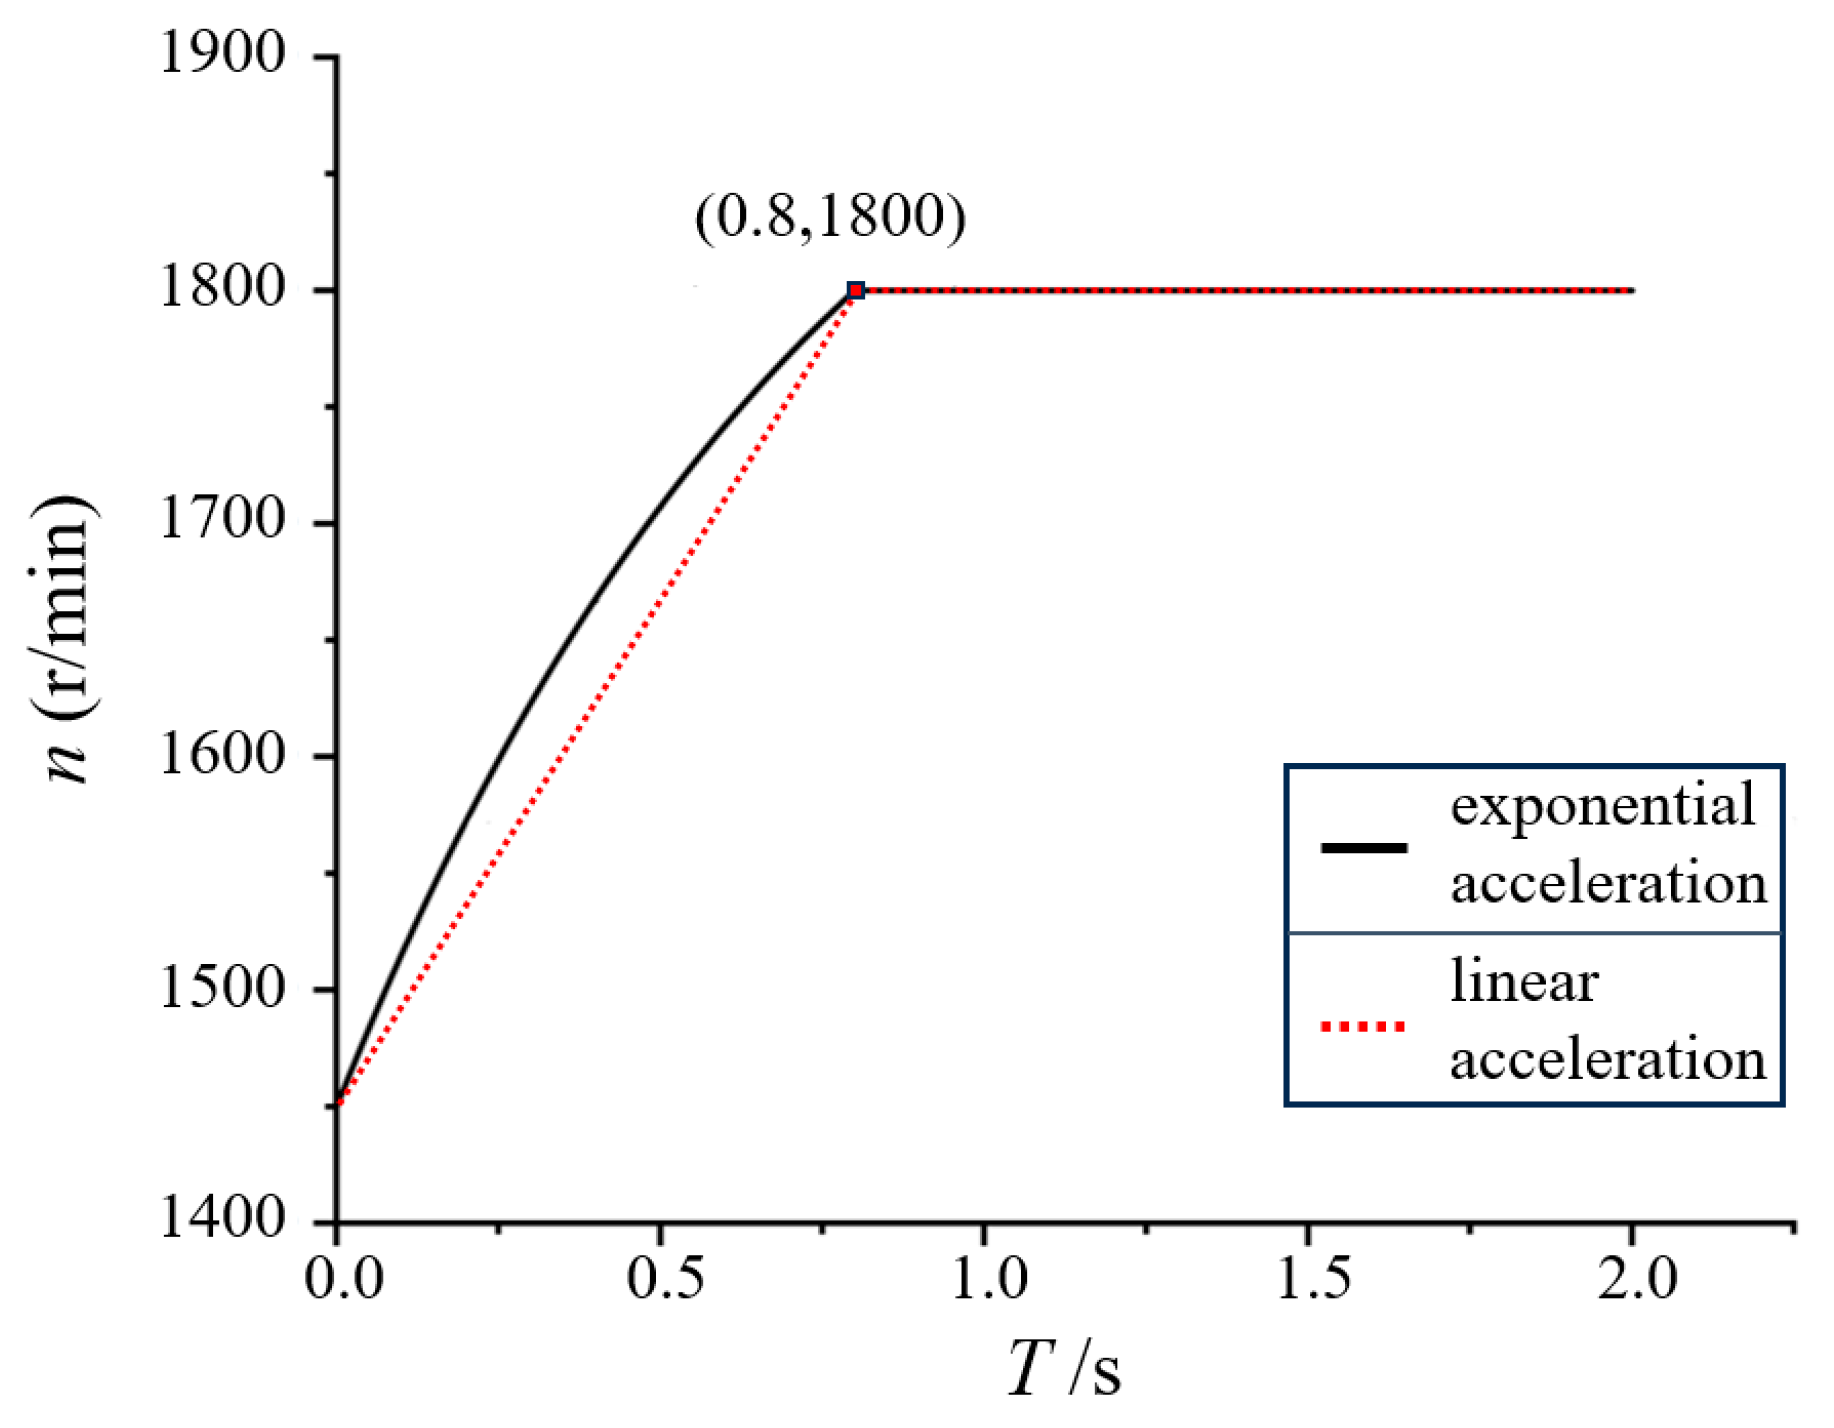
To simulate accelerated navigation, a condition frequently encountered during ship maneuvering and speed changes, the rotational speed of the shaftless water-jet propulsion pump was increased from its baseline rated speed of 1450 r/min to 1800 r/min. This speed range, extending approximately 24% beyond the rated value, was selected to represent a typical overload or high-thrust demand scenario in marine propulsion practice, such as during rapid acceleration or overcoming increased resistance. Such transient high-speed operation is critical for assessing pump performance and cavitation characteristics under demanding conditions. Two acceleration profiles were implemented: linear and exponential.
The basic equation for linear acceleration is:
x ( t ) = x 0 + x a t
The basic equation for exponential acceleration is:
x ( t ) = x 0 + x a ( 1 e t t 0 )
where x0 denotes the initial speed of the impeller; xa denotes the acceleration of the impeller; t is a certain time during the acceleration of the impeller; and t0 denotes the total time for the impeller to accelerate.
The total acceleration time for both schemes is defined as T, and the variation curve of the rotational speed of the shaftless water-jet propulsion pump is shown in Figure 2. The two profiles were selected for their contrasting jerk characteristics. The profile in Equation (12) features a theoretically infinite jerk at the acceleration boundaries, representing a severe, idealized transient load. In contrast, Equation (13) ensures a continuous, finite jerk, leading to a smoother mechanical response. This comparison isolates the effect of transient loading severity on internal cavitating flow, bridging the gap between a theoretical benchmark and a realistic, controller-mediated scenario.
We set the inlet boundary as the total pressure and the outlet boundary as the mass flow rate. The calculation domain of the propeller pump impeller is arranged in a rotating coordinate system, set to rotate around the Z-axis. The interfaces of the computational domains of each hydraulic component are connected by the GGI mode, all wall boundaries are set as non-slip walls, the wall roughness is set to 1 μm, and the wall function is set as the automatic type. For handling multiple reference frames at the rotating and stationary interfaces, the dynamic and static interfaces are set to the frozen rotor type. The convergence precision is set to 1 × 10⁻⁴, with a time step of 0.00023 s, and each time step is iterated 10 times. The convection term is discretized using the higher-order analytical format, the diffusion term is discretized using the central difference format, and the transient equation is discretized using the second-order implicit method.
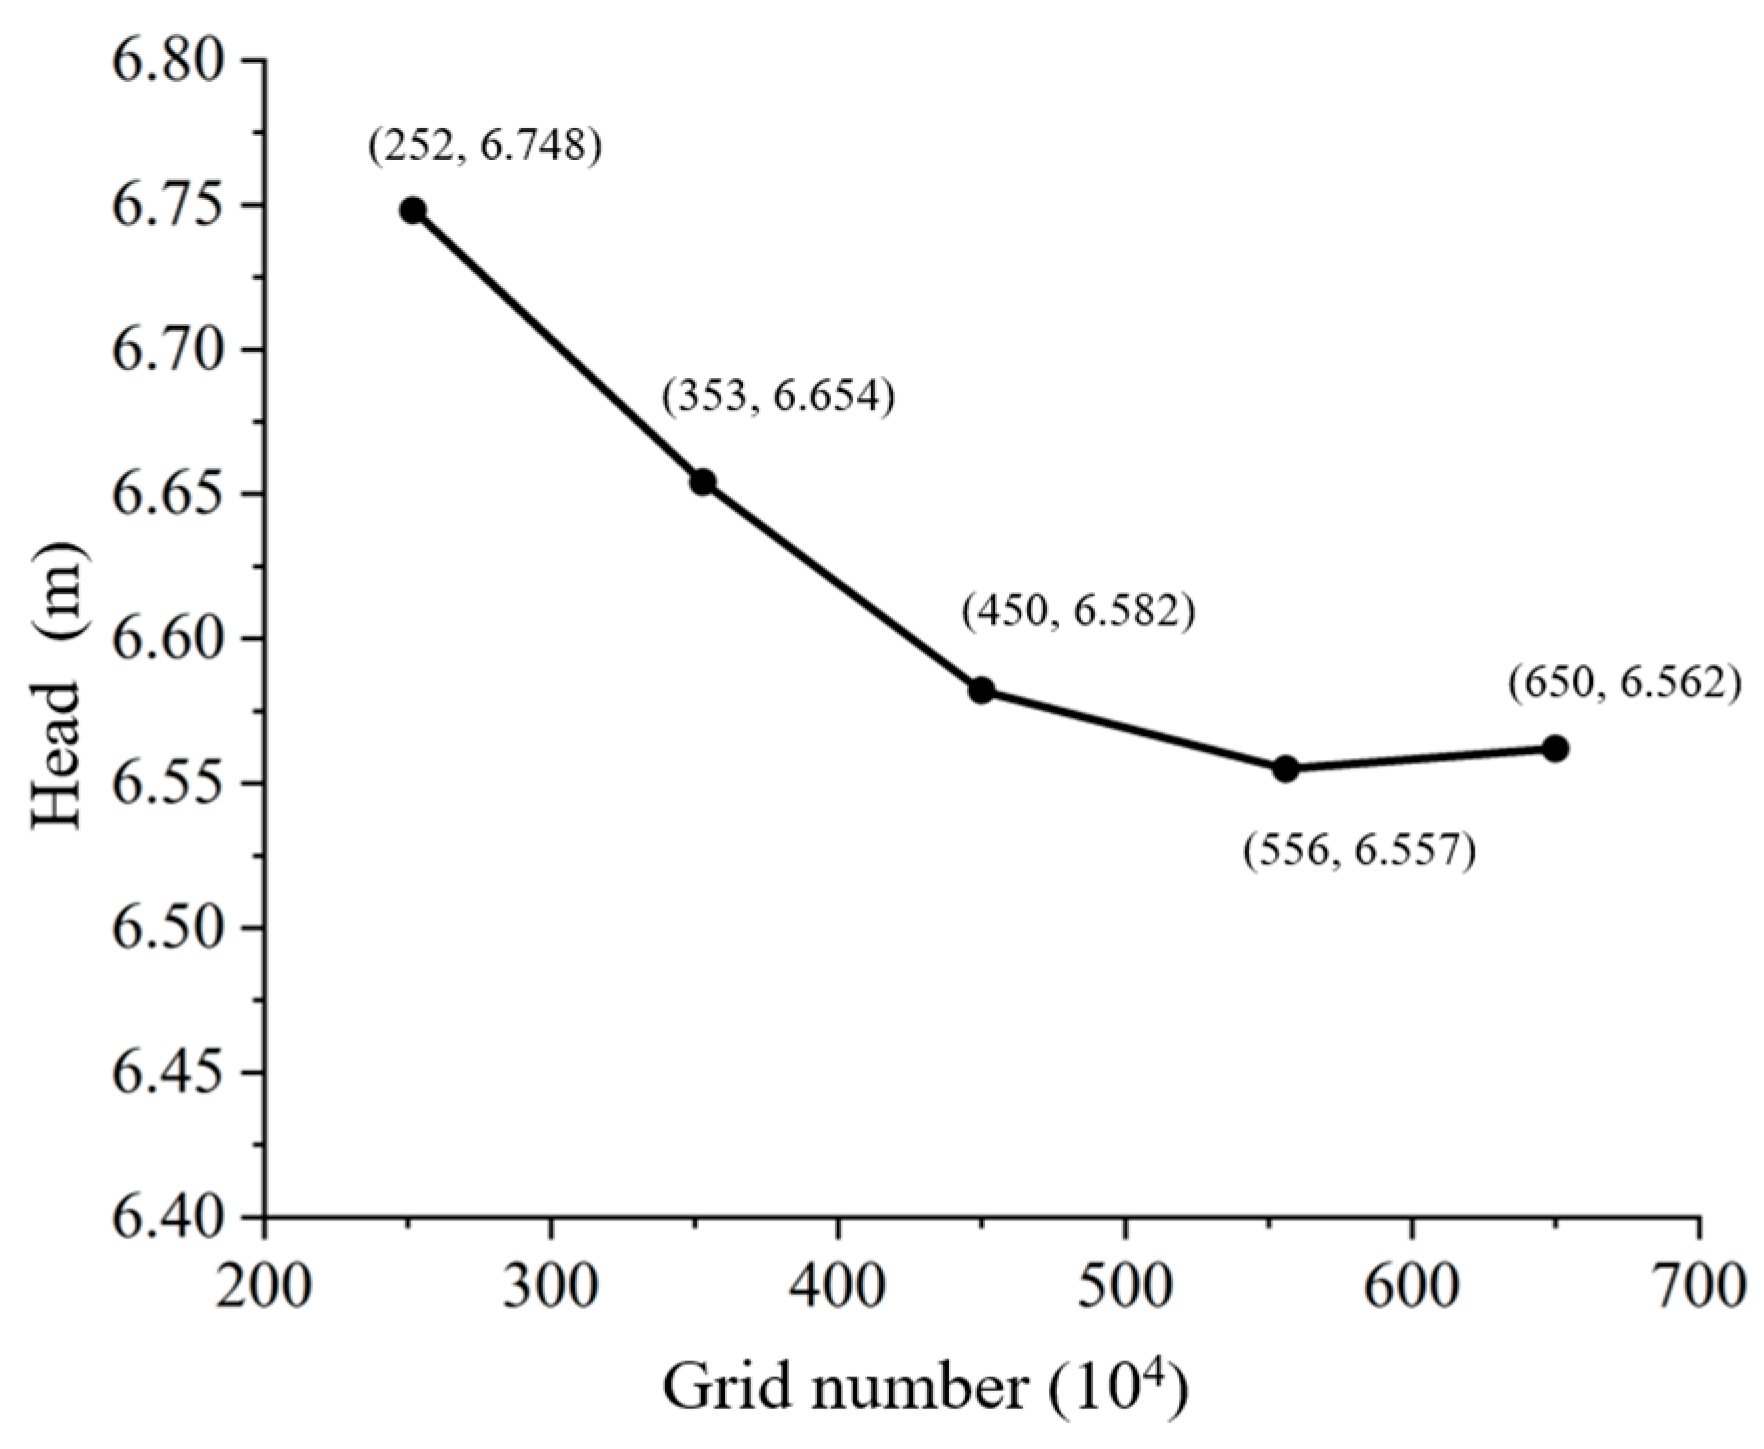
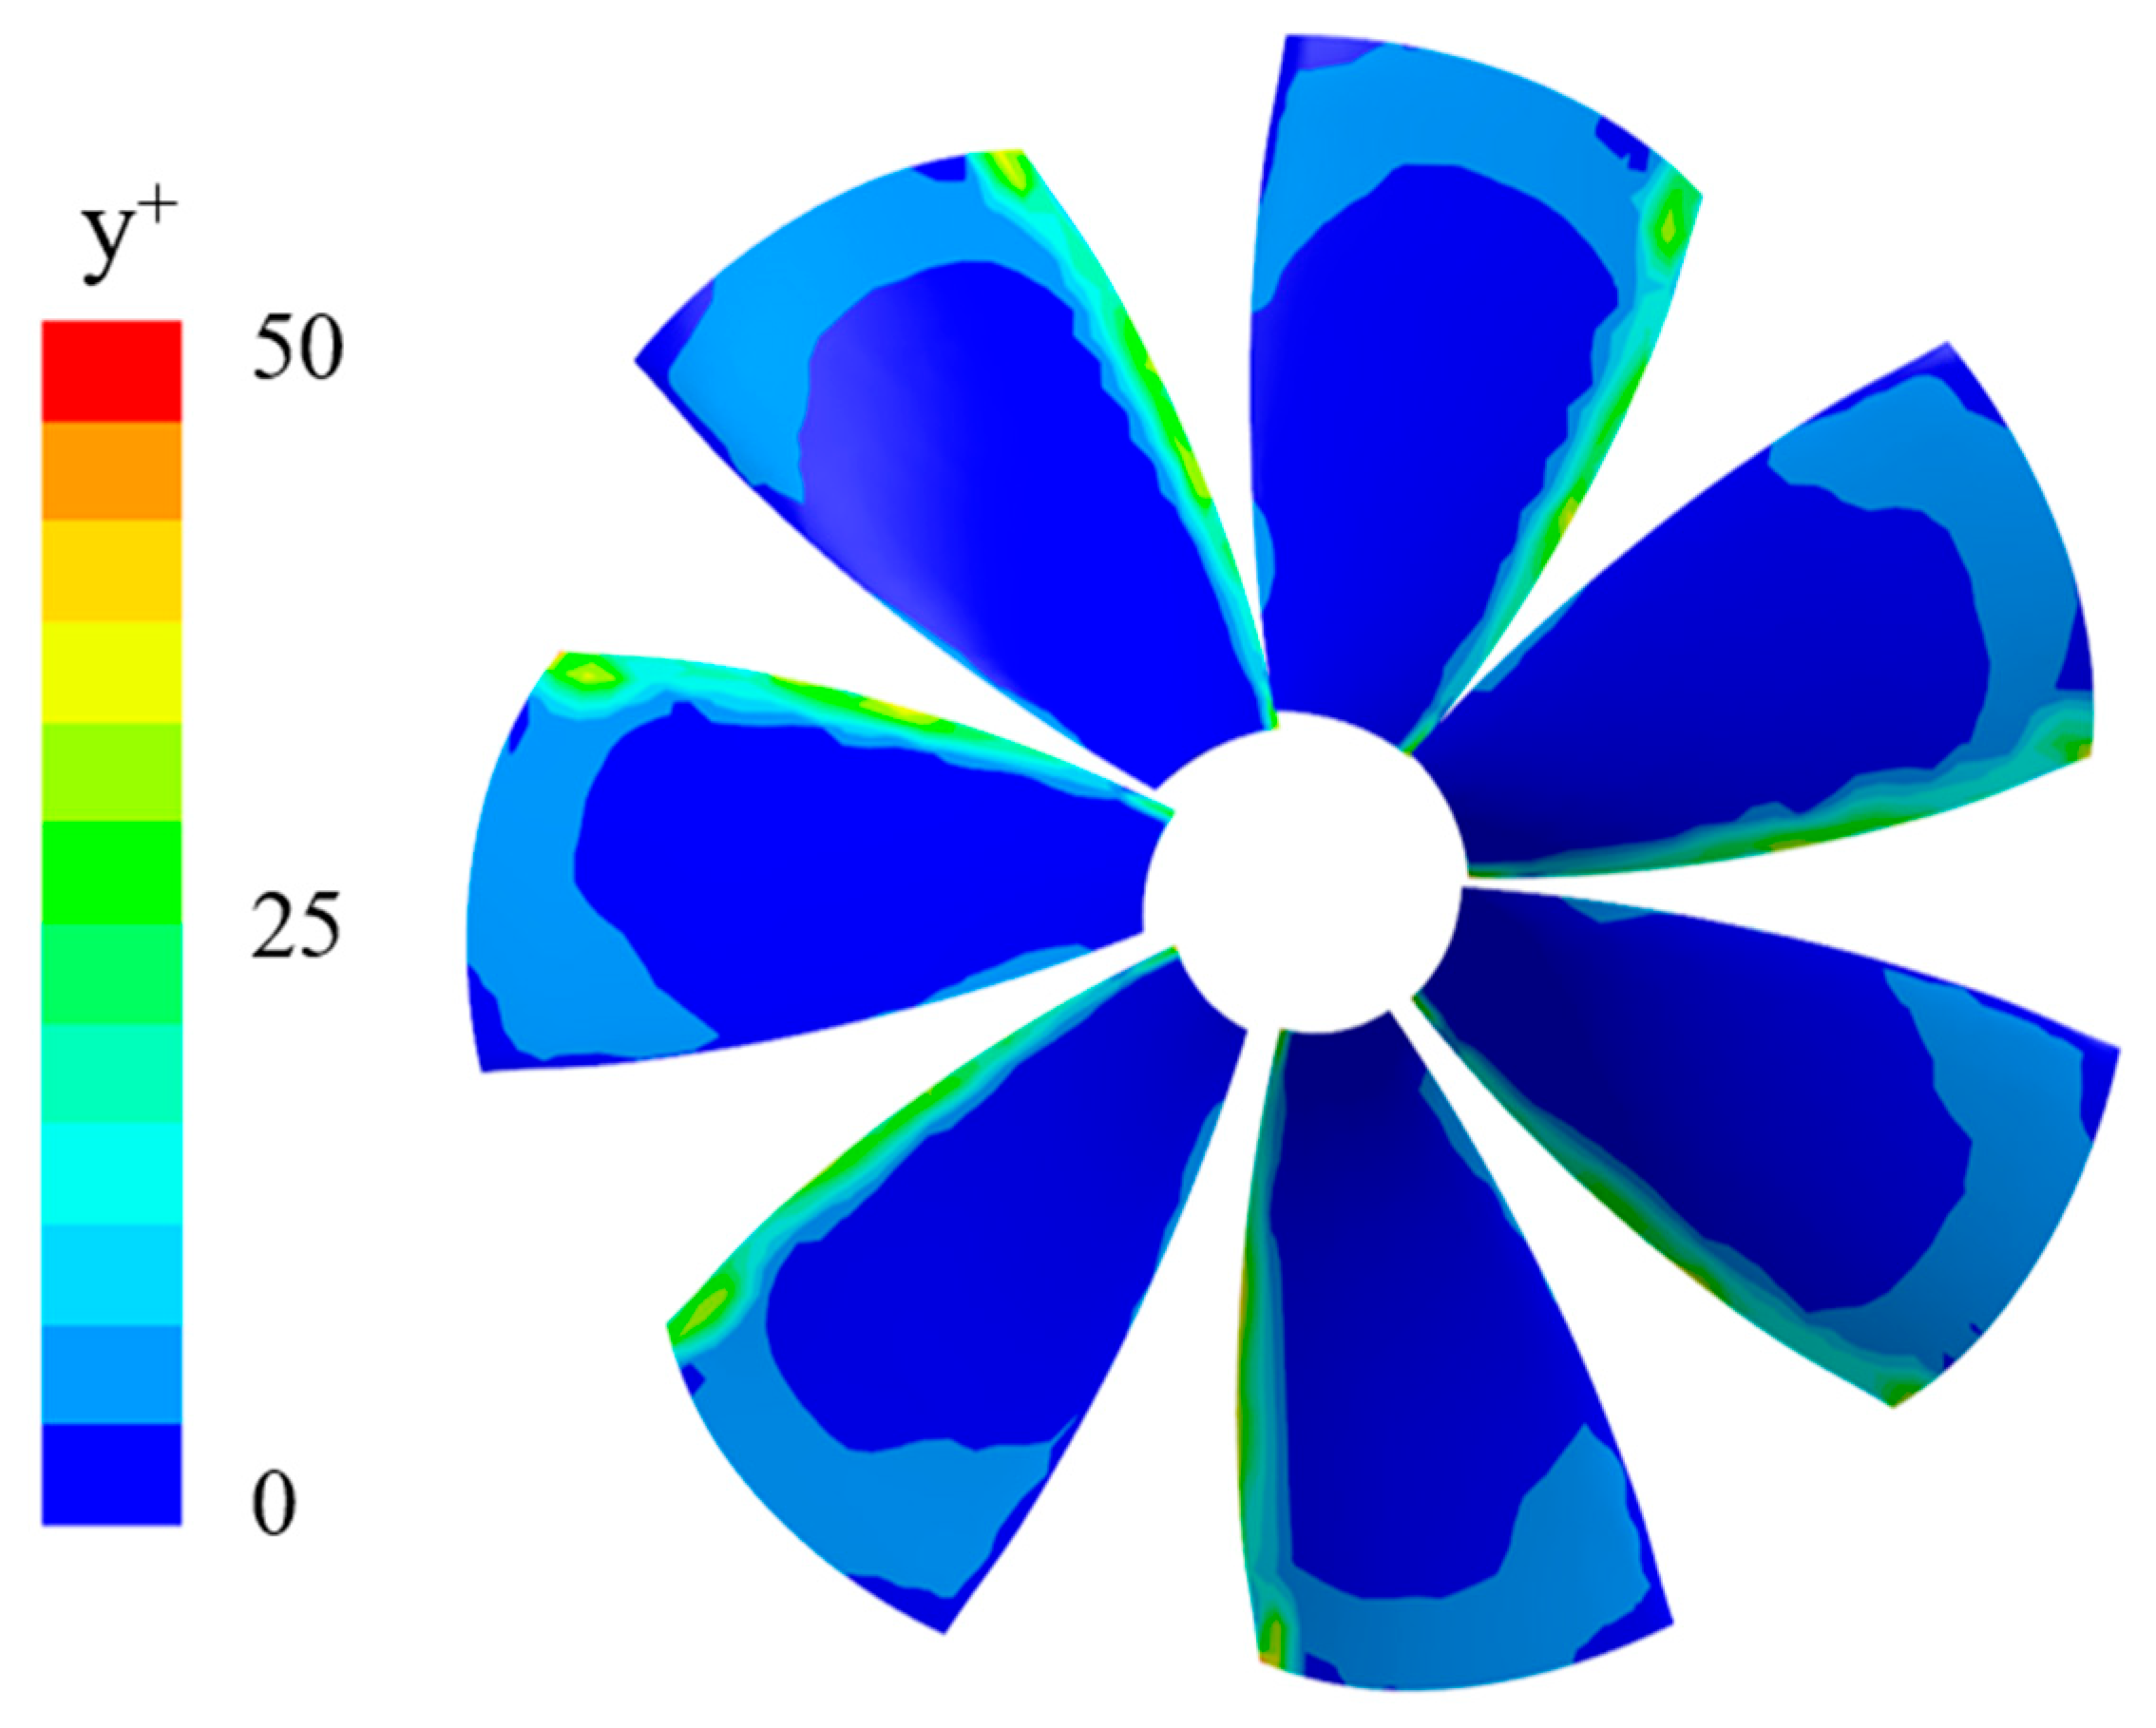
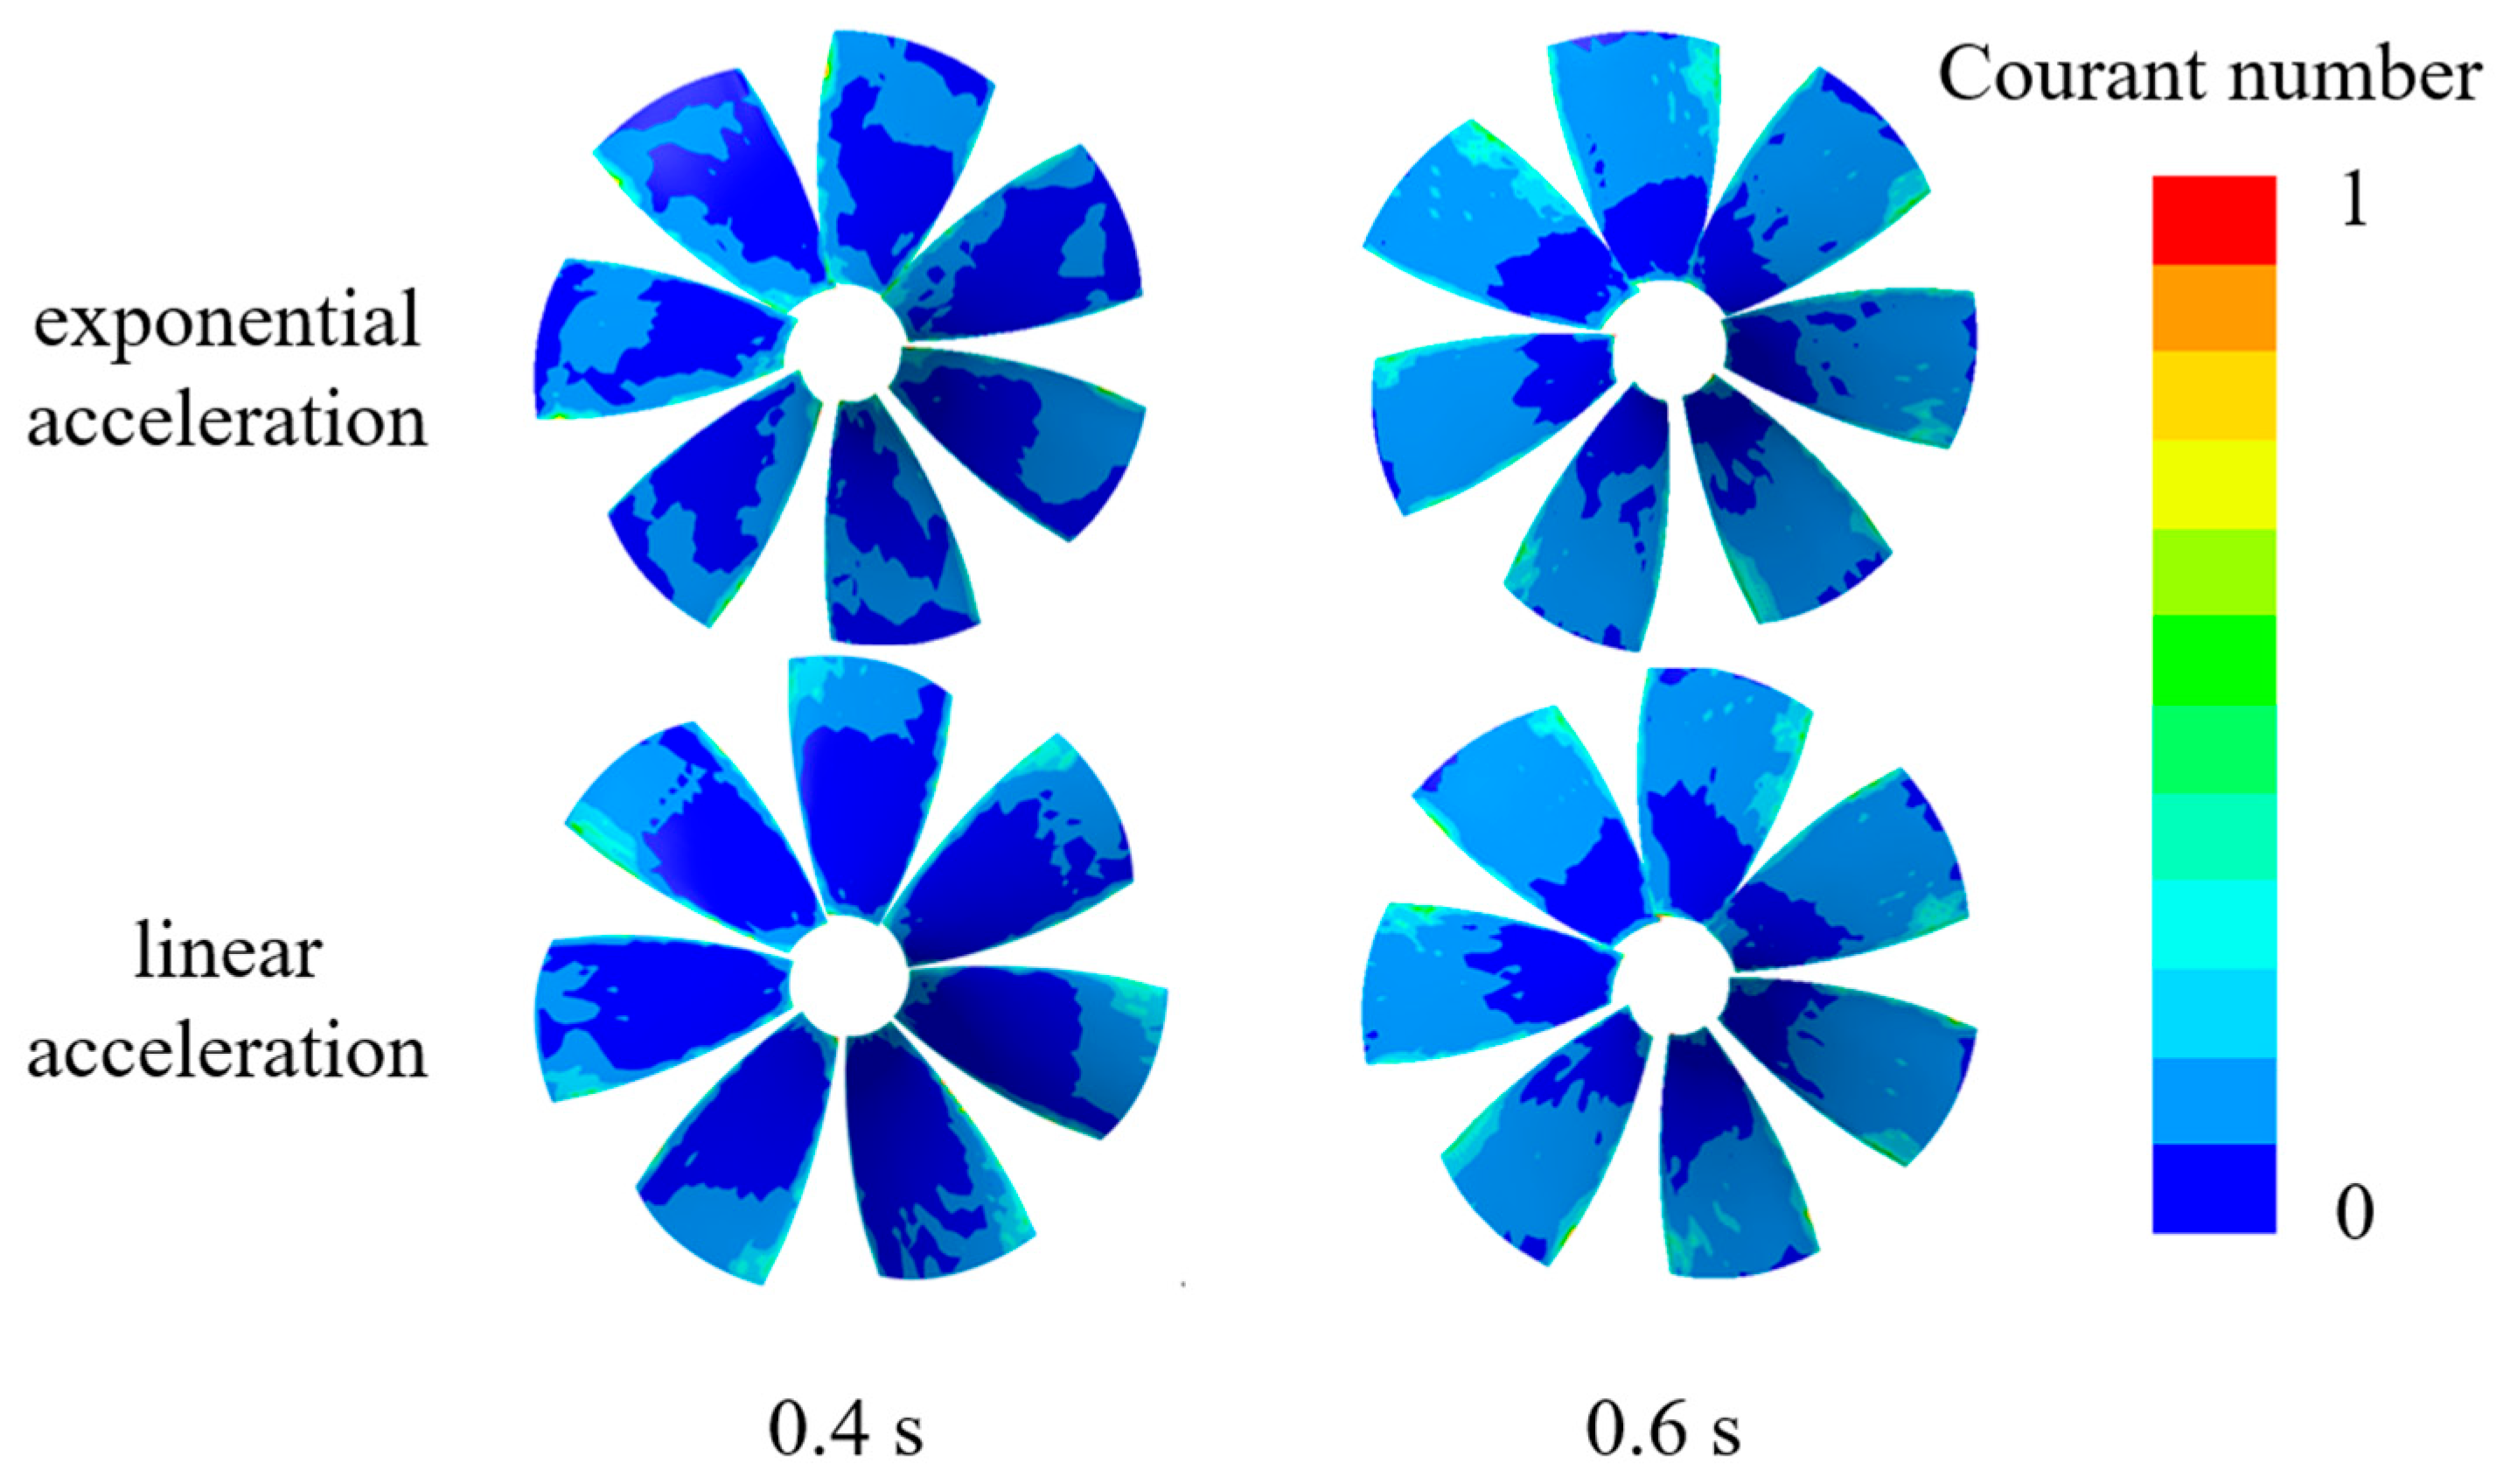
The grid of the shaftless water-jet propulsion pump is shown in Figure 3. The six-sided structured grid is adopted for meshing, and the computational domain is separately divided according to the inlet and outlet channels as well as the impeller. In order to further improve the accuracy of the numerical simulation, local mesh densification is carried out around the blade area. The grid independence verification is shown in Figure 4. It can be seen that when the total number of grids exceeds 4.5 million, the head change decreases. The influence of the grid quantity on the calculation results gradually decreases. Considering the calculation accuracy and economy, the scheme with 4.5 million grids is chosen for the research. Figure 5 shows the distribution of y+ on the blade walls based on this grid scheme, where the y+ on each wall is less than 50, which meets the requirements of turbulence models for wall y+.
The CFL condition is a fundamental criterion for the stability and accuracy of transient CFD simulations. It ensures that the fluid does not travel across more than one grid cell per time step, thereby guaranteeing that the temporal resolution is consistent with the spatial resolution validated by the steady-state study. The equation of CFL is as follows:
C = Δ t × ( u Δ x + v Δ y + w Δ z )
where u, v, and w denote the velocity components in the x, y, and z directions (m/s), respectively; Δt denotes the time step (s); and Δx, Δy, and Δz denote the size of the grid cell in the corresponding direction.
Maintaining a Courant number of less than 1 ensures controlled temporal discretization error. This offers a robust alternative to direct transient grid analysis in engineering contexts by preventing time-stepping errors from compromising spatial accuracy. Figure 6 shows the distribution of the Courant number on the blade surface during transient acceleration.

2.5. Entropy Production Theory

Entropy production, which results from energy loss in irreversible processes, provides a theoretical basis for analyzing energy loss in pump flow fields [26,27]. This approach is particularly well-suited for analyzing transient operations. First, unlike steady-state efficiency, entropy production provides a spatially and temporally resolved measure of irreversible losses. This enables precise identification of when and where energy is dissipated during dynamic events, such as cavitation shedding and vortex evolution. Second, transient flows are characterized by rapidly evolving velocity gradients and turbulent structures, which are the direct drivers of entropy generation. By computing entropy directly from these local flow variables, the method captures the instantaneous dissipation power that would be obscured in a time-averaged, steady-state analysis. Applying this theory to the shaftless water-jet propulsion pump makes it possible to identify unstable operational regions and quantify the associated energy losses. Given that the water temperature undergoes only minor changes during pump operation, entropy production due to heat transfer is negligible. Therefore, only the direct dissipation and turbulent dissipation components of entropy production are considered [28,29]. The corresponding equations are as follows:
S pro , D ¯ = μ m T K 2 (   u ¯ x ) 2 + ( v ¯ y ) 2 + ( w ¯ z ) 2 + ( v ¯ x + u ¯ y ) 2 + ( w ¯ x + u ¯ z ) 2 + ( v ¯ z + w ¯ y ) 2
S pro , D = β ρ ω k T K
where u, v, and w denote the velocity components in the x, y, and z directions (m/s), respectively; μm denotes the dynamic viscosity (kg/(m·s)); TK denotes the temperature (K); ω denotes the turbulent eddy viscosity frequency (s−1); k denotes the turbulent kinetic energy (m2/s2); and β denotes an empirical coefficient, with a value of 0.09.
In Equation (14), the unit of the velocity gradient is 1/s. The dimensional verification for the direct dissipation entropy production rate is as follows:
[ k g / ( m s ) ] [ K ] [ 1 / s 2 ] = [ k g / ( m s 3 K ) ]
[ W ] = [ J / s ] = [ ( k g m 2 ) / s 2 ] [ s ] = [ k g m 2 / s 3 ]
Therefore, we can convert the above into:
[ k g / ( m s 3 K ) ] = [ ( k g m 2 ) / s 3 ] [ m 3 K ] = [ W / ( m 3 K ) ]
In Equation (15), the dimensional verification for turbulent dissipation entropy production rate is as follows:
[ k g / m 3 ] [ K ] [ 1 / s ] [ m 2 / s 2 ] = [ W / ( m 3 K ) ]
To obtain the total entropy production of the computational fluid domain, we integrate the direct and turbulent dissipation entropy production over the volume and sum the two results. The equations are as follows:
Δ S pro , D = V S pro , D d V
Δ S pro , D ¯ = V S pro , D ¯ d V
Δ S pro , D = Δ S pro ,   D ¯ + Δ S pro , D

3. Results and Discussion

3.1. Accuracy Validation of Numerical Methods

To confirm the result of the above numerical calculation approach, experimental verification of the shaftless water-jet propulsion pump was conducted through a test performed by the National Engineering Research Center for Pumps and Systems of Jiangsu University. Figure 7 illustrates a schematic representation of this experiment. The cavitation pit is used to accumulate the fluid, as well as to dampen system fluctuations. A vacuum pump is linked to the cavitation pit to lower internal pressure and thus bring about the formation of cavitation in the pit. The test piping system is of two parts: the upper part, which accommodates the shaftless water-jet propulsion pump test part, and the lower part, which is also the steady flow pressurization part.
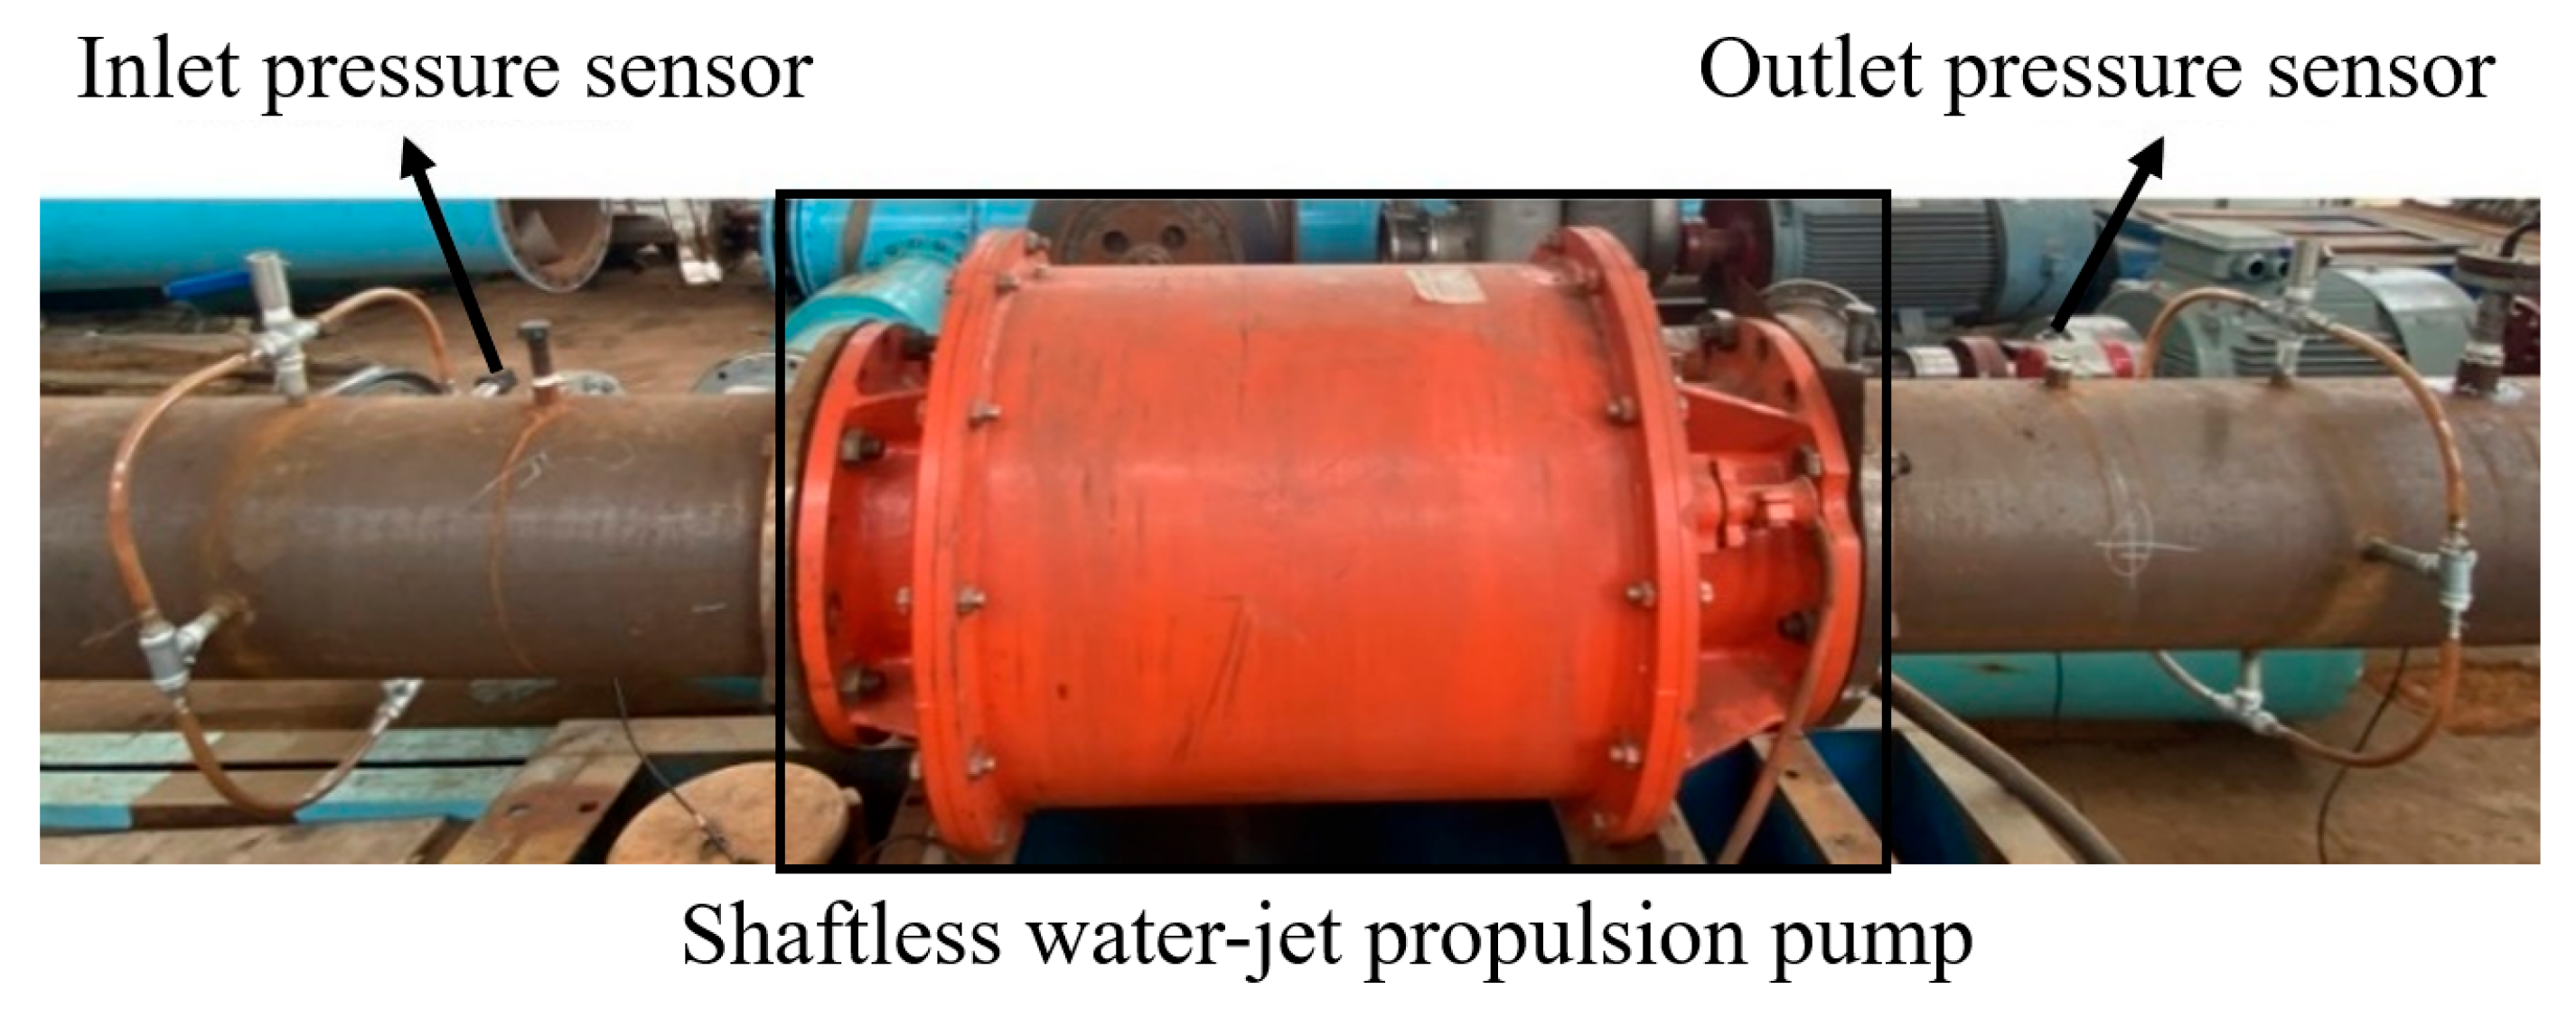
Figure 8 illustrates the physical diagram of the test section. The instrumentation used included an inlet pressure sensor (range: −0.1 to 0.1 MPa; accuracy: ±0.5%), an outlet pressure sensor (range: 0 to 1 MPa; accuracy: ±0.5%), and an electromagnetic flowmeter (range: 100 to 1800 m3/h; accuracy: ±0.5%). The uncertainty of the test apparatus efficiency, derived from these instrument accuracies, is calculated using the following equations:
f H T = ± f P T 2 + f D T 2 = ± 0.707 %
f η s = ± f H T 2 + f Q 2 = ± 0.866 %
where fHT is the error of the head; fPT is the accuracy of the inlet pressure sensor; fDT is the accuracy of the outlet pressure sensor; fηs is the comprehensive efficiency error of the test apparatus; and fQ is the accuracy of the electromagnetic flowmeter.
To ensure a direct and fair comparison between the numerical and experimental results, the CFD boundary conditions were configured to closely match the experimental setup. The inlet boundary was set to total pressure, calculated as the sum of the dynamic pressure and the static pressure measured at the pump inlet. The outlet boundary was defined by the mass flow rate measured by the electromagnetic flowmeter.
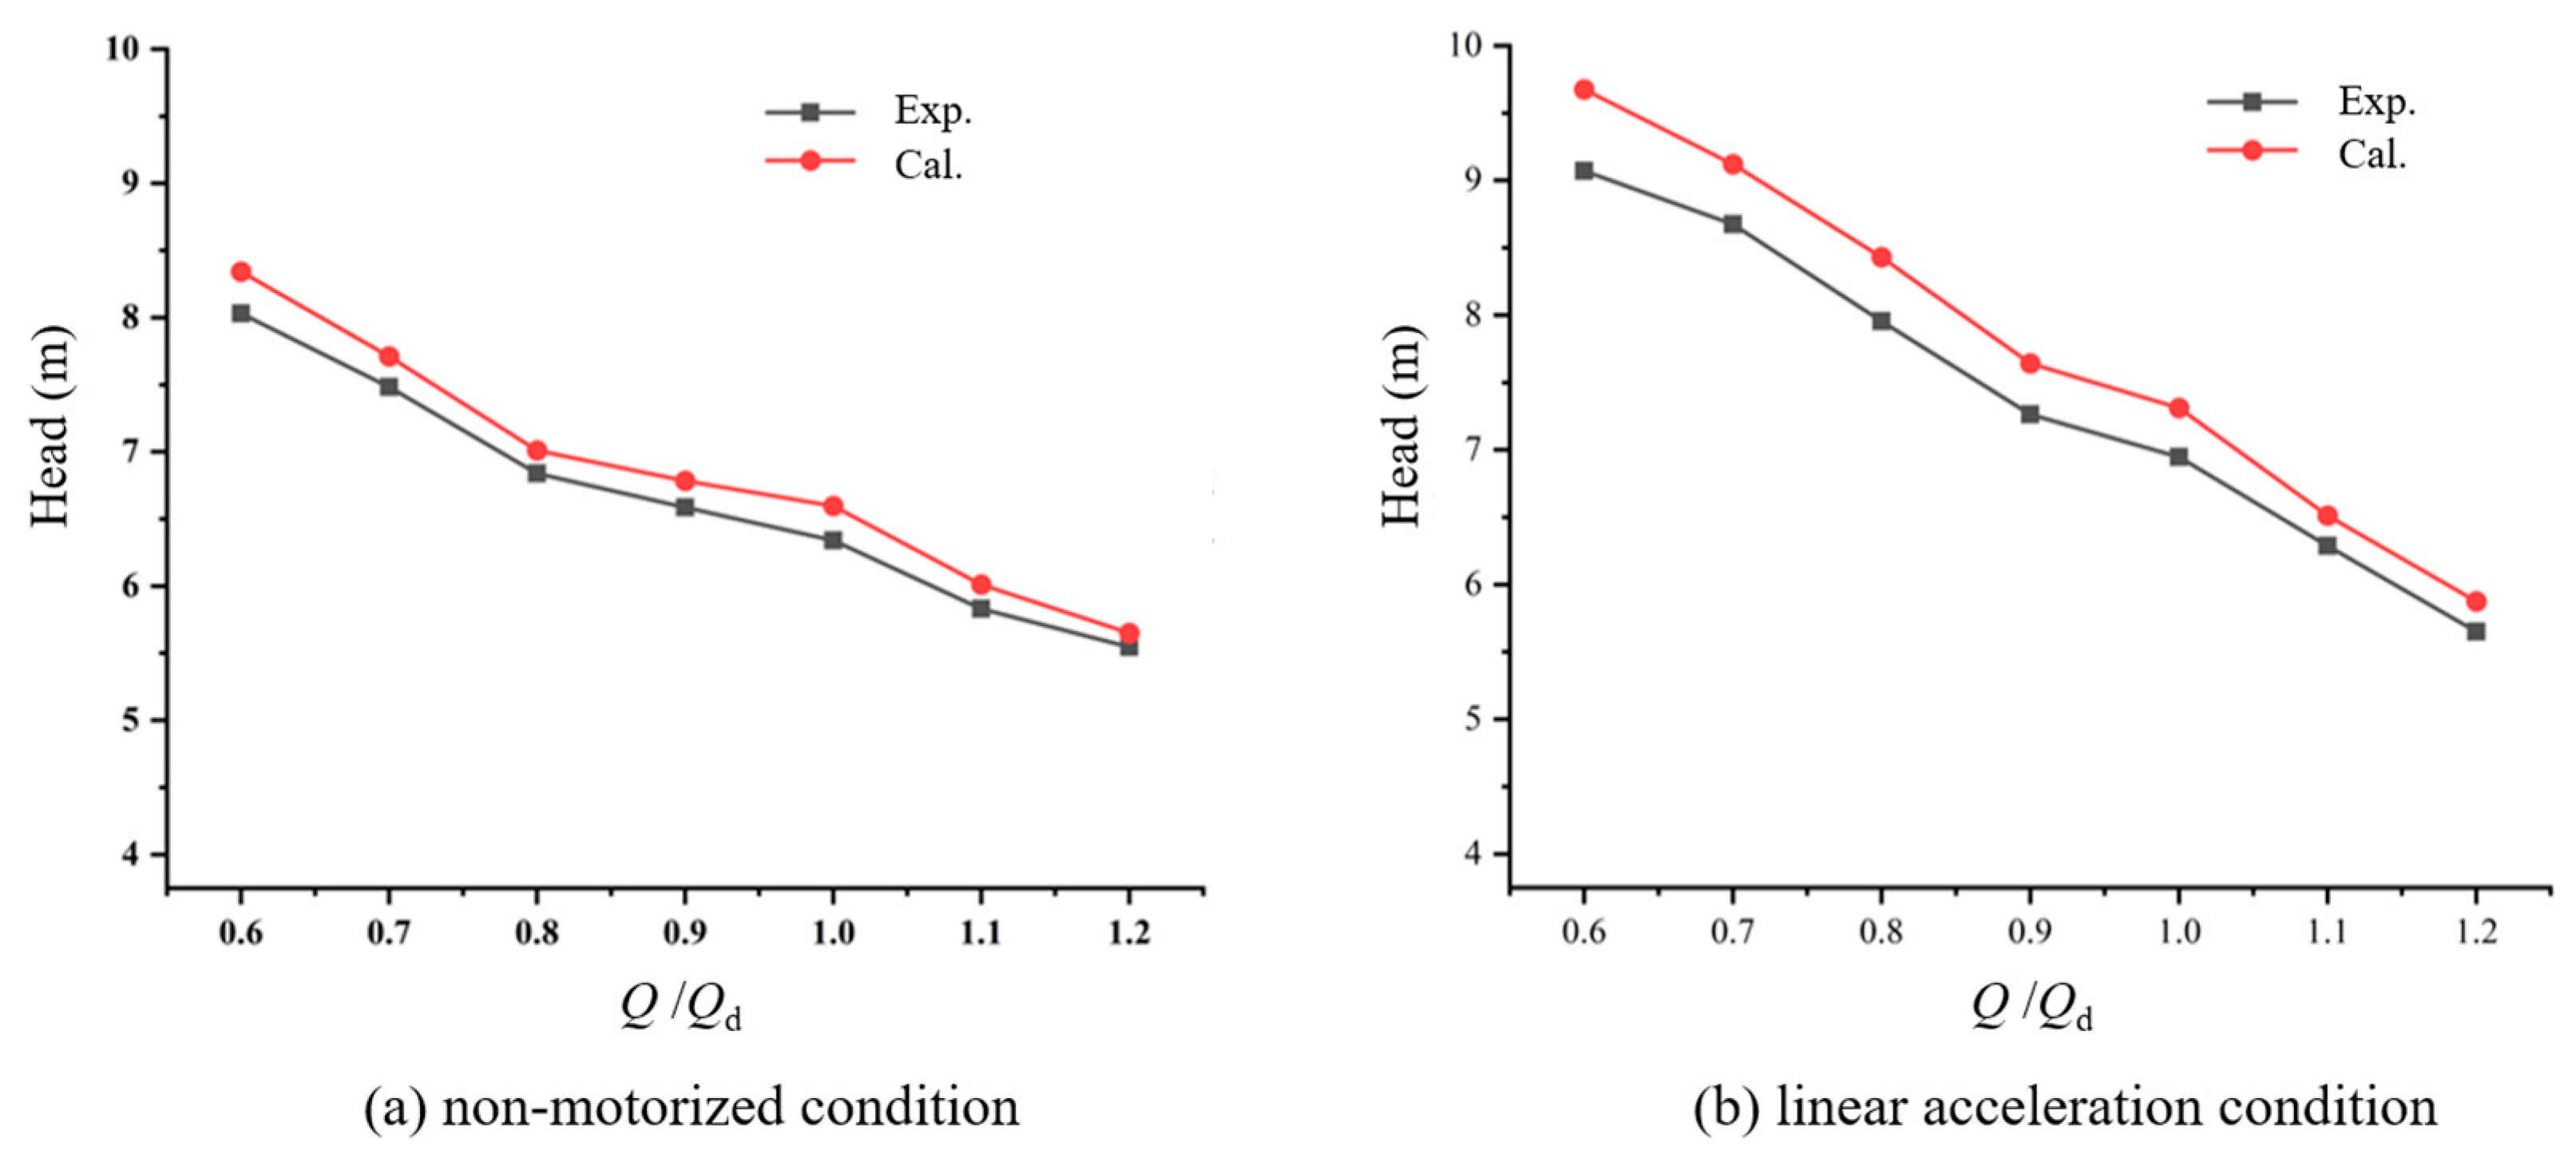
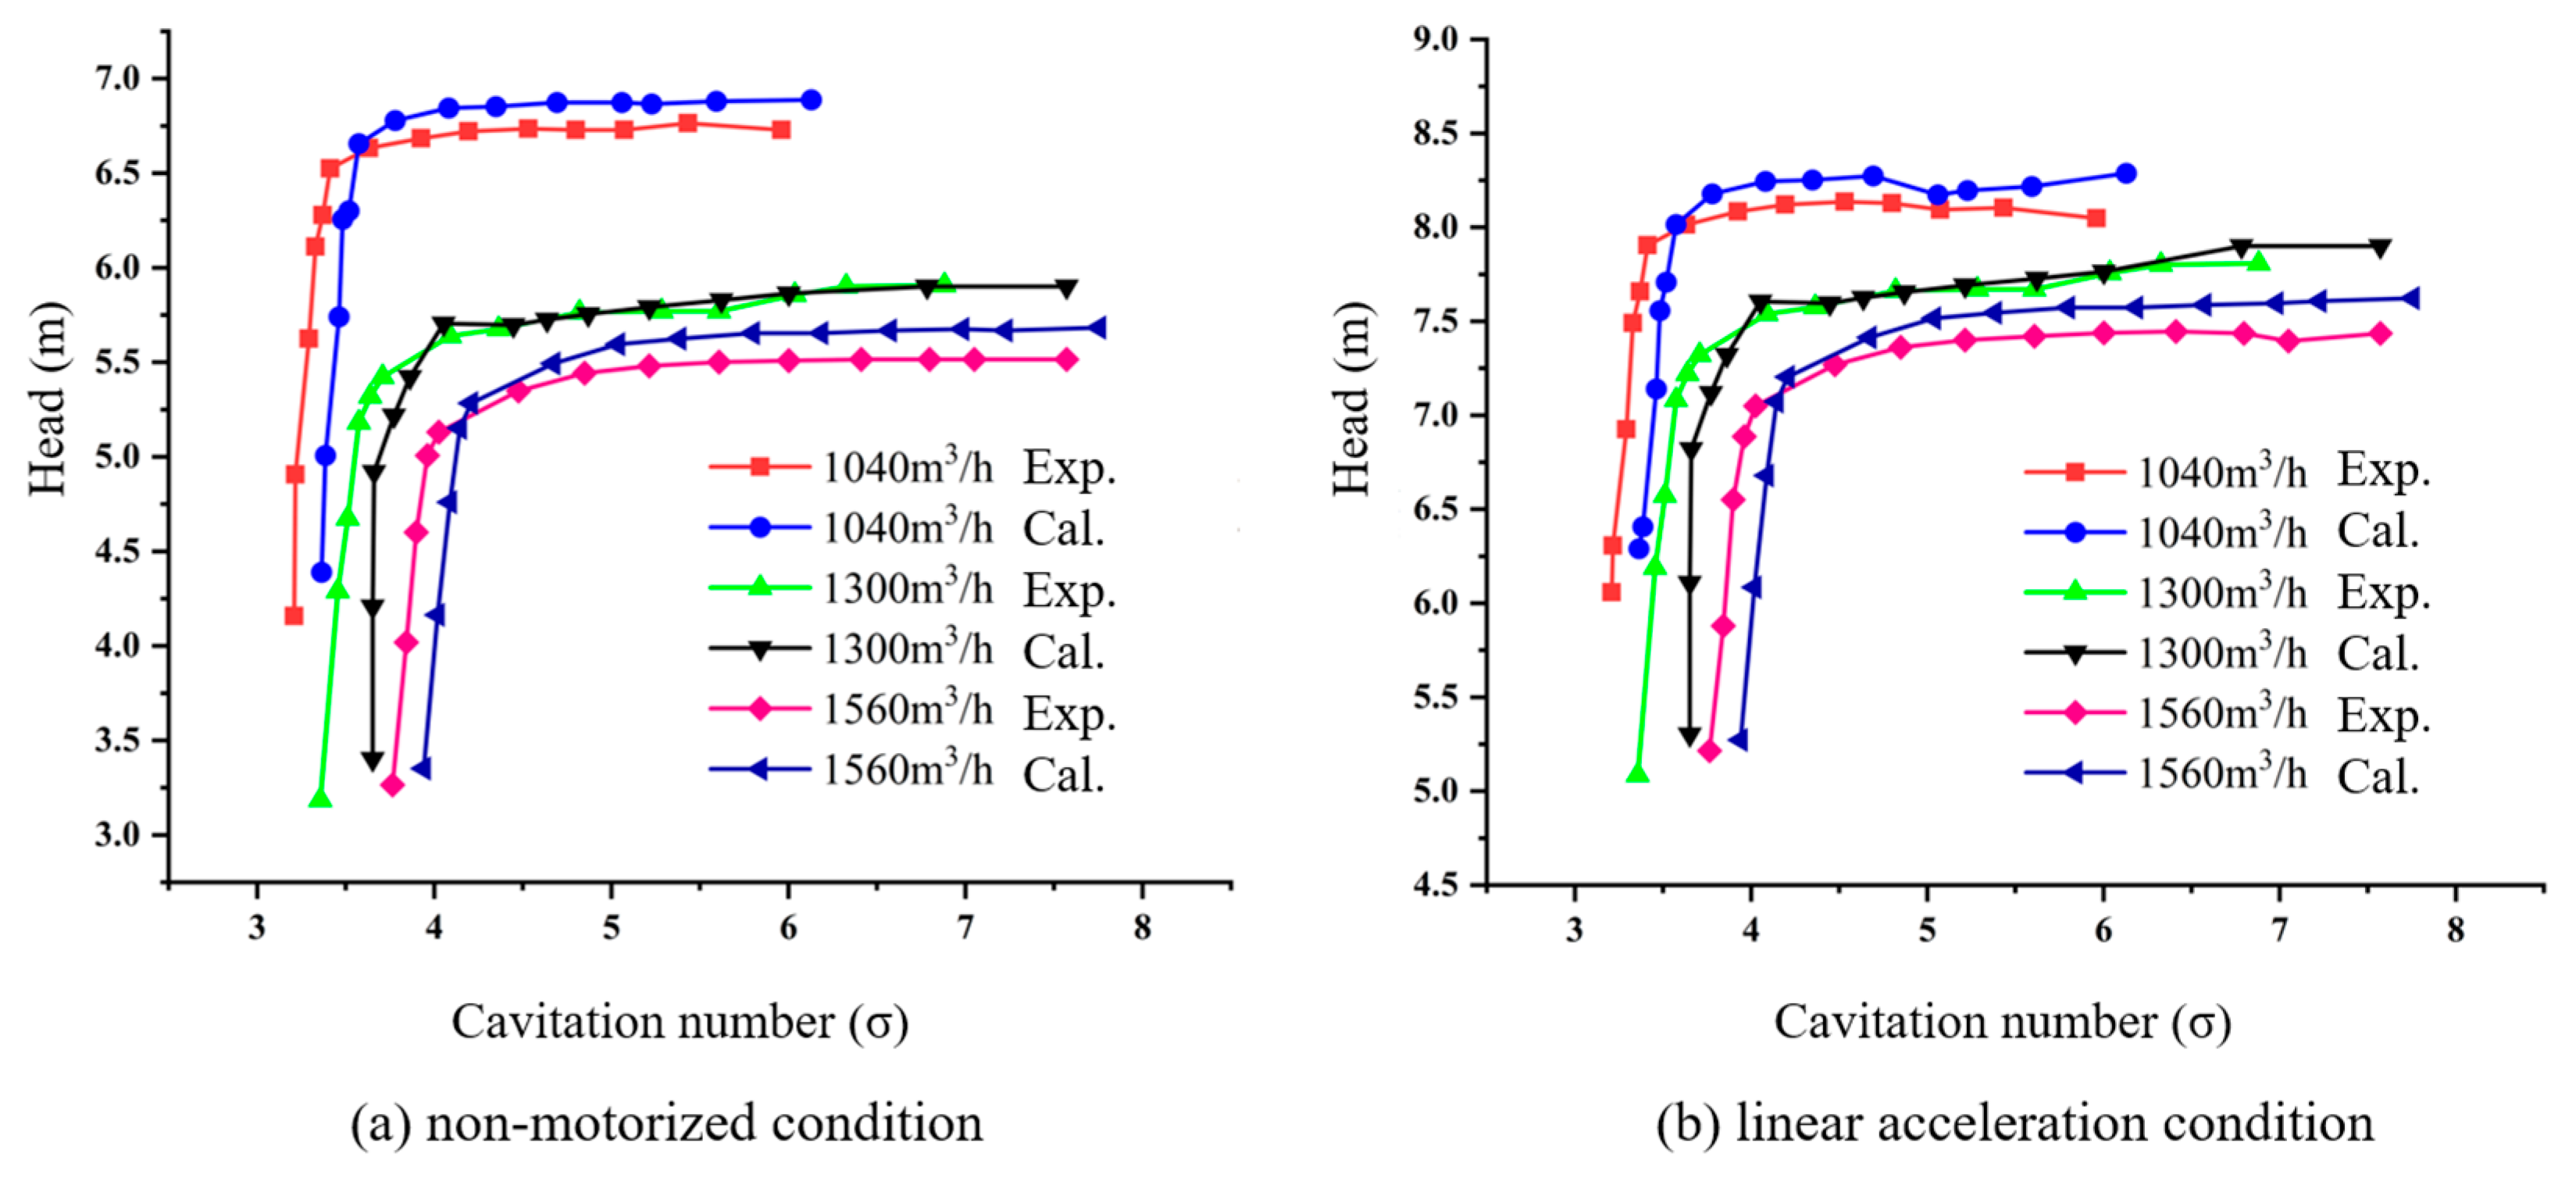
Figure 9 depicts a comparison of the measured head and calculated head of the propulsion pump under non-motorized and linear acceleration conditions. The line graph shows a reduction in the head when the flow rate is increased in both cases. The maximum deviation registered is 2.9% at 0.6 Qd under non-motorized conditions and 4.7% at 0.6 Qd under linear acceleration conditions, and the errors are all below 5%. This reveals that the numerical simulations carried out in this work are able to reliably predict the internal flow behavior of the propulsion pump. Figure 10 compares the cavitation performance of a propulsion pump under two running cases. The experimental and simulation results under each running condition are relatively close to each other and have good trends. Under non-motored situations, the greatest error is 4.1% when the flow rate is 1040 m3/h. When it is in straight-line acceleration, the greatest error is 3.1% when it is 1560 m3/h. All errors are below 5%, further demonstrating the accuracy of the numerical computations presented in this study.

3.2. Comparison of Cavitation Flow Field

3.2.1. Cavity Distribution Comparison

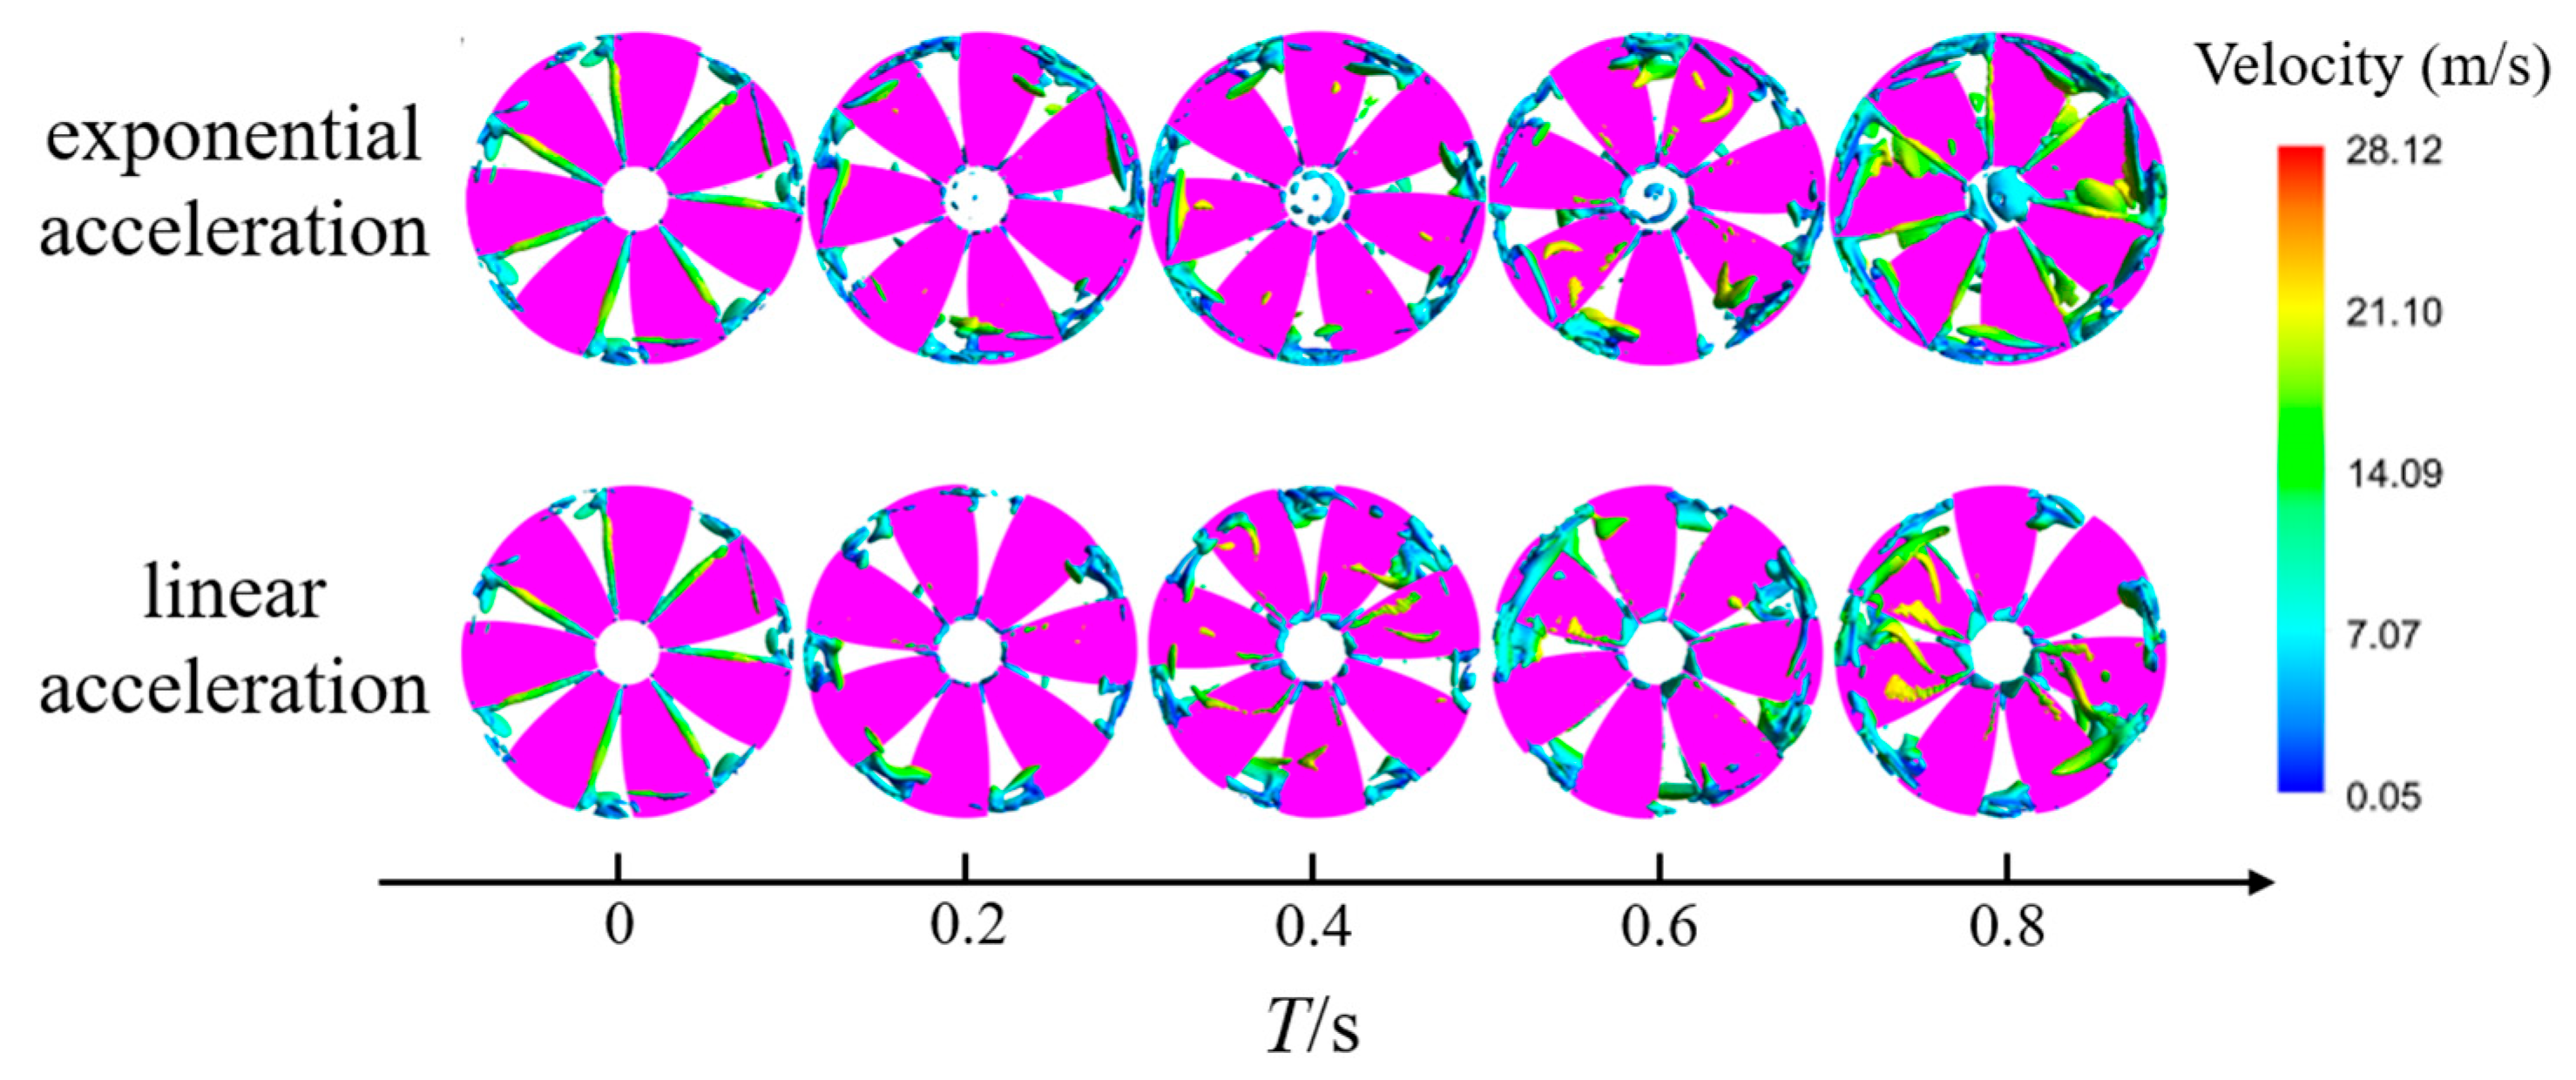
Figure 11 illustrates the distribution of vortex cores within the impeller, with the vortex surfaces colored by velocity. These vortices are primarily located at the shroud and the leading edges of the blades. Furthermore, under exponential acceleration, both the number and volume of vortex cores are greater than those under linear acceleration. The coalescence of multiple vortices leads to the formation of inlet recirculation cavitation on the blades. Additionally, the significant velocity difference across the vortex surfaces induces strong shear, which destabilizes the cavitation vortex interface and causes it to break into smaller cavities. Consequently, the cavitation morphology rapidly evolves from initial traveling cavities into sheet cavitation covering the blade surface.
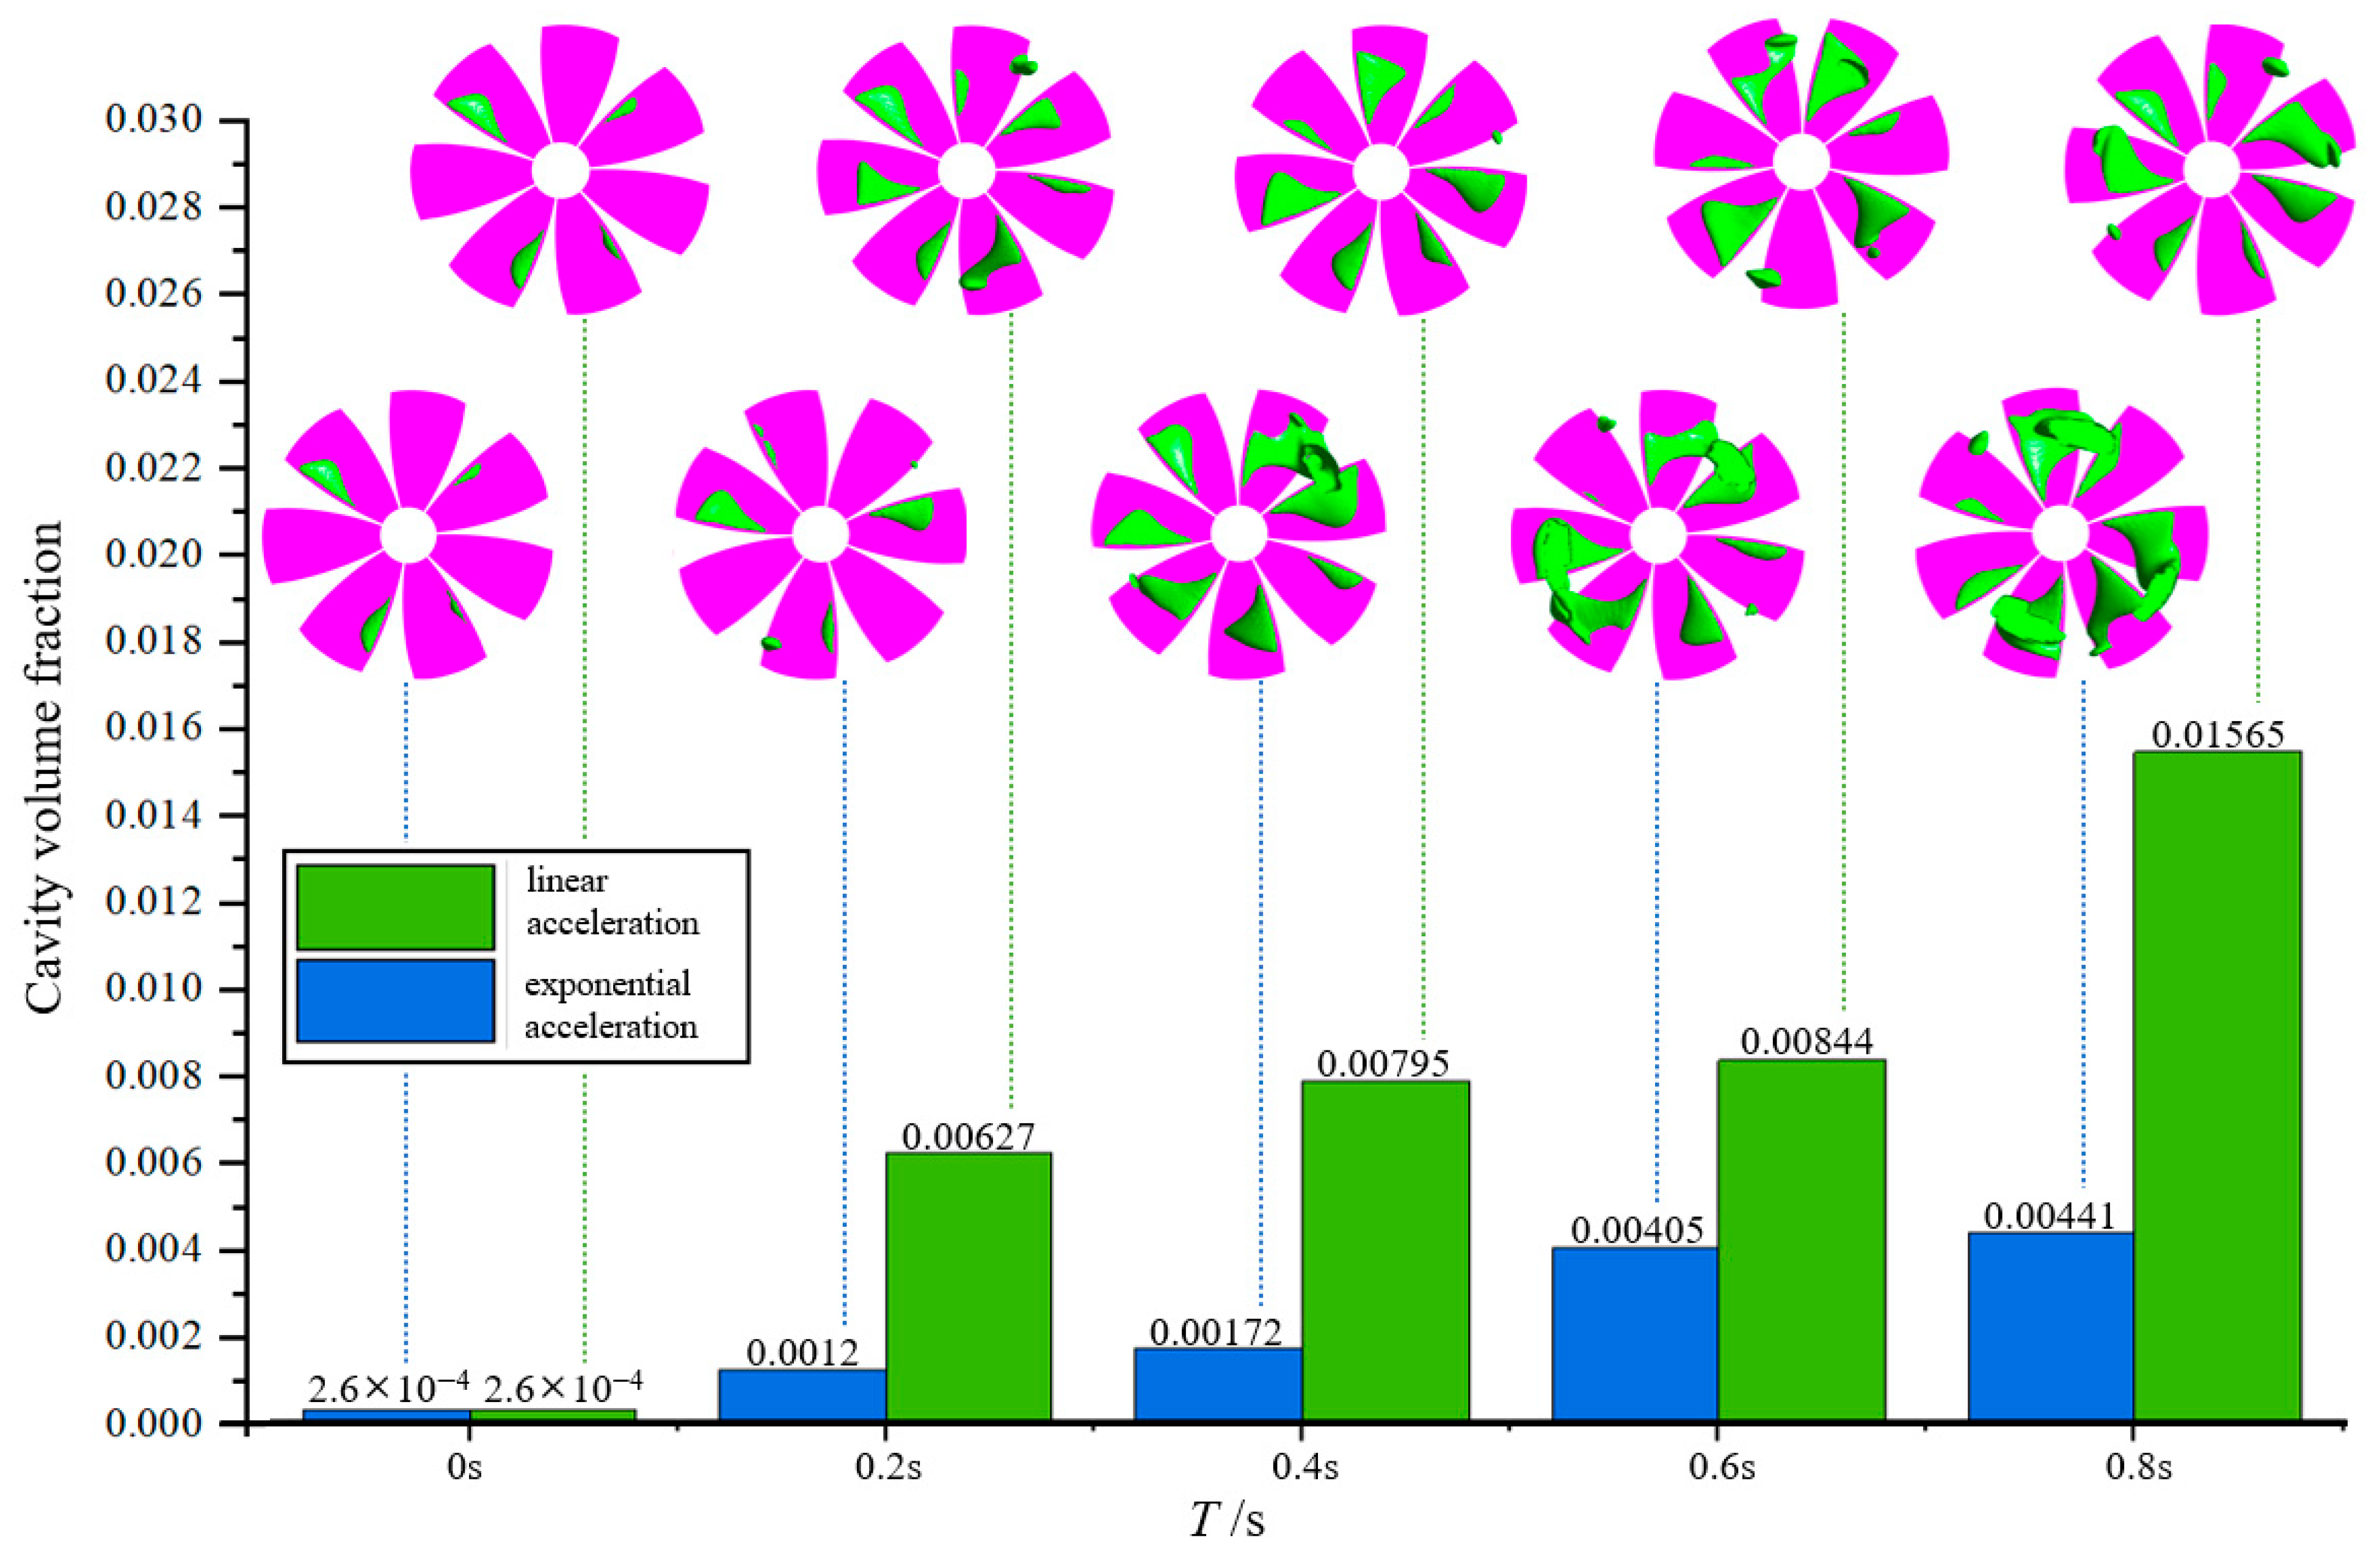
To provide better insight into the development patterns of cavitation in a shaftless water-jet propulsion pump under different acceleration conditions, Figure 12 illustrates the average volume fraction of the cavity along with its distribution across the impeller. Cavitation is most present at the leading edge of the rotor. As the acceleration progresses, the cavity intensifies, causing flaky cavities to detach. It is quite evident from the data that between entering the exponential acceleration phase from a zero baseline and when it is complete, the resulting increment is 0.00414, which is a 1554.2% increment. In comparison, for the linear acceleration phase between a zero baseline and its end, the increment is 0.01544, which is a 7261.2% increment. These phenomena can be explained by significant changes in the pressure gradient and velocity distribution of the fluid during the short acceleration time steps, which in turn lead to a successive increase in cavity volume. Meanwhile, the cavitation is subjected to shear forces from the fluid. With the continuation of acceleration, these shear acts strengthen and, finally, lead to the detachment of cavitation and its liberation from being attached to the fluid. When comparing two accelerating profiles, when the duration is equal to 0.2 s, the volume of cavitation under exponential acceleration is significantly higher than that of linear acceleration, with a volume fraction difference of 0.0006. Meanwhile, when the duration is longer than 0.4 s, the average volume fraction of the cavity of the linearly accelerating impeller is larger than that of the exponentially accelerating condition and reaches its highest difference of 0.01124 when acceleration is finished. This results in a stronger cavitation phenomenon of linear acceleration. These differences arise from the different acceleration modes. When the duration is less than 0.4 s, the impeller speed under exponential acceleration significantly exceeds that under linear acceleration. This higher speed leads to a more dramatic change in the fluid’s pressure gradient and velocity distribution, consequently resulting in a larger volume of cavity.
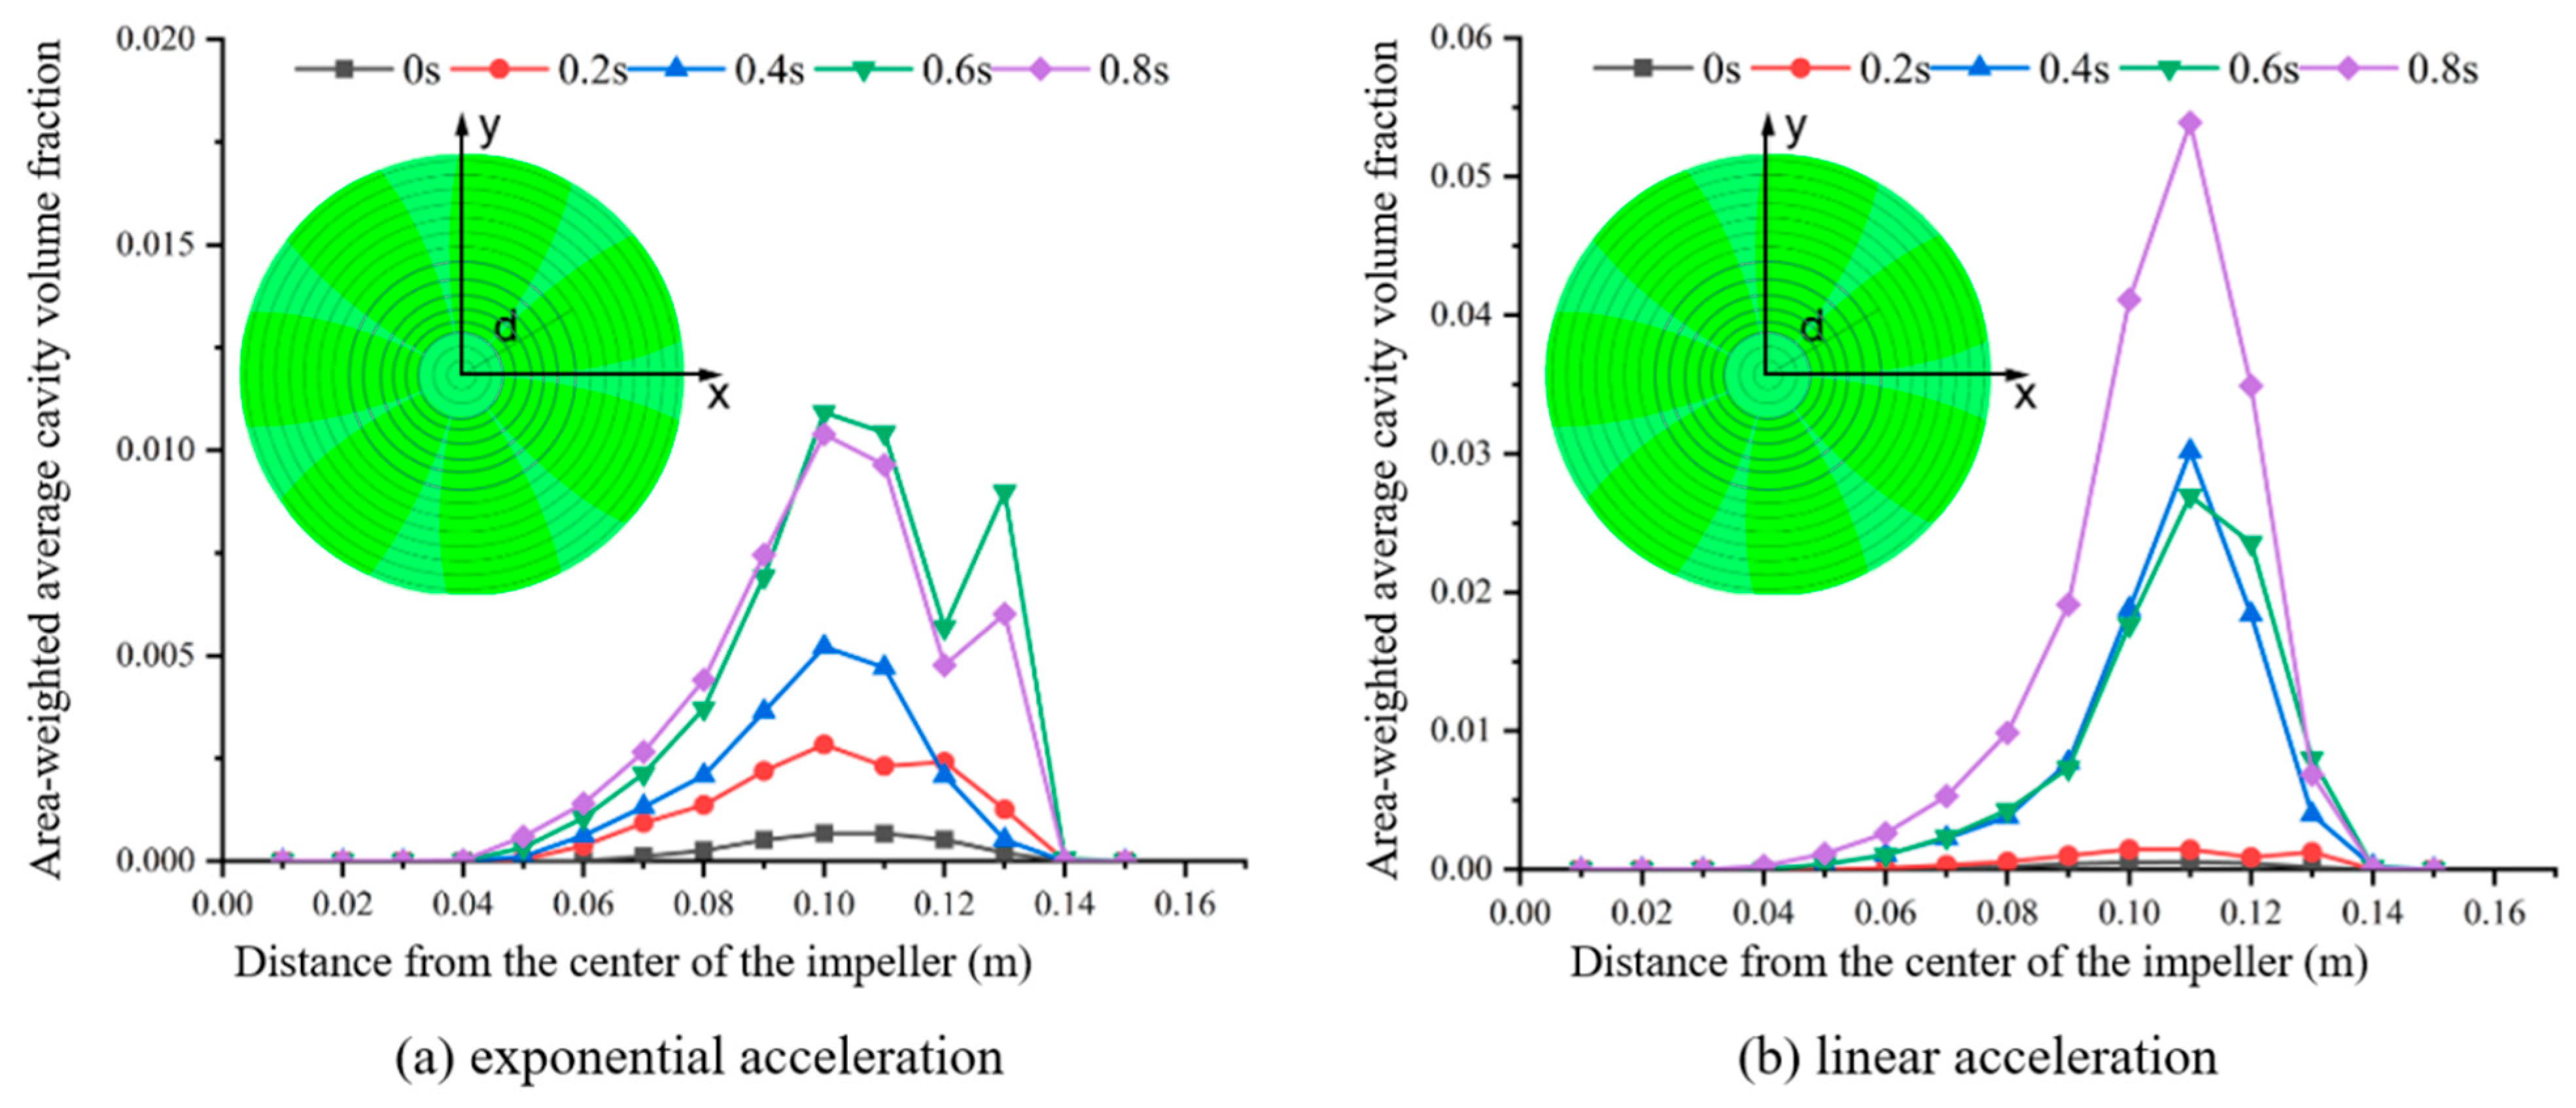
To more precisely quantify the spatial variations in the cavity volume fraction, Figure 13 and Figure 14 present the area-weighted average cavity volume fraction of the shaftless jet propulsion pump across various cross-sectional planes along both the axial and radial directions. In Figure 13, the axial area-weighted average cavity volume fraction first increases, then decreases, and again increases subsequently. The acceleration mode and the deceleration mode show an increase and a subsequent decrease between the fourth and tenth cross-sections, and an additional increase is found to happen in the eleventh cross-section. This trend is found to be responsible, upon analysis, in tandem with that given in Figure 12 by considering the shedding of cavities that are distributed along the blades. Furthermore, the axial area-weighted average cavity volume fraction under linear acceleration conditions is substantially greater than that observed under exponential acceleration conditions. In Figure 14, the radial area-weighted average volume fraction of the cavity first increases and then declines. For the two accelerating conditions, this average volume fraction remains relatively high between the fourth and fourteenth cross-sections of the blades, a region that corresponds to the mid-section, as shown in Figure 12. Additionally, the radial area-weighted average volume fraction under the linear acceleration condition is higher compared to that under the exponential acceleration condition.

3.2.2. Impeller Velocity Comparison

Figure 15 illustrates the differences in the impeller axial velocity distribution under different acceleration conditions. Two distinct low-speed recirculation regions are observable within the impeller channel. The first region, located at the shroud of the wheel, has a relatively small range. This recirculation is attributed to the spherical structure of the shroud, which causes a sudden increase in the flow passage cross-section. As the flow advances toward the shroud, it separates, resulting in recirculation. The second region, which spans from the impeller inlet to the outlet and is concentrated at the center, exhibits a larger recirculation range. At the impeller center, the centrifugal force acting on the fluid is relatively weak. Under the influence of viscous forces, a portion of the fluid flows back toward the inlet or the front regions of the impeller. As the acceleration process proceeds, both low-speed recirculation regions gradually diminish, while the high-speed regions within the impeller correspondingly increase. Furthermore, under exponential acceleration, the area of the high-speed region in the middle of the impeller is larger than that under linear acceleration. This observation aligns with the speed change profile shown in Figure 2, confirming that the rotational speed during exponential acceleration is higher in this phase.

3.2.3. Impeller Pressure Comparison

Figure 16 illustrates the blade pressure distribution under different acceleration conditions. The pressure gradient on the blade backside varies across stages due to these differing conditions. During the early acceleration stage, the rapid change in exponential acceleration generates a larger pressure gradient, corresponding to a more extensive low-pressure region. In contrast, constant acceleration in the linear case produces a milder pressure gradient and a correspondingly smaller low-pressure region. In the later stage, the fluid dynamics under exponential acceleration stabilize, reducing the pressure gradient. This reduction results in a smaller low-pressure region compared to the linear acceleration condition, where the gradient and region remain more consistent.
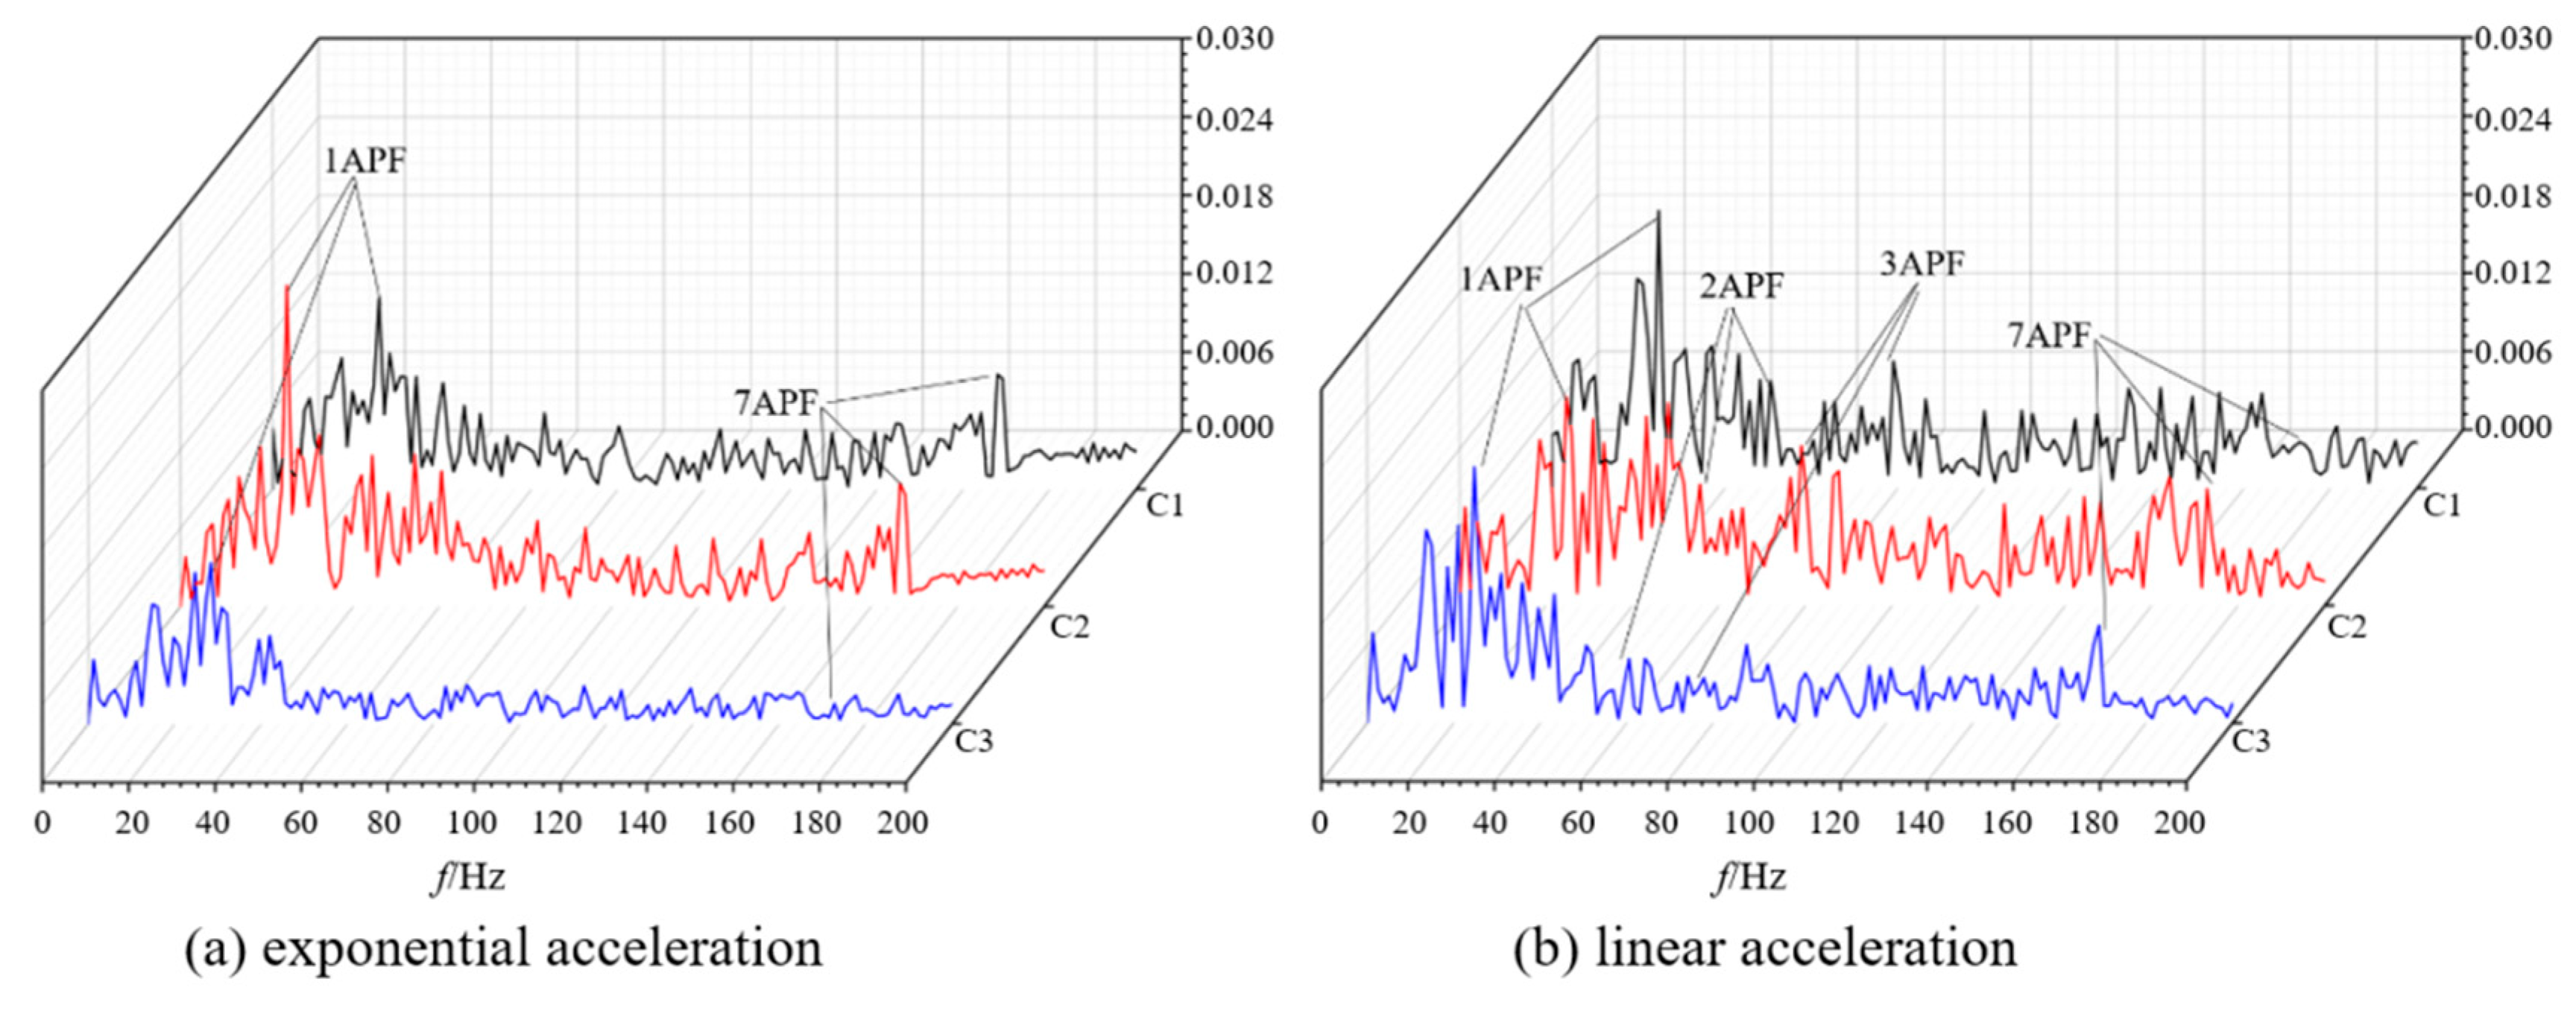
To estimate the effect of cavitation on fluid flow in the impeller, Figure 17 illustrates a distribution diagram of the pressure pulsation coefficient through the impeller. The left panel shows a layout of pressure monitoring stations on the blades of the impeller such that each station is regularly distributed along the blade surface along the rotating coordinate of the propulsion pump. The right panel shows fluctuations and maximum/minimum values of the pressure pulsation coefficient in each monitoring station. As can be especially noticed from monitoring stations in mid-span and root sections of the blade when it is under linear acceleration conditions, fluctuations of the pressure pulsation coefficient in those sections are larger than those when it is under exponential acceleration conditions. Comparing these results to Figure 12, it is clearly found that when it is under linear acceleration conditions, it is higher than when it is under exponential acceleration conditions to show that cavitation generates instability of fluid flow. As a result of the formation and collapse of cavitation, significant pressure fluctuations occur in the flow, causing an increase in the pressure pulsation coefficient. Figure 18 presents the frequency domain of pressure pulsations. The most prominent frequency in each monitoring station of the impeller is that of axial frequency, along with a harmonic frequency of about seven axial frequencies, due to a result of the blades’ resonance effect. Additionally, the linear acceleration pressure pulsation amplitude is higher than that of exponential acceleration. This is in accordance with the information in Figure 12, which reveals a higher volume of cavity fractions in linear acceleration. A higher volume of cavity fractions corresponds to a larger number of voids or inhomogeneities in a volume of fluid and, hence, higher instability in fluid flow.

3.3. Comparison of Cavitation Flow Loss

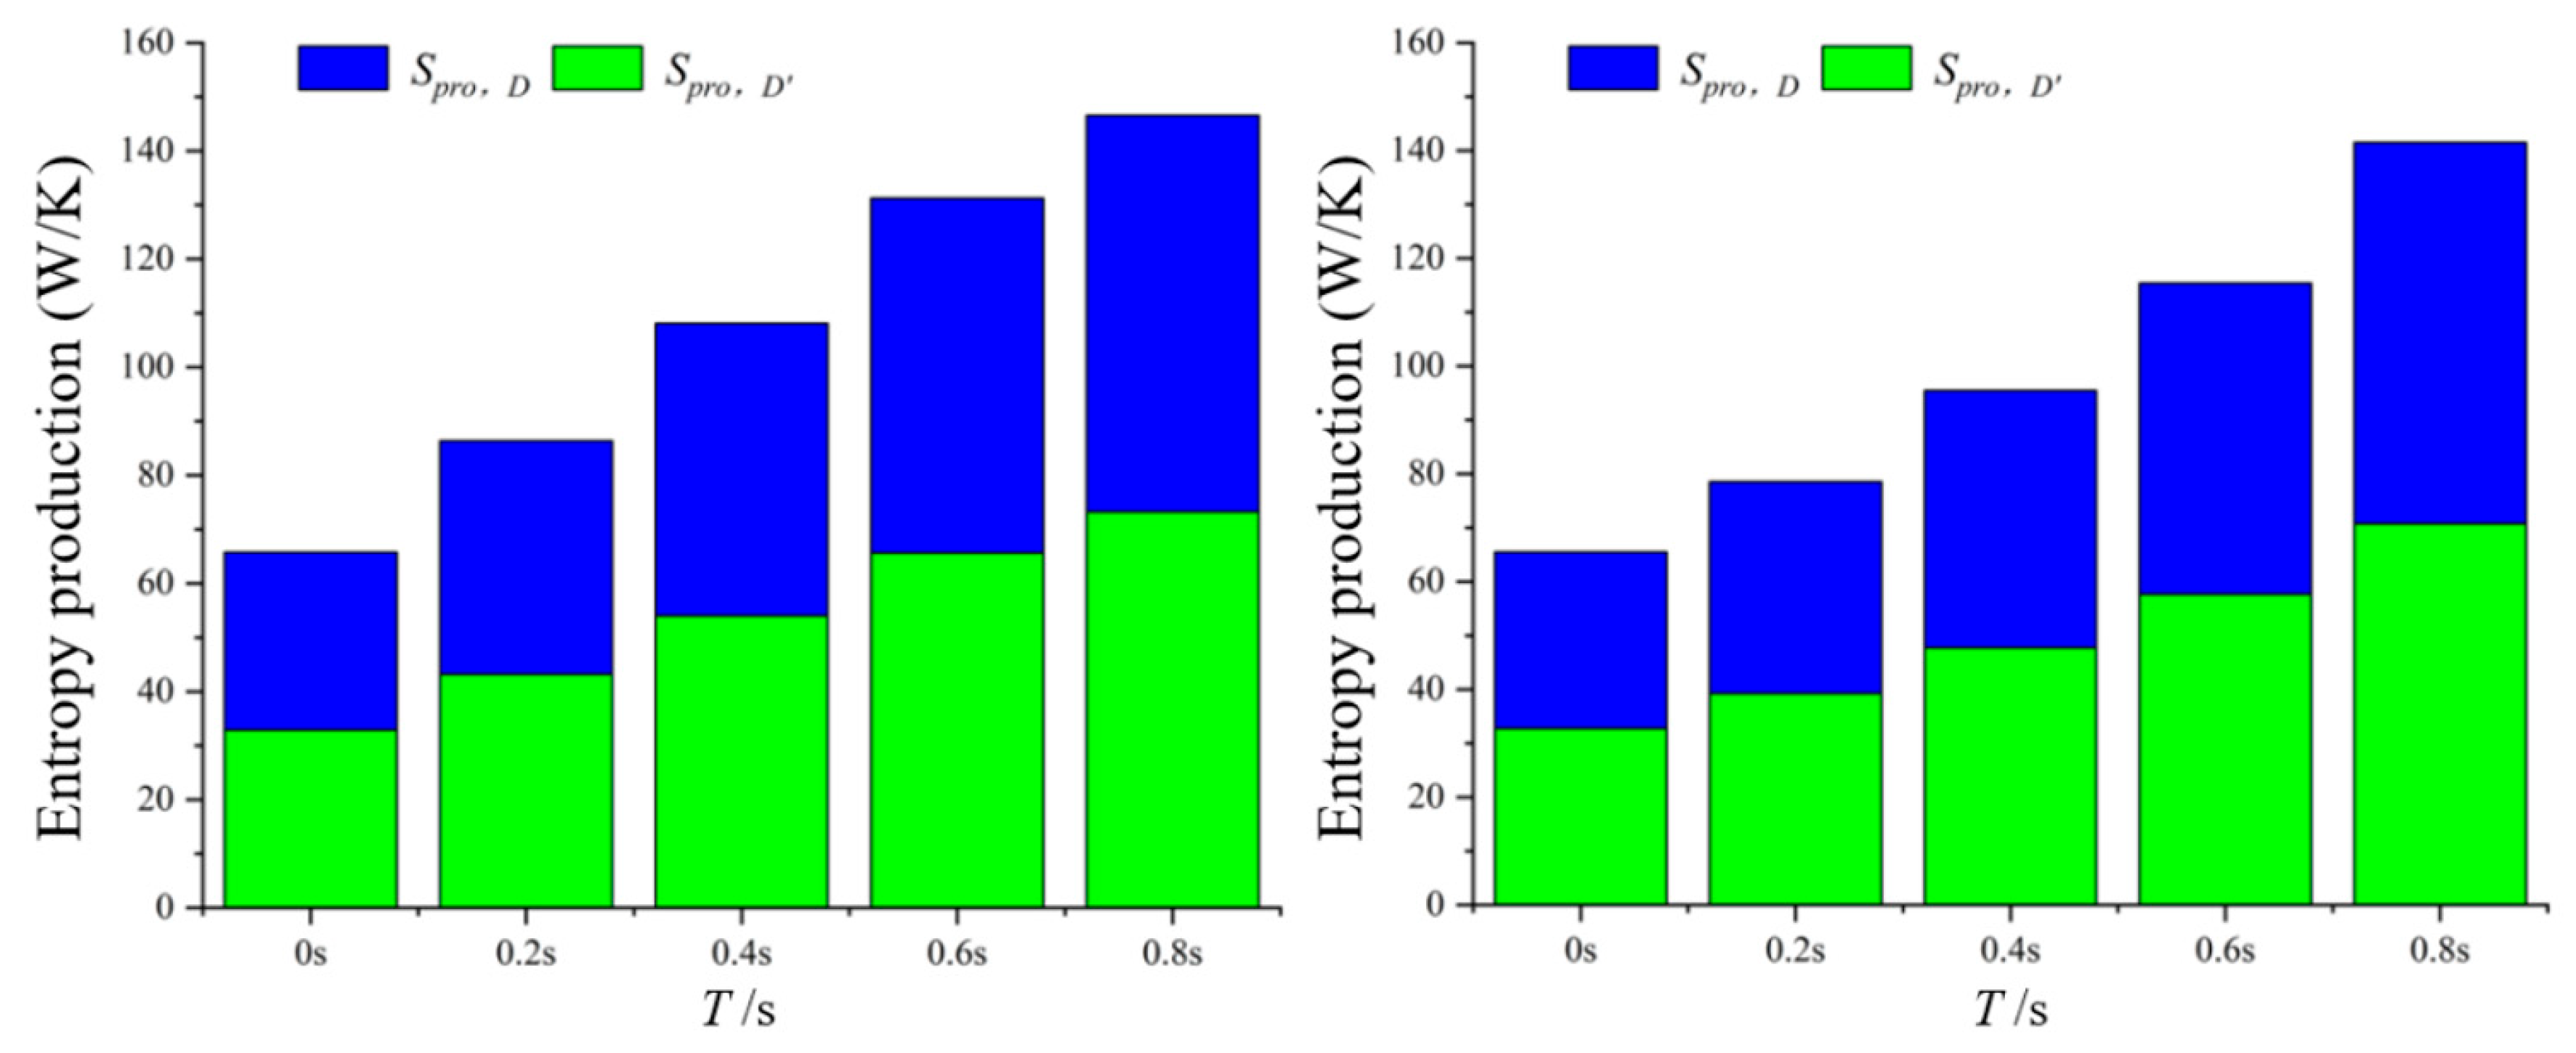
Figure 19 presents patterns of variations of individual constituents of the shaftless water-jet propulsion pump’s overall entropy generation when subjected to different acceleration modes in the progression of acceleration. The overall entropy generation continues to improve as acceleration progresses. During this operation, entropy generation due to dissipation of turbulence far outweighs that due to direct dissipation, accounting for the majority of overall entropy generation. This result suggests that, in the acceleration regime, shaftless water-jet propulsion system flow losses are mainly due to entropy generation caused by turbulence.
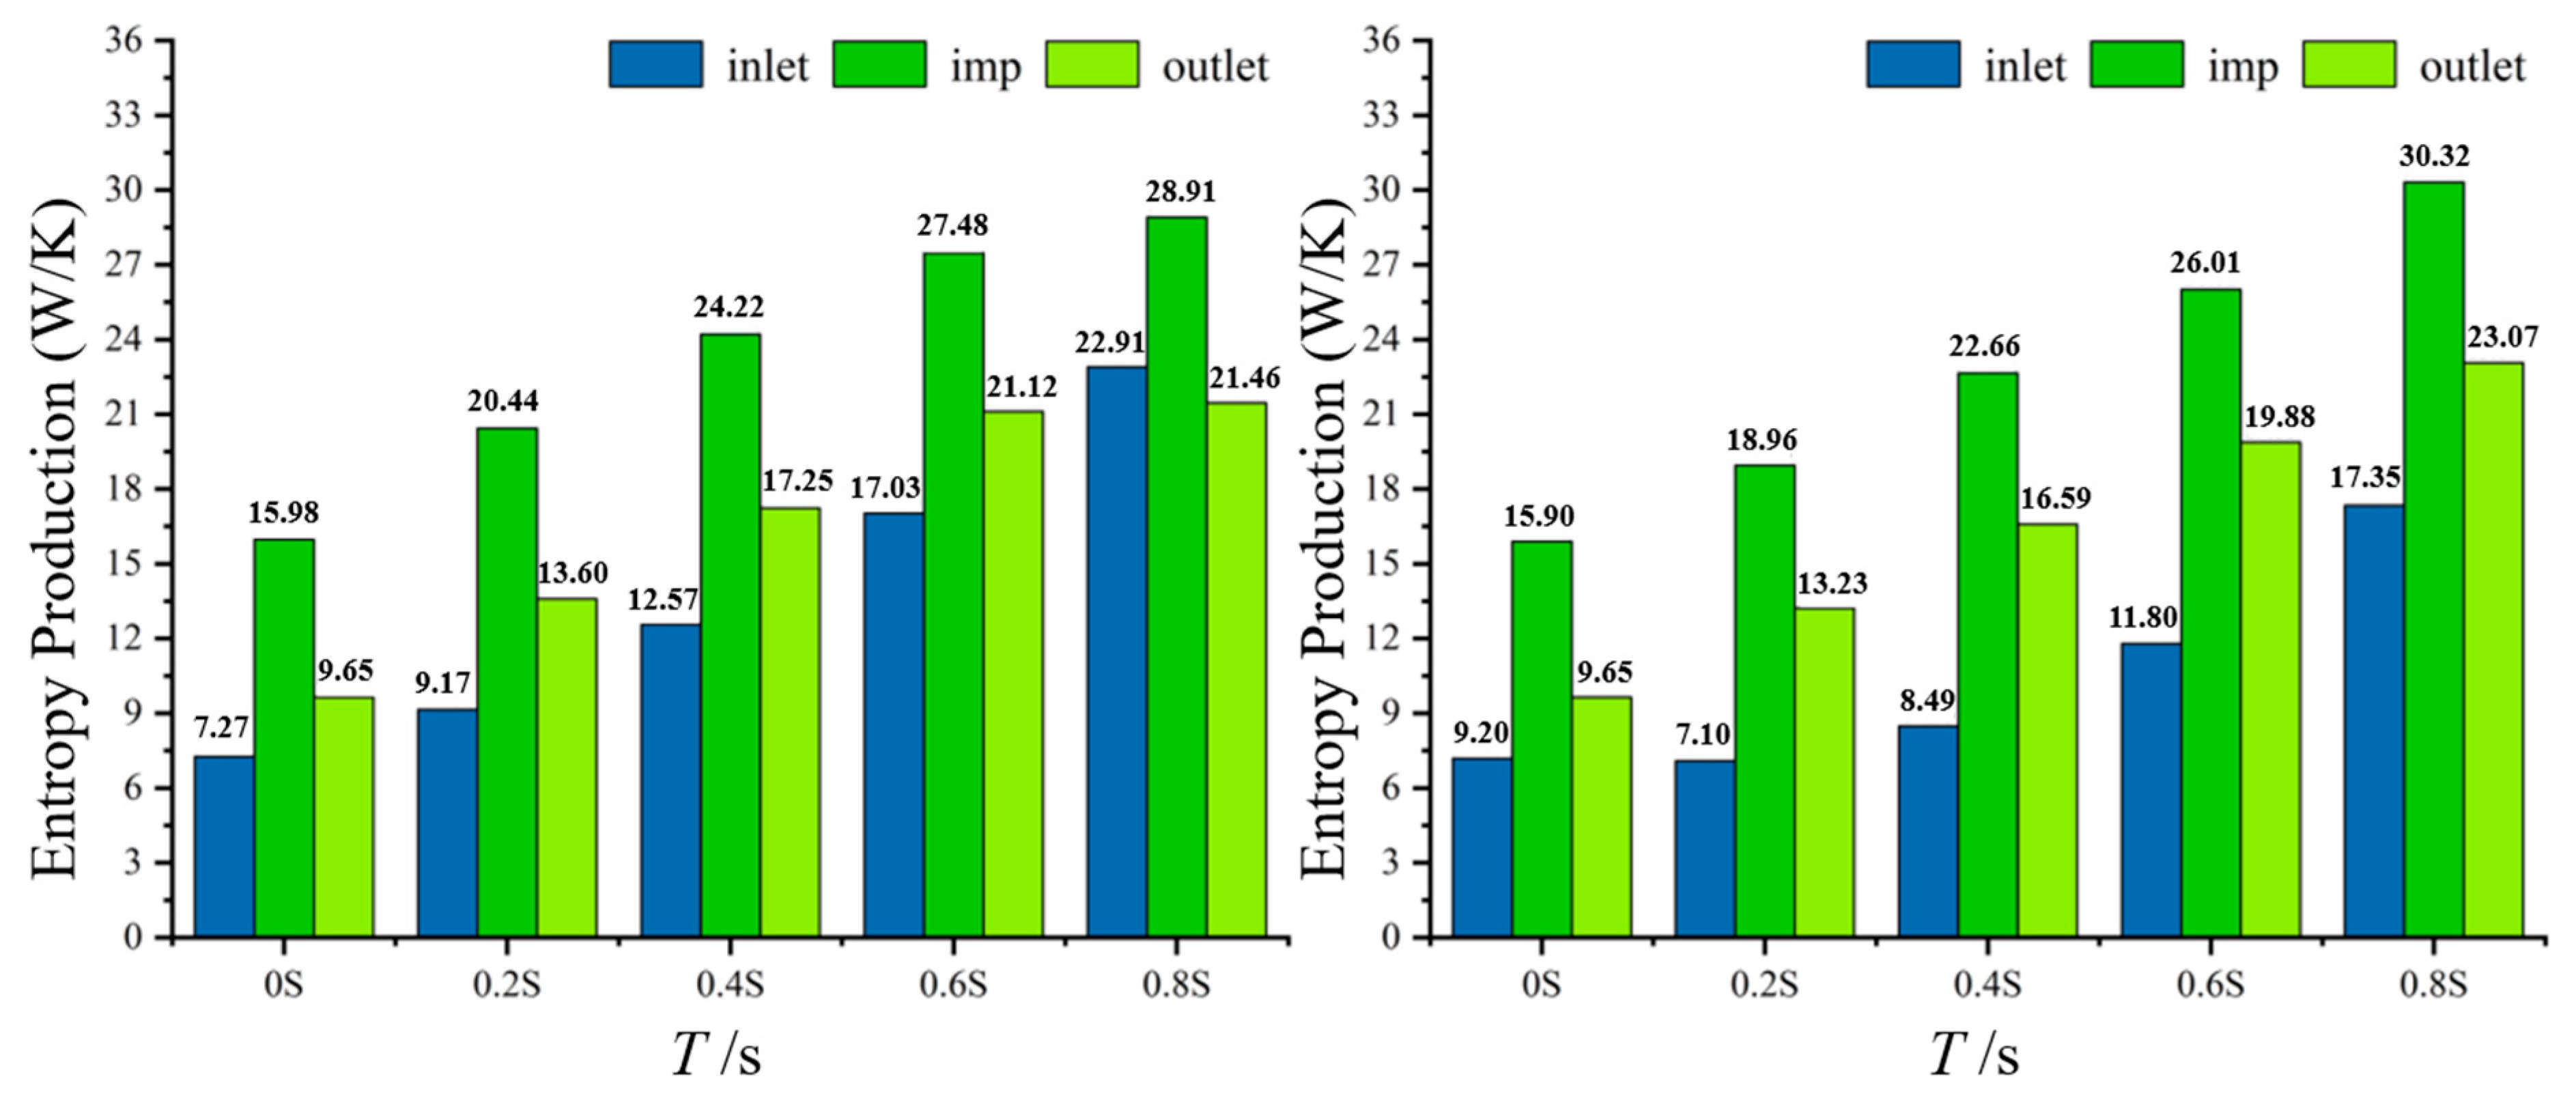
Figure 20 presents the entropy generation across different components of a shaftless water-jet propulsion pump. During the acceleration phase, most energy dissipation is concentrated in the impeller, making it the component with the highest energy loss. The outlet and inlet channels exhibit the next highest and the least energy dissipation, respectively. As the flow accelerates, entropy production in each component increases and peaks at the end of this phase. A comparison between the two acceleration processes reveals that entropy generation in the inlet flow channel, impeller, and outlet flow channel is higher under exponential acceleration than under linear acceleration. This is attributed to the irregular rate of acceleration change in an exponential system, which generates highly unsteady flow and turbulence throughout its components. Consequently, this leads to intensified vortex formation and higher turbulence intensity, resulting in greater frictional and turbulent losses, as well as increased dissipation of all forms of energy. These combined effects culminate in higher entropy production within the system.
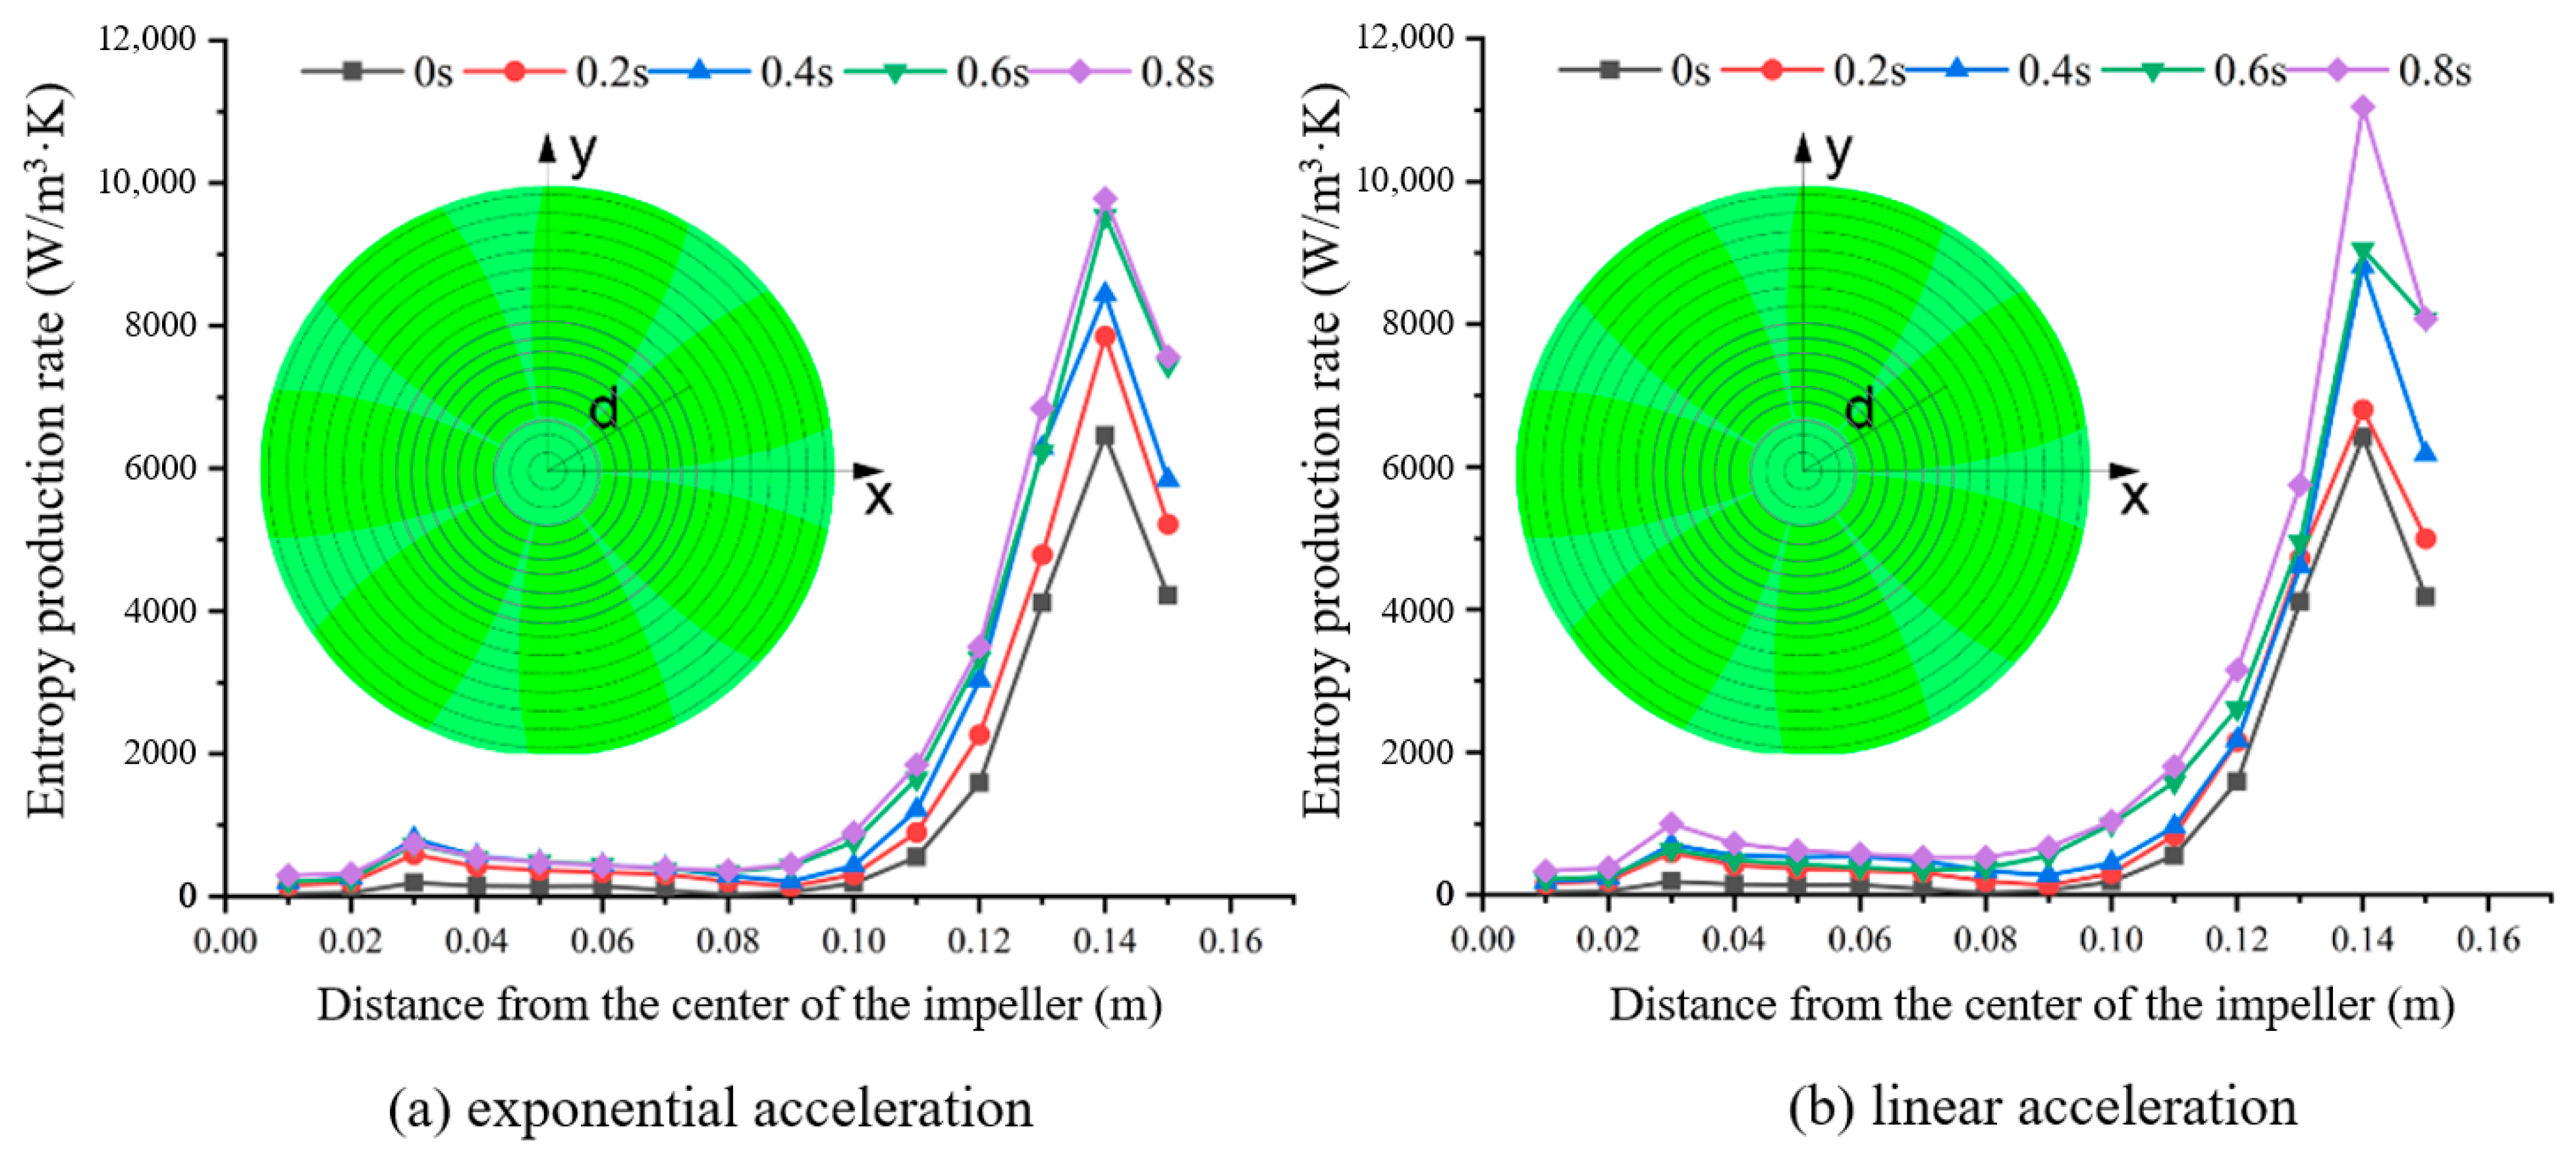
To gain a more in-depth analysis of losses of flow in the pump impeller, Figure 21 and Figure 22 show the spatial distribution of entropy production rate in different sections of the impeller. In Figure 21, as shown by the entropy production rate in the axial direction, entropy production progressively increases along the acceleration process until a maximum upon complete acceleration. Moreover, it is found from the data that before the ninth section in the axial direction, the entropy production rate during exponential acceleration of the pump is higher compared to linear acceleration of the pump, while from the ninth section onward, this situation changes. Figure 22 depicts the entropy production rate along the radial direction, suggesting that entropy production increases from the impeller’s central section towards its peripheral section until it reaches the maximum in the fourteenth section in the radial direction and then subsequently decreases. This trend indicates that entropy dissipation is mainly concentrated near the impeller’s rim section. Moreover, upon complete acceleration, the entropy production rate in each radial section is found to be higher compared to the exponential acceleration of the pump.

4. Conclusions

This study employs numerical simulation to investigate the cavitating flow and internal energy dissipation in a shaftless water-jet propulsion pump under various acceleration profiles. The numerical method was validated by comparing experimental data with the simulation results for the pump head and cavitation performance. Our results confirm that the operational acceleration profile is a critical factor affecting the transient cavitation performance and energy dissipation. The findings suggest that for real-world applications requiring a rapid thrust response, an exponential acceleration profile is effective in mitigating severe cavitation and pressure pulsations during the critical initial phase. This work provides a valuable guideline for the design of marine propulsion control systems, potentially leading to improved operational efficiency and extended component longevity. Future industrial research could focus on implementing and optimizing such adaptive acceleration strategies in propulsion controllers, building upon the mechanistic understanding established herein. The main results are summarized below:
(1) The credibility of this study’s findings is ensured through rigorous numerical and experimental validation. This includes a steady-state grid independence study, strict control of temporal discretization (CFL < 1), and an experimental uncertainty below ±0.866%. The excellent agreement between the simulation and measurement, with deviations of less than 5%, confirms the physical accuracy of the results.
(2) Between the start and end of acceleration, during linear acceleration, the volumetric expansion of the cavity increased by 0.01544, which is a growth rate of 7261.2%. For acceleration of an exponential nature, volumetric expansion of the cavity increased by 0.00414 with a growth rate of 1554.2%. Compared to linear acceleration, the volumetric expansion of the cavity in the impeller was higher at the start of acceleration but showed an inverse ratio later during exponential acceleration. The maximum difference in volumetric cavity between the two types of acceleration during acceleration of flow was 0.01124.
(3) Relative to linear acceleration, lower vibration amplitudes of the pressure pulsation coefficient were found along the mid-span and root sections of the blades in the exponential acceleration mode, along with lower amplitudes of the major frequency component of pressure pulsations. For both regimes of acceleration, the most predominant frequency present in each of the monitor locations of the stationarily running water-jet propulsion pump corresponded to the rotational frequency of the shaft, along with a harmonically higher frequency present at a shaft frequency of seven.
(4) For all acceleration modes, turbulent entropy generation in the impeller is the main source of energy loss, virtually localized near the impeller edge. Additionally, entropy generation overall under exponential acceleration is higher than that under linear acceleration.

5. Limitations and Future Work

While this study provides a systematic comparison of cavitation evolution under different acceleration conditions, certain limitations should be acknowledged. The analysis of cavitation mechanisms primarily focused on macroscopic behavior; detailed quantitative correlations, such as those between the local pressure and the vapor fraction or turbulence intensity, were beyond the scope of this work. Furthermore, although the entropy production results were derived from a flow field rigorously validated against experimental performance data, they were not directly measured due to the inherent challenges in quantifying local entropy in transient multiphase flows.
For future research, a detailed quantitative investigation into the local correlations between pressure fluctuation, vapor fraction, and turbulent kinetic energy during transient cavitation will be a primary focus of our subsequent research. Concurrently, experimental efforts will focus on acquiring local two-phase flow measurements to validate not only global performance but also local flow structures and loss mechanisms.

Author Contributions

Conceptualization, J.L.; methodology, J.L. and Y.W.; software, J.L., Y.W. and M.L.; formal analysis, J.L.; writing—original draft, J.L.; writing—review and editing, J.L., Y.W., H.L. and Q.P.; project administration, H.L.; supervision, H.L.; validation, M.L., J.L. and Q.P.; investigation, M.L. and Q.P.; data curation, J.L.; funding acquisition, Y.W. All authors have read and agreed to the published version of the manuscript.

Funding

This work was financially supported by the National Natural Science Foundation of China (Grant No. U23A20672).

Institutional Review Board Statement

Not applicable.

Informed Consent Statement

Informed consent was obtained from all subjects involved in the study.

Data Availability Statement

The data that support the findings of this study are available from the corresponding authors upon reasonable request.

Conflicts of Interest

The authors declare no conflicts of interest.

Nomenclature

QdDesigned flow (m3/h)
HDesigned head (m)
nRated speed (r/min)
nsSpecific speed
ZNumber of impeller blades
DImpeller diameter (mm)
ρDensity of the fluid medium
McMass of the reduced cavities (kg/(m3·s))
MvMass of the increased cavities (kg/(m3·s))
pPressure (Pa)
pvVaporization pressure (Pa)
psatsaturated vapor pressure (Pa)
μViscosity coefficient
FDInterphase drag force
FTDTurbulent diffusion force
PkProduction term
DkDissipation term
αvVapor phase volume fraction
αlLiquid phase volume fraction
αnucVolume fraction of the cavitating nucleon
RBCavity radius
m ˙ + Evaporation rate
m ˙ Condensation rate
x0Initial speed of the impeller (r/min)
xaAcceleration of the impeller (r/min)
tA certain time during the acceleration (s)
t0Total time for the impeller to accelerate (s)
TKTemperature (K)
ωTurbulent eddy viscosity frequency (s−1)
kTurbulent kinetic energy (m2/s2)
βEmpirical coefficient

Abbreviations

CFDComputational Fluid Dynamics
SSTShear stress transport
GGIGeneral Grid Interface
RANSReynolds Average Navier-Stokes
CFLCourant Friedrichs Lewy

References

  1. Kim, C.; Chun, H. Experimental Investigation into the performance of the Axial-Flow-Type Waterjet according to the Variation of Impeller Tip Clearance. Ocean Eng. 2005, 34, 275–283. [Google Scholar] [CrossRef]
  2. Chen, W.; Chen, P.; Zhou, Y.; Zhang, C. The effect of tip rake distribution on the hydrodynamic performance of shaftless rim-driven contra-rotating thruster. Ocean Eng. 2023, 285, 115454. [Google Scholar] [CrossRef]
  3. Cao, L.; Che, X.; Hu, J. Design method of water jet pump towards high cavitation performances. In Proceedings of the IOP Conference Series: Materials Science and Engineering, Hangzhou, China, 20–23 May 2016; Volume 129, p. 012067. [Google Scholar]
  4. Tan, Z.; Yan, P.; Liu, L. Technology development and prospect of shaftless rim-driven propulsion system. J. Wuhan Univ. Technol. 2015, 39, 601–605. [Google Scholar]
  5. Ni, Y.; Liu, M. Overview on research of water-jet propulsion. Ship Ocean Eng. 2013, 42, 1–5. [Google Scholar]
  6. Miorini, L.; Wu, X.; Katz, J. The internal structure of the tip leakage vortex within the rotor of an axial waterjet pump. J. Turbomach. 2012, 134, 031018. [Google Scholar] [CrossRef]
  7. Jiao, X.; Wang, Q.; Cheng, L.; Zhao, H. Experimental study on thrust pulsation characteristics of water jet propulsion pump units. Ocean Eng. 2023, 284, 115079. [Google Scholar] [CrossRef]
  8. Gong, B.; Zhang, C.; Yi, L. Experimental study on the cavitation flow and the induced vibration characteristics of a mixed-flow water-jet pump. J. Vib. Shock 2024, 43, 42–45. [Google Scholar]
  9. Dong, Q.; Yang, J. Experimental study on effect of cavitation on fluctuating pressure on the duct of waterjet. Ship Boat 2023, 34, 35–42. [Google Scholar]
  10. Yan, P.; Zhang, Z.; Meng, Y.; Geng, H. Numerical investigation of internal flow characteristics in an azimuth waterjet propulsion at different ship speeds. Appl. Ocean Res. 2025, 154, 104406. [Google Scholar] [CrossRef]
  11. Gong, J.; Wu, W.; Ding, M. Numerical analysis on the transom-stern wake with a horizontal plunging jet. Ocean Eng. 2023, 285, 115465. [Google Scholar] [CrossRef]
  12. Liu, H.; Cao, Y.; Wang, Y. Hydrodynamic characteristics of shaft-less waterjet pump. J. Drain. Irrig. Mach. Eng. 2015, 33, 380–386. [Google Scholar]
  13. Zhu, H.; Jin, B.; Wang, D. Open-water characteristics of shaftless pump-jet thruster. Acta Armamentarii 2021, 42, 835–841. [Google Scholar]
  14. Du, W.; Yuan, G.; Cai, L. Analysis on hydrodynamic performance of shaftless waterjet based on CFD. Ship Sci. Technol. 2022, 44, 20–25. [Google Scholar]
  15. Wang, C.; Zhang, Y.; Yang, J. Influence of pump shaft on flow performance of inlet duct and waterjet propulsion. Ship Eng. 2023, 45, 22–27. [Google Scholar]
  16. Soltanmohamadi, R.; Lakzian, E. Improved design of Wells turbine for wave energy conversion using entropy generation. Meccanica 2015, 51, 1713–1722. [Google Scholar] [CrossRef]
  17. Li, X.; Zhu, Z.; Li, Y. Experimental and numerical investigations of head-flow curve instability of a single-stage centrifugal pump with volute casing. Proc. Inst. Mech. Eng. Part A J. Power Energy 2016, 230, 633–647. [Google Scholar] [CrossRef]
  18. Ji, L.; Li, W.; Shi, W. Energy characteristics of mixed-flow pump under different tip clearances based on entropy production analysis. Energy 2020, 199, 117447. [Google Scholar] [CrossRef]
  19. Shen, S.; Qian, Z.; Ji, B. Numerical analysis of mechanical energy dissipation for an axial-flow pump based on entropy generation theory. Energies 2019, 12, 4162. [Google Scholar] [CrossRef]
  20. Shim, H.; Kim, K. Effects of the cross-sectional area of a volute on suction recirculation and cavitation in a centrifugal pump. J. Fluids Eng. 2022, 142, 051204. [Google Scholar] [CrossRef]
  21. Wang, Y.; Zhang, X.; Liu, L. Cavitation characteristics of rotational hydrodynamic cavitation generator. J. Drain. Irrig. Mach. Eng. 2023, 41, 160–165. [Google Scholar]
  22. Ruan, H.; Guo, C.; Yu, L. Cavitation induced flow instability mechanism of pump turbine under pump conditions. J. Drain. Irrig. Mach. Eng. 2023, 41, 779–786. [Google Scholar]
  23. Singhal, K.; Athavale, M.; Li, H. Mathematical Basis and Validation of the Full Cavitation Model. J. Fluids Eng. 2002, 124, 617–624. [Google Scholar] [CrossRef]
  24. Chen, T.; Huang, B.; Wang, G. Numerical study of cavitating flows in a wide range of water temperatures with special emphasis on two typical cavitation dynamics. Int. J. Heat Mass Transf. 2016, 101, 886–900. [Google Scholar] [CrossRef]
  25. Wang, Y.; Chen, J.; Luo, K. Analysis of cavitation characteristics of marine centrifugal pump based on modified Kunz model. J. Drain. Irrig. Mach. Eng. 2017, 35, 381–386. [Google Scholar]
  26. Ghorani, M.; Haghighi, M.; Maleki, A. A numerical study on mechanisms of energy dissipation in a pump as turbine (PAT) using entropy generation theory. Renew. Energy 2020, 162, 1036–1053. [Google Scholar] [CrossRef]
  27. Yu, A.; Tang, Y.; Tang, Q. Energy analysis of Francis turbine for various mass flow rate conditions based on entropy production theory. Renew. Energy 2022, 183, 447–458. [Google Scholar] [CrossRef]
  28. Kock, F.; Herwig, H. Local entropy production in turbulent shear flows: A high-Reynolds number model with wall functions. Int. J. Heat Mass Transf. 2004, 47, 2205–2215. [Google Scholar] [CrossRef]
  29. Kock, F.; Herwig, H. Entropy production calculation for turbulent shear flows and their implementation in CFD codes. Int. J. Heat Fluid Flow 2005, 26, 672–680. [Google Scholar] [CrossRef]
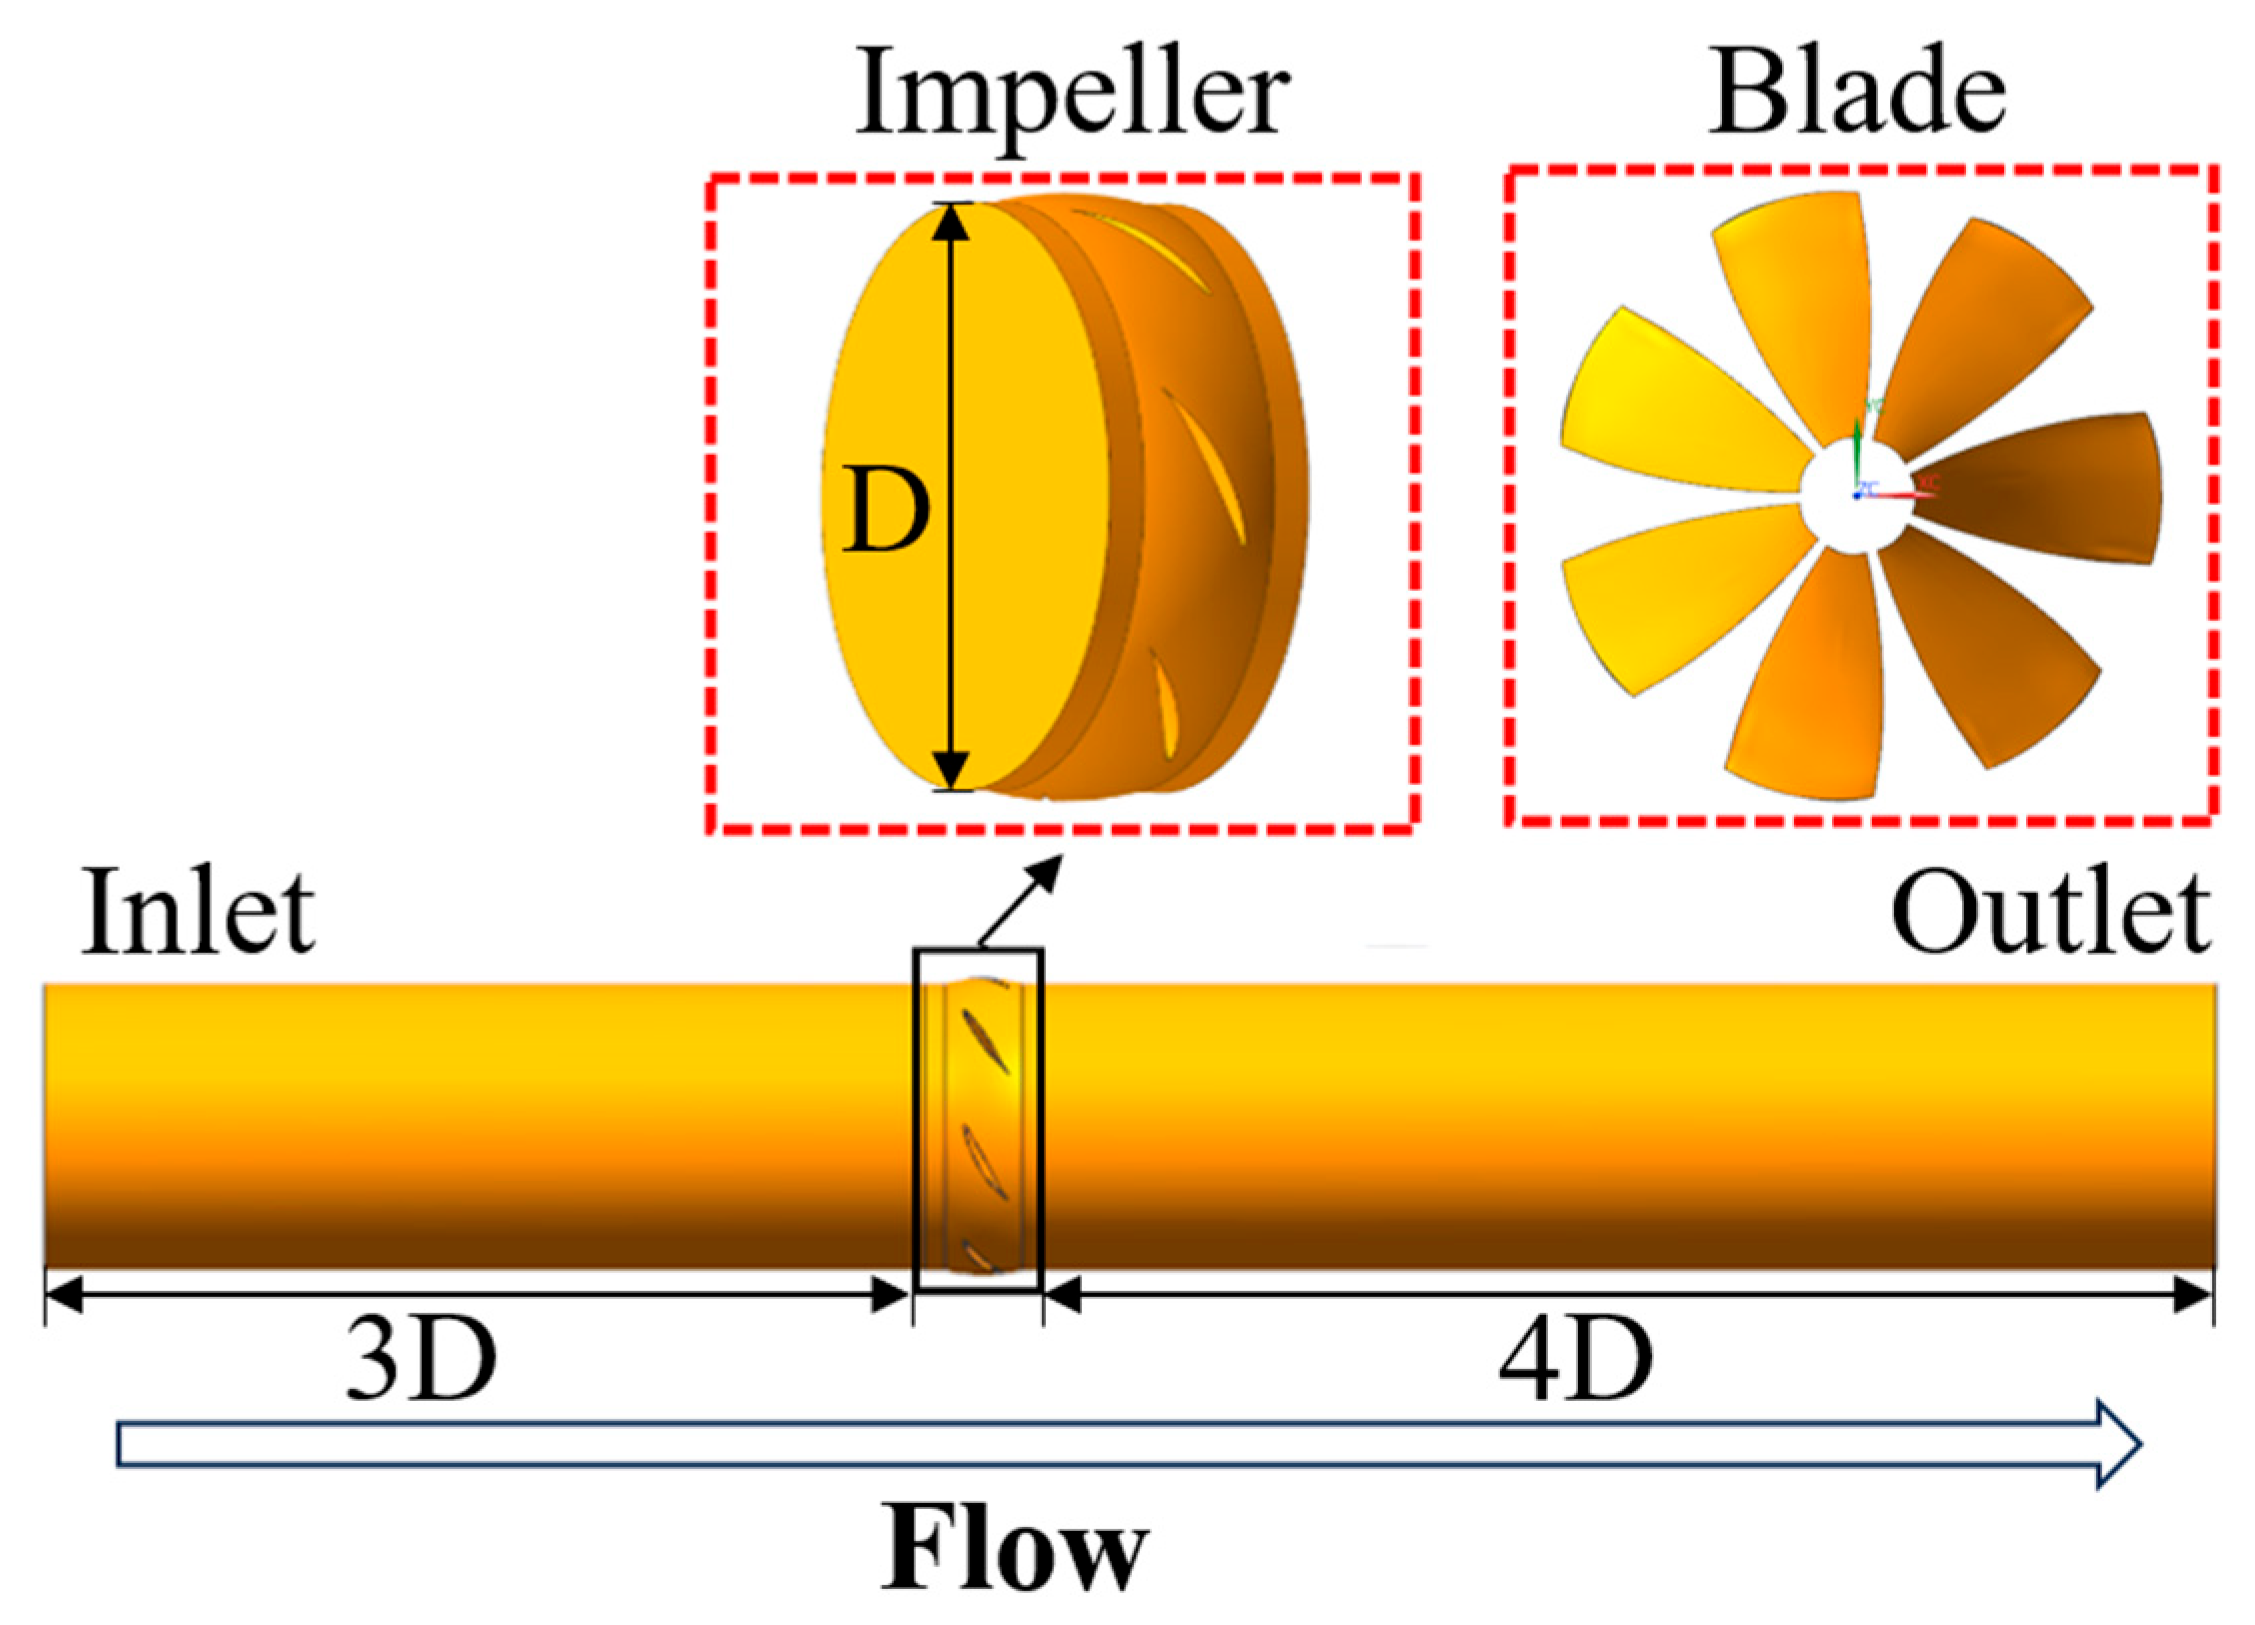
Figure 1. Three-dimensional model of shaftless water-jet propulsion pump.
Jmse 13 02165 g001
Figure 2. The speed change curve of the shaftless water-jet propulsion pump.
Jmse 13 02165 g002
Figure 3. Shaftless water-jet propulsion pump water grid.
Jmse 13 02165 g003
Figure 4. Grid independence verification.
Jmse 13 02165 g004
Figure 5. Distribution of y+ on the blade.
Jmse 13 02165 g005
Figure 6. Courant number on the blade surface during the transient acceleration (4.5 million grids).
Jmse 13 02165 g006
Figure 7. Shaftless water-jet propulsion pump test system. 1—shaftless water-jet propulsion pump; 2—pressure sensor; 3—frequency converter’; 4, 14—vent valve; 5, 10—surge tank, 6—booster pump; 7—pump base; 8—electromagnetic flowmeter; 9—electric valve; 11—cavitation tank; 12, 15—globe valve; 13—water injection hole; 16—vacuum pump.
Jmse 13 02165 g007
Figure 8. Physical diagram of the test section.
Jmse 13 02165 g008
Figure 9. Comparison of head curves of shaftless water-jet propulsion pump.
Jmse 13 02165 g009
Figure 10. Comparison of cavitation curves of shaftless water-jet propulsion pumps.
Jmse 13 02165 g010
Figure 11. Vortex core distribution within the impeller.
Jmse 13 02165 g011
Figure 12. Average cavity volume fraction and cavity distribution in impeller.
Jmse 13 02165 g012
Figure 13. Average cavity volume fraction of the axial cross-section inside the impeller.
Jmse 13 02165 g013
Figure 14. Average cavity volume fraction of the radial cross-section inside the impeller.
Jmse 13 02165 g014
Figure 15. Impeller axial velocity distribution.
Jmse 13 02165 g015
Figure 16. Impeller axial pressure distribution.
Jmse 13 02165 g016
Figure 17. Pressure pulsation coefficient distribution of impeller.
Jmse 13 02165 g017
Figure 18. Impeller frequency domain diagram.
Jmse 13 02165 g018
Figure 19. Entropy production distribution of shaftless water-jet propulsion pump.
Jmse 13 02165 g019
Figure 20. Distribution of entropy production in each flow-passing component.
Jmse 13 02165 g020
Figure 21. Distribution of entropy production rate in the impeller along the axial section.
Jmse 13 02165 g021
Figure 22. Distribution of entropy production rate in the impeller along the radial section.
Jmse 13 02165 g022
Table 1. Main hydraulic parameters of shaftless water-jet propulsion pump.
ParametersValue
Designed flow Qd (m3/h)1300
Designed head H (m)6.5
Rated speed n (r/min)1450
Specific speed ns781
Number of impeller blades Z7
Impeller diameter D (mm)300
Hub ratio dh/D0.2
Disclaimer/Publisher’s Note: The statements, opinions and data contained in all publications are solely those of the individual author(s) and contributor(s) and not of MDPI and/or the editor(s). MDPI and/or the editor(s) disclaim responsibility for any injury to people or property resulting from any ideas, methods, instructions or products referred to in the content.