Article

Evaluation of Extreme Sea Level Flooding Risk to Buildings in Samoa

1
Earth Sciences New Zealand, Wellington 6021, New Zealand
2
Disaster Management Office, Ministry of Natural Resources and Environment, Apia WS1338, Samoa
3
Geoscience, Energy & Maritime Division, The Pacific Community, Suva, Fiji
4
Geosciences Section, Meteorology Division, Ministry of Natural Resources and Environment, Apia WS1338, Samoa
*
Author to whom correspondence should be addressed.
J. Mar. Sci. Eng. 2025, 13(11), 2143; https://doi.org/10.3390/jmse13112143
Submission received: 8 October 2025 / Revised: 4 November 2025 / Accepted: 11 November 2025 / Published: 12 November 2025
(This article belongs to the Section Coastal Engineering)

Abstract

This study presents an economic risk evaluation of buildings in Samoa exposed to extreme sea level (ESL)-driven episodic flooding and permanent inundation from relative sea level (RSL) rise. A spatiotemporal risk analysis framework was applied at the building object level to calculate monetary loss, expressed as the exceedance probability loss (EPL) and average annual loss (AAL). Economic risk was enumerated at national and district levels between the period 2020 and 2140 based on RSL projections for medium confidence Shared Socioeconomic Pathways (SSPs). Over this century, national AAL for buildings from ESL flooding in 2020 is expected to double by 2100 (USD 47–51 million). Under high emissions scenarios SSP3-7.0 and SSP5-8.5, AAL rates decelerate after 2100 as permanent inundation loss increases. District level risk variability is evident. For example, Tuamasaga on Upolu Island accounted for 44% of national 100-year annual recurrence interval losses, while AAL for Aiga-i-le-Tai and Va’a-o-Fonoti over this century reaches 8% of total district building replacement values. Our model approach has potential future applications to evaluate spatiotemporal risk distribution for a broader range of socioeconomic impacts that may occur beyond directly affected flood inundation areas.

1. Introduction

Flooding is among the most devastating natural hazards affecting Pacific Small Island Developing States (PSIDS) [1]. These states are often situated in regions with climate regimes highly susceptible to tropical cyclone induced coastal flooding [2,3]. Global sea level change over the next century is expected to exacerbate the incidence of coastal flooding in PSIDS. Vitousek [4] estimated that a 0.1 to 0.2 m relative sea level (RSL) rise could double the frequency of episodic extreme sea level events in PSIDS. This change in flood regimes is likely to cause national and subnational disruption to economic activities and social cohesion from population migration from at risk areas [5]. Despite the potential frequency and severity of flood events, limited data availability continues to hinder the understanding of present-day and future flooding risk in many PSIDS.
Global mean sea level-rise (GMSLR) is expected to exacerbate localized episodic flooding from ESLs caused when tides, low atmospheric pressure, and wind-driven waves combine to produce storm-tides. Relative sea level (RSL) change can be highly variable over short coastline lengths, with uncertainty increasing under future Shared Socioeconomic Pathway-projected GMSLR scenarios [6]. In this situation, accurate economic risk assessments require an object-specific representation of tangible assets (e.g., buildings; infrastructure network components). Nationwide coastal flood risk assessments at the object level are limited to few countries [7,8,9], and risk assessments at this level are rarely undertaken for PSIDS. Risk information for high-value assets such as buildings at an object level is critical for evidence-based prioritization of hazard mitigation interventions (e.g., levees; nature-based solutions) and risk transfer management strategies (e.g., insurance; mortgages).
The availability of high-resolution coastal flood risk models remains a challenge for PSIDS. While recent advancements are made in high-resolution topographic data collection (i.e., LIDAR), storm-driven extreme sea level analyses [10], and asset-specific spatial databases [11], these data often have limited spatial resolutions that hinder continuous nationwide coastal flood risk analyses. This creates a knowledge gap within countries whereby detailed risk information is available for specific island or sub-island locations only (e.g., village; townships), with the relative risk levels between locations typically unknown. This poses a problem for evidence-based risk management whereby decisions on interventions may be limited to locations where risk data and information is available. Large-scale models that continuously map flooding hazards and impacts/risks at a national scale provide an opportunity for PSIDS to evaluate flood risk consistently across jurisdictional boundaries/islands.
This case study evaluates national building risk from coastal flooding and sea level-rise in Samoa (Figure 1). We address a current knowledge gap regarding national-scale flooding risk by developing a model framework to evaluate the changing risk to Samoa’s buildings under present-day and future RSL scenarios. Using nationwide extreme sea level and RSL projections, we evaluate building structure damage and direct economic loss out to the year 2140 in response to local RSL change. Economic loss timing and magnitude were analyzed at a building level, with particular attention on Shared Socioeconomic Pathway (SSP) 1–1.9, 2–4.5, 3–7.0, and 5–8.5 (medium confidence) scenarios between 2020 and 2140. We enumerate loss from ESL-driven episodic flooding at the national and district levels, reporting changes in loss for 100-year annual recurrence interval (ARI) flooding events and average annual loss (AAL). The analysis identifies future spatiotemporal economic loss shifts in response to RSL change.

2. Materials and Methods

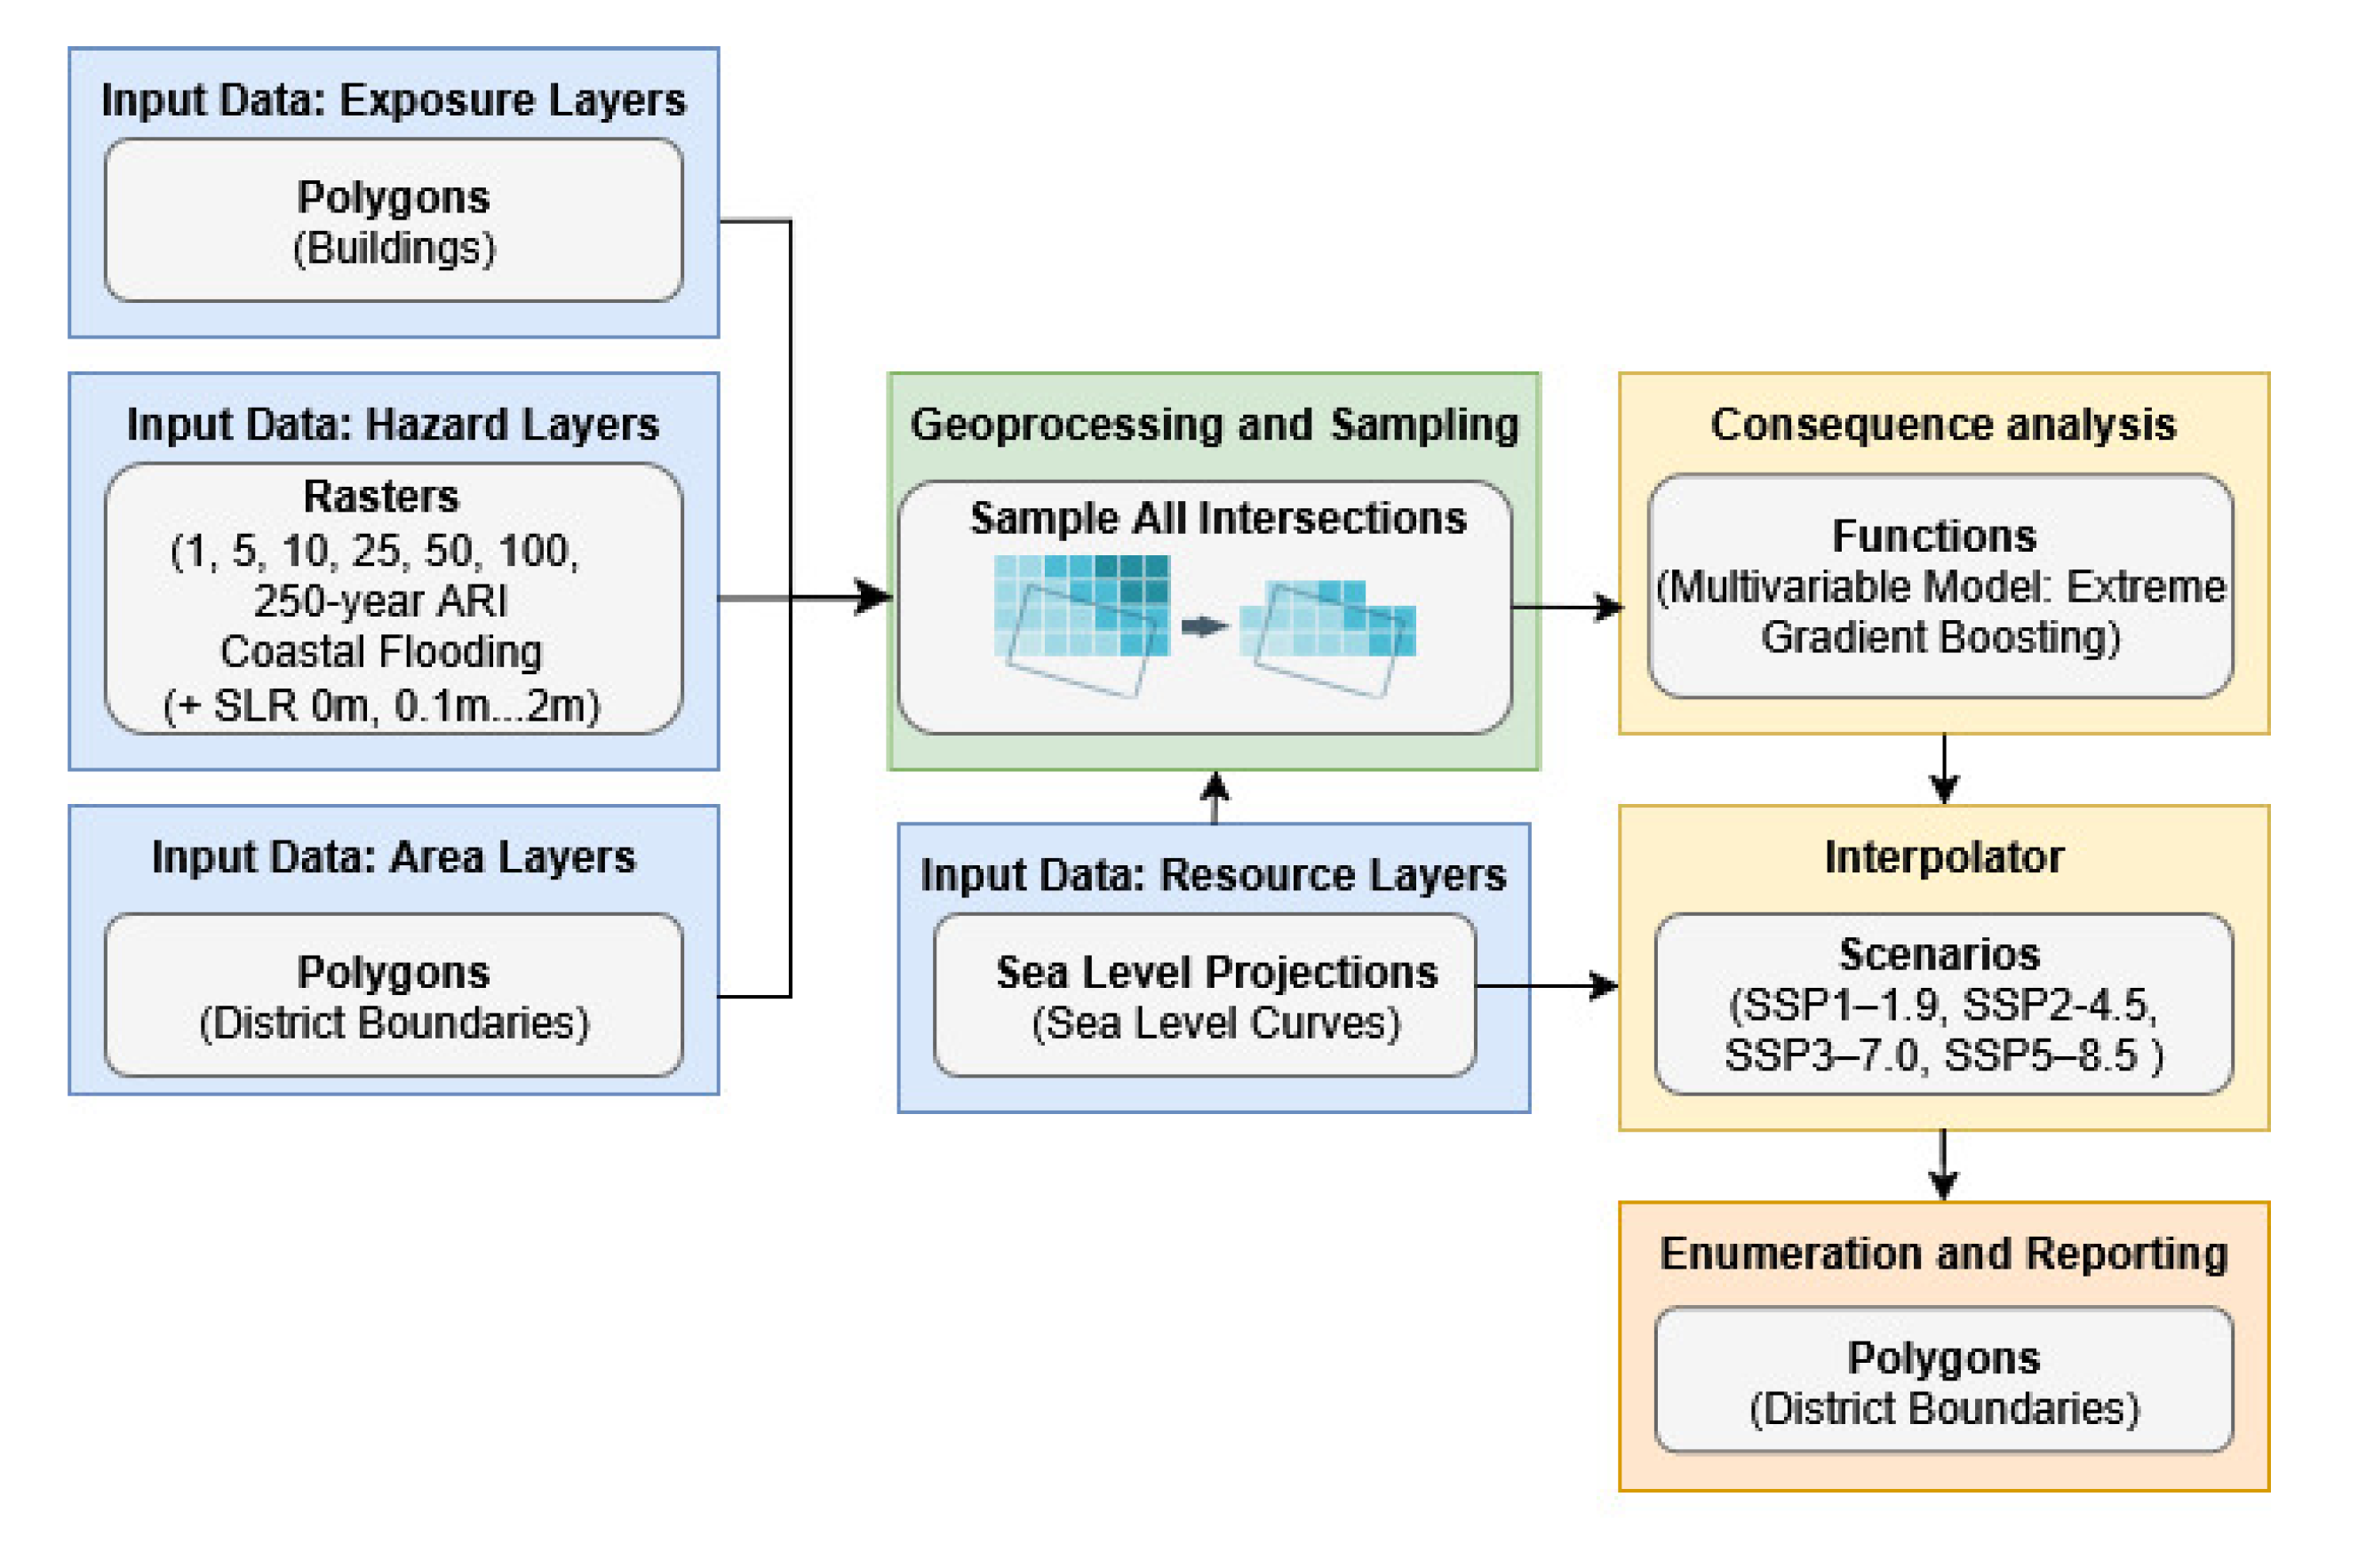
In this study, flood risk is defined as the frequency and magnitude of direct tangible damage resulting from the spatiotemporal interaction between flood hazard intensities (i.e., water depth) and building structures with an inherent vulnerability to damage when exposed to a given hazard intensity. Flood risk was assessed using the RiskScape multi-hazard modelling framework [12], a modular and configurable tool used here to evaluate exposure and impacts from coastal flooding caused episodically by extreme sea levels (ESLs), as well as permanent inundation from mean sea level-rise (SLR) and tides under both current and future climate scenarios. The model input data, processing steps, and output data are conceptualized in Figure 2 and described in Section 2.1, Section 2.2 and Section 2.3.

2.1. Input Data

2.1.1. Hazard

Nationwide spatiotemporal mapping of episodic flooding from extreme sea levels (ESLs) and permanent inundation from mean high-water springs (MHWS) was undertaken for present-day and higher mean sea levels (MSLs). Here, ESL represents the total water level (TWL) contribution from the cumulative effect of several oceanographic and atmospheric processes, including MSL, tidal elevation, and dynamic contributions from waves and storm surge. TWL can be expressed as follows:
T W L t = η ~ 2 + I B + S L A + A T
where η ~ 2 is the 2% exceedance wave-induced water level based on the formulation in [13] for reef-fronted coastlines, IB is the inverted barometer effect, SLA is the sea level anomaly, and AT is the astronomical tide. η ~ 2 was determined based on the significant wave height ( H s ), energy wave period ( T m 01 ), and mean wave direction ( θ m ) from the ERA5 global reanalysis [14]. IB was calculated as 1 cm of sea level-rise for every 1 hPa atmospheric pressure deficit from ERA5. Sea level anomaly (SLA) data was obtained from ORAS5 reanalysis [15]. For the astronomical tide, the mean high-water spring (MHWS) at each location derived from the primary tidal constituents (K1, O1, M2, and S2) in the TPXO9 dataset [16] was held constant in time. This approach ensures that all extreme water level events are captured, irrespective of their coincidence with high or low tides, thereby producing conservative inundation estimates. Wind setup was excluded from the TWL calculation due to its typically low contribution in island settings with narrow fringing reefs, where extreme sea levels are dominated by the pressure deficit of tropical cyclones [17,18]. Furthermore, the abrupt bathymetric transition between the deep ocean and the narrow reef flat prevents the generation of a significant wind setup [19]. However, this approach to exclude wind setup may underestimate TWL at locations where gently sloping coastal profiles and semi-enclosed embayments can amplify the wind setup.
Total water levels were calculated at 200–500 m intervals along the island coastline or atoll rim (reef crest), depending on local geomorphology, to capture variations in shoreline orientation. Waves were propagated from the nearest ERA5 grid node to each coastal point using Snell’s law, and all TWL components were interpolated to a 3 h resolution. The annual maxima from the 44-year TWL time series were fitted with the Generalized Extreme Value (GEV) distribution, i.e., Frechet or Gumbel for cyclone-dominated areas, such as Samoa. This produced TWL annual return intervals (ARIs) for 1-, 5-, 10-, 25-, 50-, 100-, and 250-year events.
These spatially variable TWL scenarios provided the flood surface input for inundation mapping. The mapping process extracted digital elevation model (DEM) grid cells situated below the ESL surface using a static-inclined inundation mapping technique [20]. The DEM was based on LiDAR topography (vertical error ± 0.2 m) and nearshore bathymetry (to 30 m depth) at a 5 m resolution [21,22]. Flood water depths were calculated as the difference between the ESL surface and land elevation for each DEM grid cell. This approach incorporated alongshore TWL gradients, adding complexity and realism beyond traditional planar static inundation models.
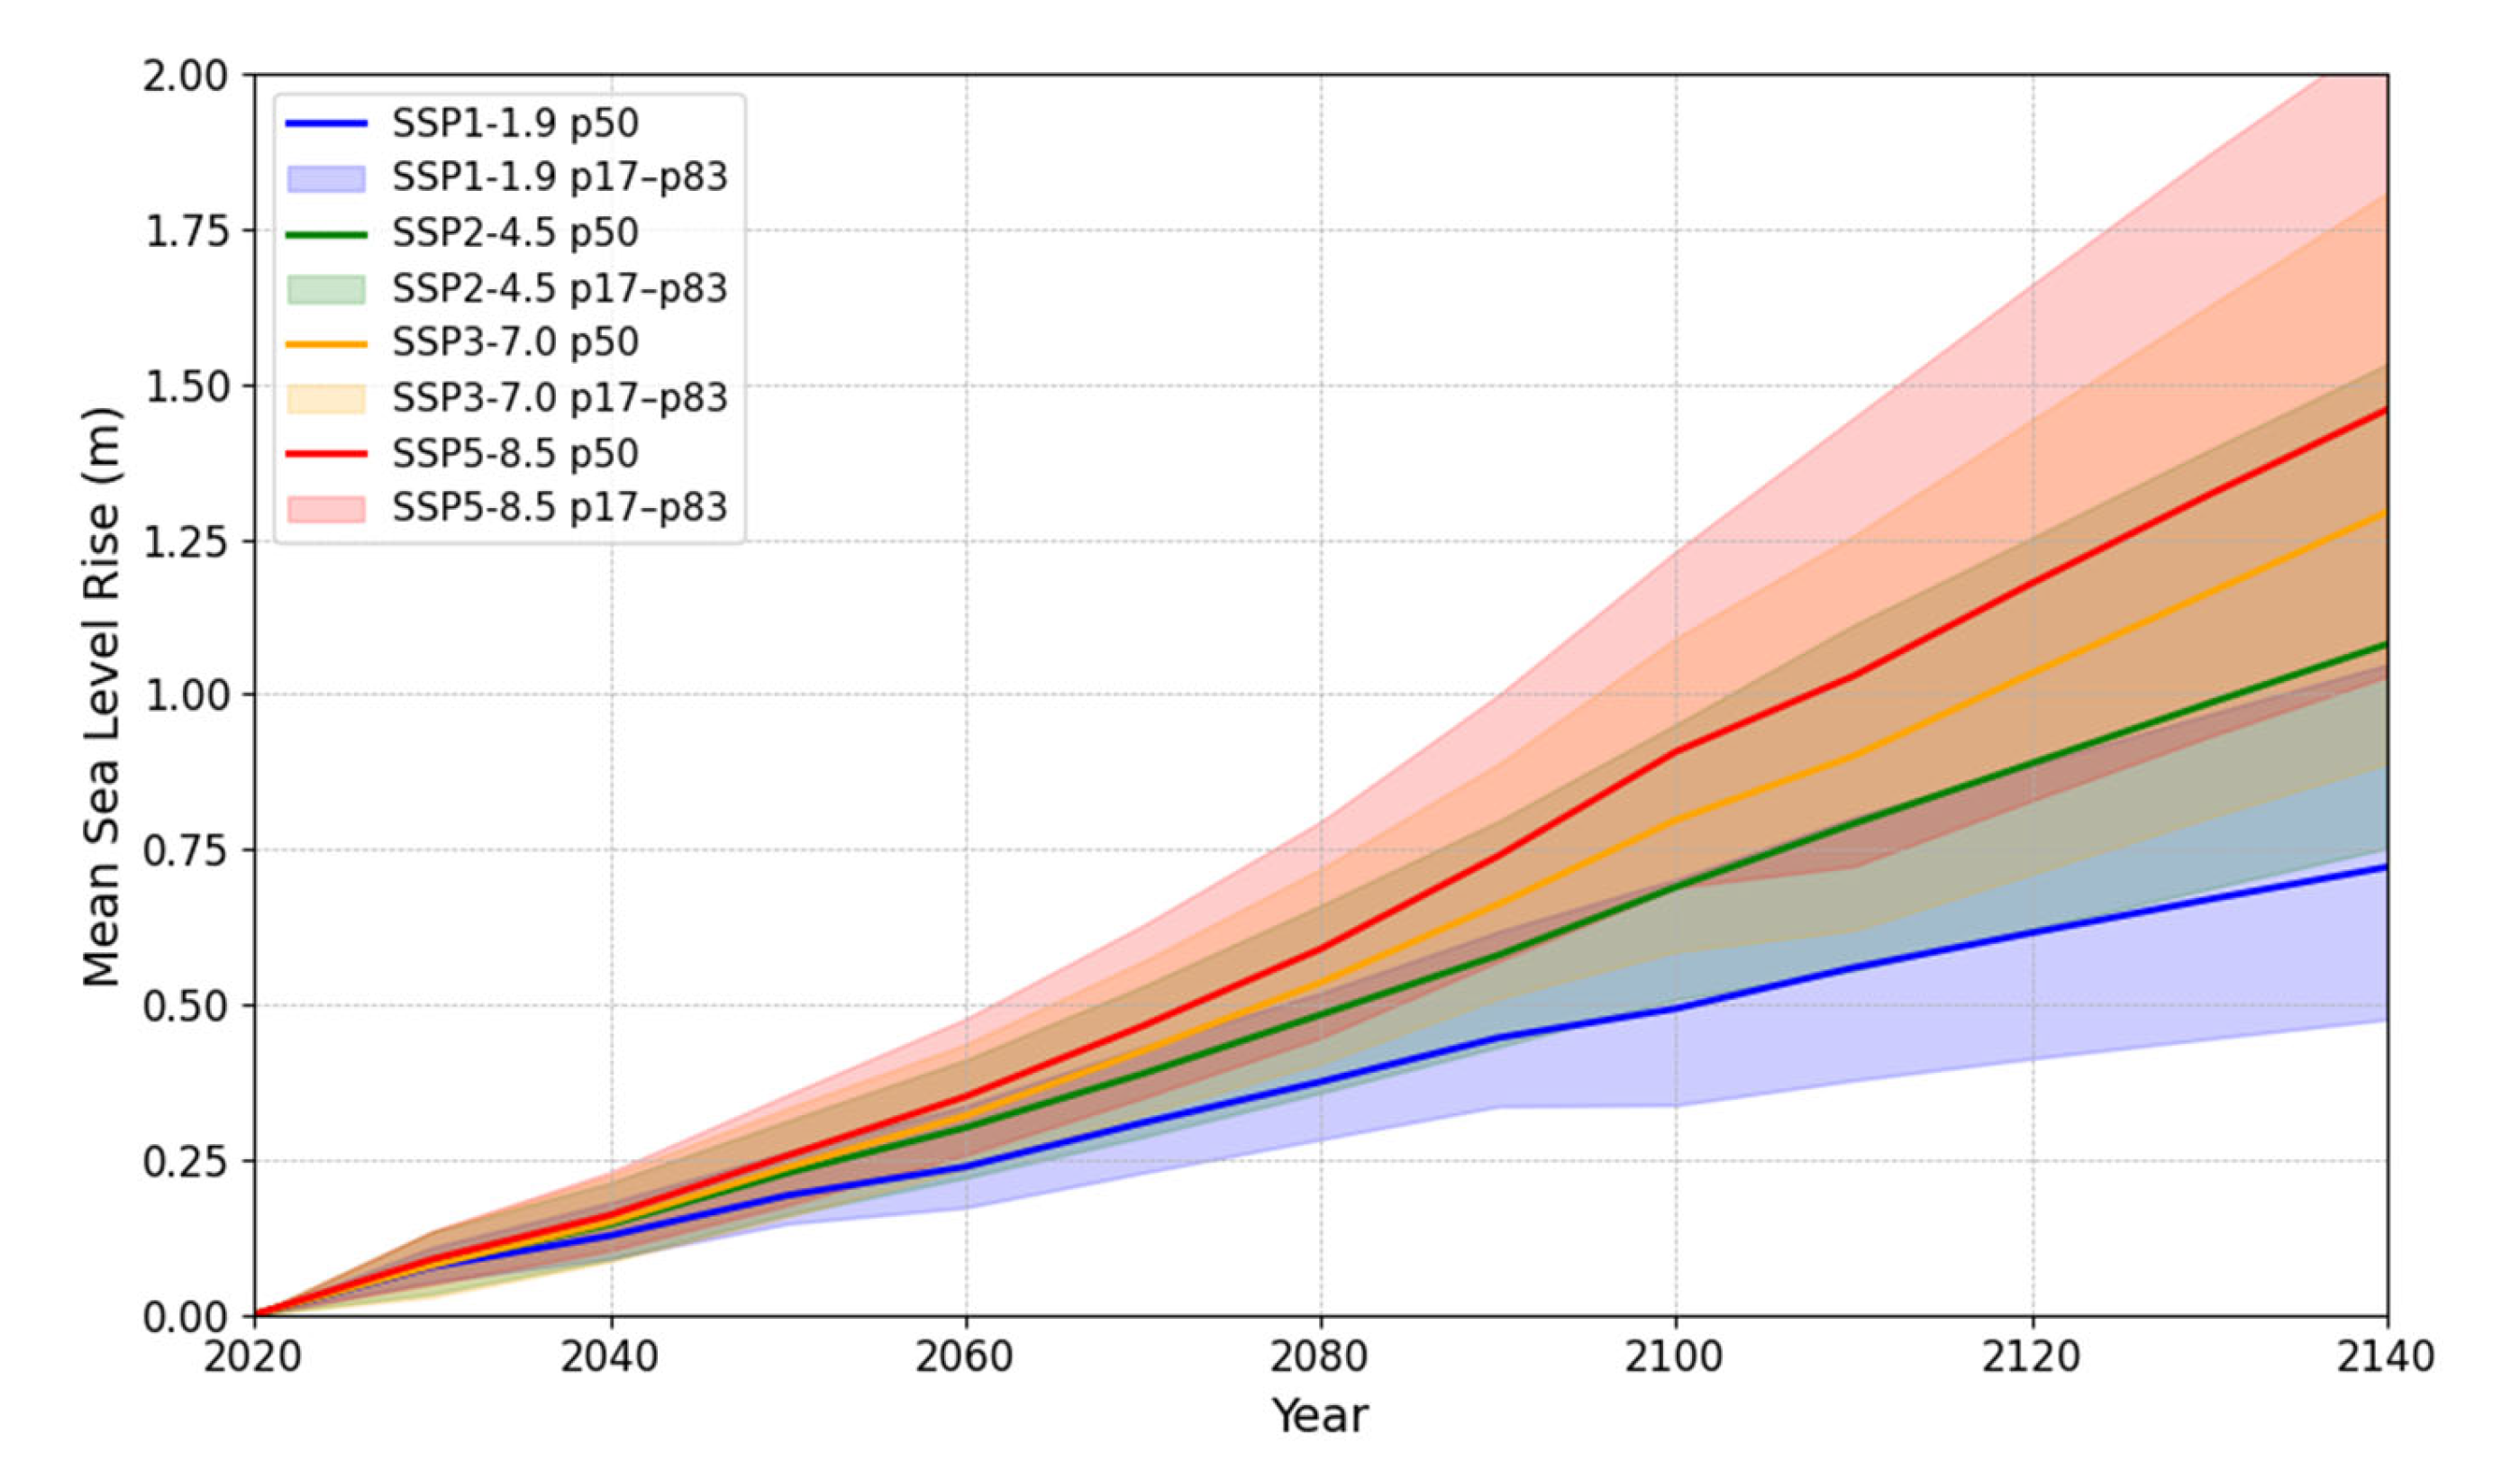
The future rates and timing of global mean sea level-rise (GMSLR) remain highly uncertain, particularly beyond 2050 [23]. A scenario-based approach was adopted to account for local RSL uncertainty, evaluating incremental increases of 0.1 m above present-day MSL [24]. This approach allowed the generation of a wide range of flooding scenarios independent of the timing of future RSL projections. A maximum 2 m SLR was considered to represent a broad range of RSL scenarios along Samoa’s coastline over the next century under various Shared Socioeconomic Pathways (SSPs) [23]. Medium confidence climatic processes for SSP ‘low’ (SSP1–1.9), ‘moderate’ (SSP2–4.5), ‘high’ (SSP3–7.0), and ‘very high’ (SSP5–8.5) emissions scenarios were represented as RSL curves (Figure 3). Each curve was spatially joined to each flood-exposed building to generate probabilistic projections of the future magnitude and timing of direct economic losses between 2020 and 2140.

2.1.2. Exposure

The exposure model estimated the replacement value of individual buildings exposed to coastal flooding. The building replacement value ( B R ) was calculated using the following general formula:
B R = i = 1 n j = 1 m i C R i j ·   B A
where for building i ,  B A is the area (m2), C R is the replacement value for structure, external finishes, internal finishes, and service components ( m i ), and n equals the number of components. B R was computed as the sum of i = 1…n, enumerated from corresponding j = 1…m component unit cost rates (USD) determined from 2020 national building construction valuation guidelines [25]. Building-specific unit costs were estimated using area (m2), use, stories, structural frame, and wall cladding (Table 1) attributes. Unit cost rates represented a median C R for B R enumeration.
A nationwide dataset representing 88,417 building outlines (i.e., building footprint) was used for this study. Several geometric and non-geometric attributes were considered for building replacement valuation and vulnerability model application, including area (m2), primary use, stories, structural frame, and wall cladding (Table 1). Building outlines and their attributes within the maximum modelled coastal flooding extent (i.e., 250-year ARI + 2 m SLR) were spatially integrated from several object-specific building datasets [26,27,28,29,30] for Samoa.

2.1.3. Vulnerability

Building structure vulnerability to physical damage was evaluated using trained decision trees based on the Extreme Gradient Boosting (XGB) algorithm [31]. The XGB algorithm for regression analysis is well suited for handling complex, nonlinear relationships between hazard and exposure predictors for physical damage. The algorithm handles missing data and mixed data types, and decision tree ensembles can further improve prediction accuracy by reducing overfitting [31]. We used the XGBoost implementation for python with the XGB algorithm trained on local empirical flood damage data from 2012 Tropical Cyclone Evan [32]. We used the hyperparameter recommendations from [32] (i.e., trees = 200; learning rate = 0.01) and limited the algorithm training to the predictor variables—maximum water depth (m), area (m2), primary use, stories, structural frame, and wall cladding—corresponding to hazard and exposure model input data. The response variable predicted by the trained algorithm was a relative damage ratio (0 to 1), representing the building ‘cost-to-repair’/‘cost-to-replace’. The model configuration produced a mean absolute error of 0.17, with a minimal mean bias error (−0.03).

2.2. Geoprocessing and Sampling

The geoprocessing and sampling steps were used to transform model input data geometries to extract spatial information for risk analysis [12]. Model input data was represented as raster grid (hazard inundation) and polygon (buildings; district boundaries) geometries. Building polygons were ‘cut’ into grids by the corresponding 5 m hazard grid geometry to sample spatial information from the intersecting hazard grid and district and village polygons. The sampling process created a georelational coverage data file by converting relevant hazard and enumeration area information into indexed values at defined locations, e.g., building outline centroids. Indexed values were then extracted to the coverage data file. Lookup functions were then used to assess hazard and enumeration area information for building grids exposed to coastal flooding. This process facilitated the calculation of descriptive statistics for building monetary loss as the risk analysis response variable.

2.3. Risk Analysis

The risk analysis quantified the building monetary loss B L from episodic flooding events using a unit loss method:
B L =   i   =   1 N R i   f D i W D i
where for building i, B L is enumerated based on replacement value R , and the maximum water depth ( W D ) sample within the building outline determines the relative damage from a corresponding vulnerability function   f D . To account for building loss from permanent inundation (PL), a function was applied to determine building PL( B P L ) from inundation of a building outline from a 1-year ARI event:
B P L =     R i ,     I f   W D i >   0.05   m   and   A R I   =   1 y e a r           0 ,     o t h e r w i s e                                                                                                              
The frequency of B L was calculated as the exceedance probability loss (EPL) and average annual loss (AAL). EPL was calculated for the independent variables B L   and B P L hazard event probability of occurrence P as follows:
E P L = i = 1 N B L P     B P L P
where B P L P     a n d   B L P ,   r e s p e c t i v e l y , r e p r e s e n t the monetary loss probability of occurrence for permanent and episodic flooding, and N is the sum of damaged buildings exposed by a hazard event with probability of occurrence P. A hypothetical loss curve is formed between P and EPL with a positive monotonic trend in response to decreasing P. The expected AAL is then estimated using trapezoidal integration to compute the area under the curve:
A A L = P m i n P max E P L P
where P m a x and P m i n represent, respectively, the highest and lowest hazard event annual probability of occurrence. E P L P denotes the building monetary loss enumeration for hazard events with the annual probability of occurrence P . Using the trapezoidal Riemann sum approach, the AAL was computed by solving the integral in Equation (6).

3. Results and Discussion

3.1. Building Economic Losses from 100-Year Annual Recurrence Interval Coastal Flooding

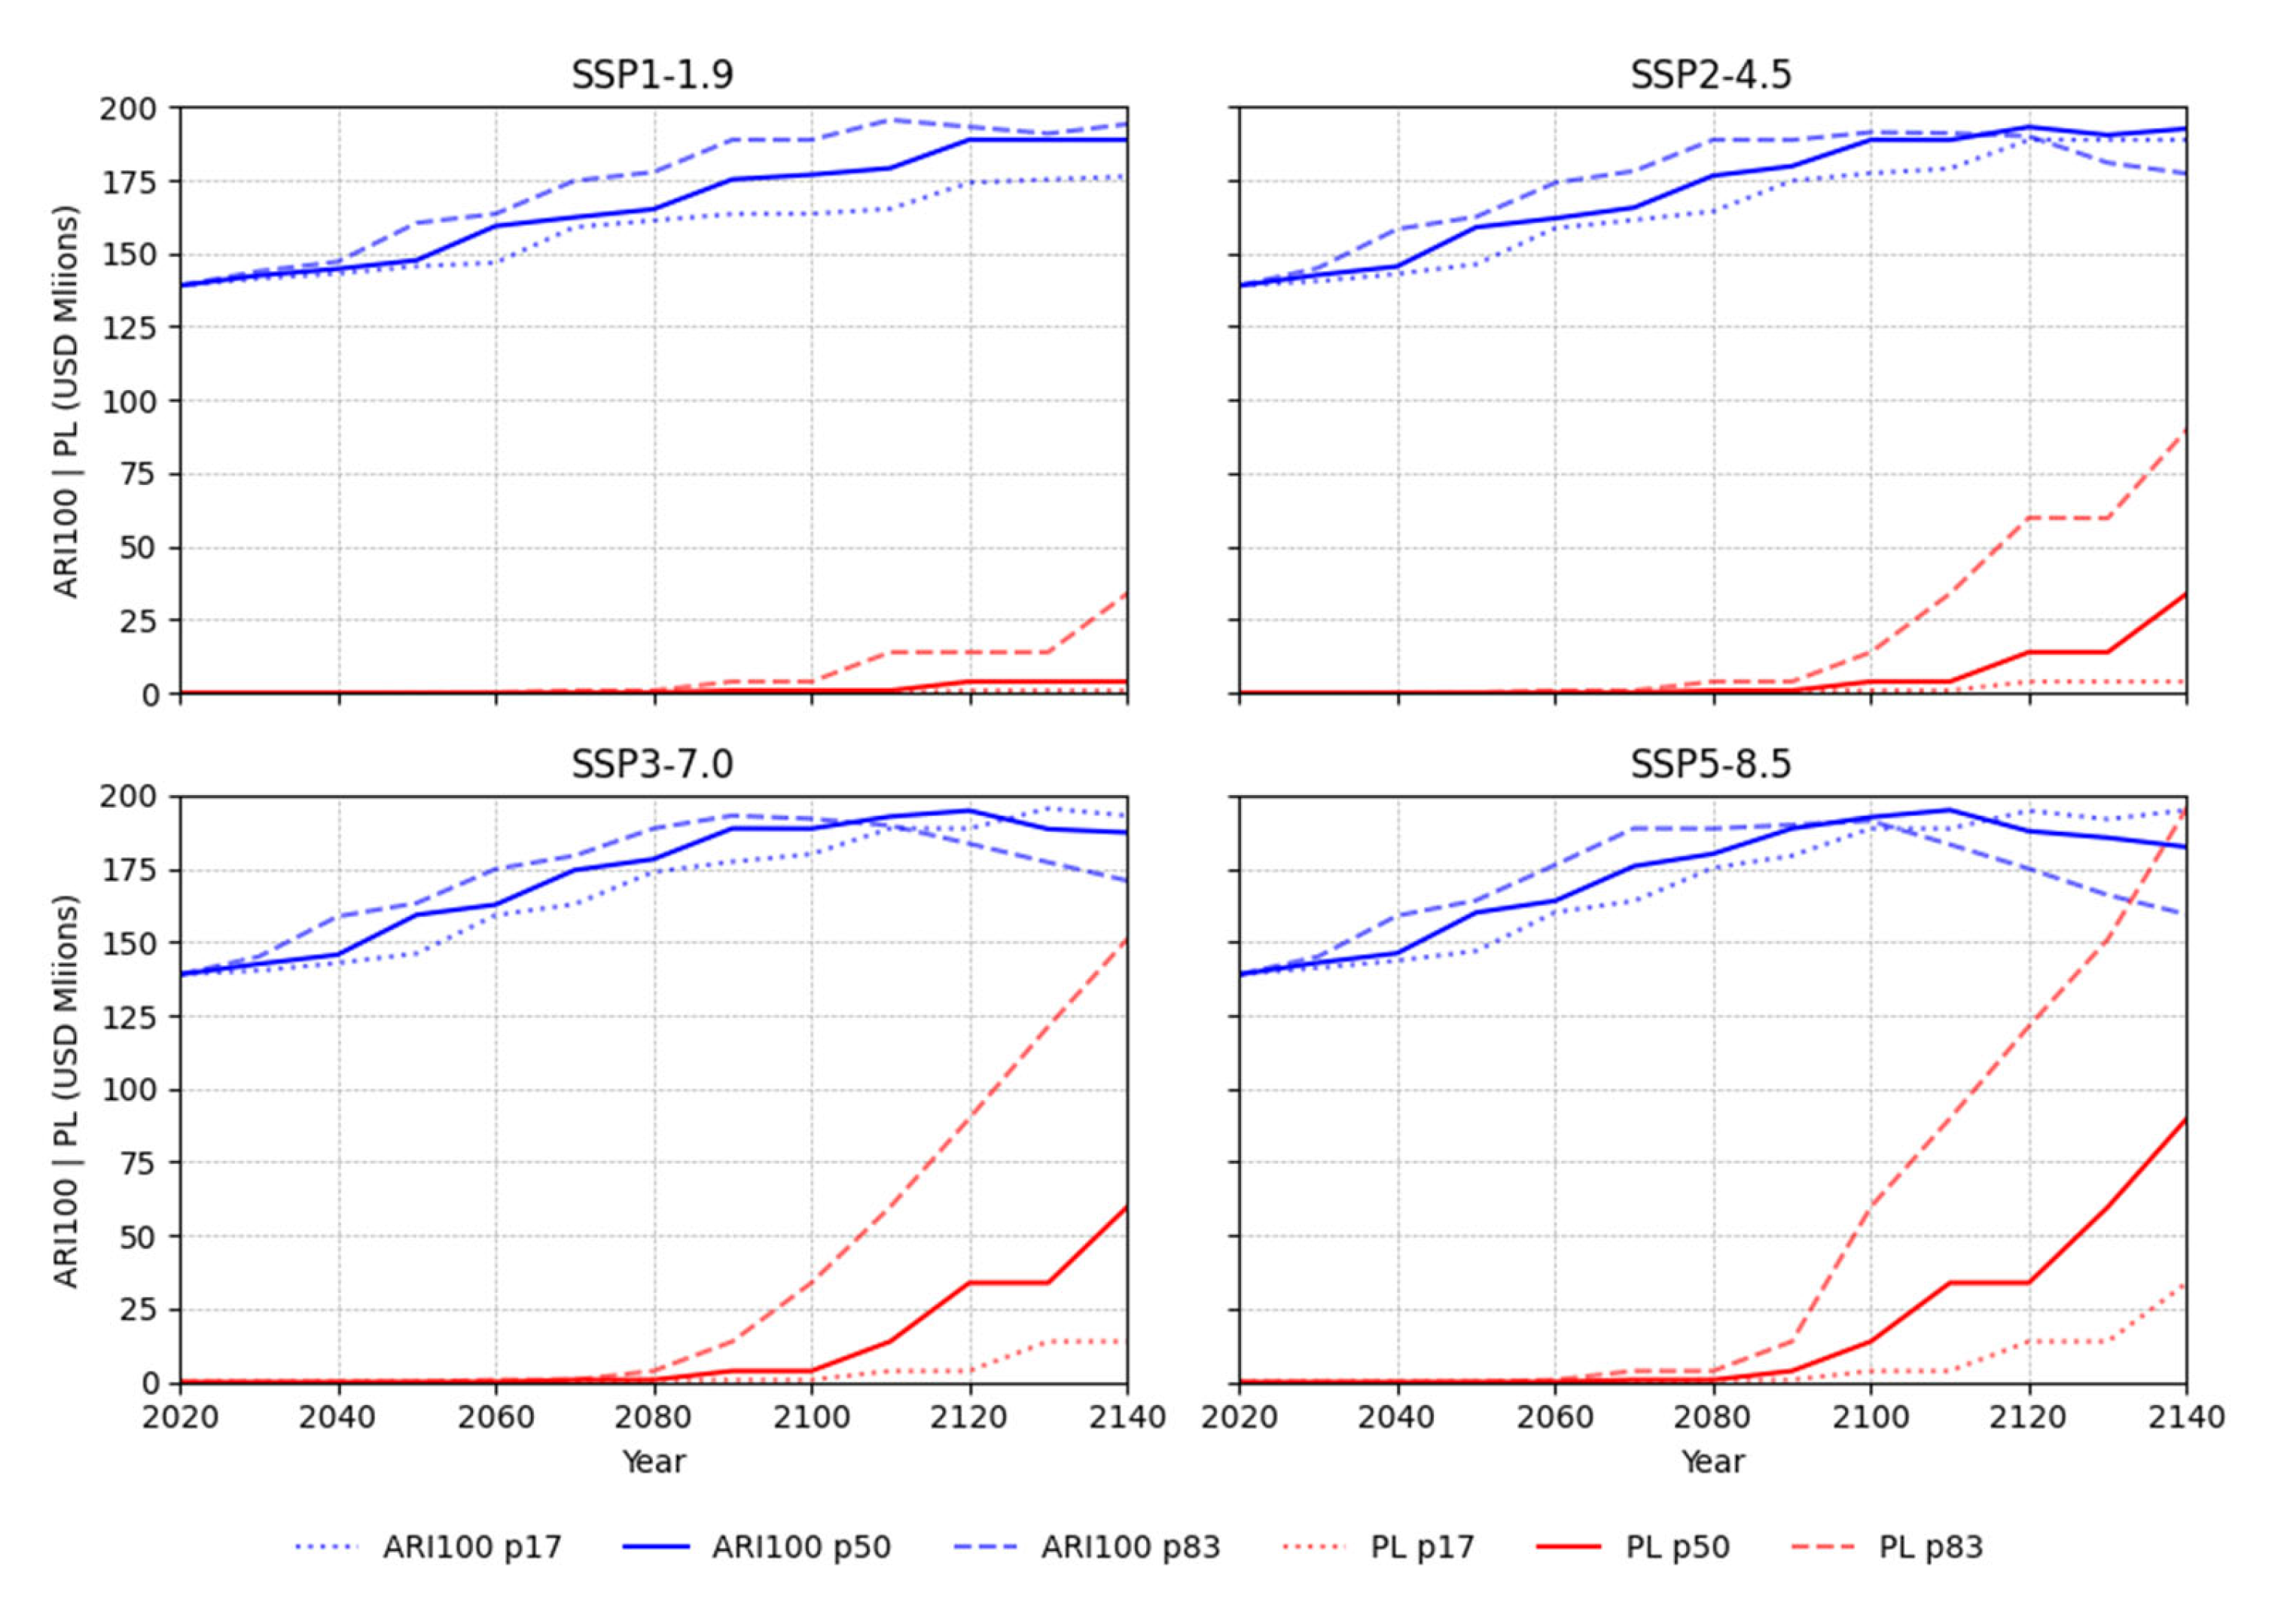
Samoa’s future risk to building economic loss from 100-year ARI coastal flooding (ARI100) and permanent inundation (PL) is reported here for Shared Socioeconomic Pathway (SSP) 1–1.9, 2–4.5, 3–7.0, and 5–8.5 (medium confidence) scenarios between 2020 and 2140 and graphically presented in Figure 4. Under SSP2-4.5, Samoa’s total potential risk to economic loss rises from USD 126.3 million in 2020 to USD 174.5 million in 2100, a 38% increase over 80 years. These losses occur 10 years earlier under the SSP5-8.5 projected RSL change. Economic losses from episodic coastal flooding begin to decrease after 2120 in response to loss from permanent inundation. Under SSP1-1.9 and SSP2-4.5, 100-year ARI losses from the 50th percentile RSL projections are relatively unchanged after 2120, while losses decrease under the 83rd percentile RSL projections. Downward trend 100-year ARI losses are signaled to occur between 2060 and 2090 under the 83rd percentile projected RSL change for the SSP3-7.0 and SSP5-8.5 scenarios. Accelerating PL after 2100 causes the 50th and 83rd percentile 100-year ARI losses between 2100 and 2140 to decrease by USD 11 million to USD 25 million.
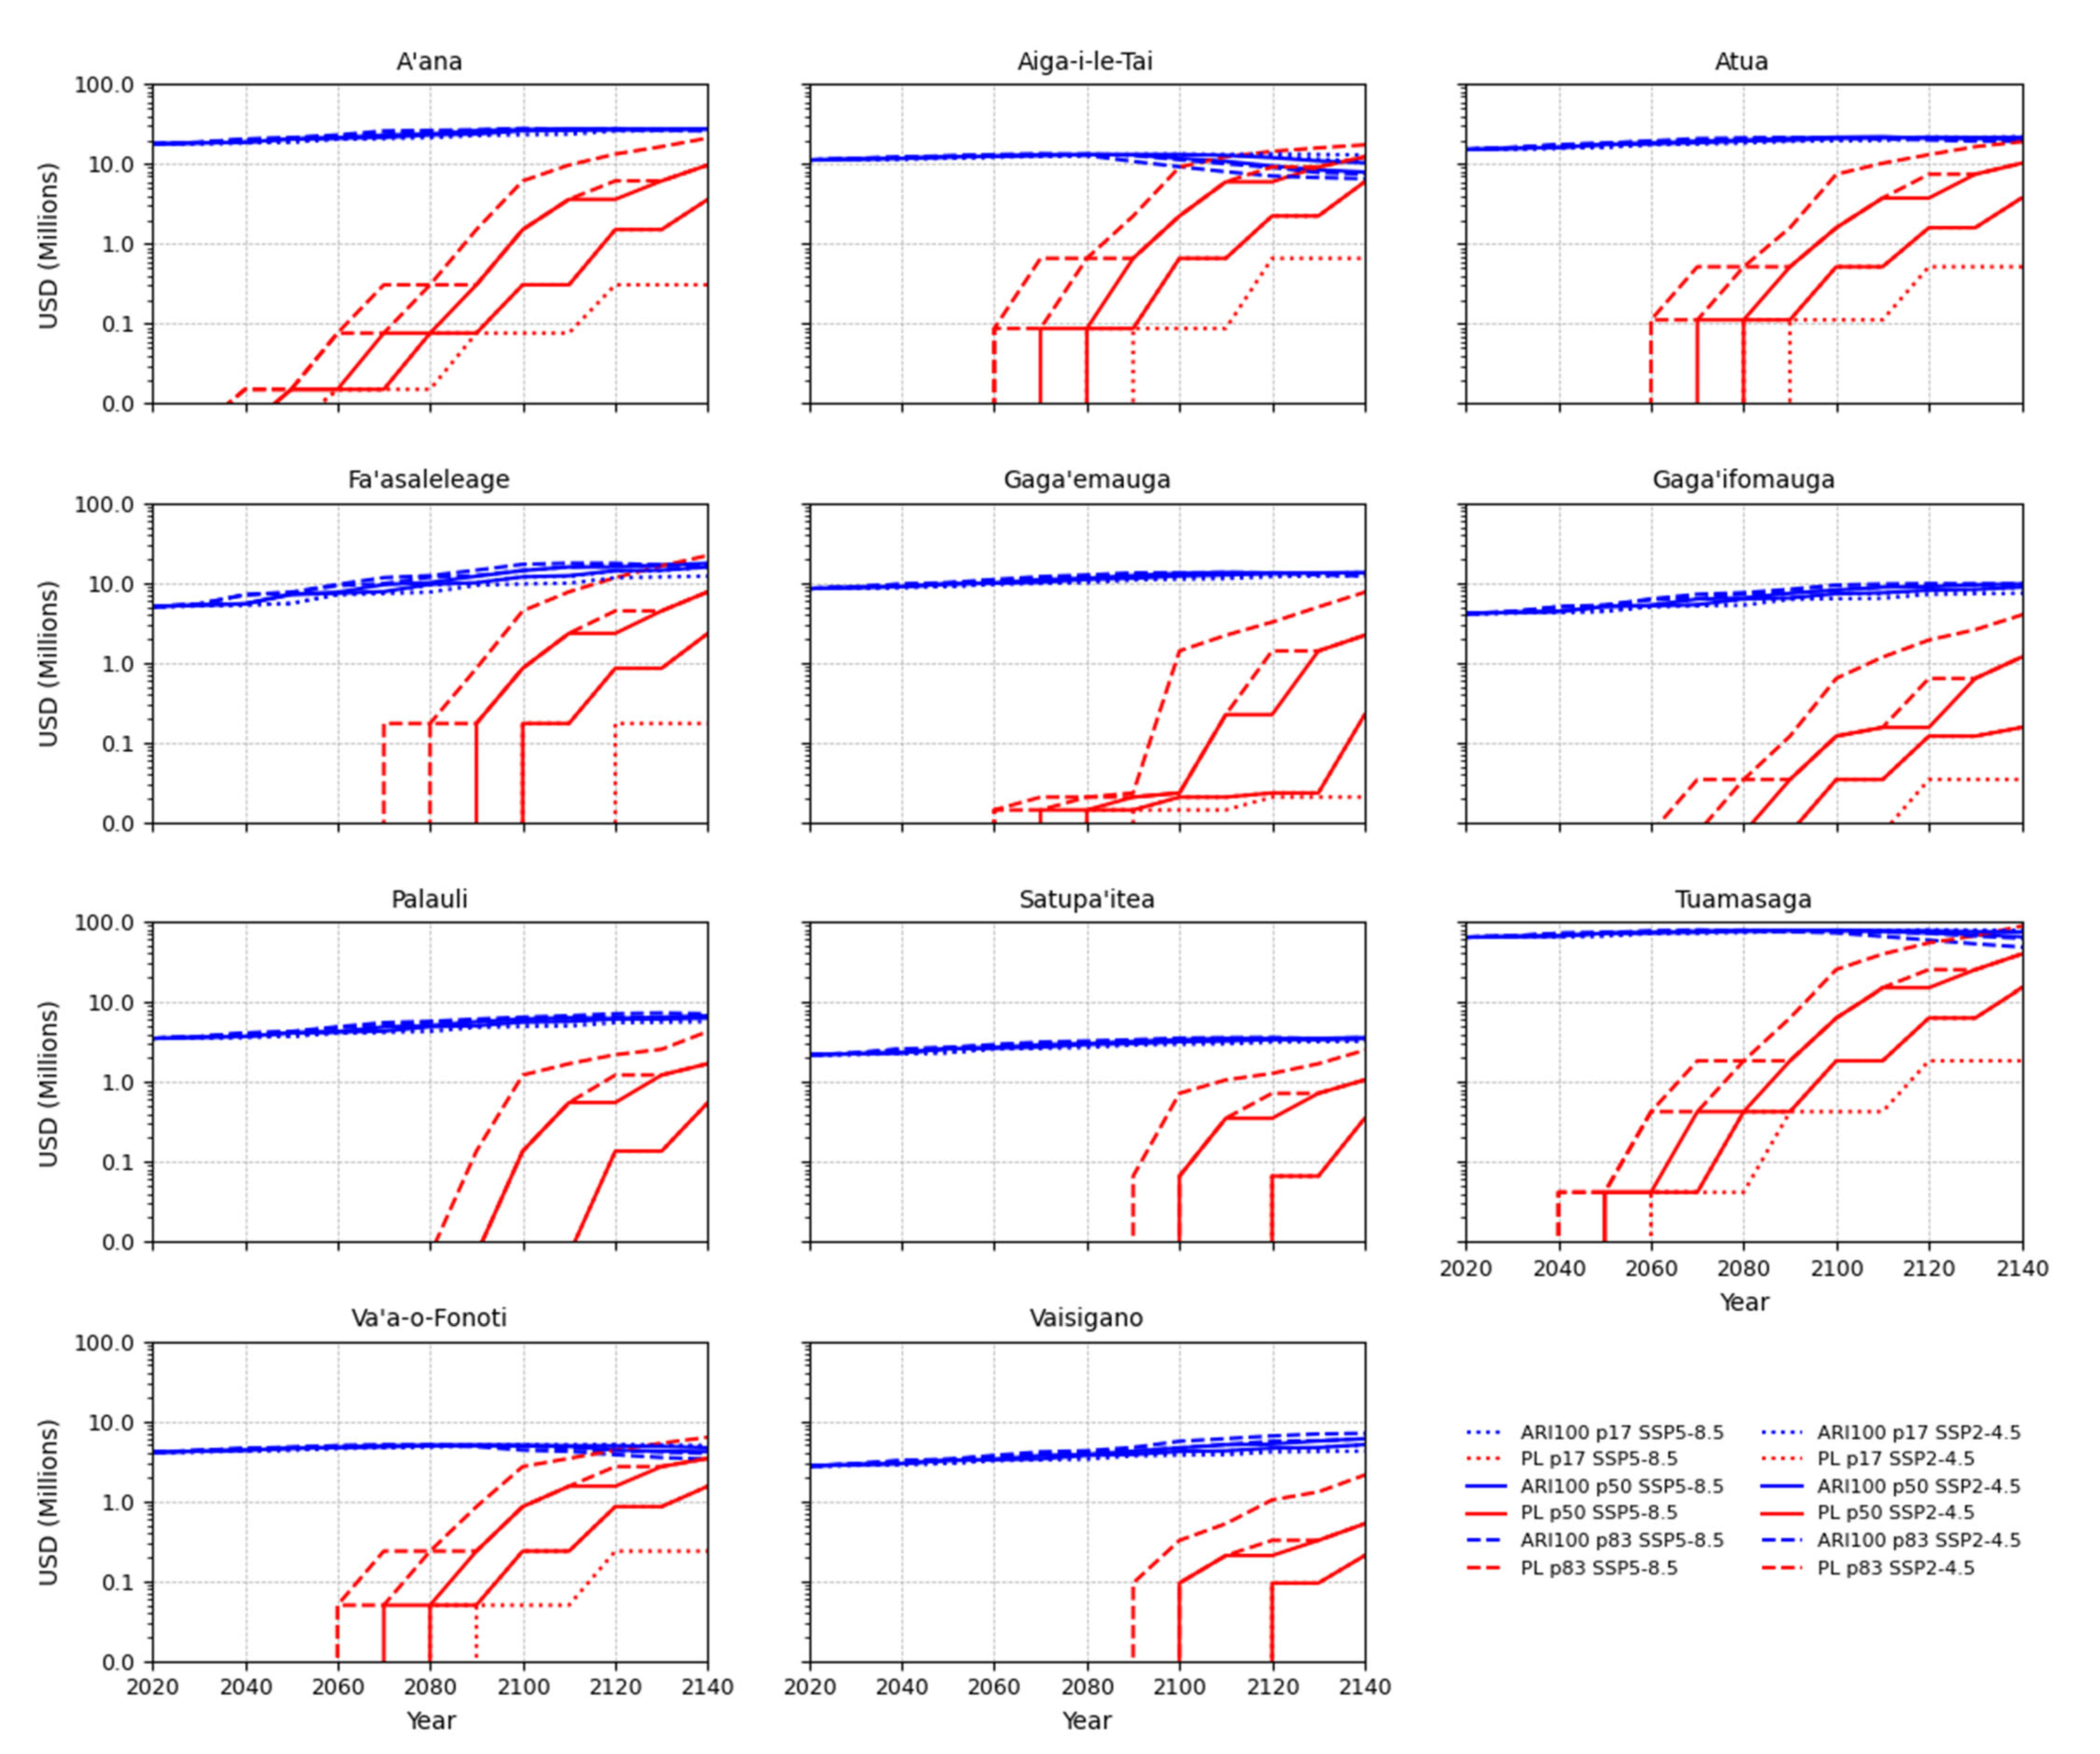
At the district level, Tuamasaga on Upolu, which includes the Apia urban area, accounts for 44% of Samoa’s total risk to ARI100 losses. Under SSP5-8.5 RSL projections, Tuamasaga’s ARI100 losses increase from USD 56 million in 2020 to USD 68 million in 2100, a 20% increase (Figure 5). Other districts including Fa’asaleleaga and Gaga’ifomauga observe proportionately higher loss increases this century. Under the SSP5-8.5 50th percentile RSL projections, Fa’asaleleaga losses could increase by 193% and Gaga’ifomauga by 80%. The accumulating PL reduces ARI100 losses after 2090 in several districts, including Aiga-i-le-Tai, Tuamasaga, and Va’a-o-Fonoti. Aiga-i-le-Tai observes the largest proportional loss decrease (41%) between 2090 and 2140 under the SSP5-8.5 50th percentile RSL projections, with the PL exceeding the 100-year ARI losses by 2130. At this time, the combined building ARI100 losses and PL in Aiga-i-le-Tai exceed 45% of the district’s total building replacement value.

3.2. Average Annual Losses from Coastal Flooding

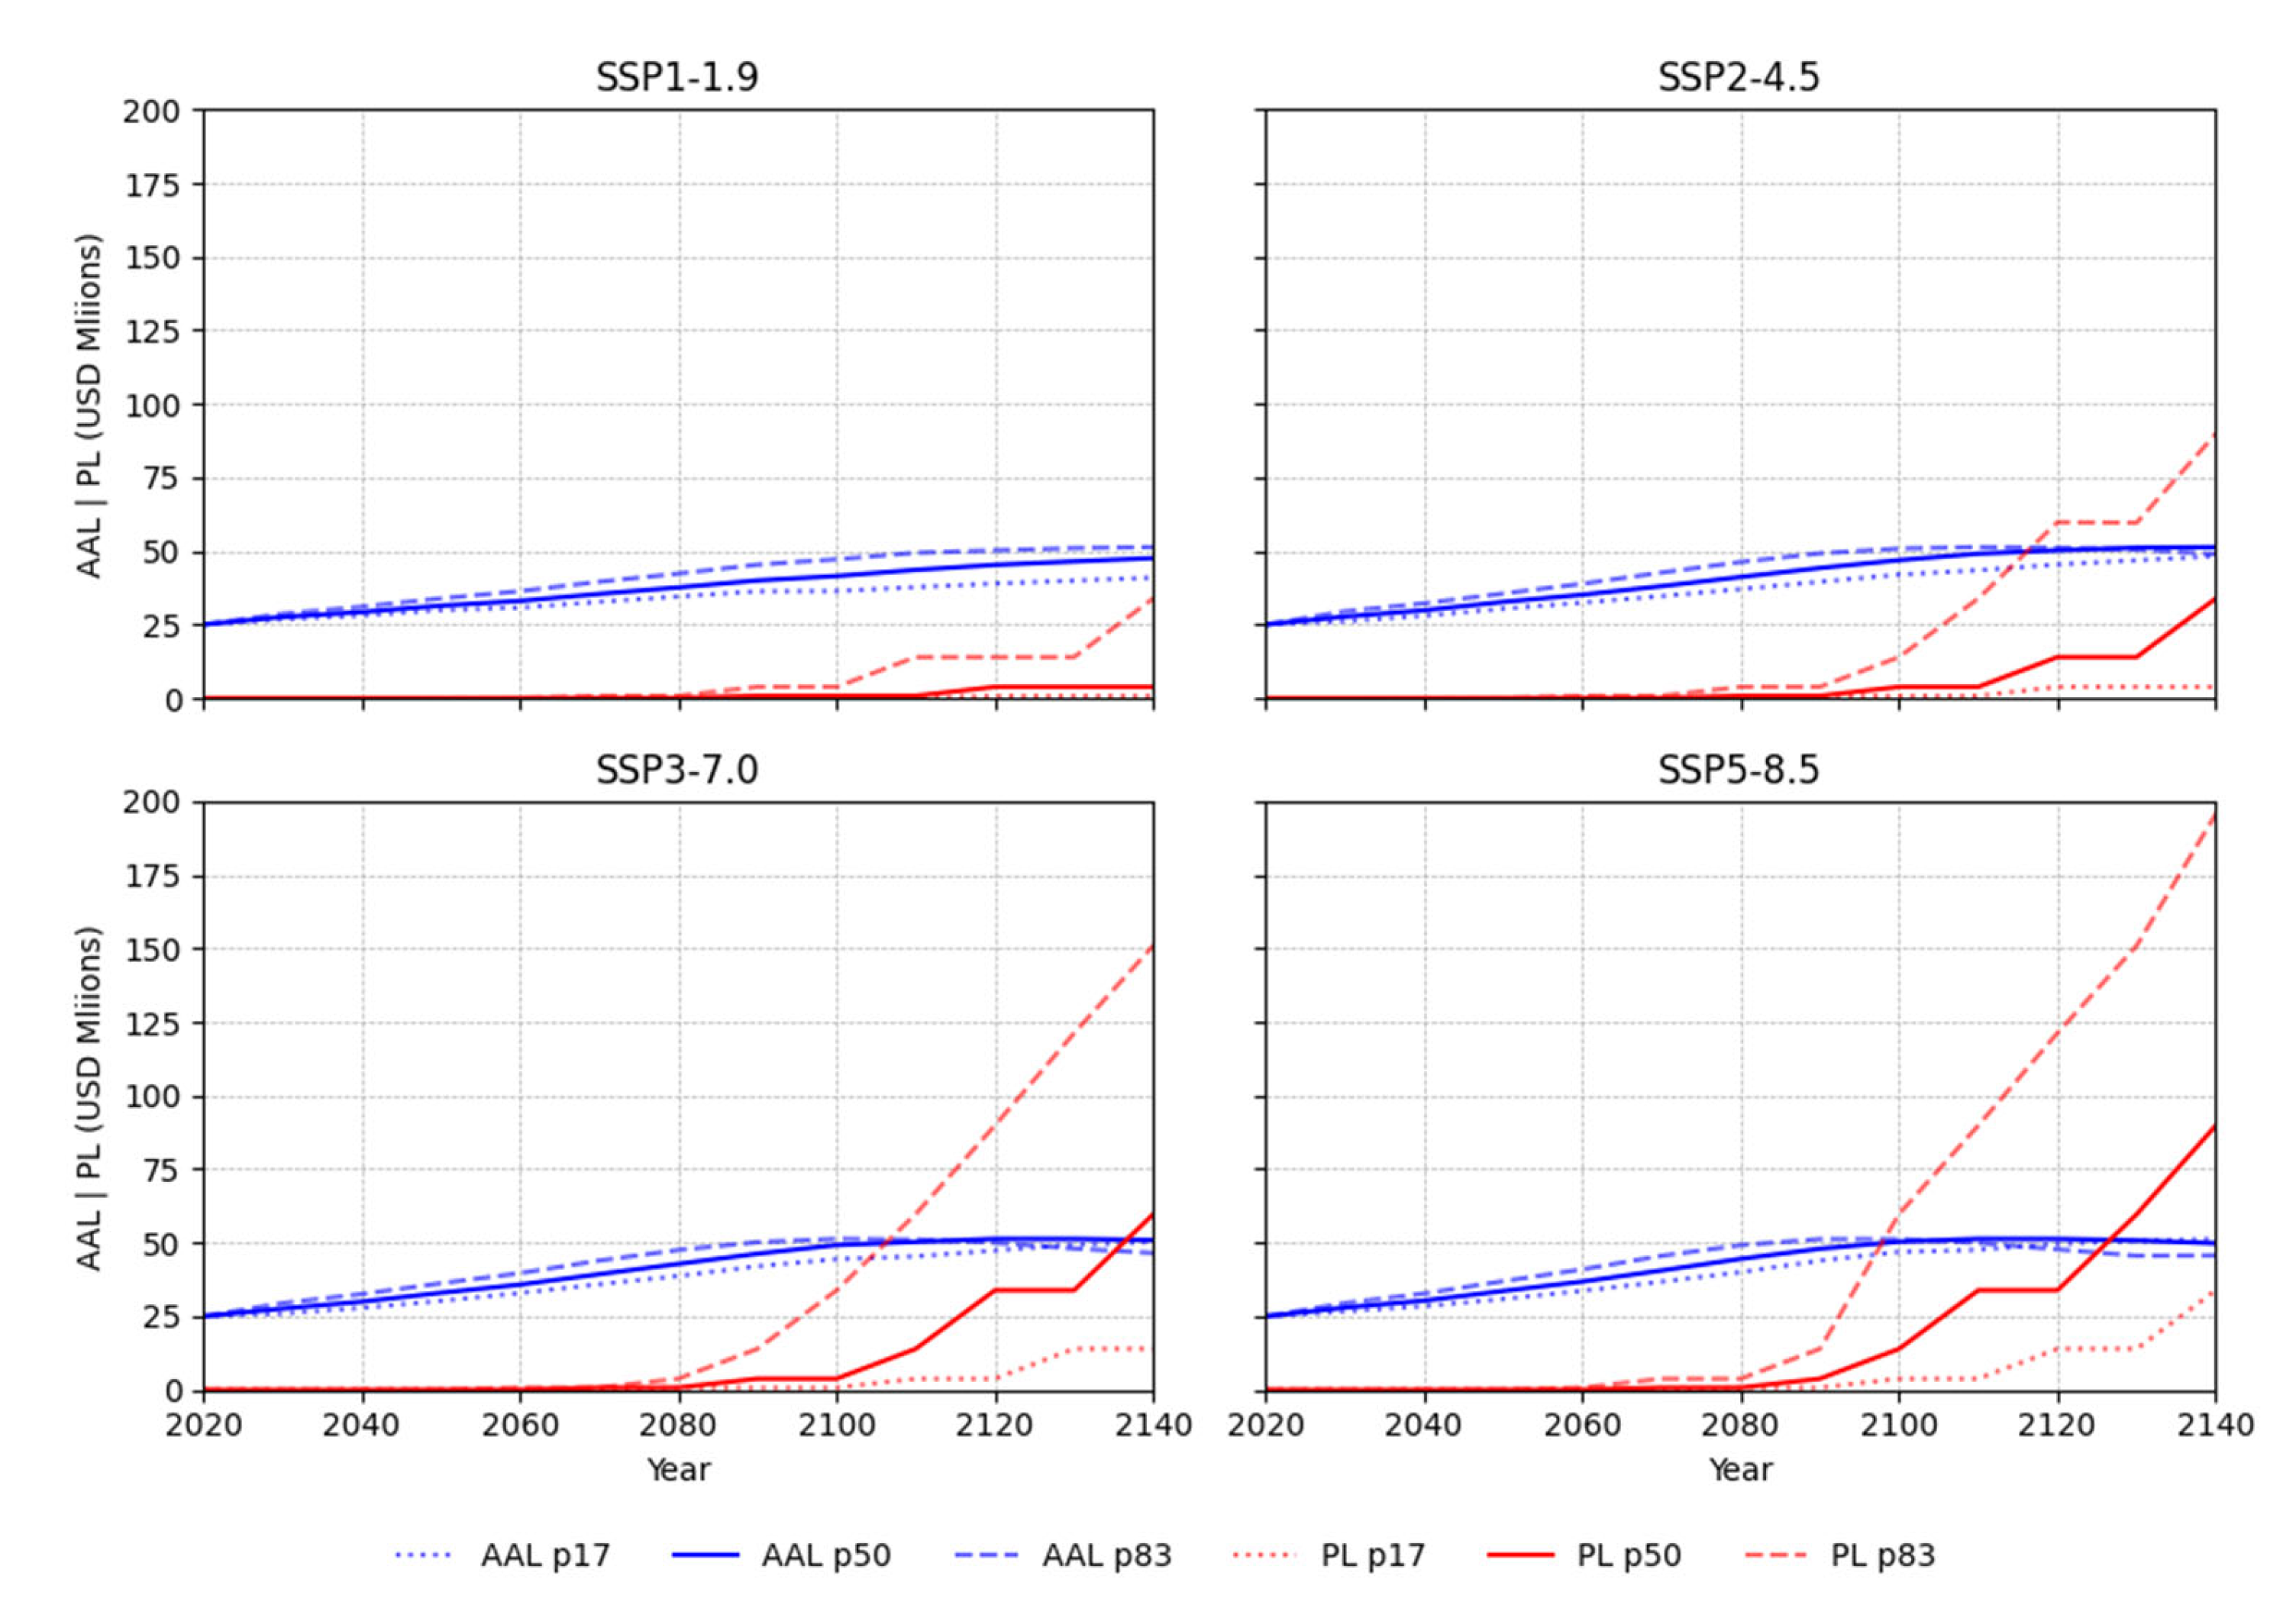
Extreme sea level driven coastal flooding by the end of this century could cause the average annual loss (AAL) in Samoa to almost double to between USD 47.7 million (42.5–51.1) and USD 50.8 million (47.7–51) for moderate (SSP2-4.5) to very high (SSP5-8.5) emissions scenarios (Figure 6). This represents 2.1% to 2.5% of the country’s 2020 building replacement value. At 2100, the 50th percentile AAL under SSP2-4.5 is expected to occur up to 15 years earlier under SSP5-8.5 emission scenarios. The rate of AAL increase for these emission scenarios decelerates toward the end of the century as the PL increases after 2080. The projected 83rd percentile PL exceeds the AAL between 2100 and 2120 for SSP2-4.5 or greater emissions scenarios, with the 50th percentile PL exceeding the 50th percentile AAL between 2120 and 2140 for the SSP3-7.0 and SSP5-8.5 scenarios. Under these high to very high emission scenarios, the 50th percentile PL increase after 2120 causes the 50th percentile AAL to reduce slightly by 2.3%, while the AAL under low-to-moderate emission scenarios increases by a similar proportion.
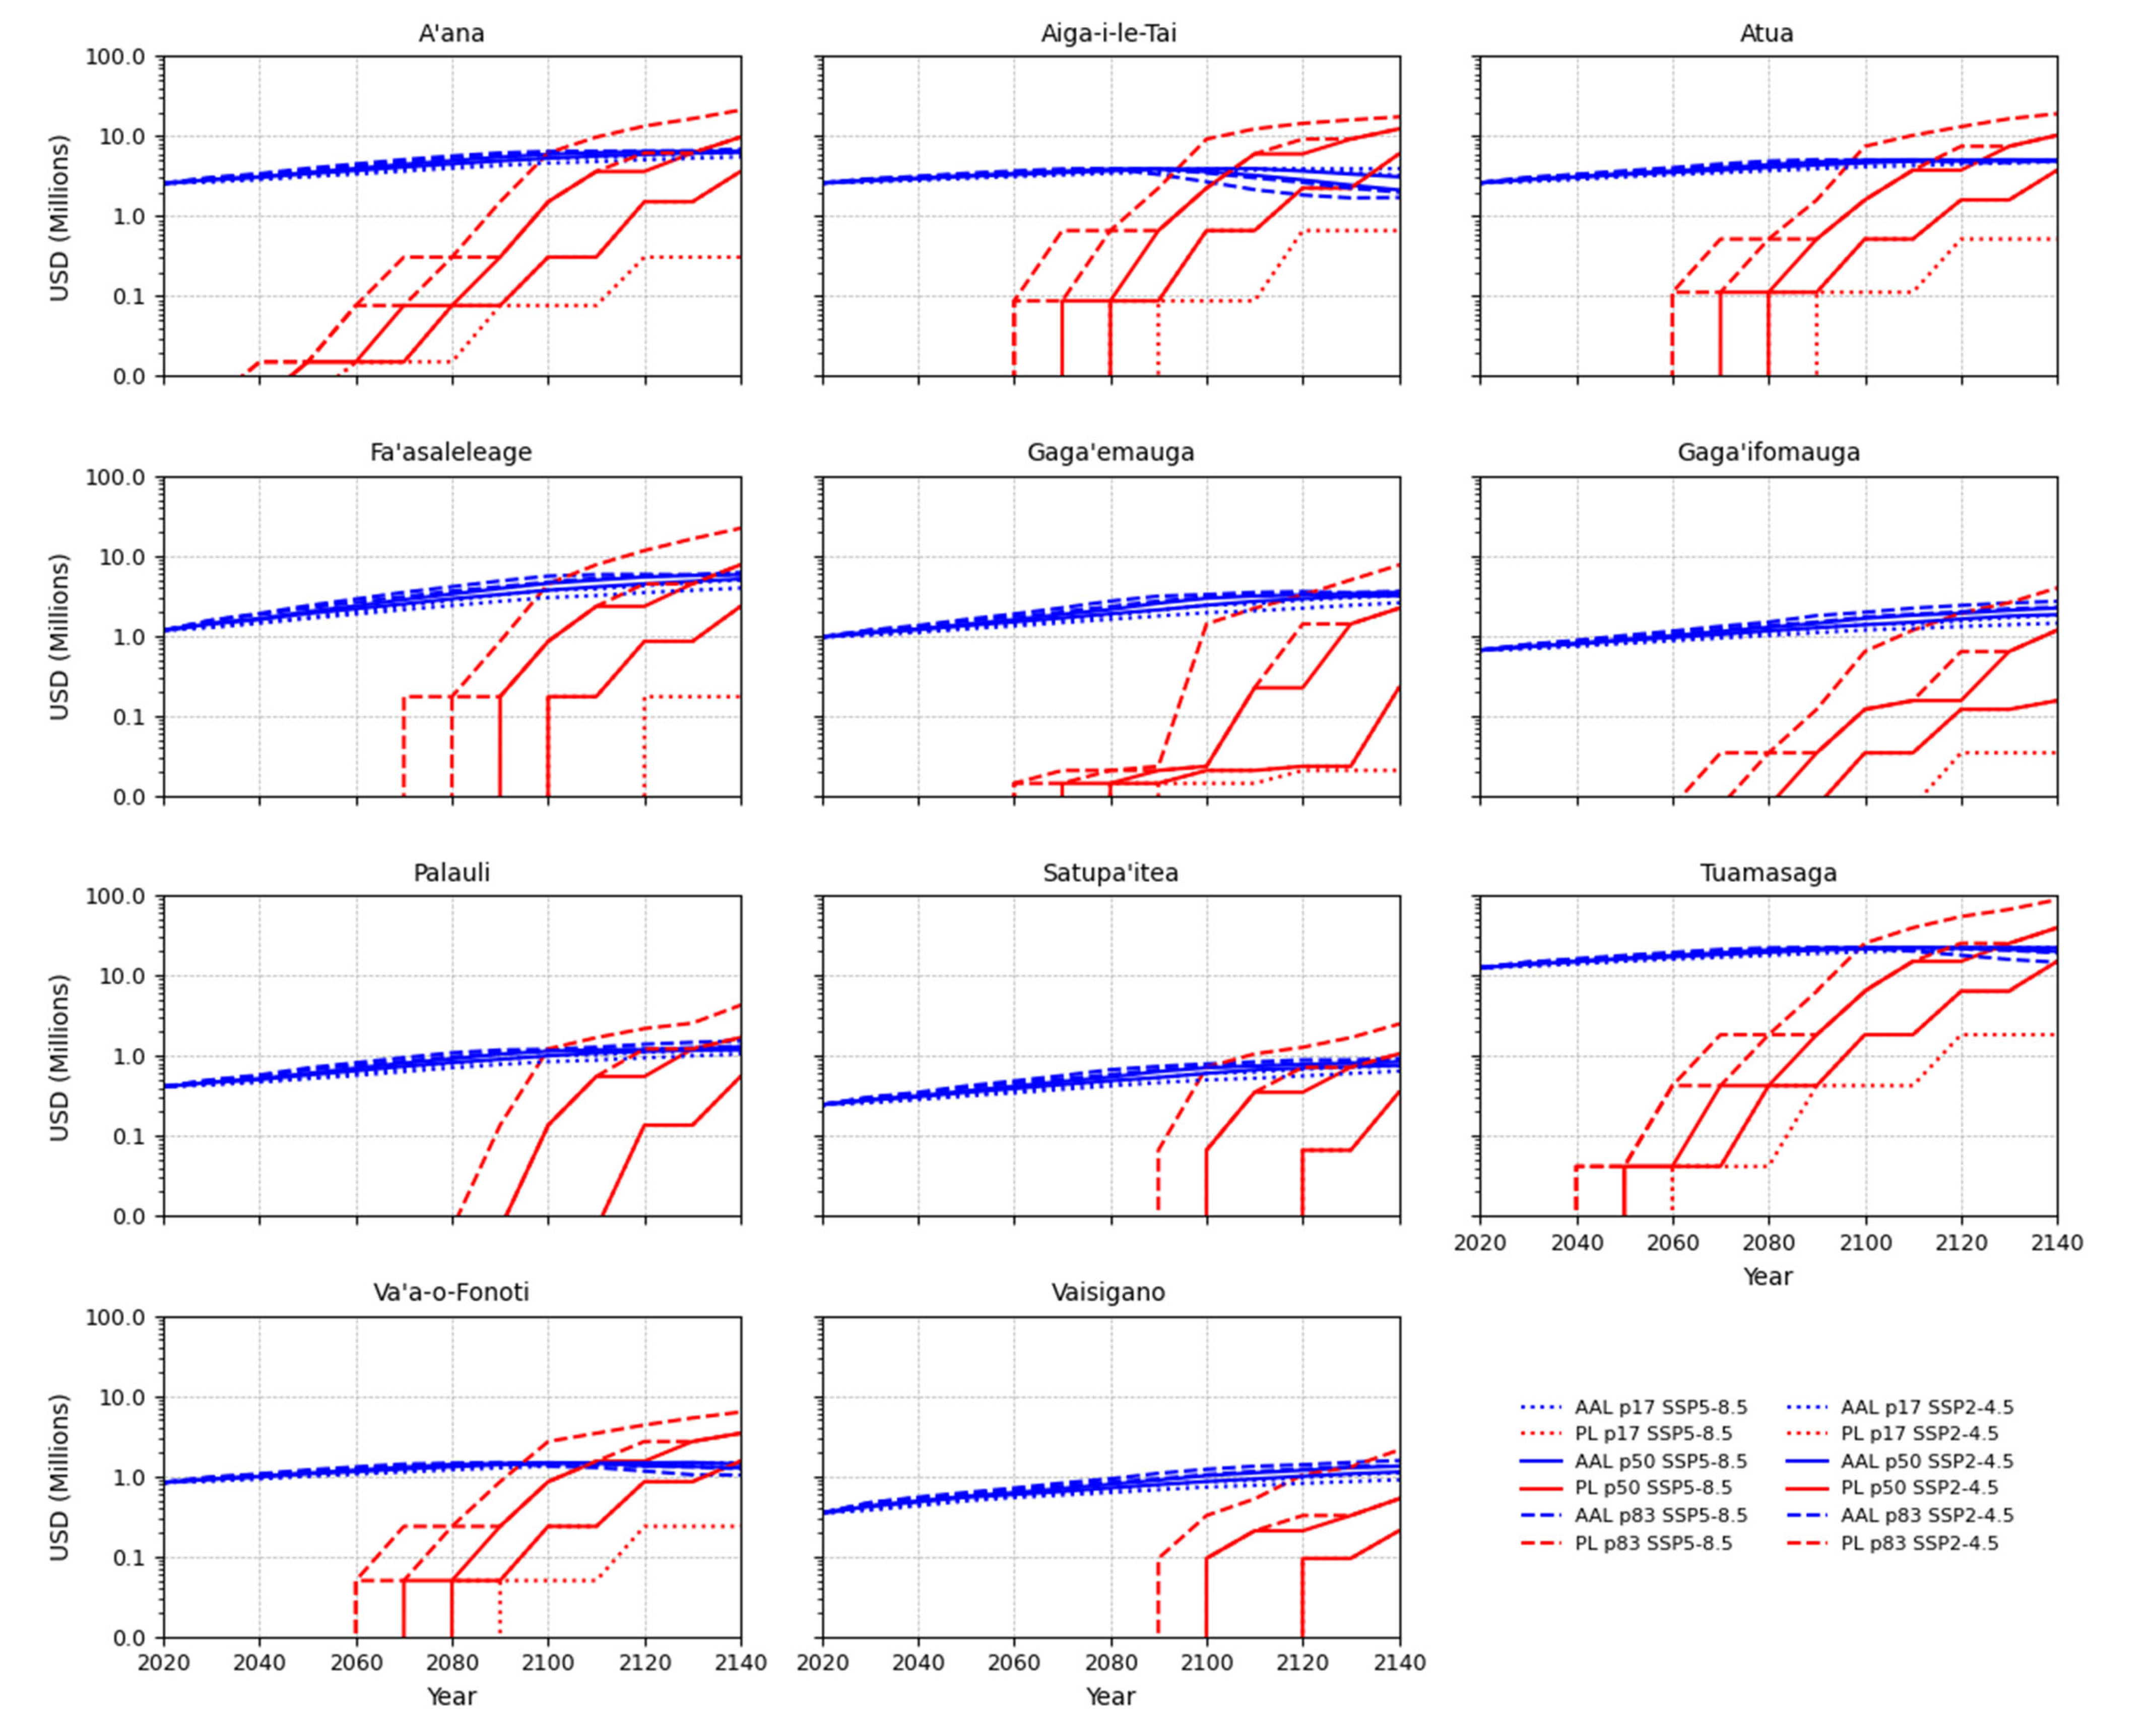
Projected AAL over the next century shows large variability between Samoa’s districts. Several districts, including Aiga-i-le-Tai, Tuamasaga, and Va’a-o-Fonoti, demonstrate decelerating AAL rates toward the end of the century, and the AAL begins to decline after 2100 as the PL accelerates (Figure 7). Similar to national trends, the AAL decline at the district level occurs after the 50th percentile PL exceeds the 50th percentile AAL. Delayed PL occurrence until after 2080 causes continual AAL increases beyond 2100 for the Fa’asaleleage, Gaga’ifomauga, and Vaisigano districts. Tuamasaga observes the highest projected AAL for all decades studied; however, the projected AAL change at 2100 equates to 2% of the district’s total 2020 building replacement value. Other districts, including Aiga-i-le-Tai and Va’a-o-Fonoti, have projected AALs at 2100 reaches 8% of the total district building replacement value. The future escalation of direct economic loss from both episodic flooding and permanent inundation in these districts could highlight an evolving spatial variability in direct economic losses across Samoa as sea levels continue to rise into the next century.
The object-level model approach presented in this study offered detailed insights on spatiotemporal building loss distribution across Samoa’s districts. This has revealed disproportionate spatial distributions in future losses, with several districts on the less populated island Savai’i expected to sustain annual losses of up to 8% of the total district building replacement value. Equitable flood risk management, however, requires a broader evaluation of tangible and intangible losses to identify interventions that optimize the social and economic aspirations of flood-exposed communities. Short-term model extensions could include other direct tangible losses to infrastructure and agriculture, with exposure data supported from volunteered geographic information (e.g., OpenStreetMap) in the absence of government databases and judgement-based vulnerability models formulated using expert elicitation techniques (e.g., [33]). Longer-term extensions could incorporate infrastructure dependency and network models to capture cascading service outages with associated indirect economic losses [34], along with agent-based models using household census data to evaluate changes to social and economic wellbeing in response to direct and indirect losses [35]. Such extensions would facilitate the evaluation of socioeconomic impacts that occur beyond directly affected flood inundation areas [36].

3.3. Study Limitations

Several key limitations in the present study should be acknowledged. The analysis considered only the present-day buildings and their economic value, which does not reflect potential development futures for Samoa and changes to building structures and values over the study period. As a result, loss projections may underestimate or misrepresent future exposure, since changes in building density, materials, and economic values driven by demographic shifts, economic development, and land use planning are not considered. Future modelling could address this limitation by incorporating building development storylines that are consistent with demographic and economic growth trends, as well as Shared Socioeconomic Pathway (SSP) scenarios, to evaluate the joint effects of changes in flood regimes and the built environment economic losses [37]. In addition, modelled ESL inundation afforded a first-order approximation of building exposure and risk under both present-day and projected sea level-rise scenarios.
Static-inclined inundation models estimate flood inundation and hazard intensities (i.e., water depth) based on simplified assumptions like uniform water levels projected onto a DEM, without simulating fluid dynamics [20]. When evaluating building risk in developed areas like Tuamasaga District, the model’s inability to simulate hydrodynamic interactions can oversimplify flood behavior in urban environments where structures, drainage systems, and coastal morphology influence local inundation patterns [38]. In contrast, dynamic inundation models use physics-based numerical methods to simulate water movement, including wave action, flow velocity, and interactions with terrain and structures. While the practical choice of a static-inclined inundation model approach did not incorporate fine-scale hydrodynamic processes (e.g., wave run-up), the modular risk model framework supports future iterative refinement. This allows for progressive updates at a local scale, whereby the integration of inundation maps derived from high-resolution numerical models (e.g., [22]) that simulate local hydrodynamic processes can be applied, as they become available, for high-risk (e.g., Tuamasaga District) or priority locations for future adaptation interventions planning. Finally, validation of the results presented could not be achieved in the current study due to unavailable observed or modelled hazard and economic loss data from historic ESL-driven flooding events. Accurate and reliable model application in local scale risk analyses rely on future potential work programs aimed at capturing empirical data on flood inundation hazard and damage processes after future extreme sea level events.

4. Conclusions

This nationwide study for Samoa estimated direct building economic loss from extreme sea level (ESL)-driven episodic flooding and permanent inundation from relative sea level (RSL) rise. Building-level economic losses were calculated using a spatiotemporal risk model framework and then evaluated at the national and district levels. Time-independent economic losses were calculated for 5-, 10-, 25-, 50-, 100-, and 250-year annual recurrence interval (ARI) ESLs and twenty-one RSL rise scenarios. The future timing and magnitude of losses between 2020 and 2140 in response to global mean sea level-rise (GMSLR) were calculated for medium-confidence Shared Socioeconomic Pathway (SSP) emission scenarios SSP1-1.9, SSP2-4.5, SSP3-7.0, and SSP5-8.5.
Our findings follow global trends where the risk of economic losses from episodic flooding continues to escalate this century. By the end of this century, national risk of economic loss from 100-year ARI ESL events could reach USD 174.5 million under the moderate-emission scenario SSP2-4.5. Under high- and very high-emission scenarios, losses of this magnitude could occur 10 years earlier. Average annual loss (AAL) in 2020 doubles to USD 50 million by 2100 under these scenarios. In the next century, AAL decreases as accumulating permanent inundation loss acts to reduce losses from episodic flooding.
At the district level, spatial variability in direct building economic loss were observed as RSL rises into the next century. Tuamasaga on Upolu Island accounted for 44% of Samoa’s total 100-year annual recurrence interval losses, and the AAL for Aiga-i-le-Tai and Va’a-o-Fonoti over this century reaches 8% of total district building replacement values. While this present study was limited to buildings, the modular spatiotemporal risk model framework is extendable to evaluate a broader range of tangible and intangible losses that could be reduced by interventions that meet the present and future social and economic aspirations of flood exposed communities.
Future improvements to the spatiotemporal flood risk model should address key limitations identified in this study. Loss estimates were based on present-day buildings and their economic values, which do not account for future development, demographic shifts, or changes in land use. Incorporating building development storylines aligned with Shared Socioeconomic Pathway (SSP) scenarios would enable more representative projections of future building flood exposure. Additionally, the use of static-inclined inundation models limited the ability to simulate complex hydrodynamic processes in more densely developed areas like Tuamasaga District. Integrating high-resolution dynamic inundation models and empirical flood damage data from future ESL events will enhance model accuracy and support more reliable local-scale flood risk assessments.

Author Contributions

All authors contributed equally to the study conceptualization, methodology, and investigation. Funding acquisition, J.U., S.W., H.D. and J.C.-T.; software and data curation, A.E., R.P. (Rose Pearson), R.P. (Ryan Paulik), C.B., A.E., M.W., K.P., S.V., J.G., J.B. and L.H.; writing—original draft preparation, R.P. (Ryan Paulik); writing—review and editing, R.P. (Ryan Paulik) and S.W. All authors have read and agreed to the published version of the manuscript.

Funding

This research was enabled through the Pacific Risk Tools for Resilience—Phase 2 project (PARTneR-2), funded by the New Zealand Ministry of Foreign Affairs and Trade (Activity No: ACT-0101226) (all authors). Science co-financing support was also provided through the New Zealand Ministry of Business, Innovation and Employment—Strategic Science Investment Fund Project No: CARH2505, FPCH2604 and PRAS2501—Earth Science New Zealand (R. Pearson; R. Paulik; C.B.; L.H.; J.B.; S.W. and J.U.).

Data Availability Statement

Results from this study are available upon reasonable request. Relative sea level projections for Samoa are available for download at https://sealevel.nasa.gov/ipcc-ar6-sea-level-projection-tool?psmsl_id=1840&data_layer=scenario (accessed on 25 March 2025).

Acknowledgments

The authors gratefully acknowledge the staff from various government agencies in Samoa who helped to guide the development of the methodology and results presented in this paper through participation in the PARTneR-2 project.

Conflicts of Interest

The authors declare no conflicts of interest.

References

  1. Nurse, L.A.; McLean, R.F.; Agard, J.; Briguglio, L.P.; Duvat-Magnan, V.; Pelesikoti, N.; Tompkins, E.; Webb, A. Small islands. In Climate Change 2014: Impacts, Adaptation, and Vulnerability. Part B: Regional Aspects. Contribution of Working Group II to the Fifth Assessment Report of the Intergovernmental Panel on Climate Change; Cambridge University Press: Cambridge, UK, 2014; p. 1613. [Google Scholar]
  2. Betzold, C. Adapting to climate change in small island developing states. Clim. Change 2015, 133, 481–489. [Google Scholar] [CrossRef]
  3. Scott, G. Climate Change and Displacement in the Pacific: An Overview; UNHCR: Geneva, Switzerland, 2019. [Google Scholar]
  4. Vitousek, S.; Barnard, P.L.; Fletcher, C.H.; Frazer, N.; Erikson, L.; Storlazzi, C.D. Doubling of coastal flooding fre-quency within decades due to sea-level rise. Sci. Rep. 2017, 7, 1399. [Google Scholar] [CrossRef]
  5. Hauer, M.E.; Fussell, E.; Mueller, V.; Burkett, M.; Call, M.; Abel, K.; McLeman, R.; Wrathall, D. Sea-level rise and human migration. Nat. Rev. Earth Environ. 2020, 1, 28–39. [Google Scholar] [CrossRef]
  6. Levy, R.; Naish, T.; Lowry, D.; Priestley, R.; Winefield, R.; Alevropolous-Borrill, A.; Beck, E.; Bell, R.; Blick, G.; Dadic, R.; et al. Melting ice and rising seas–connecting projected change in Antarctica’s ice sheets to communities in Aotearoa New Zealand. J. R. Soc. N. Z. 2024, 54, 449–472. [Google Scholar] [CrossRef] [PubMed]
  7. Breili, K.; Simpson, M.J.R.; Klokkervold, E.; Roaldsdotter Ravndal, O. High-accuracy coastal flood mapping for Norway using lidar data. Nat. Hazards Earth Syst. Sci. 2020, 20, 673–694. [Google Scholar] [CrossRef]
  8. Paulik, R.; Stephens, S.A.; Bell, R.G.; Wadhwa, S.; Popovich, B. National-scale built-environment exposure to 100-year extreme sea levels and sea-level rise. Sustainability 2020, 12, 1513. [Google Scholar] [CrossRef]
  9. Bates, P.D.; Quinn, N.; Sampson, C.; Smith, A.; Wing, O.; Sosa, J.; Savage, J.; Olcese, G.; Neal, J.; Schumann, G.; et al. Combined modeling of US fluvial, pluvial, and coastal flood hazard under current and future climates. Water Resour. Res. 2021, 57, e2020WR028673. [Google Scholar] [CrossRef]
  10. Wandres, M.; Espejo, A.; Sovea, T.; Tetoa, S.; Malologa, F.; Webb, A.; Lewis, J.; Lee, G.; Damlamian, H. A national-scale coastal flood hazard assessment for the atoll nation of Tuvalu. Earth’s Future 2024, 12, e2023EF003924. [Google Scholar] [CrossRef]
  11. Lin, S.L.; Ungaro, J.; Nimau, J.T.; Singh, S.; Raqisia, K. Development of pacific exposure dataset for use in catastrophe risk assessment. Nat. Hazards 2020, 104, 2645–2661. [Google Scholar] [CrossRef]
  12. Paulik, R.; Horspool, N.; Woods, R.; Griffiths, N.; Beale, T.; Magill, C.; Wild, A.; Popovich, B.; Walbran, G.; Garlick, R. RiskScape: A flexible multi-hazard risk modelling engine. Nat. Hazards 2023, 119, 1073–1090. [Google Scholar] [CrossRef]
  13. Merrifield, M.A.; Becker, J.M.; Ford, M.; Yao, Y. Observations and estimates of wave-driven water level extremes at the Marshall Islands. Geophys. Res. Lett. 2014, 41, 7245–7253. [Google Scholar] [CrossRef]
  14. Hersbach, H.; Bell, B.; Berrisford, P.; Hirahara, S.; Horányi, A.; Muñoz-Sabater, J.; Nicolas, J.; Peubey, C.; Radu, R.; Schepers, D.; et al. The ERA5 global reanalysis. Q. J. R. Meteorol. Soc. 2020, 146, 1999–2049. [Google Scholar] [CrossRef]
  15. Zuo, H.; Balmaseda, M.A.; Tietsche, S.; Mogensen, K.; Mayer, M. The ECMWF operational ensemble reanalysis–analysis system for ocean and sea ice: A description of the system and assessment. Ocean Sci. 2019, 15, 779–808. [Google Scholar] [CrossRef]
  16. Egbert, G.D.; Erofeeva, S.Y. Efficient inverse modeling of barotropic ocean tides. J. Atmos. Ocean. Technol. 2002, 19, 183–204. [Google Scholar] [CrossRef]
  17. Joyce, B.R.; Gonzalez-Lopez, J.; Van der Westhuysen, A.J.; Yang, D.; Pringle, W.J.; Westerink, J.J.; Cox, A.T. U.S. IOOS coastal and ocean modeling testbed: Hurricane-induced winds, waves, and surge for deep ocean, reef-fringed islands in the Caribbean. J. Geophys. Res. Ocean. 2019, 124, 2876–2907. [Google Scholar] [CrossRef]
  18. Tu’uholoaki, M.; Espejo, A.; Wandres, M.; Singh, A.; Damlamian, H.; Begg, Z. Quantifying mechanisms responsible for extreme coastal water levels and flooding during severe tropical cyclone Harold in Tonga, southwest Pacific. J. Mar. Sci. Eng. 2023, 11, 1217. [Google Scholar] [CrossRef]
  19. Espejo, A.; Wandres, M.; Damlamian, H.; Divesh, A.; Giblin, J.; Aucan, J.; Eria, M.; Toorua, U. Efficient coastal inundation early-warning system for low-lying atolls, dealing with lagoon and ocean side inundation in Tarawa, Kiribati. Weather Clim. Extrem. 2023, 42, 100615. [Google Scholar] [CrossRef]
  20. Stephens, S.A.; Paulik, R.; Reeve, G.; Wadhwa, S.; Popovich, B.; Shand, T.; Haughey, R. Future changes in built environment risk to coastal flooding, permanent inundation and coastal erosion hazards. J. Mar. Sci. Eng. 2021, 9, 1011. [Google Scholar] [CrossRef]
  21. FUGRO. Report of Survey: Airborne Lidar Bathymetric and Topographic Survey of Samoa 2015; Contract: ECRCR-LIB 2.1, Fugro LADS Document Reference No: TLCS00.047.008, Issue No: 1.00; Fugro LADS Corporation Pty Ltd.: Kidman Park, Australia, 2016. [Google Scholar]
  22. Bosserelle, C.; Williams, S.; Cheung, K.F.; Lay, T.; Yamazaki, Y.; Simi, T.; Roeber, V.; Lane, E.; Paulik, R.; Simanu, L. Effects of source faulting and fringing reefs on the 2009 South Pacific Tsunami inundation in southeast Upolu, Samoa. J. Geophys. Res. Ocean. 2020, 125, e2020JC016537. [Google Scholar] [CrossRef]
  23. Fox-Kemper, B. Ocean, cryosphere and sea level change. In Climate Change 2021: The Physical Science Basis. Contribution of Working Group I to the Sixth Assessment Report of the Intergovernmental Panel on Climate Change; Cambridge University Press: Cambridge, UK, 2021; pp. 1211–1362. [Google Scholar]
  24. Paulik, R.; Wild, A.; Stephens, S.; Welsh, R.; Wadhwa, S. National assessment of extreme sea-level driven inundation under rising sea levels. Front. Environ. Sci. 2023, 10, 1045743. [Google Scholar] [CrossRef]
  25. Pacific Regional Infrastructure Facility (PRIF). Methodology for Condition Assessment of Public Sector Infrastructure Assets in Pacific Island Countries. 2021. Available online: https://www.theprif.org/document/regional/infrastructure-maintenance/methodology-for-condition-assessment-public-sector (accessed on 12 May 2025).
  26. Williams, S.; Paulik, R.; Weaving, R.; Bosserelle, C.; Chan Ting, J.; Wall, K.; Simi, T.; Scheele, F. Multiscale quantification of tsunami hazard exposure in a pacific small island developing state: The case of Samoa. GeoHazards 2021, 2, 63–79. [Google Scholar] [CrossRef]
  27. Paulik, R.; Williams, S.; Simi, T.; Bosserelle, C.; Ting, J.C.; Simanu, L. Evaluating building exposure and economic loss changes after the 2009 South Pacific Tsunami. Int. J. Disaster Risk Reduct. 2021, 56, 102131. [Google Scholar] [CrossRef]
  28. Sischka, L.; Bosserelle, C.; Williams, S.; Ting, J.C.; Paulik, R.; Whitworth, M.; Talia, L.; Viskovic, P. Reconstructing the 26 June 1917 Samoa tsunami disaster. Appl. Sci. 2022, 12, 3389. [Google Scholar] [CrossRef]
  29. Welsh, R.; Williams, S.; Bosserelle, C.; Paulik, R.; Chan Ting, J.; Wild, A.; Talia, L. Sea-level rise effects on changing hazard exposure to far-field tsunamis in a volcanic Pacific island. J. Mar. Sci. Eng. 2023, 11, 945. [Google Scholar] [CrossRef]
  30. Pacific Risk Information System. ‘Data: Layers.’ Suva, Fiji. Pacific Community (SPC). 2023. Available online: https://geonode.pacificdata.org (accessed on 25 November 2023).
  31. Chen, T.; Guestrin, C. August. Xgboost: A scalable tree boosting system. In Proceedings of the 22nd ACM SIGKDD International Conference on Knowledge Discovery and Data Mining, San Francisco, CA, USA, 13–17 August 2016; pp. 785–794. [Google Scholar]
  32. Paulik, R.; Chang-Ting, J.; Williams, S. Flood damage evaluation for buildings in a small island developing state. Water Resour. Res. 2025, 61, e2025WR040141. [Google Scholar] [CrossRef]
  33. Nirandjan, S.; Koks, E.E.; Ye, M.; Pant, R.; Van Ginkel, K.C.; Aerts, J.C.; Ward, P.J. Physical vulnerability database for critical infrastructure hazard risk assessments-a systematic review and data collection. Nat. Hazards Earth Syst. Sci. 2024, 24, 4341–4368. [Google Scholar] [CrossRef]
  34. Lan, C.; Wild, A.; Paulik, R.; Wotherspoon, L.; Zorn, C. Assessing indirect impacts of extreme sea level flooding on critical infrastructure. J. Mar. Sci. Eng. 2023, 11, 1420. [Google Scholar] [CrossRef]
  35. Haer, T.; Botzen, W.W.; de Moel, H.; Aerts, J.C. Integrating household risk mitigation behavior in flood risk analysis: An agent-based model approach. Risk Anal. 2017, 37, 1977–1992. [Google Scholar] [CrossRef]
  36. Logan, T.M.; Anderson, M.J.; Reilly, A.C. Risk of isolation increases the expected burden from sea-level rise. Nat. Clim. Change 2023, 13, 397–402. [Google Scholar] [CrossRef]
  37. Chen, X.; Zhang, H.; Chen, W.; Huang, G. Urbanization and climate change impacts on future flood risk in the Pearl River Delta under shared socioeconomic pathways. Sci. Total Environ. 2021, 762, 143144. [Google Scholar] [CrossRef]
  38. Barnard, P.L.; Erikson, L.H.; Foxgrover, A.C.; Hart, J.A.F.; Limber, P.; O’Neill, A.C.; Van Ormondt, M.; Vitousek, S.; Wood, N.; Hayden, M.K.; et al. Dynamic flood modeling essential to assess the coastal impacts of climate change. Sci. Rep. 2019, 9, 4309. [Google Scholar] [CrossRef]
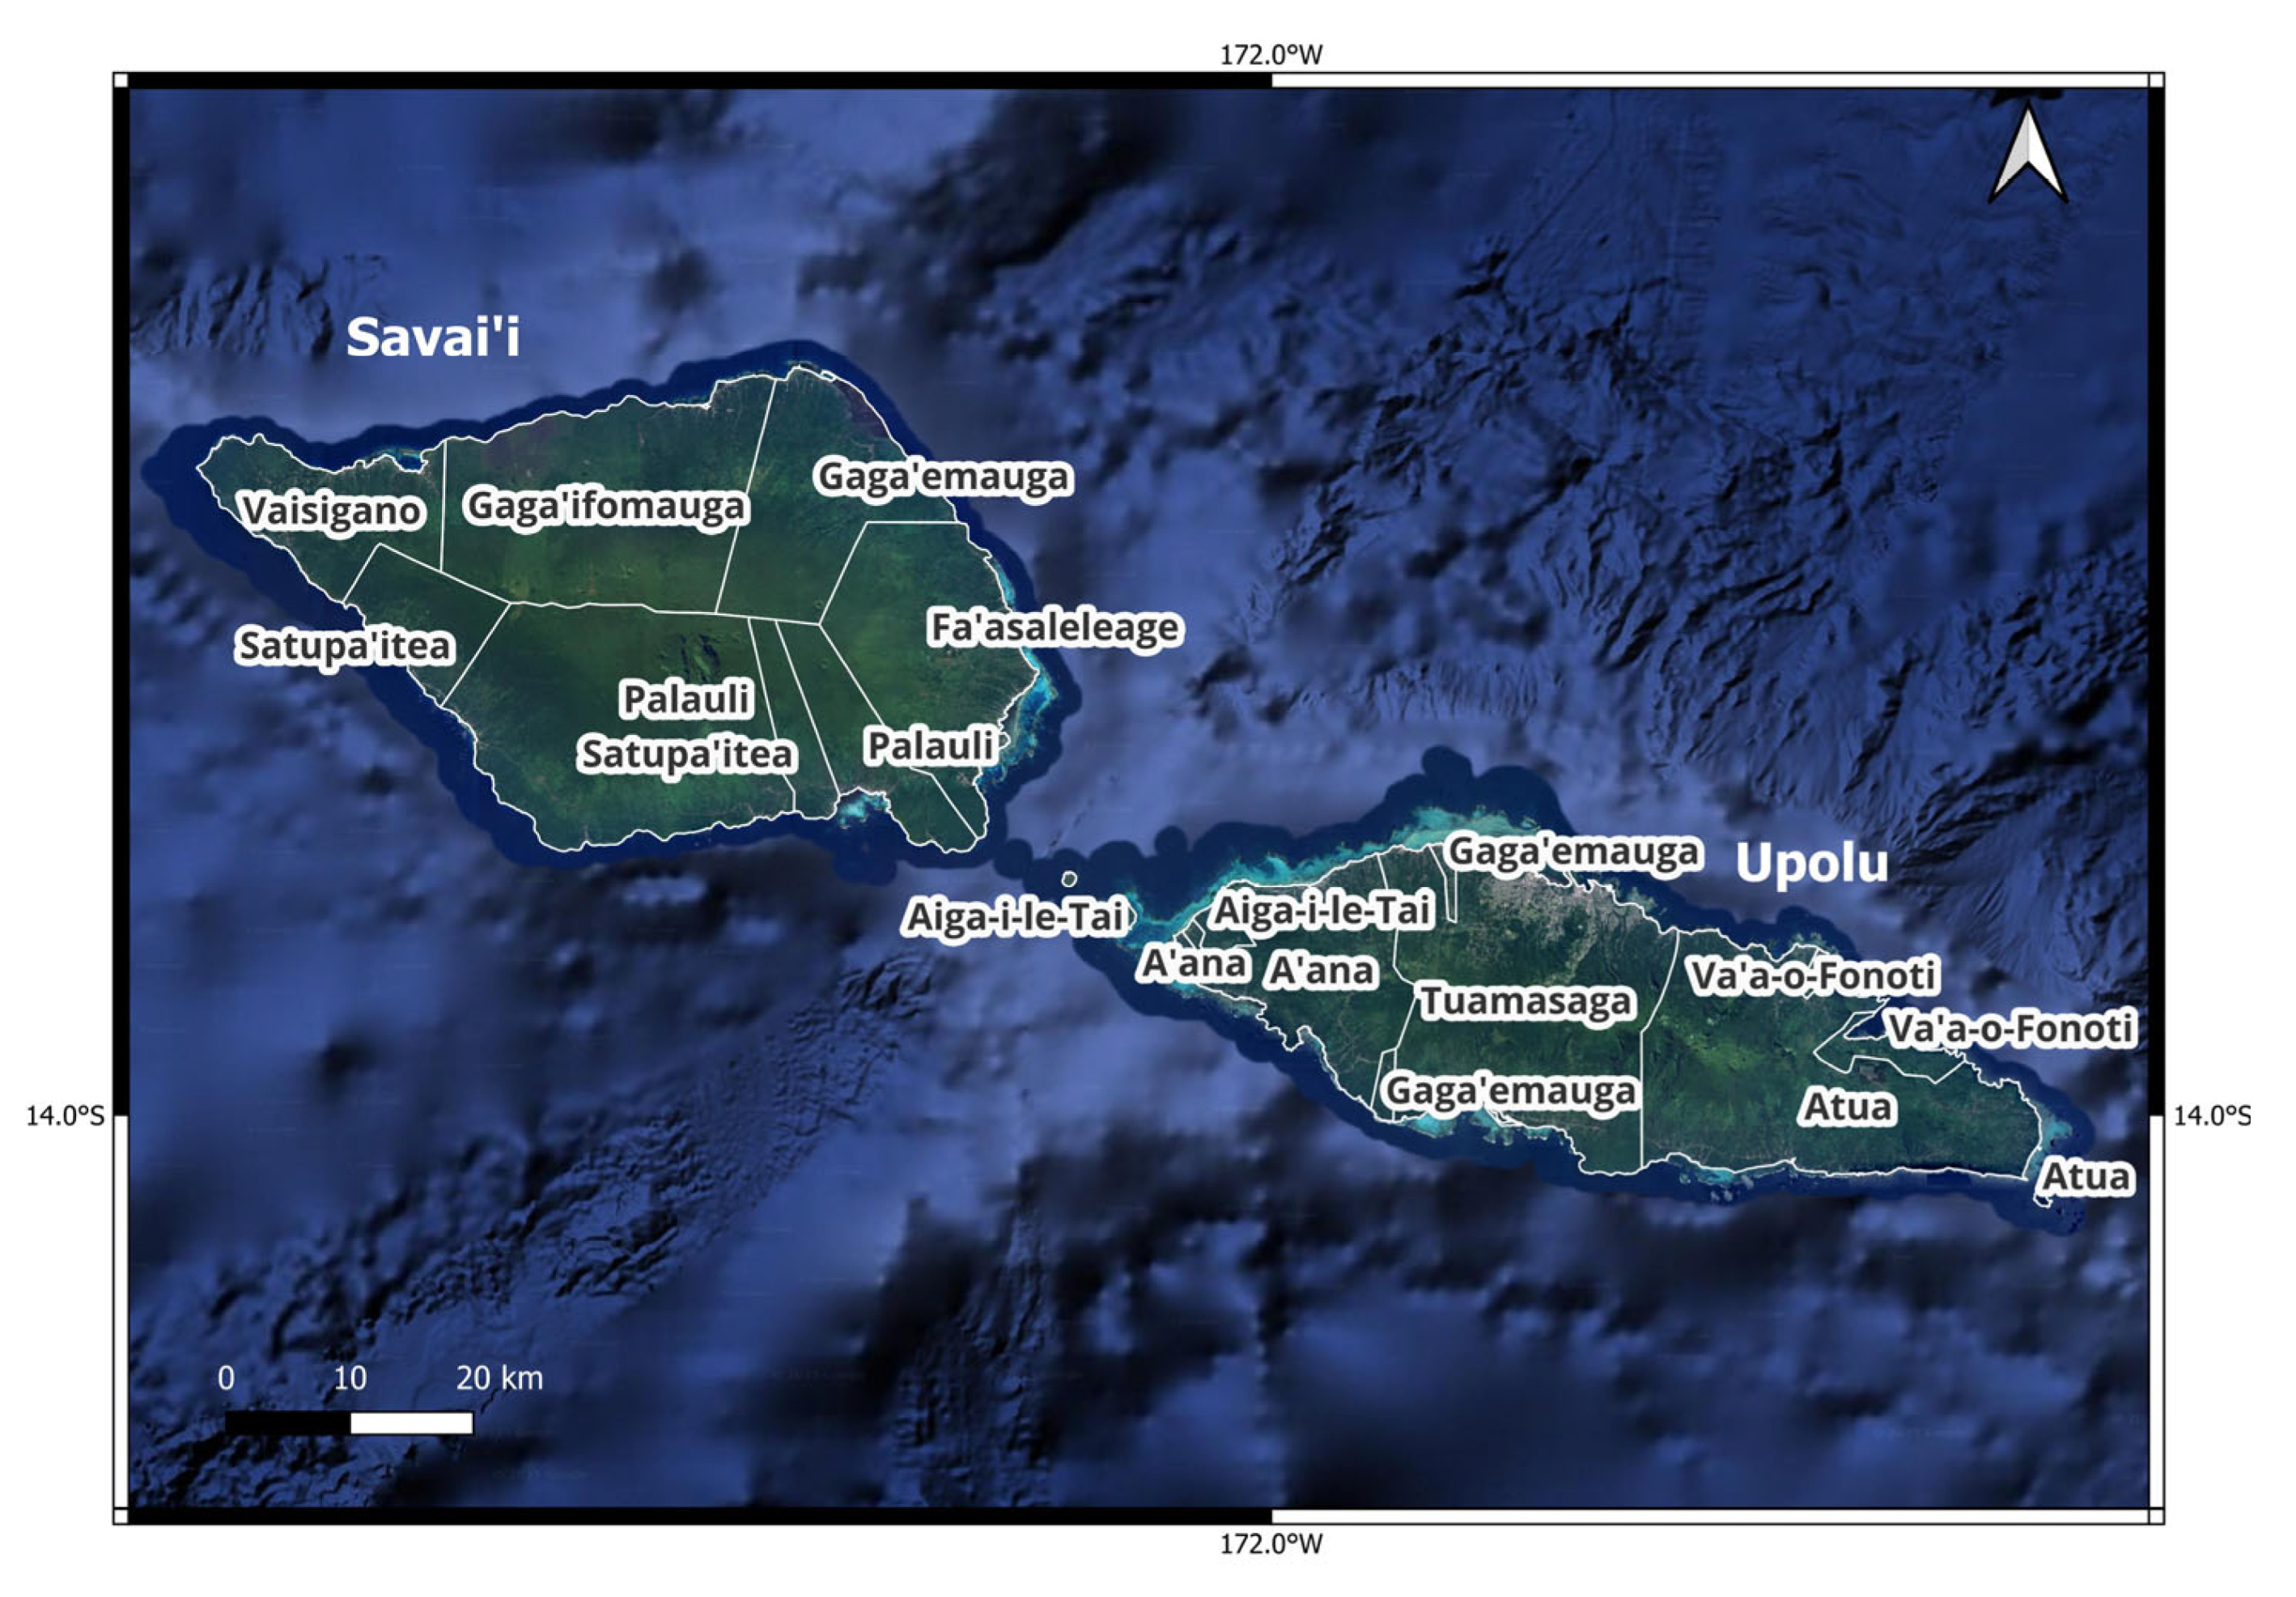
Figure 1. Samoa islands and district boundaries used in this study.
Jmse 13 02143 g001
Figure 2. Conceptual diagram of the RiskScape model pipeline steps and parameters to be used in this study.
Jmse 13 02143 g002
Figure 3. Samoa RSL projections between 2020 to 2140 for median (p50) and likely (p17–p83) GMSL range climate-driven sea level processes known with medium confidence under Share Socioeconomic Pathways 1–1.9, 2–4.5, 3–7.0, and 5–8.5 (after [23]).
Jmse 13 02143 g003
Figure 4. Samoa’s total building 100-year annual recurrence interval loss (ARI100) and permanent inundation loss (PL) estimated for RSL projections to 2140 for median (p50) and likely (p17–p83) GMSL range climate-driven sea level processes known with medium confidence.
Jmse 13 02143 g004
Figure 5. Samoa district total building 100-year annual recurrence interval loss (ARI100) and permanent inundation loss (PL) estimated for RSL projections to 2140 for median (p50) and likely (p17–p83) GMSL range climate-driven sea level processes known with medium confidence.
Jmse 13 02143 g005
Figure 6. Samoa’s total building average annual loss (AAL) and permanent inundation loss (PL) estimated for RSL projections to 2140 for median (p50) and likely (p17–p83) GMSL range climate-driven sea level processes known with medium confidence.
Jmse 13 02143 g006
Figure 7. Samoa district total building average annual loss (AAL) and permanent inundation loss (PL) estimated for RSL projections to 2140 for median (p50) and likely (p17–p83) GMSL range climate-driven sea level processes known with medium confidence.
Jmse 13 02143 g007
Table 1. Building attributes considered for this study.
Attributes Attribute Classes or DescriptionData Type *
Location DistrictA’ana; Aiga-i-le-Tai; Atua; Fa’asaleleage; Gaga’emauga; Gaga’ifomauga; Palauli; Satupa’itea; Tuamasaga; Va’a-o-Fonoti; VaisiganoText (N)
Geometric Area Building roof outline area (m2)Integer (C)
Stories Number of complete building floor levels Integer (C)
Non-geometricPrimary UseResidential (House; Fale); Commercial (Retail; Accommodation); Government (Public services; Education); Health (Clinic; Hospital) Community; Religious; Industrial (Manufacturing; Storage), Infrastructure Utility; Accommodation; Out building; Other Text (N)
Replacement ValueBuilding replacement value estimated in 2020 US dollars (USD)Integer (C)
Structural Frame Concrete (Concrete column, Tilt-Up Slab, and Load bearing wall); Steel (Steel column; Steel frame); Timber (Timber frame; Wooden pole); OtherText (N)
Wall CladdingConcrete Masonry; Fiber-cement; Metal sheet; Open; Other; Mixed; Timber; TraditionalText (N)
* (C) Continuous; (N) Nominal.
Disclaimer/Publisher’s Note: The statements, opinions and data contained in all publications are solely those of the individual author(s) and contributor(s) and not of MDPI and/or the editor(s). MDPI and/or the editor(s) disclaim responsibility for any injury to people or property resulting from any ideas, methods, instructions or products referred to in the content.