Abstract
In recent years, a new type of natural gas hydrate reservoir (designated as Class 1S reservoir) has been discovered in the Qiongdongnan Basin. Within this hydrate reservoir, free gas and hydrate coexist within the same stratum. The Class 1S reservoir is comprised of three distinct zones: the gas accumulation zone, the three-phase zone, and the hydrate-bearing zone. It exhibits significant commercial development potential. This paper analyzes the formation mechanism and geological context of Class 1S hydrates. A geological model was established and numerical simulation methods were employed to evaluate its production capacity, elucidating the evolutionary patterns of hydrate saturation distribution at different well locations. The simulation results indicate that production wells should be prioritised in gas accumulation zones in order to achieve the highest cumulative gas production. Additional production wells may be considered in later stages to enhance recovery rates. Secondary hydrate formation significantly impacts production in Hydrate-bearing zone and three-phase zone. Measures such as wellbore heating can be employed to minimize secondary hydrate formation around the wellbore.
1. Introduction
Natural gas hydrates are defined as crystalline compounds that form through the interaction of natural gas and water, resembling ice [1,2]. It has been established that an increase in temperature or a decrease in pressure will result in the escape of methane gas, thereby causing the solid hydrate to disintegrate. Terrestrial permafrost regions and deep-sea environments are the main places where natural gas hydrates can be found [3]. The combustion of these materials produces only minimal amounts of carbon dioxide and water, resulting in significantly lower levels of pollution when compared with coal, oil and other fossil fuels [4]. In consideration of the substantial natural gas reserves, there is an emerging global consensus that natural gas hydrates may present a viable alternative energy source [5].
In the latter half of the 20th century, a significant number of hydrate drilling and test extraction projects were initiated on a global scale [6,7,8]. Nevertheless, the systematic understanding of hydrate deposits remains elusive, and no effective means for commercial exploitation of these deposits have been developed [9,10,11]. Moridis’ classification of natural gas hydrate reservoirs, which was conducted between 2003 and 2007, resulted in the identification of three distinct categories [12,13]. Among these, Class I hydrate reservoirs are considered to offer the most promising commercial prospects [14]. Class I reservoirs manifest a discernible two-layer configuration, comprising an upper hydrate-bearing sedimentary layer and a lower gas–liquid two-phase fluid layer [15]. Moreover, it is noteworthy that the boundary of hydrate deposits within Class I reservoirs frequently coincides with the hydrate phase equilibrium boundary. Consequently, it can be deduced that the appropriate alteration of temperature or pressure conditions within Class I hydrate reservoirs has the capacity to induce hydrate decomposition [16,17,18]. This classification system, which has been widely adopted by subsequent researchers in the hydrate field, is valued for its practicality and scientific rigour. Building upon this framework, scholars have employed diverse strategies to assess gas production potential, significantly advancing research into the commercial development of hydrates [19,20,21,22].
In recent years, international academic research on natural gas hydrates has primarily focused on these three conventional types. However, a 2018 geological survey in the Qiongdongnan Sea area yielded new discoveries. The Guangzhou Marine Geological Survey (GMGS) has identified a novel hydrate reservoir. In comparison with conventional Type I hydrate reservoirs, this novel reservoir displays a distinctive spatial distribution pattern, characterised by the presence of gas accumulation zone at the centre and hydrate enrichment zone forming an annular distribution surrounding them. This hydrate deposit presents novel opportunities for the commercial development of hydrate reservoirs [23].
A hallmark of such hydrate reservoirs is the concurrent presence of highly saturated hydrates and free gas within the same stratum. The boundary of the hydrate stability zone is often observed to coincide with the boundary of the free gas phase. Therefore, a three-phase region exists between the hydrate stability zone and the free gas zone. In the context of natural gas production, this reservoir type is considered to be the most optimal. It is notable that minor variations in pressure and temperature can induce hydrate decomposition, which is a critical factor in the reservoir’s functionality. This aligns with the characteristics of Class I deposits. For the purpose of subsequent reference, this particular category of hydrate reservoir is designated as a Class 1S reservoir. However, no systematic study has yet explored the development potential of Class 1S hydrate reservoir. Therefore, this study will comprehensively analyze the geological background, reservoir characteristics, and formation mechanism of Class 1S hydrate reservoir, and construct a geological model based on them to optimize the development strategy. In addition, this study will explore the impact of well deployment on gas production efficiency, and evaluate potential problems such as secondary hydrate generation during the development process to reveal its genesis mechanism. The findings of this research endeavour have the potential to provide a theoretically robust foundation and practical technological assistance for the effective development of hydrate reservoirs of this nature.
2. Geological Background
The Qiongdongnan Basin is located in the northwestern part of the South China Sea. It is naturally separated from the Yingjihai Basin to the west. To the east, it connects with the Pearl River Estuary Basin [24]. The basin is remarkable for its deep structure and sedimentary evolution, with the maximum water depth exceeding 3000 m, and the cumulative thickness of the Cenozoic sedimentary sequences exceeding 10,000 m [25]. The Cenozoic stratigraphic sequence in the Qiongdongnan Basin is relatively well-preserved, with only the Paleocene Lingtou Formation lacking direct well exposure. The Yacheng Formation, formed during the late rift stage, constitutes the core hydrocarbon source rock layer in the basin [26]. The Lingshui Formation exhibits distinct petrological differentiation, with its base consisting of marine-terrestrial transitional deposits and its middle-upper sections dominated by marine sediments, forming the primary gas-bearing zone in the basin’s deeper sections. Quaternary Ledong Formation: Predominantly clayey in lithology, interbedded with thin layers of silt and fine sand, rich in bioclastic material and unconsolidated. This formation constitutes the primary stratigraphic setting for hydrate reservoirs [27,28].
In recent years, systematic geological exploration has been conducted in the target area of the Qiongdongnan Basin, with over 20 wells (including core-recovery wells) drilled and a high-resolution three-dimensional seismic dataset acquired [29,30]. Through integrated interpretation of logging curves and seismic attributes, a deeper understanding of hydrate resources in the Qiongdongnan Basin (QDNB Block) has been gained [31,32].
The peripheral faults formed during the rapid rifting phase of the deepwater uplift and its surrounding areas in the QDNB basin provide rapid transport pathways for deep fluids. Gas plumes at the uplift’s structural high points transport deep pyrothermal and biogenic gases to the shallow hydrate thermopressure stability zone, creating hydrate leakage pathways and pore-fracture seepage [33]. These pathways serve as secondary conduits for the diffusion and accumulation of shallow free gas. Simultaneously, gas chimneys with high temperature gradients (65–105 °C/km) significantly alter the regional geothermal gradient, forming annular low-temperature zones and central high-temperature areas. These temperature variations have been shown to influence the distribution of hydrates and gas, resulting in the presence of both free gas and hydrates within the same horizontal stratum. The distribution range of free gas shows a marked expansion trend with increasing depth. Thermodynamic field characteristics reveal that gas-rich zones correspond to high geothermal gradient zones, with the gradient gradually decreasing to 65 °C/km toward the hydrate stability zone, forming distinct temperature zoning. Based on well logging data and hydrate phase equilibrium data, a large-scale gas–water–hydrate three-phase coexistence zone is inferred to exist within this system.
Figure 1 shows the hydrate system in this region: the leftmost image depicts the hydrate distribution, with blue-green areas indicating hydrate-bearing zone; the middle image shows the gas distribution, where red areas represent gas accumulation zone; the rightmost image illustrates the combined distribution of hydrates and gas. This diagram reveals that the hydrates exhibit a ring-shaped distribution, with a high-saturation gas reservoir at its center. The hydrate distribution zone completely encloses the gas distribution zone, representing a significant spatial distribution difference compared to conventional hydrate reservoirs.

Figure 1.
Hydrate and gas distribution of the gas hydrate reservoir.
This hydrate reservoir exhibits typical thin-bedded characteristics (thickness < 10 m), with lithology dominated by chalky fine-grained sediments. Notably, the upper reservoir is overlain by a suite of ultra-low-permeability deep-sea mudstone caps (permeability < 0.1 mD), which effectively block vertical gas migration from deeper layers, leading to significant accumulation of free gas.
Thus, the primary formation mechanisms for Class 1S hydrate reservoirs are: a robust deep gas supply system, a gas chimney-dominated transport system, and the hydrate storage system within stable domains coupled with the sealing effect of the caprock.
3. Model Construction
Since the original geological model has problems such as low computational efficiency and strong non-homogeneity, and cannot systematically summarize the characteristics and development effect of the new hydrate reservoir, this study extracts typical geological units to construct a simplified geologic model (Figure 2). The model consists of three areas: (1) Hydrate-bearing zone (highly saturated hydrate + water); (2) three-phase zone (hydrate + free gas + water); and (3) Gas accumulation zone. Based on the simplified geologic model, the corresponding computational numerical model will be established in the subsequent chapters, and multi-parameter analyses such as gas production will be carried out.
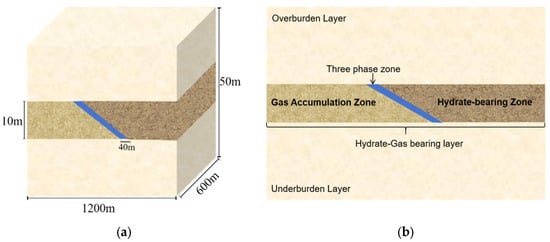
Figure 2.
Three-dimensional schematic diagram and vertical cross-section diagram of the geologic model. (a) Three-dimensional schematic diagram of the geologic model. (b)vertical cross-section diagram of the geologic model.
3.1. Model Description
The simplified geological model described in this paper is shown in Figure 2. This model features a rectangular structure that extends in the X, Y and Z directions, with corresponding lengths of 1200 m, 600 m and 50 m. There are a total of 576,250 grid cells. The maximum grid spacing in the Z direction is 4 m, with a minimum spacing of 1 m. The maximum spacing in the X- and Y-directions is 5 m, with a minimum spacing of 1 m in each direction.
The distribution of temperature and pressure within the model is demonstrated in Figure 3. The model’s temperature ranges from 13.7 to 19.2 °C, with the highest temperature of 19.2 °C occurring in the lower left corner. Temperatures decrease progressively toward the upper right corner. The model’s pressure ranges from 18.9 MPa to 19.3 MPa, with pressure increasing with depth—a characteristic consistent with conventional hydrate reservoirs.

Figure 3.
Schematic diagram of temperature and pressure distribution in the geologic model. (a) Schematic diagram of temperature distribution. (b) Schematic diagram of pressure distribution.
Hydrates and free gas mainly accumulate in the Hydrate-Gas bearing layer (HGBL), which is 10 m thick, with a horizontal permeability of 20–50 mD (as shown in Figure 4), and a vertical permeability of 0.5 times the horizontal permeability. The porosity is between 0.4 and 0.5 (as shown in Figure 5). The left half of the model is characterised by a higher temperature and is predominantly gas. In contrast, the right half exhibits a lower temperature and is rich in highly saturated hydrates. The middle is a 40 m wide three-phase zone, thus forming a gas-three-phase zone-hydrate composite layer. In this study, the hydrate saturation level in the Hydrate-bearing Zone is set at 0.5. The gas saturation level in the gas accumulation zone is also set at 0.5. In the three-phase zone, both the hydrate and free gas saturation levels are recorded at 0.2 with specific parameters as shown in Table 1. This paper’s model employs a closed boundary with no transfer of matter or heat. Relative Permeability and Capillary-Pressure Curves: refer to the first International Hydrate Simulator Comparison Project for Problem 5.
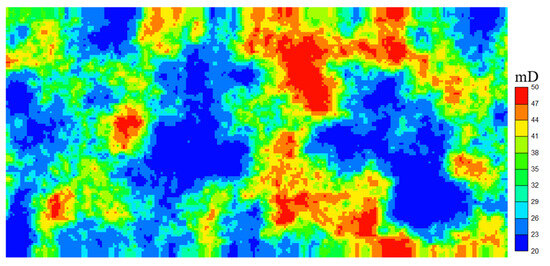
Figure 4.
Schematic Diagram of Permeability Parameters in Hydrate Reservoirs.
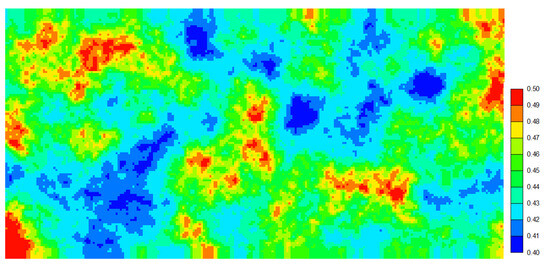
Figure 5.
Schematic Diagram of Porosity Parameters in Hydrate Reservoirs.

Table 1.
Physical parameter table of the model.
3.2. Production Modes
The current gas hydrate extraction technology system mainly includes multiple technology paths such as (1) reservoir depressurization method, (2) thermodynamic excitation method, (3) chemical inhibitor injection method, and (4) CO2-CH4 replacement method [34,35,36,37,38]. Since the boundary of the hydrate-bearing zone in Class 1S nearly coincides with that of the free gas enrichment zone, appropriately reducing pressure can disrupt the phase equilibrium of hydrates [39,40,41]. Therefore, this paper employs the pressure reduction method as the base mining method [42,43].
In terms of well optimization, although horizontal wells are theoretically better able to adapt to the strong horizontal inhomogeneity of the reservoir, the vertical well development mode was finally chosen due to engineering constraints such as the thin thickness of the target layer (<10 m) and the high trajectory control accuracy required (±0.5 m) [44,45].
In order to systematically study the influence of vertical well spatial location on the exploitation dynamics, this study established five case scenarios (Case 1, Case 2, Case 3, Case 4, Case 5). Case 1 and Case 2 both have perforation sections entirely within the gas accumulation zone. Case 3 features the most complex perforation section, traversing three distinct zones: gas accumulation zone, hydrate-bearing zone and three-phase zone. The lengths of the perforation sections within these three zones are 5 m, 1 m, and 4 m, respectively. Case 4 and Case 5 share a total perforation section length of 10 m, with both sections entirely located within the hydrate-bearing zone. All five scenarios employ single-well extraction, differing only in well location (specific locations shown in Figure 6). The design of the simulation scheme follows (1) uniform wellbore flow pressure control (10 MPa); (2) constant production cycle (3650 days) (3) injection of the hole stratum through the entire Hydrate-Gas bearing layer, and the perforation section length is uniformly 10 m. In particular, the completion locations are selected to cover key fluid units such as: gas accumulation zone, three-phase zone and hydrate-bearing zone, in order to reveal the law of production capacity difference under different mining paths. This spatial discretization research method can provide a new theoretical basis for well location optimization in Class 1S hydrate reservoir.

Figure 6.
Schematic Diagram of Well Locations for Five Cases.
3.3. Model Verification
The present study employs the CMG-STARS (2021.10) software for numerical calculations [46,47,48,49]. The STARS simulator incorporates multiple advanced well management and control options. The software in question incorporates sophisticated fully implicit geochemical simulation capabilities and advanced reaction kinetics modelling. In 2008, the inaugural international gas hydrate code comparison evaluated five mainstream hydrate reservoir simulators. This finding serves to substantiate the robust performance of the CMG-STARS software in simulating hydrate reservoir exploitation [50,51,52,53].
This paper provides further validation of the reliability of the CMG-STARS model, as demonstrated through hydrate decomposition experiments [54]. The pressure-reduction hydrate decomposition experiment was conducted in the CHS experimental facility. A vertical well was used for gas and water production during pressure-reduction extraction. The experiment consisted of two phases: pressure reduction and constant pressure. This paper primarily focuses on fitting run 1, which involved a pressure reduction duration of 22 min. The specific experimental process and simulation parameters are referenced in Xiao’s article. The fitting results are shown in Figure 7. A comparison of the simulation and experimental results shows that the cumulative gas production differs by 6%. Overall, however, the numerical simulation results are consistent with the experimental results, demonstrating the strong reliability of the CMG-STARS programme.
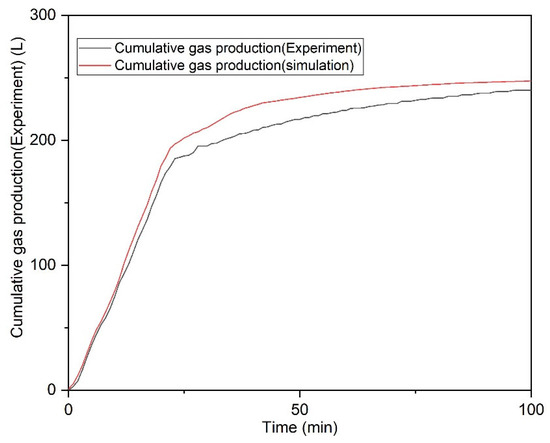
Figure 7.
Comparison of Experimental Results with Simulation Results.
The size of the wellbore grid may significantly impact the results. To ensure simulation accuracy, five distinct wellbore grid sizes were set for comparison: 0.5 m, 1 m, 2.5 m and 5 m. Generally, smaller wellbore grids yield higher accuracy. Therefore, the 0.5 m grid size was designated as the control group. The cumulative gas production error for each alternative scheme was calculated relative to the control group. As shown in Table 2, when the grid size was 1 m, the error remained within 0.01 compared to the control group—a sufficiently small margin. Taking simulation speed into account, the 1 m grid size scheme was selected for subsequent simulations.

Table 2.
Comparison of Cumulative Gas Production and Error Among Different Schemes.
4. Results and Discussions
4.1. Production Characteristic
The gas production rates of Case 1 and Case 2 located in the gas accumulation zone are significantly higher than those of Case 3, Case 4, and Case 5 in Figure 8. Among these, Case 1 exhibits exceptionally high gas production during days 1–30, reaching approximately 83,000 m3/d (The gas volume and hydrate volume in this paper are both expressed in standard conditions). Production gradually declines between days 31–120, then gradually increased again from days 121 to 600 to approximately 81,346 m3/d, after which it began to decline steadily, reaching 17,130 m3/d at day 3650. The gas production curve for Case 2 closely resembles that of Case 1, with the primary difference being that Case 2’s production increased steadily from days 1 to 800, reaching a maximum daily production of 74,000 m3/d. Production then gradually declined from 800 to 3650 days, reaching 13,860 m3/d at 3650 days. Case 3 has a relatively low daily gas production capacity, approximately 10,000 m3/d. Case 4 and Case 5 are primarily situated within the hydrate zone. Both cases exhibited low gas production rates, with Case 4 demonstrating higher output than Case 5.
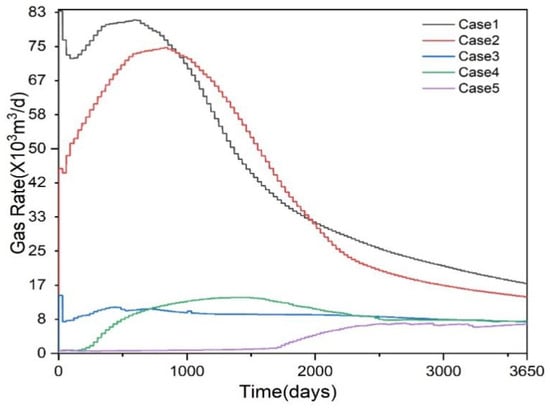
Figure 8.
Gas rate of five cases.
As illustrated in Figure 9, the cumulative gas production over 3650 days for Case 1, Case 2, Case 3, Case 4, and Case 5 is 16.2932 × 10⁷ m3, 14.98 × 10⁷ m3, 3.41 × 10⁷ m3, 3.41 × 10⁷ m3, and 1.34 × 10⁷ m3, respectively. The cumulative gas production of Case 1 and Case 2 is significantly higher than that of the other three cases. The most unexpected result in this simulation is likely that of Case 3. Although half of the perforation section in Case 3 is located within the gas accumulation zone, both the daily gas production and cumulative gas production are relatively low. Compared to Case 4 and Case 5, the simulation results for Case 3 show no significant advantage.

Figure 9.
Cumulative gas production of five cases.
Figure 10 shows the variation patterns of hydrate volume across different scenarios. In Case 1 and Case 2, hydrate decomposition is more significant and exhibits a consistent trend. At 3650 days, Case 1 retains 2.0 × 10⁵ m3 of hydrate, while Case 2 retains 2.3 × 10⁵ m3. This is because the wells in Case 1 and Case 2 are primarily located within the gas accumulation zone, enabling rapid gas production that reduces reservoir pressure and subsequently triggers hydrate decomposition. Case 3 exhibited the least hydrate decomposition, with a decomposition volume of only 1.26 × 10⁵ m3, the lowest among the five scenarios. In Case 4, the hydrate decomposition rate remained relatively uniform between days 1 and 2700. From days 2700 to 3300, hydrate decomposition was negligible, with the hydrate volume stabilizing around 5.75 × 10⁵ m3. From days 3300 to 3650, hydrate decomposition continued, ultimately reducing the hydrate volume to 5.5 × 10⁵ m3. In Case 5, the hydrate decomposition rate was relatively uniform, with a final residual hydrate volume of 526,489 m3.
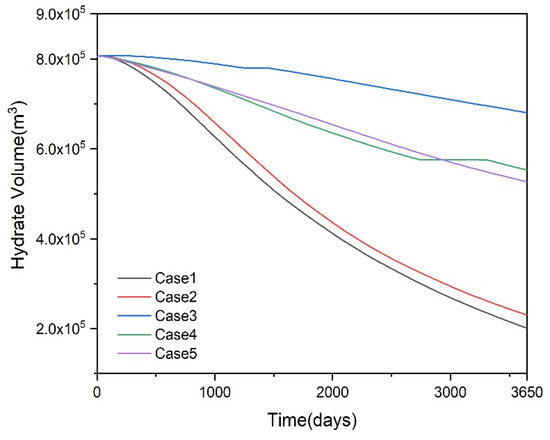
Figure 10.
Hydrate volume of the reservoir for Case 1–5.
Figure 11 shows the gas volume variation patterns in reservoirs under different scenarios. From days 1 to 2000, the gas volume trends in Case 1 and Case 2 are relatively consistent. Due to continuous gas production, the gas volume in the reservoir steadily decreases. From days 2000 to 3650, the gas volume in Case 1 remains largely unchanged. Considering the hydrate decomposition pattern, this indicates that the gas production rate from hydrates equals the well’s gas production rate during this period. In Case 2, the gas volume increases, suggesting that the gas production rate from hydrates exceeds the well’s gas production rate, indicating a relatively low well production rate at this stage. Case 3 shows a slight decrease in gas volume, maintaining 1.77 × 10⁸ m3 at 3650 days. Case 4 and Case 5 exhibit similar patterns of continuous gas volume increase. Based on the aforementioned hydrate decomposition and gas production patterns, the pressure reduction strategies in Case 4 and Case 5 prove effective, enabling partial hydrate decomposition and sufficient gas supply. However, the low gas production rate of the wells impedes further gas extraction from the reservoir.
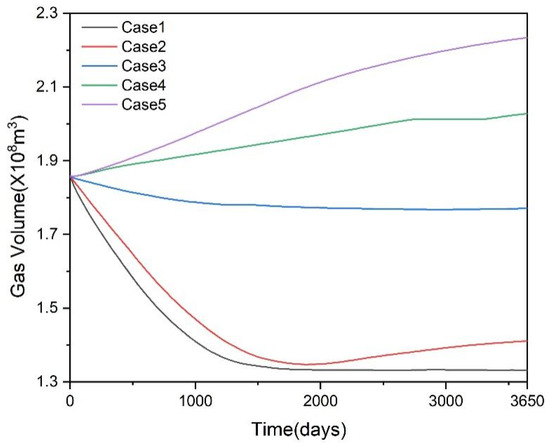
Figure 11.
Gas volume of the reservoir for Case 1–5.
Based on the above analysis, a preliminary conclusion can be drawn: Case 1 and Case 2, located within the gas accumulation zone, exhibit higher gas production rates, with Case 1 demonstrating greater cumulative gas production than Case 2. It is evident that both Case 4 and Case 5 are located within the hydrate-bearing zone, where the permeability of the substrate is known to be particularly high. The hydrate-bearing reservoir is characterised by a relatively low level, which has a consequential effect on the reservoir’s cumulative gas production. However, Case 3, with half of its perforated section situated in the gas accumulation zone, does not demonstrate a significant advantage in cumulative gas production compared to Case 4 and Case 5. This requires further analysis.
4.2. Evolution of Hydrate Distribution
As shown in Figure 12 and Figure 13, evolution of hydrate saturation(Sh) distribution on the vertical cross-section and the horizontal cross-section. The hydrate decomposition dynamics reveal that the decomposition patterns in Case 1 and Case 2 are relatively similar. At 180 days, only partial decomposition occurred in the hydrates within the three-phase zone and near the underlying layer. By 365 days, hydrates in the three-phase zone had completely decomposed, while those near the underlying layer underwent further decomposition, with hydrate saturation decreasing by approximately 0.1. At 1825 days, significant decomposition occurred in the top and bottom parts of the hydrate reservoir, while decomposition in the middle part was relatively minor. By 3650 days, the decomposition front in the central hydrate had advanced approximately 75 m. The hydrate saturation dynamics in Case 3 reveal minimal decomposition, occurring only near the underlying formation. Concurrently, significant secondary hydrate formation is observed around the wellbore. This likely explains why half of the perforated section in Case 3 lies within the gas reservoir yet yields substantially lower production than Cases 1 and 2. The hydrate decomposition dynamics in Cases 4 and 5 are similar, with decomposition primarily occurring around the wellbore and near the underlying formation. By 3650 days, hydrates within a 20-m radius of the wellbore had largely decomposed. Concurrently, significant secondary hydrate formation was observed around the wellbore. This secondary hydrate generation likely contributed to the reduced gas production observed in Cases 4 and 5.
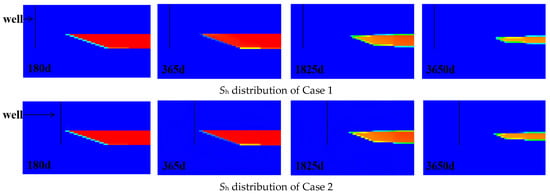
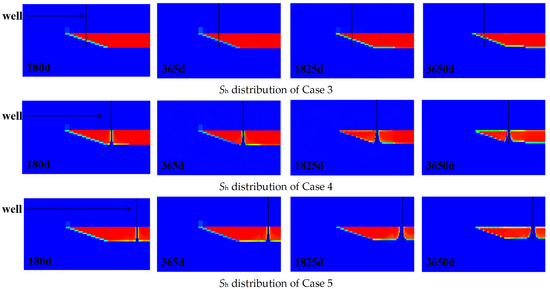
Figure 12.
Evolution of Sh distribution on the vertical cross-section for Case 1–5.
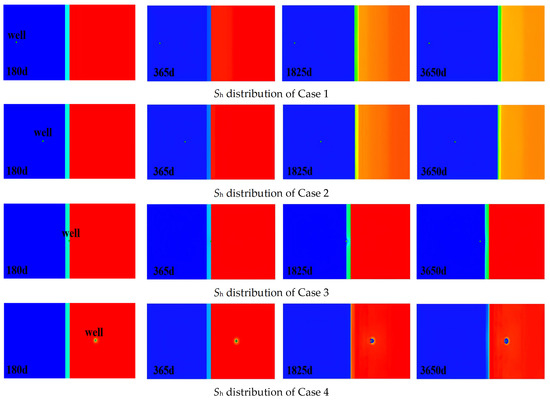

Figure 13.
Evolution of Sh distribution on the horizontal cross-section.
The variation in secondary hydrate saturation within a 2.5 m radius around the wellbore is shown in Figure 14. It was observed that the secondary hydrate saturation around the wellbore in Case 3 remained consistently high from days 1 to 3650. It has been demonstrated that from days 1 to 500, there was a significant increase in gas production in Case 3 compared with Cases 4 and 5 (as shown in Figure 8). This finding indicates the benefit of the proximity of Case 3 to the gas accumulation zone. However, the higher gas production rate induced a strong choke expansion effect, causing a rapid decrease in wellbore temperature. Simultaneously, Case 3’s well is situated between the free gas and hydrate reservoirs, where temperatures are lower. Consequently, the choke expansion effect rapidly generates substantial secondary hydrates around the wellbore, reducing surrounding permeability. Between days 500 and 3650, this phenomenon decreased gas production and prevented further pressure drop propagation, thereby inhibiting hydrate decomposition. Thus, Case 3 exhibited the lowest hydrate decomposition rate and the lowest gas production. Both perforation sections in Case 1 and Case 2 are situated within the gas accumulation zone, resulting in higher reservoir temperatures. The warmer gas helps elevate temperatures around the wellbore, leading to relatively fewer secondary hydrates. Compared to Case 2, Case 1 experiences higher temperatures and fewer secondary hydrates, yielding slightly higher cumulative gas production. From days 1 to 200, gas in Case 4 primarily originates from the decomposition of hydrates around the wellbore, resulting in a lower initial gas production rate. From 200 to 1500 days, gas production in Case 4 accelerated rapidly as surrounding hydrates decomposed and permeability increased. The combination of high production rates and low surrounding temperatures led to extensive secondary hydrate formation around the well. From 1500 to 3650 days, significant secondary hydrate generation persisted, continuously suppressing Case 4’s gas production rate. From 1 to 30 days, the hydrates around the Case 5 well were completely decomposed. Between 30 and 2000 days, the hydrate saturation around Case 5 remained at 0. This was due to the low gas production rate of Case 5, which resulted in negligible throttling expansion effects. Consequently, despite having the lowest wellbore temperature, no secondary hydrates formed during this phase. From 2000 to 3650 days, the gas production rate of Case 5 increased, enhancing the throttling expansion effect. Consequently, a certain amount of secondary hydrate formed around the well. This hydrate formation also caused the daily gas production to fluctuate between 6000 and 7400 m3/d, preventing further increases in the production rate.

Figure 14.
Hydrate saturation around the well of Case 1–5.
In summary, the saturation of hydrates around the wellbore exhibits a significant correlation with the gas production rates in Case 3, Case 4, and Case 5. The formation of secondary hydrates has been demonstrated to have a substantial impact on gas production rates in the examined scenarios. Consequently, measures such as heating are required to mitigate the formation of secondary hydrates in the surrounding area of the wellbore. In Cases 1 and 2, the perforated sections are located within the higher-temperature gas accumulation zone, where secondary hydrate formation is minimal. However, the limited well control area and reserves result in residual hydrates remaining undecomposed in the reservoir’s right section. Consequently, insufficient subsequent gas supply leads to declining gas production rates. Future considerations should include increasing the number of wells to enhance recovery rates.
4.3. Effect of Wellbore Pressure on Results
The above analysis reveals that the location of the well and the formation of secondary hydrates have a significant influence on gas production behaviour. However, this conclusion was obtained at a bottomhole pressure of 10 MPa. To verify the universality of this finding, this study established four simulation scenarios with different bottom-hole pressures. These were set at 5 MPa, 7.5 MPa, 12.5 MPa and 15 MPa, respectively. All other parameters remained unchanged, consistent with the simulation scenario at a bottomhole pressure of 10 MPa. The gas production results are shown in Figure 15. Figure 16 presents the statistical analysis of hydrate saturation within a 2.5-metre radius around the wellbore.
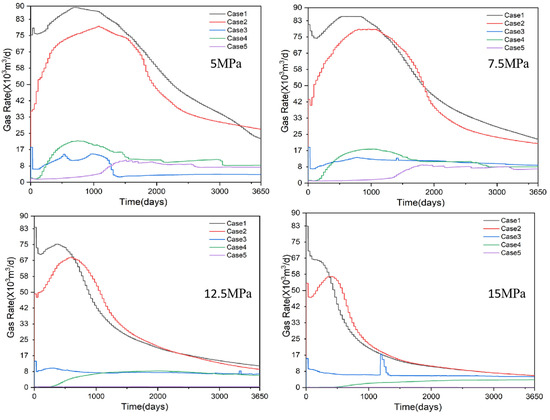
Figure 15.
Gas production rates for five cases at wellhead pressures of 5, 7.5, 12.5 and 15 MPa.
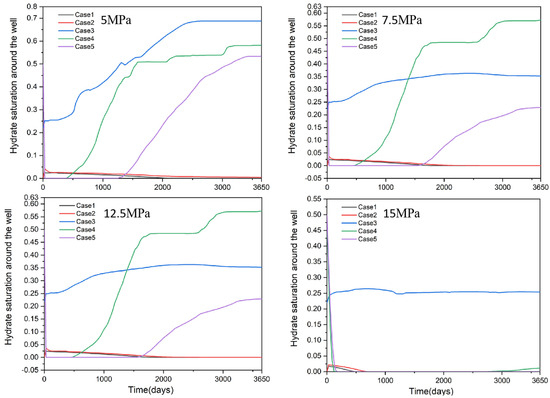
Figure 16.
Hydrate saturation of Case 1–5 at wellhead pressures of 5, 7.5, 12.5 and 15 MPa.
Of the scenarios at 5 MPa, 7.5 MPa, 12.5 MPa and 15 MPa, Cases 1 and 2 exhibit significantly higher gas accumulation zone production rates than Cases 3, 4 and 5. Therefore, Case 1 within the gas accumulation zone should be prioritised as the production well. In the 5 MPa, 7.5 MPa and 12.5 MPa pressure groups, secondary hydrate formation around the wellbore was markedly higher in Cases 3, 4 and 5 than in Cases 1 and 2. This phenomenon had a significant impact on the gas production behaviour of Cases 3, 4 and 5. At 15 MPa, the smaller bottomhole pressure differential results in lower gas production in Cases 4 and 5, leading to reduced saturation of secondary hydrates around the wellbore. Therefore, under different production pressures, both well location and secondary hydrate formation significantly influence gas production behaviour.
5. Conclusions
This paper analyzes the geological background and formation mechanisms of Class 1S hydrate deposits. Based on actual data, a geological model was established and five simulation scenarios were set for different well locations, revealing the gas production characteristics of Class 1S hydrate deposits and providing development recommendations. Conclusions are as follows:
- (1)
- The formation mechanism of Class 1S hydrate deposits involves: a robust deep gas supply system, a gas chimney-dominated transport system, and the hydrate storage system within stable domains coupled with the sealing effect of the caprock.
- (2)
- Case 1, located within the gas accumulation zone, is recommended as the priority option to achieve the highest cumulative gas production. Additional production wells may be considered in later stages to enhance recovery rates.
- (3)
- Secondary hydrate formation significantly impacts production in Cases 3, 4, and 5. Measures such as wellbore heating can be employed to minimize secondary hydrate formation around the wellbore.
- (4)
- Geomechanical deformations do exert a certain influence on the results, especially in the three-phase zone. However, the article does not consider geomechanical deformation. This will be a focus of our subsequent work.
Author Contributions
Software, Z.P. and Z.Z.; Methodology, Z.P. and B.L.; Data curation, J.D.; Investigation, C.X. (Changwen Xiao); Writing—original draft, X.L.; Writing—review and editing, C.X. (Chenlu Xu); Project administration, L.Y.; Funding acquisition, H.L.; Conceptualization, L.N. and J.C. All authors have read and agreed to the published version of the manuscript.
Funding
This research was funded by the Special Project for Marine Economy Development of Guangdong (Six Marine Industries) (GDNRC [2024]48), 2025 Hainan International Science and Technology Cooperation Research and Development Project(GHYF2025017), National Natural Science Foundation of China(No.42476232), Guangzhou Science and Technology Program(No.202206050002), National Key Research and Development Program (2024YFC2814703), the Youth Research Team Project of the National Engineering Research Center of Gas Hydrate Exploration and Development (Grant No. NERC2024003), the National Natural Science Foundation of China (No. 42406232).
Data Availability Statement
The datasets generated and analyzed during the current study are available from the corresponding author by request.
Acknowledgments
Support for this work was jointly provided by the Special Project for Marine Economy Development of Guangdong (Six Marine Industries), 2025 Hainan International Science and Technology Cooperation Research and Development Project, National Natural Science Foundation of China, Guangzhou Science and Technology Program, National Key Research and Development Program, the Youth Research Team Project of the National Engineering Research Center of Gas Hydrate Exploration and Development.
Conflicts of Interest
The authors declare no conflicts of interest.
References
- Sloan, E.D. Fundamental principles and applications of natural gas hydrates. Nature 2003, 426, 353–359. [Google Scholar] [CrossRef]
- Kvenvolden, K.A.; Lorenson, T.D. The global occurrence of natural gas hydrate. Geophys. Monogr. 2001, 124, 87–98. [Google Scholar] [CrossRef]
- Cherskiy, V.P.; Tsarev, V.P.; Nikitin, S.P. Investigation and prediction of conditions of accumulation of gas resource in gas-hydrate pools. Pet. Geol. 1984, 21, 84–89. [Google Scholar]
- Liu, C.L.; Meng, Q.G.; He, X.L.; Li, C.F.; Ye, Y.G.; Lu, Z.Q.; Zhu, Y.H.; Li, Y.H.; Liang, J.Q. Comparison of the characteristics for natural gas hydrate recovered from marine and terrestrial areas in China. J. Geochem. Explor. 2015, 152, 67–74. [Google Scholar] [CrossRef]
- Makogon, Y.F. Natural gas hydrates-a promising source of energy. J. Nat. Gas Sci. Eng. 2010, 2, 49–59. [Google Scholar] [CrossRef]
- Makogon, Y.F.; Holditch, S.A.; Makogon, T.Y. Russian field illustrates gas-hydrate production. Oil Gas J. 2005, 103, 43–50. [Google Scholar]
- Dallimore, S.R.; Uchida, T.; Collett, T.S. Scientific results from JAPAX/JNOC/GSC Mallik 2L-38 gas hydrate research well, Mackenzie Delta, Northwest Territories, Canada. Geol. Surv. Can. Bull. 1999, 544, 295–311. [Google Scholar]
- De Angelis, M.A.; Lilley, M.D.; Baross, J.A. Methane oxidation in deep-sea hydrothermal plumes of the endeavour segment of the Juan de Fuca Ridge. Deep Sea Res. Part I 1993, 40, 1169–1186. [Google Scholar] [CrossRef]
- Chazallon, B.; Rodriguez, C.T.; Ruffine, Y.; Carpentier, Y.; Riboulot, Y. Characterizing the variability of natural gas hydrate composition from a selected site of the Western Black Sea, off Romania. Mar. Pet. Geol. 2020, 124, 104785. [Google Scholar] [CrossRef]
- Klauda, J.B.; Sandler, S.I. Global distribution of methane hydrate in ocean sediment. Energy Fuels 2005, 19, 459–470. [Google Scholar] [CrossRef]
- Takahashi, H.; Yonezawa, T.; Fercho, E. Operation Overview of the 2002 Mallik gas hydrate production research well program at the Mackenzie Delta in the Canadian Arctic. In Proceedings of the Offshore Technology Conference, Houston, TX, USA, 5 May 2003. [Google Scholar] [CrossRef]
- Moridis, G.J.; Collett, T.S.; Dallimore, S.R.; Satoh, T.; Hancock, S.; Weatherill, B. Numerical studies of gas production from several CH4-hydrate zones at the Mallik Site, Mackenzie Delta, Canada. J. Petrol. Sci Eng. 2004, 43, 219–238. [Google Scholar] [CrossRef]
- Alp, D.; Parlaktuna, M.; Moridis, G.J. Gas production by depressurization from hypothetical Class 1G and Class 1W hydrate reervoirs. Energy Convers. Manag. 2007, 48, 1864–1879. [Google Scholar] [CrossRef]
- Moridis, G.J.; Kowalsky, M.B.; Pruess, K. Depressurization-induced gas production from Class 1 hydrate deposits. SPE J. Res. Eval. Eng. 2007, 10, 458–481. [Google Scholar] [CrossRef]
- Moridis, G.J.; Sloan, E.D. Gas production potential of disperse low-saturation hydrate accumulations in oceanic sediments. Energy Convers. Manag. 2007, 48, 1834–1849. [Google Scholar] [CrossRef]
- Moridis, G.J.; Collett, T.S.; Boswell, R.; Hancock, S.; Coh, C. Gas Hydrates as a Potential Energy Source: State of Knowledge and Challenges; Springer: Berlin/Heidelberg, Germany, 2013; pp. 977–1033. [Google Scholar] [CrossRef]
- Moridis, G.J.; Collett, T.S.; Pooladi-Darvish, M.; Hancock, S.H.; Santamarina, C.; Boswell, R.; Kneafsey, T.J.; Rutqvist, J.; Kowalsky, M.B.; Reagan, M.T. Challenges, Uncertainties and Issues Facing Gas Production from Hydrate Deposits in Geologic Systems. In Proceedings of the SPE Unconventional Gas Conference, Pittsburgh, PA, USA, 23–25 February 2010. [Google Scholar] [CrossRef]
- Moridis, G.J.; Reagan, M.T. Estimating the upper limit of gas production from Class 2 hydrate accumulations in the permafrost: 1. Concepts, system description, and the production base case. J. Pet. Sci. Eng. 2011, 76, 194–204. [Google Scholar] [CrossRef]
- Ye, H.; Chen, J.; Yao, Y.; Chen, D.; Wu, X.; Li, D.; Zi, M. Gas recovery from low-permeability muddy silt gas hydrate reservoirs by depressurization coupled with hot water injection: Impact of hydro-lock effect. Energy 2025, 316, 134413. [Google Scholar] [CrossRef]
- Ye, H.; Yao, Y.; Chen, D.; Duan, J.; Wu, X.; Li, D.; Zi, M. Hydrate-based CO2 sequestration in post-exploitation natural gas hydrate reservoir: A numerical method considering mixed hydrate. Energy 2025, 336, 138406. [Google Scholar] [CrossRef]
- Qin, F.; Sun, J.; Cao, X.; Mao, P.; Zhang, L.; Lei, G.; Jiang, G.; Ning, F. Numerical simulation on combined production of hydrate and free gas from silty clay reservoir in the South China Sea by depressurization: Formation sealing. Appl. Energy 2025, 377, 124343. [Google Scholar] [CrossRef]
- Li, B.; Sun, Y.; Jiang, S.; Zhang, G.; Feng, J.; Shan, H.; Li, X. Production characteristics and sensitivity analysis on gas hydrate and shallow gas coexistence reservoirs: Focus on gas hydrate formation. Appl. Energy 2025, 386, 125572. [Google Scholar] [CrossRef]
- Yu, L.; Lu, H.; Zhang, L.; Xu, C.; Kuang, Z.; Li, X.; Yu, H.; Wang, Y. Assessment of Gas Production from Complex Hydrate System in Qiongdongnan Basin of South China Sea. Energies 2023, 16, 7447. [Google Scholar] [CrossRef]
- Zhao, Z.X.; Sun, Z.; Wang, Z.F.; Sun, Z.P.; Liu, J.B.; Zhang, C.M. The high-resolution sedimentary filling in Qiongdongnan Basin, northern south China Sea. Mar. Geol. 2015, 361, 11. [Google Scholar] [CrossRef]
- Wei, J.G.; Liang, J.Q.; Lu, J.A.; Zhang, W.; He, Y.L. Characteristics and dynamics of gas hydrate systems in the northwestern South China Sea-Results of the fifth gas hydrate drilling expedition. Mar. Pet. Geol. 2019, 110, 287–298. [Google Scholar] [CrossRef]
- Liang, J.Q.; Zhang, W.; Lu, J.A.; Wei, J.G.; Kuang, Z.K.; He, Y.L. Geological occurrence and accumulation mechanism of natural gas hydrates in the eastern Qiongdongnan Basin of the South China Sea: Insights from site GMGS5-W9-2018. Mar. Geol. 2019, 418, 106042. [Google Scholar] [CrossRef]
- Meng, M.M.; Liang, J.Q.; Lu, J.A.; Zhang, W.; Kuang, Z.K.; Fang, Y.X.; He, Y.L.; Deng, W.; Huang, W. Quaternary deep-water sedimentary characteristics and their relationship with the gas hydrate accumulations in the Qiongdongnan Basin, Northwest South China Sea. Deep Sea Res. Part I 2021, 177, 103628. [Google Scholar] [CrossRef]
- Zhang, W.; Liang, J.Q.; Lu, J.A.; Meng, M.M.; He, Y.L.; Deng, W.; Feng, J.X. Characteristics and controlling mechanism of typical leakage gas hydrate reservoir forming system in the Qiongdongnan Basin, northern South China Sea. Nat. Gas Ind. 2020, 40, 90–99, (In Chinese with English Abstract). [Google Scholar] [CrossRef]
- He, Y.L.; Liang, J.Q.; Shi, W.Z.; Kuang, Z.K.; Deng, W.; Wang, R.; Xu, L.T.; Du, H. Influencing factors and accumulation modes of gas hydrate in the South low uplift and its surrounding area of Qiongdongnan Basin. Earth Sci. 2021, 5, 1711–1727, (In Chinese with English Abstract). [Google Scholar] [CrossRef]
- Xie, Y.H.; Zhang, G.C.; Sun, Z.P.; Zeng, Q.; Zhao, Z.; Guo, S. Reservoir forming conditions and key exploration technologies of Lingshui 17-2 giant gas field in deepwater area of Qiongdongnan Basin. Petrol. Res. 2019, 4, 1–18. [Google Scholar] [CrossRef]
- Chen, Z.G.; Jiang, T.; Kuang, Z.G.; Chen, C.; Xiong, P.F.; Chen, Y. Accumulation characteristics of gas hydrate-shallow gas symbiotic system in Qiongdongnan Basin. Earth Sci. 2022, 47, 1619–1634, (In Chinese with English Abstract). [Google Scholar] [CrossRef]
- Huang, W.; Zhang, W.; Liang, J.Q.; Shang, J.J.; Meng, M.M.; Shan, C.C. Comparative study of gas hydrate accumulation system in the Qiongdongnan Basin of the South China Sea and the Ulleung Basin of Korea. J. China Uni. Min. Tech. 2020, 50, 363–380, (In Chinese with English Abstract). [Google Scholar] [CrossRef]
- Huang, S.Z.; Li, F.; Song, P.; Hu, B.; Sun, W.Y. Study on geophysical identification technology of ultra deep water and shallow gas reservoirs in Qiongdongnan Basin. Earth Sci. 2022, 339, 1–11, (In Chinese with English Abstract). [Google Scholar] [CrossRef]
- Xue, K.P.; Liu, Y.; Yu, T.; Yang, L.; Zhao, J.F.; Song, Y.C. Numerical simulation of gas hydrate production in shenhu area using depressurization: The effect of reservoir permeability heterogeneity. Energy 2023, 271, 126948. [Google Scholar] [CrossRef]
- Wei, R.P.; Xia, Y.Q.; Wang, Z.F.; Li, Q.P.; Lv, X.; Leng, S.D.; Zhang, L.X.; Zhang, Y.; Xiao, B.; Yang, S.X.; et al. Long-term numerical simulation of a joint production of gas hydrate and underlying shallow gas through dual horizontal wells in the South China Sea. Appl. Energy 2022, 320, 119235. [Google Scholar] [CrossRef]
- Zhao, E.M.; Hou, J.; Du, Q.J.; Liu, Y.G.; JI, Y.K.; Bai, Y.J. Numerical modeling of gas production from methane hydrate deposits using low-frequency electrical heating assisted depressurization method. Fuel 2021, 290, 120075. [Google Scholar] [CrossRef]
- Gajanayake, S.; Gamage, R.P.; Wanniarachchige, P.; Zhang, D. Quantification of CO2 replacement in methane gas hydrates: A molecular dynamics perspective. J. Nat. Gas Eng. 2022, 98, 104396. [Google Scholar] [CrossRef]
- Li, S.X.; Li, S.; Zhang, R.Y.; Li, Q.P.; Pang, W.X. Strategies for gas production from Class 2 hydrate accumulations by depressurization. Fuel 2021, 286, 119380. [Google Scholar] [CrossRef]
- Yang, S.W.; Lang, X.M.; Wang, Y.H.; Wen, Y.G.; Fan, S.S. Numerical simulation of Class 3 hydrate reservoirs exploiting using horizontal well by depressurization and thermal co-stimulation. Energy Convers. Manag. 2014, 77, 298–305. [Google Scholar] [CrossRef]
- Li, S.; Wang, Z.; Li, S.; Wang, X.; Hao, Y. Investigations on performance of hydrate dissociation by depressurization near the quadruple point. J. Nat. Gas Sci. Eng. 2021, 90, 103929. [Google Scholar] [CrossRef]
- Wang, B.; Fan, Z.; Wang, P.; Liu, Y.; Zhao, J.; Song, Y. Analysis of depressurization mode on gas recovery from methane hydrate deposits and the concomitant ice generation. Appl. Energy 2018, 227, 624–633. [Google Scholar] [CrossRef]
- Zhang, Y.; Zhang, P.; Hui, C.; Tian, S.; Zhang, B. Numerical analysis of the geomechanical responses during natural gas hydrate production by multilateral wells. Energy 2023, 269, 126810. [Google Scholar] [CrossRef]
- Meret, S.; Al-Raoush, R.I.; Jung, J.W.; Alshibli, K.A. Comprehensive literature review on CH4-CO2 replacement in microscale porous media. J. Pet. Sci. Eng. 2018, 178, 48–62. [Google Scholar] [CrossRef]
- Liu, Y.; Hou, J.; Chen, Z.; Bai, Y.; Su, H.; Zhao, E.; Li, G. Enhancing hot water flooding in hydrate bearing layers through a novel staged production method. Energy 2021, 217, 119319. [Google Scholar] [CrossRef]
- Zhong, X.; Pan, D.; Zhu, Y.; Wang, Y.; Zhai, L.; Li, X.; Tu, G.; Chen, C. Fracture network stimulation effect on hydrate development by depressurization combined with thermal stimulation using injection-production well patterns. Energy 2021, 228, 120601. [Google Scholar] [CrossRef]
- Uddin, M.; Coombe, D.; Law, D.; Gunter, B. Numerical studies of gas hydrate formation and decomposition in a geological reservoir. In Proceedings of the SPE Gas Technology Symposium, Calgary, AB, Canada, 15 May 2006. [Google Scholar] [CrossRef]
- Gaddipati, M. Code Comparison of Methane Hydrate Reservoir Simulators Using CMG STARS. Ph.D. Thesis, West Virginia University, Morgantown, WV, USA, 2008. [Google Scholar]
- Ajayi, T.; Anderson, B.J.; Seol, Y.; Boswell, R.; Myshakin, E.M. Key aspects of numerical analysis of gas hydrate reservoir performance: Alaska North Slope Prudhoe Bay Unit “L-Pad” hydrate accumulation. J. Nat. Gas Sci. Eng. 2018, 51, 37–43. [Google Scholar] [CrossRef]
- Matsuda, H.; Yamakawa, T.; Sugai, Y.; Sasaki, K. Gas Production from Offshore Methane Hydrate Layer and Seabed Subsidence by Depressurization Method. Engineering 2016, 8, 353–364. [Google Scholar] [CrossRef][Green Version]
- Myshakin, E.M.; Gaddipati, M.; Rose, K.; Anderson, B.J. Numerical simulations of depressurization-induced gas production from gas hydrate reservoirs at the Walker Ridge 313 site, northern Gulf of Mexico. Mar. Pet. Geol. 2012, 34, 169–185. [Google Scholar] [CrossRef]
- Vysniauskas, A.; Bishnoi, P.R. A kinetic study of methane hydrate formation. Chem. Eng. Sci. 1983, 38, 1061–1072. [Google Scholar] [CrossRef]
- Kim, H.C.; Bishnoi, P.R.; Heidemann, R.A.; Rizvi, S.S.H. Kinetics of methane hydrate decomposition. Chem. Eng. Sci. 1987, 42, 1645–1653. [Google Scholar] [CrossRef]
- Su, Z.; Moridis, G.J.; Zhang, K.; Wu, N. A huff-and-puff production of gas hydrate deposits in Shenhu area of South China Sea through a vertical well. J. Pet. Sci. Eng. 2012, 86–87, 54–61. [Google Scholar] [CrossRef]
- Xiao, C.-W.; Li, X.-S.; Lu, H.-F.; Li, G.; Xu, C.-L.; Qi, R.-R.; Xing, D.-H.; Li, X.; Weng, Y.-F.; Yu, L. Experimental studies and pore-scale modeling of hydrate dissociation kinetics at different depressurization rates in a cubic hydrate simulator. Chem. Eng. J. 2024, 499, 156313. [Google Scholar] [CrossRef]
Disclaimer/Publisher’s Note: The statements, opinions and data contained in all publications are solely those of the individual author(s) and contributor(s) and not of MDPI and/or the editor(s). MDPI and/or the editor(s) disclaim responsibility for any injury to people or property resulting from any ideas, methods, instructions or products referred to in the content. |
© 2025 by the authors. Licensee MDPI, Basel, Switzerland. This article is an open access article distributed under the terms and conditions of the Creative Commons Attribution (CC BY) license (https://creativecommons.org/licenses/by/4.0/).