Article

Design and Implementation of a LiDAR-Based Inspection Device for the Internal Surveying of Subsea Pipelines

1
Naval University of Engineering, Wuhan 430033, China
2
School of Mechatronic Engineering, Central South University, Changsha 410083, China
*
Authors to whom correspondence should be addressed.
J. Mar. Sci. Eng. 2025, 13(11), 2141; https://doi.org/10.3390/jmse13112141
Submission received: 16 October 2025 / Revised: 3 November 2025 / Accepted: 7 November 2025 / Published: 12 November 2025

Abstract

Subsea pipelines are extensively utilized in transportation systems. Conducting regular and effective internal inspections of these pipelines to promptly identify internal defects and potential risks is of paramount importance to ensure safe operational practices. In response to the practical engineering requirements for the internal inspection of subsea pipelines, this paper presents the design of an inspection device capable of capturing point cloud data from pipelines with internal diameters of 100 mm and above and performing three-dimensional reconstruction through coding. This device clearly reveals internal pipeline defects and enables both qualitative and quantitative analyses. Upon designing the motion module, control system, and LiDAR-based detection module of the internal pipeline inspection device, the capacity to collect internal point cloud data and perform 3D reconstruction was achieved. An experimental prototype of the inspection device was manufactured and tested using a simulated pipeline constructed to replicate real-world conditions. An analysis of the inspection results demonstrates that the device can travel steadily inside the pipeline, and the collected point cloud data can be used for 3D reconstruction via coding, accurately and clearly displaying the internal 3D structure of the pipeline and its defects. This device provides a basis for the prediction of pipelines’ service lives.

1. Introduction

Subsea pipeline transportation offers significant advantages in the conveyance of gases and liquids, including a high capacity, reliability, speed, safety, and efficiency. However, external environmental factors, such as water currents and soil conditions, can subject these pipelines to corrosion, cracking, and depression. These issues not only compromise transport efficiency but also pose substantial safety hazards [1]. Consequently, it is imperative to employ effective methods for the regular inspection of pipelines to prevent accidental failures [2]. Figure 1 illustrates a cross-sectional view comparing the internal condition of a normal subsea pipeline against that of a corroded one, used to transport a mixture of petroleum, water, and certain gases. Existing pipeline inspection technologies are constrained by limitations in their practical engineering application, presenting significant challenges for survey operations. Manual inspection methods are not only time-consuming and labor-intensive but are also prone to oversight. While technology-assisted approaches offer alternatives, their effectiveness is often restricted by the realities of field deployment and the current state of technological development [3].
To address the aforementioned issues, current research focuses on utilizing various detection technologies, such as electromagnetic testing, acoustic testing, and machine vision inspection, to identify internal pipeline defects [4,5]. Electromagnetic testing offers high sensitivity for the detection of surface or near-surface defects in metallic pipelines; it boasts rapid inspection speeds and requires no coupling agent. However, its application is limited to metallic materials; it has a low detection rate for deep-seated defects; and its efficacy is easily affected by the pipe wall thickness and geometry [6]. Acoustic testing is capable of identifying deep-seated defects and leakage points; it is suitable for long-distance scanning and demonstrates good compatibility with non-metallic pipelines. However, it is susceptible to environmental noise, which can interfere with signals, and it involves complex data analysis, with poor real-time performance [7]. Machine vision inspection enables the intuitive visualization of defects. Nevertheless, it necessitates a clean and dry environment, fails under inadequate lighting conditions, and entails high equipment costs, as well as being sensitive to pipeline deformation [8]. Yun Liang [9] detected internal pipeline corrosion via in-line inspection using ultrasonic testing. Meanwhile, Zhe Liu [10] designed a magnetic flux leakage inspection device for subsea pipelines, with its measurement reliability and accuracy being experimentally verified. Meniconi, S. et al. [11,12] focused on the Trieste Submarine Pipeline. They first designed a test protocol for pressure wave generation using SDV; they then localized pipe wall degradation by integrating numerical and analytical models with on-site data—this approach was subsequently validated via diving inspections. Cawley, P. [13] employed ultrasonic-guided waves with frequencies below 100 kHz. By controlling wave modes and coherent noise, he achieved the inspection of pipelines, rails, and other structures and extended this technology’s application to commercial pipeline systems. However, this method exhibits limitations in the inspection of complex structures and testing of high-attenuation systems. Davidson, R. [14] utilized various pig types, including mandrel-type and foam-type pigs. Driven by differential pressure, these pigs perform functions such as pipeline cleaning, diameter measurement, and fluid separation. Nevertheless, foam-type pigs suffer from rapid wear; intelligent pigs have poor real-time communication capabilities; and neither type is suitable for non-circular or multi-branch pipelines. Bohorquez, J. et al. [15] combined fluid transients with convolutional neural networks (CNNs). They incorporated stochastic resonance to optimize the noise intensity for model training, thereby realizing pipeline leak localization. This method, however, relies on the matching of numerical and experimental data, remains unverified in looped pipeline network scenarios, and shows reduced accuracy under large background pressure fluctuations. Covas, D. et al. [16] applied inverse transient analysis, coupled with a viscoelastic pipeline transient solver, for leak detection. However, this method requires precise knowledge of the pipeline’s physical properties, is ineffective under slow valve operations, and struggles to detect small leaks (<0.12 L/s). Mohapatra, P.K. et al. [17] adopted the frequency response method (FRM; based on a transfer matrix) to analyze steady-state oscillatory flow. They used peak patterns to determine the location of a single blockage and mean values to quantify the blockage size. However, this approach does not enable the identification of individual positions of multiple blockages; actual friction impedes peak identification; and the frictionless assumption does not reflect real-world conditions. Brockhaus, S. et al. [18] reviewed in-line inspection (ILI) technologies—including magnetic flux leakage (MFL), ultrasonic testing (UT), and electromagnetic acoustic transducers (EMATs)—for corrosion detection in underground pipelines. Among these, MFL has low sensitivity to shallow corrosion; UT requires liquid coupling; EMATs are costly; and none are applicable to non-metallic pipelines. Mpesha, W. et al. [19] used the frequency response method, generating an oscillatory flow via periodic valve opening and closing, and they localized leaks using secondary pressure peaks. This method demands pressure and flow rate measurements at valves, is incompatible with closed pipeline networks, and fails to detect micro-leaks (<0.5% of the average flow rate). Kazeminasab, S. et al. [20] reviewed pipeline robots, classifying their mechanical systems and summarizing tasks such as localization, mapping, navigation, and inspection. Pipeline robots, face challenges in navigating elbows/reducing pipes, are vulnerable to localization interference, and have poor detection capabilities for non-metallic pipelines. Liou, C. [21] analyzed transient pressure signals via the impulse response extraction method to localize leaks. It was shown that impulses are susceptible to noise interference; signal attenuation in long pipelines leads to weak responses; and the method has not been validated in multi-leak scenarios. Gazis, D.C. [22] established a three-dimensional (3D) analytical foundation for wave propagation in hollow cylinders, providing theoretical support for the ultrasonic-guided wave testing of pipelines. This work, however, was limited to theoretical derivation, did not integrate practical inspection scenarios, and is difficult to adapt to complex cross-sections.
In summary, the aforementioned technologies fail to facilitate the qualitative and quantitative analyses of defects. Consequently, scholars have proposed the use of laser technology for the detection of internal pipeline defects. This technology offers high detection accuracy and has promising development prospects. It not only facilitates the qualitative and quantitative analyses of defects but also enables the 3D visualization of the pipeline interior with the aid of computer technology [23]. Liu Xuxiang [24] addressed the detection of partial wear on the inner walls of narrow, fine oil pipes with small internal diameters by proposing a method that employs a point laser sensor to perform continuous circumferential measurements at different positions on the pipe’s inner wall. This approach involves reconstructing the 3D point cloud data of the pipeline’s internal surface and allows for both qualitative analysis and quantitative calculation. Li Yi et al. [25] tackled the issues of missed and false judgements occurring during the manual assessment of deformation-type defects in pipelines by introducing an automated identification method based on laser point cloud data. This method enables the identification of pipeline deformation defects through the calculation of relevant information from fitted ellipses to cross-sections of the pipe point cloud. Mario Montoya et al. [26] established a fully functional laser system based on a freeform laser profiling method, characterized by a high resolution, excellent precision, and fast acquisition speeds. Tina Tian et al. [27] integrated a monocular camera, an inertial sensor, a ring-shaped laser profiler, and LiDAR to achieve the colored 3D reconstruction of the internal pipeline surface.
The current work presents the design of an internally navigable pipeline inspection device. The apparatus is equipped with a LiDAR sensor that acquires and transmits internal 3D point cloud data in real time during axial traversal. Subsequently, a 3D reconstruction algorithm is used to process the collected data to generate detailed internal models of pipelines with internal diameters ≥100 mm. In contrast to the aforementioned inspection techniques, the proposed method not only enables the comprehensive visualization of the internal pipeline condition for qualitative and quantitative defect analysis but also incorporates an integrated, modular design. This results in a compact, lightweight, and portable system, thereby enhancing the ease and practicality of routine pipeline operation and maintenance.

2. Overall Design of Subsea Pipeline Inspection Device

2.1. Overall Design Scheme

Considering the practical conditions and the inspection requirements for subsea pipelines, the proposed device must fulfil several criteria. Firstly, it must achieve stable locomotion within the complex internal pipeline environment. Secondly, it must ensure the stable operation of the onboard LiDAR system. Thirdly, it must be capable of collecting internal point cloud data for subsequent 3D reconstruction. Fourthly, it should be applicable to pipelines with an internal diameter of 100 mm and above. Finally, the device needs to be compact, lightweight, and portable.
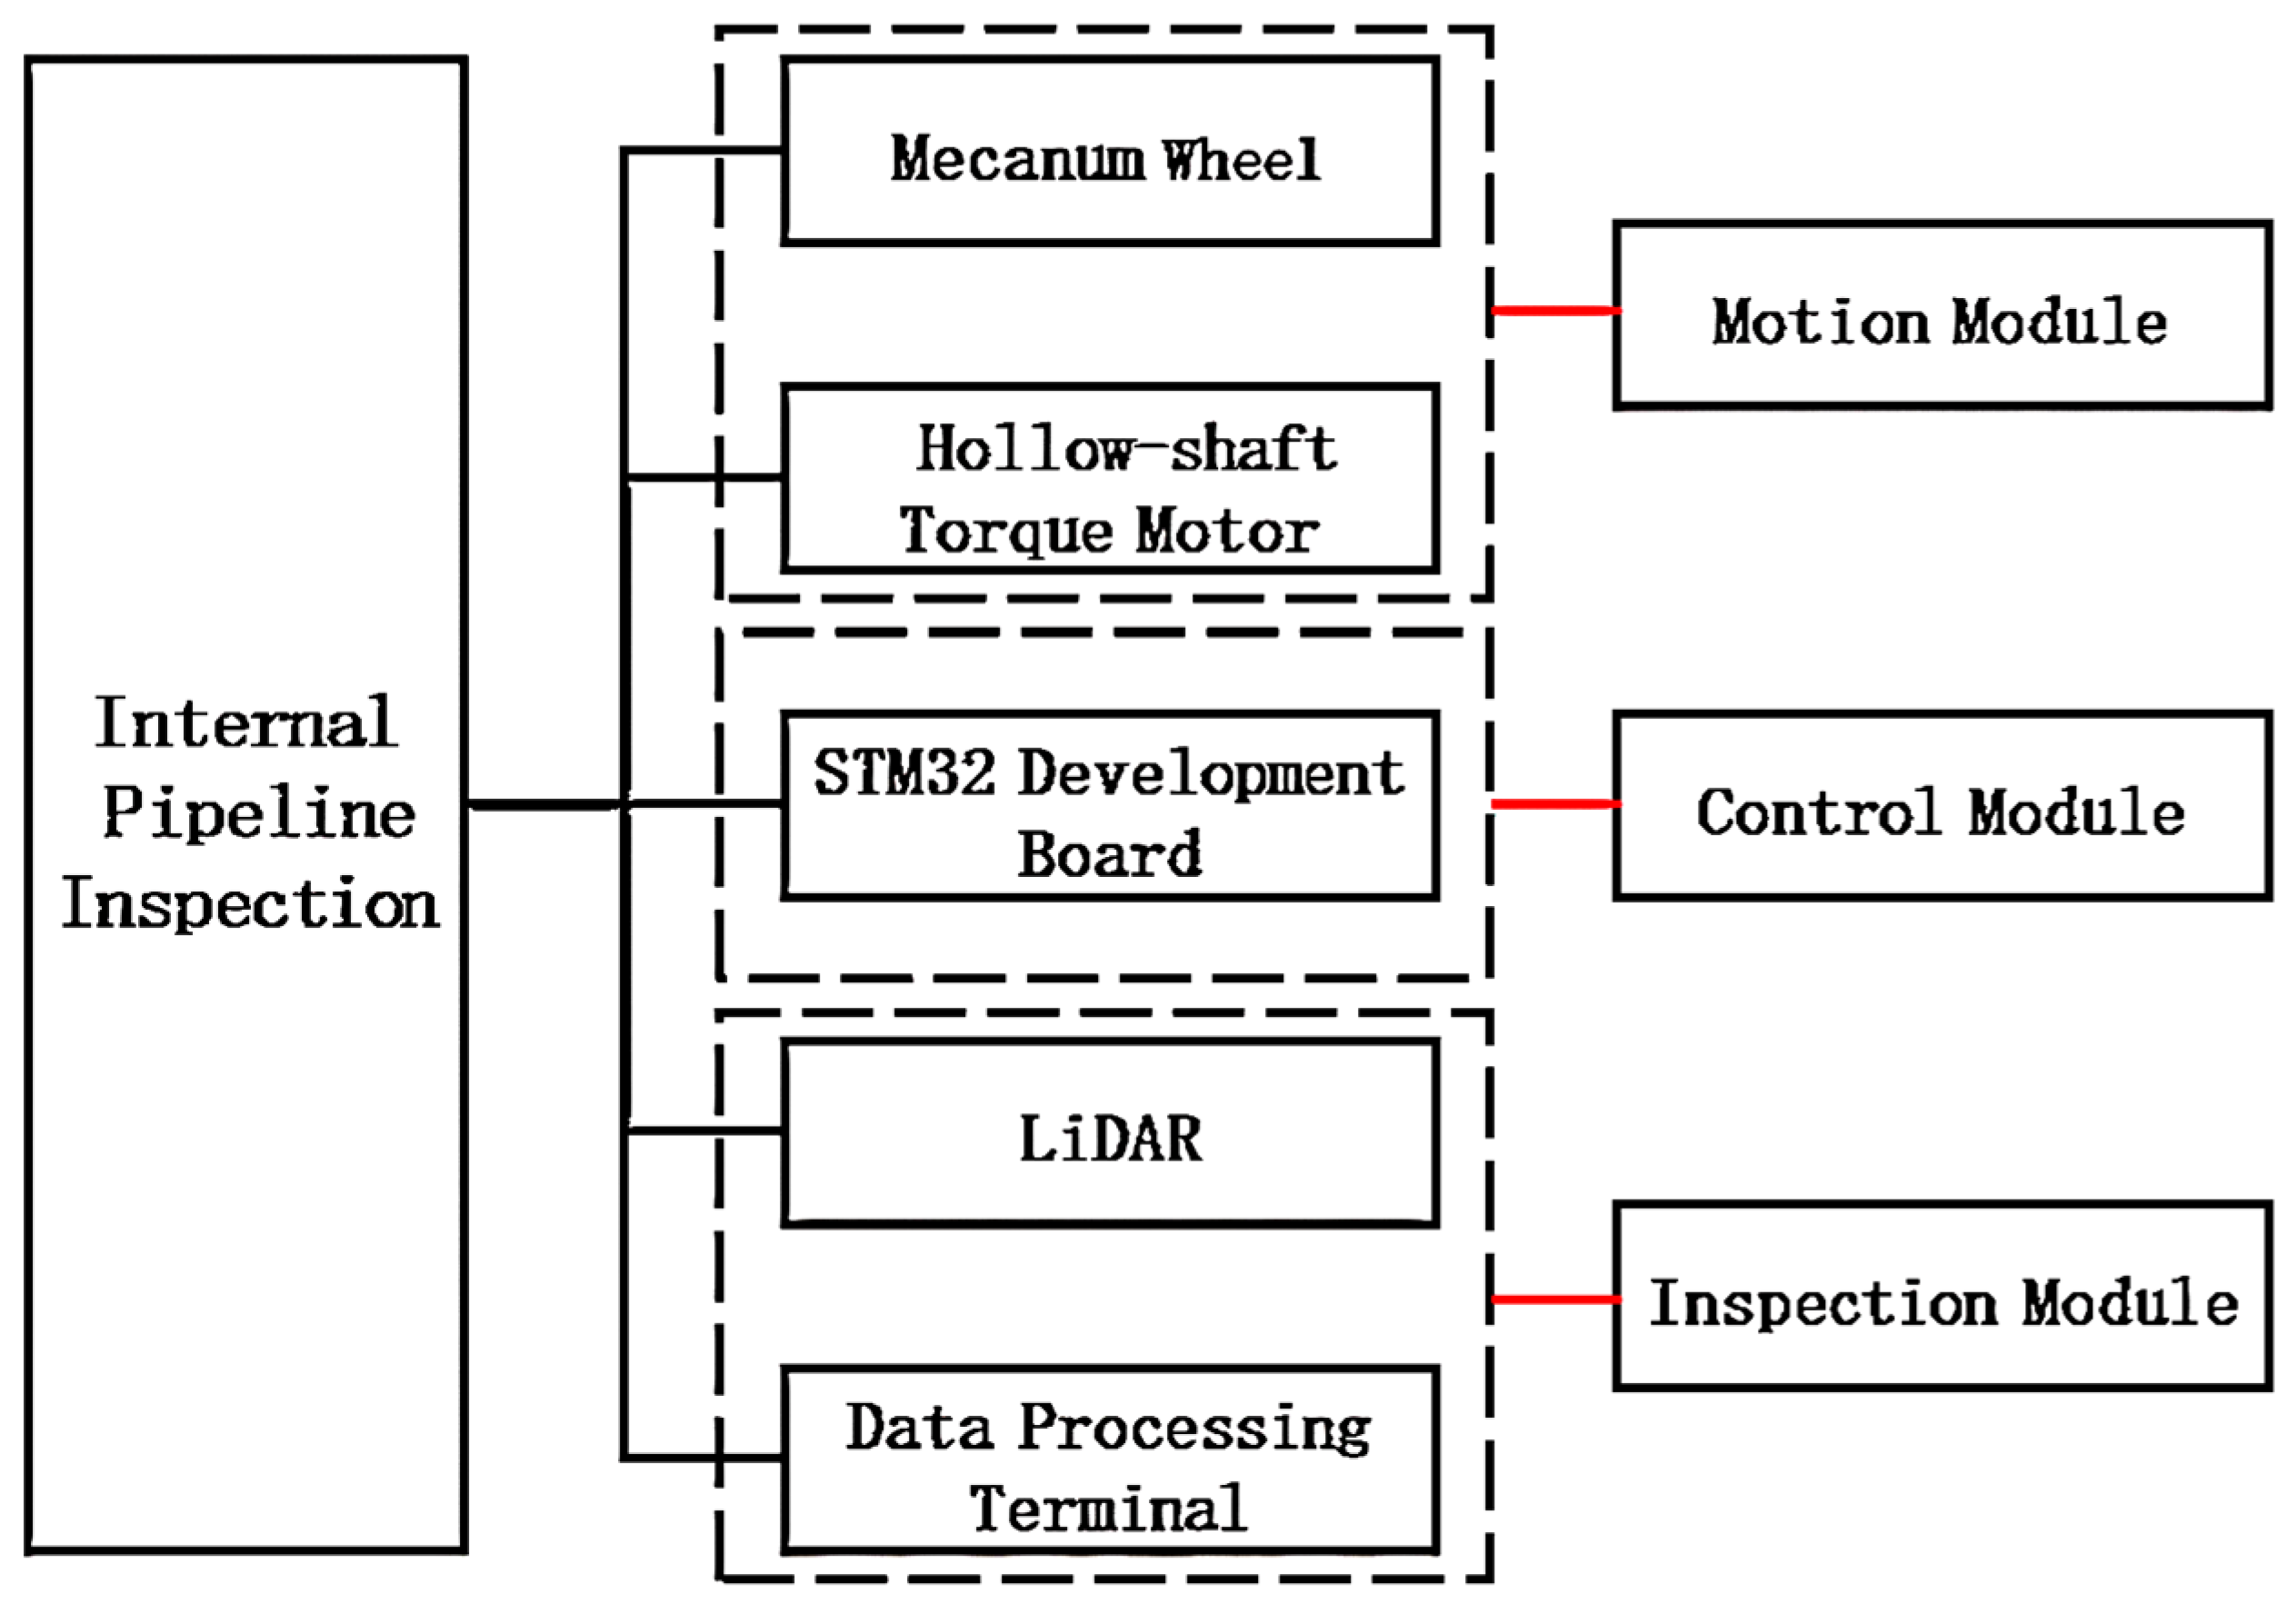
To guarantee the stability of the inspection device and the reliability of the acquired data, the internal subsea pipeline inspection apparatus presented in this paper is divided into three modules: the locomotion module, the control system, and the detection module. The locomotion structure employs a combination of a hollow-shaft torque motor and Mecanum wheels. The control system utilizes an STM32 development board as its platform, implementing PID control algorithms to enable the autonomous movement of the inspection device. The detection module consists of a LiDAR sensor for point cloud data acquisition. The acquired point cloud data are transmitted to a data processing terminal for 3D reconstruction. The overall design scheme is illustrated in Figure 2.
The 3D model of the inspection device is shown in Figure 3. The device is broadly divided into two main parts: the locomotion module and the LiDAR unit. The locomotion module serves as the moving platform for the device, responsible for ensuring stable movement and maintaining central alignment within the pipe. The two Mecanum wheels are connected by a linking rod. The LiDAR unit is responsible for measuring the point cloud data of the internal bore. Furthermore, the STM32 development board is housed within the central cavity of the Mecanum wheel assembly. Wiring connects the various components through the through-hole of the hollow-shaft torque motor. Considering the constraints of the actual operating space, a custom-designed 12 V power supply is employed. This flat-shaped power system is mounted, along with the development board, within the central cavity of the Mecanum wheel assembly.

2.2. Locomotion Module Design

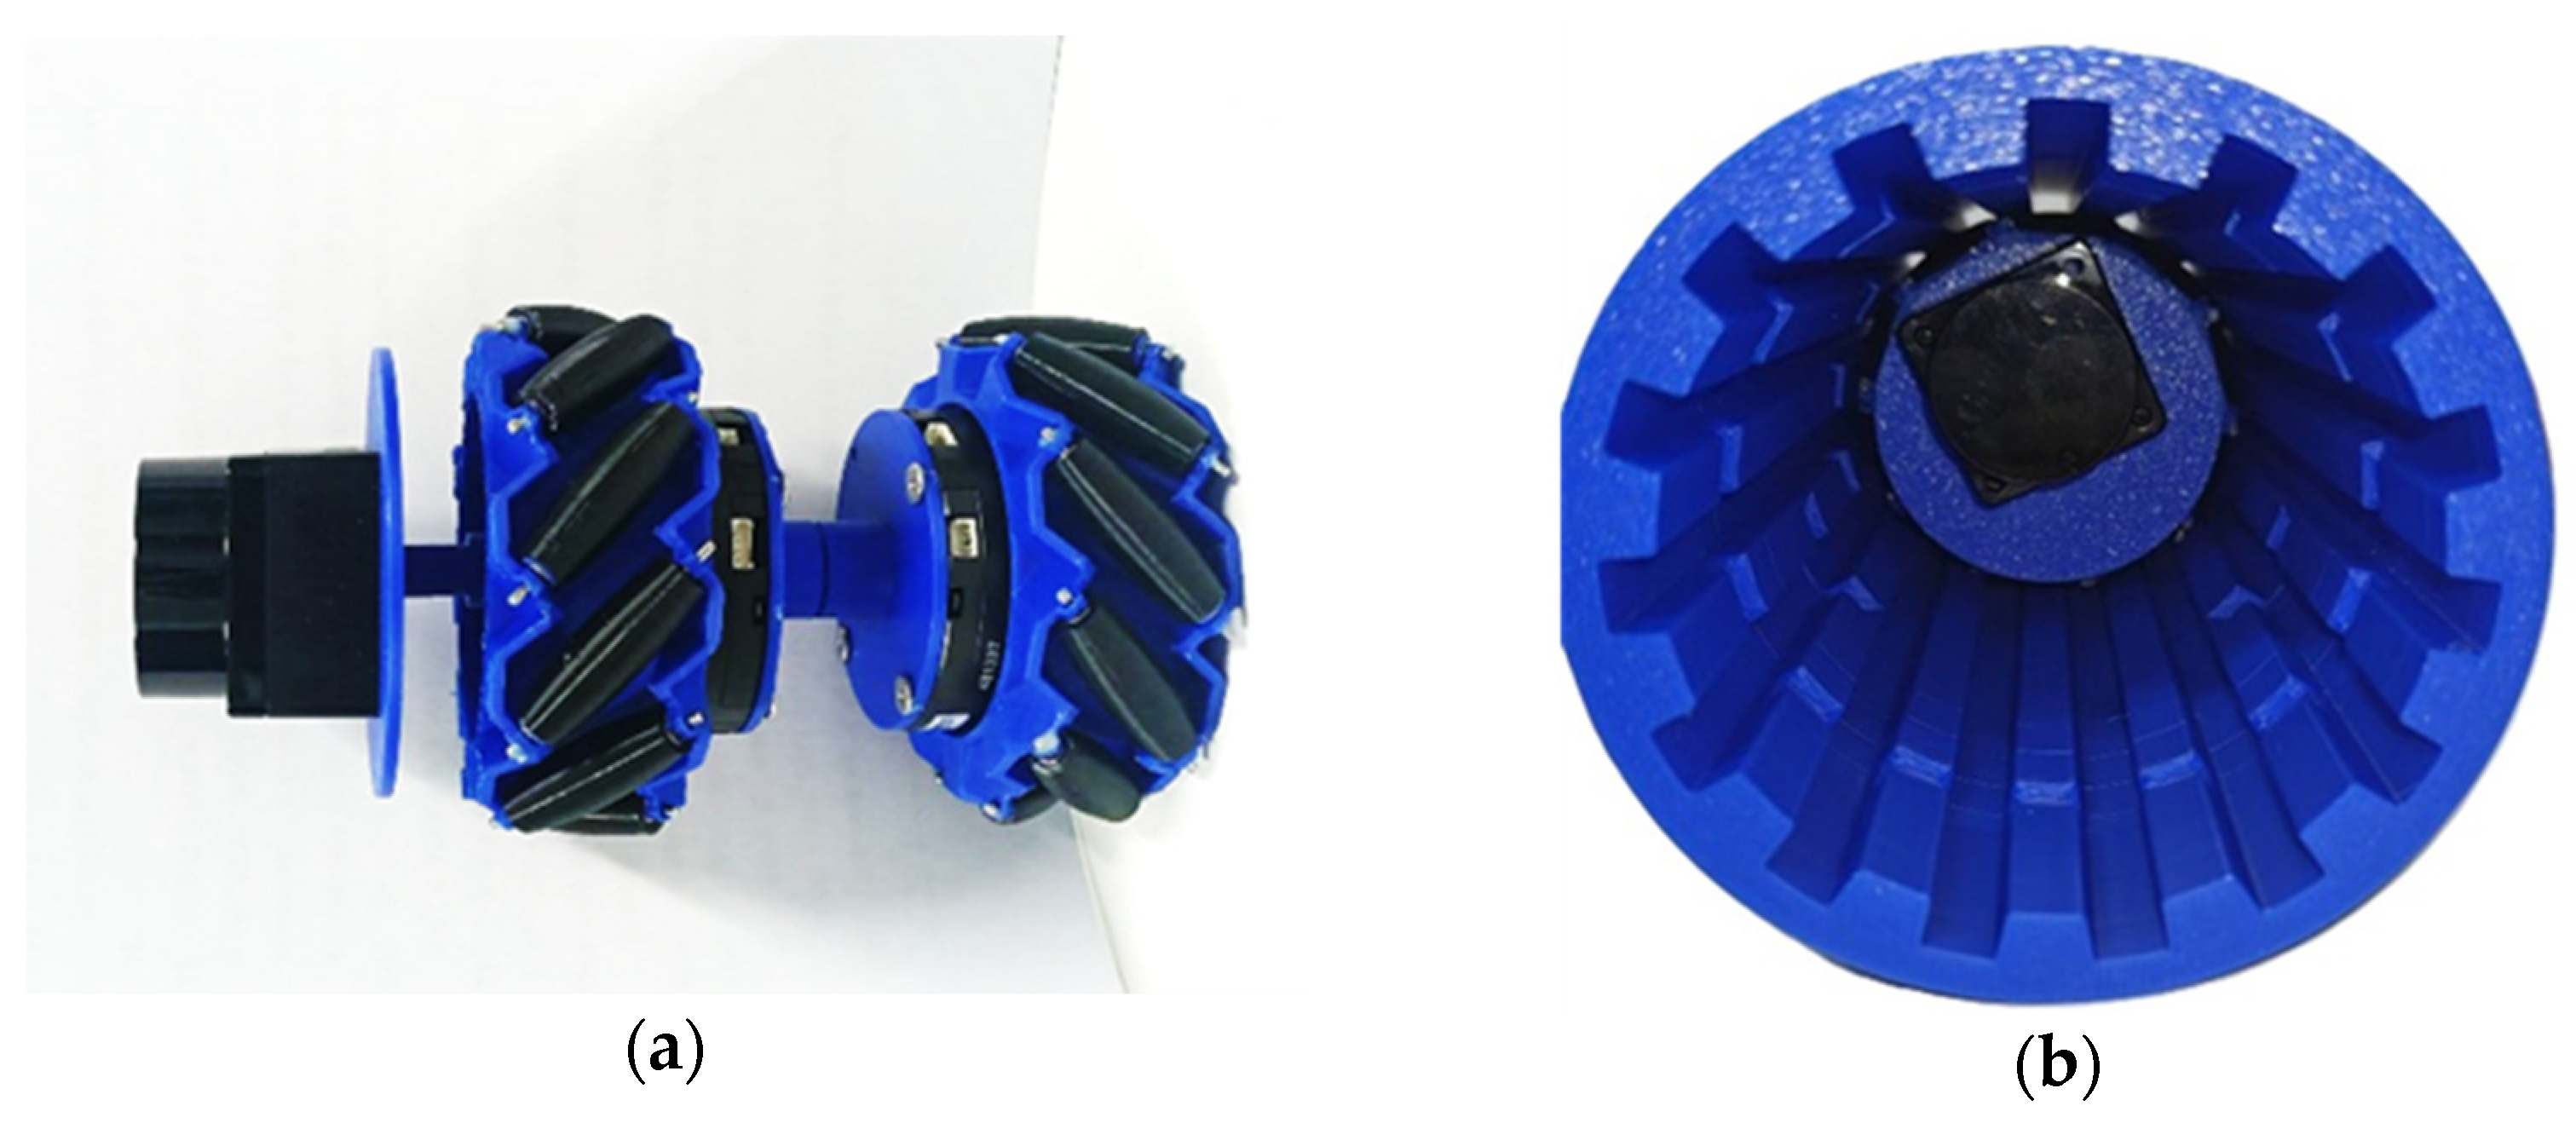
Conventional architectures for in-pipe locomotion typically employ either wheeled or linkage-based mechanisms. Wheeled systems propel themselves through motor-driven wheels engaging the pipe inner wall, offering continuous and efficient motion. Their design is relatively simple and allows for high traversal speeds; however, they exhibit poor adaptability to irregular pipe geometries and obstacles, with their traction being highly dependent on the friction between the wheels and the pipe surface. In contrast, linkage-based mechanisms, often inspired by the biomechanics of organisms such as inchworms, achieve peristaltic crawling through the alternating extension, contraction, and locking of multiple body joints. This inchworm-like, step-by-step locomotion is characterized by relatively low speeds but demonstrates exceptional terrain adaptability and obstacle-crossing capabilities, making it particularly suitable for complex pipeline environments. To overcome the limitations of traditional locomotion systems [28], a novel structure integrating a hollow-shaft torque servo motor with Mecanum wheels [29] was designed. One hollow-shaft torque motor and one Mecanum wheel constitute a single locomotion module. The device incorporates two such modules connected in series at the front and rear. The structure of the locomotion module is depicted in Figure 4.
Within the module, (1) denotes the Mecanum wheel hub, which serves to fix the rollers, bear the load, and ensure the proper movement of the Mecanum wheel. Meanwhile, (2) refers to the Mecanum wheel rollers, which are the primary components responsible for the wheel’s movement. They provide the driving force for the device and, crucially, ensure the central alignment of the inspection device within the pipeline. Next, (3) is the hollow-shaft torque motor, responsible for driving the Mecanum wheel, and (4) is the motor sleeve, which connects the rotor of the hollow-shaft torque motor to the Mecanum wheel hub, ensuring the effective transmission of torque from the motor. The synergistic operation of these four components guarantees the central alignment of the inspection device.

2.3. LiDAR and Control Board Selection

The front end of the internal pipeline inspection device is equipped with a LiDAR sensor, serving as the detection module to acquire internal point cloud data. The following key factors were considered during the component selection process: (1) the accuracy requirements for data acquisition; (2) the measurement range of the LiDAR; (3) the physical dimensions of the LiDAR unit; (4) its power supply requirements; and (5) the data transmission specifications.
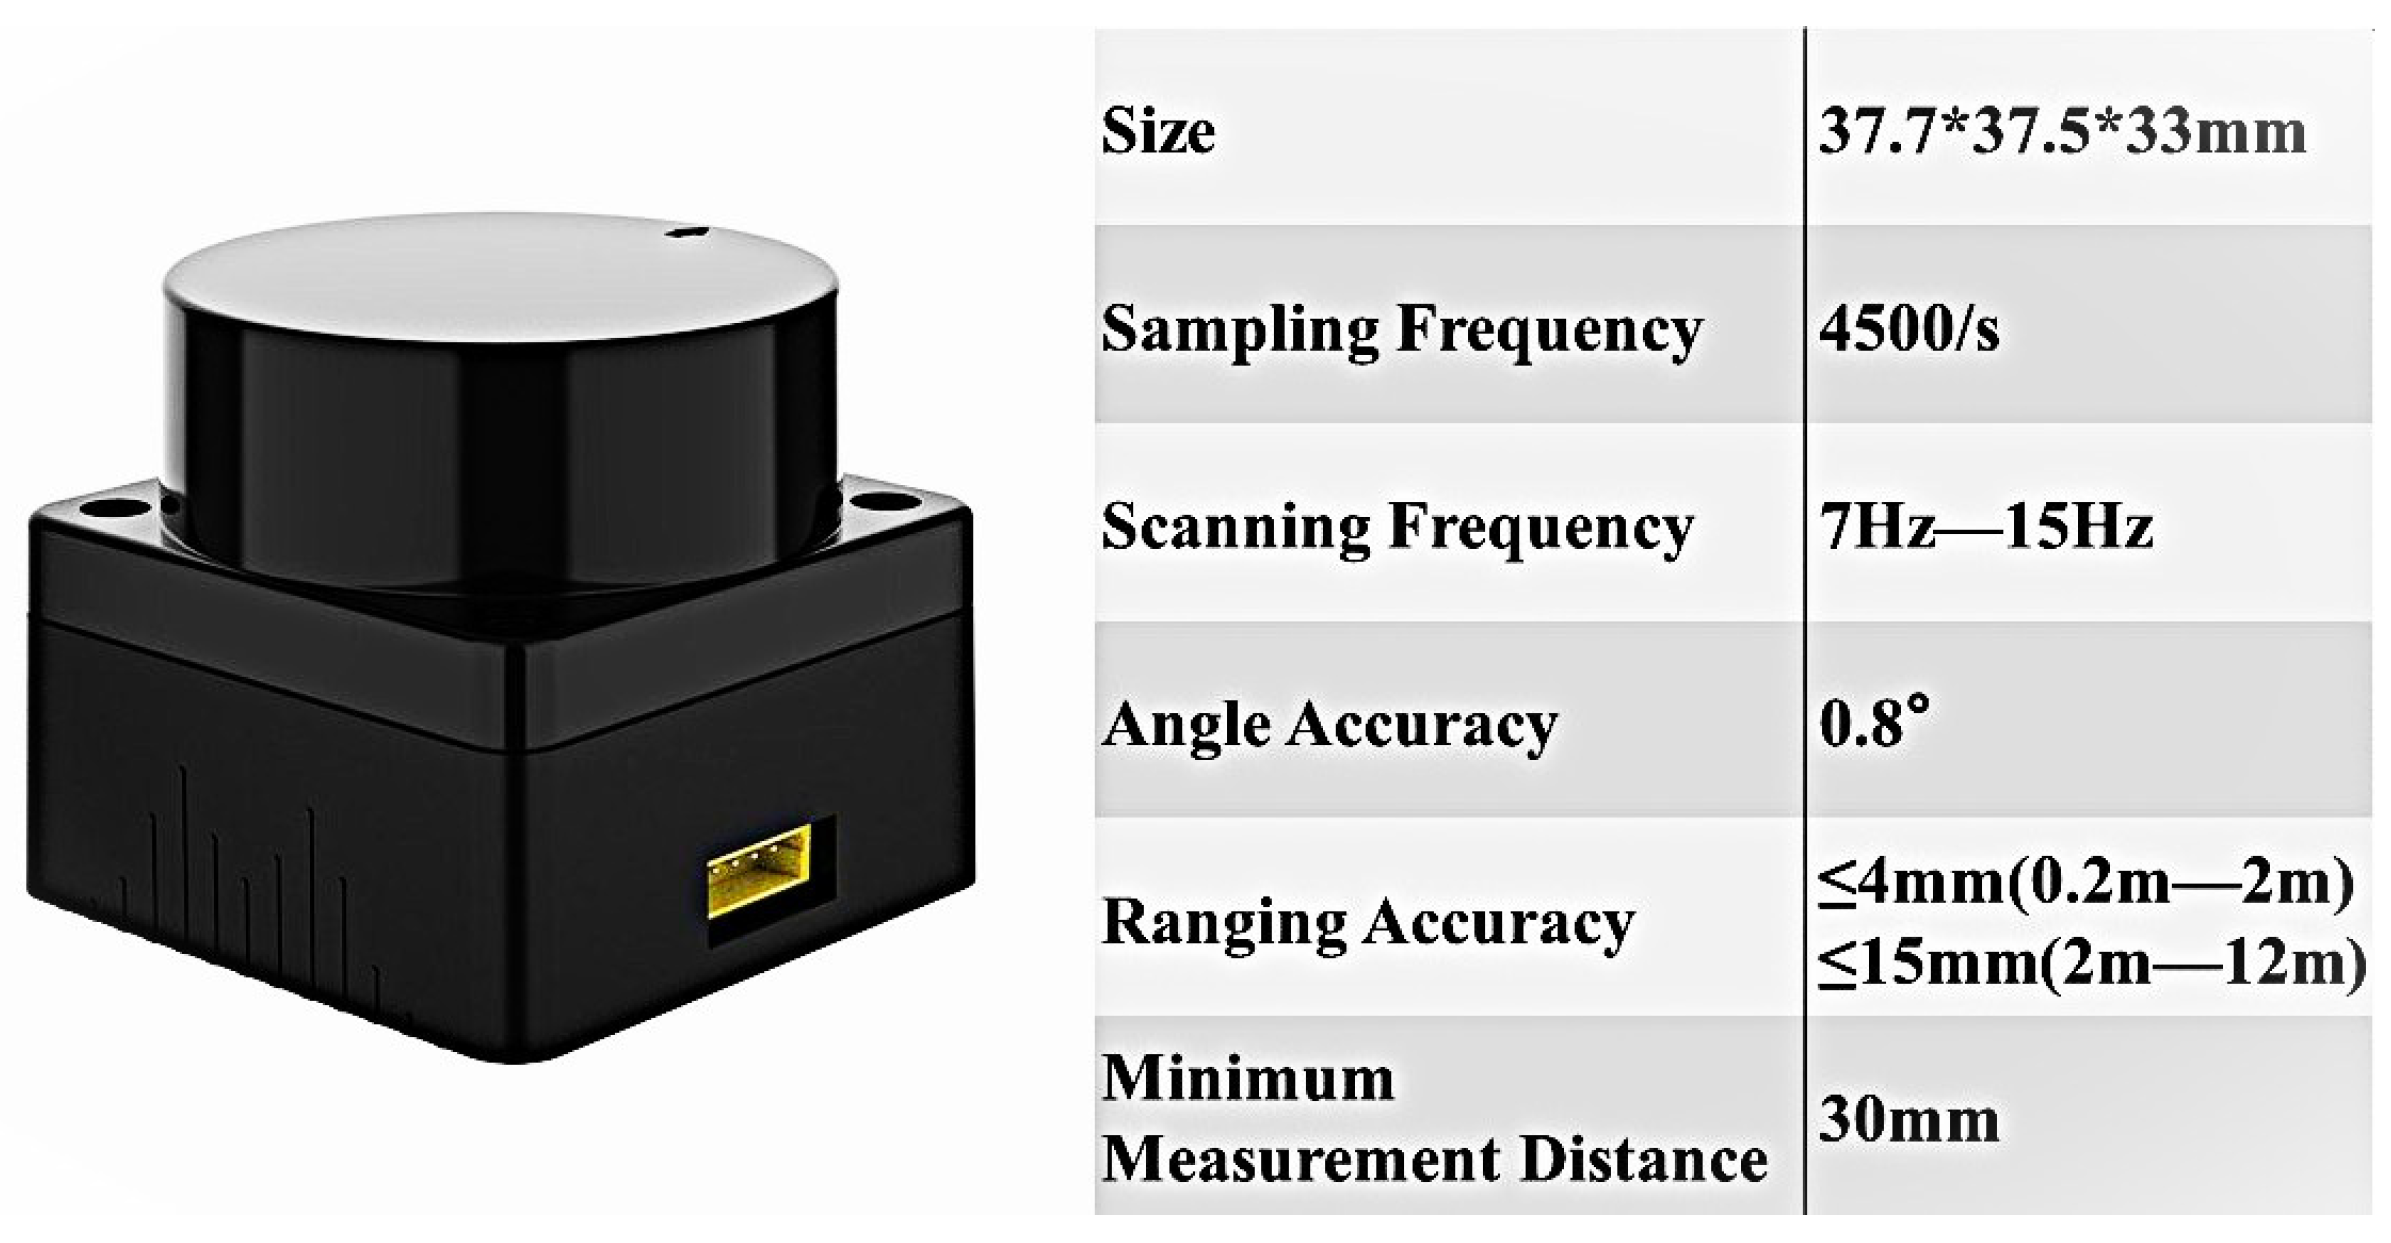
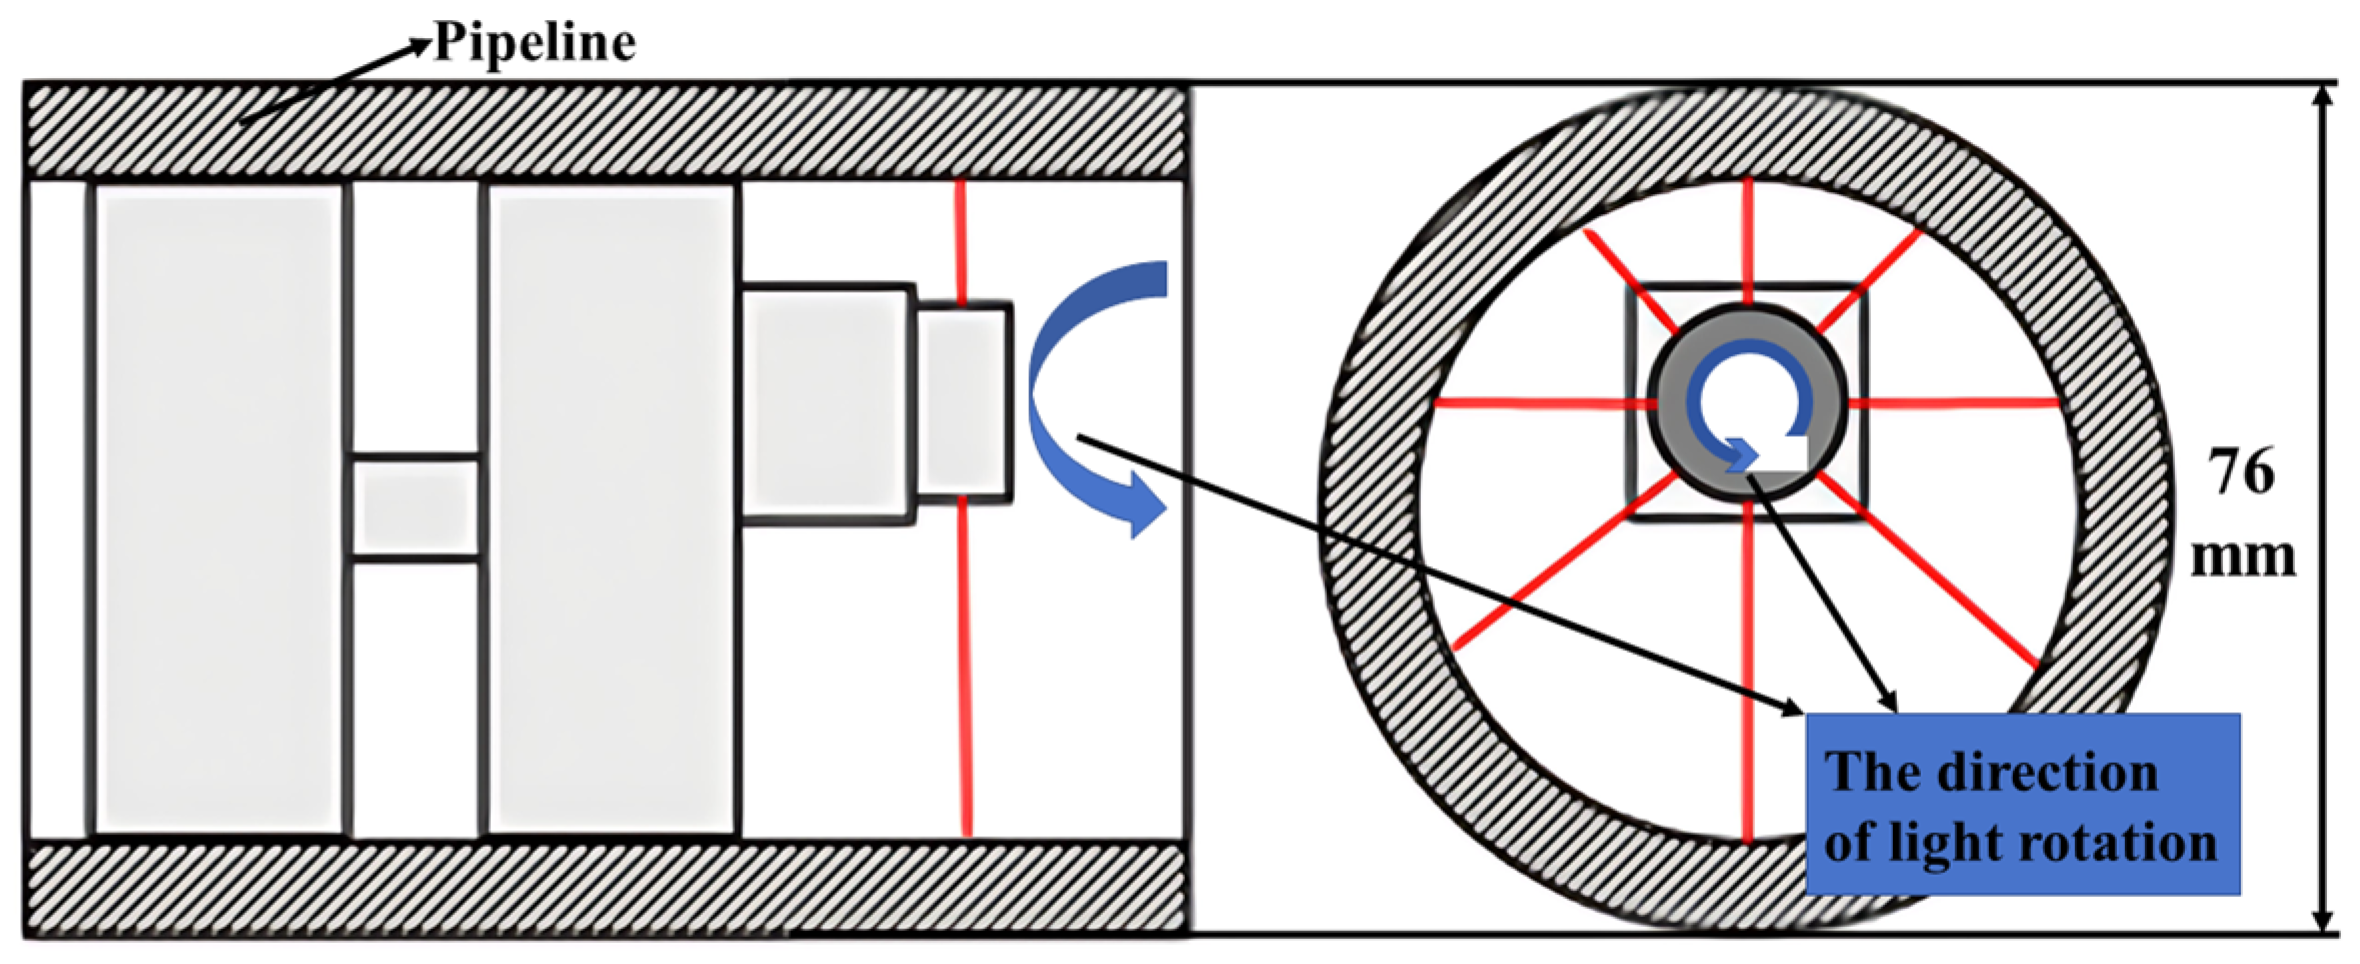
After the comprehensive evaluation of these factors, the Orbbec MS200 LiDAR was selected, which is shown in Figure 5. This LiDAR operates based on the time-of-flight (ToF) ranging principle. It has a diameter not exceeding 40 mm, a weight of only 40 g, a measurement range of 0.03 m to 12 m, and a sampling frequency of 4500 points per second. These specifications ensure that sufficient point cloud data can be collected within a short time period. During operation, the LiDAR scans the pipeline interior to collect data. The acquired point cloud data are received by a data acquisition program on the processing terminal for subsequent analysis. Since the LiDAR’s minimum measurement distance is 30 mm, it was installed with an offset (eccentric mounting), as illustrated in Figure 6, to avoid any blind spots in the measurement field.
Since the LiDAR was required to acquire internal point cloud data while the inspection device is in motion, it was necessary to regulate the device’s step length and velocity. A development board was therefore adopted as the control center to manage both the motors and the LiDAR. Considering the confined internal space of the pipeline, an STM32 development board was selected for its high level of integration and compact dimensions. The STM32 board, which utilizes an ARM core, offers high performance, low power consumption, and excellent expandability, making it suitable for a variety of application scenarios. Power is supplied to the motors, and their operation is controlled via a booster module connected to the development board. The development board also interfaces with the LiDAR to manage data acquisition. The control algorithm implemented for the pipeline inspection device is a proportional–integral–derivative (PID) control algorithm.

3. Simulation Verification

Following the completion of the internal pipeline inspection device model, a kinematic simulation analysis was conducted to verify the feasibility of the device’s movement within the pipeline and to analyze the stability of its motion. Using the ADAMS 2020 software, a pipeline internal model was established based on realistic operational conditions. The model incorporated multiple straight grooves, stepped grooves, and irregular recesses to simulate internal surface anomalies. The inspection device model was then positioned within this pipeline environment for simulation analysis. The overall assembly model is presented in Figure 7.
According to the movement mode of the internal pipeline inspection device, as specified in the design scheme, torque is provided to the device’s motor to drive it forward, causing the motor to rotate the Mecanum wheels. Rolling constraints are set between the rollers of the Mecanum wheels and the inner wall of the pipeline. After the motor operates, the inspection device travels inside the pipeline; thus, the kinematic simulation of the device’s movement process could be successfully completed. The vibrational accelerations of the inspection device in the X, Y, and Z directions during travel were analyzed to evaluate its motion stability. The simulation results show that the internal pipeline inspection device can move at a constant speed inside the pipeline.

4. Experimental Validation

To validate the practical feasibility of the internal pipeline inspection device, practical traversal and data acquisition experiments were conducted. The inspection device was deployed inside a pipeline for testing, allowing the observation of its motion behavior and the operational status of the LiDAR. Point cloud data acquired by the LiDAR were collected for subsequent processing.
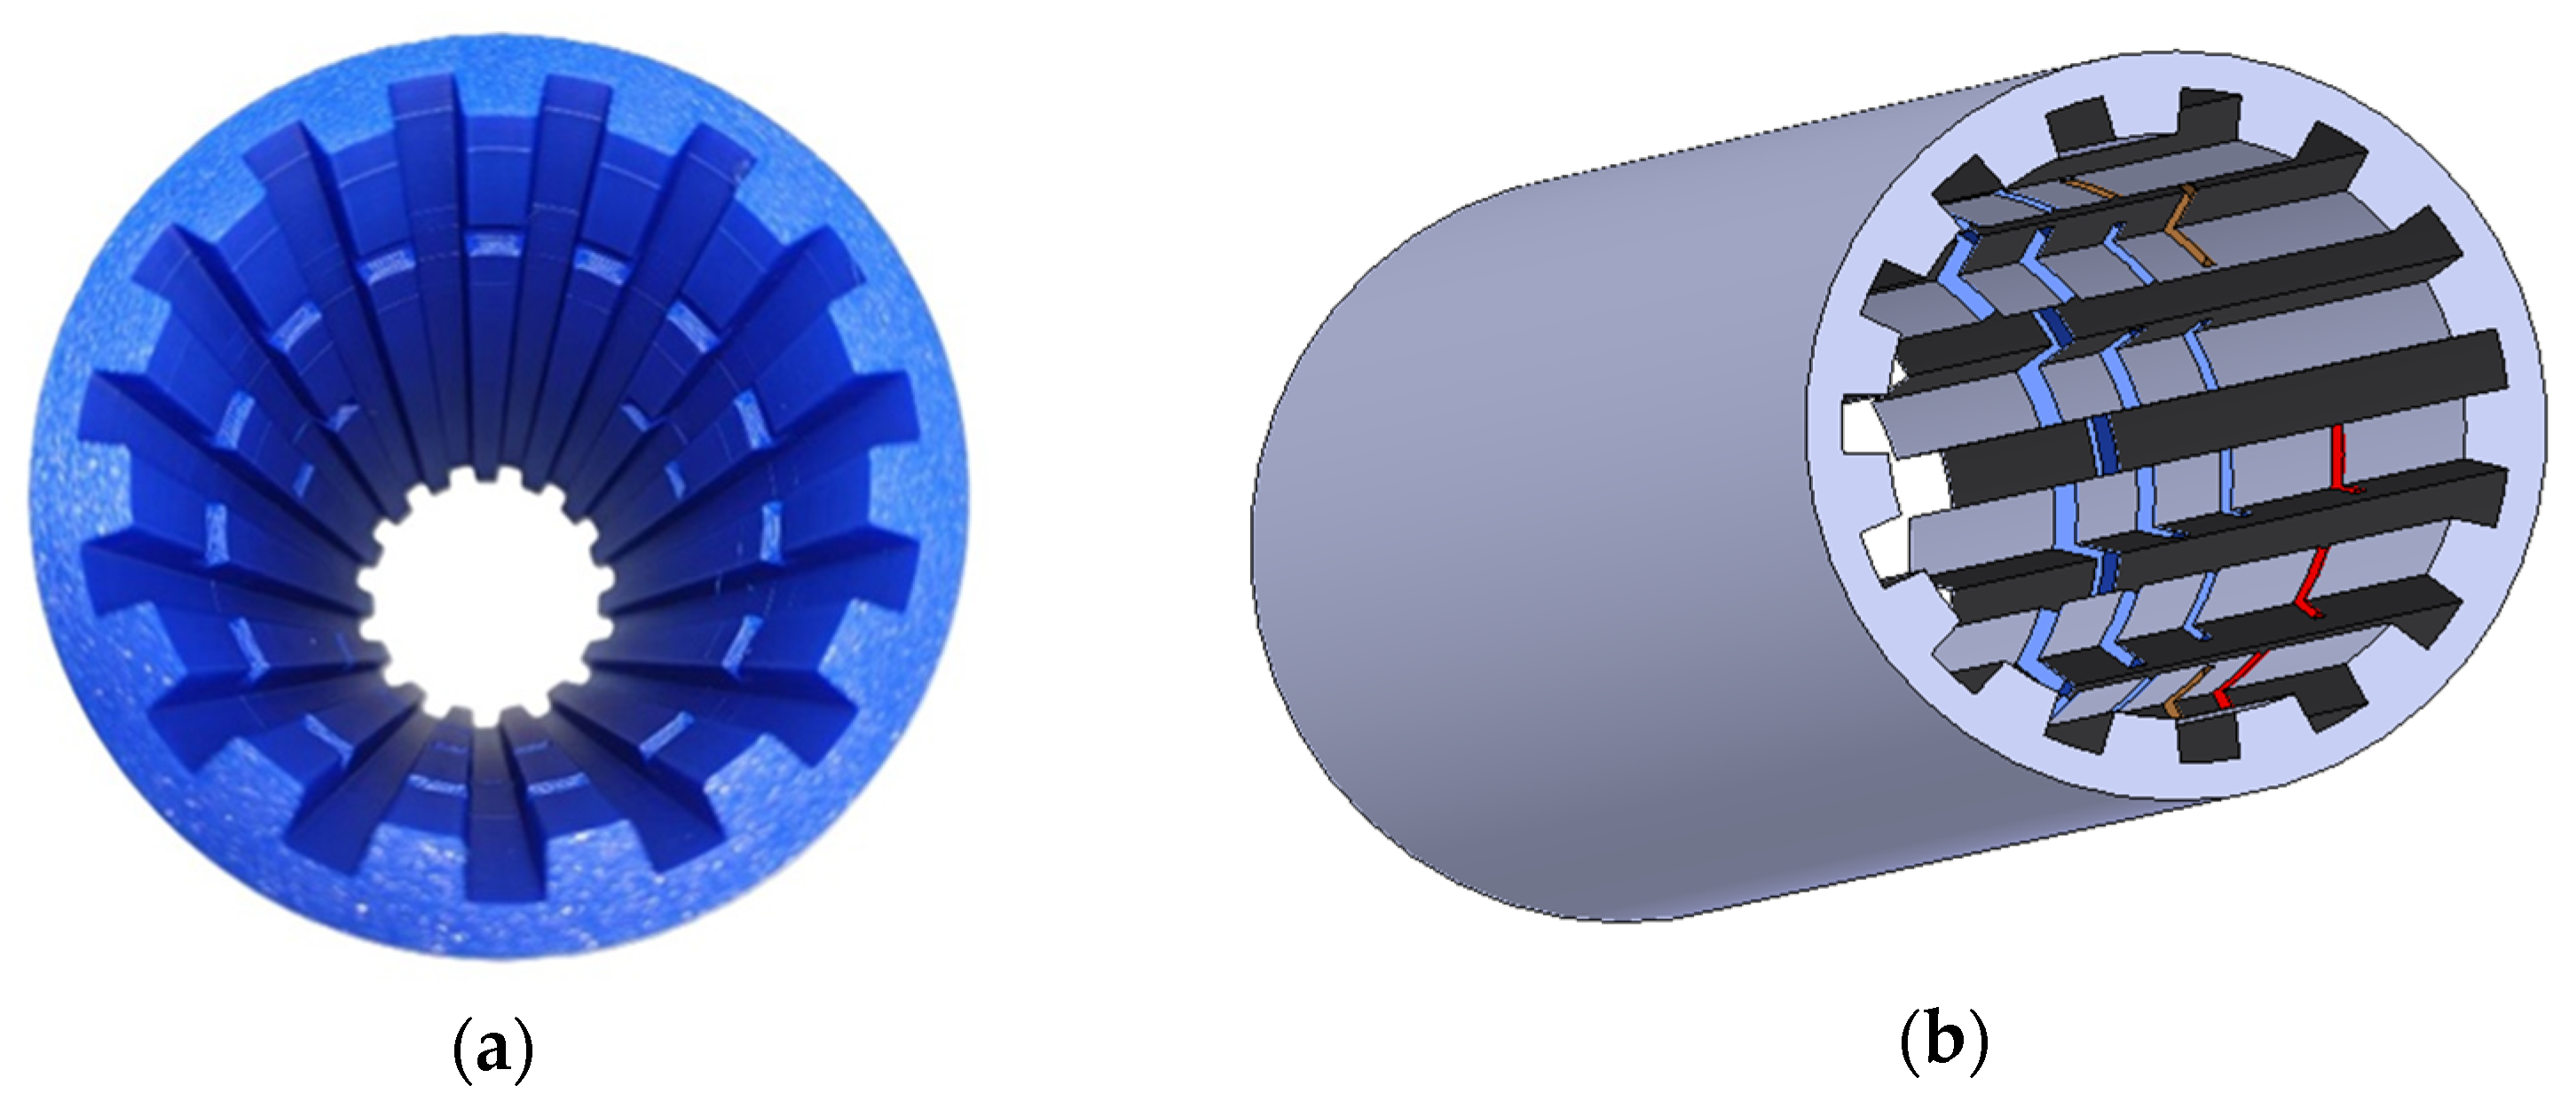
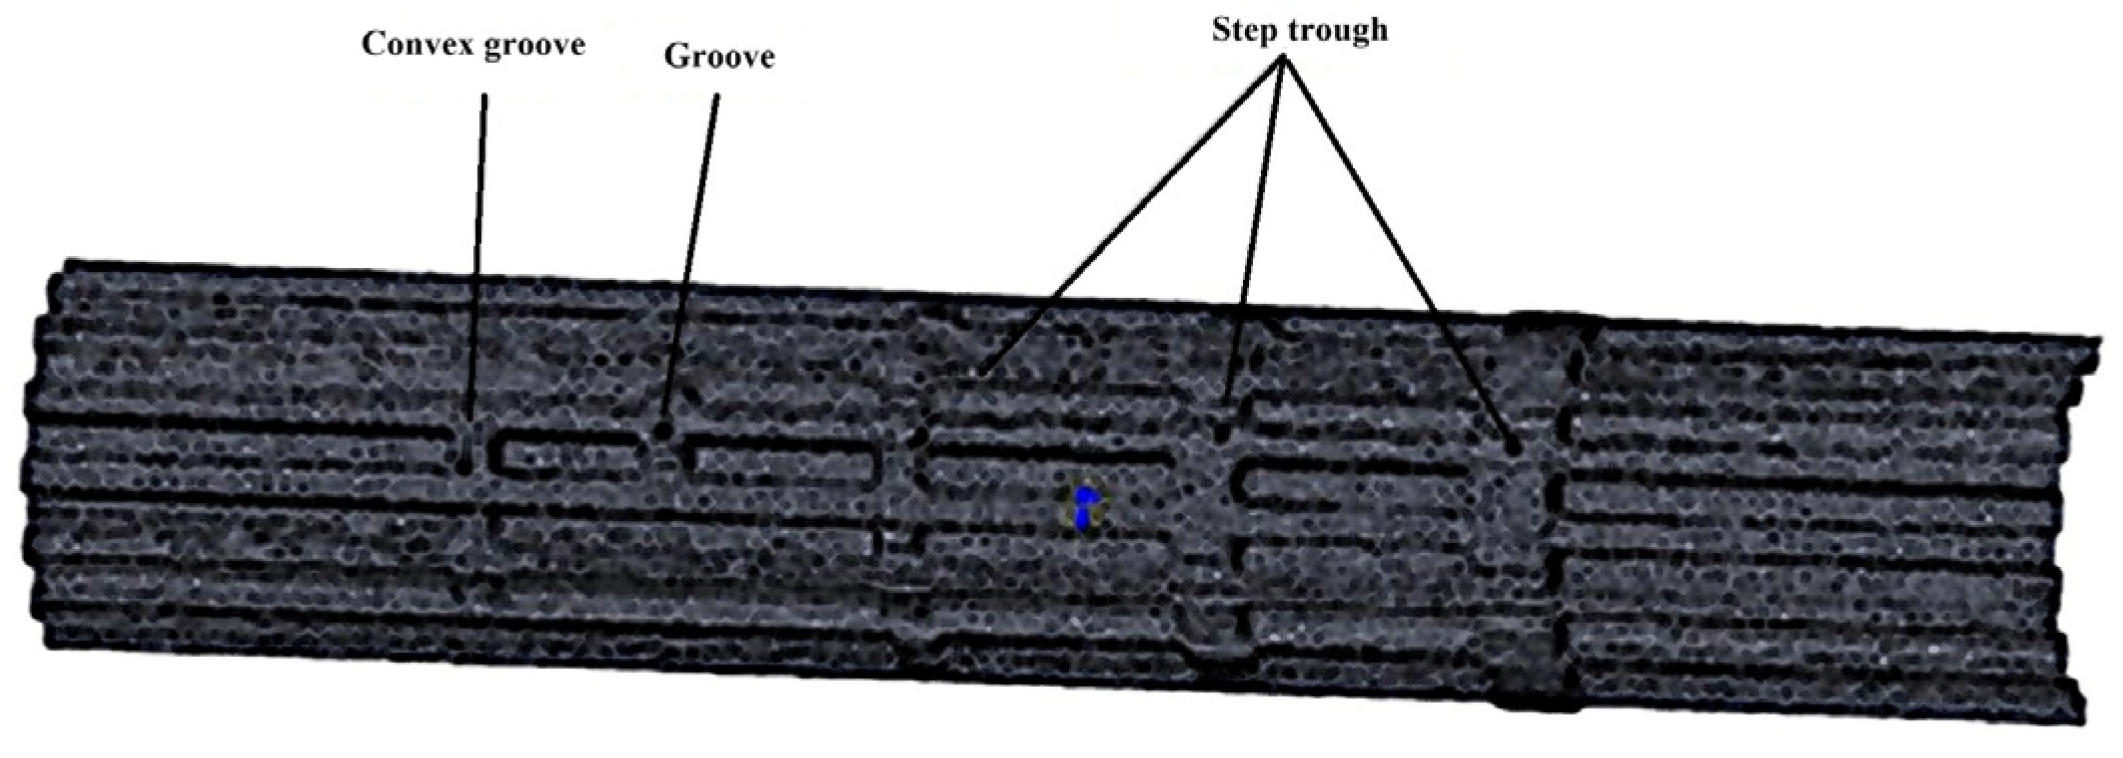
The inspection experiment required a section of a pipeline and a prototype of the inspection device. Considering the practical difficulties associated with measurement inside actual pipelines, an internal pipeline model was fabricated to simulate the complex internal conditions. This model, featuring a 100 mm internal diameter and incorporating linear grooves, a stepped groove, and irregular depressions, was produced using 3D printing and is shown in Figure 8. A photograph of the physical inspection device and the non-contact measurement data acquisition process during operation are presented in Figure 9.
The specific data acquisition procedure is as follows:
(1)
Device Advancement: The inspection device advances while the LiDAR remains in standby mode. The STM32 development board, utilizing a PID control algorithm, governs the device’s movement, controlling its progression in precise increments of 0.5 mm according to preset parameters.
(2)
Device Halt and Data Acquisition: The device halts, and the LiDAR acquires point cloud data. Following the cessation of the hollow-shaft torque motors, the host computer triggers the LiDAR to operate to capture the point cloud information.
(3)
Data Transmission and Resumption: Upon completion of the scan, the LiDAR transmits the acquired point cloud data back to the host computer. The host computer then commands the LiDAR to cease operation, and the inspection device resumes its advancement based on the programmed instructions.
(4)
Process Iteration: The cycle described above (steps 1–3) is repeated iteratively. This process accumulates point cloud data for a specific length of the pipeline’s internal bore.
(5)
Post-Processing and Reconstruction: After data acquisition is complete, the inspection device is retrieved from the pipeline. The collected data undergo preprocessing and subsequent 3D reconstruction through a dedicated data processing algorithm.
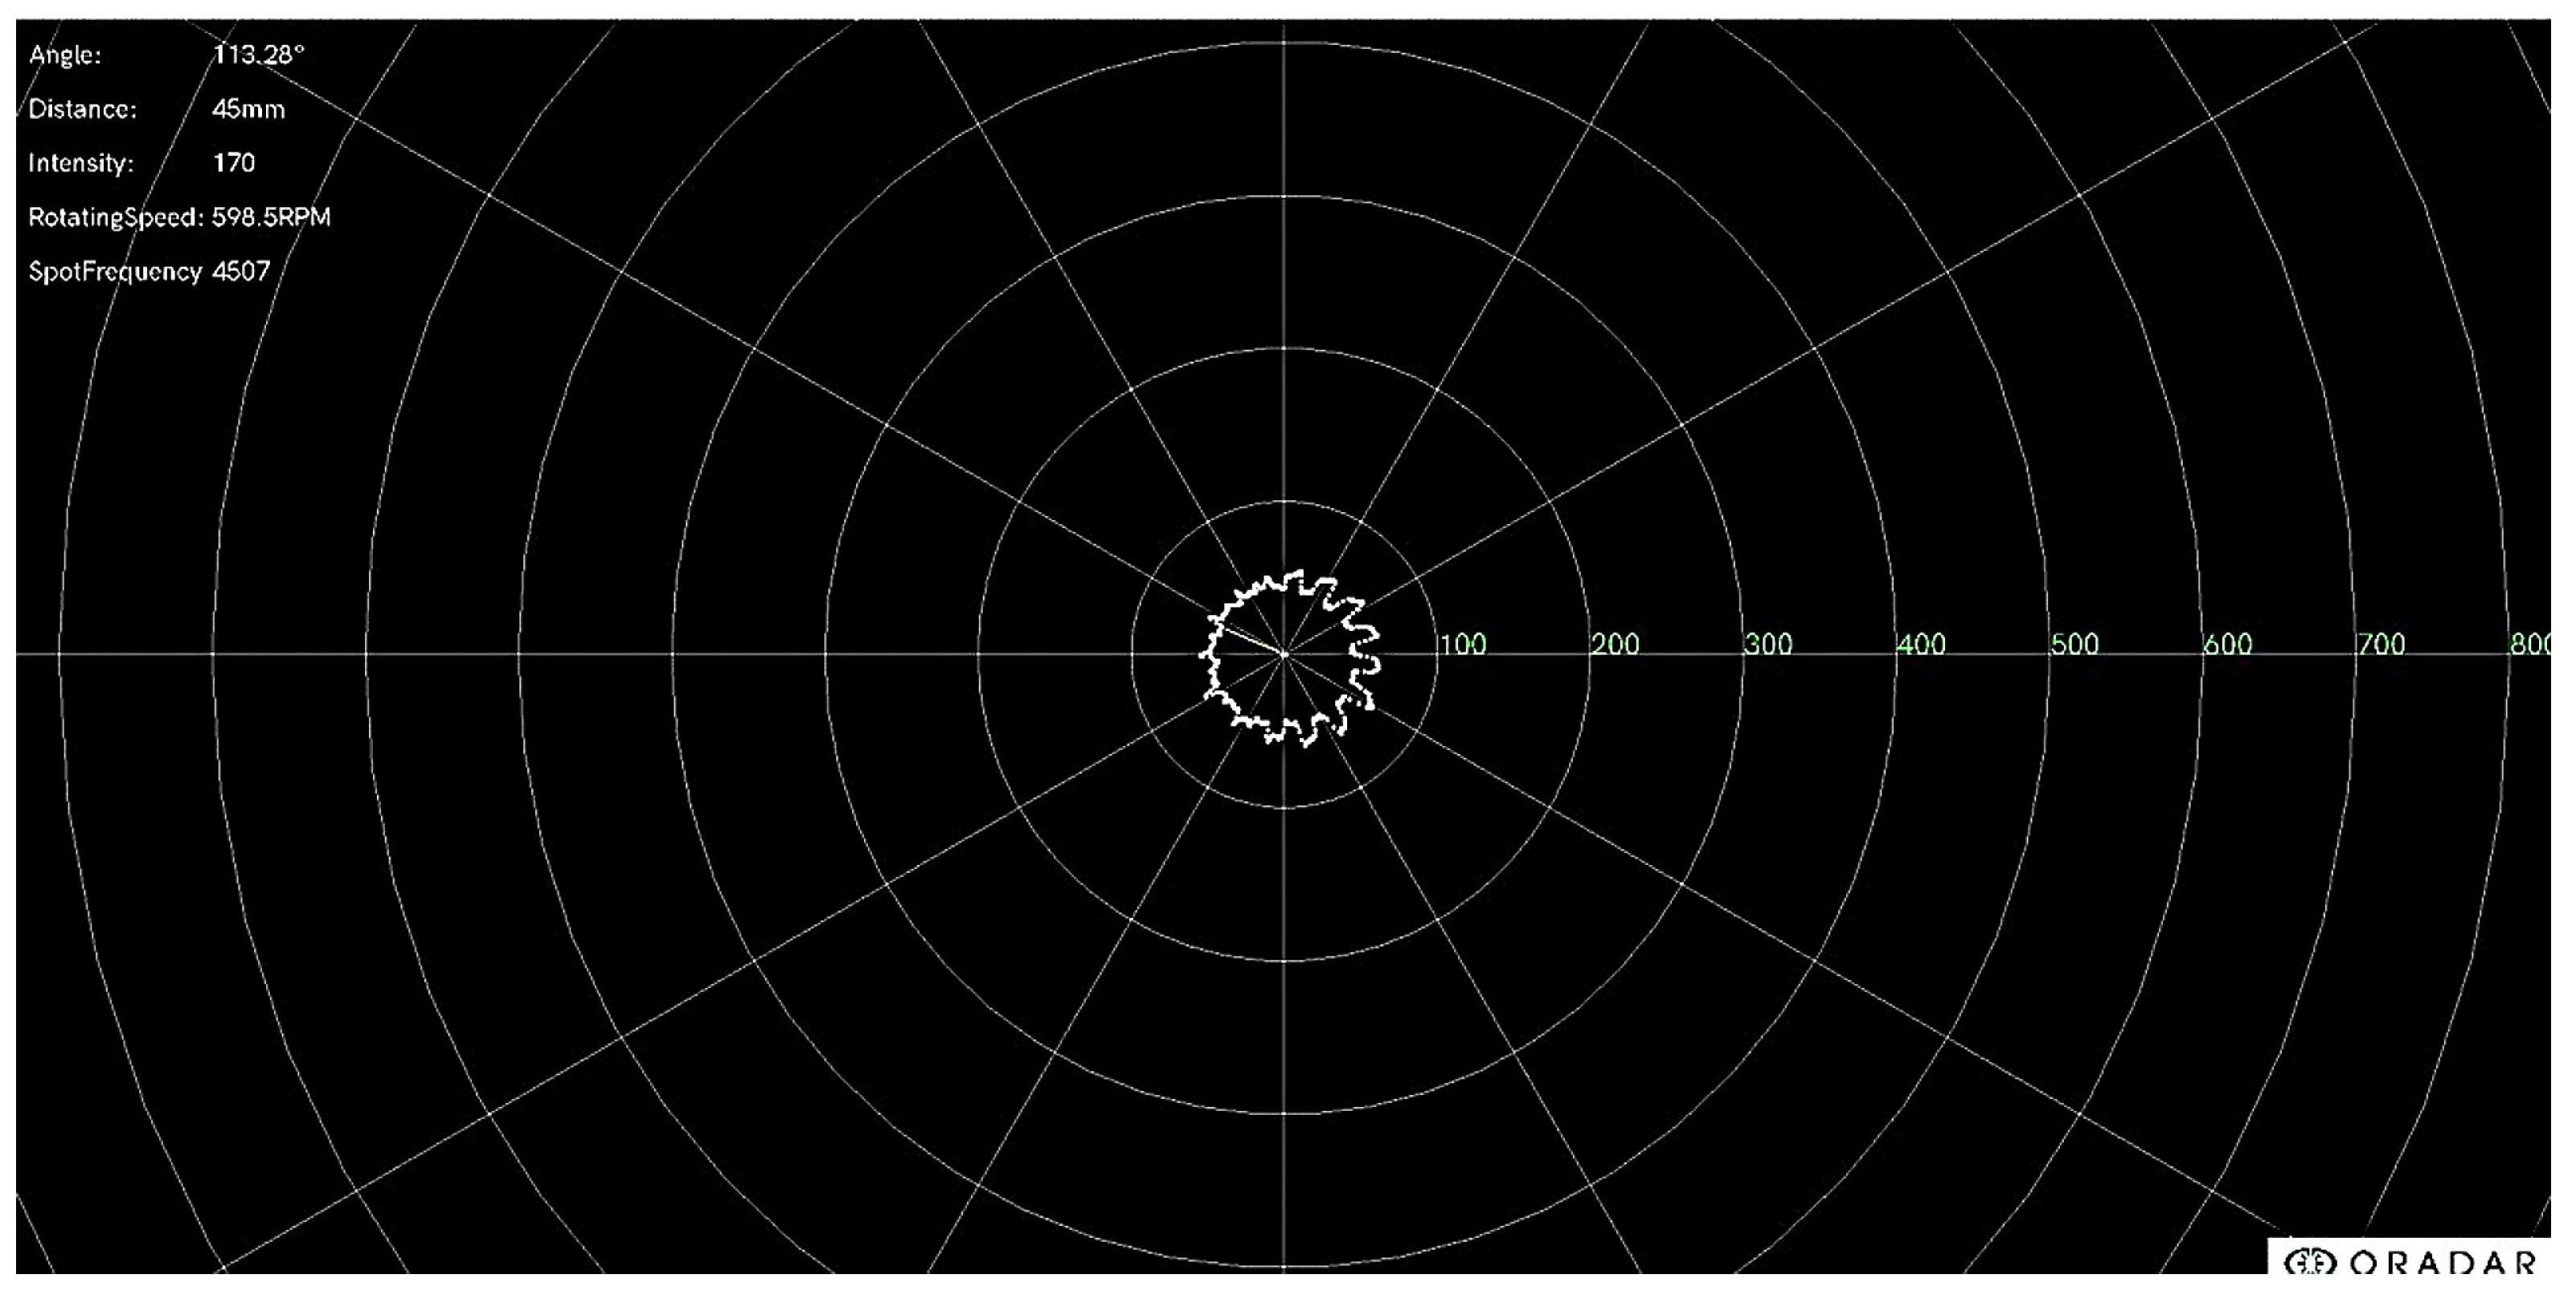
Through the coordinated operation of the device’s locomotion and detection modules, the LiDAR successfully collects internal pipeline point cloud data and transmits them to the data processing terminal. The data collection page window is shown in Figure 10. A sample of the acquired data is presented in Table 1.
Based on the data presented in the table, the point cloud data were first processed by transforming the X and Y coordinates. The Z coordinate was initialized from 0 and incremented by a value of 0.5 mm for each step, corresponding to the motor’s step length. Finally, three-dimensional reconstruction was performed on the acquired point cloud data of the pipeline’s internal bore, resulting in the point cloud model shown in Figure 11.
The model was then radially sectioned to obtain a cross-sectional view, as presented in Figure 12. This cross-sectional perspective allows for clearer observation of the various internal defects within the pipeline.
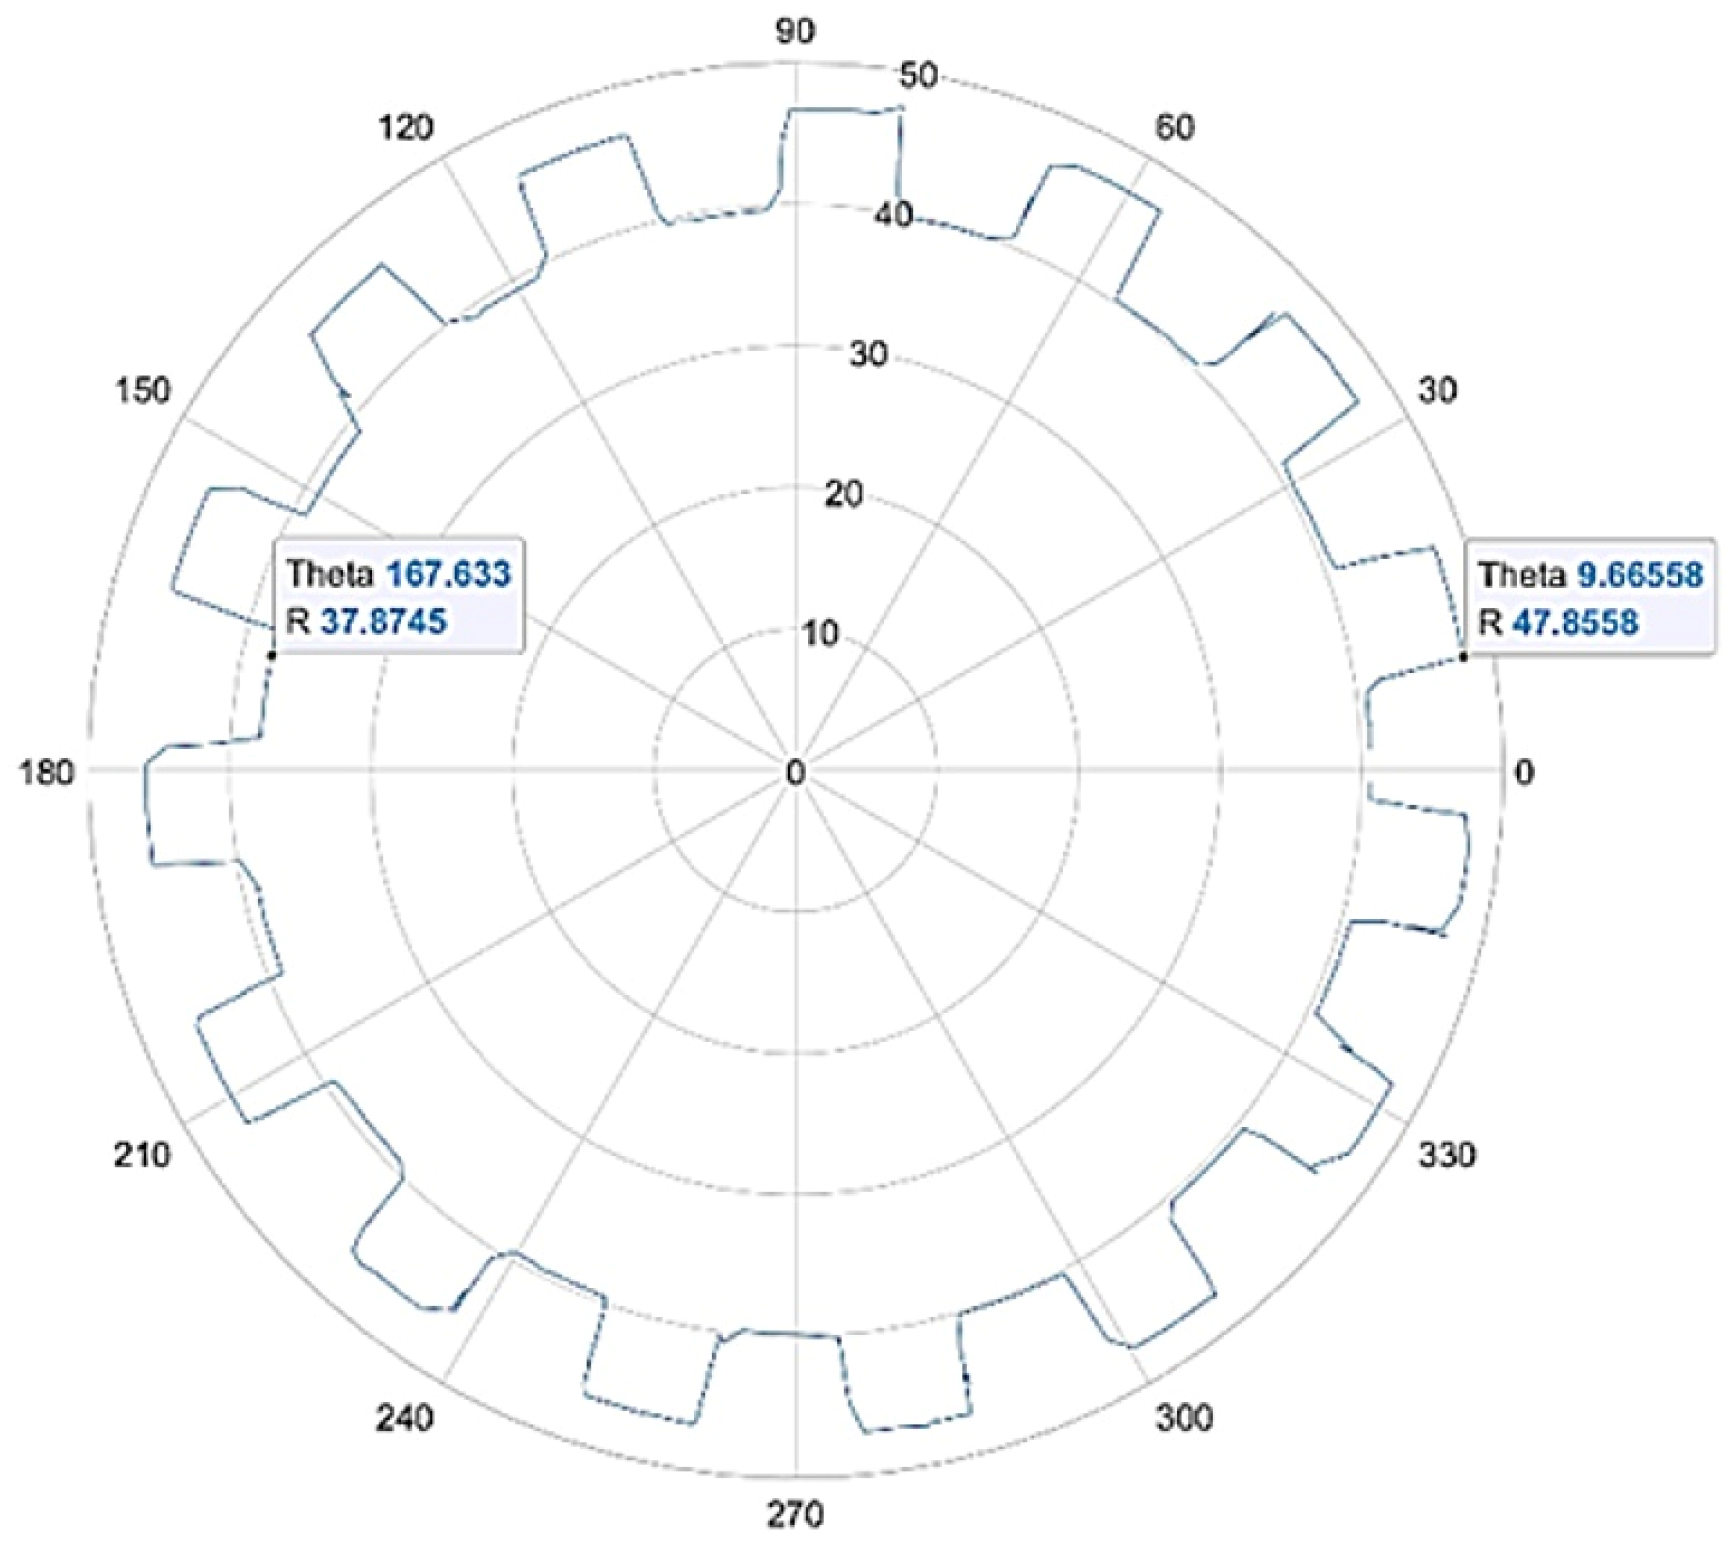
A comparison between the actual pipeline interior and the point cloud model reveals that the model effectively captures the relevant defects present within the pipeline. However, further analysis of the detection device’s measurement errors is required. Following the 3D reconstruction of the internal pipeline point cloud, cross-sectional data were selected to calculate the LiDAR’s detection error. MATLAB 2020 was employed to fit the pipeline’s internal cross-sections. The fitting results are shown in Figure 13, and a comparison of the data from distinct feature regions is presented in Table 2.
By comparing the above fitting results, it can be seen that the detection data from the LiDAR exhibit a certain degree of error. In the aforementioned fitting graphs, the maximum radius is 47.8558 mm and the minimum radius is 37.8745 mm. Through the data comparison between the model dimensions and the maximum measured dimensions, it can be inferred that the maximum error of the internal pipeline inspection device is approximately 3 mm, with an average error of 1.8 mm. The main causes of the error are as follows: the internal pipeline inspection device may experience slight vibration during travel, thereby affecting the detection results obtained from the LiDAR; the data detected by the LiDAR contain some noise and missing data points; and the measurement accuracy of the LiDAR is limited.
Compared with the results obtained by Zang Chunhua et al. [30], whose average measurement error was 0.147 mm, the error measured in this work is large. This can be explained by the fact that the aforementioned study collected data on a pipeline’s outer diameter in a different working scenario, where more sensor models were available. Moreover, they fused two types of data (LiDAR and camera), resulting in higher data accuracy. In the future, our team will consider conducting a feasibility analysis on a multi-source data fusion scheme to improve the accuracy and reduce the errors.

5. Conclusions

The subsea pipeline internal inspection device designed in this work can achieve relatively stable movement inside pipelines, synchronously collect high-density point cloud data on the pipeline’s inner surface, and complete the 3D reconstruction of the internal structure of a pipeline with a diameter of 100 mm and above. This device provides an effective technical means for the visual inspection of internal pipeline conditions and has strong engineering applicability. However, to further improve the accuracy and reliability of the detection data, subsequent research is needed to verify its movement stability; it is also necessary to select LiDAR sensors with higher measurement accuracy and ntegrate a three-axis gyroscope to determine the impact of instability on the data measurement accuracy. Following these improvements, the system will facilitate the high-precision positioning, qualitative identification, and quantitative analysis of internal defects in subsea pipelines, providing strong data support for pipeline safety assessment, maintenance, and management.

Author Contributions

Conceptualization, W.L. and Q.M.; methodology, W.L. and Q.M.; validation, P.Z. and Q.W. (Qianshi Wang); formal analysis, P.Z. and Q.W. (Qianshi Wang); investigation, Q.W. (Qianshi Wang) and H.C.; resources, W.L.; data curation, H.C. and Q.W. (Qianshi Wang); writing—original draft preparation, Q.W. (Qianshi Wang) and Q.M.; writing—review and editing, W.L. and Q.W. (Qingshan Wang); supervision, W.L.; project administration, W.L.; funding acquisition, W.L. All authors have read and agreed to the published version of the manuscript.

Funding

The authors gratefully acknowledge the financial support from the Hubei Provincial Natural Science Foundation, 2023AFB900.

Data Availability Statement

The data provided in this study are available upon request from the corresponding author due to privacy restrictions.

Conflicts of Interest

The authors declare no conflicts of interest.

References

  1. Du, F.; Li, C.; Wang, W. Development of Subsea Pipeline Buckling, Corrosion and Leakage Monitoring. J. Mar. Sci. Eng. 2023, 11, 188. [Google Scholar] [CrossRef]
  2. Ho, M.; El-Borgi, S.; Patil, D.; Song, G. Inspection and Monitoring Systems Subsea Pipelines: A Review Paper. Struct. Health Monit. 2020, 19, 606–645. [Google Scholar] [CrossRef]
  3. Davis, P.; Brockhurst, J. Subsea Pipeline Infrastructure Monitoring: A Framework for Technology Review and Selection. Ocean Eng. 2015, 104, 540–548. [Google Scholar] [CrossRef]
  4. Zhang, H.; Zhang, J.; Lin, R.; Wang, Y. Advanced Inspection Techniques for Submarine Pipeline Integrity. In Submarine Pipeline Integrity: Assessment of Failure Modes and Advanced Evaluation Techniques; Zhang, H., Zhang, J., Lin, R., Wang, Y., Eds.; Springer Nature: Cham, Switzerland, 2025; pp. 1–14. ISBN 978-3-031-92092-9. [Google Scholar]
  5. Ma, Q.; Liang, W.; Zhou, P. A Review on Pipeline In-Line Inspection Technologies. Sensors 2025, 25, 4873. [Google Scholar] [CrossRef]
  6. Wang, C.; Wu, S.; Xin, J.; He, R.; Chen, J.; Wang, D. Numerical Simulation of Oil and Gas Pipeline Crack Detection Based on Pulsed Eddy Current Testing Technology. In Proceedings of the 2021 4th International Conference on Electron Device and Mechanical Engineering (ICEDME), Guangzhou, China, 19–21 March 2021; pp. 46–50. [Google Scholar]
  7. Cao, W.Y. Research on Pipeline Acoustic Detection and Leak Localization Technology. Master’s Thesis, North China Electric Power University (Beijing), Beijing, China, 2024. [Google Scholar]
  8. Fahimipirehgalin, M.; Trunzer, E.; Odenweller, M.; Vogel-Heuser, B. Automatic Visual Leakage Detection and Localization from Pipelines in Chemical Process Plants Using Machine Vision Techniques. Engineering 2021, 7, 758–776. [Google Scholar] [CrossRef]
  9. Liang, Y. Discussion on Subsea Pipeline Internal Inspection and Anti-Corrosion Strategies. Petro. Chem. Equip. 2024, 27, 160, 164–167. [Google Scholar]
  10. Liu, Z. Series Design of Measuring Nodes for Subsea Pipeline Inspection Equipment. Orient. Enterp. Cult. 2013, 241–242. Available online: https://kns.cnki.net/kcms2/article/abstract?v=DJp2nd4LPS1cscr9z09rI124I3CYnNQJe1xTnqfyzdM49v_Gkxj5LsjL_Ohu98CnrTc8_EXRCCmOs-2qrGHgD24o0AjW4ijSoBqY1O4Vc273gnQ6qqJwCrszpPTaj50JWvBHFIo20kxe8FjgGFYHSjWZ2CKP3elU5p7uLXNG98pD_vcVOK3RmA==&uniplatform=NZKPT&language=CHS (accessed on 17 October 2025).
  11. Meniconi, S.; Brunone, B.; Tirello, L.; Rubin, A.; Cifrodelli, M.; Capponi, C. Transient Tests for Checking the Trieste Subsea Pipeline: Diving into Fault Detection. J. Mar. Sci. Eng. 2024, 12, 391. [Google Scholar] [CrossRef]
  12. Meniconi, S.; Brunone, B.; Tirello, L.; Rubin, A.; Cifrodelli, M.; Capponi, C. Transient Tests for Checking the Trieste Subsea Pipeline: Toward Field Tests. J. Mar. Sci. Eng. 2024, 12, 374. [Google Scholar] [CrossRef]
  13. Cawley, P. Practical Long Range Guided Wave Inspection–Applications to Pipes and Rail. Mater. Eval. 2003, 61, 66–74. [Google Scholar]
  14. Davidson, R.; Pipeline, H. An Introduction to Pipeline Pigging; Gulf Publishing: Houston, TX, USA, 2002. [Google Scholar]
  15. Bohorquez, J.; Lambert, M.F.; Alexander, B.; Simpson, A.R.; Abbott, D. Stochastic Resonance Enhancement for Leak Detection in Pipelines Using Fluid Transients and Convolutional Neural Networks. J. Water Resour. Plan. Manag. 2022, 148, 04022001. [Google Scholar] [CrossRef]
  16. Covas, D.; Ramos, H. Case Studies of Leak Detection and Location in Water Pipe Systems by Inverse Transient Analysis. J. Water Resour. Plan. Manag. 2010, 136, 248–257. [Google Scholar] [CrossRef]
  17. Mohapatra, P.K.; Chaudhry, M.H.; Kassem, A.A.; Moloo, J. Detection of Partial Blockage in Single Pipelines. J. Hydraul. Eng. 2006, 132, 200–206. [Google Scholar] [CrossRef]
  18. Brockhaus, S.; Ginten, M.; Klein, S.; Teckert, M.; Stawicki, O.; Oevermann, D.; Meyer, S.; Storey, D. 10–in-Line Inspection (ILI) Methods for Detecting Corrosion in Underground Pipelines. In Underground Pipeline Corrosion; Orazem, M.E., Ed.; Woodhead Publishing: Cambridge, UK, 2014; pp. 255–285. ISBN 978-0-85709-509-1. [Google Scholar]
  19. Mpesha, W.; Gassman, S.L.; Chaudhry, M.H. Leak Detection in Pipes by Frequency Response Method. J. Hydraul. Eng. 2001, 127, 134–147. [Google Scholar] [CrossRef]
  20. Kazeminasab, S.; Sadeghi, N.; Janfaza, V.; Razavi, M.; Ziyadidegan, S.; Banks, M.K. Localization, Mapping, Navigation, and Inspection Methods in in-Pipe Robots: A Review. IEEE Access 2021, 9, 162035–162058. [Google Scholar] [CrossRef]
  21. Liou, C.P. Pipeline Leak Detection by Impulse Response Extraction. J. Fluids Eng. 1998, 120, 833–838. [Google Scholar] [CrossRef]
  22. Gazis, D.C. Three-dimensional Investigation of the Propagation of Waves in Hollow Circular Cylinders. I. Analytical Foundation. J. Acoust. Soc. Am. 1959, 31, 568–573. [Google Scholar] [CrossRef]
  23. Jia, M.Y.; Shen, X.; Feng, X.X. Application of LiDAR Technology in Pipeline Inspection Robots. Metrol. Meas. Technol. 2025, 51, 64–67. [Google Scholar] [CrossRef]
  24. Liu, X.X. Research on Defect Detection Method for Pipeline Inner Wall Based on Point Laser Sensor. Master’s Thesis, Tianjin University of Science and Technology, Tianjin, China, 2025. [Google Scholar]
  25. Li, Y.; Dong, S.Q.; Shi, Y.; Chen, Q. Quantitative Detection Technology for Deformation Defects in Drainage Pipes Based on Laser Point Cloud Data. J. Eng. Geophys. 2024, 21, 54–61. [Google Scholar]
  26. Montoya, M.; Montelongo, Y.; Jiang, N.; Morris, S.M.; Parra-Michel, J. Free-Form Laser Profilometry for Pipeline Inspection and 3D Cylindrical Reconstructions. IEEE Sens. J. 2022, 22, 297–303. [Google Scholar] [CrossRef]
  27. Tian, T.; Wang, L.; Yan, X.; Ruan, F.; Aadityaa, G.J.; Choset, H.; Li, L. Visual-Inertial-Laser-Lidar (VILL) SLAM: Real-Time Dense RGB-D Mapping for Pipe Environments. In Proceedings of the 2023 IEEE/RSJ International Conference on Intelligent Robots and Systems (IROS), Detroit, MI, USA, 1–5 October 2023; pp. 1525–1531. [Google Scholar]
  28. Ambati, P.; Raj, K.M.S.; Joshuva, A. A Review on Pipeline Inspection Robot. AIP Conf. Proc. 2020, 2311, 060002. [Google Scholar] [CrossRef]
  29. Abdelrahim, M.; Hassan, A.; Ojo, D.; Hosny, M.; Ammar, H.H.; El-Samanty, M. A Novel Design of a T-Model Three Mecanum Wheeled Mobile Robot. In Proceedings of the 2022 International Conference on Advanced Robotics and Mechatronics (ICARM), Guilin, China, 9–11 July 2022; pp. 509–513. [Google Scholar]
  30. Zang, C.H.; Wang, H.J.; Gao, X.Y.; Ji, H.G.; Wang, K.; Zhao, L.X.; Qiu, N.C. Diameter and Roundness Measurement Method of Expanded Pipes Based on Laser Line Scanning 3D Reconstruction. Dev. Innov. Mach. Electr. Prod. 2021, 34, 79–81. [Google Scholar]
Figure 1. Internal view of pipeline: normal condition versus corrosion.
Jmse 13 02141 g001
Figure 2. Schematic diagram of the internal pipeline inspection system.
Jmse 13 02141 g002
Figure 3. Model diagram of the internal pipeline inspection device.
Jmse 13 02141 g003
Figure 4. Structural diagram of the locomotion module: (1) Mecanum wheel hub; (2) Mecanum wheel roller; (3) motor sleeve; (4) hollow-shaft torque motor.
Jmse 13 02141 g004
Figure 5. Orbbec MS200 LiDAR.
Jmse 13 02141 g005
Figure 6. Schematic diagram of LiDAR mounting position.
Jmse 13 02141 g006
Figure 7. Kinematic simulation model of the internal pipeline inspection device.
Jmse 13 02141 g007
Figure 8. Pipeline physical object and model diagrams: (a) physical object; (b) schematic diagram.
Jmse 13 02141 g008
Figure 9. Pipeline internal inspection device and data acquisition process: (a) physical device; (b) data acquisition process.
Jmse 13 02141 g009
Figure 10. Data collection page window.
Jmse 13 02141 g010
Figure 11. Internal pipeline point cloud model (The colors are mainly used to distinguish feature regions, with feature regions marked in red. The red fan-shaped area in the left figure mainly corresponds to the concave groove feature region, and the blue fan-shaped area corresponds to the convex groove feature region).
Jmse 13 02141 g011
Figure 12. Cross-sectional view of the model.
Jmse 13 02141 g012
Figure 13. Fitting results for the pipeline’s internal cross-section.
Jmse 13 02141 g013
Table 1. Sample point cloud data of the pipeline interior.
Angle/°Radius/mmAngle/°Radius/mm
70.01640109.15146
74.49040115.37744
78.09140117.76139
80.18247121.31939
92.87740128.38441
102.46840131.44546
103.92341136.38246
104.15143139.85043
Table 2. Comparison of data from distinct feature regions.
RegionDefect Size/mmMaximum Measured Dimension/mm
Groove4548
Convex groove3838
Step trough 14648
Step trough 24446
Step trough 34244
Depression 145.547
Depression 241.843
Disclaimer/Publisher’s Note: The statements, opinions and data contained in all publications are solely those of the individual author(s) and contributor(s) and not of MDPI and/or the editor(s). MDPI and/or the editor(s) disclaim responsibility for any injury to people or property resulting from any ideas, methods, instructions or products referred to in the content.