Article

A Boundary Element Method for the Hydrodynamic Analysis of Toroidal Propellers

Ocean Engineering Group, Department of Naval Architecture and Ocean Engineering, Hongik University, Sejong 30016, Republic of Korea
J. Mar. Sci. Eng. 2025, 13(11), 2142; https://doi.org/10.3390/jmse13112142 (registering DOI)
Submission received: 20 September 2025 / Revised: 16 October 2025 / Accepted: 10 November 2025 / Published: 12 November 2025
(This article belongs to the Section Ocean Engineering)

Abstract

Toroidal propellers have emerged as a promising substitute for next-generation marine propulsors due to their potential advantages in hydrodynamic efficiency and noise control. This article presents a hydrodynamic analysis of toroidal propellers using a potential-based boundary element method (BEM) that enables rapid computations of complex geometries when compared with computationally demanding viscous simulations. The method predicts the inviscid flow characteristics, forces, and circulation distributions of toroidal propellers and is validated against Reynolds-averaged Navier–Stokes (RANS) simulations under various loading conditions and geometric configurations. The comparison shows that the BEM successfully reproduces the overall thrust and torque trends observed in the viscous simulations, although discrepancies arise due to flow separation and the absence of leading-edge vortices that dominate the suction side dynamics in RANS results. The wake alignment model in the BEM captures the overall trajectories of the shed vortices with good consistency, though its concentrated wake representation occasionally brings the trailing wake substantially close to the rear blade surface, which causes locally low pressures that are not present in RANS where boundary layers prevent direct wake impingement. The BEM was further extended for a parametric study that varied pitch, axial spacing, and lateral angle, showing that pitch variations have the most significant influence on propeller loading and thrust characteristics. Overall, the present work demonstrates that the proposed BEM provides a computationally efficient and physically reasonable framework for predicting the performance of toroidal propellers, especially for early-stage geometric design and optimization.

1. Introduction

Recently, toroidal propellers have emerged as a novel propulsion concept in both aerial and marine applications due to their potentially low noise, high efficiency, and enhanced cavitation resistance. The unique propeller geometry forms a closed loop that effectively redistributes tip vortices and mitigates the end-of-blade losses typically witnessed in conventional propellers. In the field of aeronautics, toroidal designs have been shown to reduce broadband noise by 5–20 dB while improving thrust when compared to standard multicopter fans [1]. In hydrodynamics, toroidal shapes offer advantages such as enhanced efficiency, improved tip vortex control, low-noise, and potential energy savings [2,3,4]. There have been Computational Fluid Dynamics (CFD) studies using Reynolds-averaged Navier–Stokes (RANS) and detached eddy simulations that have emphasized intense vortex evolution characteristics compared to conventional propellers, providing guidance for the optimization design research of toroidal propellers [5,6].
With growing significance, several patents have emphasized the advancement and proprietary development of toroidal propeller designs. For instance, U.S. Patent US10836466 B2 [7] (assigned to Massachusetts Institute of Technology, MIT) presents a toroidal propeller in which the tip of each blade curves into the next, forming a closed loop. This distinctive configuration enhances structure stiffness and significantly reduces the acoustic signature while producing higher thrust compared to conventional propellers. It enables quieter drone operation and, thus, broader public acceptance, as has been addressed by MIT Lincoln Laboratory. More recently, in marine applications, Sharrow Marine has developed toroidal propellers with twisted-loop blades that mitigate tip vortices, leading to improved efficiency, reduced noise, and lowering fuel consumption in watercrafts [8].
Although toroidal propellers exhibit promising benefits, compared to conventional propellers in many applications [9], the research on them has been relatively limited primarily due to the challenges associated with understanding and modeling their complex and unique geometry. Recently, Ye et al. (2024) [10] proposed an effective mathematical formulation for toroidal propeller geometries, enabling smooth and accurate construction of the desired blade shapes. Building on this formulation, recent computational studies have used high-fidelity CFD approaches to investigate the intricate vortex dynamics and flow structure interactions associated with two blades (front and rear) of the toroidal propeller [5]. While prior research based on the formulation has explored the impact of the non-conventional parameters of toroidal propellers, such as pitch angle, axial length, vertical angle, and lateral angle, there remain gaps in fast and reliable modeling and the analysis tools for early-stage toroidal propeller design; most existing studies largely rely on CFD or experiments [6], which can be demanding, especially during initial concept designs of a toroidal propeller. Given the growing interest in toroidal propellers and their potential applications, a more computationally efficient analysis tool would be beneficial for propeller designers. This article aims to address that need by employing a panel method (or, boundary element method, BEM) as a lightweight yet robust alternative for the fast production of toroidal propeller geometries and their hydrodynamic performance analysis. In addition to demonstrating the usefulness of the method, this study also seeks to investigate its limitations through direct comparison with viscous RANS simulations.
This article mainly presents fully wetted (non-cavitating) simulation results, as the scope is limited to inviscid and non-cavitating flow conditions in order to focus on the capability of BEM in modeling complex toroidal geometries and evaluating their performance in wetted flow. An in-house boundary element method code—which can perform geometry generation and hydrodynamic analysis based on user-specified parametric input data, as well as produce rendered outputs that can be conveniently post-processed using CFD visualization tools, such as Tecplot—was employed. The in-house code was originally developed for conventional (non-toroidal) propellers by the Ocean Engineering Group at The University of Texas at Austin (code name: PROPCAV [11]), and it was extended in the present study for hydrodynamic analysis of the toroidal propellers. For validation of the results, the numerical predictions were compared with the RANS-based CFD results obtained in the present work and with the data reported in Kim et al. (2025) [6]. Comparative analyses were performed across a range of toroidal propeller geometries, including variations in pitch angle, lateral angle, and wheelbase length, to evaluate the predictive capability of the panel method under different geometric configurations. The results demonstrate that the panel method can capture overall force trends with reasonable accuracy.
The rest of this article is organized as follows. Section 2 presents the fundamentals of the boundary element method, as applied to toroidal propellers, along with the modeling approach, including wake alignment and geometry generation. Section 3 presents the validation of the proposed method against RANS simulations, followed by parametric studies on geometric variations and an assessment of computational efficiency compared with RANS in terms of the computing time. Finally, Section 4 summarizes the main conclusions and outlines possible future work related to the development of toroidal propeller analysis tools within the context of the BEM.

2. Methodology

2.1. Boundary Element Method for Propeller Analysis

When the coordinate system is fixed to a rotating propeller, the total velocity q at any point can be decomposed into three components, i.e., the effective inflow U i n , the relative rotational velocity due to the rotation of the propeller, and the perturbation velocity u induced by the presence of the propeller itself:
q = U i n ω × r + u ,
where ω denotes the angular velocity of the propeller, and r represents the position veoctor relative to the axis of rotation. The perturbation velocity u is defined as the gradient of the velocity potential ϕ , i.e.,
u = ϕ .
Assuming the flow is inviscid and irrotational, the velocity potential ϕ must satisfy the Laplace equation:
2 ϕ = 0 .
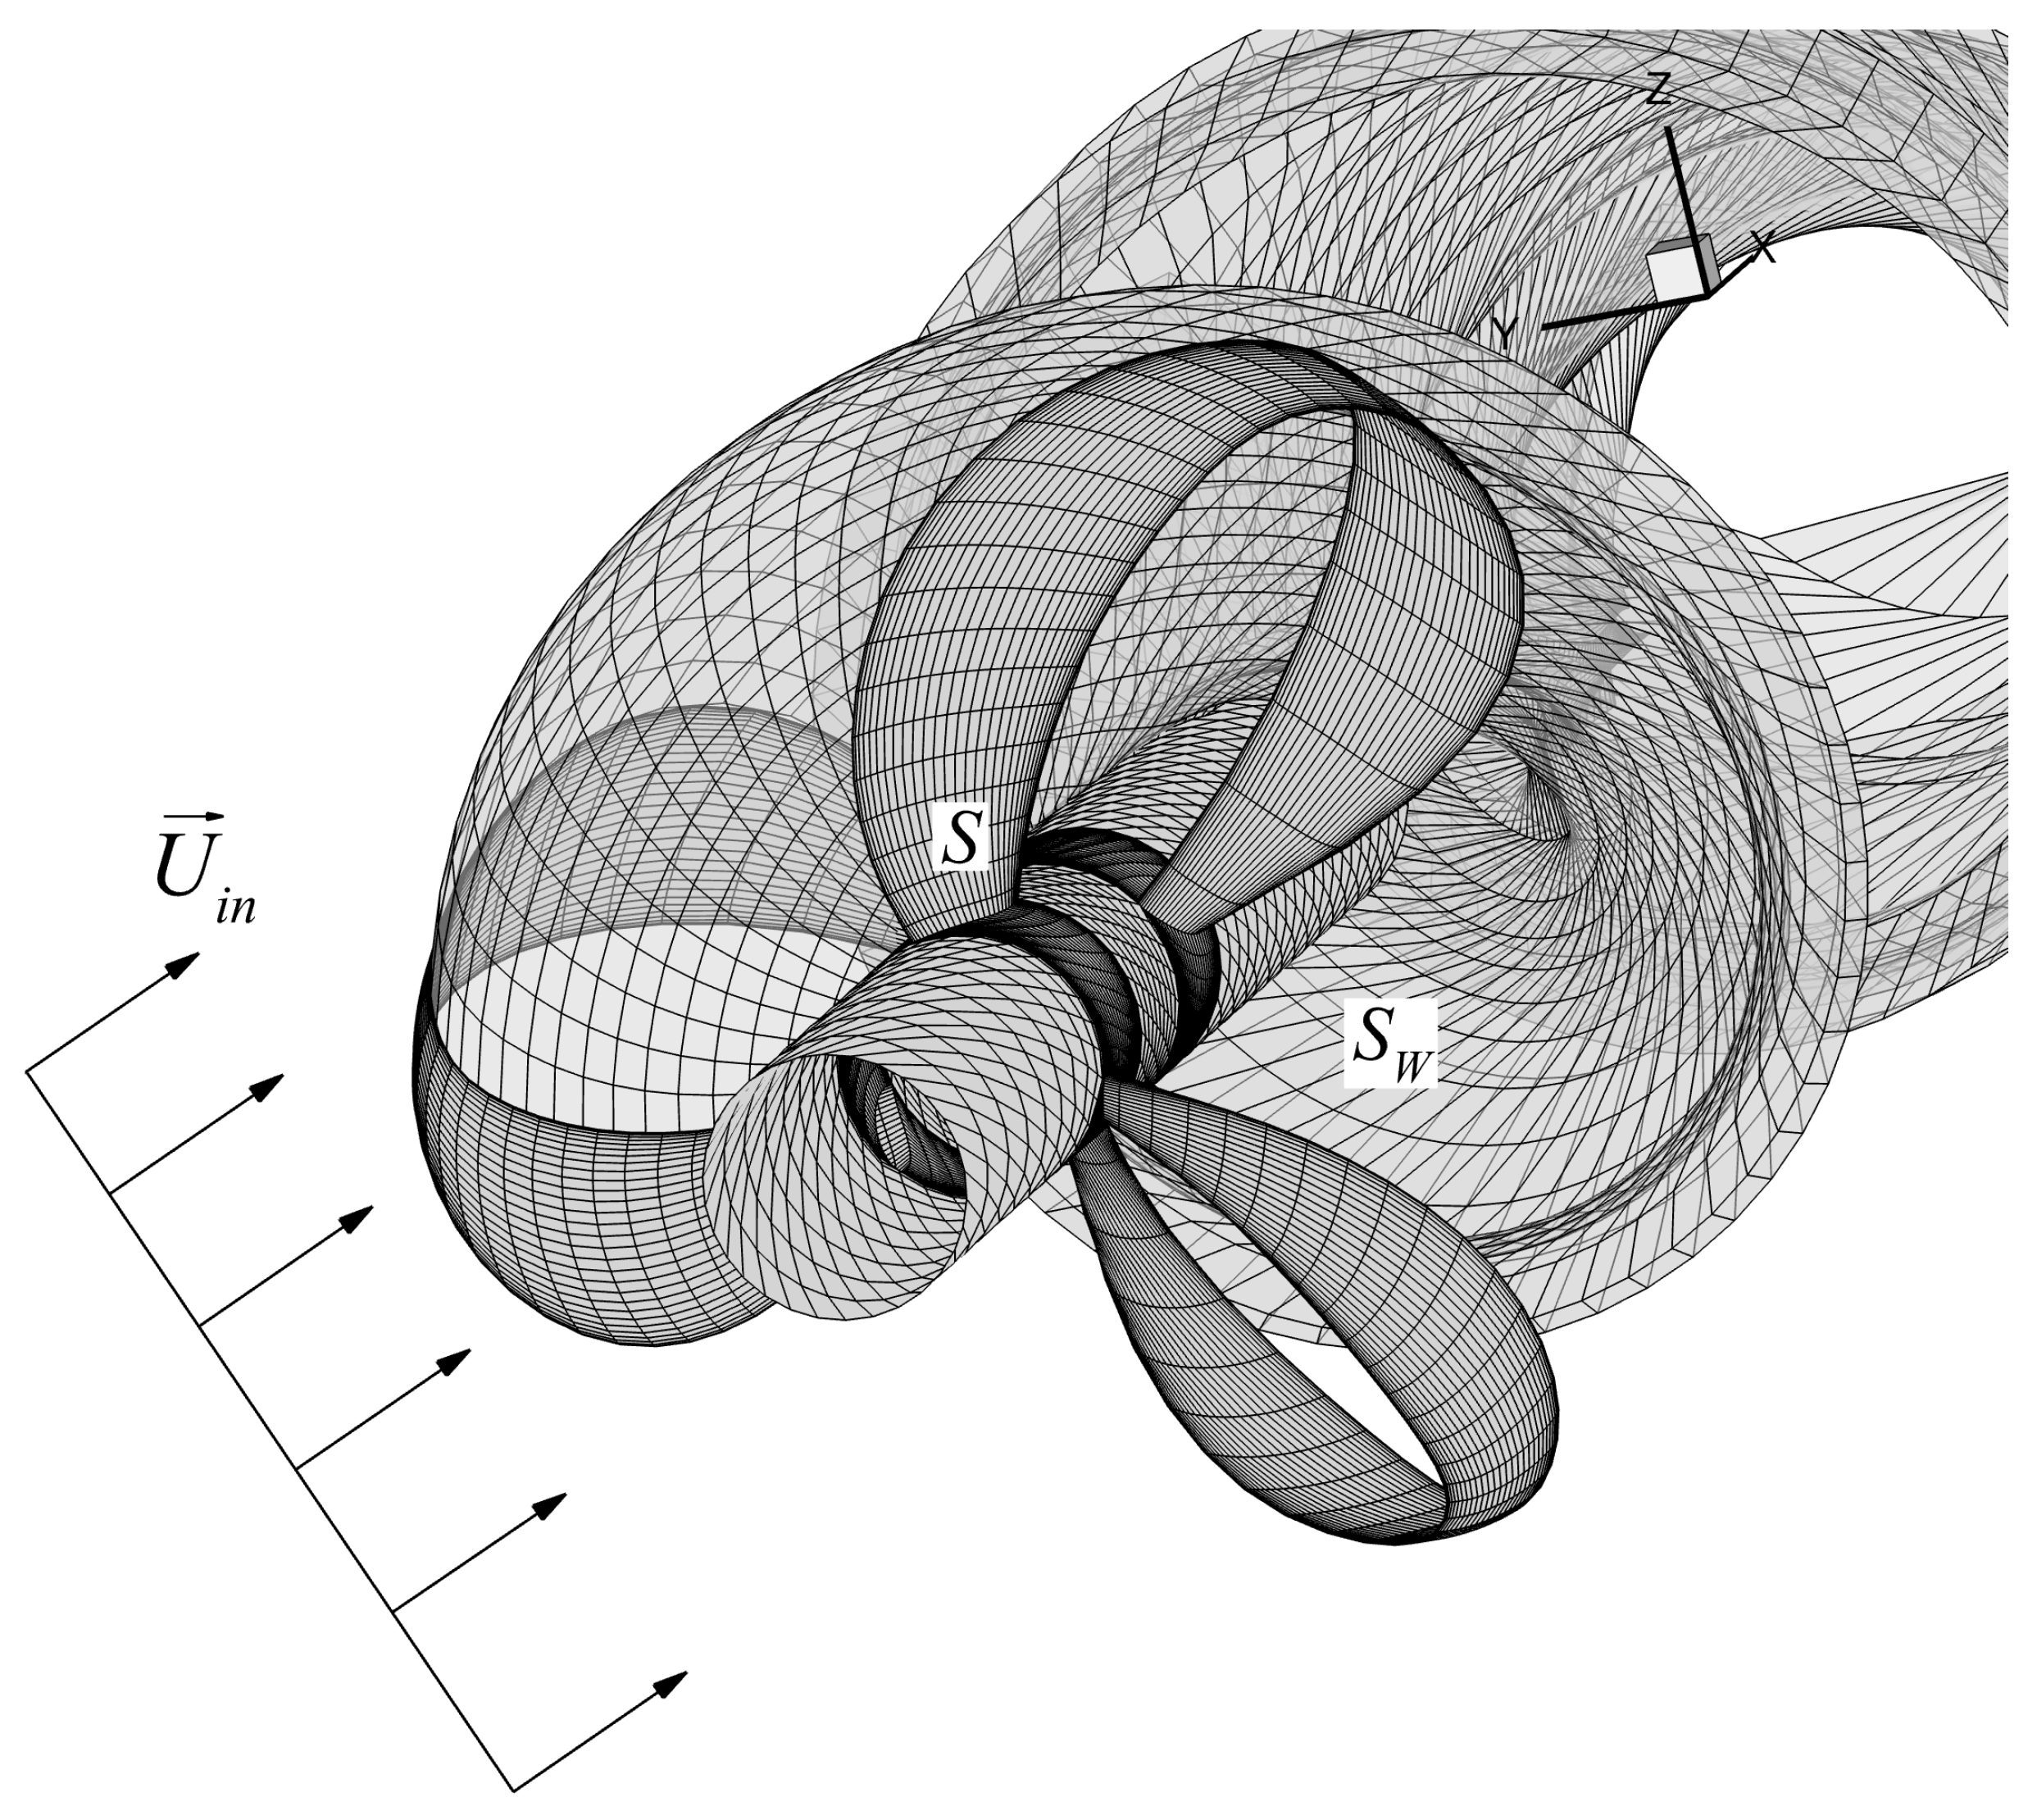
According to Green’s third identity, Equation (3) can be reformulated into a boundary integral form, as shown in Equation (4). In the formulation, S denotes the propeller surface, assuming a fully wetted condition in the absence of cavitation, as shown in Figure 1.
ϕ p 2 = S G ( p ; q ) ϕ q n q G ( p ; q ) n q ϕ q d S S W Δ ϕ W G ( p ; q ) n + d S ,
where S W represents the wake surface; n q the normal vector at point q pointing into the fluid; n + the normal vector on the wake surface; G ( p ; q ) the 3D full-space Green’s function equivalent to 1 4 π r ( p ; q ) ; and the field point p and the variable point q are distance r ( p ; q ) apart from each other. On the wake surface, the Kutta condition is enforced such that the wake strength Δ ϕ W is equal to the difference in velocity potential across the two sides of the blade trailing edge:
Δ ϕ W = ϕ T + ϕ T ,
where the superscripts + and − correspond to the suction and pressure sides at the blade trailing edge, respectively.
Once the velocity potential ϕ p is determined on the propeller boundary, the propeller-induced velocity u at any point in the flow field can be evaluated by taking the gradient of Equation (4), where ϕ p 2 is replaced by ϕ p for external problems.
u = 1 4 π S ϕ q n q 1 r ( p ; q ) ϕ q n q 1 r ( p ; q ) d S + 1 4 π S W Δ ϕ W ( r q ) n + 1 r ( p ; q ) d S .
The analytical formation (Equation (4)) will be solved for the unknown dipole strength ϕ p on the wetted surface by enforcing the kinematic boundary condition (Equation (7)), which provides the unknown source strength ϕ p n p in Equation (4), thereby leaving ϕ p as the sole unknowns to be solved for.
ϕ p n p = U i n + ω × r · n ,
where n is the local normal vector on the surface. The surface pressure P, which varies in space and time (in the case of an unsteady problem), can be derived from the unsteady Bernoulli equation by connecting two points, i.e., one on the blade surface and the other on the shaft axis far upstream of the propeller:
P 0 ρ + 1 2 U i n 2 + ω 2 r 2 = ϕ p t + P ρ + 1 2 q t 2 + g y s ,
where ρ is the fluid density; g is the gravitational constant; q t is the total velocity vector; y s is the vertical distance from the horizontal plane passing through the propeller axis; and P 0 represents the reference pressure far upstream. The total velocity q t V s , V v , 0 at a point p can be obtained by combining the directional derivatives of the perturbation potential ϕ p with the effective inflow velocity, which is expressed in the local curvilinear coordinate system ( s , v , n ) as follows:
V s ϕ p s + U i n ω × r · s V v ϕ p v + U i n ω × r · v V n ϕ p n + U i n ω × r · n = 0 ( on the boundary ) .
The unsteady term ϕ p t is evaluated via a second-order central difference approximation, and it is considered only after completing the second full propeller revolution in unsteady problems.

2.2. Modeling Toroidal Propeller Geometries Using a BEM

Traditionally, the hydrodynamic BEM used for the design and analysis of conventional propellers defines the geometric parameters, such as the pitch, camber, rake, and skew, based on radial stations from the blade root to the tip [12]. However, this approach is not directly applicable to toroidal propellers due to their loop-like and non-radial configuration. As such, the primary challenge in modeling toroidal propellers lies in establishing a suitable mathematical representation of their complex geometry. To address this, Ye et al. (2024) [10] recently proposed a set (essential for defining toroidal propeller shapes in a parametric form) of non-conventional geometric parameters, including axis span l, lateral angle φ , roll angle ψ , and vertical angle α . Unlike conventional propellers that define geometric parameters based on radial stations, the proposed approach defines them based on axial span l, which extends from the midchord of the front root section to that of the rear root section 0.0 l L .
To begin with, similar to conventional propellers, a reference line needs to be defined, as shown in Equation (10) and Figure 2. The axial span l extends from the midchord of the front root section to that of the rear root section, while r represents the radial distance to the current station from the propeller axis. By incorporating the rake x m and the lateral angle φ , both expressed as functions of the axial span l, the generatrix line of the propeller can be constructed (Equation (11) and Figure 3). The generatrix line includes a varying lateral angle φ , which typically starts with a negative value (meaning the blade section rotates toward the direction of propeller rotation) at the front root. Then, it transitions to a positive value near the tip and continues to the rear root section. During the design process, the lateral angle needs to be carefully specified to achieve the desired/optimal performance of the propeller, as it could place the rear blade in the path of the shedding wake from the front blade, which would thus affect the performance. For comparison, the reference line is illustrated alongside the generatrix line in Figure 3.
x = l r = r l l θ = 0 .
x = l + x m l r = r l l θ = φ l .
The side angle of the blade can be further adjusted by incorporating the skew angle θ m , as is commonly performed for conventional propellers. Unlike the lateral angle, the skew angle introduces an additional axial displacement, referred to as the skew-induced rake along the blade pitch. Accordingly, Equation (12) defines the blade reference line, which serves as the basis for constructing the full 3D Cartesian coordinates of the blade surface. Within this framework, y b and y f represent the distance from the chordline to the back and face sides of the blade, respectively, as described in Equation (13), where c denotes the chord length, s is the distance from the leading edge to the current point along the chordline, and the function ϕ l represents the pitch angle at the current axial location l. Figure 4 presents the constructed blade reference line, which is shown in a pink solid line, along with the previously defined reference and generatrix lines.
x = l + x m l + r θ m l tan ϕ l = l + x T l r = r l l θ = φ l + θ m l ,
x = l + x T l + c 2 + s sin ϕ l y b y f cos ϕ l r = r l l θ = φ l + θ m l + 1 r c 2 + s cos ϕ l + y b y f sin ϕ l y = r cos θ z = r sin θ .
The blade reference line and Equation (13) generate each section of the blade at a constant radial location, as shown in Figure 4a. This method is generally adequate for generating the radial sections of conventional propellers with mild rake; however, in the case of toroidal propellers, the pronounced rake causes difficulty in accurately representing the thickness in the transitional region near the blade tip connecting the front and rear parts of the blade. To go around this, Ye et al. (2024) [10] introduced a rotation angle ψ , which rotates the blade section about its chordline, as depicted in Figure 5 and Figure 6.
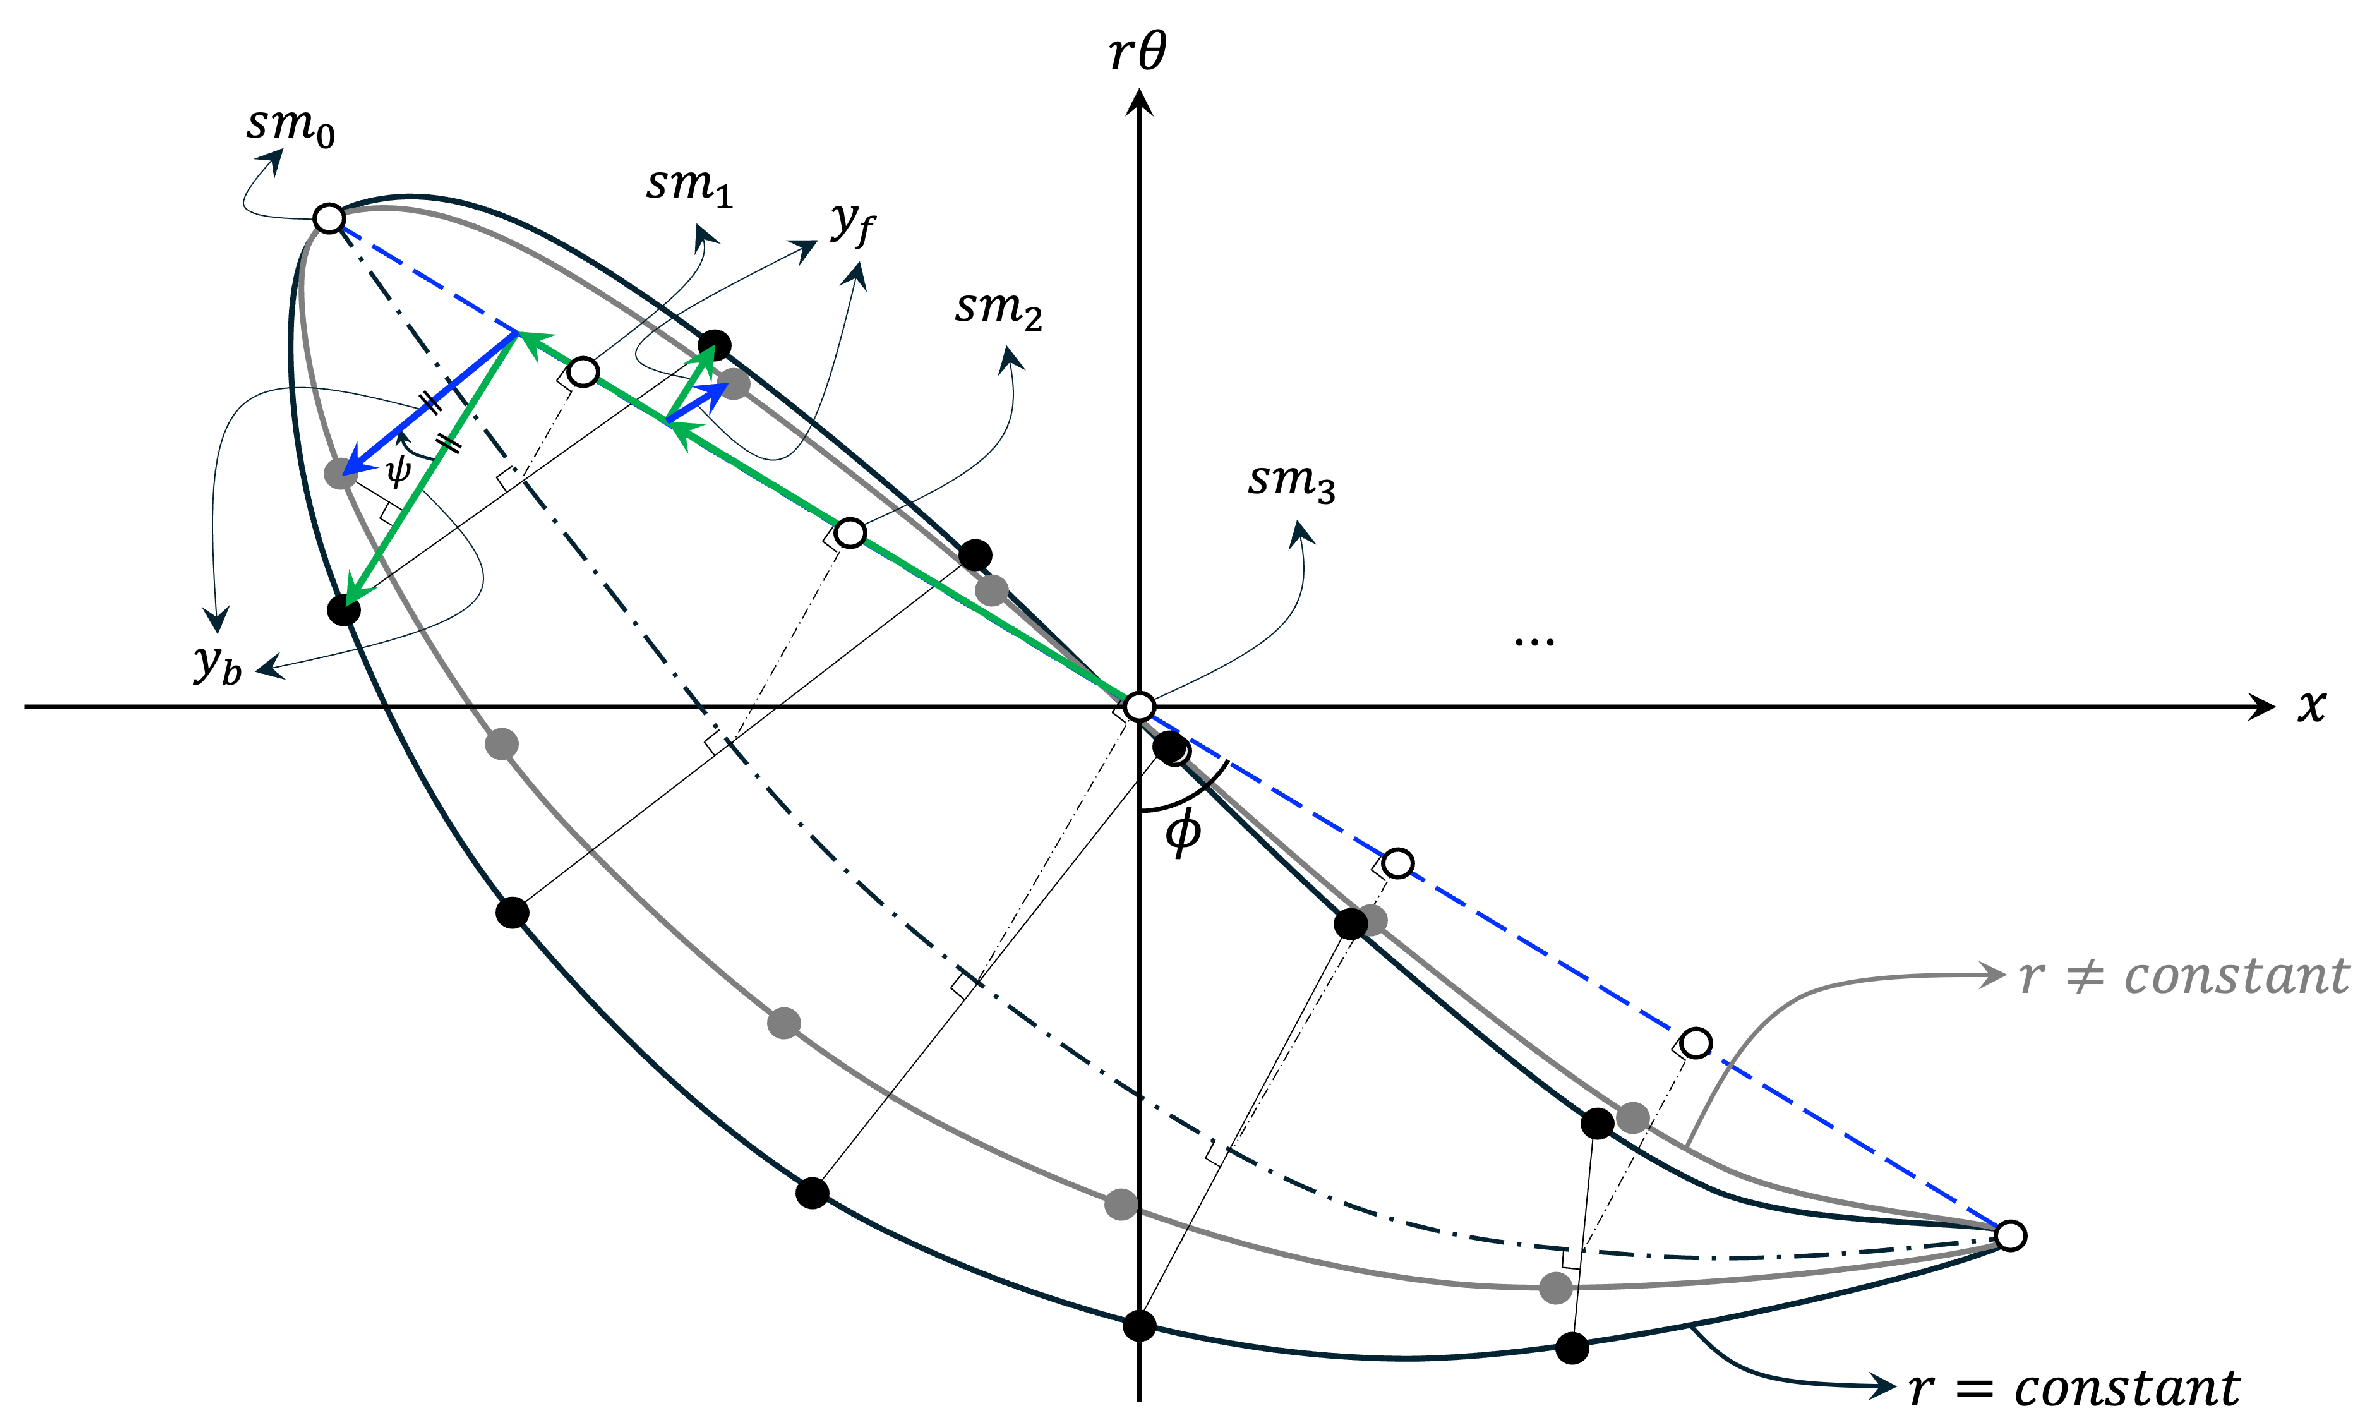
In Figure 5, the black solid line and filled circles in the x- r θ plane (at constant r) represent the original blade section before applying the rotation angle ψ . To incorporate this rotation, the proposed method first places discretized nodes along the chordline using a full-cosine spacing s m 0 , s m 1 , s m 2 , . . . . At each node, the camber and thickness distributions are applied to define the initial surface points (black filled circles). The vertical distances from the chordline to the back and face sides—denoted as y b and y f , respectively (green arrows)—are defined accordingly and rotated by ψ about the chordline, resulting in a new surface (in gray color with blue arrows) where the surface points no longer lie at a constant radial position. The blue arrows now connect the rotated back and face surfaces to the chordline. The rotation angle is zero at the front root section and gradually increases along the blade span, reaching approximately 90 near the blade tip and 180 at the rear root section. The 180 rotation, thus, flips the rear root section, causing the looped blade to behave like a lifting body rather than a turbine blade with negative camber. In other words, this half-turn rotation at the rear root enables the pressure side of the front blade to smoothly transition into the suction side of the rear blade, forming a continuous loop. Incorporating the rotation angle ψ , Equation (13) is recast into Equation (14).
x = l + x T l + c 2 + s sin ϕ l y b y f cos ψ l cos ϕ l r = r l l + y b y f sin ψ l θ = φ l + θ m l + 1 r c 2 + s cos ϕ l + y b y f cos ψ l sin ϕ l y = r cos θ z = r sin θ
Lastly, the vertical angle α is introduced to provide better control over the angle of attack experienced by the blade sections of a toroidal propeller, especially in the transition region (near the blade tip) where the roll angle approaches 90 . While the pitch angle alone determines the inflow angle at the front and rear roots (because the nodal points in those sections lie on the almost same radial plane), the transition region experiences more complex interactions between the chordline and the direction of rotation. The vertical angle, defined as the angle between the chordline and the rotational tangent, can lift or lower the blade sections relative to the direction of rotation. This adjustment allows the toroidal propeller to draw fluid into the interior of the loop, which could potentially improve flow alignment; however, it can also lead to increased rotational resistance, deviation of the inflow direction [6,10], and, potentially, a higher risk of cavitation when the angle of attach becomes too high. In the current method, the vertical angle is incorporated into the same manner as the rotation angle, with the key difference being that the chordline is now rotated about its midpoint; consequently, the leading and trailing edges are lifted or lowered by the vertical angle (Figure 7). With this modification, Equation (14) is updated to yield the final form in Equation (15).
x = l + x T l + c 2 + s cos α l sin ϕ l y b y f cos ψ l cos ϕ l r = r l l c 2 + s sin α l + y b y f sin ψ l θ = φ l + θ m l + 1 r c 2 + s cos α l cos ϕ l + y b y f . cos ψ l sin ϕ l . y = r cos θ z = r sin θ .
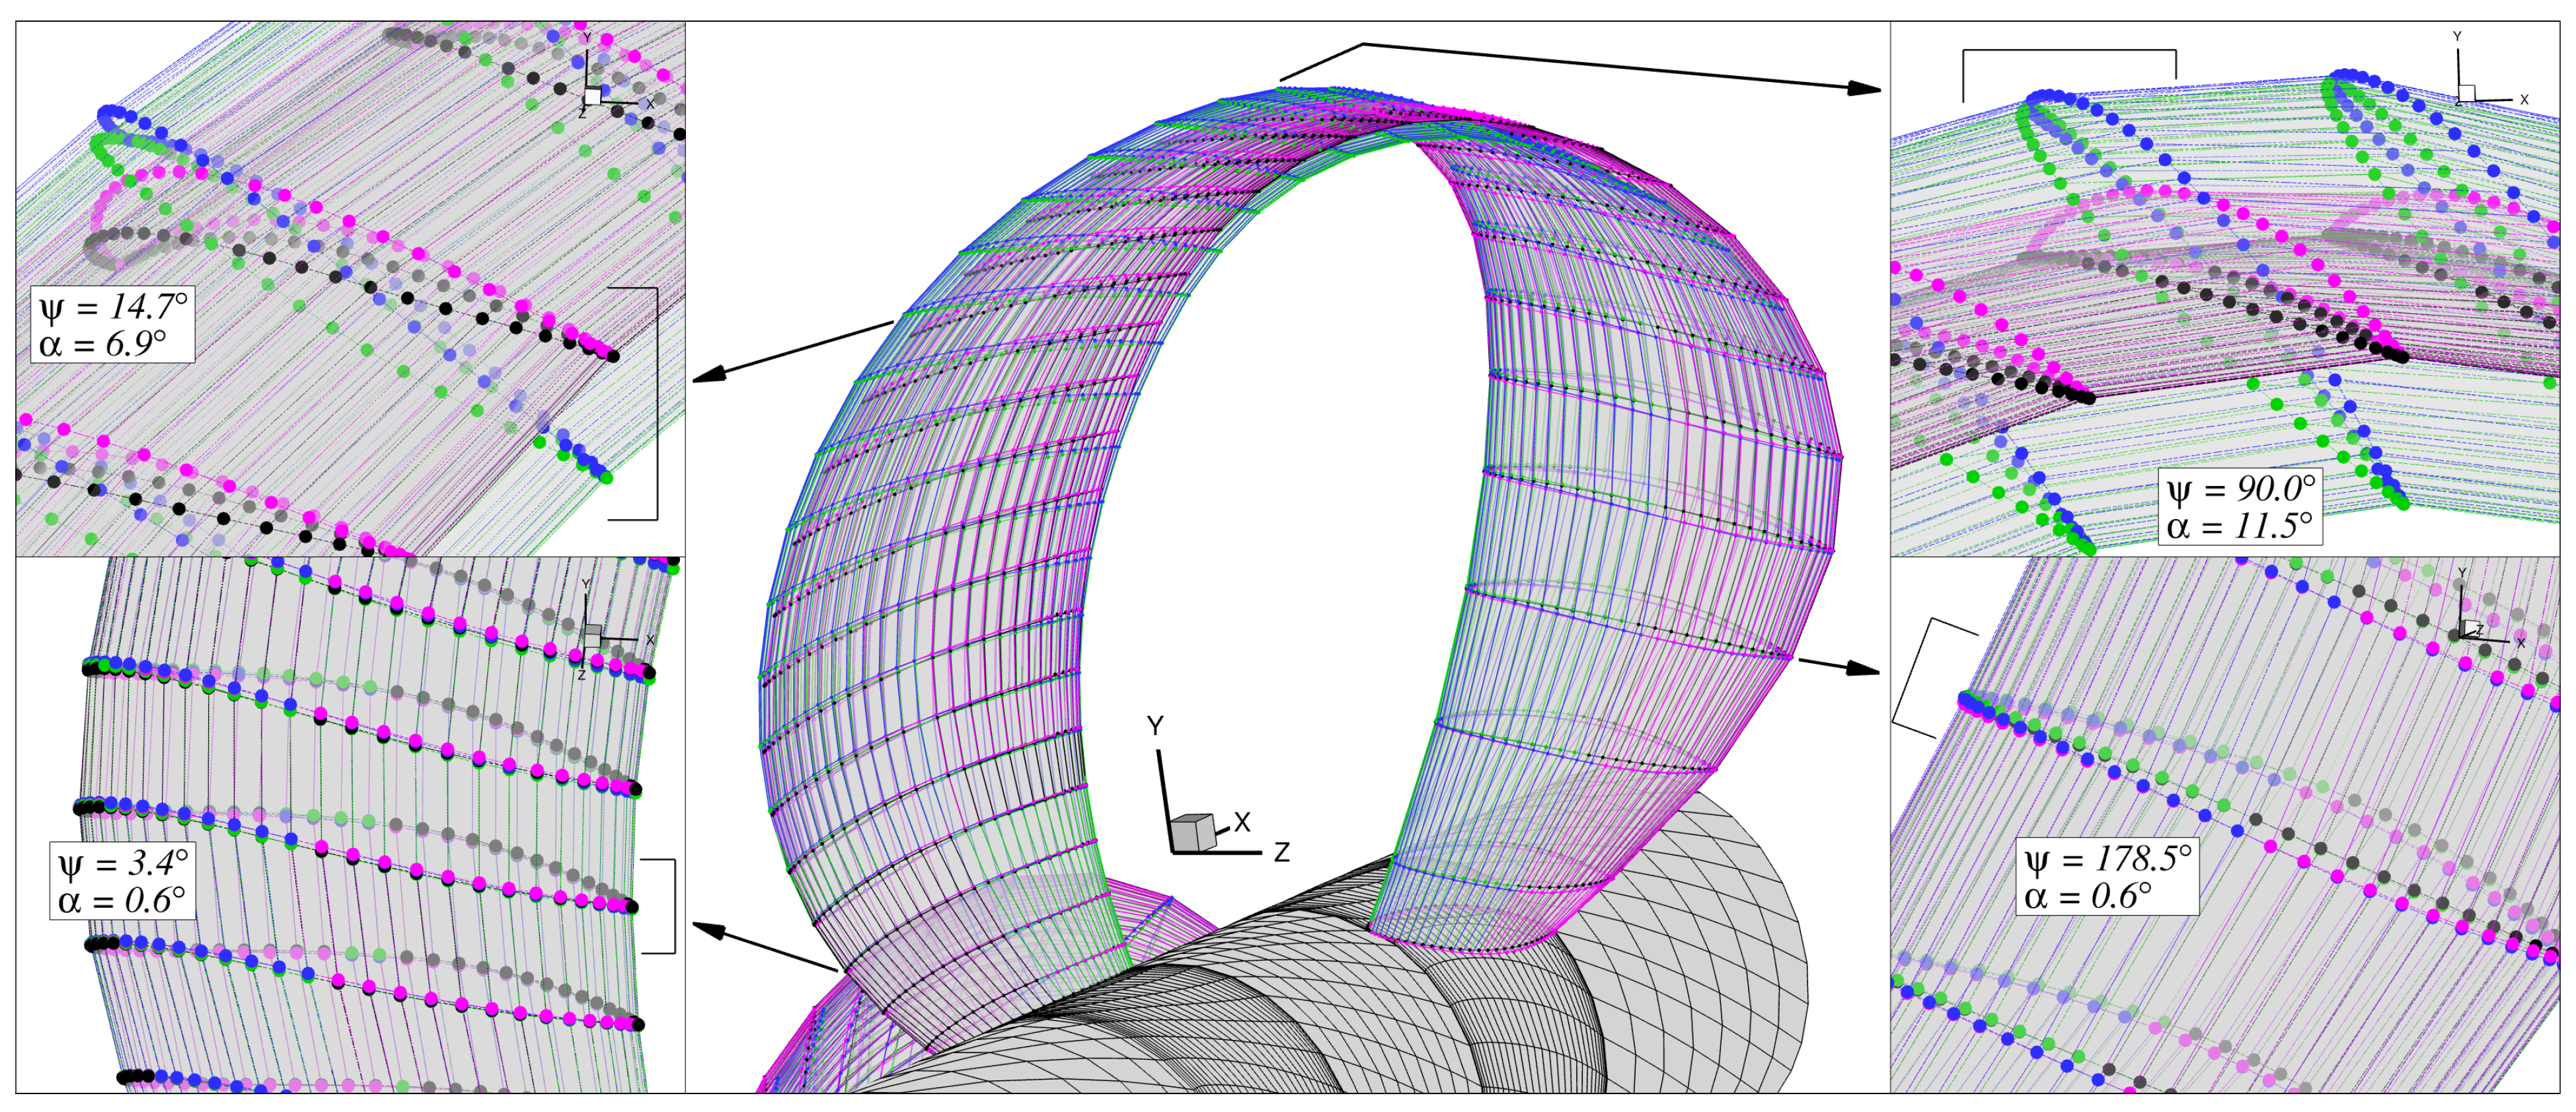
Figure 8 presents the geometric variations of toroidal propellers modeled using the proposed method and incorporating the non-conventional parameters described above. The subframes provide enlarged views of several sections for clearer comparison: the surface formed by black filled scatters represents the baseline geometry, which was constructed using the blade reference line, specified camber, and thickness, as defined in Equation (13). Applying only the rotation angle ψ to this surface results in the geometry shown by the pink filled scatters. Notably, the rear root section is rotated nearly 180 , making a positive camber with respect to the inflow even in the looped blade span. When only the vertical angle α is applied, the base surface is now transformed into the green-marked geometry. Finally, applying both angles yielded the surface shown with the blue filled scatters, with which the open water performance analysis was conducted, as shown in the following sections.

3. Results and Discussions

3.1. Open Water Performance of the Model Propeller

As shown in this section, the proposed method was used with the toroidal propeller geometry published in Ye et al. (2024) [10] to validate the hydrodynamic BEM approach. The detailed geometric profiles defined along the axial span are provided in their paper; therefore, only the key specifications of the model propeller are summarized in Table 1. More recently, Wang et al. (2024) [2] and Kim et al. (2025) [6] (in Korean) tested the same geometry using Reynolds-averaged Navier–Stokes (RANS) simulations, investigating various parameter sets to assess their influence on propeller performance. Their findings provide a database for the selection of appropriate geometric parameters in both the design and analysis of future toroidal propellers.
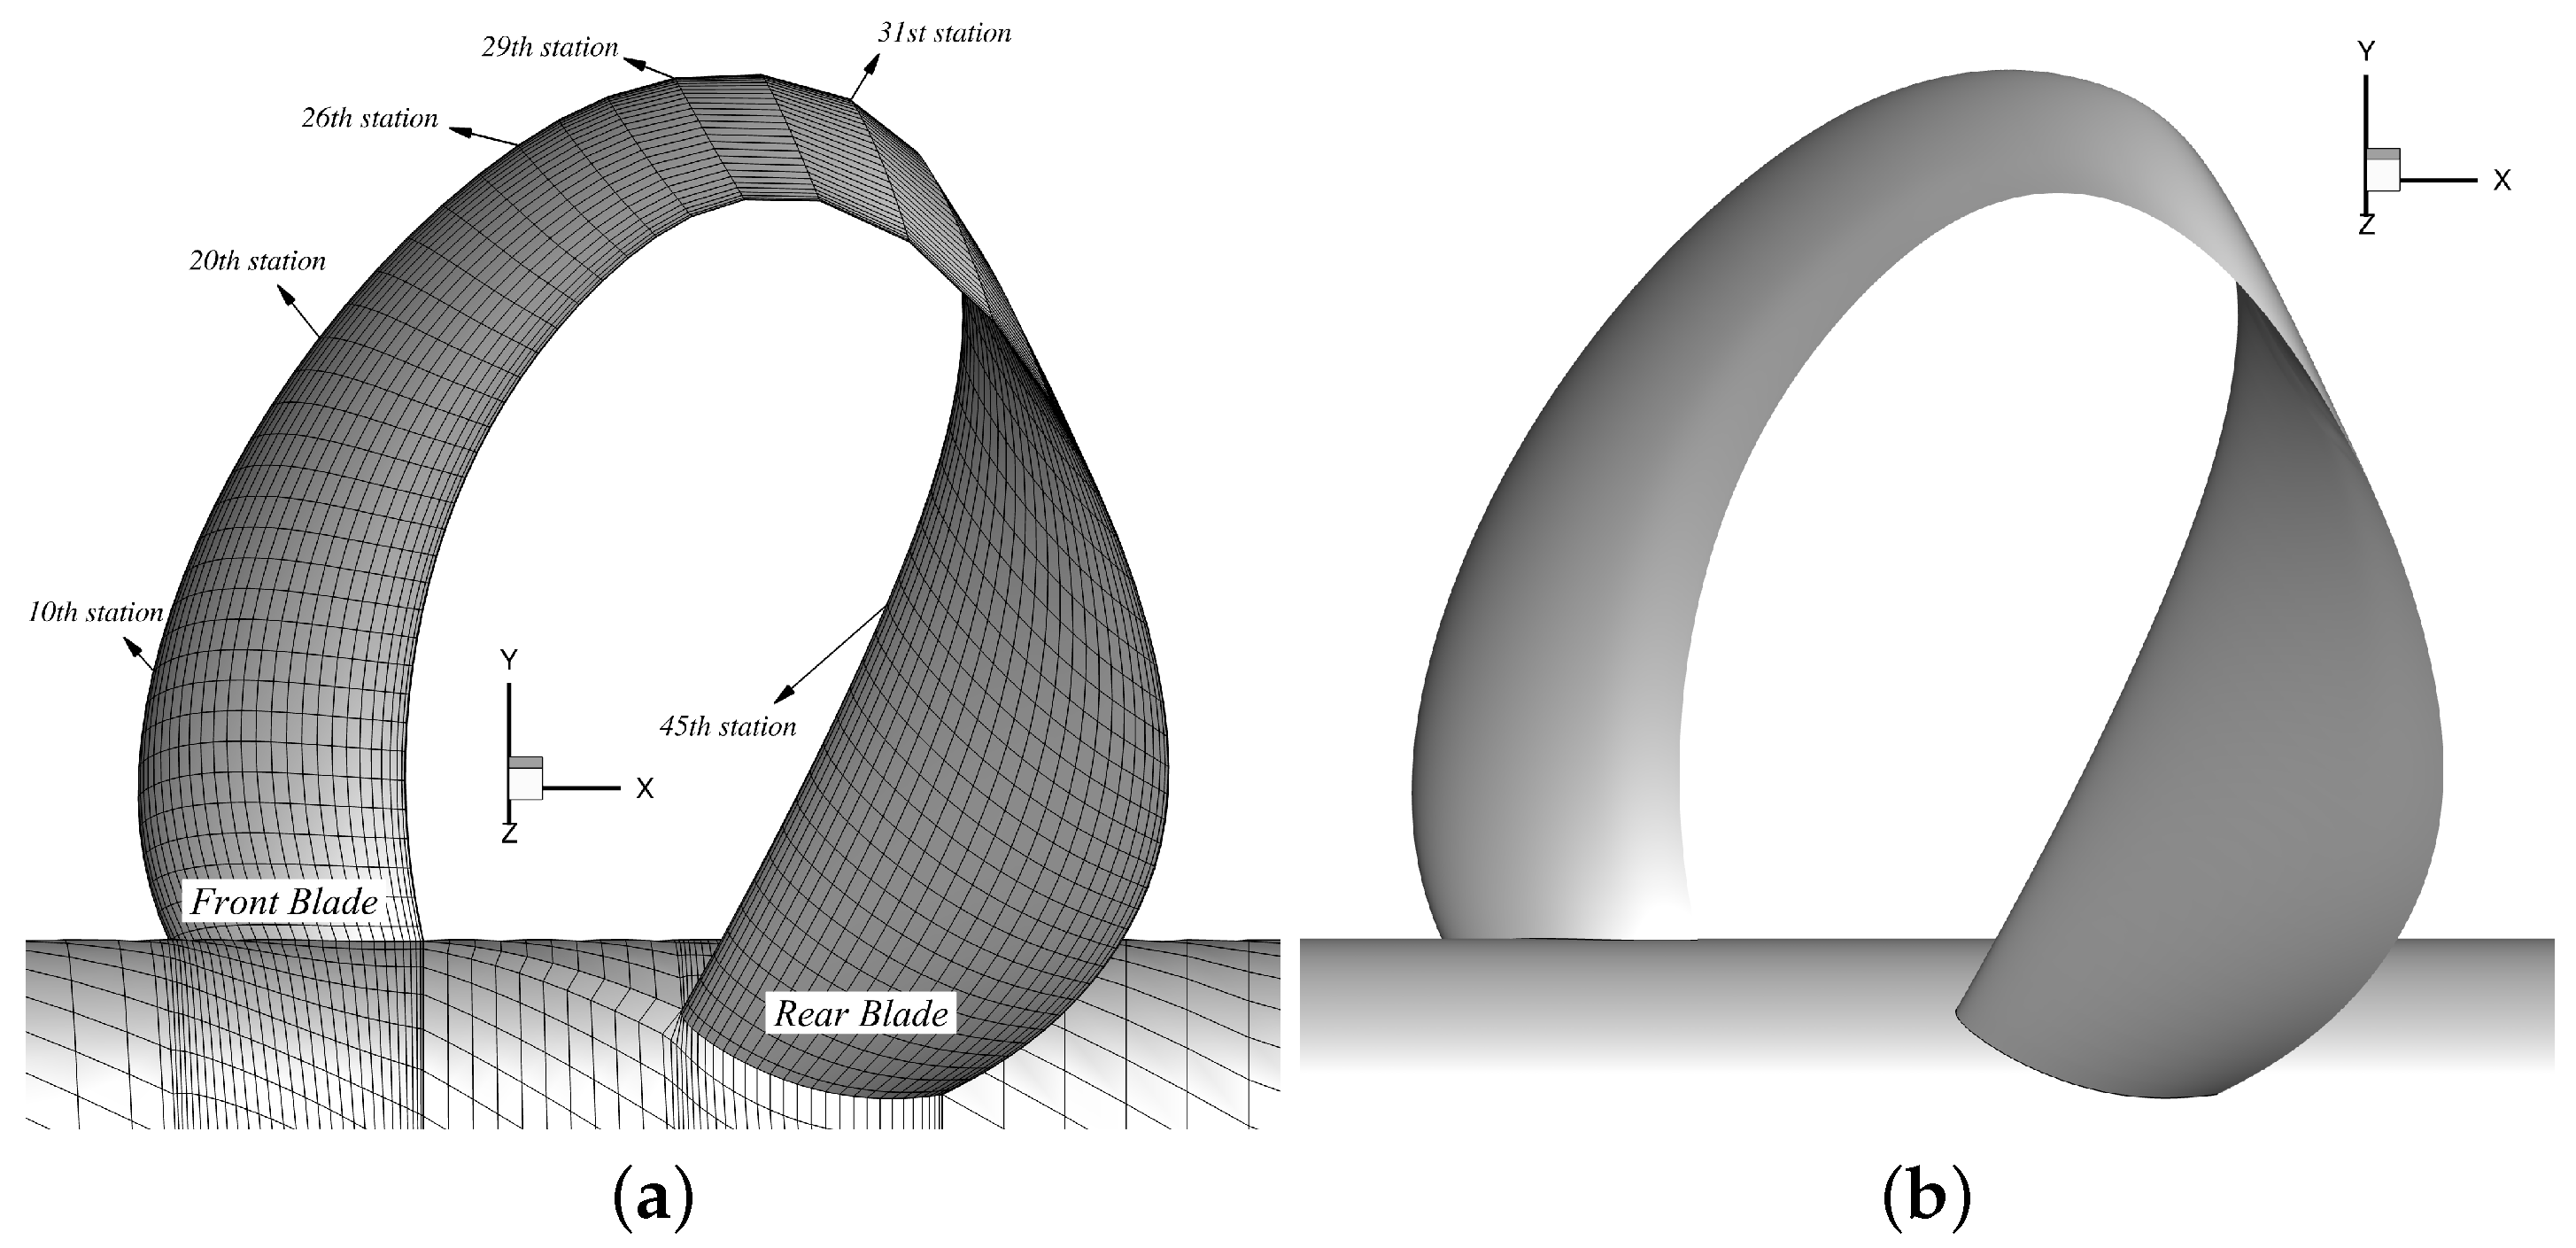
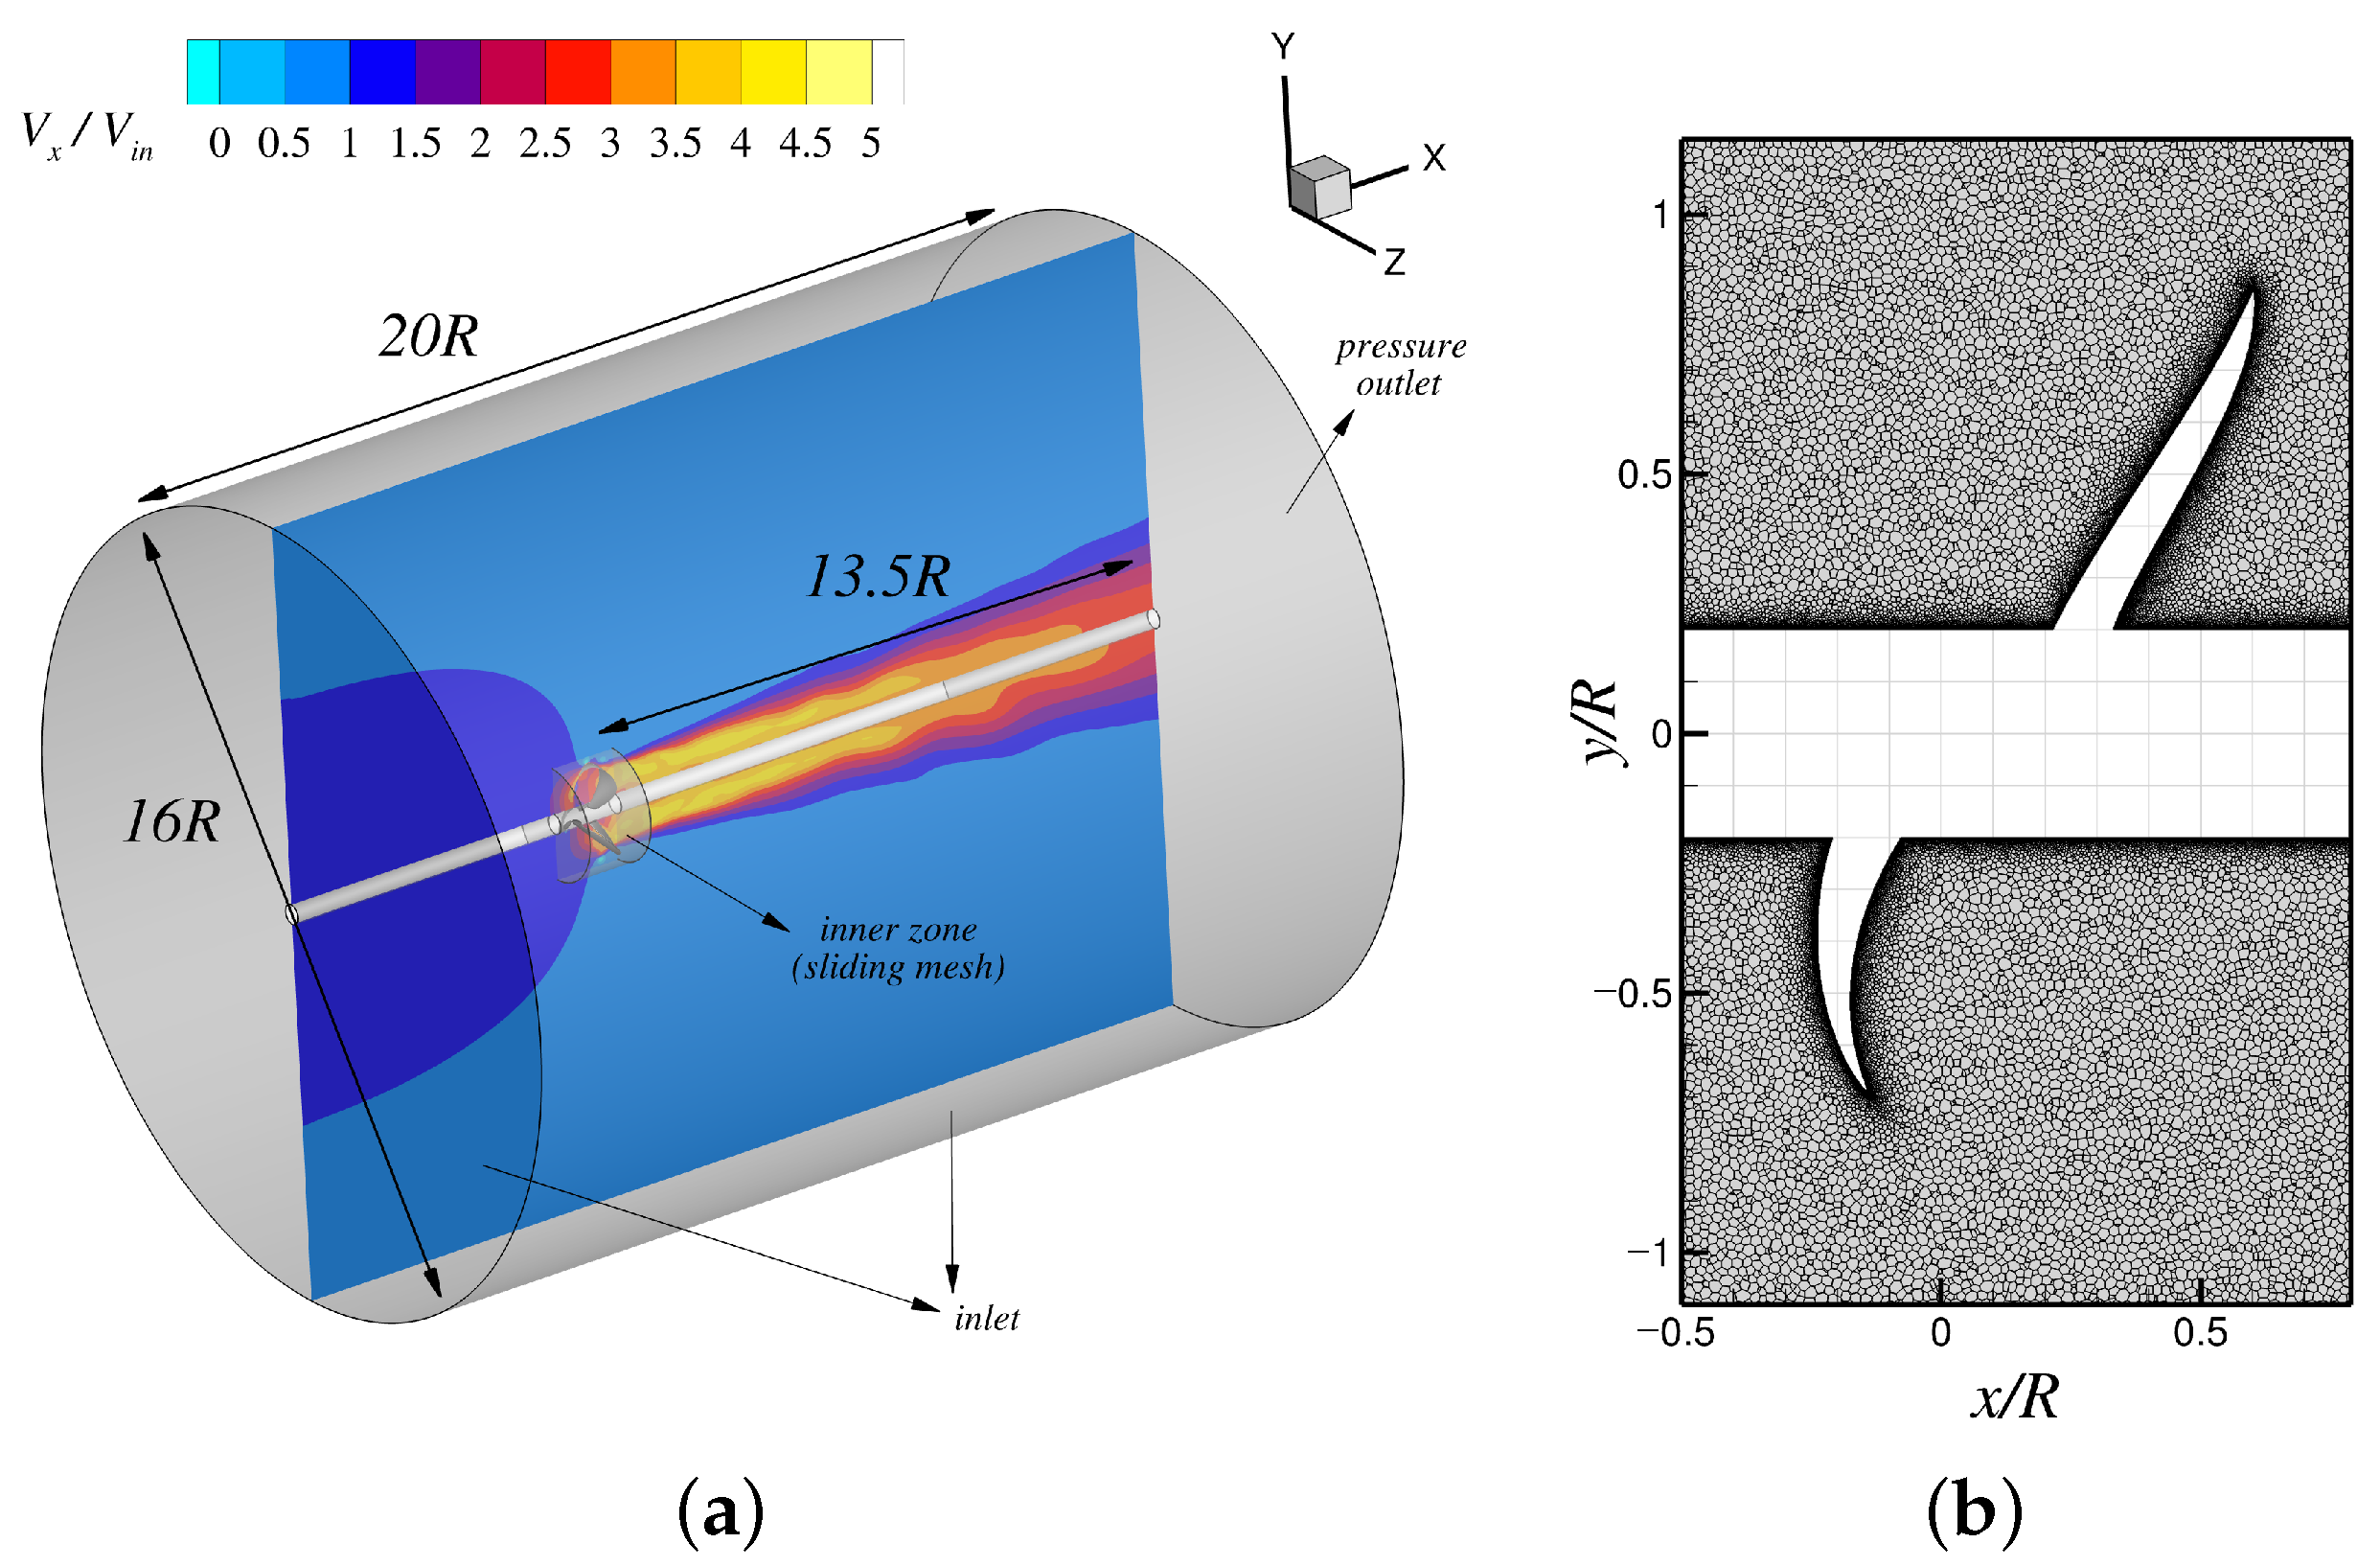
For BEM discretization, the proposed method, using 60 panels in both directions (Figure 9a), utilizes full-cosine spacing in the chordwise direction and uniform spacing in the spanwise direction. For additional validation of the BEM results, RANS simulations were conducted in this study using ANSYS/Fluent (version 2022 R1). Figure 9b and Figure 10a show the model propeller used in the RANS simulations and the computational domain with applied boundary conditions, respectively. The RANS simulations were performed in a fully unsteady manner with a time-step size of θ = 3 per blade motion. The k ω SST turbulence model was adopted with a Reynolds number of R e = V s R ν = 1.0 × 10 6 , which was defined based on the upstream speed V s and the propeller radius R. A second-order implicit scheme was used for time advancement in transient mode. Polyhedral grids were employed in the inner rotating zone (Figure 10b) that conformed with the rotating blades, while quadrilateral grids were given elsewhere. The overall domain dimensions were set wide enough to avoid tunnel effects. The QUICK and SIMPLEC schemes were selected for spatial discretization and pressure–velocity coupling, respectively. Convergence residuals were set to 1.0 × 10 6 for all solving variables, and most of them met the tolerance except for the continuity, which remained around 7.0 × 10 6 after 30 iterations per time step. About 22.6 million cells were used to discretize the whole computational domain, and each simulation took more than one day per advance ratio to achieve stabilized forces (without mesh generation time), with a longer runtime observed for low advance ratios. Although most of the simulations in modern CFD analysis are largely automated from setup to execution, the total computational cost still remains substantial compared with what is incurred by BEM, which requires about five to ten minutes depending on loading to complete the same case and when running on much fewer computing nodes (The BEM and RANS simulations were performed on a Windows workstation equipped with a 12th Gen Intel(R) Core(TM) i7 processor (2.50 GHz) and 64 GB of RAM; the RANS simulations were executed using 64 computing nodes, while the BEM computations employed 8 nodes in parallel mode). Moreover, from the input parameters, the geometry production prior to the hydrodynamic analysis takes less than one second.
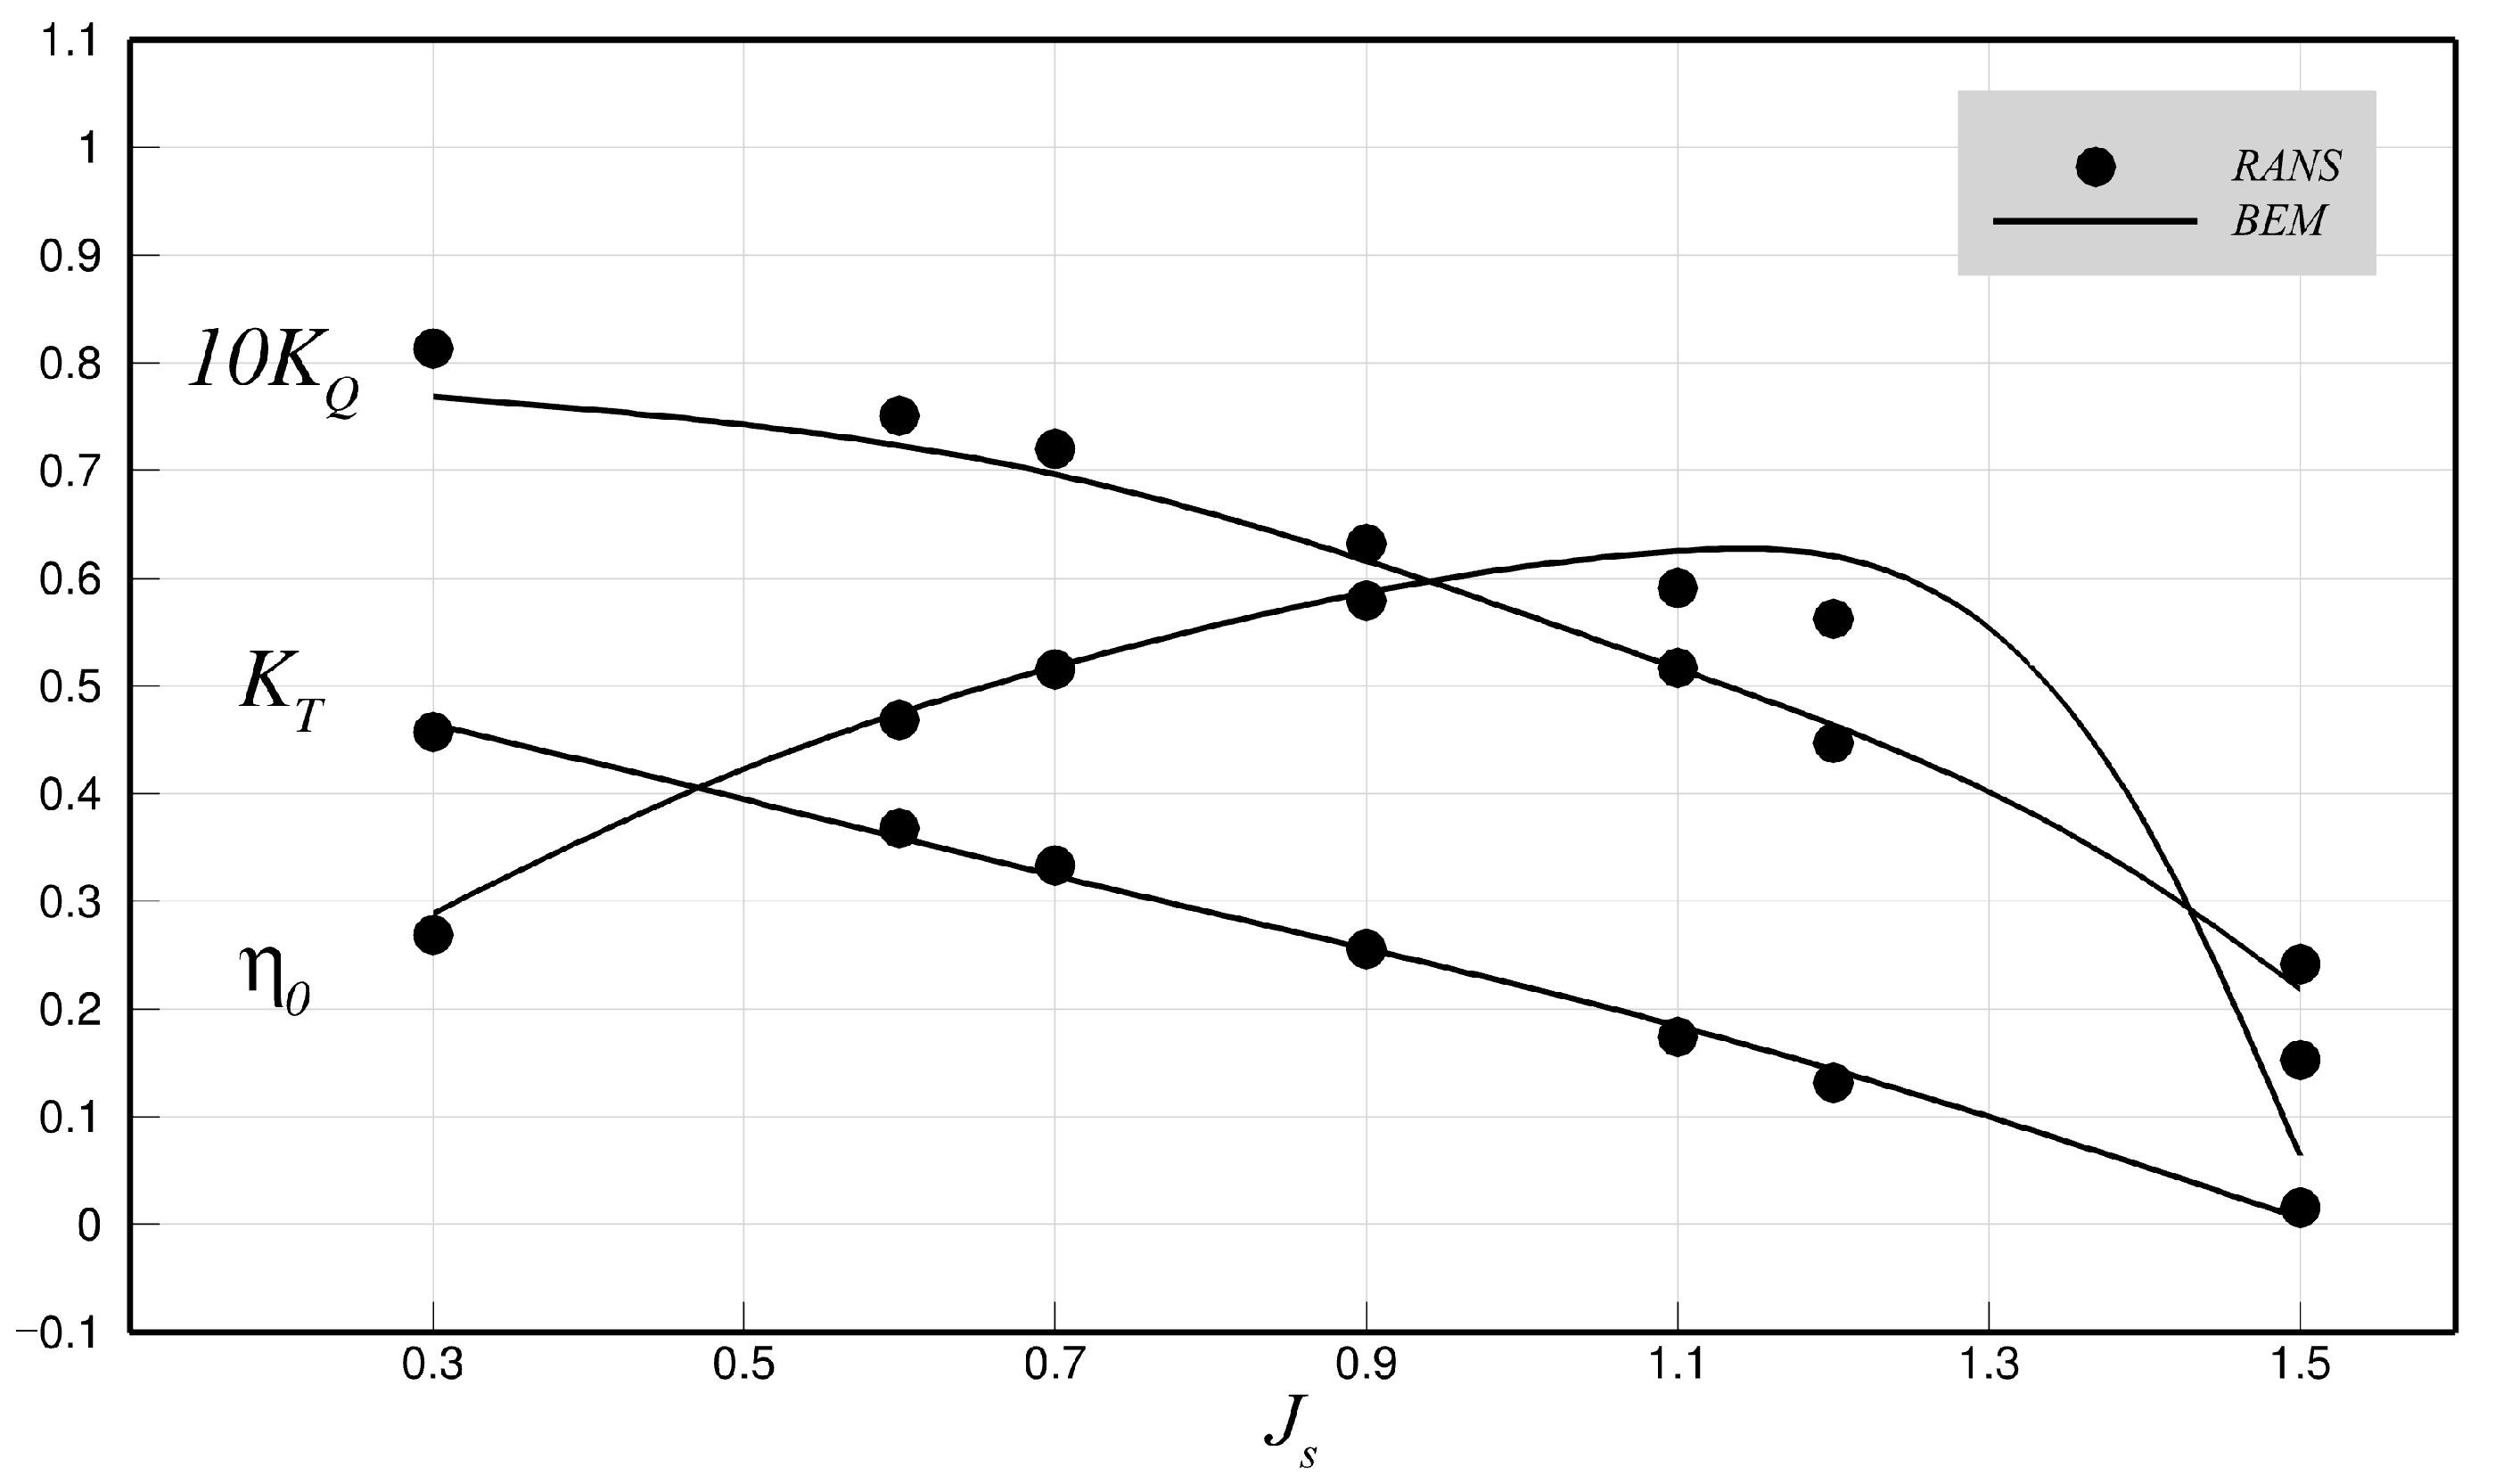
Figure 11 presents the open water performance of the model propeller, as analyzed using the present method, in comparison with RANS. The thrust and torque coefficients, K T and K Q , in the figure are defined following the equations:
K T = T ρ n 2 D 4 K Q = Q ρ n 2 D 5 η 0 = J s 2 π K T K Q J s = V s n D ,
where T and Q denote the predicted thrust and torque on the blade, respectively; and D = 2 R and n are the propeller diameter and rotational speed (in revolution per second), respectively. In general, the BEM predictions follow the overall trends and magnitudes observed in the RANS results well, although the torque was shown to be slightly underpredicted with a low J s . The high angles of attack at a low J s with a large pitch and vertical angle lead to, along with flow separation on the suction side of the blade, strong pressure peaks near the leading edge. The separated flow increases pressure drag and viscous losses, which contribute to a higher torque when compared with the fully inviscid predictions by the BEM. It is worth noting that the toroidal propeller produces significantly higher thrust and torque, compared to conventional propellers, mainly because of the combined loading contributions from both blades. However, since both K T and K Q increased simultaneously, the propulsive efficiency did not show a notable improvement over that of conventional propellers under the present configuration.
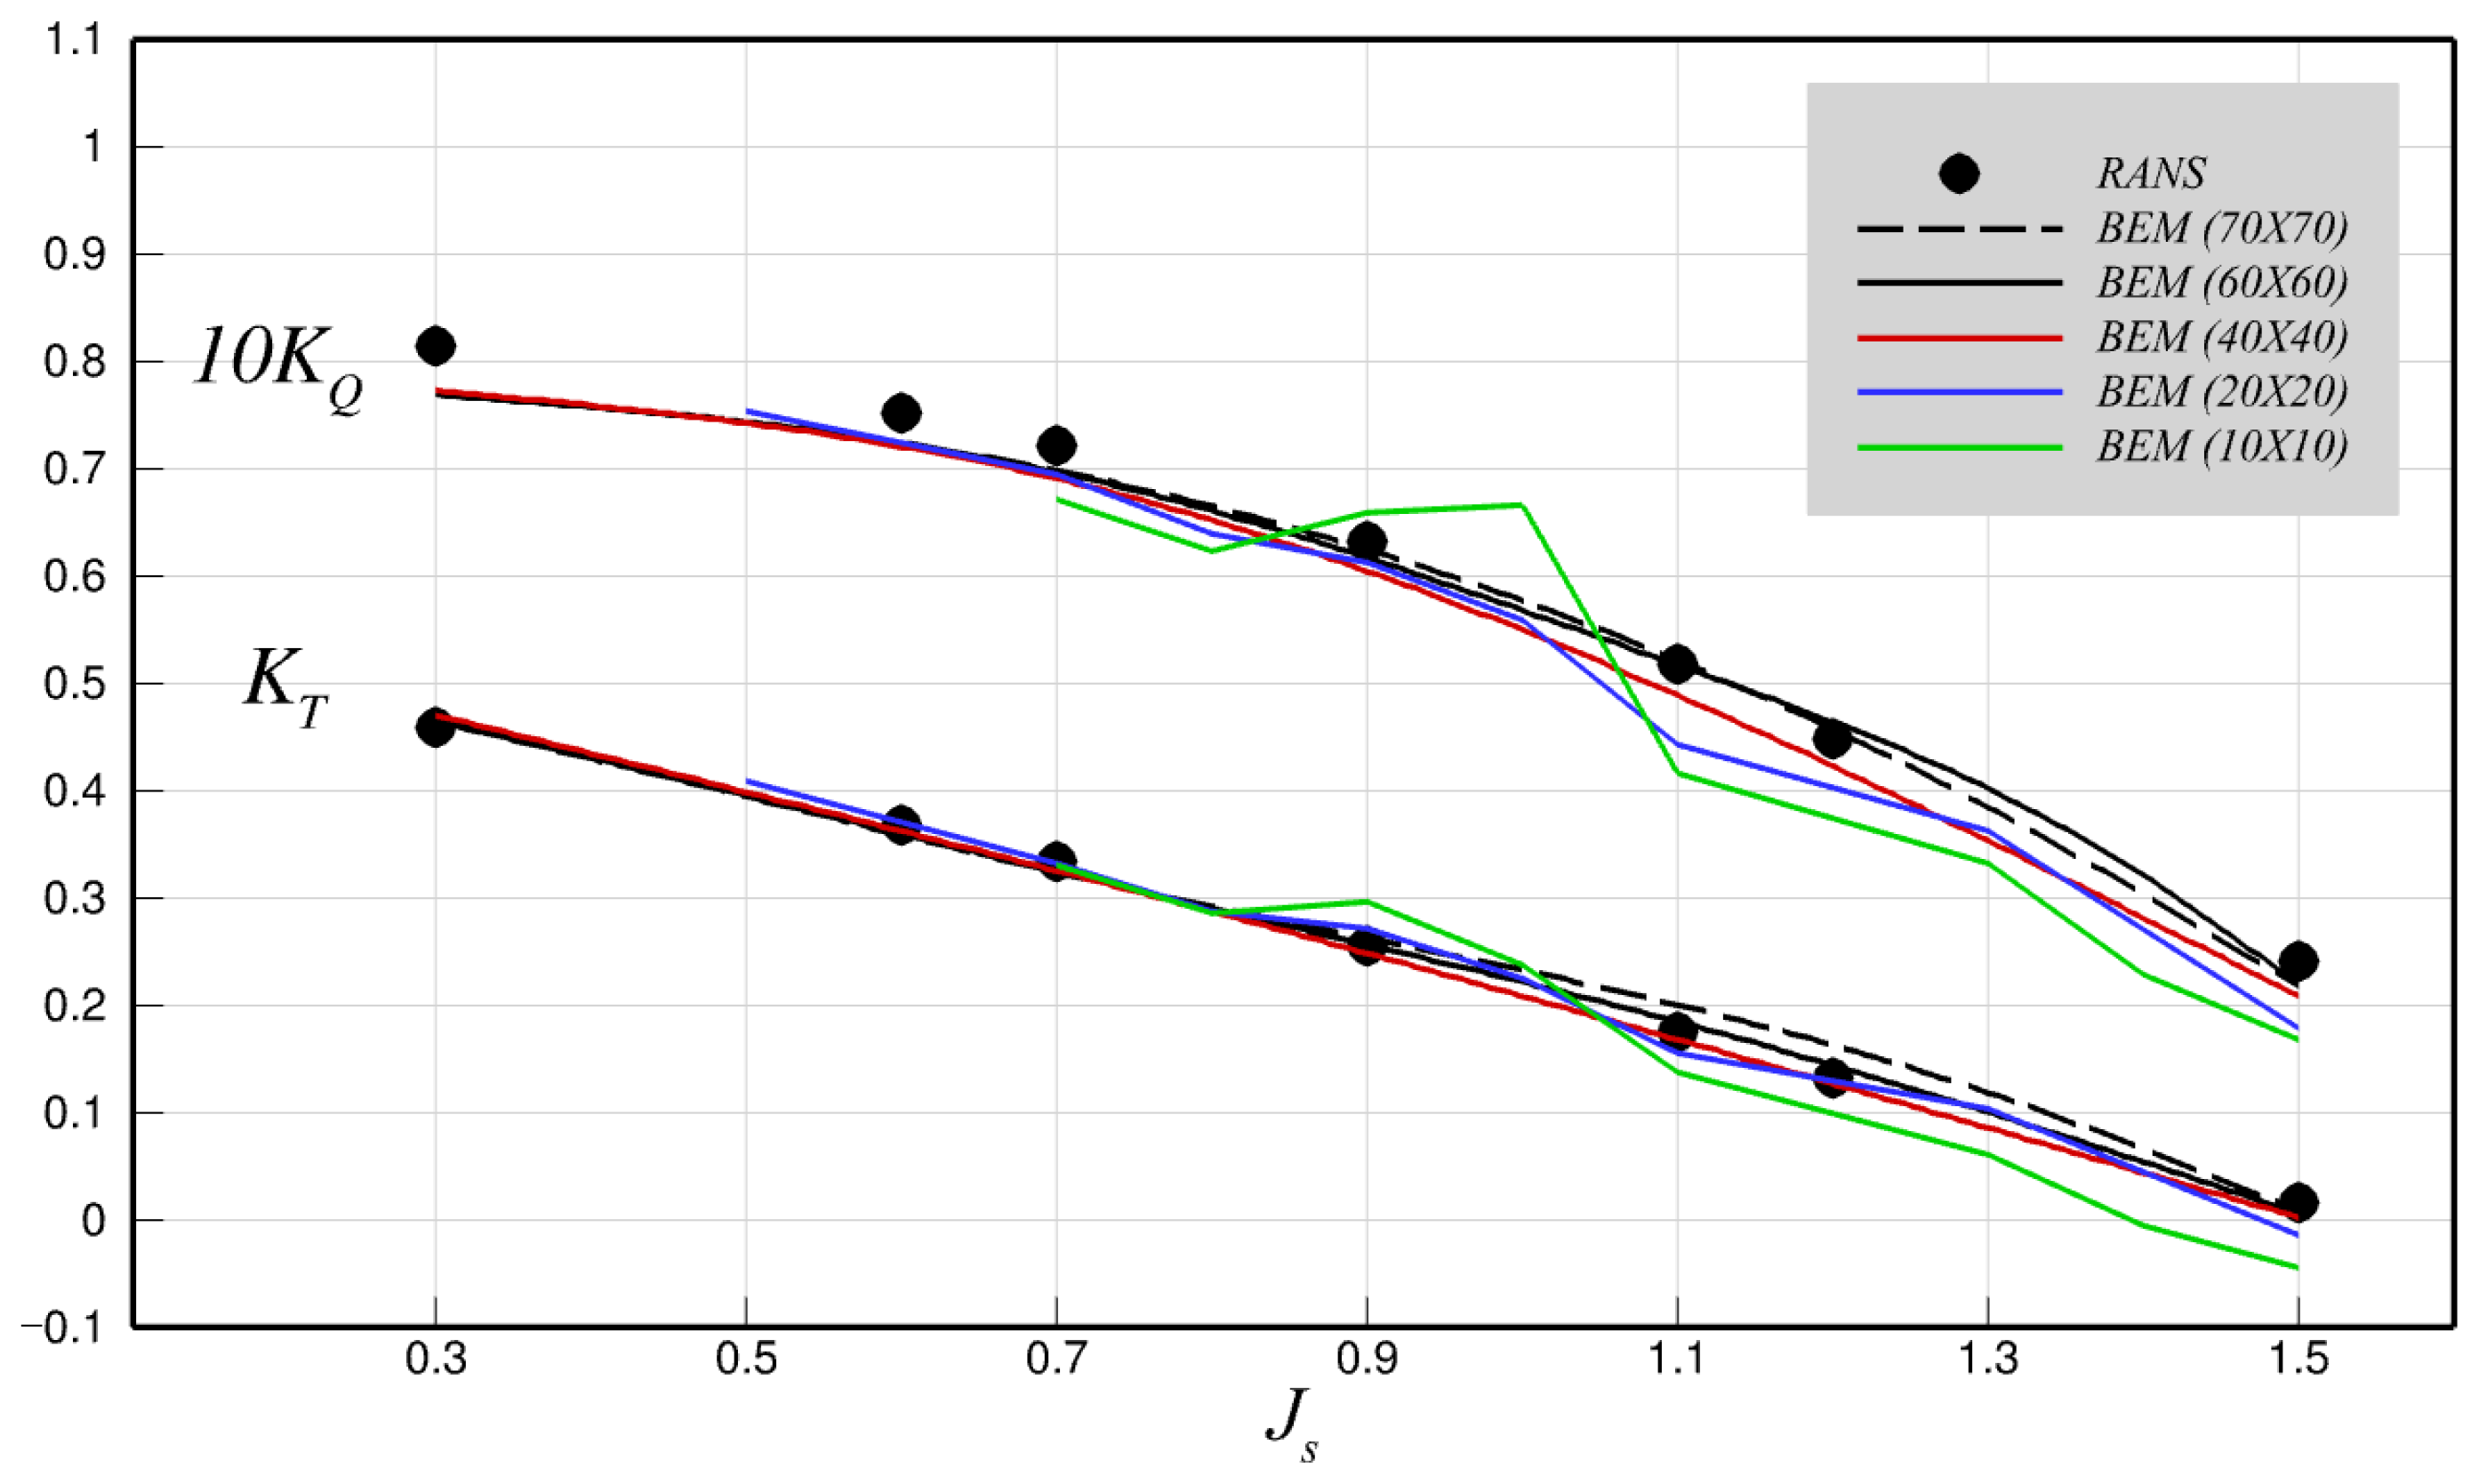
Following the open water test, a grid independence study was conducted using different panel densities on the blade surface (Figure 12). The hub panels connected to the blade roots were adapted according to the number of blade panels in the chordwise direction. Five different grid densities were tested, and the corresponding open water performance are presented in Figure 13. The panel density had a noticeable influence on the numerical predictions. The coarsest grid (the 10 × 10 case) shows very unstable and inconsistent performance trends, which improved progressively with finer discretizations. Beyond the current setup ( 60 × 60 ), the predicted thrust and torque showed no significant deviation at a lower J s , in which the higher angles of attack effectively suppressed the intense blade–wake interactions, as will be discussed next in detail. Minor fluctuations were observed at higher J s . The toroidal propeller, in particular, exhibited unstable predictions at these conditions, mainly because the reduced angle of attack causes the front blade wake to impinge directly on the rear blade. Under such conditions, a sufficiently fine panel resolution is required to ensure more reliable performance predictions.
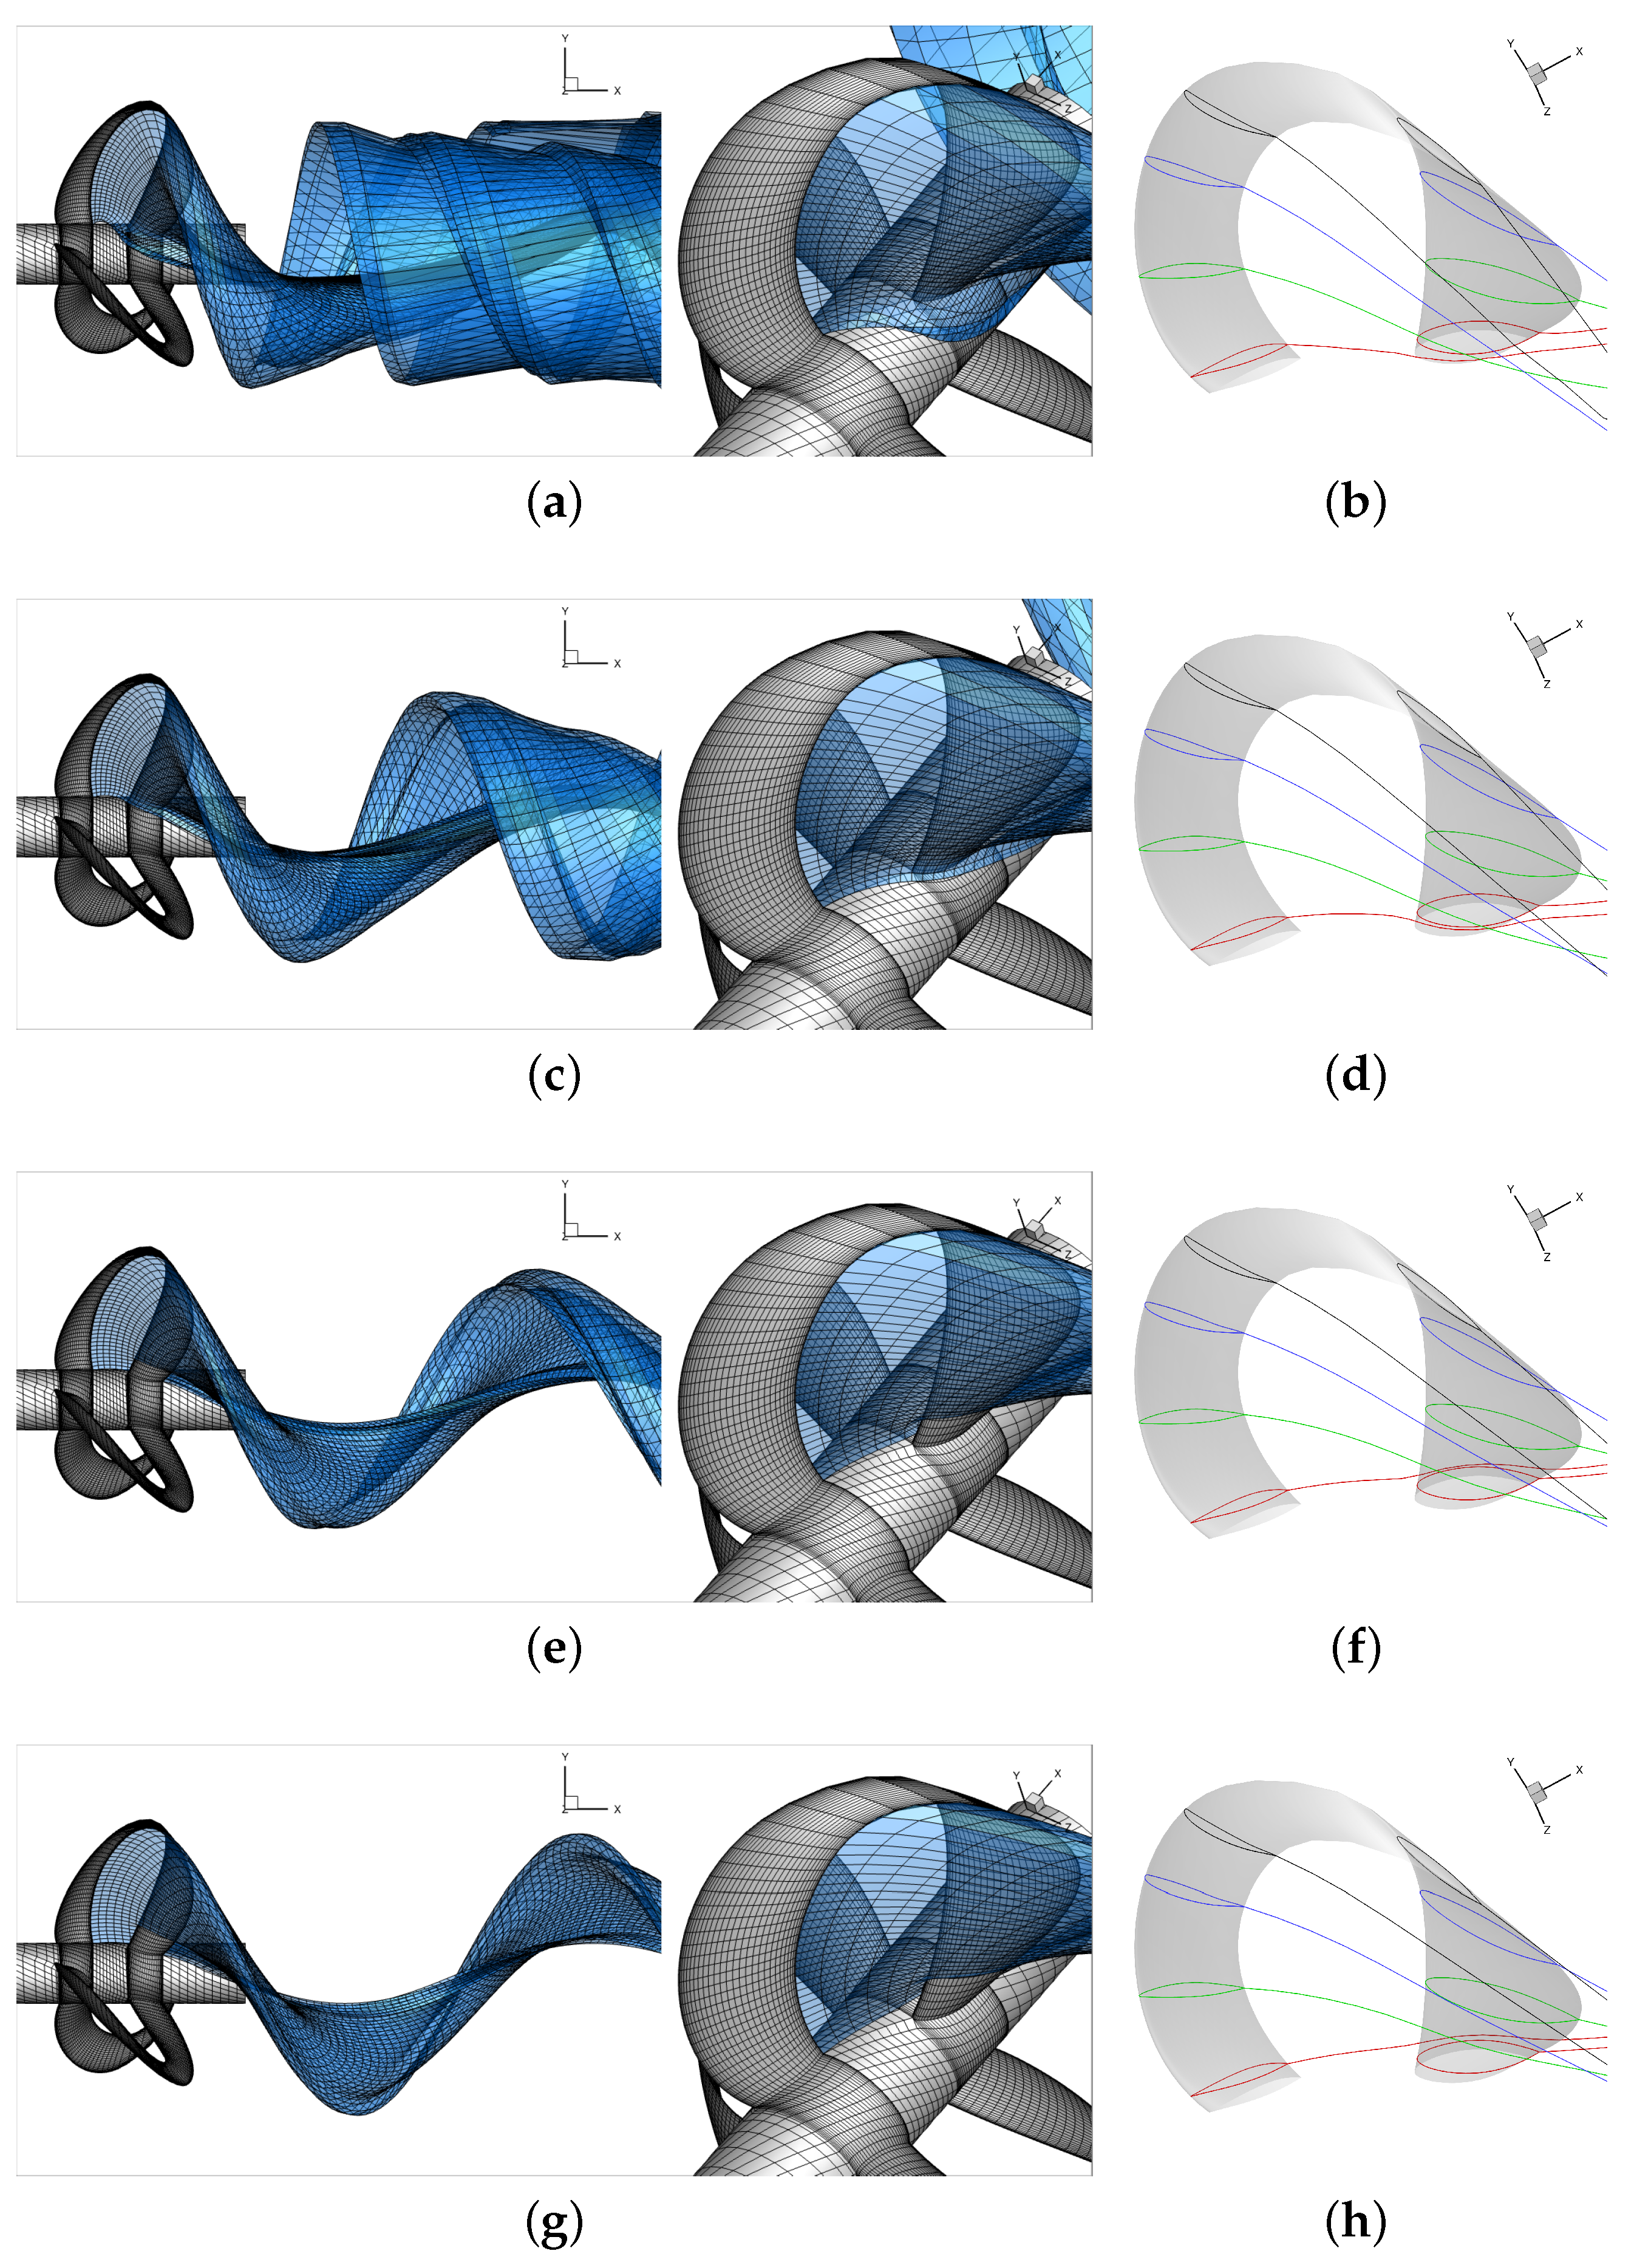
Figure 14 show the fully aligned wake under four different loading conditions, corresponding to J s = 0.3 , 0.7 , 1.1 , and 1.5 . Each subfigure shows the intersection between the blade and its wake at several cylindrical cross sections for different radial locations. Previous studies on conventional propellers [13,14,15] have shown that the wake has a significant influence on the performance of both open and ducted propellers when using the panel method. The main cause arises from concentrated vortices (that is, the trailing wake panels), which can induce numerical singularities when they convect too close to wall boundaries during the intense propeller–wake interactions. In the present work, the most advanced wake alignment model [13] was adopted, aligning the four nodal points of each wake panel based on the induced velocities from the blade, hub, and the wake itself. Unlike conventional propellers, toroidal propellers require an additional treatment because the trailing wake shed from the front blade may intersect or even split the rear blade, as shown in Figure 14e,g. In cases where a wake panel intersects with the blade surface during the wake alignment process, its nodal points that fall inside the blade surface are repositioned onto the rear blade surface. This repositioning is normally performed during the initial wake alignment stage before the wake becomes fully aligned and stabilized. However, even after relocating the nodal points outside the blade, the associated control points (Note the control point is positioned at the centroid of each quadrilateral panel defined by four nodal points) may still remain inside the blade geometry, as the wake could penetrate through the rear blade. To maintain the physical accuracy of the BEM solution, the influence functions associated with these control points to the propeller need to be neglected when constructing the BEM matrix of the influence function. The toroidal propeller is relatively unaffected by the wake-splitting issue under high loading conditions or when operating at low pitch angels (as shown in Figure 14a,c) because the wake passes the rear blade with sufficient clearance; however, as the J s increases, the wake–blade intersection becomes more pronounced.
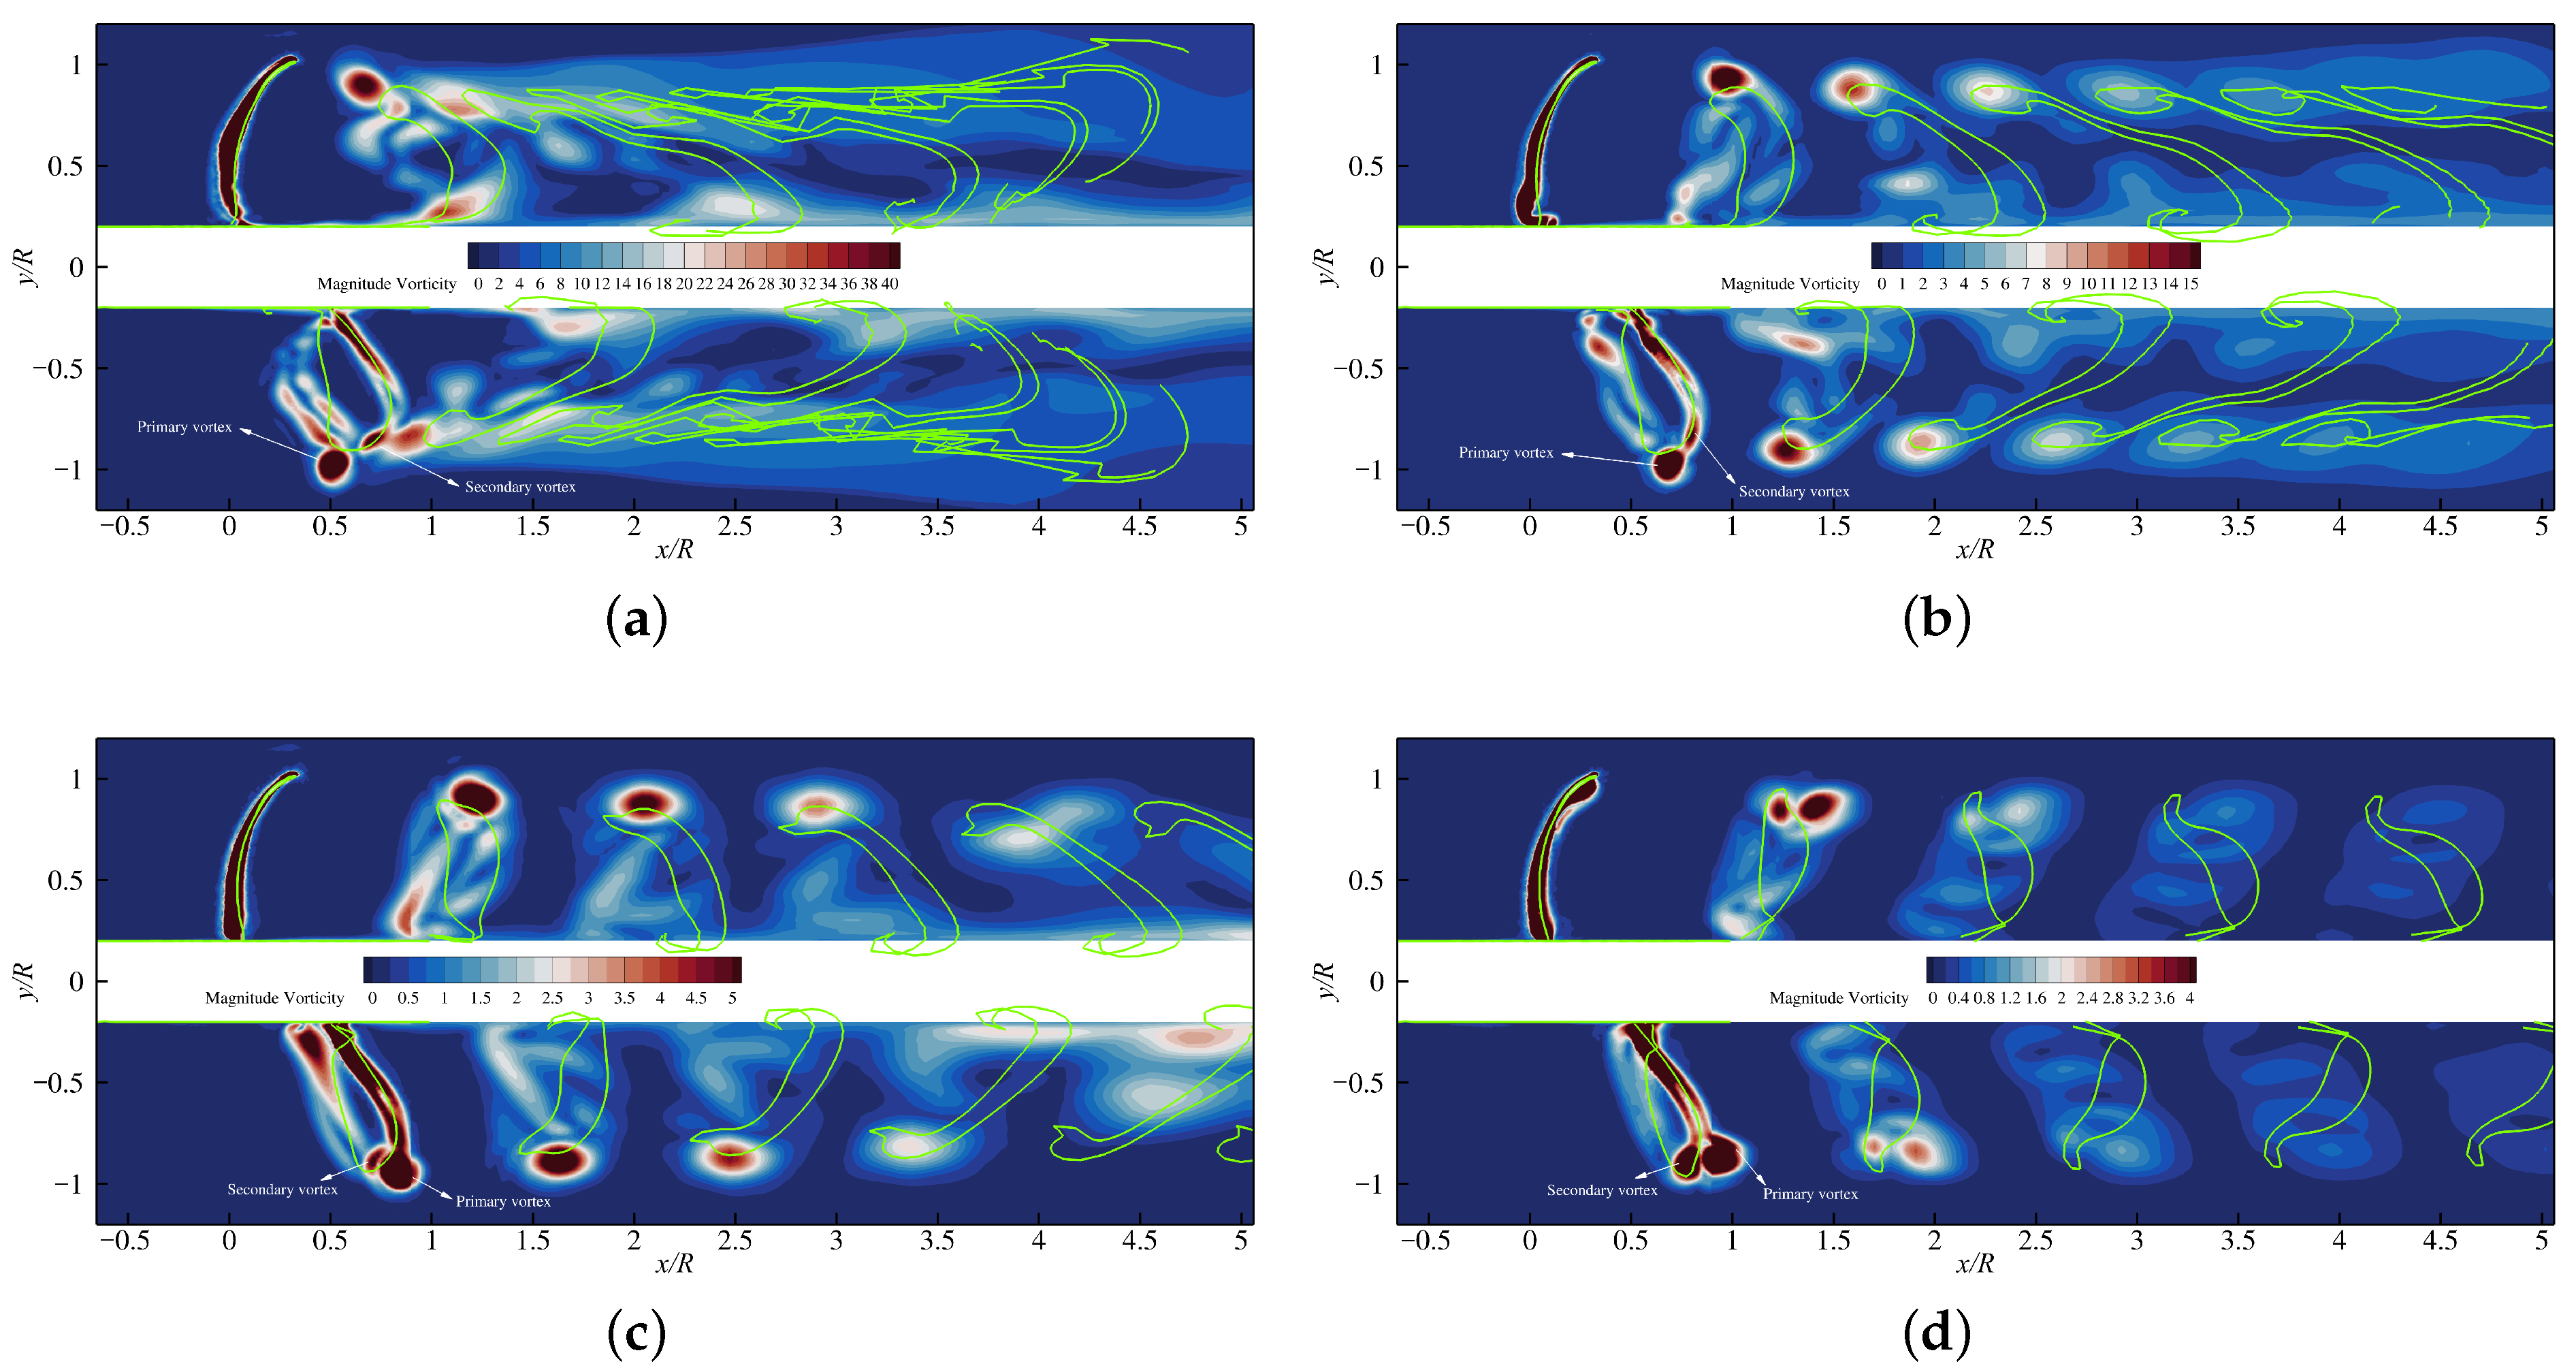
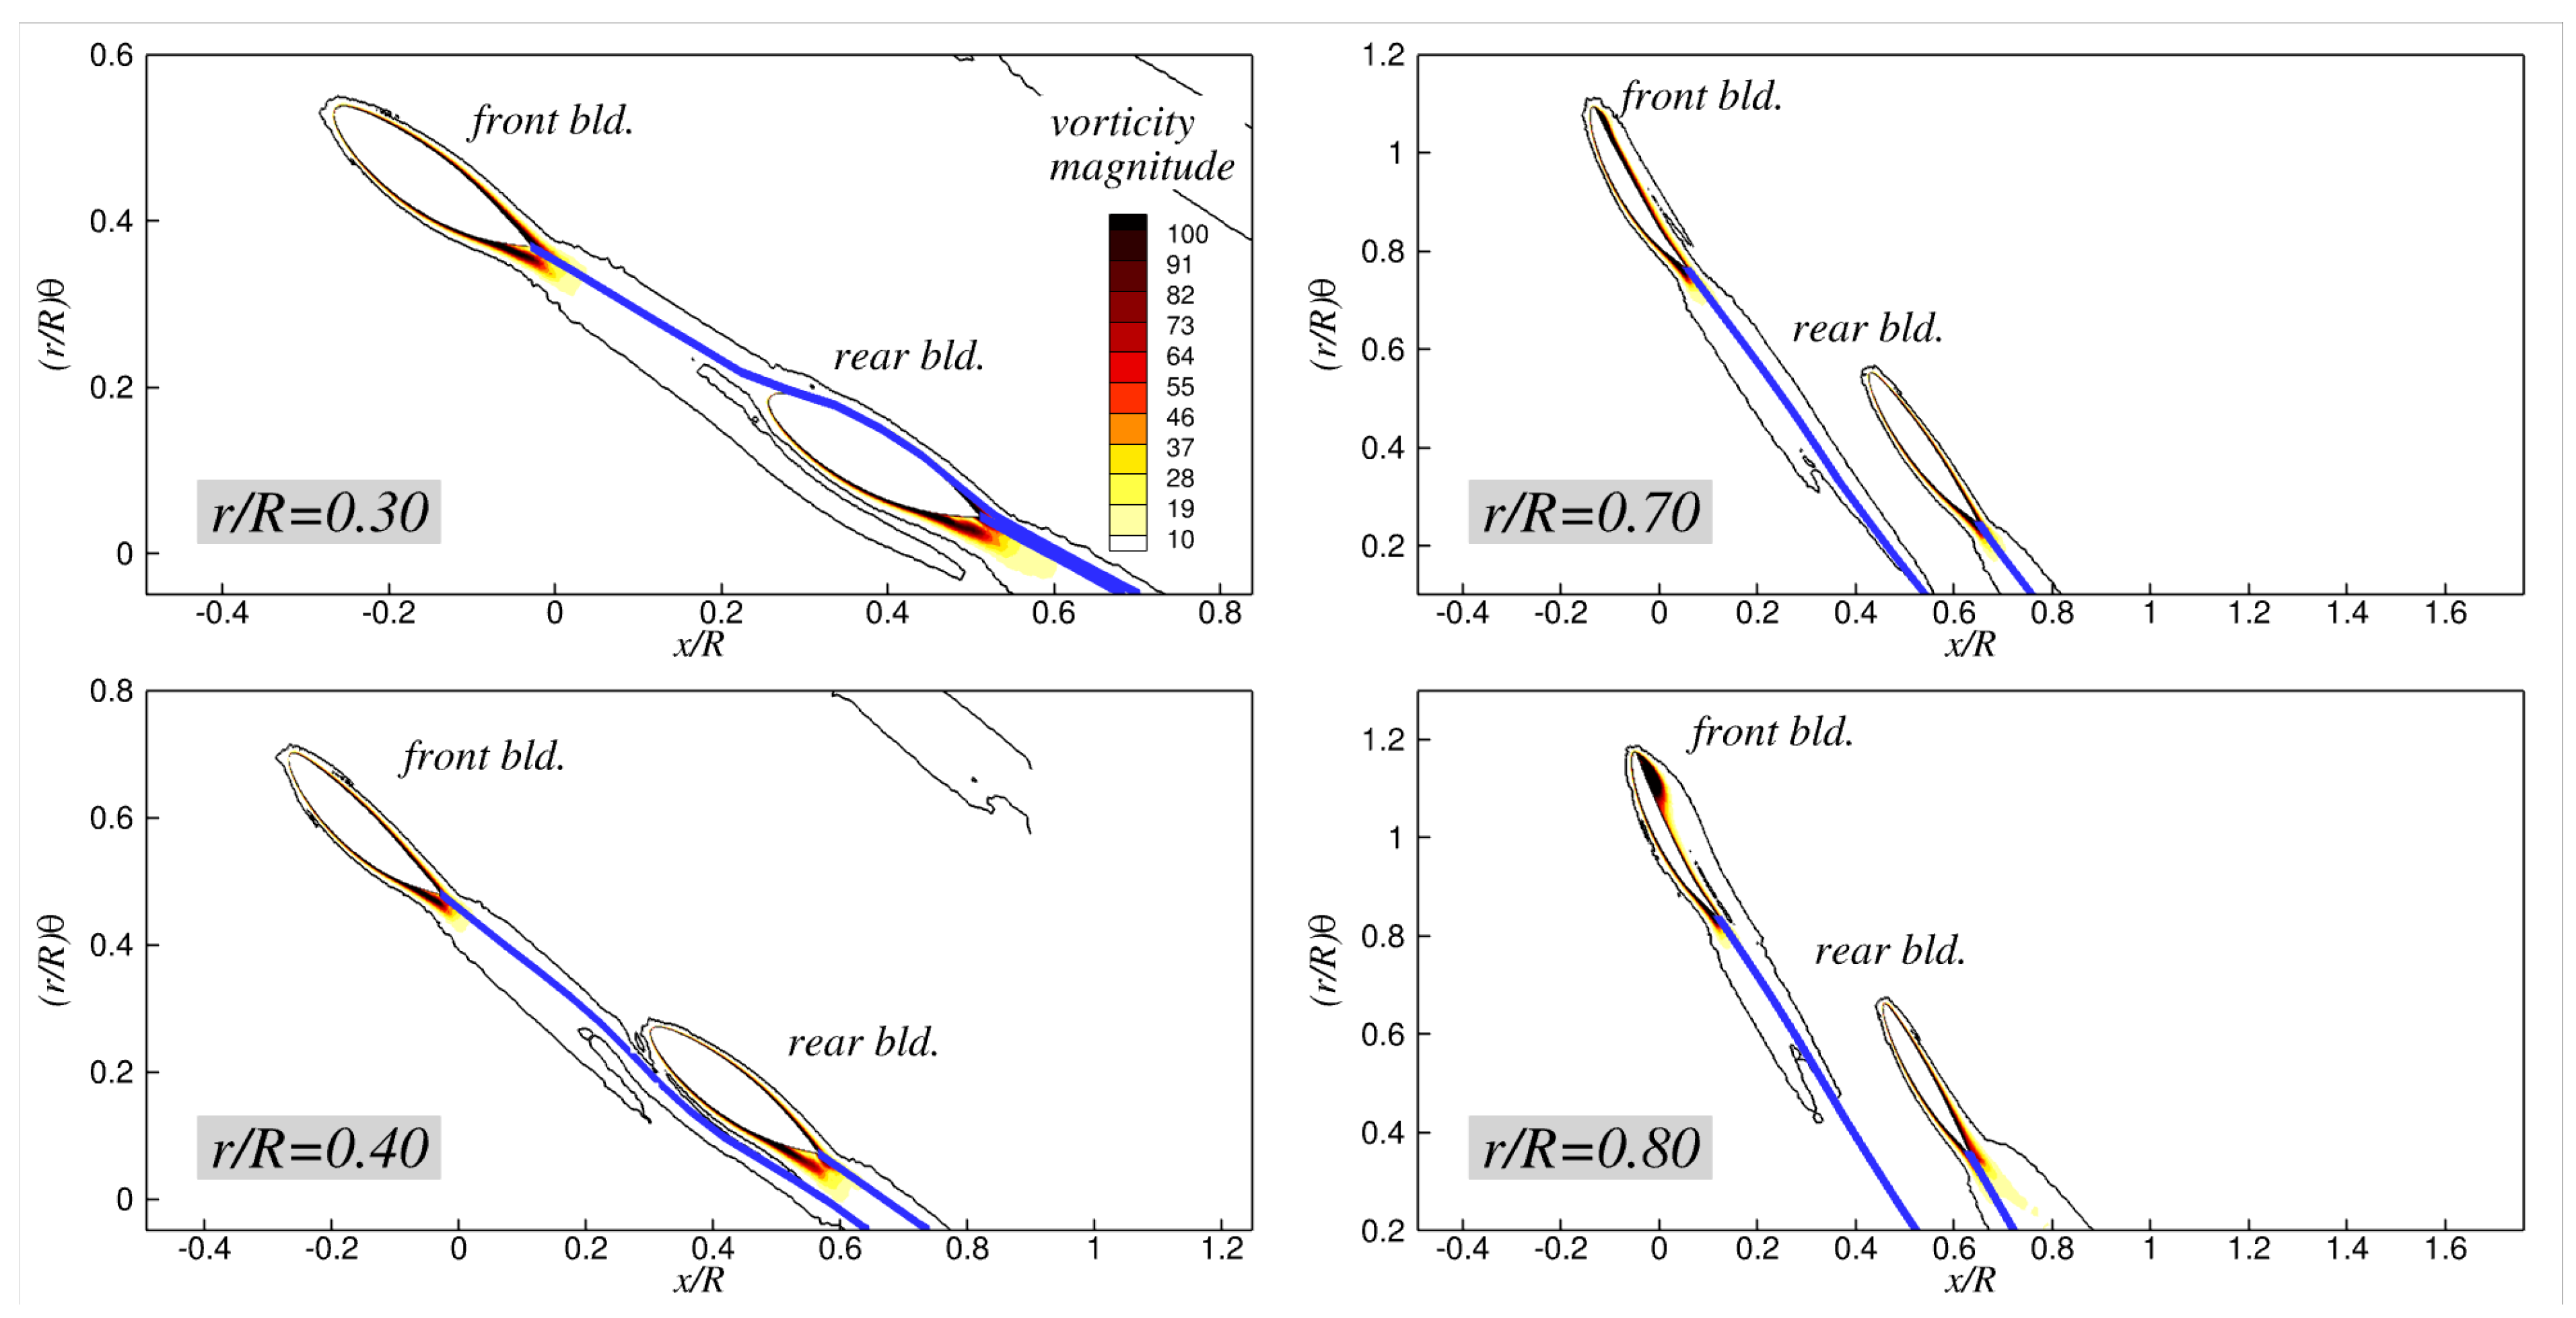
Figure 15 presents contour plots of the vorticity magnitude on the x y plane predicted by the RANS simulations, and these are overlaid with the BEM wake panels (shown as green solid lines) on the same plane for four different advance ratios. As is shown, the lower the advance ratio, the stronger the vorticity shed from both blades, and the vortical structures gradually diffused as they were convected downstream. The locations of the concentrated vorticity in the wake predicted by the BEM did not exactly match those from the RANS predictions. The model toroidal propeller exhibited two distinct vortical structures: one referred to as the primary vortex, and the other as the secondary vortex. The primary vortex mainly developed from the leading edge of the front blade (thus, it is a leading-edge vortex), and it was convected over the looped tip, resulting in its position being at a higher radial location in the wake compared with the BEM wake panels. The secondary vortex, which forms near the tip region, gradually shifted toward the pressure side of the front blade with J s due to the reversed angle of attack on the blade, and it eventually started to originate from the leading edge along the pressure side of the front blade. Consequently, the positions of the concentrated secondary vortices in the wake moved forward in the axial direction relative to the primary vortex at high J s , and they fell inside the looped blade region (Figure 15d). The mismatch in the wake locations between the BEM and RANS predictions might be attributed to not only the presence of the leading-edge vortices that were not accounted for in the proposed BEM formulation, but also due to the vortical interactions between the shed wake and the rear blade, which can lead to wake breakdown and diffusion during wake–blade interactions.
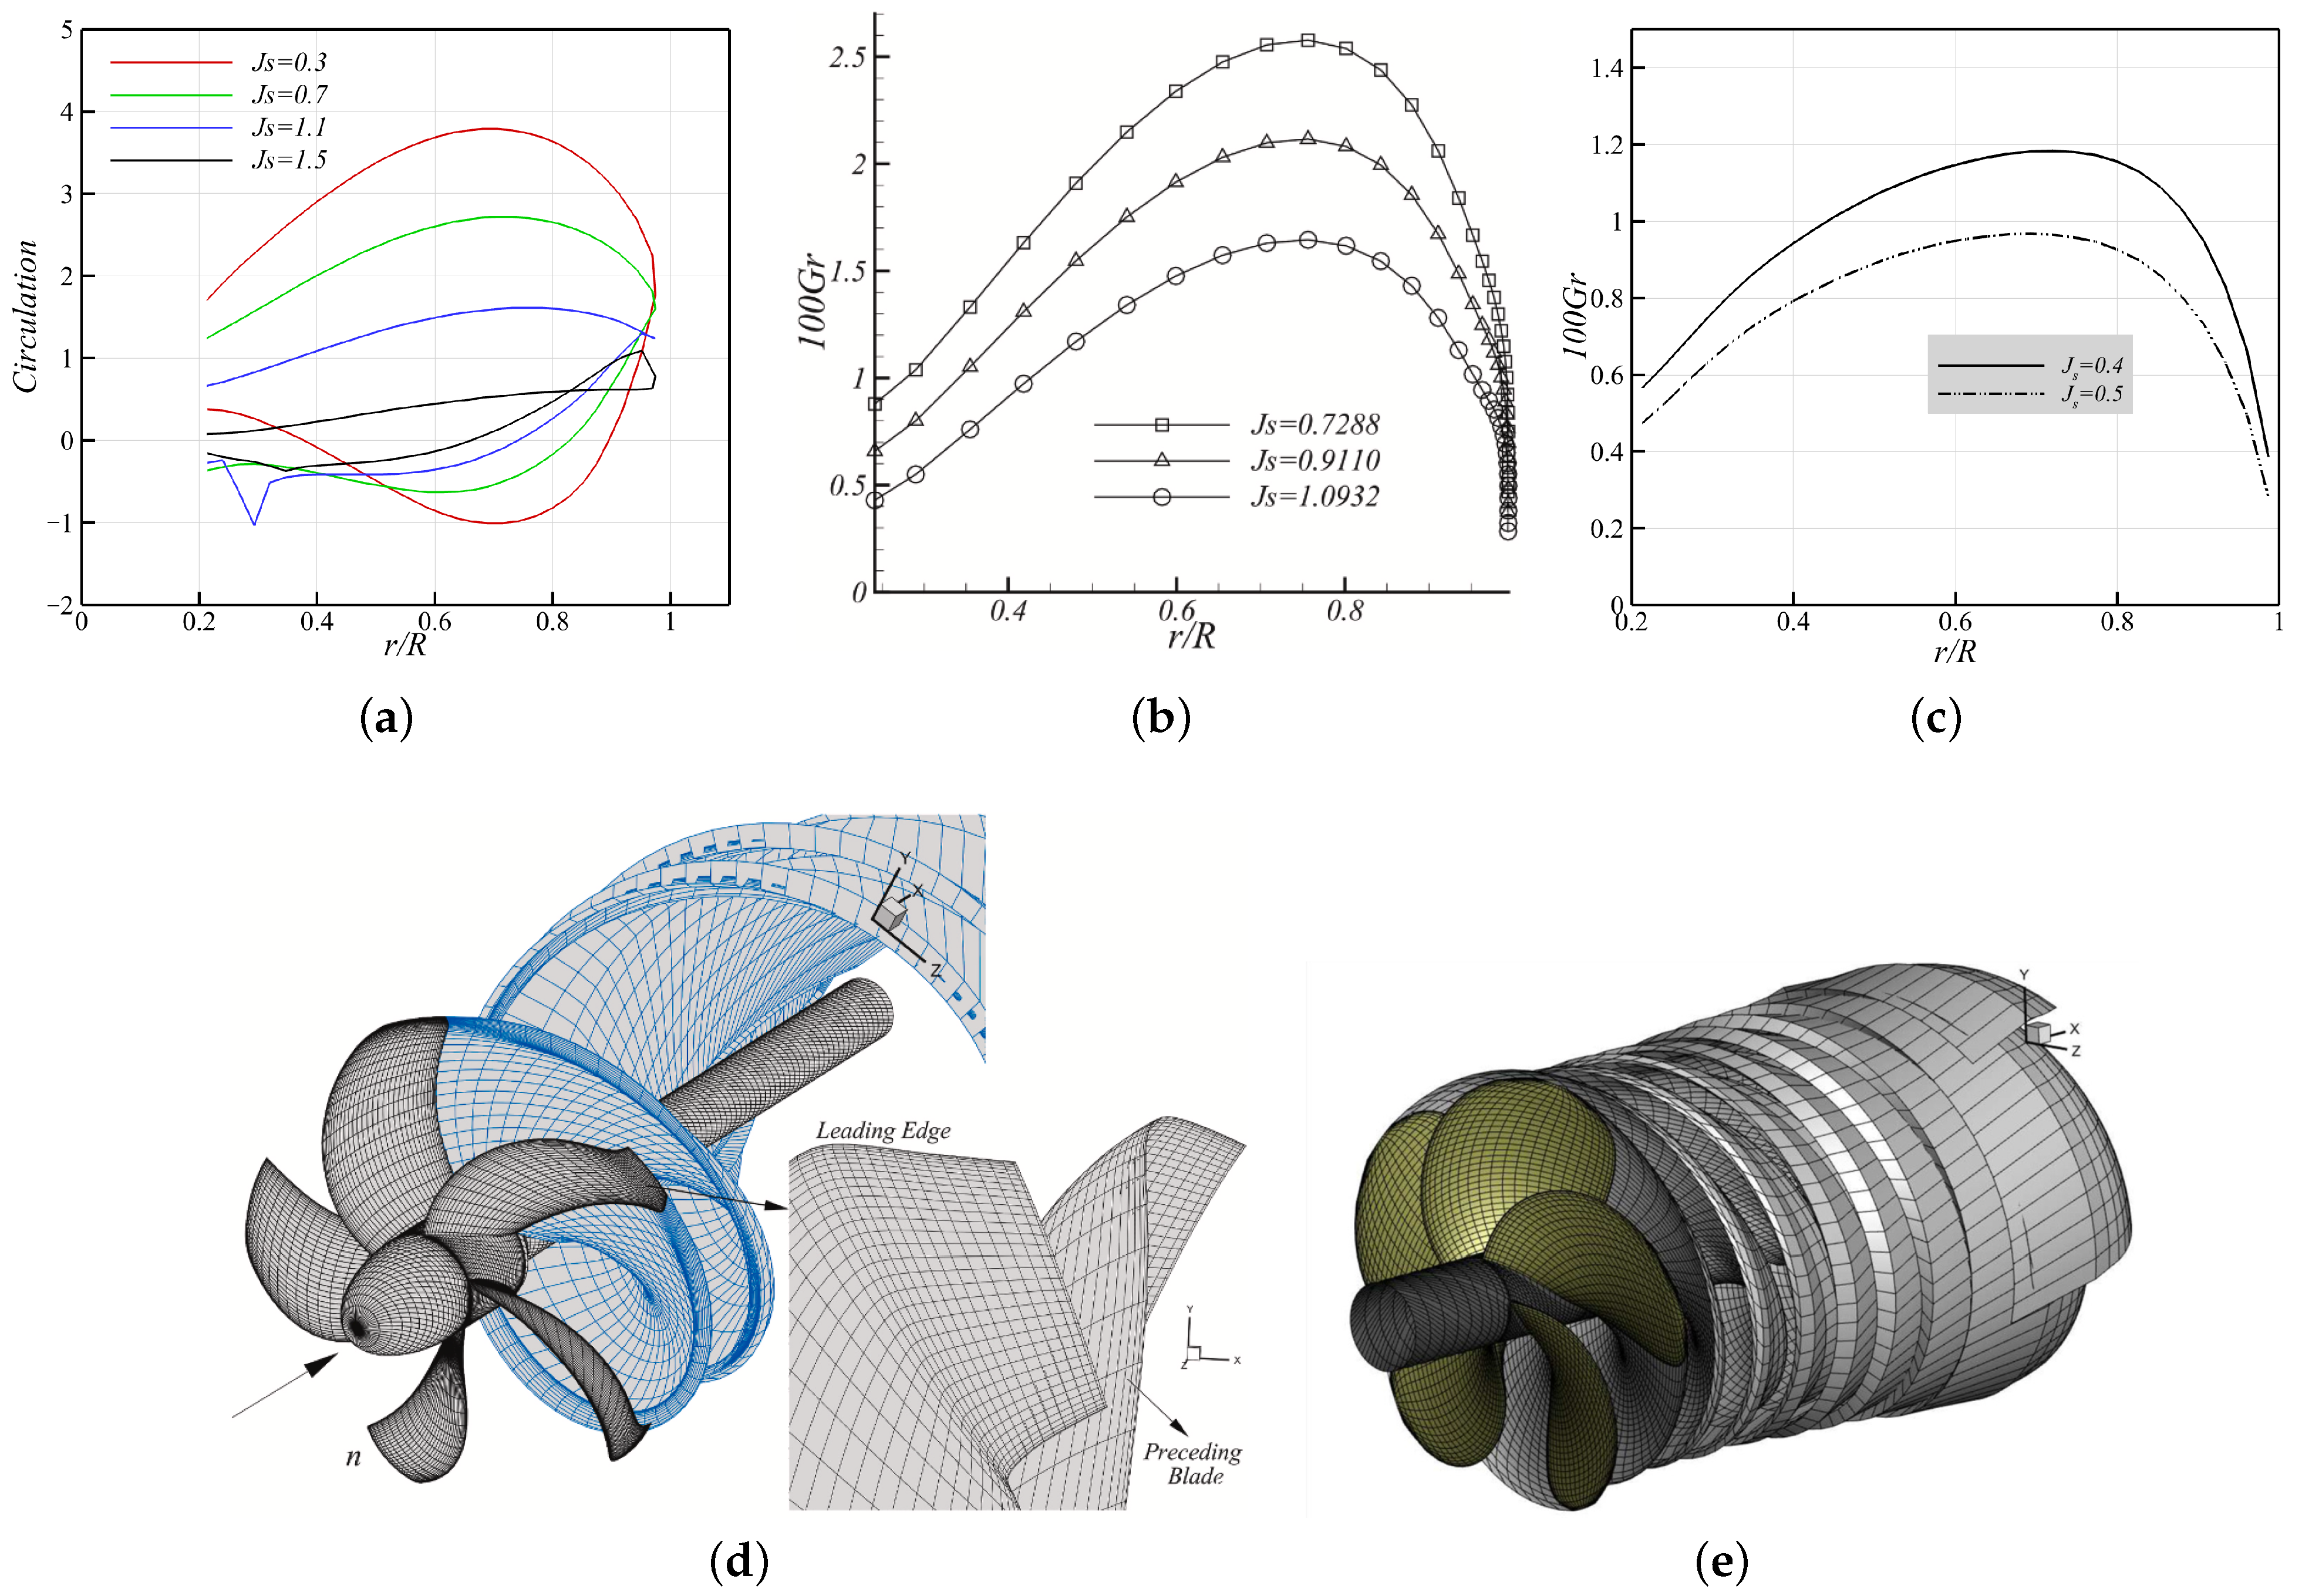
Figure 16a presents the predicted circulation distributions at four different advance ratios, i.e., J s = 0.3 , 0.7 , 1.1 , and 1.5 . Owing to the toroidal (looped) shape of the blade, the circulation showed a continuous pattern that started from the front blade root ( r / R = 0.2 ), passed the tip around r / R = 1.0 , and returned to the rear blade root ( r / R = 0.2 ), which formed a distinctive sparrow-shaped pattern. It is clearly different from the circulation patterns of conventional, non-looped propellers, such as for example, the tip-loaded propeller (TLP) (Figure 16b,d) with a knuckled tip that shifts the load distribution outward, as well as the rounded-tip open propeller (Figure 16c,e). As expected, the loading on the front blade seemed to be very similar to that of conventional propellers, whereas the rear blade showed characteristics similar to a turbine with negative axial loading on the upper part of the rear blade (corresponding to the regions of positive circulation). The front blade consistently generated positive thrust across its entire span, providing the propeller with forward thrust, whereas the rear blade exhibited two distinct regions: one that generated negative axial force (pushing the propeller backward) and another that contributed to forward thrust. For instance, at J s = 0.7 , the front blade showed positive circulation throughout, indicating uniformly positive thrust. Meanwhile, the rear blade produced negative thrust (i.e., positive circulation but force directed downstream) in the range 0.83 < r / R < 1.0 and positive thrust in 0.2 < r / R < 0.83 (In this context, positive thrust refers to a force directed upstream (forward), whereas negative thrust corresponds to a force directed downstream (backward)). Ideally, optimal performance may be achieved by designing the toroidal propeller such that the front blade generates positive circulation and the rear blade generates negative circulation over their entire spans, thereby maximizing net thrust. In other words, the beak of the sparrow pattern, which is formed at the blade tip where the front blade transitions into the rear blade, should ideally approach zero, indicating minimal thrust cancellation at the junction.
Judging from the circulation distributions, the front blade experiences higher loading than the rear blade under all operating conditions, with the maximum loading on both blades occurring around r / R 0.7 and decreasing in magnitude as J s increases. The abnormal peaks observed near the rear blade root are caused by the extreme proximity of the trailing wake from the front blade to the rear blade surface. Such interactions are inevitable in multi-propeller systems, where propellers sit in a face-to-face arrangement and could behave as a critical source of error in the panel method as discussed next.
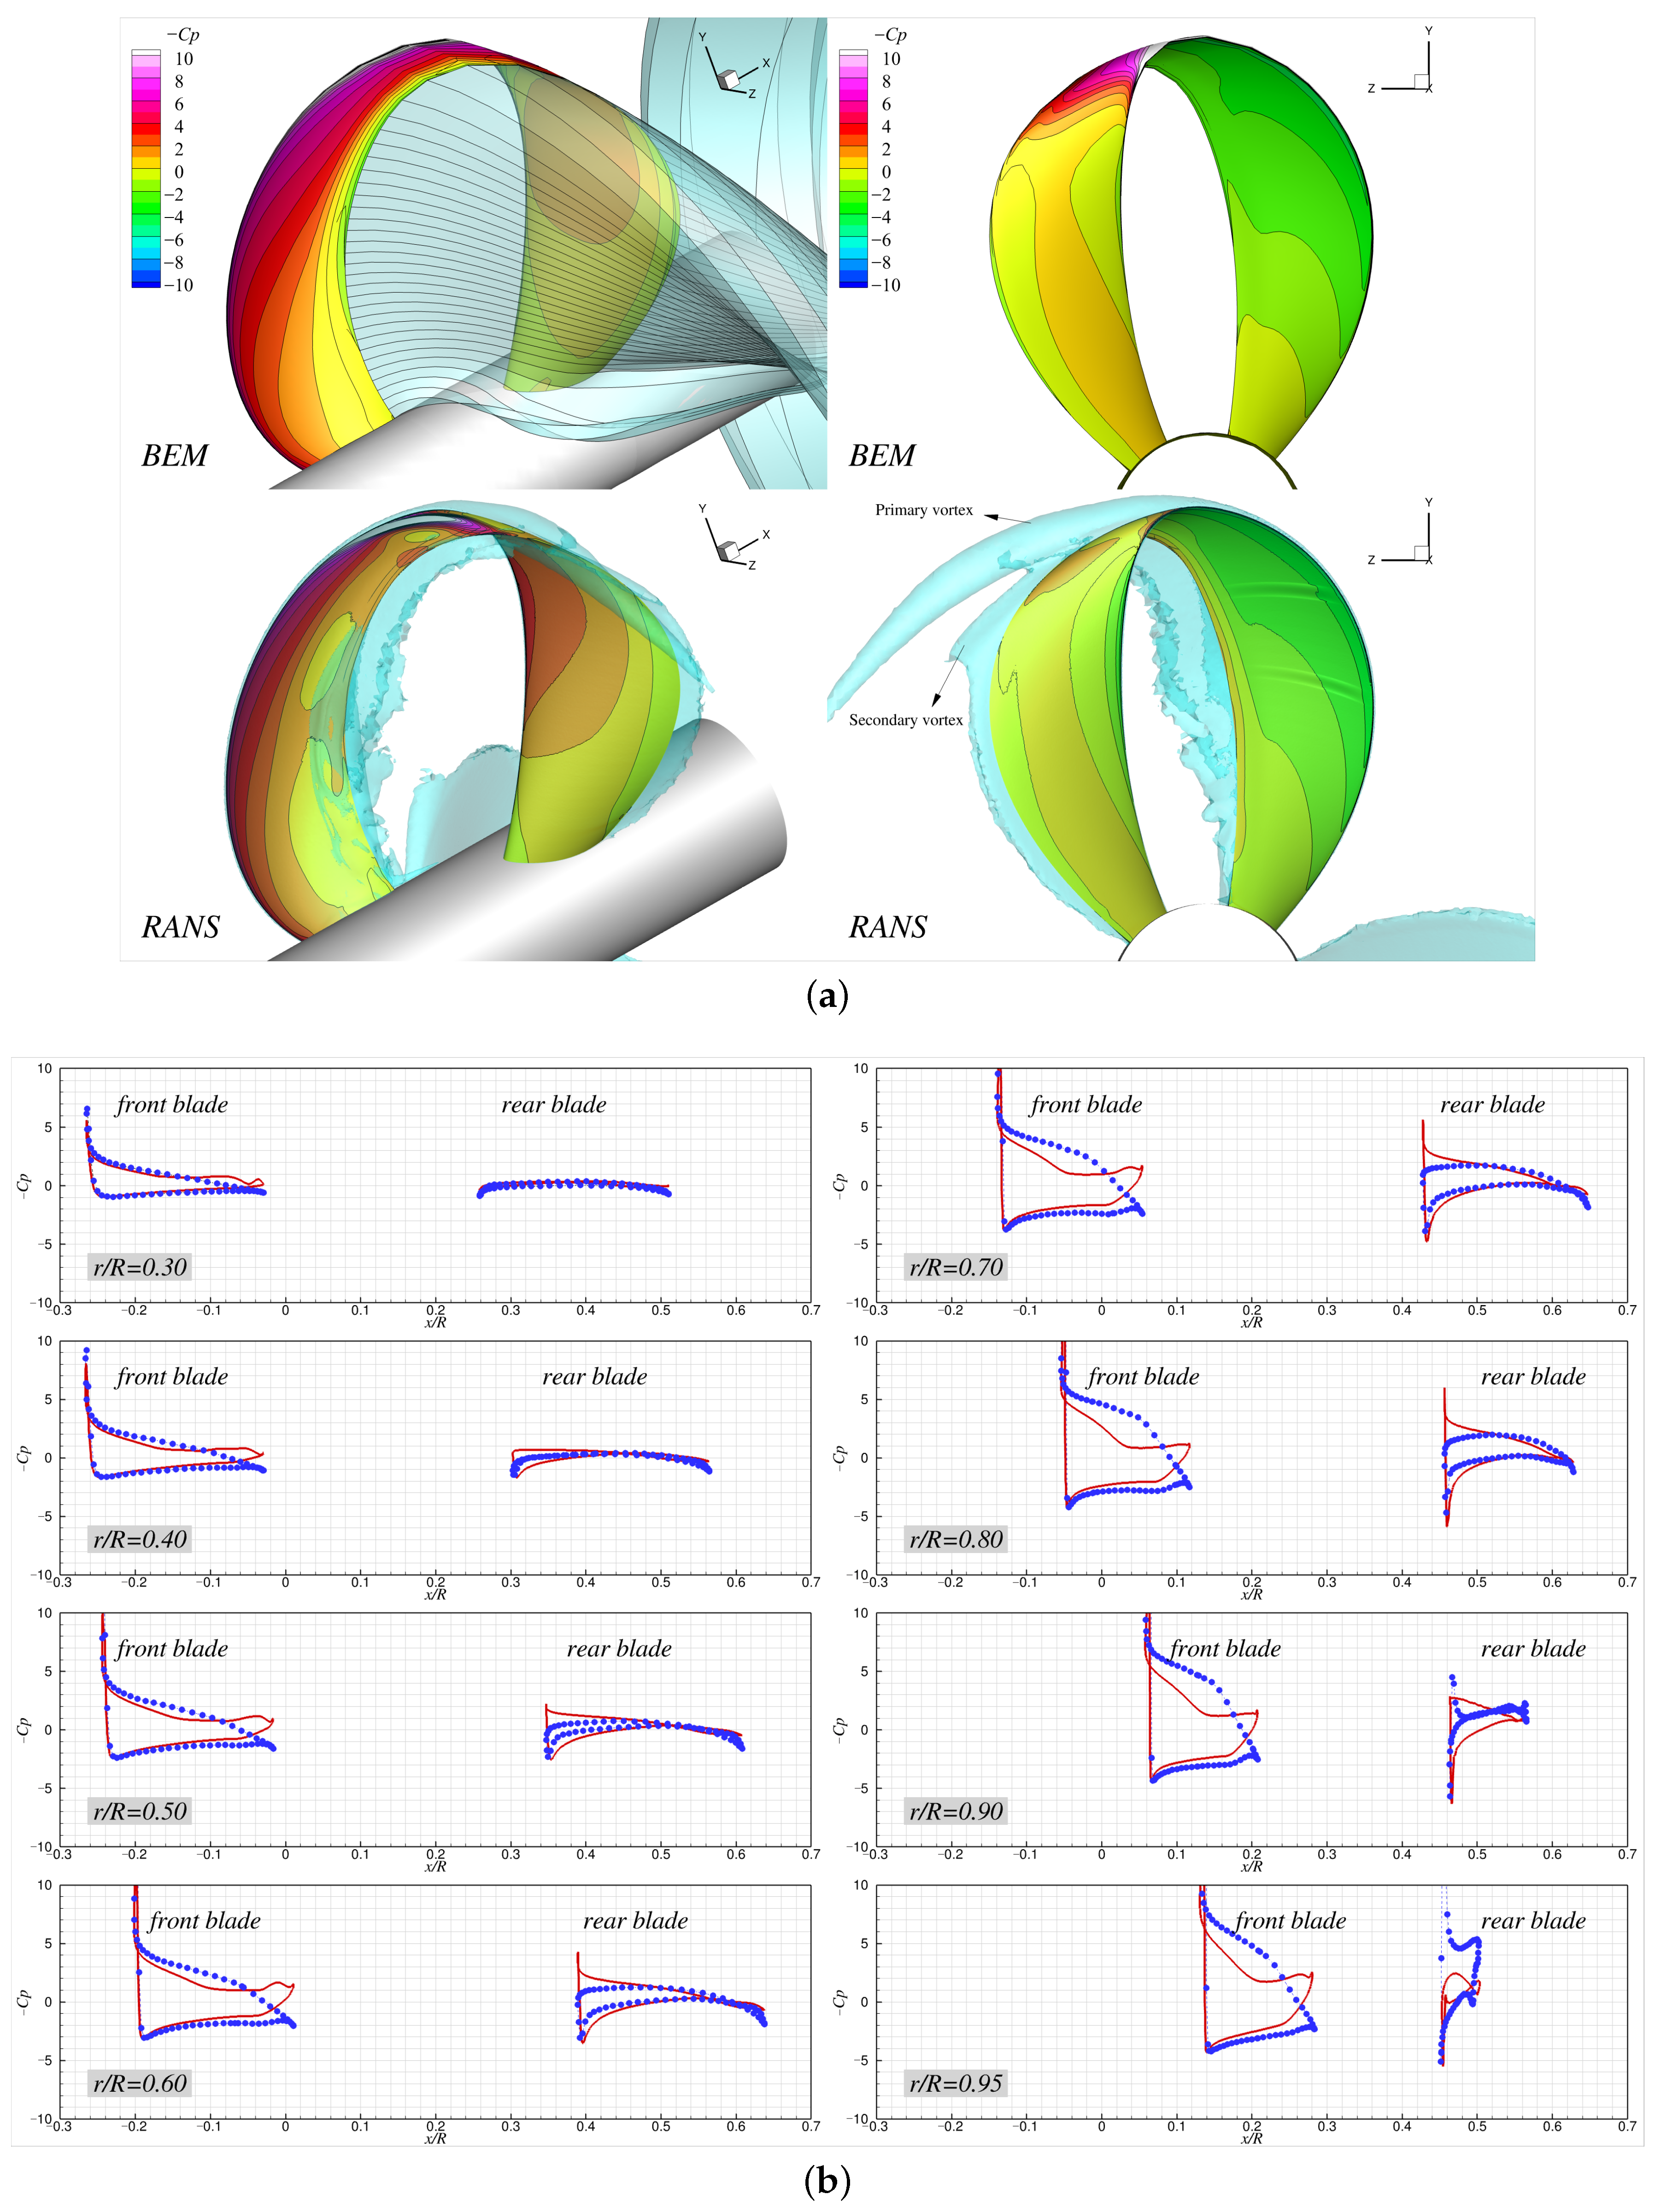
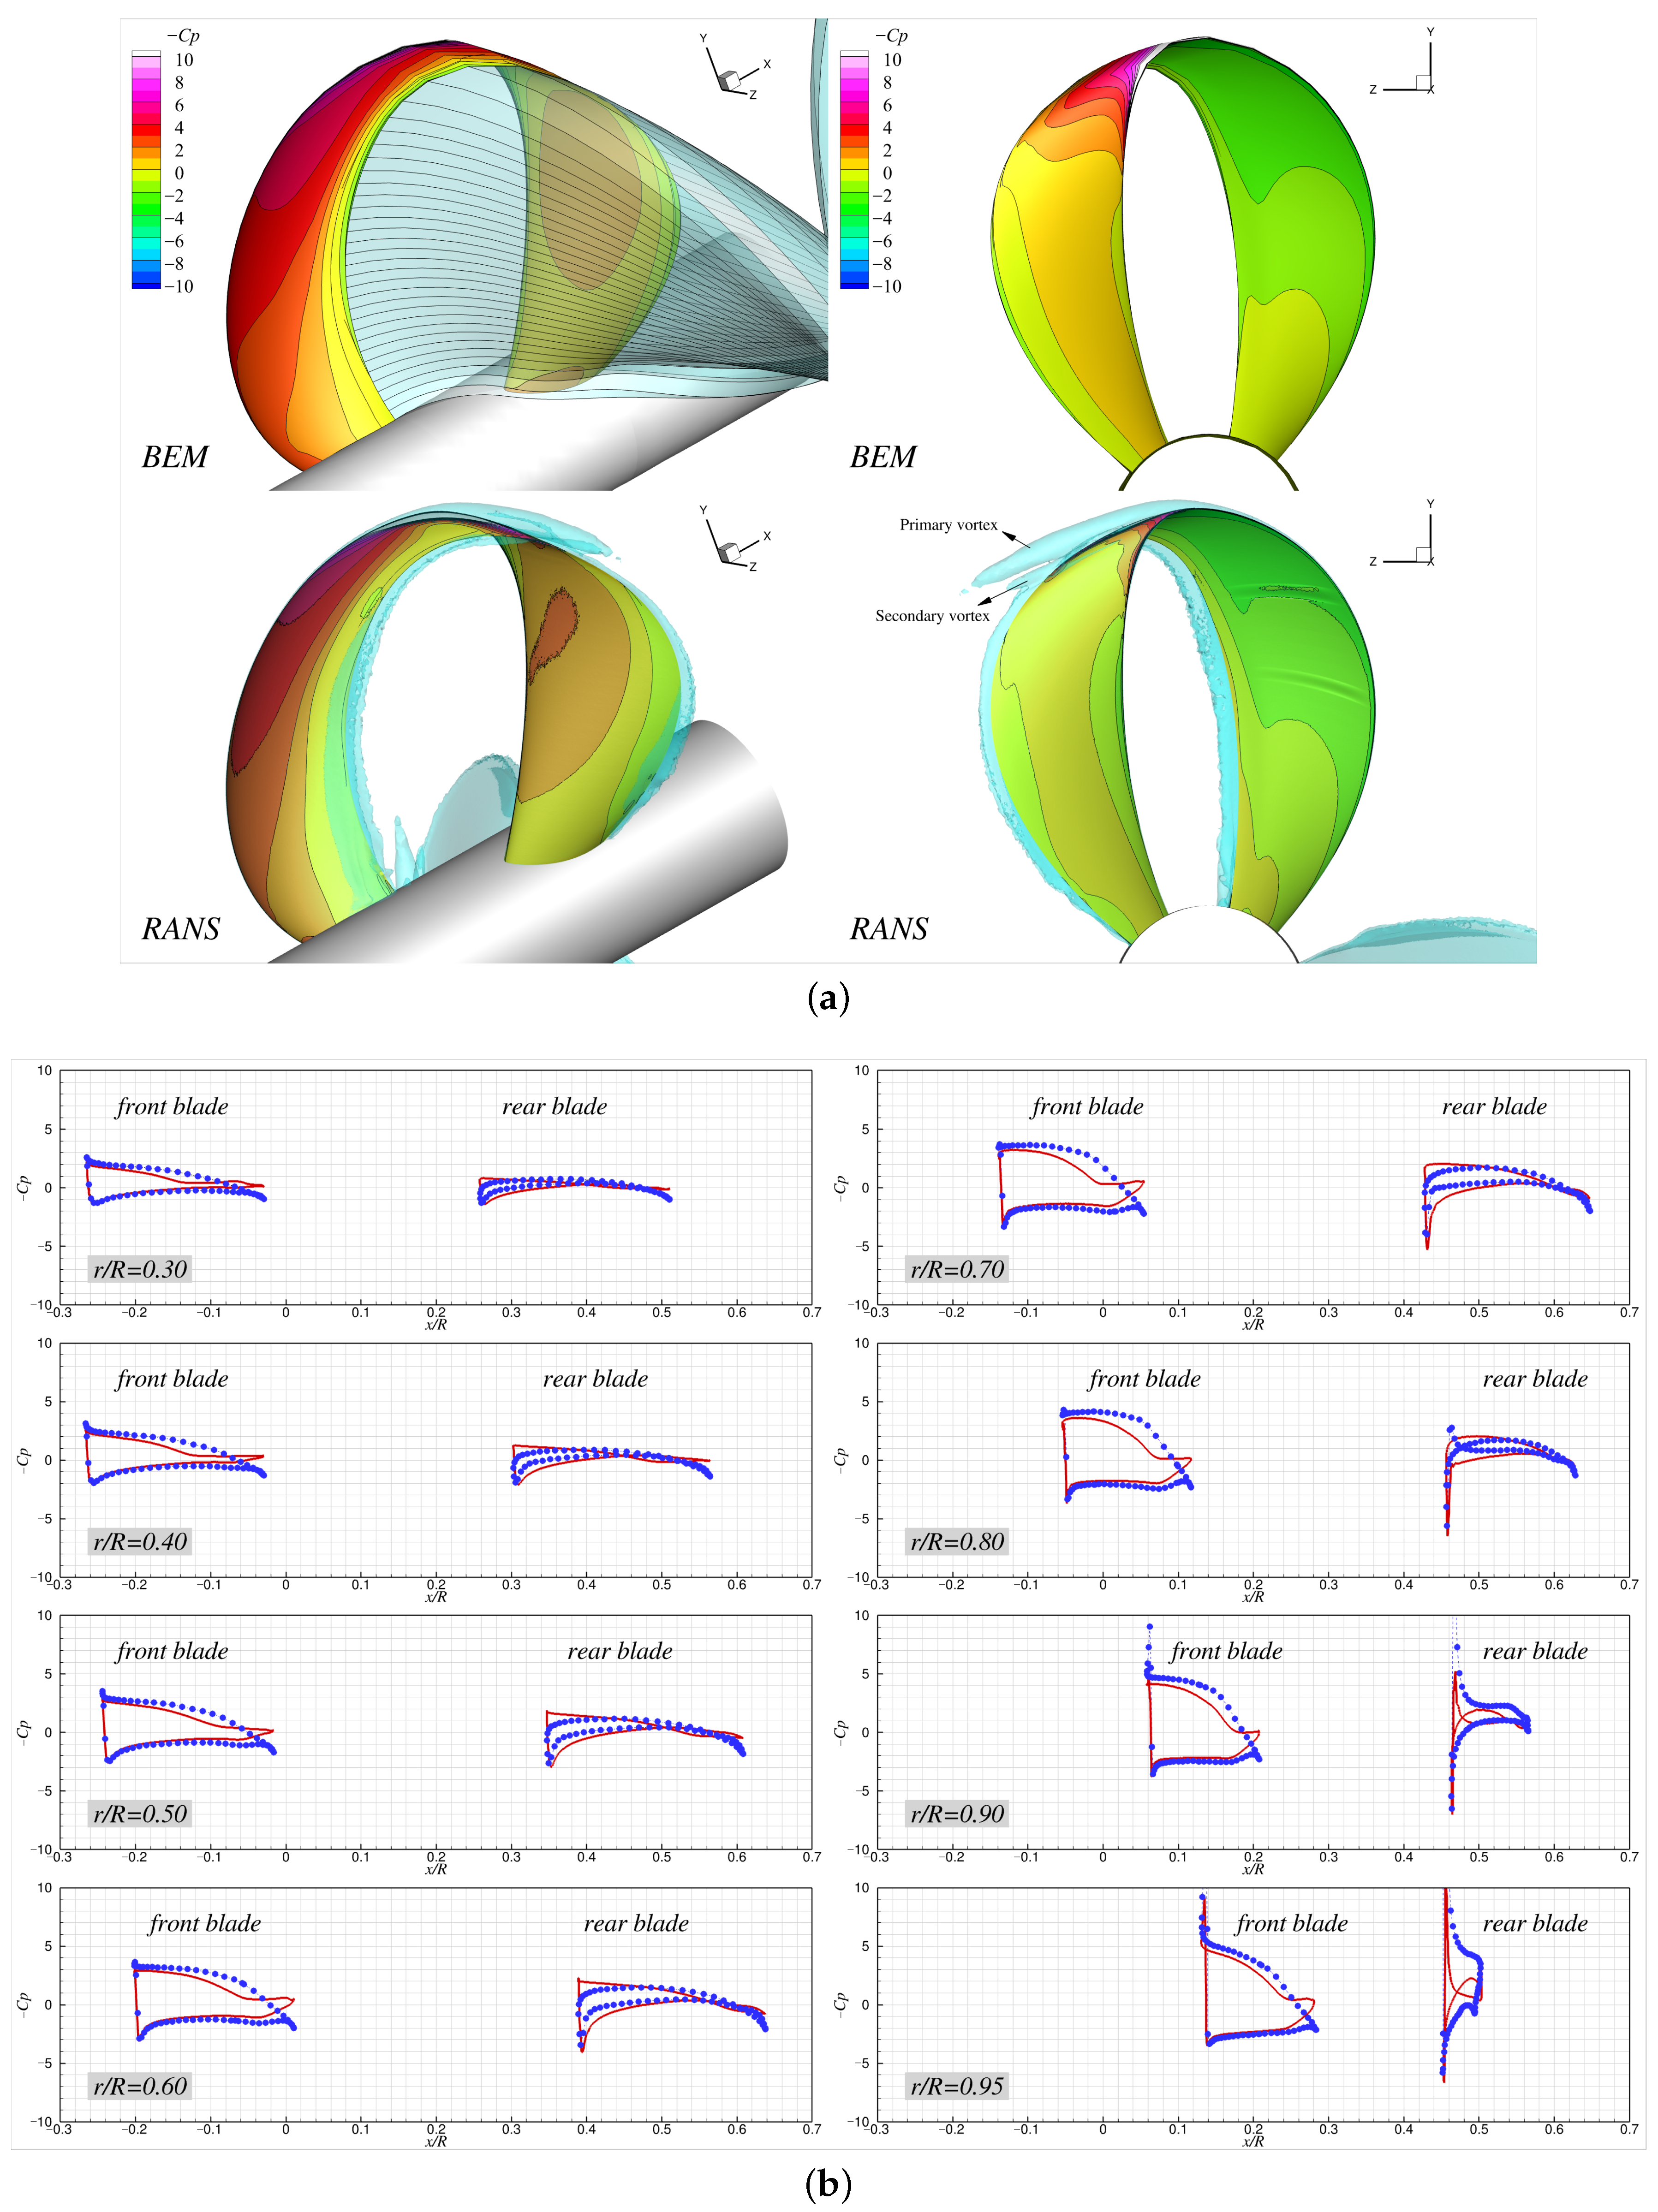
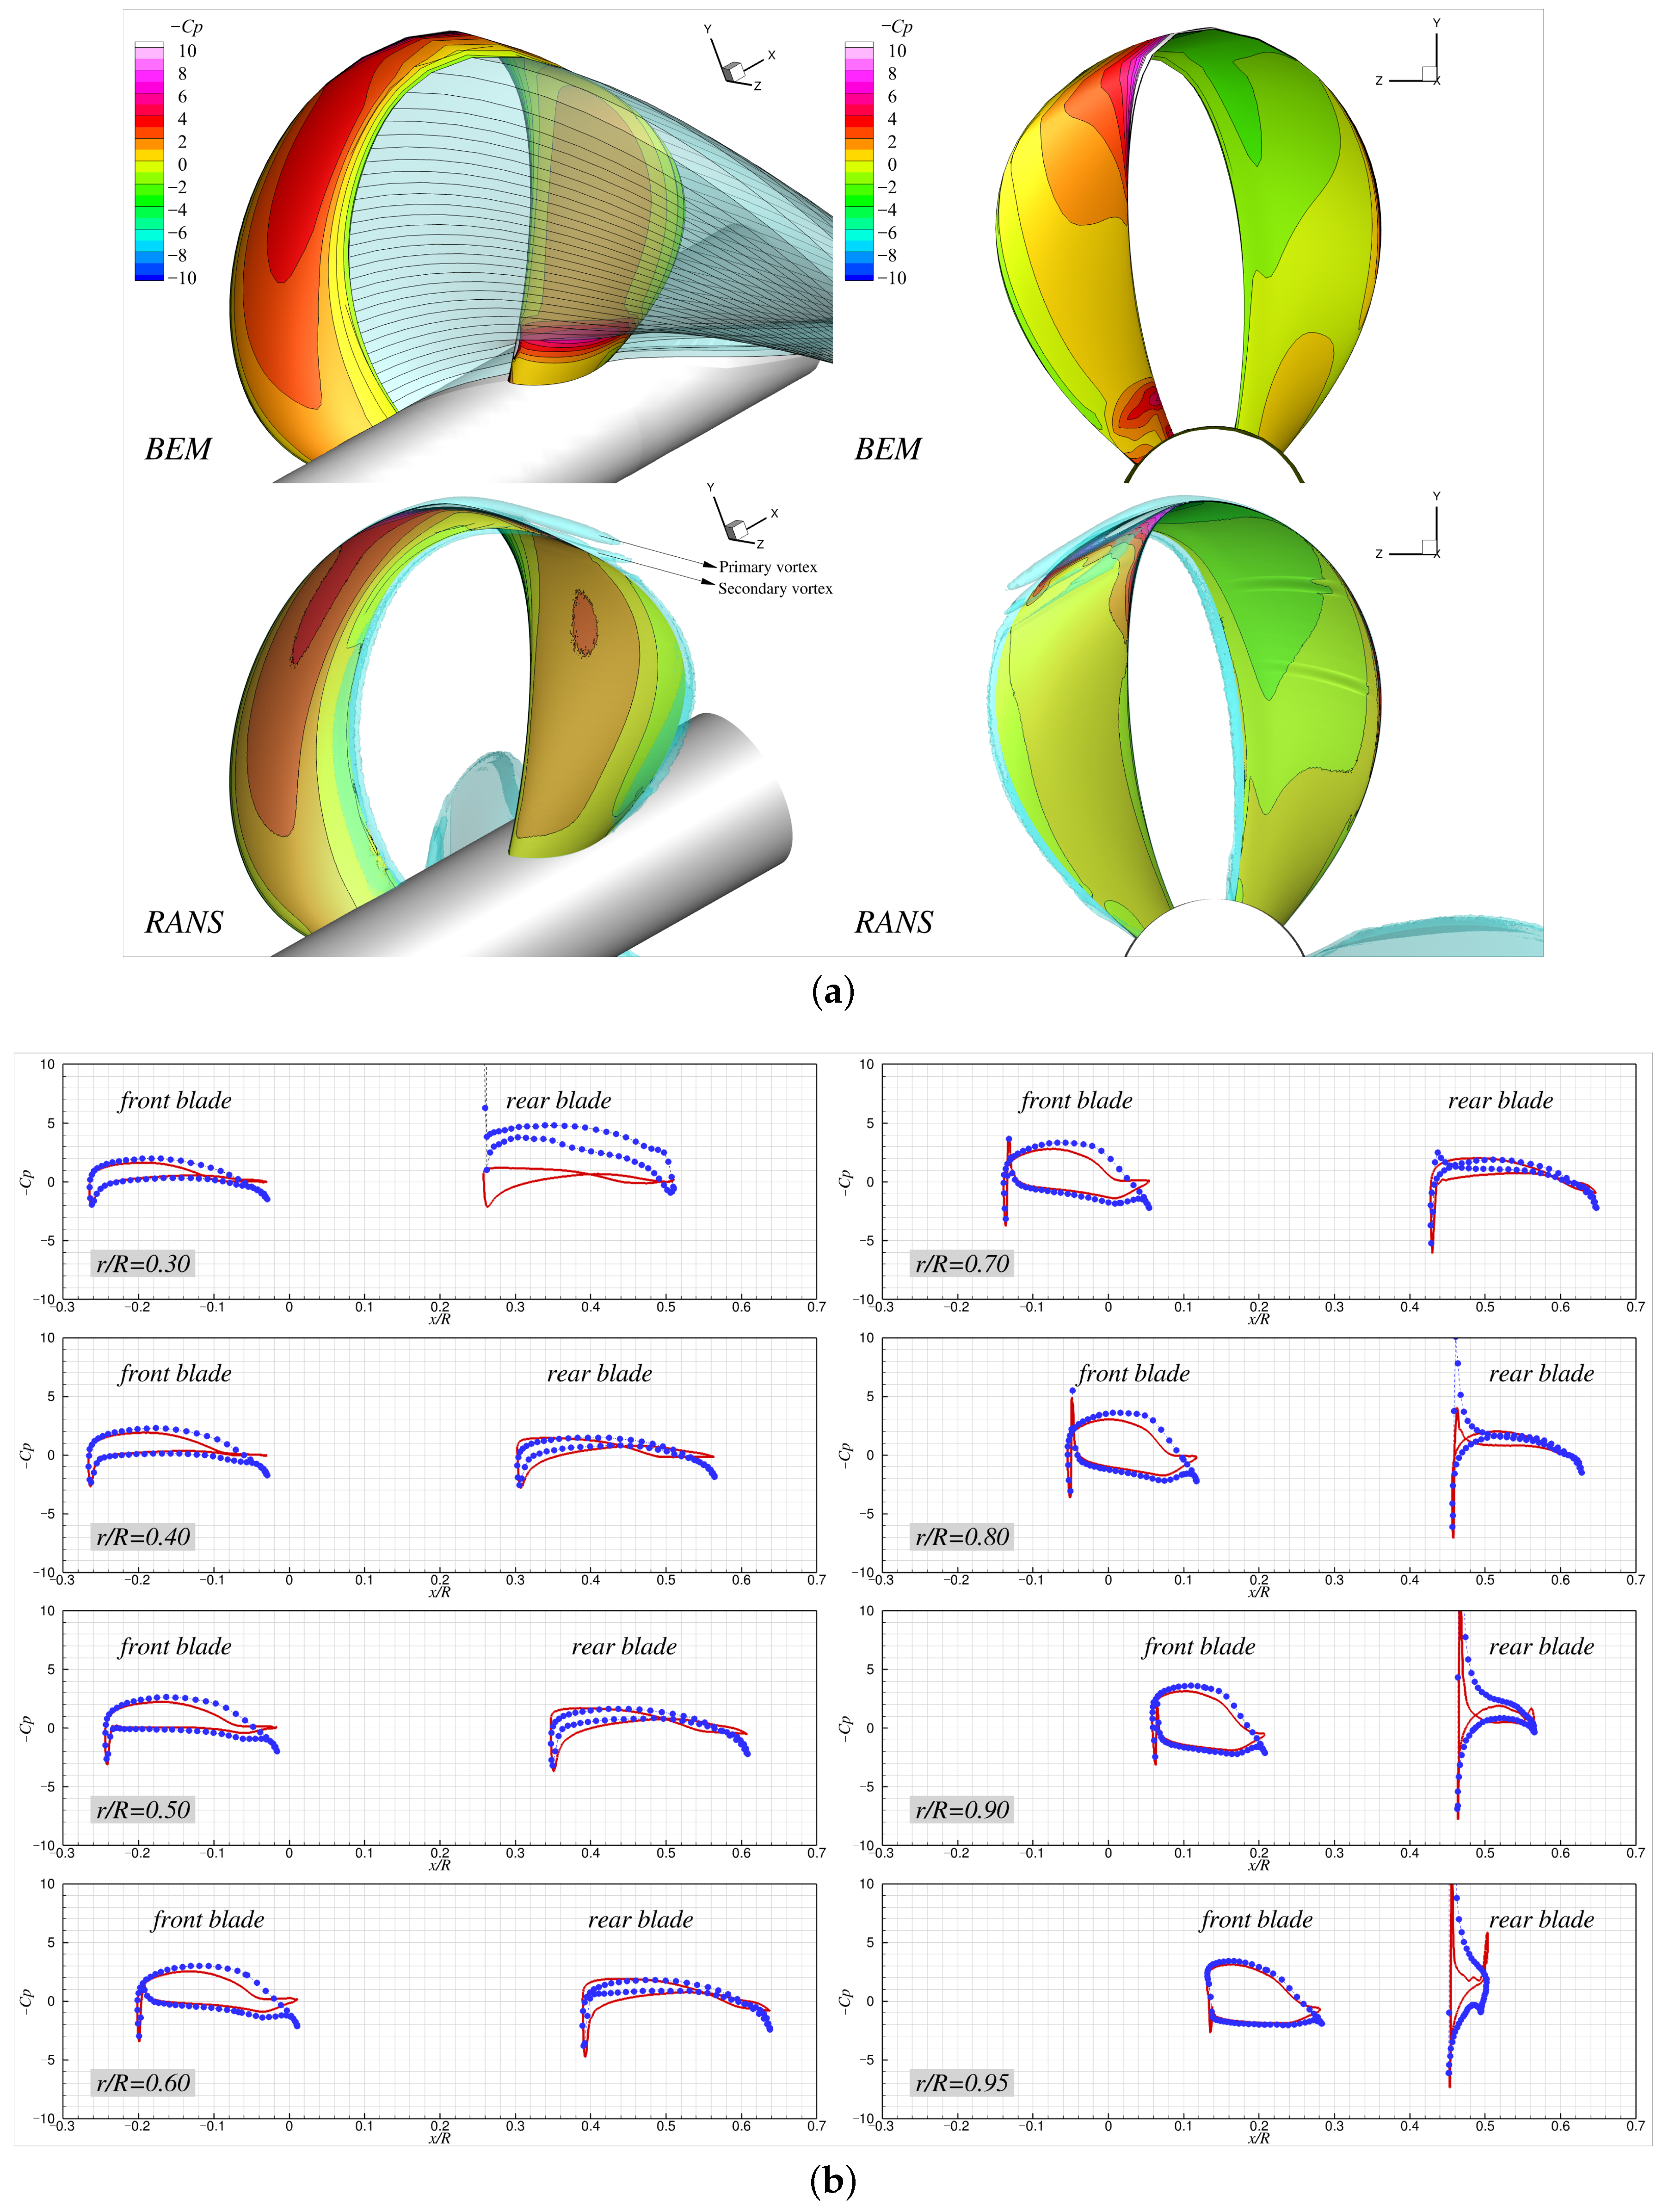
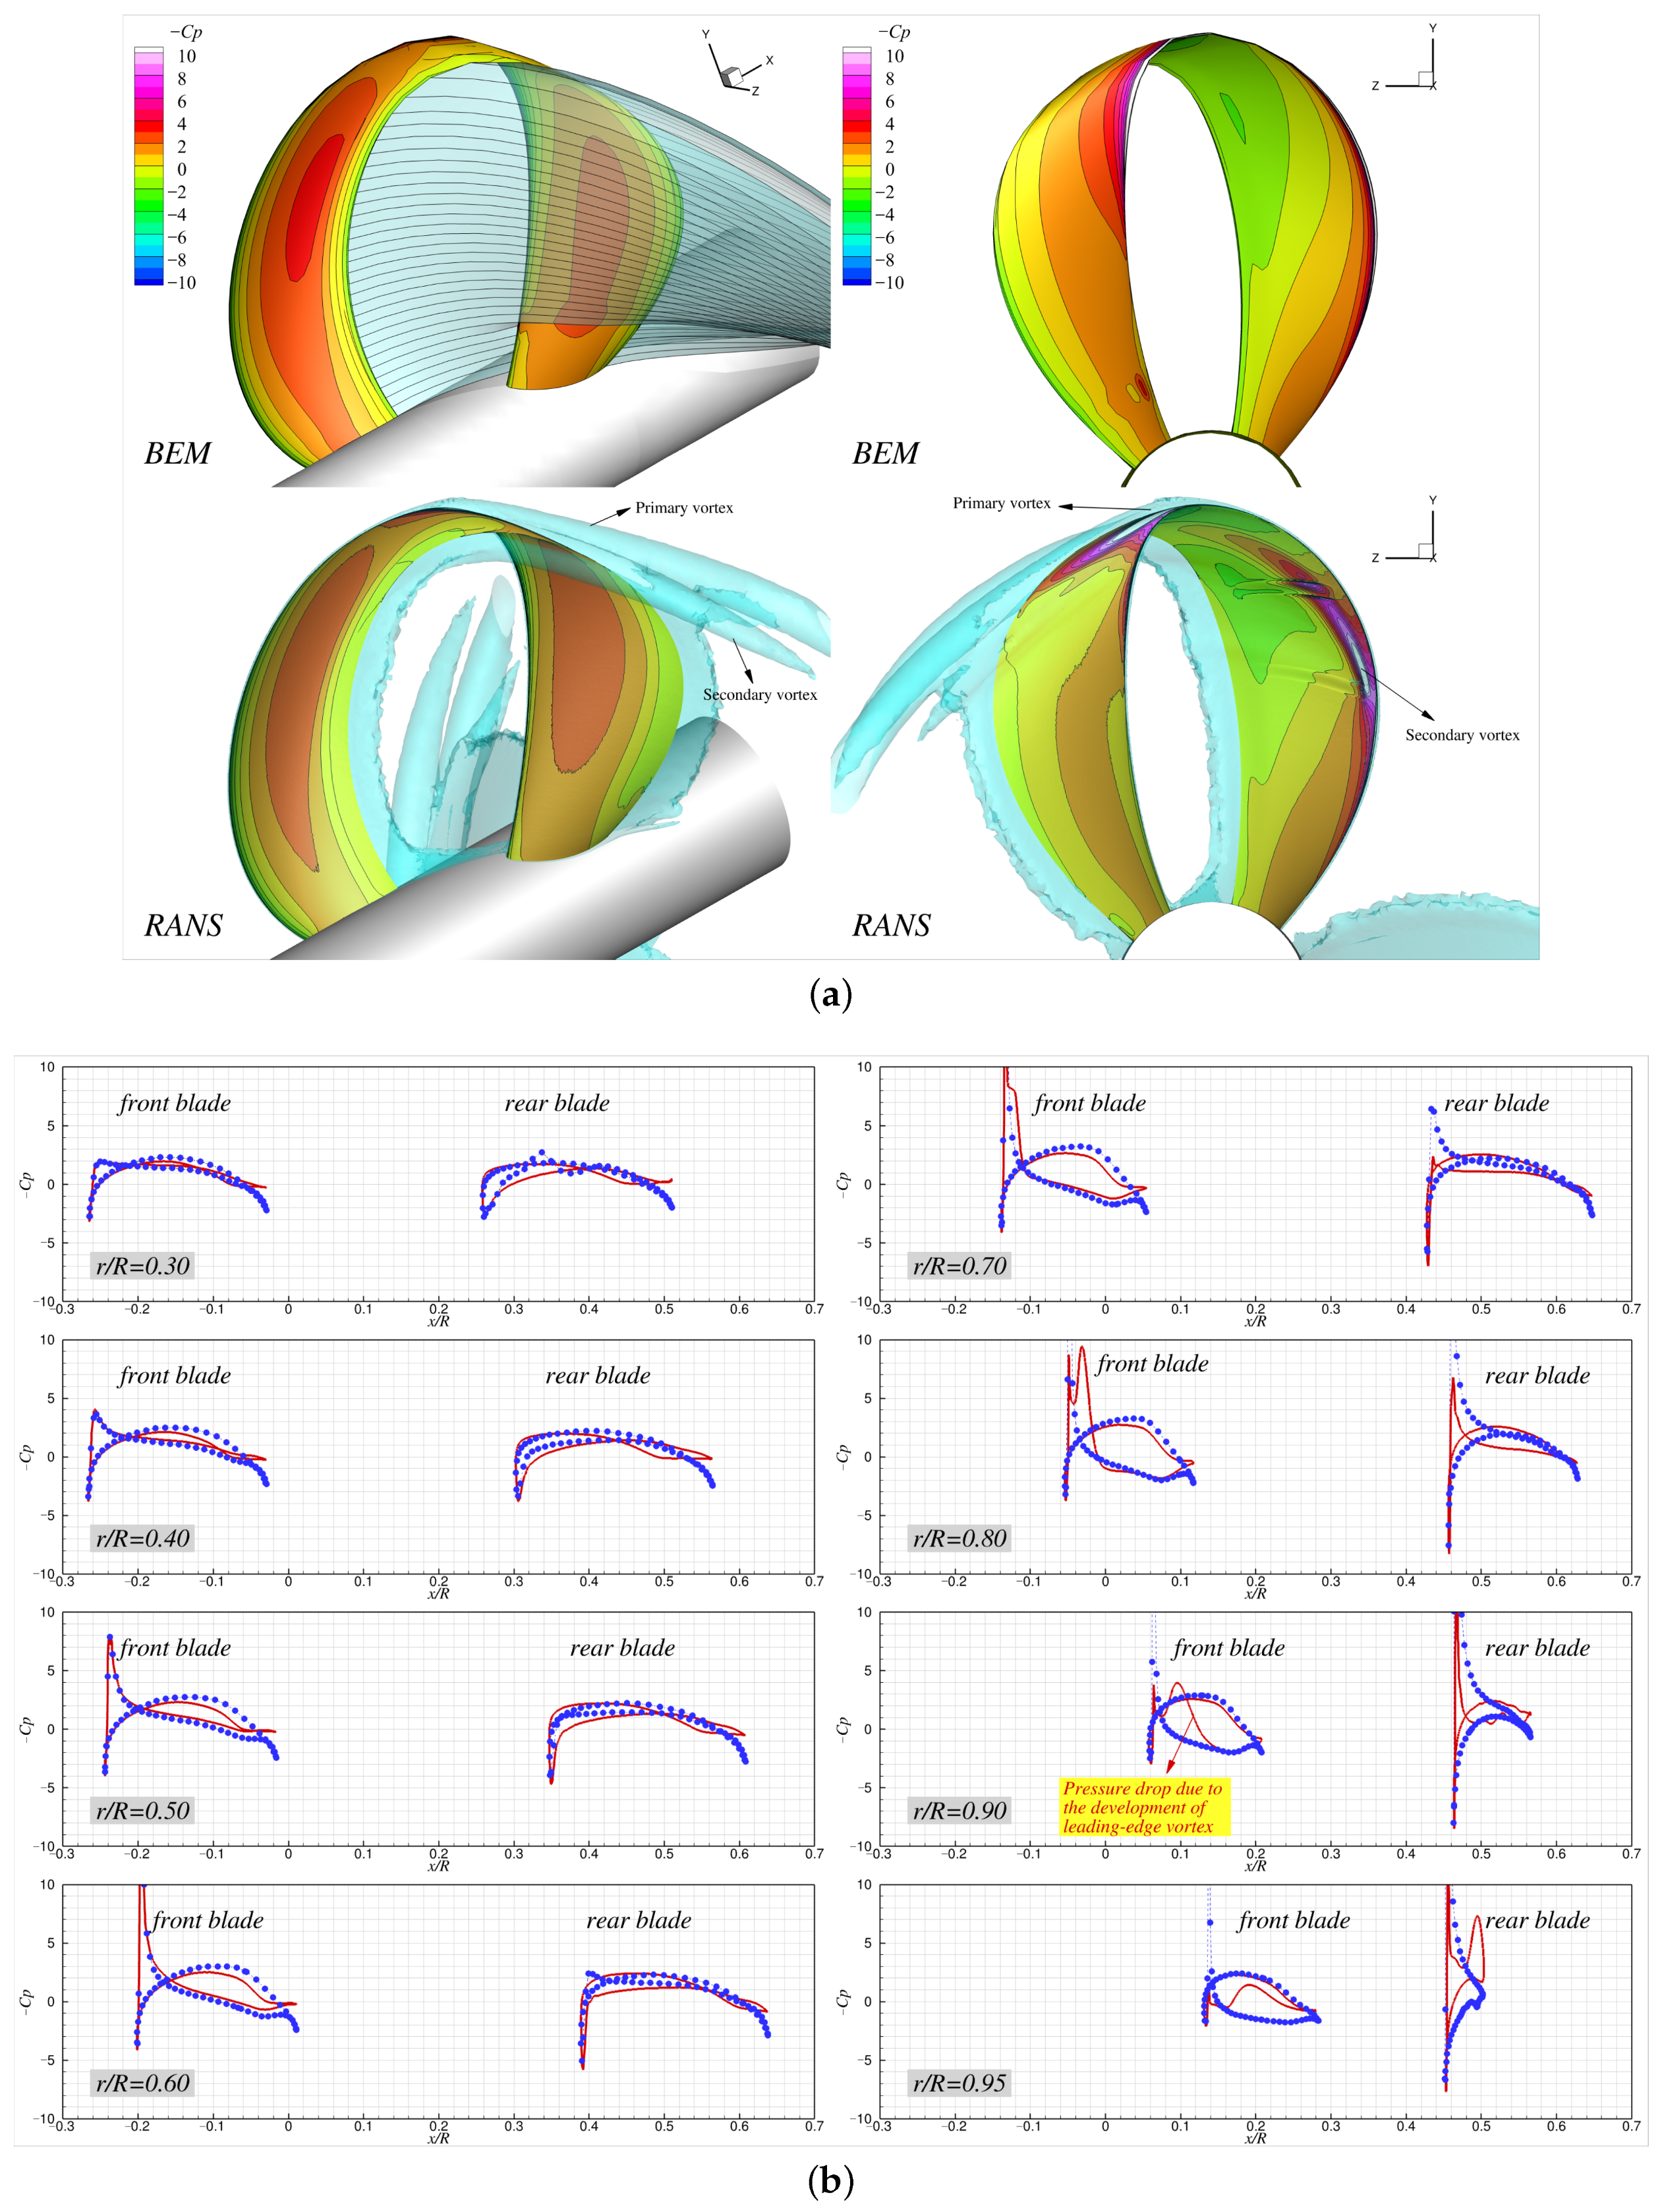
Figure 17, Figure 18, Figure 19 and Figure 20 compare the pressure distributions (in C p ) on the blade between the BEM and RANS predictions at several J s together with the fully aligned BEM wakes and the iso-surface of vorticity magnitude of 100 [s−1]. Under higher loading conditions, the 3D plots show that the wake shed from the front blade did not intersect with the rear blade due to the high angle of attack; instead, the wake remained aligned along the hub surface and flowed downstream without direct contact with the rear blade. As the loading fell, the angle of attack was reduced, bringing the rear blade gradually into the path of the shed wake and causing it to split ( J s = 1.1 and 1.5 ). Since the front blade had its maximum pitch near the root, the initial point of contact with the wake occurred at the root of the rear blade; as J s increased, this contact point shifted outward along the span of the rear blade. The iso-surfaces of the vorticity and surface pressure contours from the RANS results captured a strong leading-edge vortex that originated from the front blade, passed over the looped tip, and convected downstream. This vortex induced very low pressure along its trajectory near the blade surface, resulting in noticeable differences from the BEM predictions, where such low-pressure regions beneath the leading-edge vortices were absent as these vortices were not modeled. Particularly, at J s = 1.5 , the leading-edge vortex from the front blade developed on the pressure side due to the reversed angle of attack, resulting in localized pressure reduction along its trajectory.
Another critical flow feature that the BEM failed to capture here was flow separation, as observed in the 3D plots that compare the BEM wake and the RANS vortices. In the 2D pressure plots, the two approaches showed reasonable agreement near the leading edge of the front blade, but noticeable deviations appeared from the midchord region where the flow separation occurred (see also the detachment of vorticity from the blade midchord in the 3D plots). When separation occurred, the adverse pressure gradient induced a localized increase in the pressure due to flow stagnation, leading to discrepancies from the inviscid results on the suction side. Toward the trailing edge, the surface pressures behind the separation region went lower than those predicted by the BEM because the separated flow prevents pressure recovery. As J s increased and the angle of attack decreased, the separation on the front blade was mitigated, resulting in better agreement between the BEM and RANS predictions on the suction side. However, at J s = 1.5 , a strong leading-edge vortex originating from the pressure side of the front blade generated a region of significantly low pressure, as captured in the 2D pressure plots (Figure 20b).
A noticeable difference between the BEM and RANS predictions also appeared on the rear blade pressure distribution, particularly at r / R = 0.5 0.8 , where the RANS results exhibited pronounced suction peaks near the leading edge, which were absent in the BEM predictions. These peaks might be attributed to the unsteady interaction between the rear blade and the wake shed from the front blade. As the rear blade passes through this highly non-uniform inflow, it experiences locally increased angles of attack and strong velocity gradients, which, in turn, induce the formation of leading-edge pressure peaks. As the loading falls, these leading-edge pressure peaks become mitigated due to the reduced angle of attack. Such effects are fully captured in the viscous and transient nature of the RANS simulations, but they are beyond the scope of the potential-based BEM solver.
In the present BEM formulation, the trailing wake is represented as a concentrated vortex sheet shed from the trailing edges of both blades. This modeling explains the noticeable pressure discrepancies at J s = 1.1 and r / R = 0.3 , where the BEM predicts substantially lower pressures than RANS on both sides of the rear blade. When the concentrated vortex convects too close to the blade surface, it can induce extremely low pressures. In contrast, the vortices shed from the front blade in the RANS simulations diffuse and interact with the rear blade boundary layer, preventing direct impingement on the blade surface and, thus, avoiding such exaggerated pressure drops.
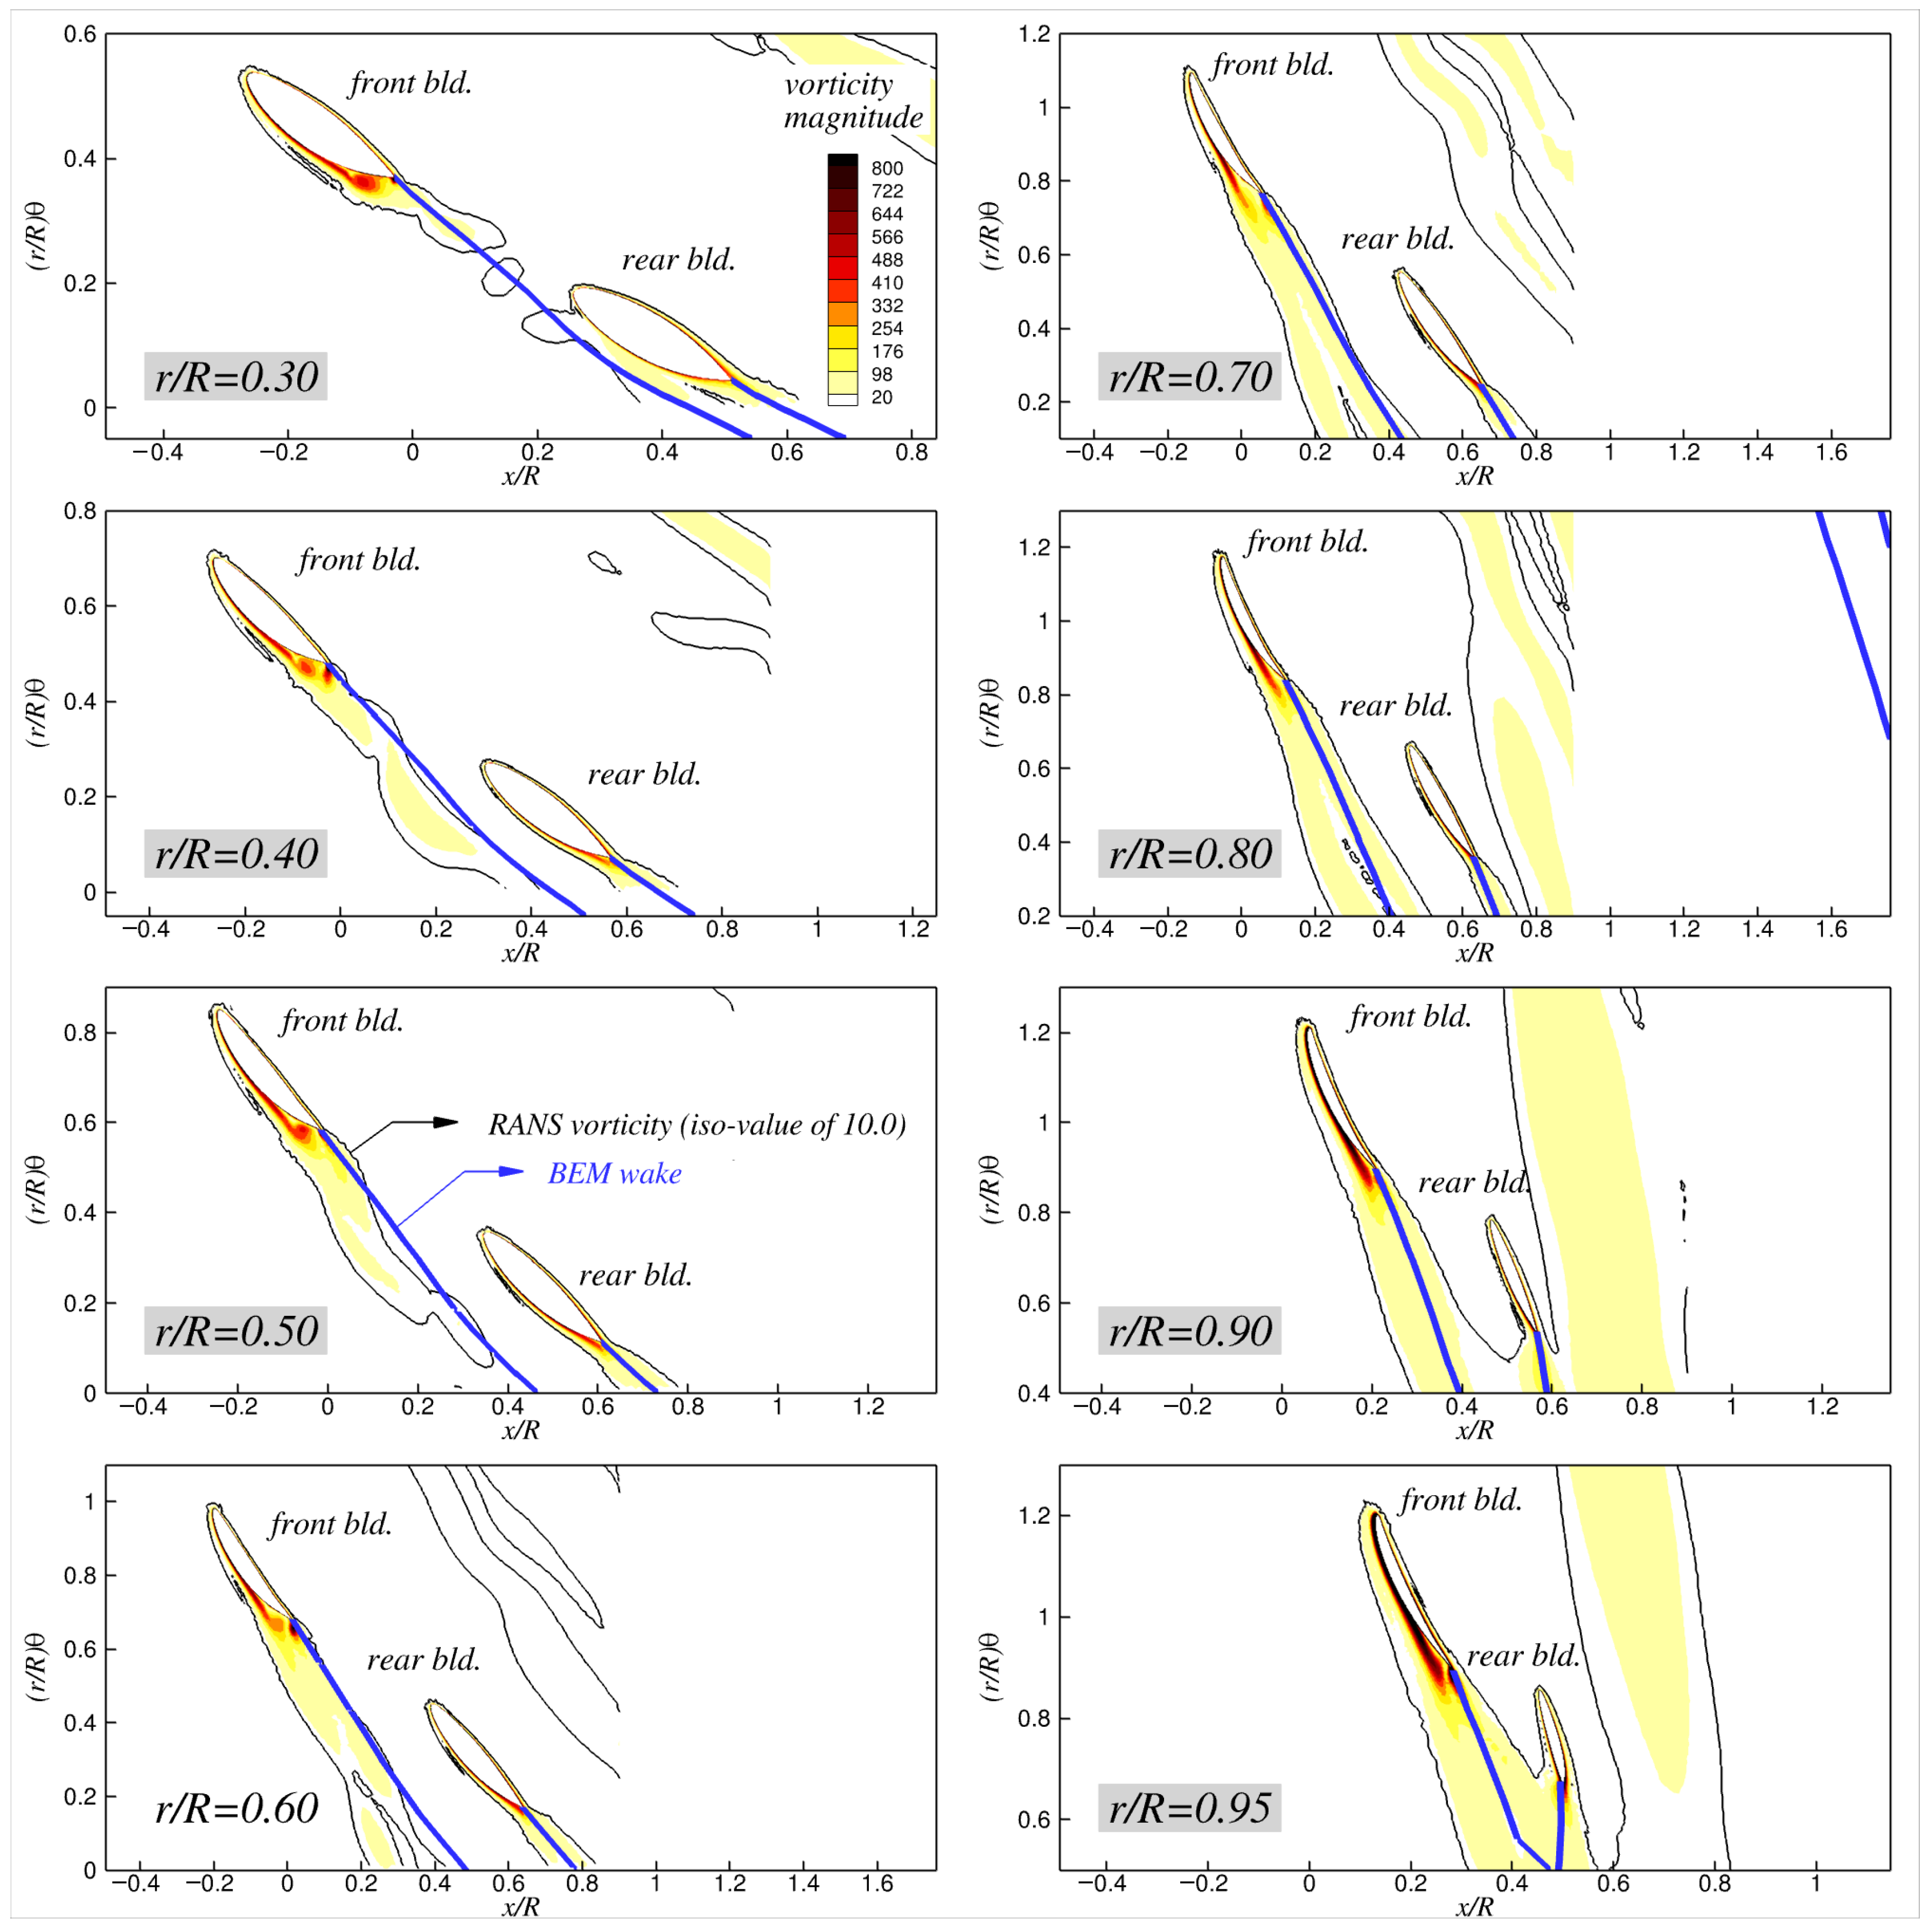
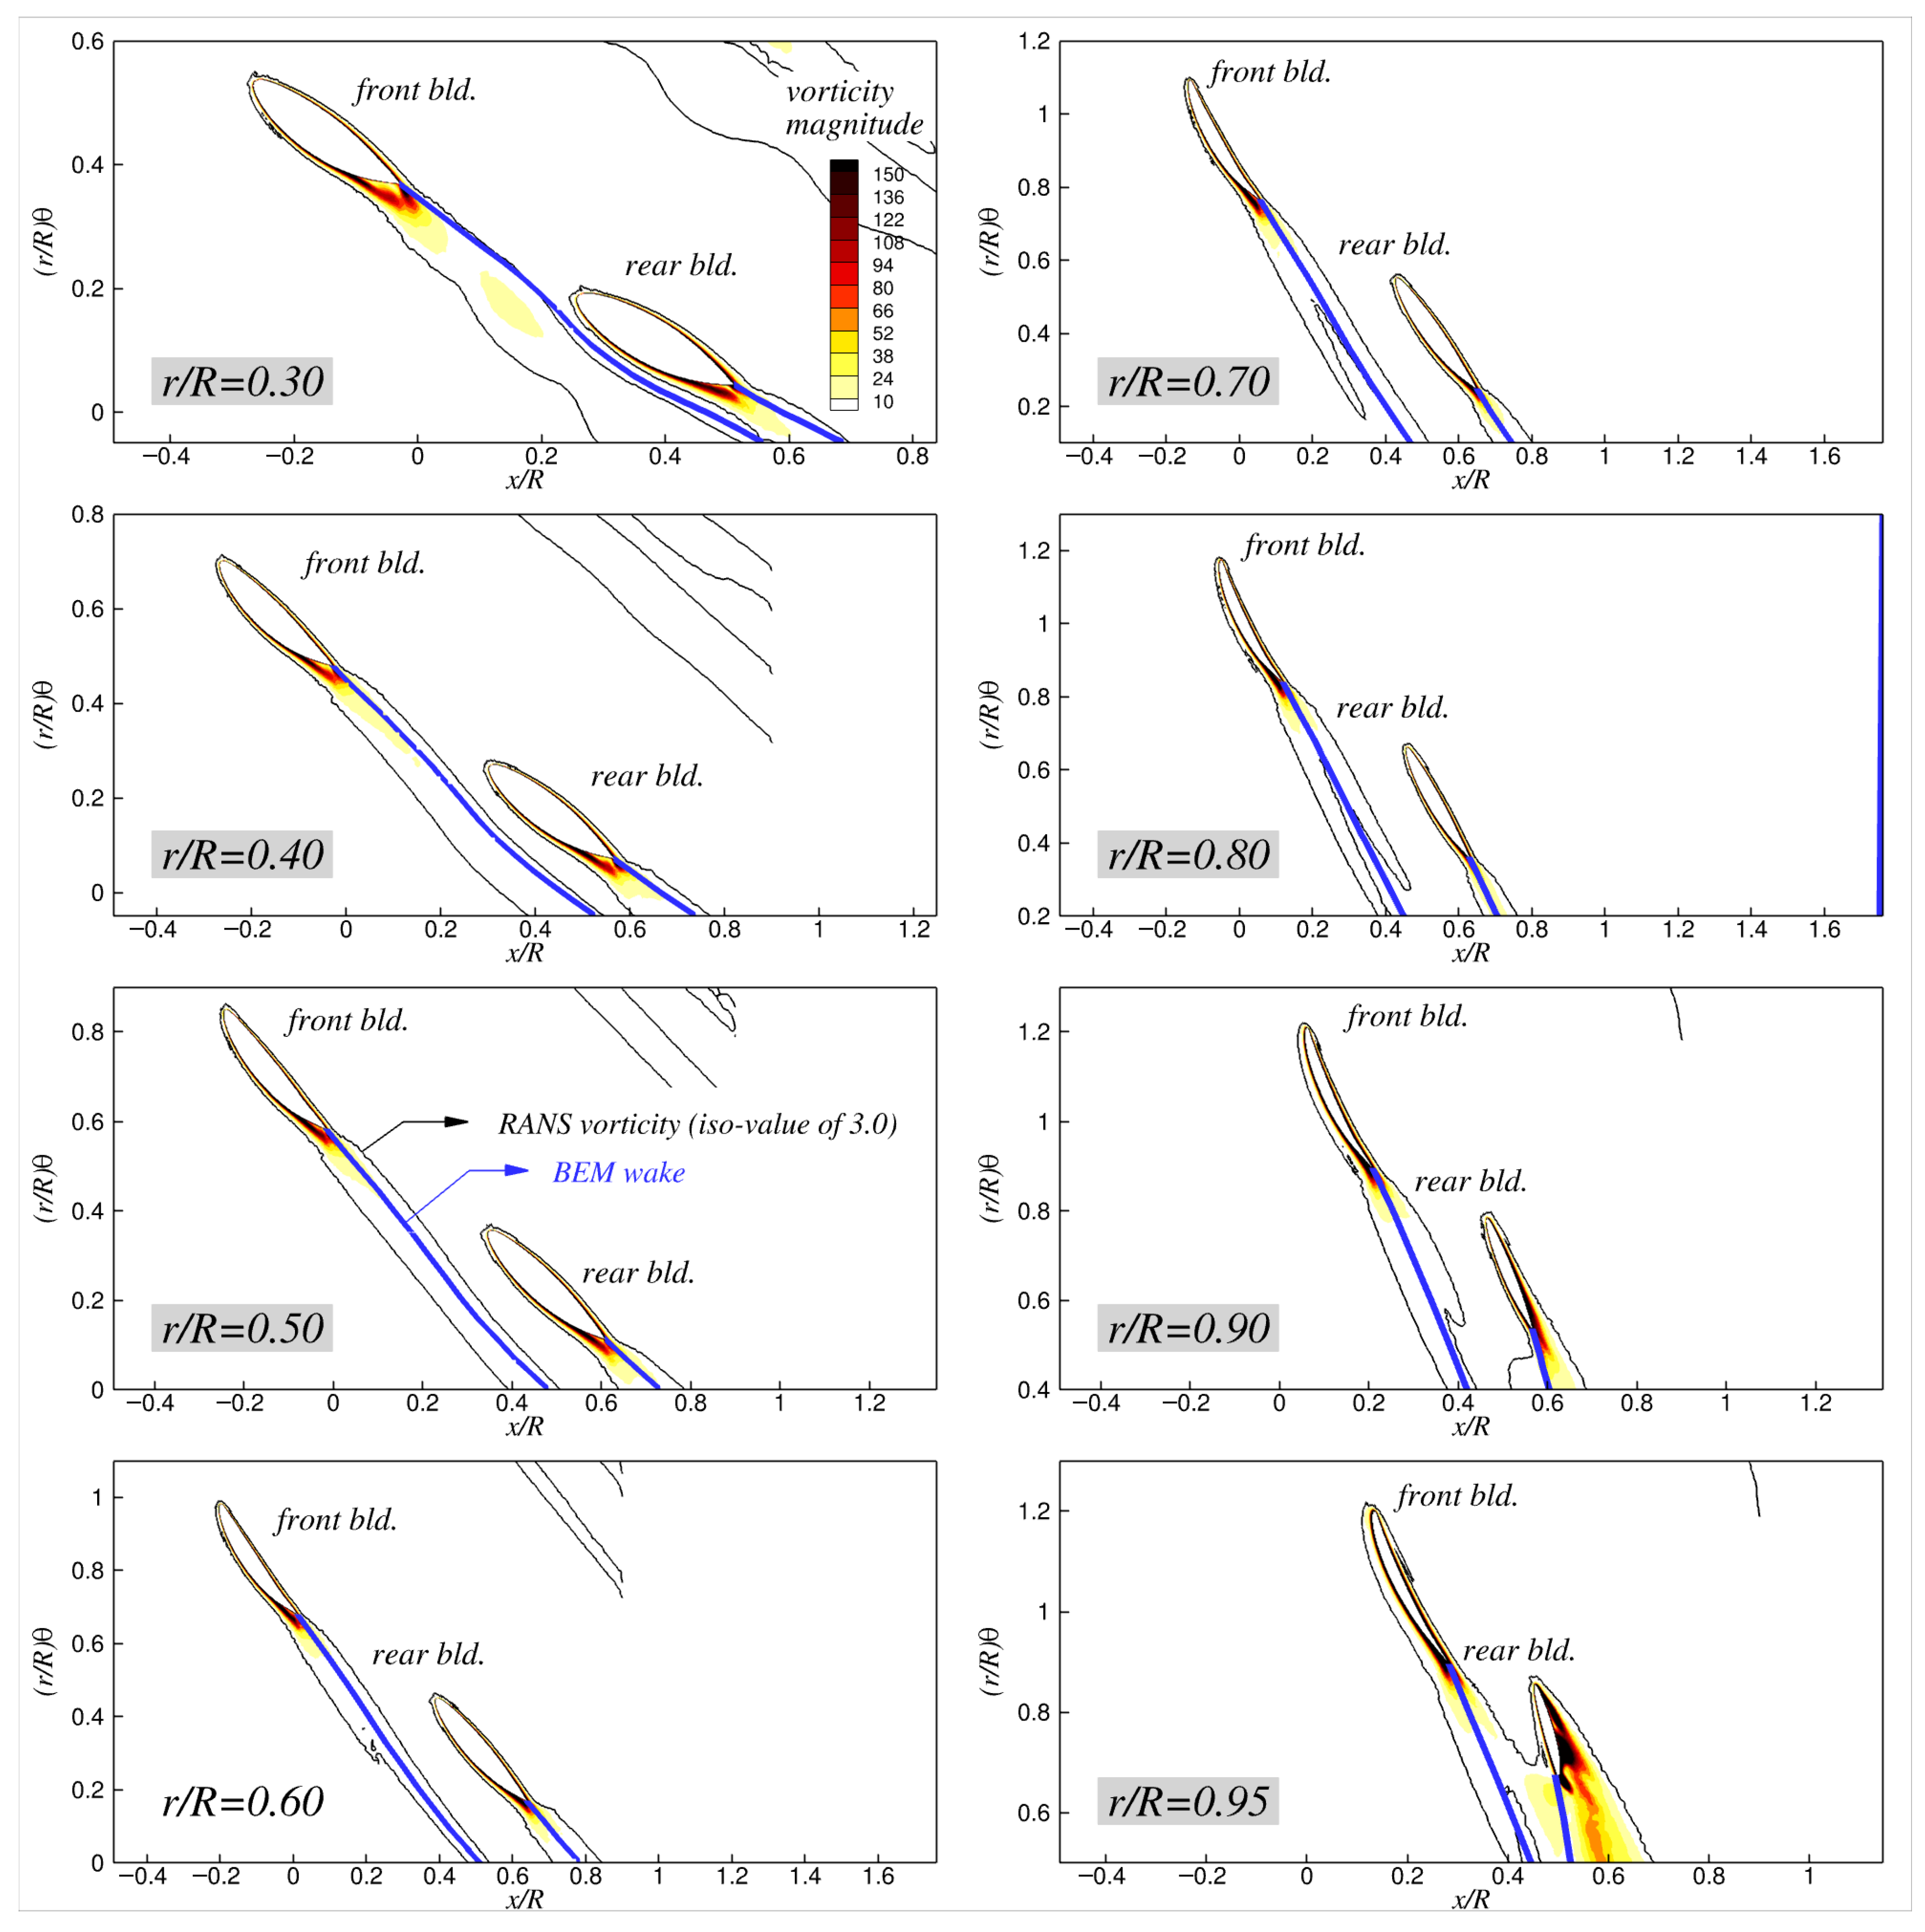
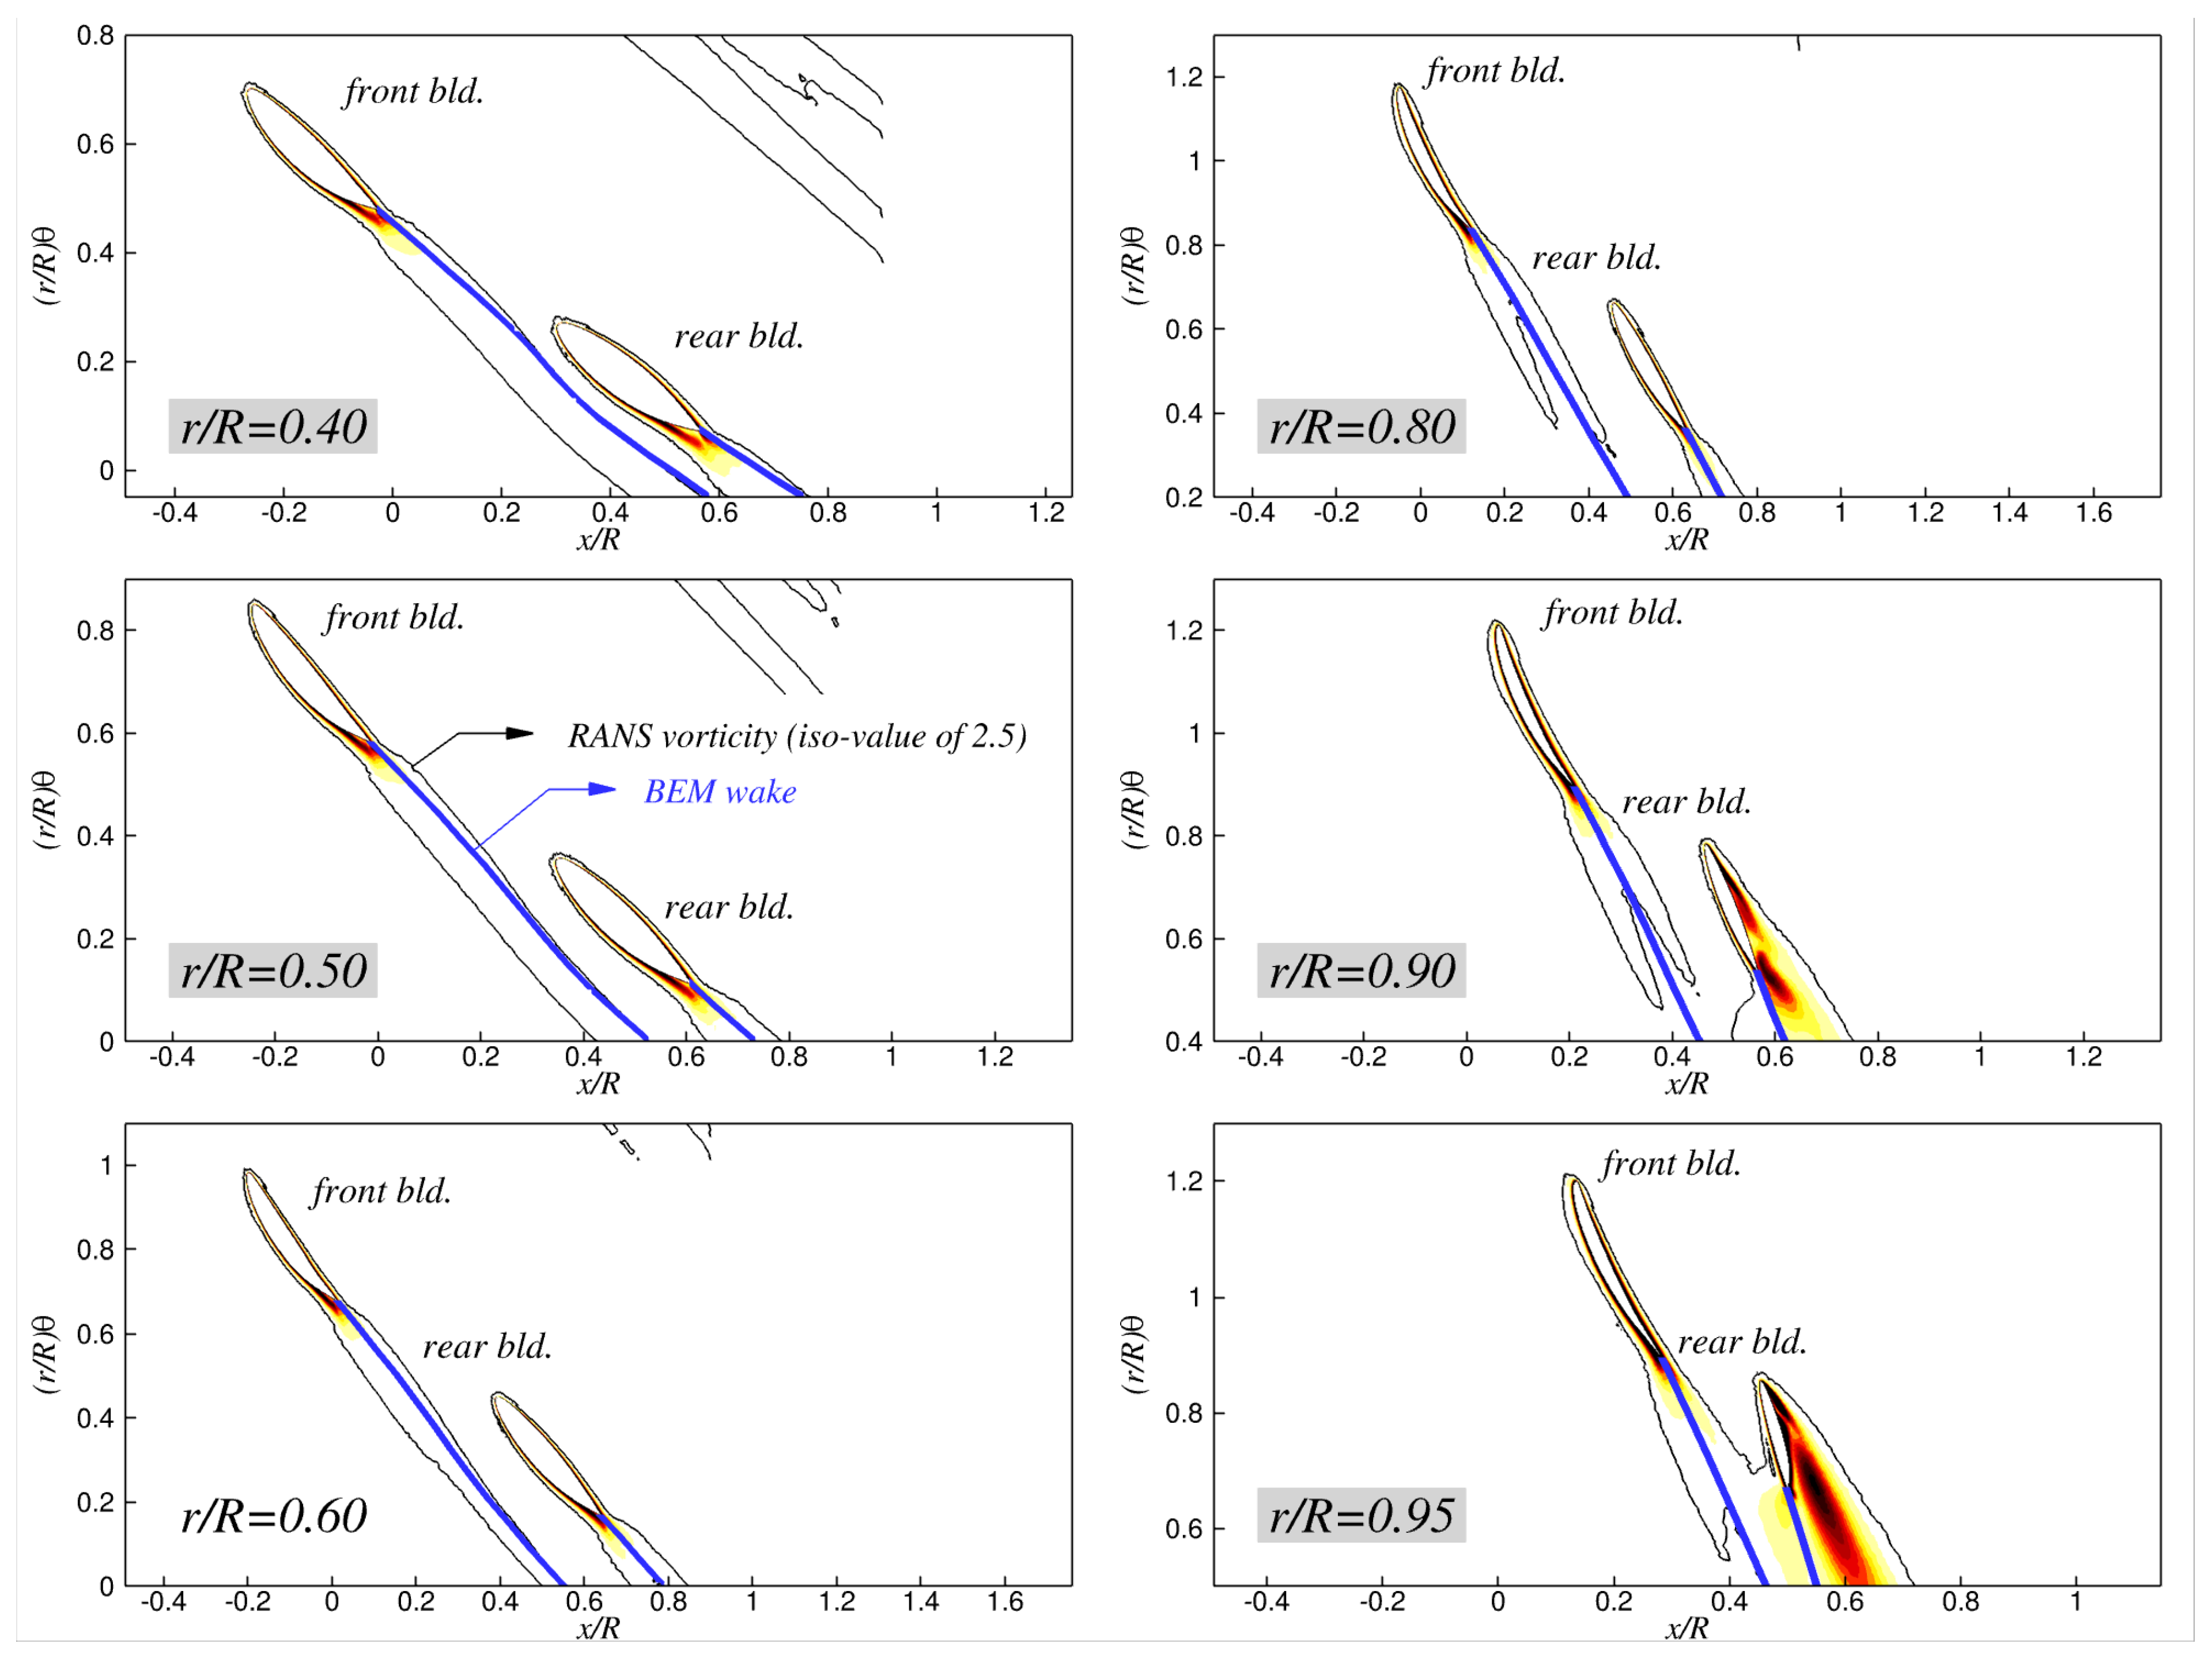
In addition to the wake comparison between the BEM and RANS predictions on the vertical (x-y) plane (Figure 15), Figure 21, Figure 22, Figure 23 and Figure 24 compare the BEM-predicted trailing wakes with the shed vortices from the RANS simulations on the x- r θ plane at several radial stations. Because the toroidal propeller exhibits a non-conventional blade configuration and complex wake topology, it is crucial to validate the BEM-predicted wake trajectories against the viscous RANS results at various radial locations. Overall, the figures show satisfactory agreement between the two different approaches: The BEM trailing wakes, represented as concentrated vortex filaments (blue solid lines in the figures), generally follow the paths of the shed vortices captured in the RANS simulations. The wake–blade interactions near the rear-blade root are particularly well reproduced by the BEM. The predicted wake approaches the rear-blade surface as J s increases, eventually touching the surface at J s = 1.1 , and it then shifts from the suction side to the opposite side of the blade at J s = 1.5 . The RANS results reveal a very similar trend, where the wake shed from the front blade gradually moves closer to the rear blade with increasing J s , bringing the rear blade into the path of the shed wake. These features are captured by the BEM, demonstrating its capability to predict the overall wake alignment and its evolution under varying operating conditions. It is also worth noting that the BEM trailing wake passes extremely close to the rear-blade surface at J s = 1.1 and r / R = 0.30 in the absence of a developing boundary layer on the rear blade surface, which explains the substantial low-pressure regions discussed earlier.

3.2. Parametric Study of the Model Propeller

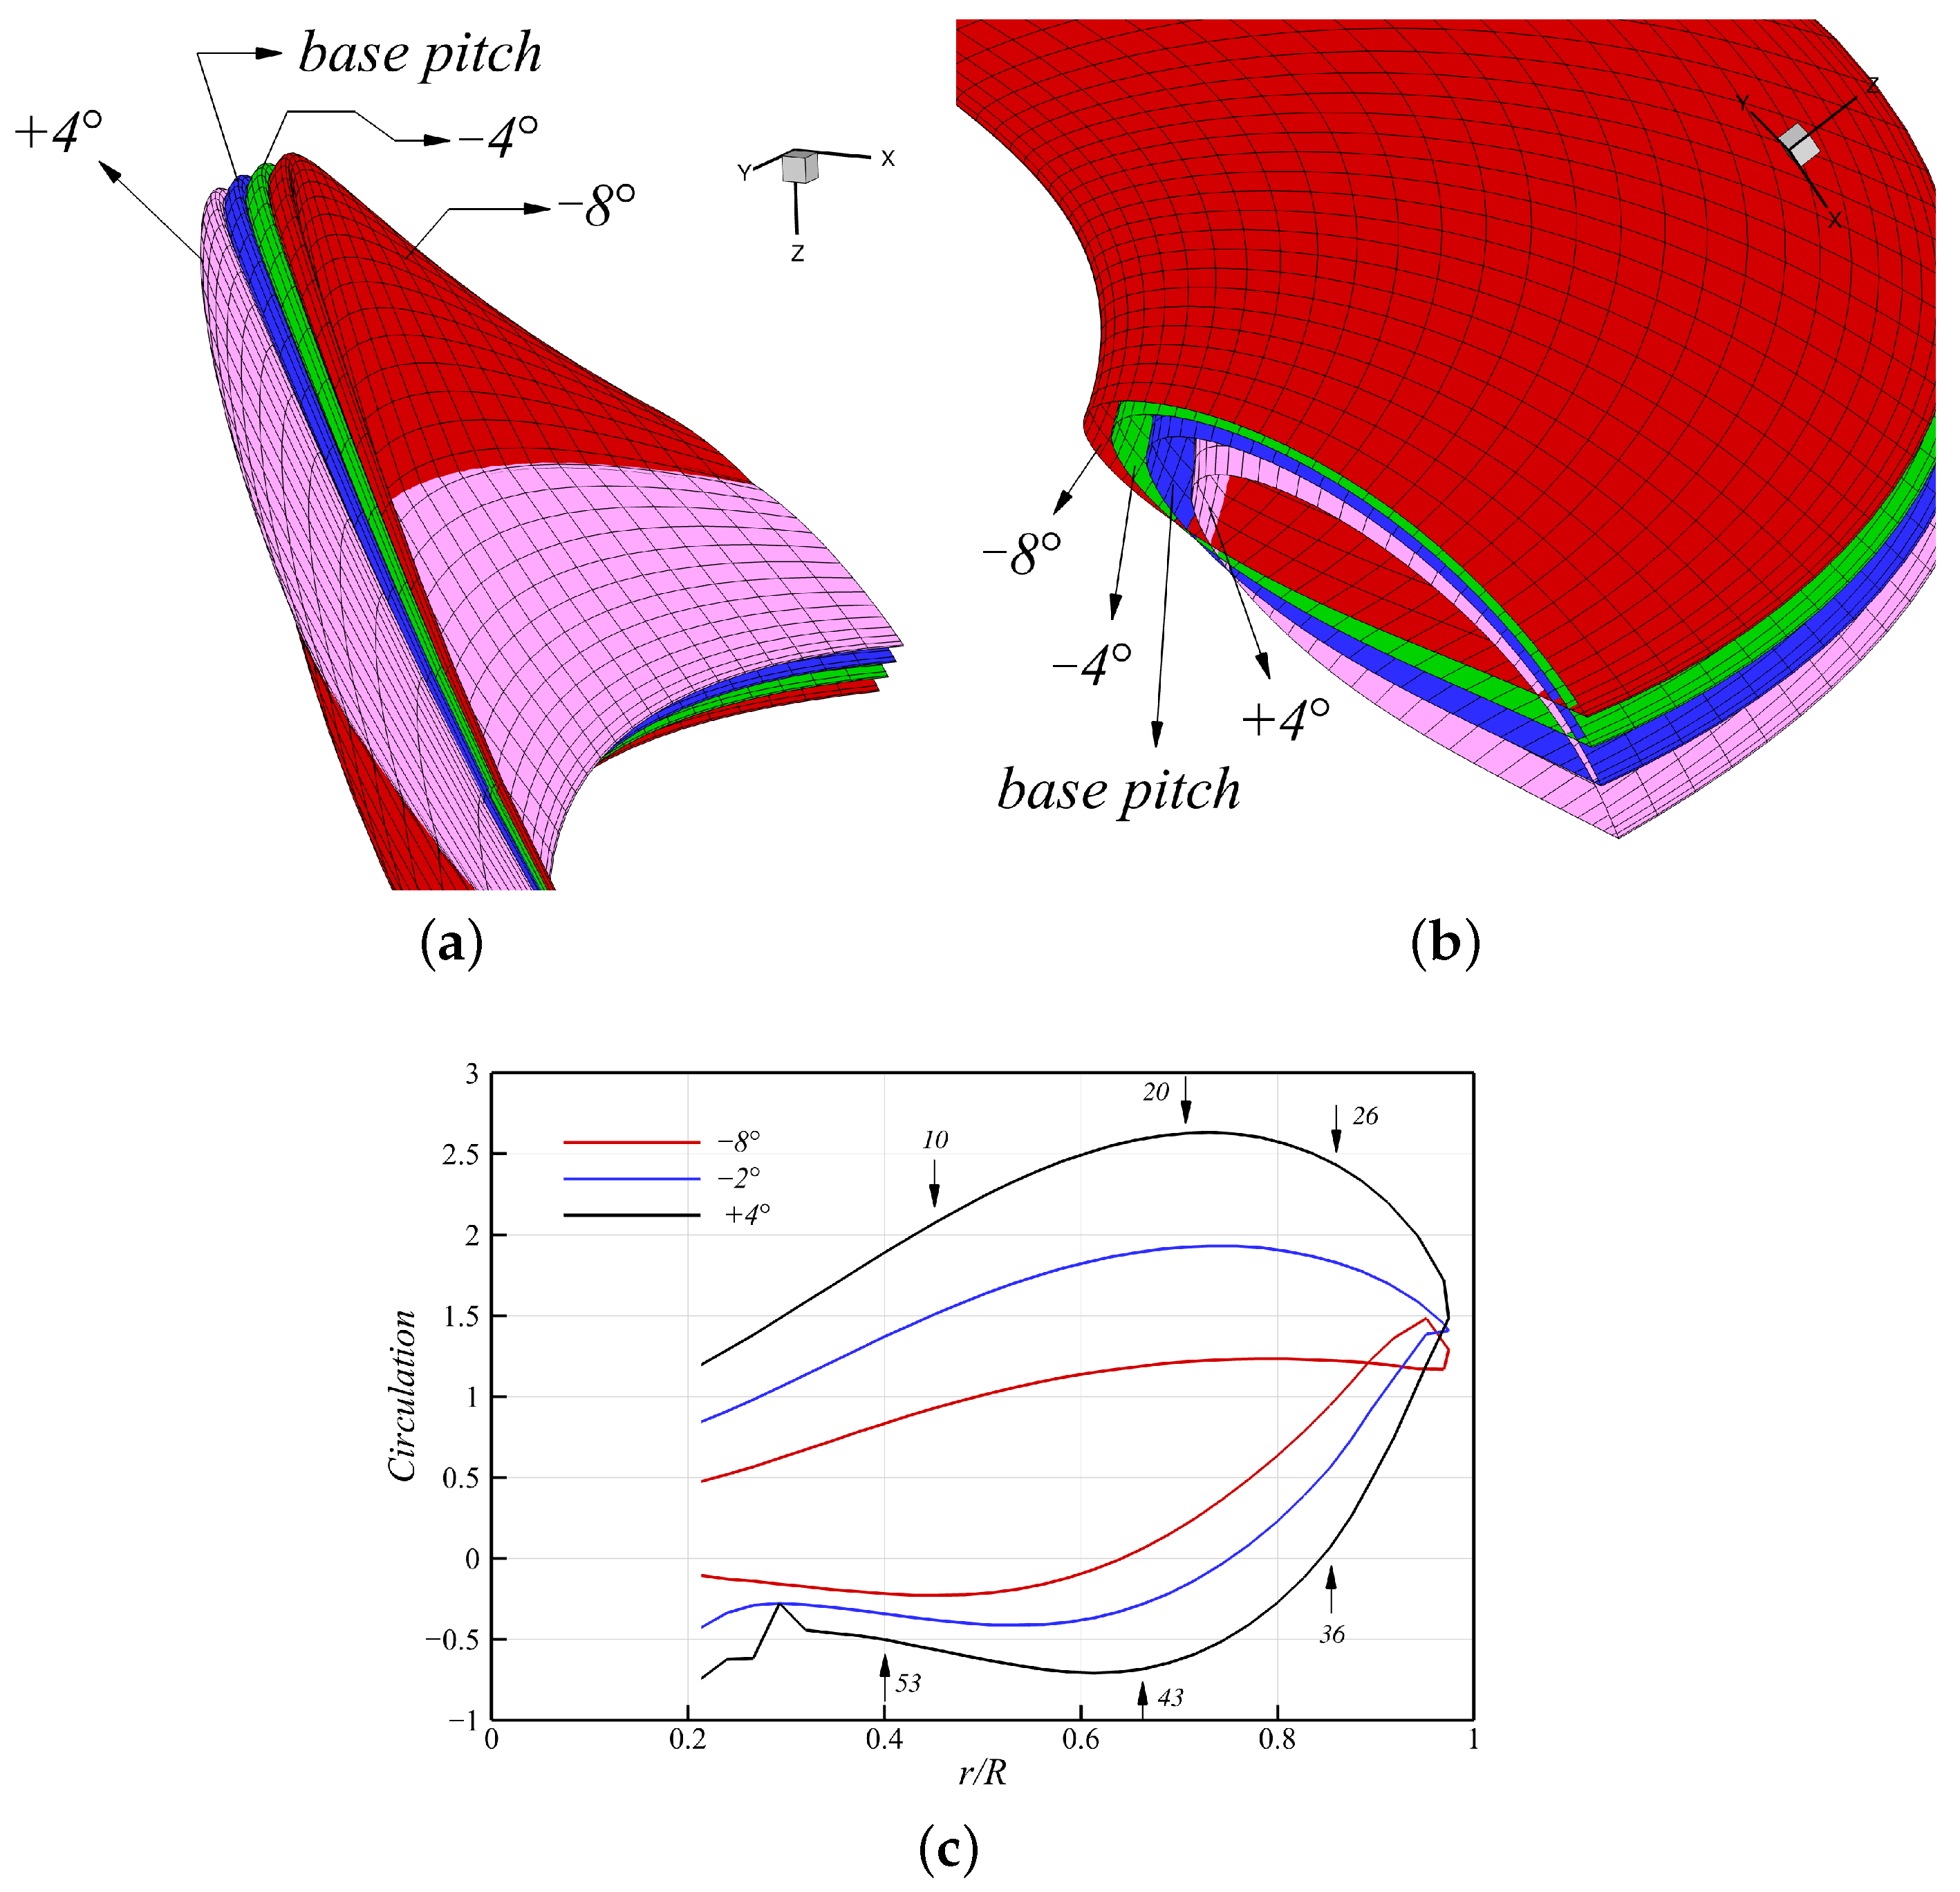
As shown in this section, a parametric study of the model propeller was conducted by varying key geometric parameters, such as the blade pitch, axial distance, and lateral angle, to evaluate the feasibility and reliability of the proposed method across different geometric configurations. For validation, reference was made to the RANS simulation data reported in Kim et al. (2025) [6]. Figure 25a,b shows how the propeller geometry varied with four different pitch angles: 8 , 4 , 0 , and + 4 . The 0 case shows the base pitch, representing the geometry without any pitch adjustment across all radial positions. Figure 25c shows the circulation distribution for pitch angles of 8 , 2 , and + 4 at an advance ratio of J s = 0.9 , presenting how pitch variation affects the loading distribution of the model propeller.
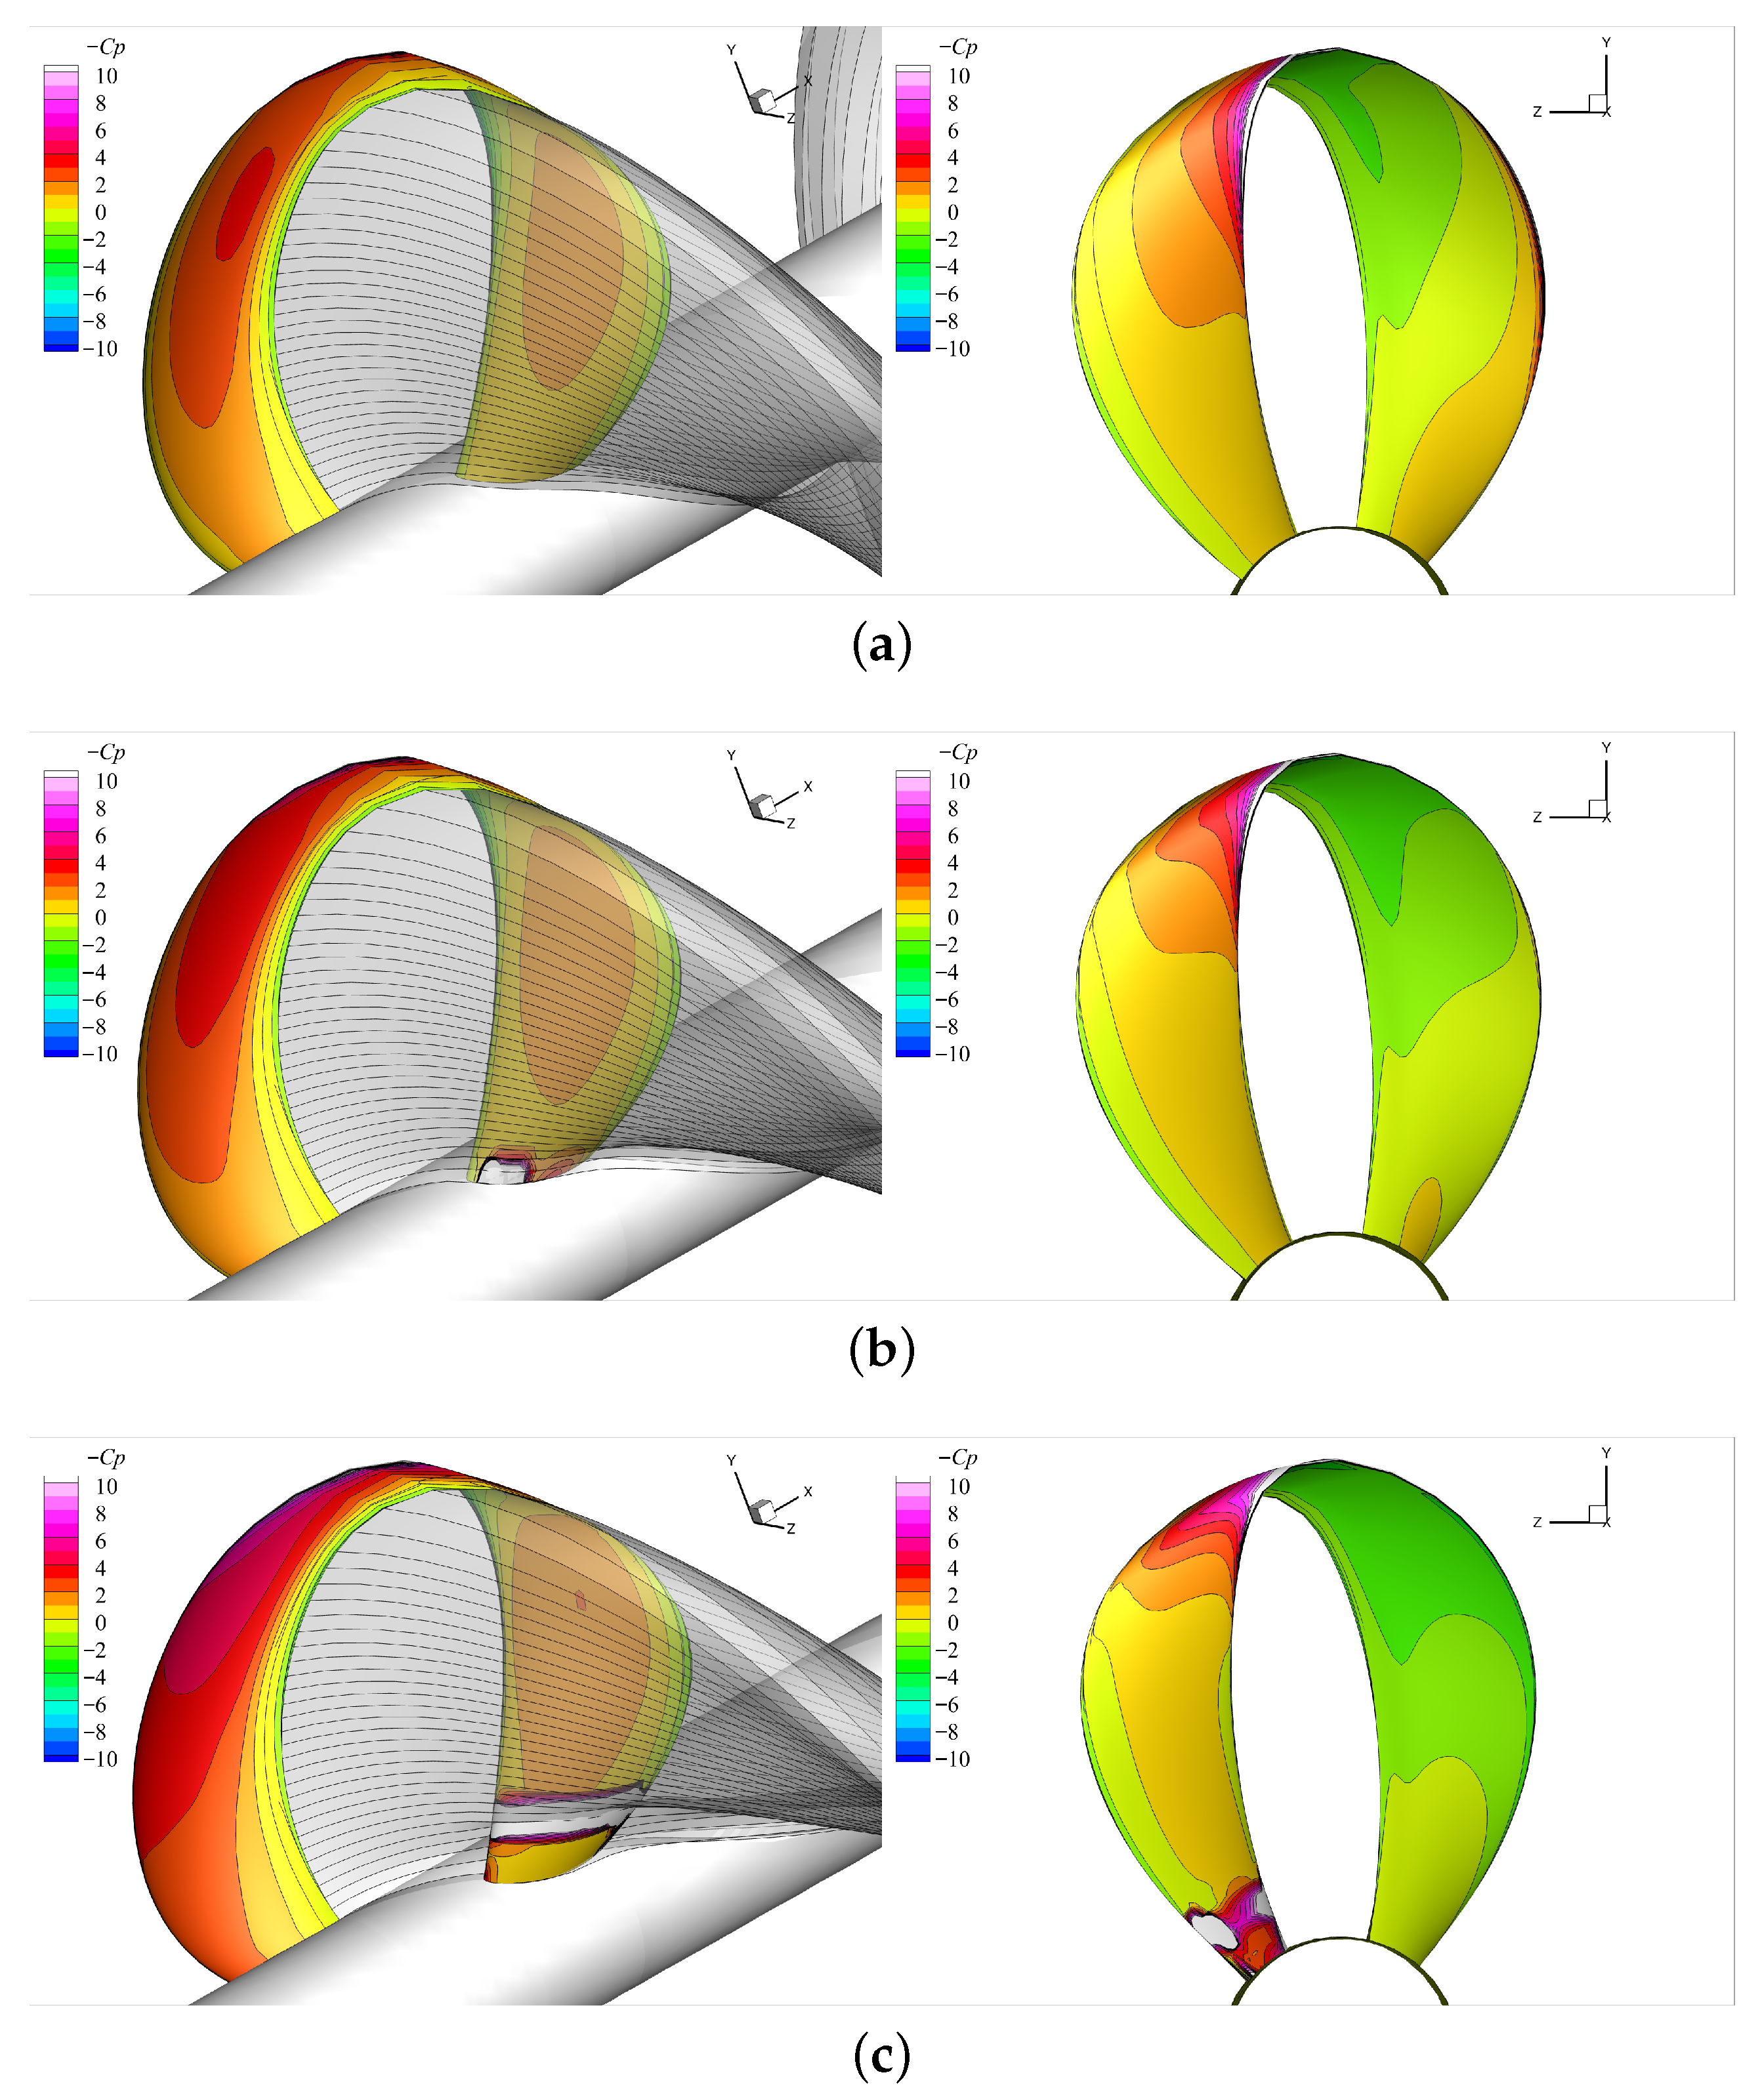
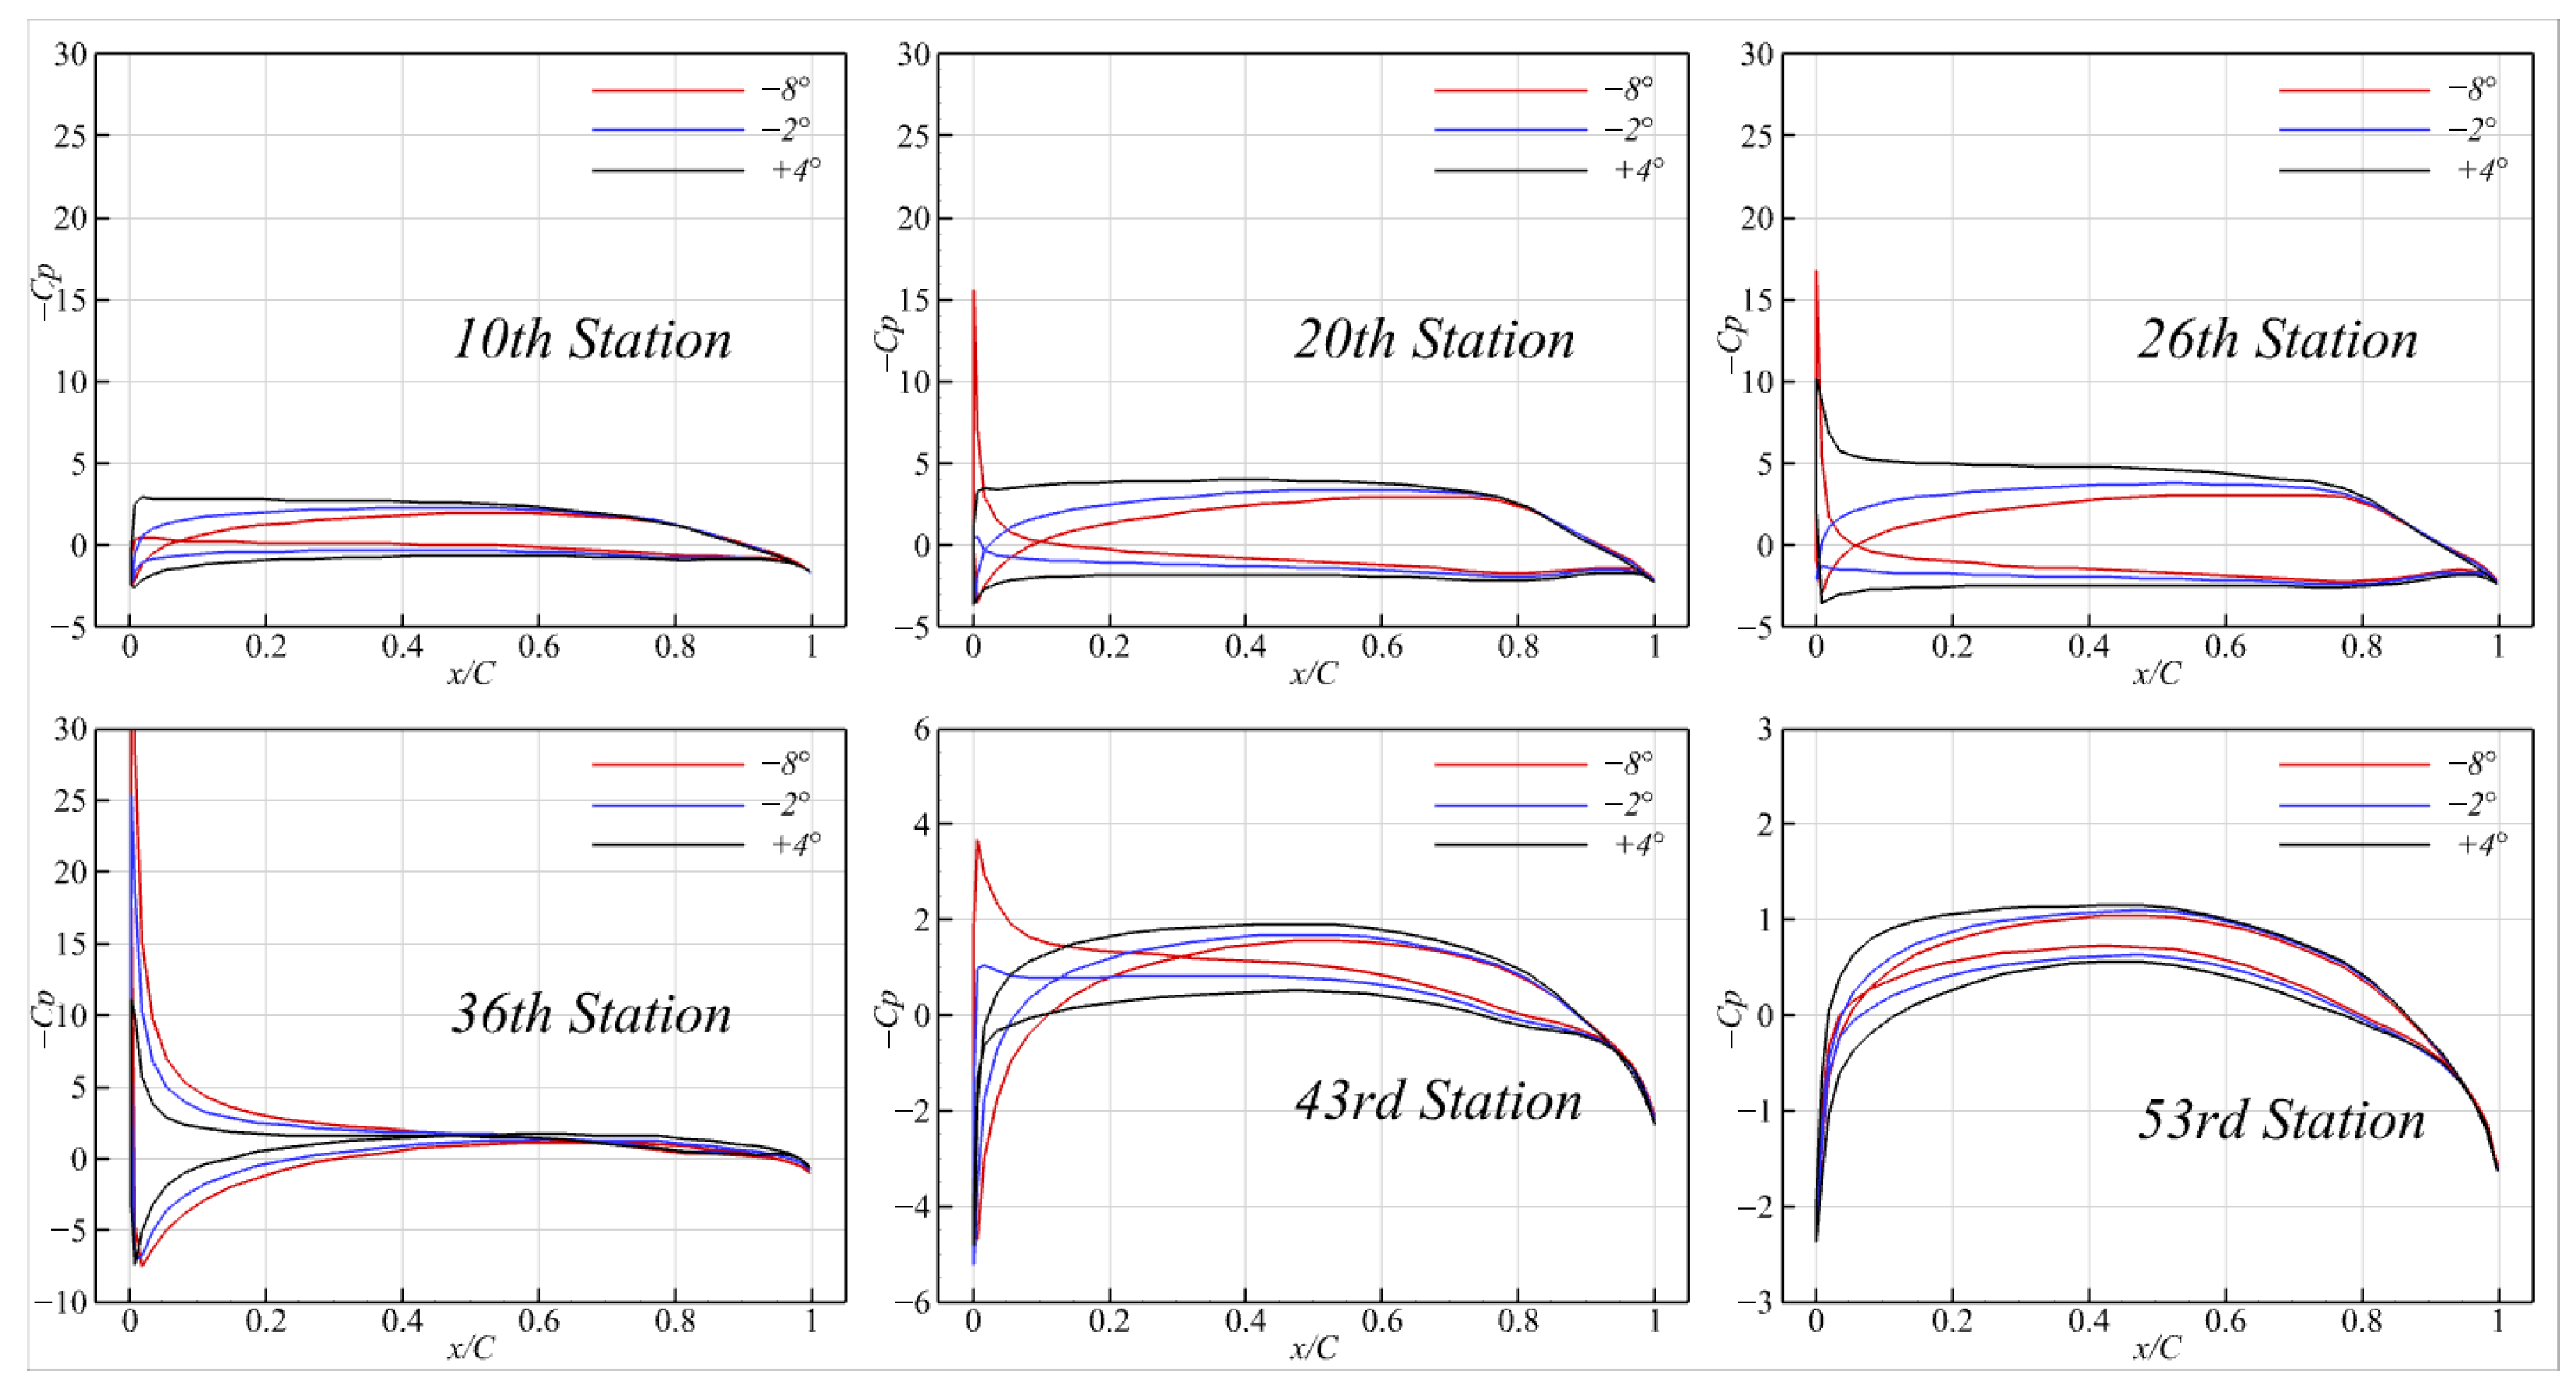
As shown in Figure 26 and Figure 27, the pressure difference between the suction and pressure sides of the blades increased with pitch, resulting in higher loading and thrust on the propeller. In the + 4 pitch case, the loading approached nearly zero around the 36th station as this was the region where the negative thrust (directed downstream) of the rear blade turned positive. Consequently, the negative values in the circulation plot at r / R 0.85 actually indicate a positive thrust that drove the propeller forward, which contrasted with the turbine blades, where negative circulation typically indicates axial forces directed downstream. It is because of the inverted sections with rotation angle ψ that enabled the rear blade to act as a lifting body, rather than as a turbine blade. As will be shown in the following results under different geometric configurations, pitch variation produced the most significant influence on the toroidal propeller loading, whereas the effects of other geometric parameters tested in the present study were comparatively minor.
As the blade pitch increased, the rear blade was gradually placed in the path of the shed wake from the front blade. This wake induced very low pressures as it passed near the rear blade surface, significantly increasing the risk of cavitation, even near the root sections. As noted earlier, the BEM-predicted wake occasionally tended to pass too close to the rear-blade surface, whereas the RANS results showed that viscous effects prevent direct contact between the wake and the blade. To address this gap numerically, one could introduce a numerical fence or a proximity constraint that prevents the wake panels from approaching unrealistically close to the blade surface, allowing the BEM predictions to remain physically consistent with the RANS results in the regions of intensive blade–wake interaction.
Figure 28 shows a comparison of the predicted forces from the proposed method with the RANS results [6] across a range of pitch adjustments, from 8 to + 4 , at two different advance ratios: J s = 0.3 and 0.7 . The overall magnitudes and trends predicted by the proposed method showed promising agreement, although the torque tended to be slightly underpredicted compared to the RANS results. As shown in Figure 27, increasing the pitch reduced the reversed pressure peaks at the leading edge, which likely helps to prevent flow separation on the face side of the blade and, thus, results in better agreement between the panel method and the viscous simulations.
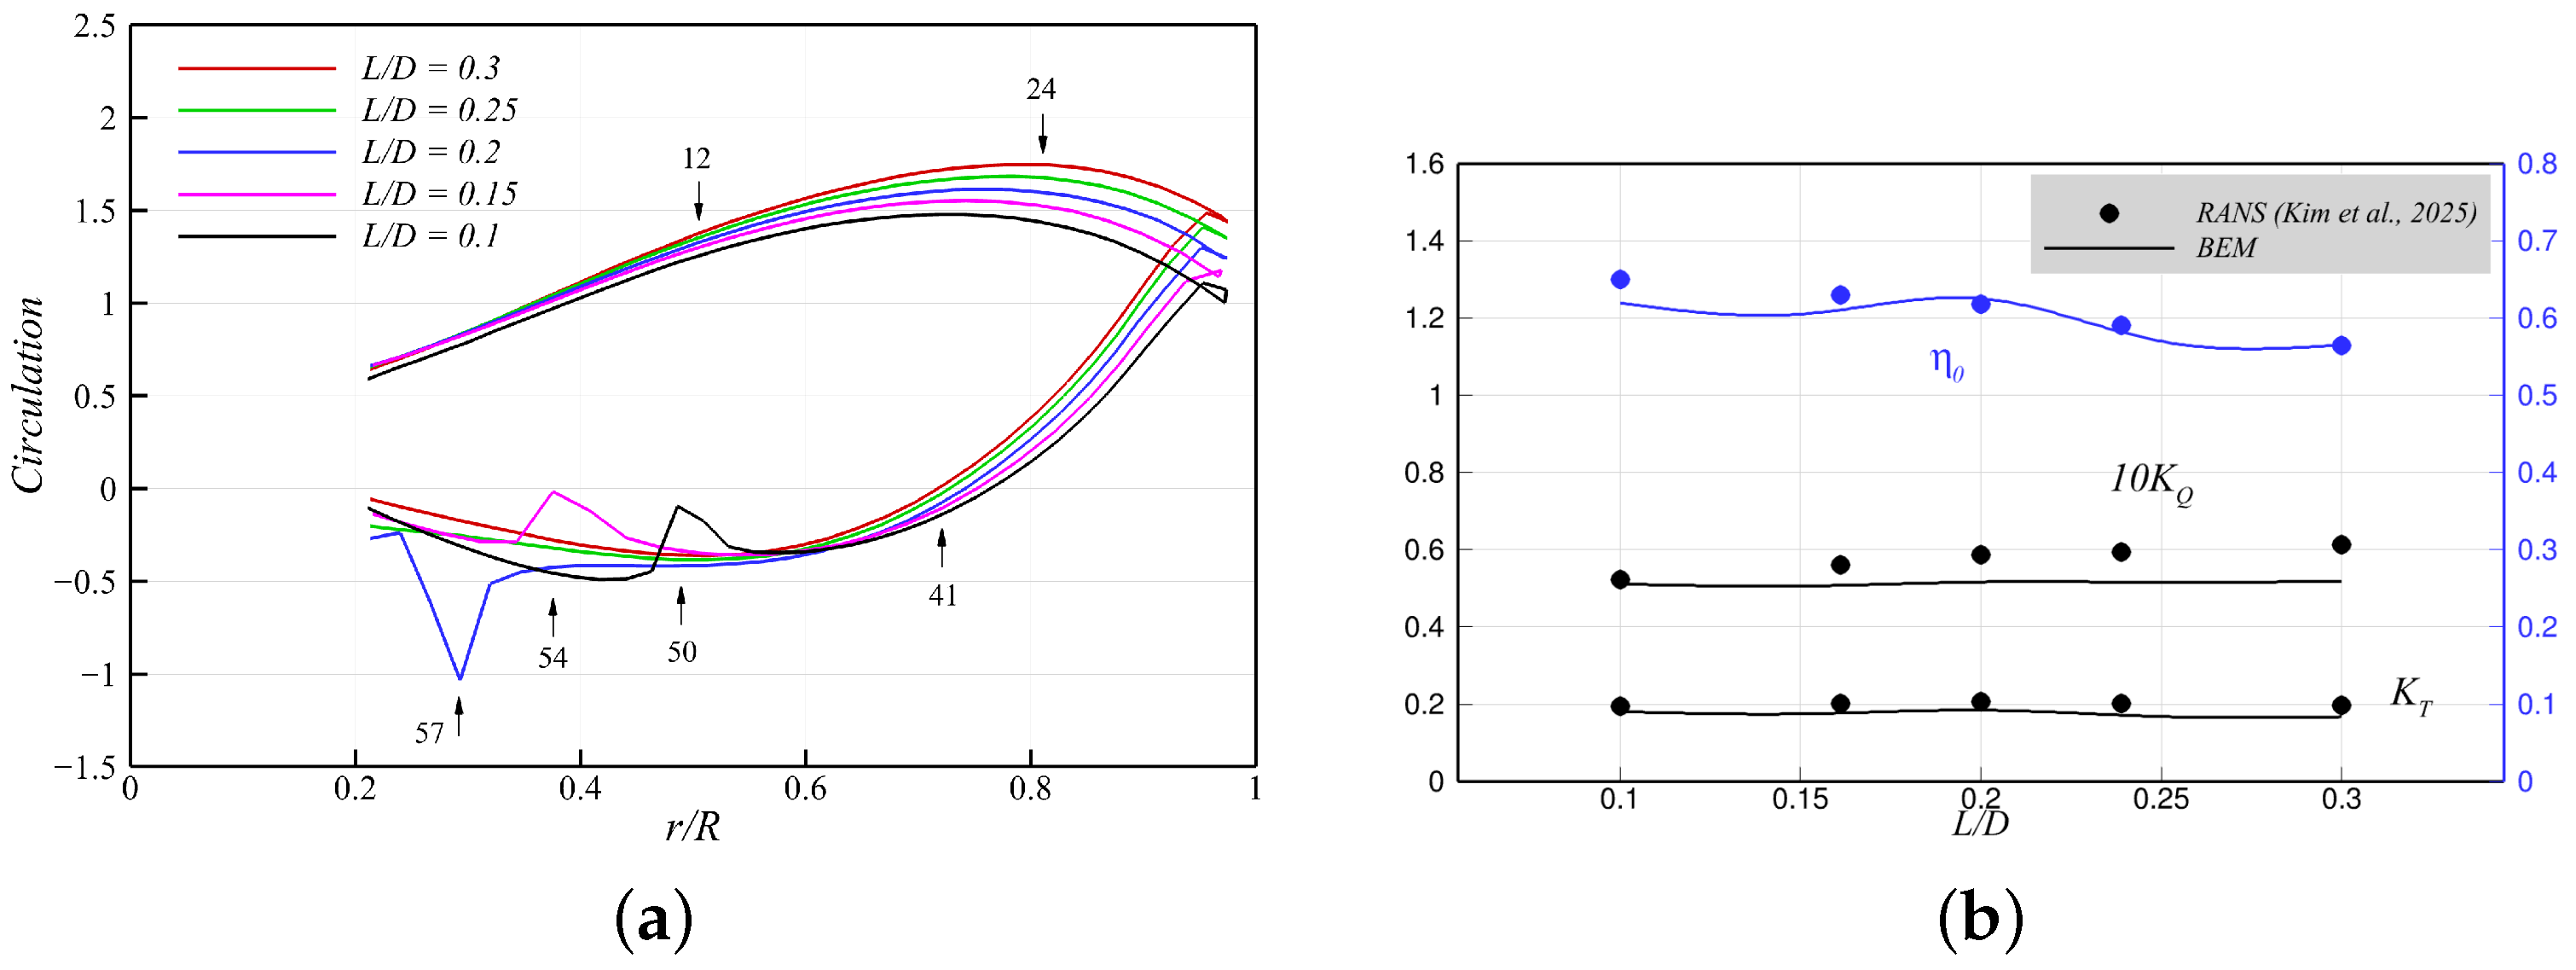
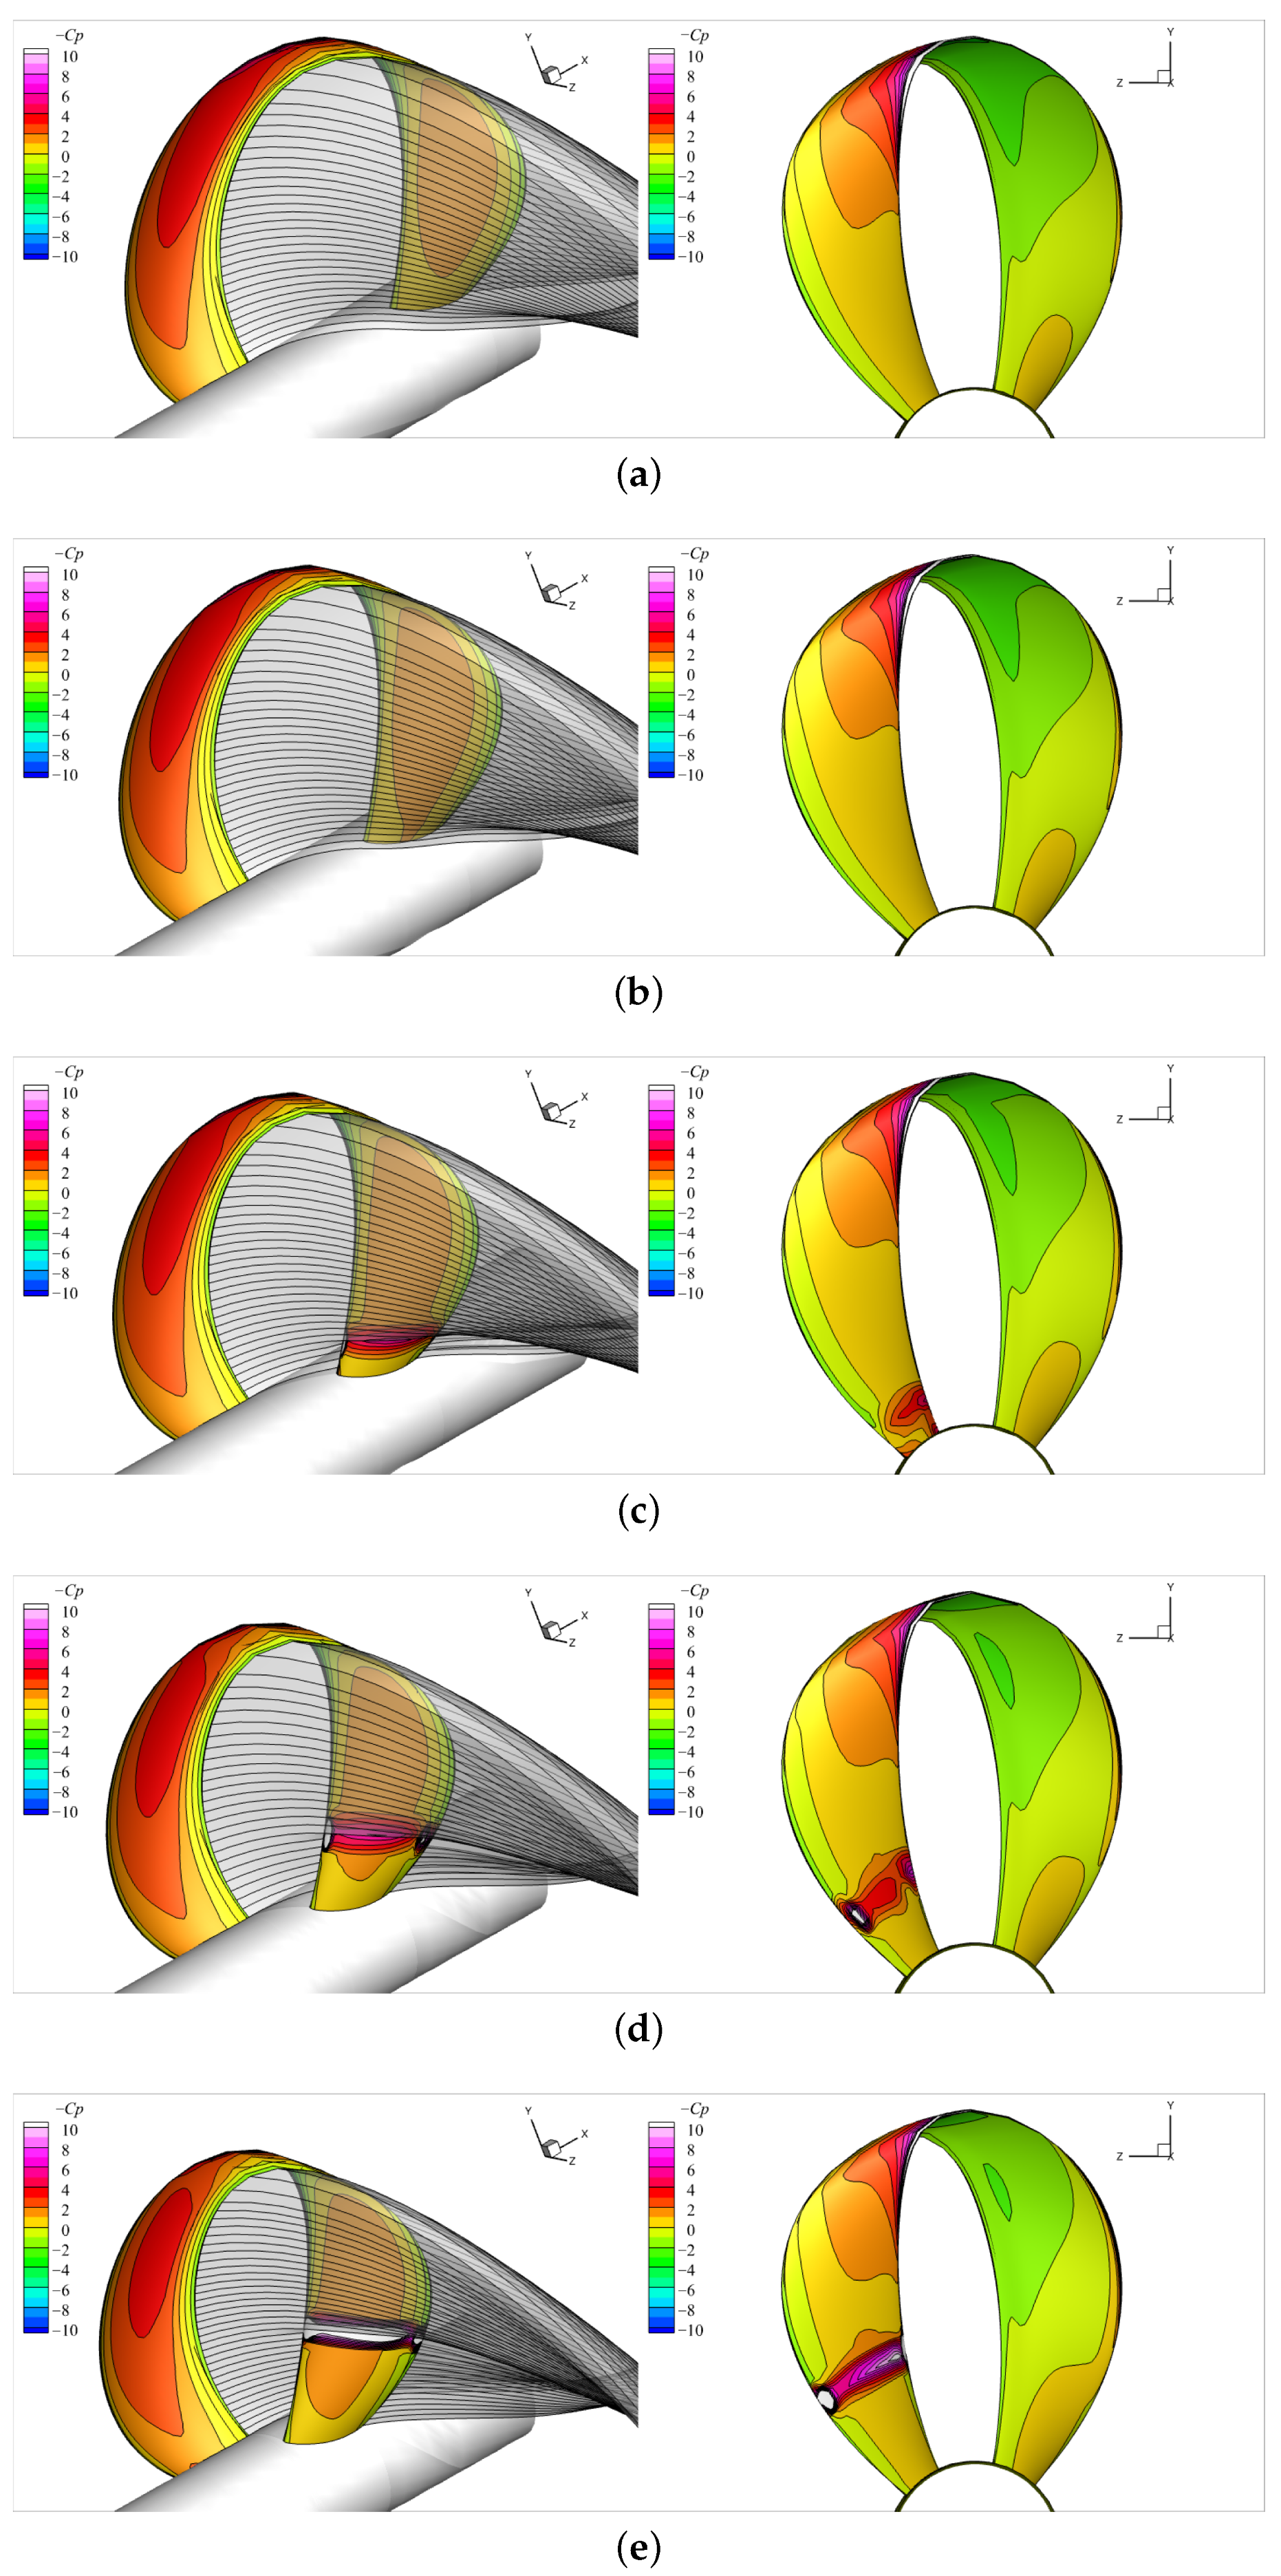
Next, the present method was evaluated for various axial distances, L / D = 0.1 , 0.15, 0.20, 0.25, and 0.30 , at an advance ratio of J s = 1.1 , as shown in Figure 29. As the axial gap between the front and rear blades was reduced, the rear blade progressively entered the path of the shed wake. When L / D 0.20 , the wake from the front blade began to impinge on the rear blade surface, lowering its local surface pressure. This pressure drop became more pronounced at smaller axial distances due to stronger blade–wake interactions as the wake impingement point shifted radially outward.
Low-pressure regions were shown on the pressure (face) side of the rear blade ( 0.7 r / R 1.0 ), which became smaller as the axial distance decreased, thereby reducing thrust cancellation. This trend can be further examined through the circulation distributions presented in Figure 30a, which shows that the beak of the circulation curve progressively approached zero with shorter axial spacing. The abnormal peaks near the rear blade root resulted from the localized pressure variations caused by the interactions between the shed wake and the rear blade. When the fully aligned wake was positioned close to the blade surface, it lowered the local pressure, either on the suction or pressure side (depending on its location of contact). For instance, in the cases of L / D = 0.1 and L / D = 0.15 , the wake impinging on the pressure side of the rear blade (facing downstream) reduced the local pressure and, consequently, diminished the positive thrust in that region. In contrast, for L / D = 0.2 , the wake situated close to the suction side decreased the suction side pressure, thereby enhancing the thrust, as shown in the increased loading near r / R 0.3 in Figure 30a. This interaction led to a slight increase in both K T and K Q at L / D = 0.2 , as observed in both the BEM and RANS predictions shown in Figure 30b.
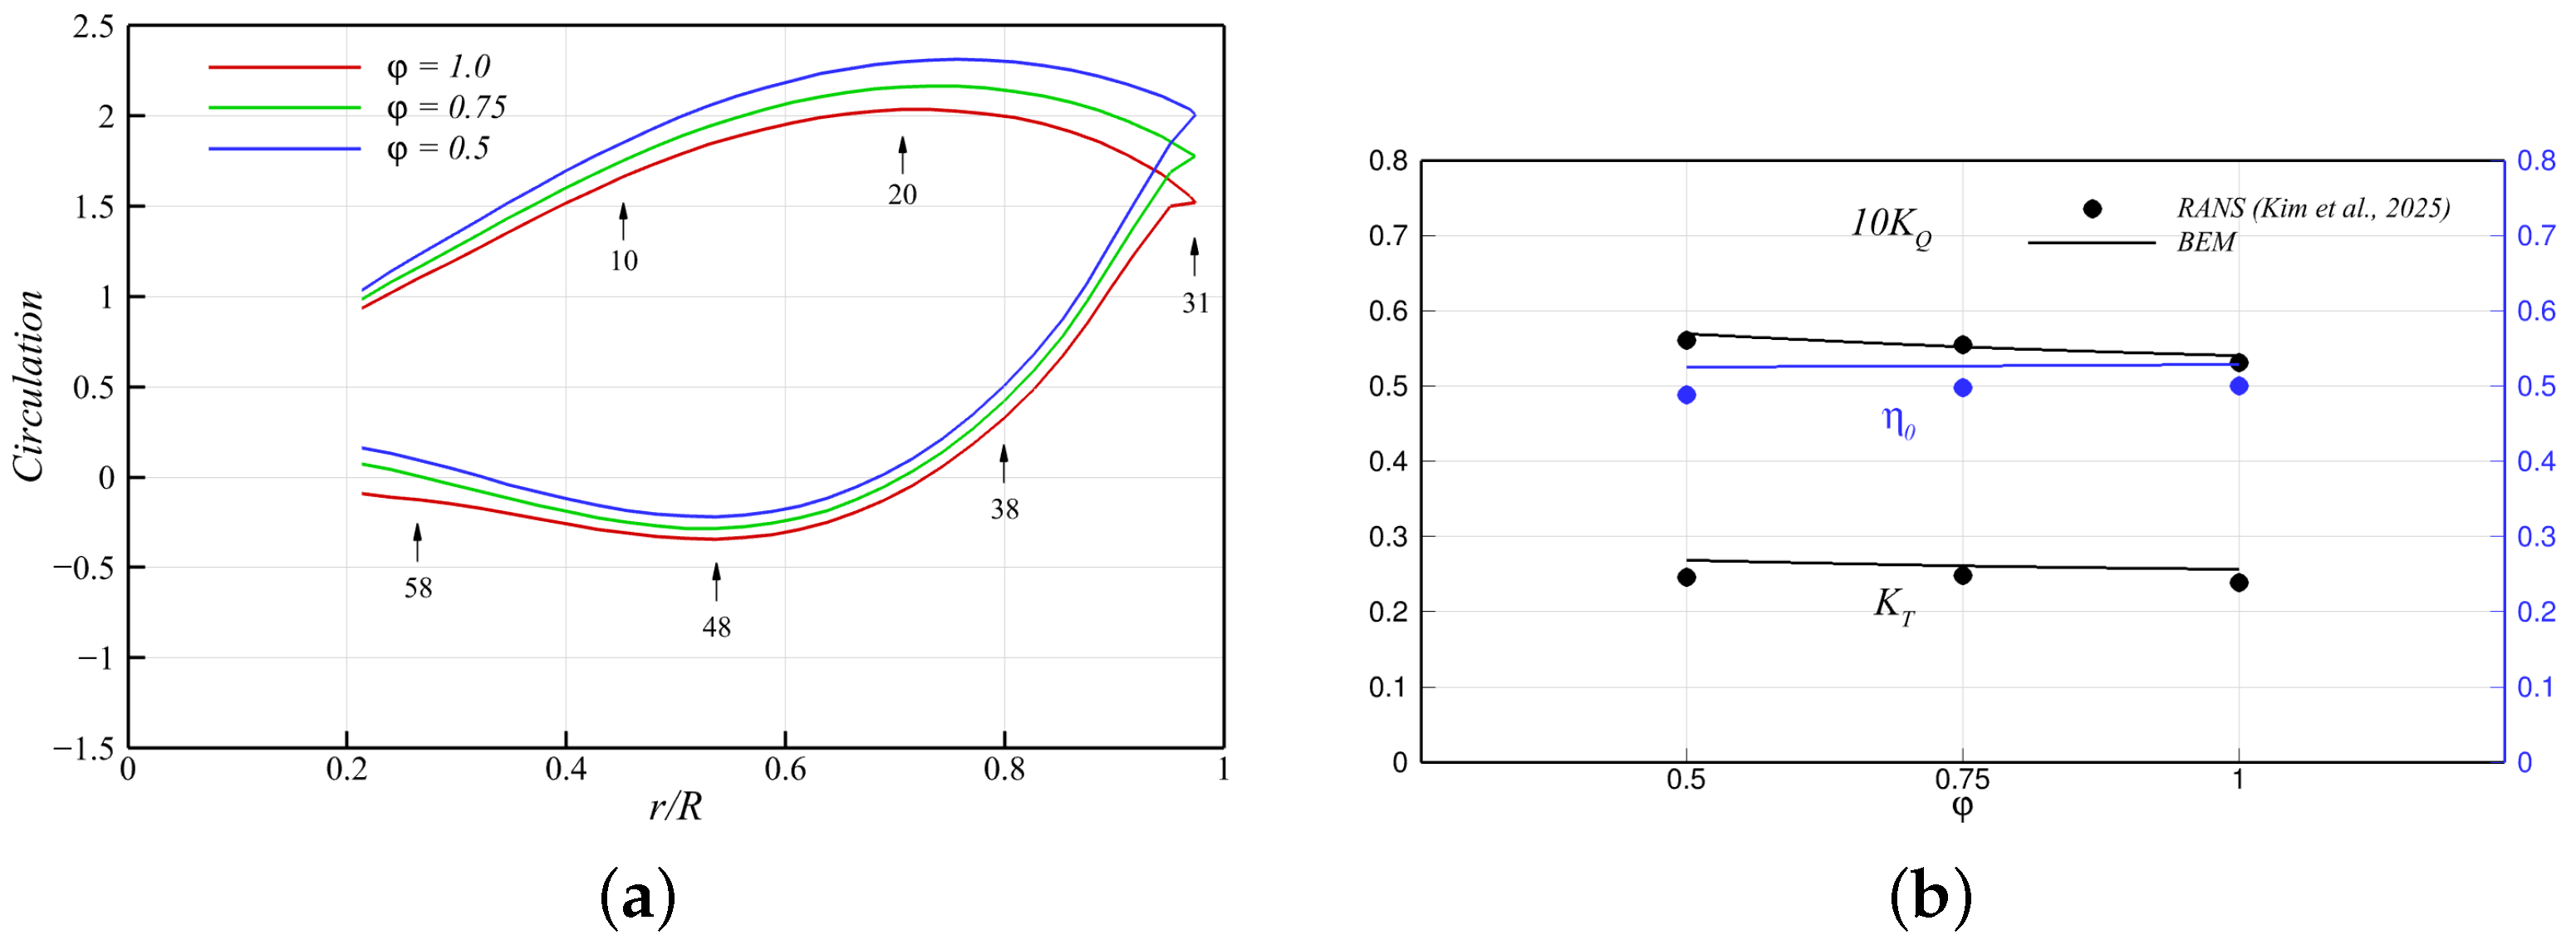
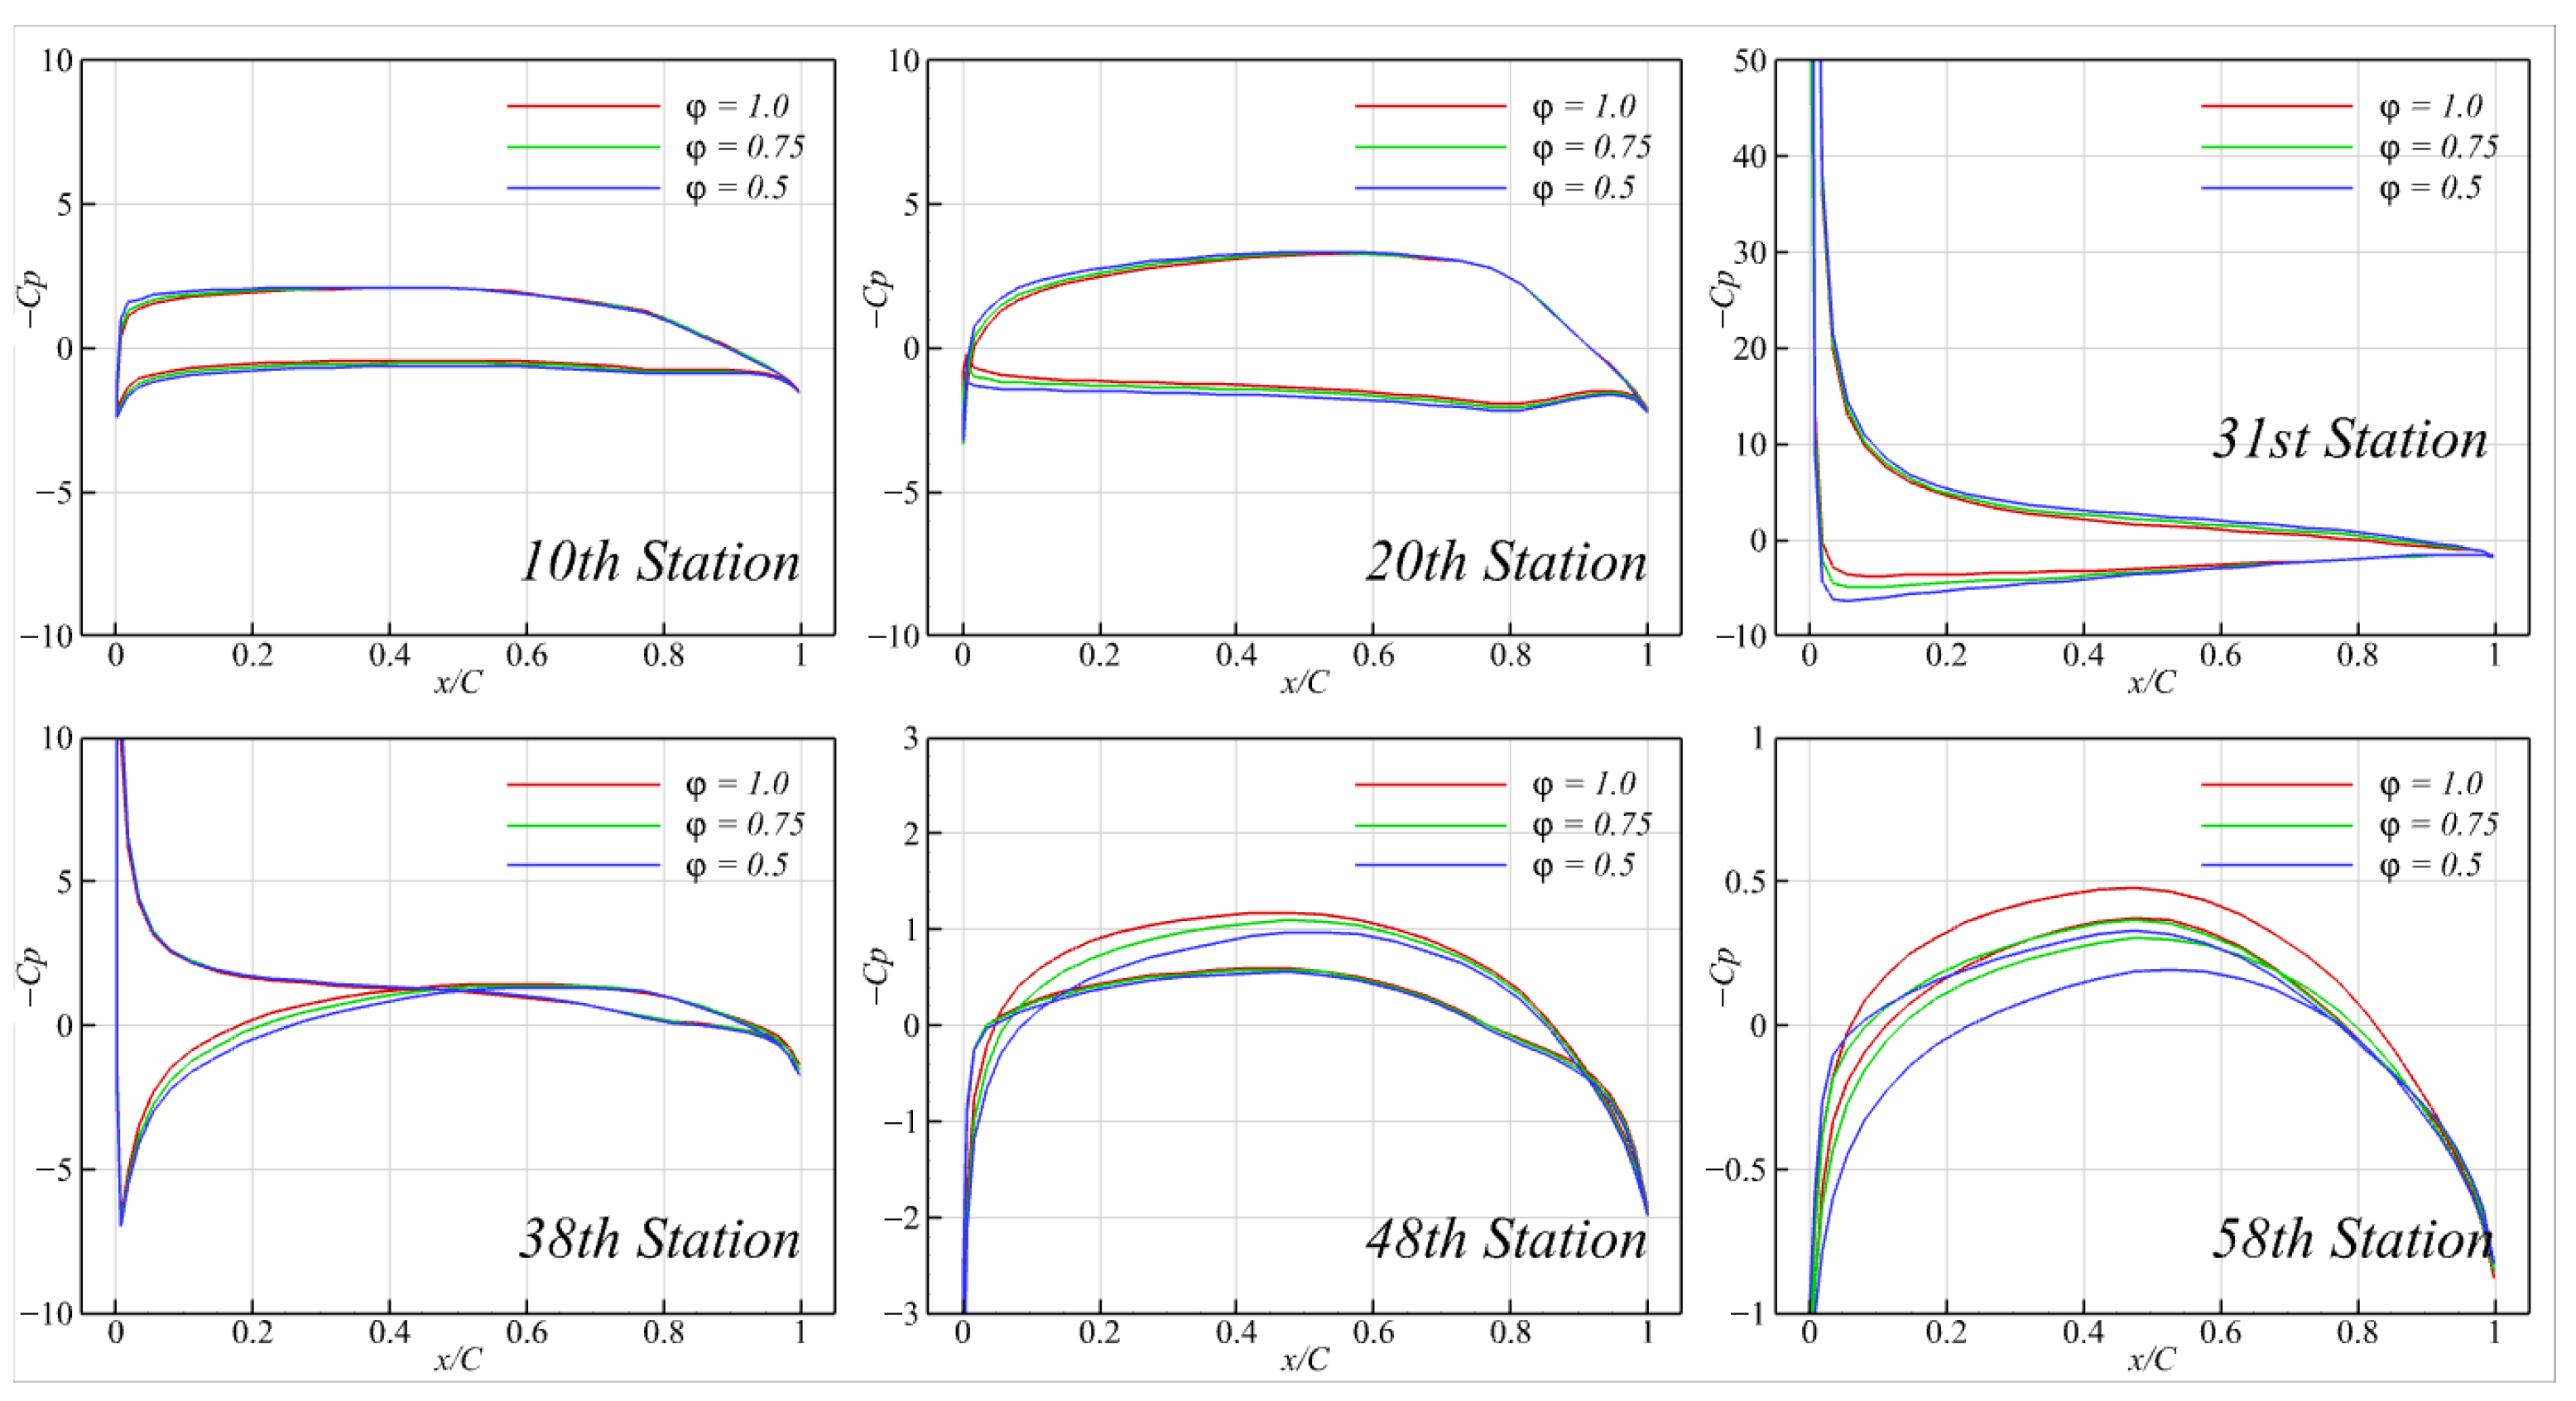
Lastly, the proposed method was evaluated for different lateral angles, i.e., φ = 0.5 , 0.75 , and 1.0 , at an advance ratio of J s = 0.7 , as shown in Figure 31, where φ = 1.0 corresponds to the baseline geometry. The cases where φ = 0.75 and 0.5 represent the configurations where the lateral angle of the baseline geometry was uniformly reduced to 75% and 50% of its original value, respectively, along the entire span.
Figure 32 presents the circulation distributions and a comparison of the thrust and torque coefficients ( K T and K Q ) between the proposed method and RANS. At this J s , variations in the later angle φ did not lead to significant changes in overall propeller loading. Specifically, as φ decreased, the front blade experienced increased loading, but the rear blade simultaneously lost positive thrust, resulting in a net thrust cancellation. The beak of the circulation distribution also deviated further from zero as φ decreased, without providing significant improvement in efficiency η 0 (Figure 32b). This trade-off should be carefully considered when using lateral angles as a key design parameter for toroidal propellers. The surface pressure distributions (Figure 33) further suggest that the current geometries were highly prone to cavitation on both the face and back sides of the blades; due to the high torque and pressure peaks near the leading edge, the model propeller will likely experience supercavitation.
4. Conclusions

This study presents a boundary element method (BEM) for the hydrodynamic analysis of toroidal propellers. The objective was to assess the feasibility of the method in handling complex propeller geometry by incorporating non-conventional geometric controls, such as rotation and the lateral and vertical angles for a range of parametric variations and loading conditions. Based on its theoretical foundation, the proposed method captures the inviscid flow features around complex looped geometry and presents the interactions between a fully aligned wake and a looped blade. Validation against the RANS simulations showed that the proposed method is capable of predicting thrust and torque with promising agreement, particularly under moderate loading conditions. The limitations of the BEM have also been discussed, where it was noted that the BEM cannot capture viscous phenomena such as flow separation and the unsteady vortical interactions between the front and rear blades, both of which influence local pressure distributions and downstream wake dynamics.
In the open water performance analysis, the proposed BEM successfully reproduced the overall trends and magnitudes of thrust and torque predicted by the RANS simulations, demonstrating good predictive capability under a wide range of loading conditions. The primary discrepancies were observed near the blade leading edge, where the RANS results captured strong pressure peaks and local flow separation on the suction side. As the advance ratio increased, the blade angle of attack deceased, leading to more attached flow and, consequently, improving the agreement between the BEM and RANS results. In the wake field, the fully aligned BEM wakes showed good consistency with the trajectories of the vortices shed in the RANS simulations, including their approach and eventual interaction with the rear blade at higher J s . However, the concentrated wake representation in the BEM occasionally resulted in the wake passing substantially close to the blade surface, producing locally low pressures that were not observed in the viscous RANS results, where the boundary layer prevented direct wake impingement.
The study was also extended to examine the flexibility of the method through a parametric analysis of key geometric variations, including variations in the pitch, axial spacing, and lateral angle. These investigations show key insights into how such parameters affect thrust distribution, the wake interactions arising from geometric change, and the risk of cavitation. In particular, the circulation distribution patterns reveal the critical role of the transition region between the front and rear blades, where the looped geometry induces negative thrust near the upper part of the rear blade and, thus, reduces the net propulsive force. Optimizing this region appears to be essential in order to minimize thrust cancellation and achieve an optimal configuration. The results indicate that modifying the propeller geometry through changes in pitch, lateral angle, or axial spacing has a direct impact on performance. Among these, pitch variation had the most pronounced influence on the propulsive forces, whereas the effects of lateral angle and axial spacing were less significant. Instead, these latter parameters primarily increased the risk of the rear blade being placed in the path of the shed wake from the front blade, leading to very low surface pressures and a higher chance of cavitation. The circulation distribution supported these conclusions, showing only minor changes in propeller loading except in the case of pitch variation. These findings emphasize important considerations for toroidal propellers, particularly when using those parameters as key geometric variations.
Across all the presented studies, the superior computational efficiency of the proposed method was advantageous, making it adequate for early-stage design. For a given set of geometric parameters, geometry generation was completed within one second, and the hydrodynamic BEM solution required only about five to ten minutes for each J s , which is beneficial for exploring the influence of different geometries on the overall propeller performance.
For future work, it is intended to extend the existing framework to address several of the limitations discussed in the present study. As revealed in the detailed comparison between the BEM and RANS results, key viscous flow phenomena were captured in the RANS simulations but not in the potential-based BEM predictions. Such viscous effects influence the local surface pressures, particularly near the leading edge, the midchord where the flow separates, and on the rear blade. To mitigate these limitations, the proposed method can incorporate an approach based on the leading-edge vortex (LEV) model proposed by Tian and Kinnas (2011) [18] within the context of the panel method. In this model, the separated vortex is represented as an additional free vortex shed from the leading edge and governed by a pressure-based Kutta condition. The LEV sheet is convected using a de-singularized Biot–Savart kernel and a pseudo-unsteady alignment scheme, which enables improved predictions of low-pressure regions near the blade leading edge. In addition, efforts are underway to extend the existing framework to cavitating flow conditions, with the corresponding results forthcoming. Similar to the approach applied to conventional open propellers [17], the cavitation modeling in the proposed BEM will utilize the blade surface pressures obtained from fully wetted simulations. The cavity prediction algorithm identifies the onset of cavitation by locating the detachment points on each side of the blade, where the local surface pressure first drops below the specified cavitation number, determining the position of the cavity leading edge. Additionally, coupling the proposed BEM with a Ffowcs Willams–Hawkings acoustic formulation, as previously applied to conventional open propellers [19,20,21], can be extended for toroidal propellers to assess their underwater noise characteristics. These applications will contribute to a more comprehensive framework for evaluating both the hydrodynamic and hydroacoustic performance of novel marine propulsion systems.

Funding

This work was supported by the Hongik University new faculty research support fund.

Data Availability Statement

Data are available from the corresponding author upon request.

Conflicts of Interest

The author declares no conflicts of interest.

References

  1. Jansen, H. Impact of Toroidal Propeller Design on Unmanned Aerial Vehicle Acoustic Signature and Aerodynamic Performance. Int. J. Aerosp. Eng. 2024, 2, 1–11. [Google Scholar]
  2. Wang, C.; Liu, S.; Xia, K.; Wang, C.; Ye, L. Numerical research on hydrodynamic performance of toroidal propeller under the influence of geometric parameters. Ocean. Eng. 2024, 314, 119704. [Google Scholar] [CrossRef]
  3. Wu, J.; Wang, Q.; Deasy, H.; Hang, J. A Study on the Effect of Toroidal Propeller Parameters on Efficiency and Thrust. Energies 2024, 17, 5938. [Google Scholar] [CrossRef]
  4. Vu, X.D.; Nguyen, A.T.; Nha, T.L.; Chu, H.Q.; Dinh, C.T. Numerical Aerodynamic and Aeroacoustic Analysis of Toroidal Propeller Design. Int. J. Aviat. Sci. Technol. 2024, 5, 20–33. [Google Scholar] [CrossRef]
  5. Xu, P.; Guo, Y.; Ye, L.; Song, K. Hydrodynamic Performance of Toroidal Propeller Based on Detached Eddy Simulation Method. J. Mar. Sci. Eng. 2024, 12, 2132. [Google Scholar] [CrossRef]
  6. Kim, M.; Jung, S.; Paik, B.; Ahn, J.; Kim, S.; Kim, J.; Park, I. Numerical Study on the Open Water Performance of a Toroidal Propeller Using CFD. J. Soc. Nav. Archit. Korea 2025, 62, 187–198. [Google Scholar] [CrossRef]
  7. Sebastian, T.; Strem, C. Toroidal Propeller. U.S. Patent US10836466 B2, 17 November 2020. [Google Scholar]
  8. Time Editorial Staff Sharrow MX Propeller. Time Magazine, 24 October 2023. Available online: https://time.com/collection/best-inventions-2023/6324424/sharrow-mx-propeller/ (accessed on 12 August 2025).
  9. Hassan, H.M.; Elsakka, M.M.; Refaat, A.; Zhang, H.; Yin, Z.; Ahmed, A.; Moustafa, M.M. A comparative study on the hydrodynamic performance of traditional and closed-loop marine propellers. Mar. Syst. Ocean. Technol. 2025, 20, 34. [Google Scholar] [CrossRef]
  10. Ye, L.; Wang, C.; Sun, C.; Guo, C. Mathematical expression method for geometric shape of toroidal propeller. Chin. J. Ship Res. 2024, 19, 224–233. [Google Scholar]
  11. Kim, S.; Kinnas, S.A. PROPCAV R2022—User Manual and Documentation; OEG Report 22-1; Ocean Engineering Group, The University of Texas at Austin: Austin, TX, USA, 2022. [Google Scholar]
  12. Kerwin, J.E.; Hadler, J.B. The Principles of Naval Architecture Series: Propulsion; The Society of Naval Architects and Marine Engineers: New York, NY, USA, 2010. [Google Scholar]
  13. Kim, S.; Kinnas, S.A.; Du, W. Panel method for ducted propellers with sharp trailing edge duct with fully aligned wake on blade and duct. J. Mar. Sci. Eng. 2018, 6, 89. [Google Scholar] [CrossRef]
  14. Baltazar, J.M.; Rijpkema, D.; de Campos, J.F.; Bosschers, J. Prediction of the Open-Water Performance of Ducted Propellers with a Panel Method. J. Mar. Sci. Eng. 2018, 6, 27. [Google Scholar] [CrossRef]
  15. Lee, H.; Kinnas, S.A. Unsteady wake alignment for propellers in nonaxisymmetric flows. J. Ship Res. 2005, 49, 176–190. [Google Scholar] [CrossRef]
  16. Kim, S.; Kinnas, S.A. Prediction of cavitating performance of a tip loaded propeller and its induced hull pressures. Ocean. Eng. 2021, 229, 108961. [Google Scholar] [CrossRef]
  17. Kim, S.; Kinnas, S.A. A panel method for the hydrdynamic analysis of a cavitating propeller with sheet and developed tip vortex cavitation. Phys. Fluids 2023, 35, 127118. [Google Scholar] [CrossRef]
  18. Tian, Y.; Kinnas, S.A. Modeling of Leading Edge Vortex and its Effects on Propeller Performance. In Proceedings of the 2nd International Symposium on Marine Propulsors (SMP11), Hamburg, Germany, 15–17 June 2011. [Google Scholar]
  19. Kim, S.; Kinnas, S.A. Numerical prediction of underwater noise on a flat hull induced by twin or podded propeller systems. J. Sound Vib. 2022, 539, 117256. [Google Scholar] [CrossRef]
  20. Ebrahimi, A.; Seif, M.S.; Nouri-Borujerdi, A. Hydrodynamic and Acoustic Performance Analysis of Marine Propellers by Combination of Panel Method and FW-H Equations. J. Mar. Sci. Eng. 2019, 24, 81. [Google Scholar] [CrossRef]
  21. Wang, Y.; Gottsche, U.; Abdel-Maksoud, M. Sound Field Properties of Non-Cavitating Marine Propellers. J. Mar. Sci. Eng. 2020, 8, 885. [Google Scholar] [CrossRef]
Figure 1. The toroidal propeller and wake panels subject to the general effective inflow U i n ; for clarity, the wake is shown only for the key-blade.
Jmse 13 02142 g001
Figure 2. The toroidal propeller geometry and its reference line modeled by the hydrodynamic BEM. The reference line was generated based on Equation (10). The subfigures show the following: (a) a close-up view of the blade tip, and (b) the propeller viewed from the side (x-y plane) and (c) from the front (y-z plane). ω indicates the axis and direction of rotation in all figures.
Jmse 13 02142 g002
Figure 3. The toroidal propeller geometry and its blade generatrix modeled by the hydrodynamic BEM. The blade generatrix was generated based on Equation (11). The subfigures show the following: (a) a close-up view of the blade tip, and (b) the propeller viewed from the side (x-y plane) and (c) from the front (y-z plane).
Jmse 13 02142 g003
Figure 4. The toroidal propeller geometry and its blade reference line modeled by the hydrodynamic BEM. The blade reference line was generated based on Equation (12). The subfigures show the following: (a) a close-up view of the blade tip, and (b) the propeller viewed from the side (x-y plane) and (c) from the front (y-z plane).
Jmse 13 02142 g004
Figure 5. Schematic showing the blade section applying the rotation angle ψ before (black solid line and filled circles) and after (gray solid line and filled circles). Prior to rotation, all nodal points are placed on a constant radial position; after applying ψ , the blade section is rotated about the chordline (blue dashed line), resulting in a three-dimensional surface variation.
Jmse 13 02142 g005
Figure 6. Toroidal propeller geometry with rotation angle ψ applied. The blade surface was constructed using discretized sections based on Equation (14). The subfigures show the following: (a) a close-up view of the blade tip, and (b) the propeller viewed from the side (x-y plane) and (c) from the front (y-z plane).
Jmse 13 02142 g006
Figure 7. Toroidal propeller geometry with rotation angle ψ and vertical angle α applied. The blade surface was constructed using discretized sections based on Equation (15). The subfigures show the following: (a) a close-up view of the blade tip, and (b) the propeller viewed from the side (x-y plane) and (c) from the front (y-z plane).
Jmse 13 02142 g007
Figure 8. Geometric variations of toroidal propellers with applied rotation ( ψ ) and vertical ( α ) angles: black (baseline), pink ( ψ only), green ( α only), and blue (both). Annotated values indicate the applied angles.
Jmse 13 02142 g008
Figure 9. A toroidal propeller modeled by (a) BEM and (b) RANS. The discretized blade and hub surfaces used in the BEM analysis are shown in (a), in which the numbered stations indicate the locations where surface pressure comparisons are made, as shown in Section 3.2. Each labeled station corresponds to the location where the black arrow in the figure begins.
Jmse 13 02142 g009
Figure 10. A RANS computational domain shown in a (a) three-dimensional view with applied boundary conditions and in a (b) two-dimensional view near the inner zone and the blades.
Jmse 13 02142 g010
Figure 11. Comparison of the open water performance of the model toroidal propeller between the BEM and RANS predictions.
Jmse 13 02142 g011
Figure 12. The different grid densities used in the BEM to discretize the toroidal blade for the grid independence study: from left to right, 10 × 10 , 20 × 20 , 40 × 40 , 60 × 60 , and 70 × 70 panels in the chordwise × spanwise directions.
Jmse 13 02142 g012
Figure 13. Grid independence study of the proposed method using different panel resolutions on the blade; for example, “60×60” in the legend denotes 60 panels in both the spanwise and chordwise directions.
Jmse 13 02142 g013
Figure 14. The fully aligned trailing wakes at four different advance ratios: (a,b) J s = 0.3 , (c,d) J s = 0.7 , (e,f) J s = 1.1 , and (g,h) J s = 1.5 . The subfigures (b,d,f,h) present the blade and the cross-sectional views of the aligned wake at several radial positions (distinguished by color); these highlight the interactions between the rear blade and the shed wake in the context of panel method.
Jmse 13 02142 g014
Figure 15. Comparison of the vorticity contours in the wakes predicted by RANS and the trailing wake panels predicted by BEM (indicated by green solid lines) at advance ratios of (a) 0.3, (b) 0.7, (c) 1.1, and (d) 1.5. All results are shown on the vertical plane ( z / R = 0.0 ) intersecting with the axis of the toroidal propeller.
Jmse 13 02142 g015
Figure 16. Comparison of the circulation distributions at the indicated advance ratios for (a) the model toroidal propeller, (b) a tip-loaded propeller, and (c) a rounded-tip open propeller. The corresponding geometries modeled by the BEM are shown in (d,e), respectively. Subfigures (b,d) were adapted from Kim and Kinnas (2021) [16], while (c,e) were adapted from Kim and Kinnas (2023) [17] for comparison.
Jmse 13 02142 g016
Figure 17. Comparison of the surface pressure distributions ( C p ) on the blade between the BEM and RANS results in (a) 3D with the fully aligned BEM wake and the iso-surface of vorticity magnitude of 100 [s−1] in perspective view and in (b) 2D plots at several radial stations, where the BEM results are blue scatters and the RANS results are red solid lines. J s = 0.3 .
Jmse 13 02142 g017
Figure 18. Comparison of the surface pressure distributions ( C p ) on the blade between the BEM and RANS results in (a) 3D with the fully aligned BEM wake and the iso-surface of vorticity magnitude of 100 [s−1] in perspective view and in (b) 2D plots at several radial stations, where the BEM results are blue scatters and the RANS results are red solid lines. J s = 0.7 .
Jmse 13 02142 g018
Figure 19. Comparison of the surface pressure distributions ( C p ) on the blade between the BEM and RANS results in (a) 3D with the fully aligned BEM wake and the iso-surface of vorticity magnitude of 100 [s−1] in perspective view and in (b) 2D plots at several radial stations, where the BEM results are blue scatters and the RANS results are red solid lines. J s = 1.1 .
Jmse 13 02142 g019
Figure 20. Comparison of the surface pressure distributions ( C p ) on the blade between the BEM and RANS results in (a) 3D with the fully aligned BEM wake and the iso-surface of vorticity magnitude of 10 [s−1] in perspective view and in (b) 2D plots at several radial stations, where the BEM results are blue scatters and the RANS results are red solid lines. J s = 1.5 .
Jmse 13 02142 g020
Figure 21. Comparison of the BEM trailing wake and the RANS-simulated shed vortices on the x- r θ plane at several radial stations. The BEM wakes are shown as blue solid lines, while the RANS vortices are represented by contour plots, with black solid lines indicating the specified iso-value of the vorticity magnitude. J s = 0.3 .
Jmse 13 02142 g021
Figure 22. Comparison of the BEM trailing wake and the RANS-simulated shed vortices on the x- r θ plane at several radial stations. The BEM wakes are shown as blue solid lines, while the RANS vortices are represented by contour plots with black solid lines indicating the specified iso-value of the vorticity magnitude. J s = 0.7 .
Jmse 13 02142 g022
Figure 23. Comparison of the BEM trailing wake and the RANS-simulated shed vortices on the x- r θ plane at several radial stations. The BEM wakes are shown as blue solid lines, while the RANS vortices are represented by contour plots, with black solid lines indicating the specified iso-value of the vorticity magnitude. J s = 1.1 .
Jmse 13 02142 g023aJmse 13 02142 g023b
Figure 24. Comparison of the BEM trailing wake and the RANS-simulated shed vortices on the x- r θ plane at several radial stations. The BEM wakes are shown as blue solid lines, while the RANS vortices are represented by contour plots, with black solid lines indicating the specified iso-value of the vorticity magnitude. J s = 1.5 .
Jmse 13 02142 g024aJmse 13 02142 g024b
Figure 25. Comparison of blades with different pitch angles: (a) front blade, (b) rear blade, and (c) corresponding circulation distributions at J s = 0.9 . The arrows indicate the radial locations of the stations, and the surface pressure comparisons are presented in the following figures.
Jmse 13 02142 g025
Figure 26. Left: 3D contour plots of the surface pressures ( C p ) on the suction side with a fully aligned wake in perspective view. Right: the corresponding pressure distribution on the pressure side at J s = 0.9 . Pitch adjustments are (a) 8 , (b) 2 , and (c) + 4 .
Jmse 13 02142 g026
Figure 27. Comparison of the pressure distributions predicted by BEM for the several pitch adjustments at the stations that are denoted in Figure 25c.
Jmse 13 02142 g027
Figure 28. Comparison of the open water performance of the model toroidal propeller between the BEM and RANS predictions reported by Kim et al. (2025) [6] for various pitch adjustments at (a) J s = 0.3 and (b) J s = 0.7 .
Jmse 13 02142 g028
Figure 29. Left: 3D contour plots of the surface pressures ( C p ) on the suction side with a fully aligned wake in perspective view. Right: the corresponding pressure distribution on the pressure side at J s = 1.1 . The axial distance between the front and rear blade roots L / D was varied as (a) 0.3, (b) 0.25, (c) 0.2, (d) 0.15, and (e) 0.1.
Jmse 13 02142 g029
Figure 30. Comparison of the (a) circulation distributions for varying axial distances and the (b) corresponding open water performance predictions from BEM and RANS [6]. J s = 1.1 .
Jmse 13 02142 g030
Figure 31. Left: 3D contour plots of the surface pressures ( C p ) on the suction side with a fully aligned wake in perspective view. Right: the corresponding pressure distribution on the pressure side at J s = 0.7 . The lateral angle ψ was reduced to (b) 75% and (c) 50% of the baseline case, which is shown in (a).
Jmse 13 02142 g031
Figure 32. Comparison of the (a) circulation distributions for varying lateral angles and the (b) corresponding open water performance predictions from BEM and RANS [6]. J s = 0.7 .
Jmse 13 02142 g032
Figure 33. Comparison of the pressure distributions predicted by BEM for several lateral angles at the stations that are denoted in Figure 32a.
Jmse 13 02142 g033
Table 1. The main parameters of the toroidal propeller model.
ParameterValue
Total axial span L [mm]160
Diameter D [mm]800
Hub-Radius ratio r h / R [ - ] 0.2
Number of blade Z [ - ]3
Section profileNACA 66 (mod)
Disclaimer/Publisher’s Note: The statements, opinions and data contained in all publications are solely those of the individual author(s) and contributor(s) and not of MDPI and/or the editor(s). MDPI and/or the editor(s) disclaim responsibility for any injury to people or property resulting from any ideas, methods, instructions or products referred to in the content.