Article

Research on Conflict Detection Methods in Detailed Design of Large Cruise Ships

1
College of Shipbuilding Engineering, Harbin Engineering University, Harbin 150001, China
2
College of Mechanical and Electrical Engineering, Harbin Engineering University, Harbin 150001, China
3
Marine Drilling Technology Department, The Institute of Exploration Techniques, CAGS, Langfang 065000, China
*
Authors to whom correspondence should be addressed.
J. Mar. Sci. Eng. 2025, 13(11), 2138; https://doi.org/10.3390/jmse13112138
Submission received: 10 October 2025 / Revised: 2 November 2025 / Accepted: 11 November 2025 / Published: 12 November 2025
(This article belongs to the Special Issue Safety of Ships and Marine Design Optimization)

Abstract

Aiming to address the frequent design conflicts arising during multi-disciplinary collaboration in the detailed design phase of large cruise ships, coupled with the inadequacy of traditional methods in detecting unknown constraints, this paper proposes a hybrid conflict detection framework integrating interval propagation with intelligent algorithms. First, using the piping design of a cruise ship’s water supply system as a typical scenario, design constraints are categorized into known and unknown sets. For known constraints, the interval propagation algorithm is employed for rapid inference and verification. For unknown constraints that are difficult to express explicitly, an improved particle swarm optimization (IPSO) algorithm is proposed to optimize the parameters of a radial basis function (RBF) neural network, thereby constructing an IPSO-RBF conflict detection model. Case studies demonstrate the interval propagation algorithm’s efficacy in identifying conflicts within water supply pipeline designs. Concurrently, testing against historical design datasets reveals that the IPSO-RBF model outperforms multiple comparative models, including PSO-RBF, AFSA-RBF, etc., in terms of conflict detection accuracy, precision, and recall. This validates the method’s effectiveness and superiority in resolving design conflicts within complex systems for large cruise ships.

1. Introduction

The design of a large cruise ship constitutes a highly complex engineering system, typically progressing through an iterative sequence of three stages: basic design, detailed design, and production design. The detailed design phase, serving as the critical link between conceptual innovation and physical construction, produces outcomes that not only refine and expand upon the basic design but also form the direct basis for subsequent production design and actual shipbuilding. During this phase, numerous specialized teams—including hull structure, machinery, electrical, piping, and outfitting—must collaborate to accomplish the detailed design tasks ranging from system layout to component selection.
While this collaborative design mode enhances specialized expertise, it simultaneously introduces a multitude of intertwined design constraints, forming a complex and dynamically evolving constraint network. This network encompasses mandatory design standards, owner and classification society requirements, as well as inherent dependencies among various design variables. As illustrated in Figure 1, these constraints can be categorized according to object hierarchy (e.g., main segment, sub-segment, unit). Design variables can be further classified into independent variables and coupled variables: changes in the former (shown as red lines in Figure 1) primarily affect a single design object; whereas the latter (shown as yellow lines in Figure 1) are associated with multiple objects, and their modification can easily trigger chain reactions, representing a primary source of design conflicts. As the design process advances and constraints are continuously refined, insufficient or delayed information exchange between disciplines can make it difficult for designers to comprehensively manage constraint evolution, inevitably leading to the occurrence of conflicts.
Given the pivotal role of the detailed design phase (accounting for approximately 30–40% of the total design effort), conflicts arising during this stage, if not detected and resolved promptly, can significantly increase modification costs in subsequent phases and potentially delay the project schedule. Therefore, establishing an efficient conflict detection method to assist designers in early identification and resolution of conflicts is of paramount theoretical and practical importance for ensuring cruise ship design quality, controlling project risk, and accumulating design knowledge.
Although conflict detection has been extensively studied in fields such as mechanical engineering and architecture, its application to the detailed design of large cruise ships faces significant challenges. Firstly, existing methods predominantly focus on known, explicit constraints, lacking effective means for modeling and detecting the numerous unstated, implicit constraints prevalent in the design process. Secondly, published research specifically addressing conflict detection in the detailed design of complex internal systems (e.g., water supply, ventilation) within large cruise ships remains scarce.
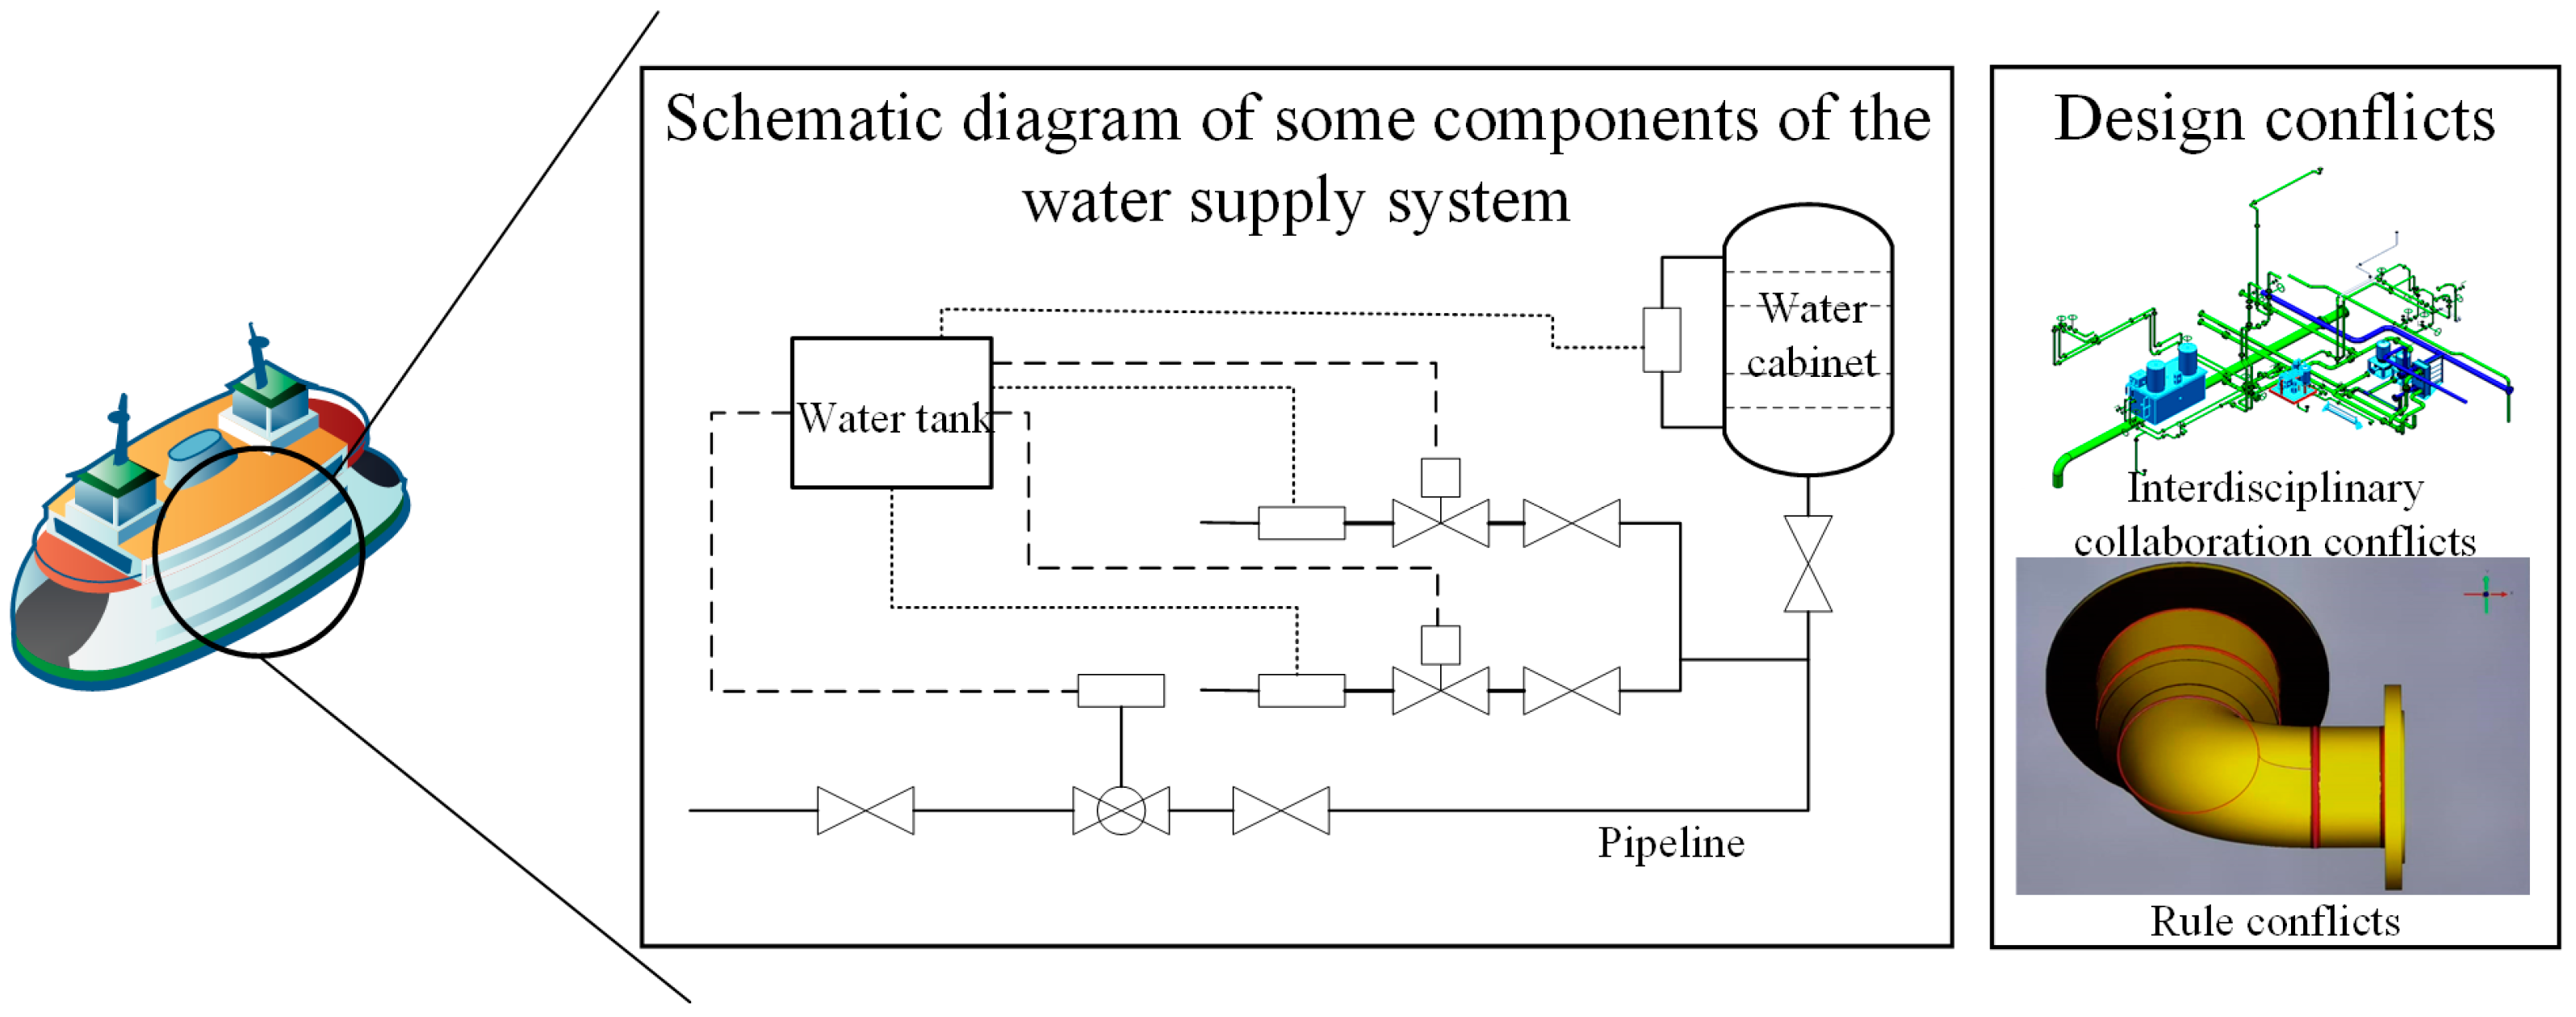
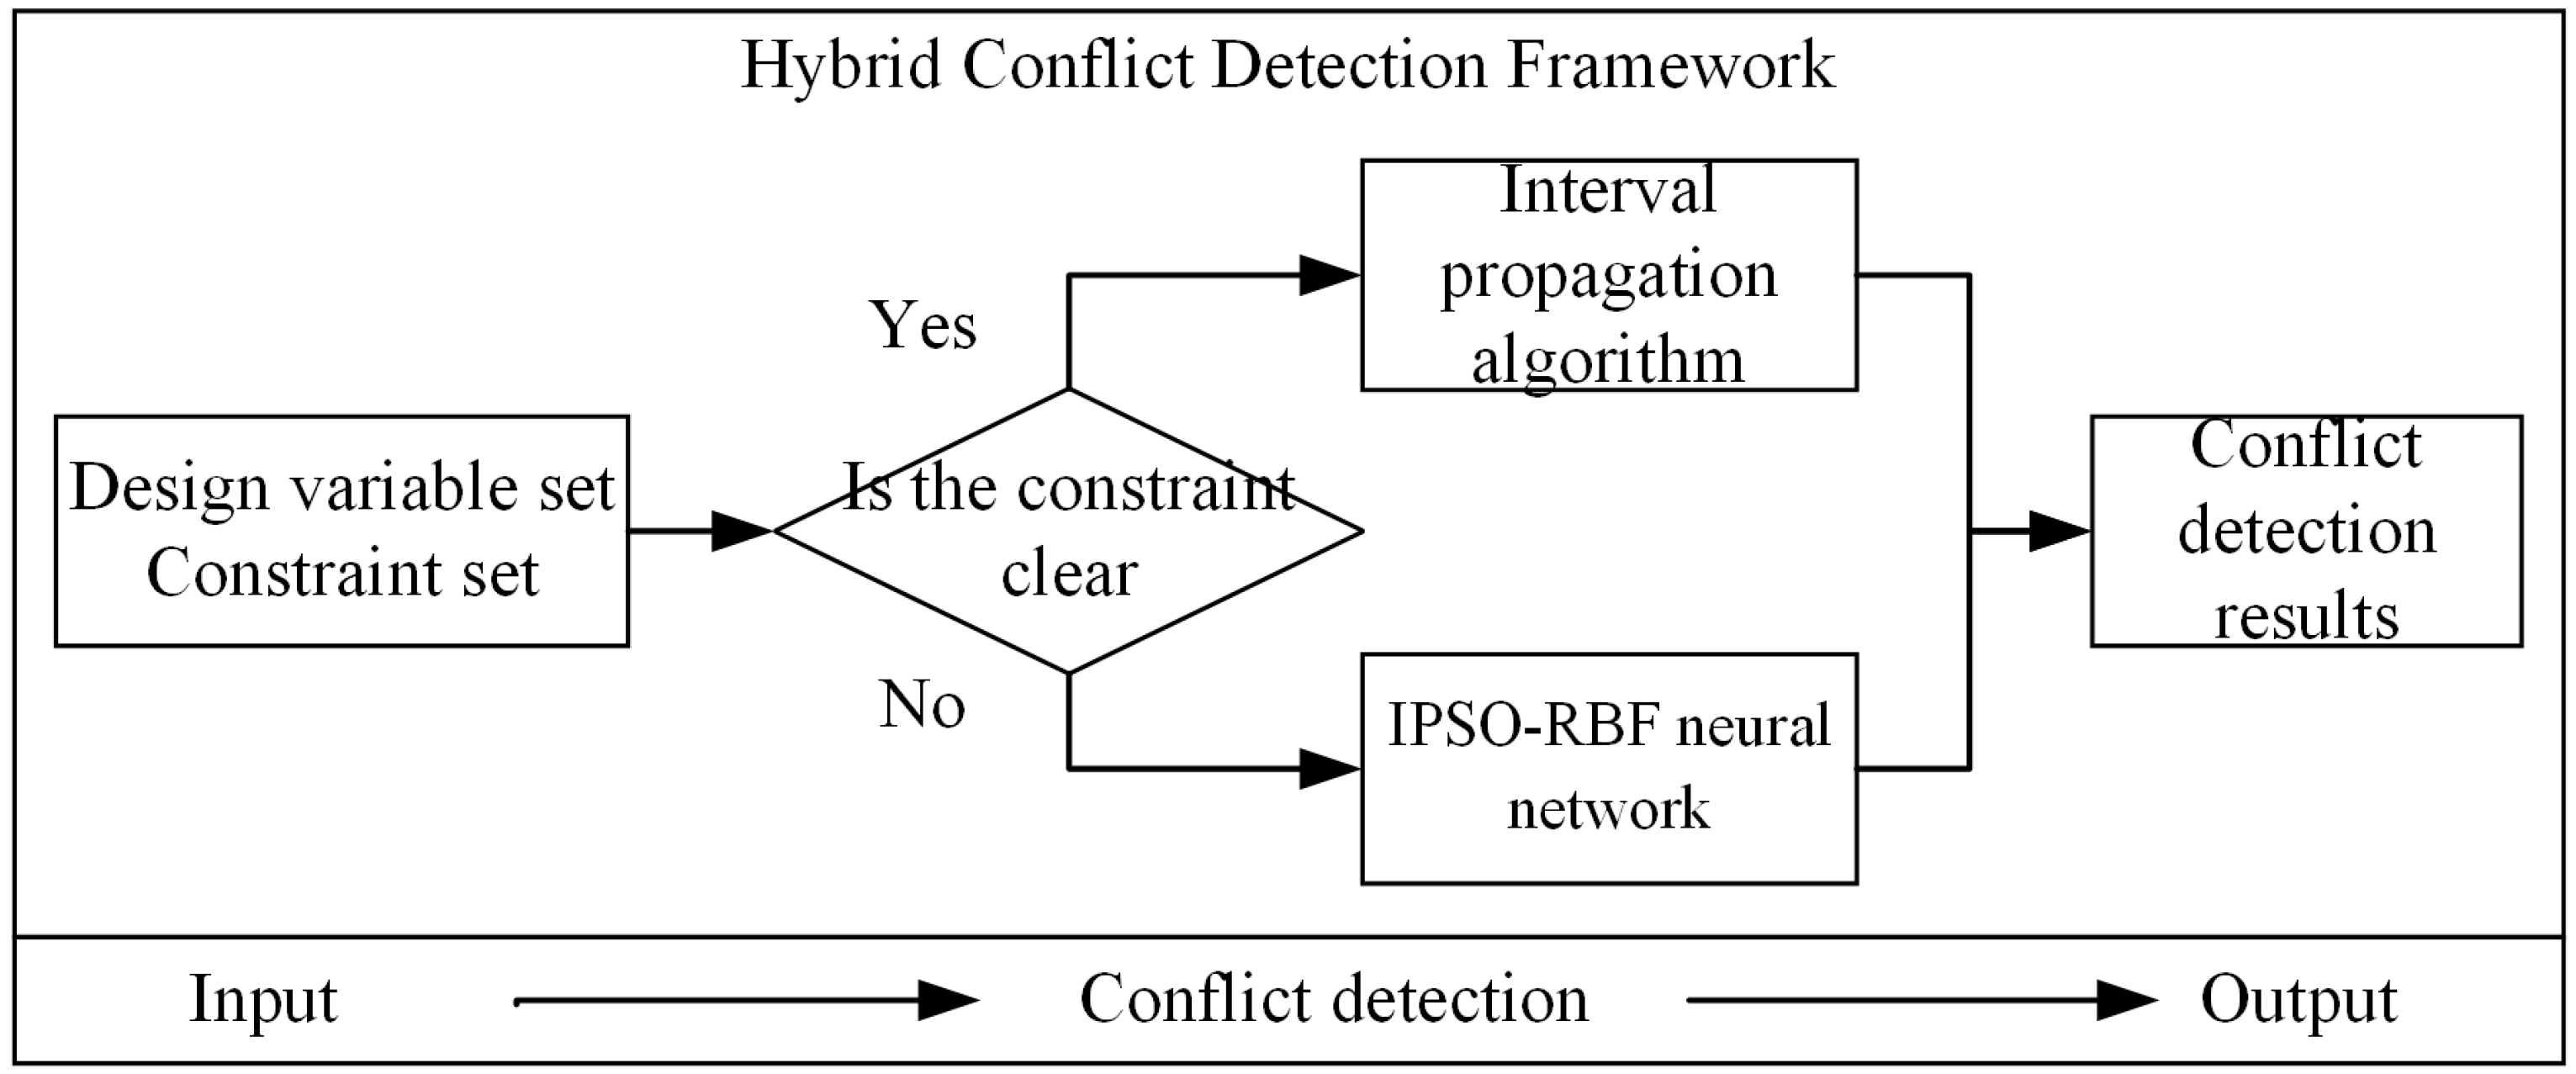
To address these challenges, this paper categorizes the core issues in conflict detection for large cruise ship detailed design into two classes: (1) Known Constraint Conflicts: How to achieve rapid, automated identification of conflicts involving explicitly modellable constraints. (2) Unknown Constraint Conflicts: How to achieve high-accuracy intelligent prediction of conflicts arising from implicit constraints that rely on historical experience and are difficult to define precisely. Accordingly, this paper proposes a hybrid conflict detection framework (the overall framework is shown in Figure 2) and uses the piping design of a large cruise ship’s water supply system as a continuous validation case study. The complexity and multi-disciplinary interaction characteristics of this system (whose schematic and typical conflicts are illustrated in Figure 3) make it an ideal scenario for validating the conflict detection methodology. For instance, in pipeline penetration design, the structural discipline might restrict the opening diameter (e.g., d < 0.05 m) to ensure strength, while the piping discipline might require a larger diameter (e.g., d > 0.05 m) to meet flow rate requirements. Such conflicts, governed by explicitly definable rules, fall under known constraints. Conversely, certain layout schemes might comply with all codified regulations yet historically tend to cause water pressure imbalances or maintenance difficulties; these experience-based conflicts belong to the category of unknown constraints.
The main contributions of this paper are as follows:
(1) Framework Innovation: A divide-and-conquer hybrid detection framework is proposed, decomposing the Constraint Satisfaction Problem (CSP) into known and unknown constraint sets, addressed by an interval propagation algorithm and an intelligent prediction model, respectively. This provides a systematic solution for handling both certain and uncertain conflicts in complex design systems.
(2) Algorithm Innovation: An improved Particle Swarm Optimized Radial Basis Function (IPSO-RBF) neural network model is proposed. The novelty lies in the IPSO algorithm’s incorporation of dynamic inertia weights and a periodic particle reset mechanism, effectively overcoming the tendencies of standard PSO to premature convergence and RBF parameters to settle into local optima, thereby achieving superior predictive performance and robustness.
(3) Application Innovation: The aforementioned hybrid framework and algorithm are, for the first time, systematically applied to conflict detection in the detailed design of piping within a large cruise ship’s water supply system, filling a research gap in this specific domain. Experimental results demonstrate that the proposed method outperforms several mainstream models combining intelligent optimization algorithms in terms of detection accuracy and robustness.
The remainder of this paper is structured as follows: Section 2 reviews the related literature. Section 3 details the proposed conflict detection methodology. Section 4 validates the effectiveness and superiority of the method through design instances from the water supply system. Finally, Section 5 concludes the paper.

2. Literature Review

In contemporary shipbuilding and large-scale engineering design, the concepts of Building Information Modeling (BIM) and Product Lifecycle Management (PLM) are deeply integrated into specialized software ecosystems, such as AVEVA Marine, Ship Constructor, and NAPA. These platforms form the core working environment for modern cruise ship design. Their built-in conflict detection modules, which primarily rely on geometric rules and spatial interference analysis (e.g., clash detection), can efficiently identify physical collisions between pipes, cable trays, and structural members. Such methods are highly effective for resolving conflicts involving known, parametrizable geometric constraints and have become part of the standard industry workflow.
However, the conflict management processes within these industrial software suites possess inherent limitations. Firstly, their detection capabilities are highly dependent on comprehensive and precise 3D geometric information, meaning full-scale analysis can typically only be conducted during the middle or later stages of detailed design. Secondly, and more critically, these tools struggle to effectively handle non-geometric constraints and implicit knowledge. For instance, a design might pass all geometric clash checks flawlessly, yet its piping layout could lead to future maintenance difficulties, system pressure imbalances, or violate operational practices based on specific owner experience. These conflicts stem from complex coupling relationships between disciplines and historical experience, which cannot be fully captured by simple geometric rules or pre-defined parameter lists. The lack of robust modeling and detection capabilities for such “unknown” or “implicit” conflicts in existing tools represents a primary source of design iterations and late-stage modifications.
To compensate for the lack of practical tools, the academic community has conducted extensive explorations in the field of conflict detection. Design conflict detection is a critical step in ensuring the quality of complex product design and has long attracted attention from academia and industry. In the field of ship design, existing research mostly focuses on conflict detection methods based on rules, models, and intelligent algorithms, primarily applied to aspects like ship structural design and load checking. For example, Li et al. [1] trained four machine learning models, including a Radial Basis Function (RBF) network, to predict the cyclic ultimate strength of stiffened plates in ship bottom structures under combined loads; Yurdakul et al. [2] used Pareto frontiers to select better main dimension decision schemes among conflicting design criteria; Lee et al. [3] proposed a hydrodynamic design method for an underwater hull cleaning robot by trading off conflicting design requirements. Regarding interdisciplinary collaboration, scholars often conduct conflict resolution research based on multi-agent systems, such as Lee et al. [4,5] who used case-based reasoning conflict resolution strategies to reduce conflicts occurring during interdisciplinary knowledge sharing.
In broader industrial fields, conflict detection methods have also diversified. Guermouche M et al. [6] used fuzzy ARTAPP neural networks to classify fault-free diesel engine data, determining conflicts between samples based on hyper-rectangles; Khorshid E et al. [7] detected infeasibility in mechanical design by analyzing inequality constraints and design variables, significantly reducing the number of constraint checks; Fradi M et al. [8] proposed a method based on category theory to detect conflicts among numerous disciplinary and expert models in the context of mechatronics; Dang et al. [9] used Convolutional Neural Networks (CNN) for aircraft conflict detection in restricted airspace; Zhou et al. [10] also focused on conflict detection for aerial vehicles, designing a method based on mathematical calculations like the Hadamard product of matrices to detect conflicts among large numbers of UAVs in airspace.
At the methodological level, Han et al. [11] proposed a Bayesian network resource conflict model for virtual manufacturing cells to detect the location and quantity of resource conflicts, addressing shortcomings in resource conflict detection; Zhao et al. [12] proposed a three-layer Bayesian network based on Bayesian network theory, using graphs and qualitative methods to detail the relationships between first-layer causes, second-layer faults, and third-layer symptoms; Zhang et al. [13] proposed an extended rule model SOECAP to detect design conflicts using fuzzy set theory, addressing the low efficiency of traditional ECA rule reasoning for conflict detection; Bliudze S et al. [14] proposed an SMT-based conflict detection algorithm and discussed dynamically resolving conflicts based on resource usage priorities; Sun et al. [15] proposed attribute and rule hierarchy evaluation criteria to detect design conflicts, addressing the lack of strategy quality assessment and constraint consideration in conventional detection methods; Leung [16] used Radial Basis Functions in Deep Neural Networks (DNN) for feature selection, with experiments verifying an accuracy of up to 99.37% for network attack detection using this method.
Among various conflict detection methods, neural networks [17] have become one of the mainstream prediction tools due to their powerful nonlinear fitting capability. The RBF neural network (Radial Basis Function Neural Network, RBFNN) is widely used in regression prediction [18,19], pattern recognition [20,21], and equation solving [22,23,24,25] due to its local approximation capability and fast learning characteristics. Traditional parameter optimization (e.g., centers, widths, weights) of RBF networks often uses gradient descent methods but is prone to falling into local optima. In recent years, with the development of artificial intelligence technology, various intelligent algorithms have been used to optimize the structure of RBF neural network models. Muneeswaran et al. [26] used the Tree Seed Algorithm to optimize the clustering centers, widths, and weight values of RBF neural networks; Lin et al. designed a novel Modulated Window RBFNN (MW-RBFNN) with tunable activation functions, using Raised Cosine Radial Basis Functions (RC-RBF) as basic functions and adjusting their shape using exponential functions, then using the combined tunable shape basis functions as the NN’s activation function. Zhao et al. [27] used the q-Gaussian function as the radial basis function for RBF neural networks and used the Particle Swarm Optimization algorithm to select network parameters; Zheng et al. [28] designed a nearest-neighbor-based clustering algorithm for training RBF neural networks to reduce the number of parameters optimized during model structure training.
Besides these, metaheuristic algorithms such as Genetic Algorithm (GA) [29], Simulated Annealing (SA) [30], Ant Colony Optimization (ACO) [31], Particle Swarm Optimization (PSO) [32], and Differential Evolution (DE) [33] have also been used to optimize various neural network model structures, including RBF and BP neural networks. These swarm intelligence optimization algorithms simulate optimization mechanisms in natural phenomena to optimize neural network model structures and promote model fitting quality. These studies fully demonstrate the effectiveness of combining intelligent optimization algorithms with neural networks, providing a feasible technical path for handling unknown and uncertain design constraints.
Although the aforementioned research has made significant progress, obvious limitations remain when applying it to the ultra-complex system of large cruise ships: the detailed design phase of cruise ships is a multi-disciplinary collaborative design process, where the factors considered far exceed those of ordinary products. Existing research mostly focuses on detecting conflicts involving known, explicit constraints, lacking effective modeling and detection means for the large number of implicit, unspecified, or uncertain constraint sets present during the design process. Secondly, at the algorithmic level, traditional optimization algorithms like PSO are prone to premature convergence and getting stuck in local optima, SA algorithms have slow convergence speeds, and ACO algorithms have complex parameter settings and low search efficiency. These limitations result in difficulty meeting the practical engineering requirements for detection accuracy and stability when handling high-dimensional, nonlinear cruise ship design constraint problems.
Simultaneously, most existing conflict detection research focuses on mechanical, architectural, or aerospace fields. Public literature on conflict detection specifically for large cruise ships, especially their internal complex systems (e.g., water supply, ventilation, electrical systems) during detailed design, is relatively scarce. Existing cruise ship design conflict detection methods rely on manual rules or preset models, exhibiting poor adaptability to unknown constraints. Addressing the above problems, this paper transforms conflict detection into a Constraint Satisfaction Problem (CSP) through a design constraint model, thereby proposing a hybrid framework for conflict detection in the detailed design of large cruise ships: using interval propagation algorithms for rapid verification of known constraints; and for unknown constraints, utilizing the global search capability of IPSO to optimize RBF parameters, combined with the nonlinear mapping capability of radial basis functions, to achieve intelligent prediction of conflicts.

3. Conflict Detection Method for Large Cruise Ship Detailed Design

In the detailed design phase of a cruise ship, all design variables are interconnected through various design constraint relationships, forming the overall design constraint network for this phase. Therefore, the detailed design phase of a cruise ship is essentially the process of finding reasonable assignments for design variables. This process can be transformed into solving a Constraint Satisfaction Problem (CSP).
A CSP can be described by a set of design variables X, a domain set I, and a set of related design constraints C. A CSP can consist of n variables and m constraints, as shown in Equation (1).
C S P : = X , I , C
where X = { x 1 , x 2 , , x n } represents the set of design variables; I = { I 1 , I 2 , , I n } represents the domain set, which is the value range of the design variables, I i is the domain of x i ; C = { C 1 , C 2 , , C m } represents the set of design constraint conditions. Design constraints can be divided into two parts: the set of variables constrained by the constraint and the set defining the constraint relation, i.e., C i = { V ( C i ) , R ( C i ) } . V ( C i ) = { x i 1 , x i 2 , , x i p } represents the set of variables constrained by design constraint C i , and R ( C i ) = { x i 1 , x i 2 , , x i p } I i 1 × I i 2 × × I i p represents the constraint relation on the set of design variables V C i , where I i 1 × I i 2 × × I i p is the Cartesian product.
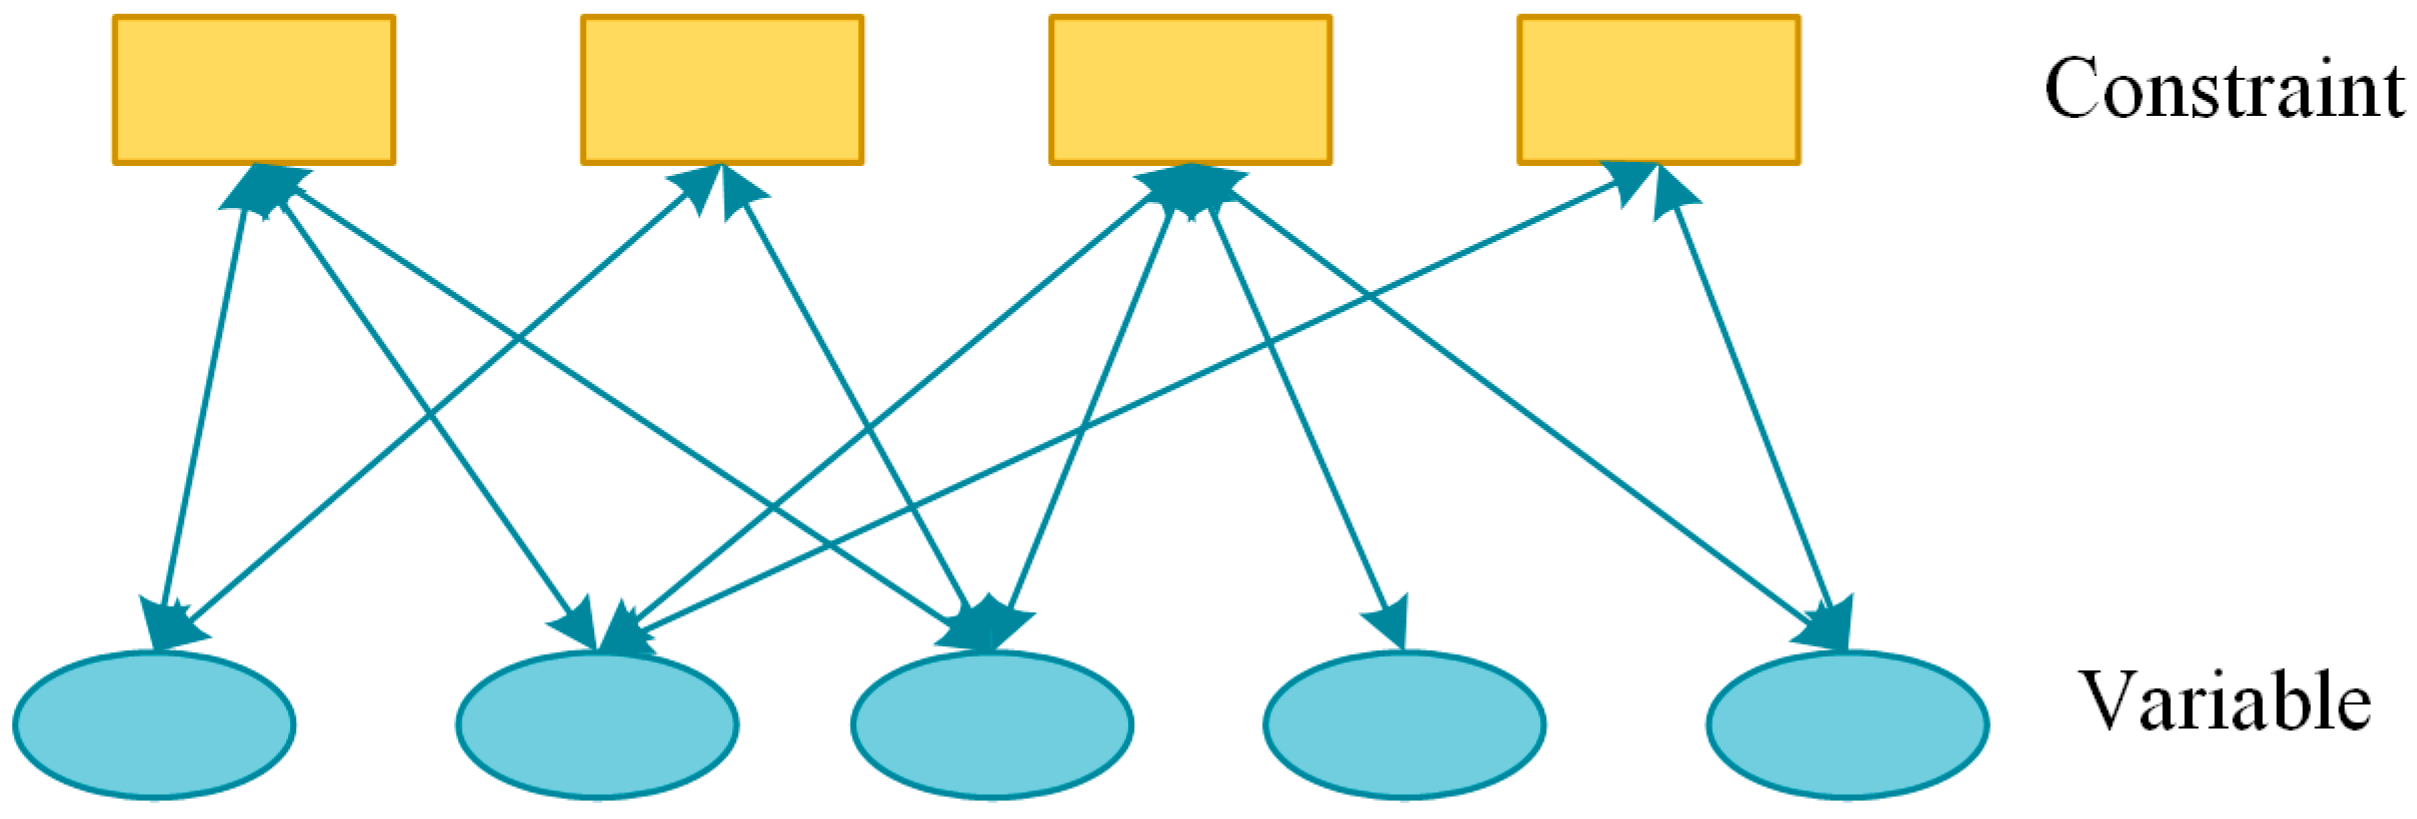
The design constraints form a constraint network, which can determine whether the design variables satisfy the constraint conditions. The constraint network for design conflict detection is shown in Figure 4.
A solution to the CSP is expressed as
K ( Z ) = { ( x 1 = x 1 , x 2 = x 2 , , x n = x n ) C i , Π V ( C i ) R ( Z ) R ( C i ) }
where Π V ( C i ) R ( Z ) represents the projection of design variable V ( C i ) onto R ( Z ) ; R ( Z ) represents all relations in the constraint network.
Solving a CSP involves searching within the value ranges of all design variables to find at least one assignment that satisfies all constraints. If K ( Z ) has a solution, no design conflict exists; if no solution exists, a design conflict is present.
During the detailed design phase of a cruise ship, as the design deepens and iteratively optimizes, the set of design constraint relationships can be divided into a known constraint set C k and an unknown constraint set C u . The known constraint set C k refers to the explicitly defined constraints between different disciplines. The unknown constraint set C u refers to constraints that are not yet explicit or may emerge during the future design process. As information exchange between disciplines strengthens, the unknown constraint set will gradually become explicit and transform into the known constraint set.
Therefore, research on conflict detection methods for large cruise ship detailed design is conducted from two perspectives: conflict detection methods under known constraints and conflict detection methods under unknown constraints.

3.1. Known Constraint Conflict Detection Method Based on Interval Propagation Algorithm

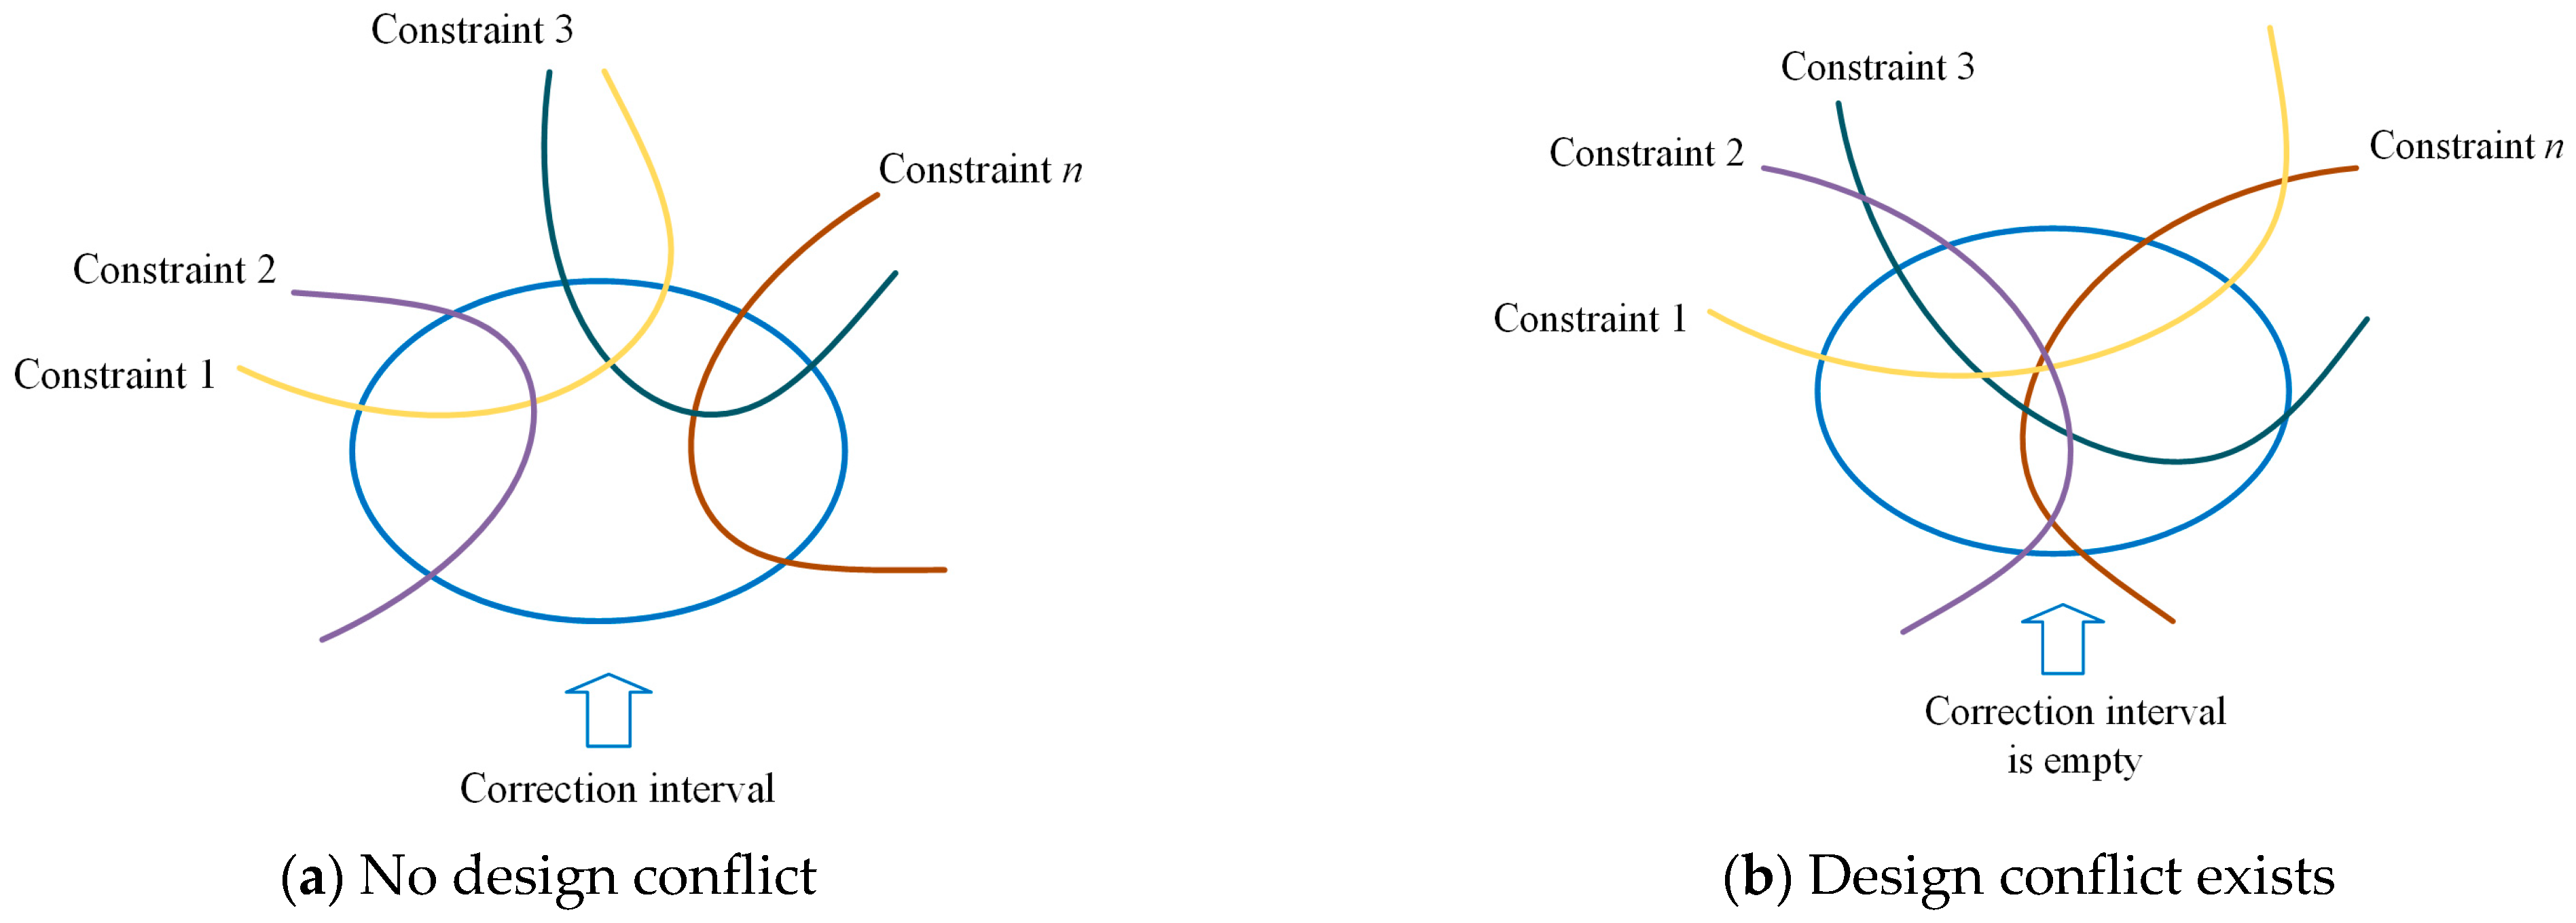
In the cruise ship detailed design constraint network, selecting an appropriate conflict detection method for the known constraint set C k is crucial. The primary method for conflict detection in the known constraint set C k is the interval propagation algorithm. The interval propagation algorithm is a process of gradually refining the value intervals of design variables, as shown in Figure 5.
When solving for cruise ship detailed design variables, the interval propagation algorithm can be regarded as an extension of real number arithmetic. In a CSP, ensuring all design constraints are satisfied, the interval propagation algorithm can adjust the value ranges of design variables.
For ease of computation, the upper and lower limits of the design variable value intervals are used to represent calculation results during the operation of the interval propagation algorithm. For any two design variables A = a 1 , a 2 , B = [ b 1 , b 2 ] , the basic arithmetic rules are shown in Equation (3).
A + B = [ a 1 , a 2 ] + [ b 1 , b 2 ] = [ a 1 + b 1 , a 2 + b 2 ] A B = [ a 1 , a 2 ] [ b 1 , b 2 ] = [ a 1 b 2 , a 2 b 1 ] A B = [ a 1 , a 2 ] [ b 1 , b 2 ] = [ min ( a 1 b 1 , a 1 b 2 , a 2 b 1 , a 2 b 2 ) , max ( a 1 b 1 , a 1 b 2 , a 2 b 1 , a 2 b 2 ) ] A / B = [ a 1 , a 2 ] / [ b 1 , b 2 ] = [ a 1 , a 2 ] [ min ( 1 / b 1 , 1 / b 2 ) , max ( 1 / b 1 , 1 / b 2 ) ] , 0 [ b 1 , b 2 ] A B = [ a 1 , a 2 ] [ b 1 , b 2 ] = [ max ( a 1 , b 1 ) , min ( a 2 , b 2 ) ] max ( a 1 , b 1 ) < min ( a 2 , b 2 ) max ( a 1 , b 1 ) > min ( a 2 , b 2 )
The interval propagation algorithm analyzes the changes in the value ranges of design variables under the influence of design constraints to determine the feasible interval for a design variable x i ( 1 i n ) under the action of the constraint set C . Let the domain of design variable x i j be I i j . The new domain of x i j under the action of constraint R ( C i ) = R ( x i 1 , x i 2 , , x i j ) is I i j = { f 1 ( [ R ( C i ) ] ) | x i j } I i j .
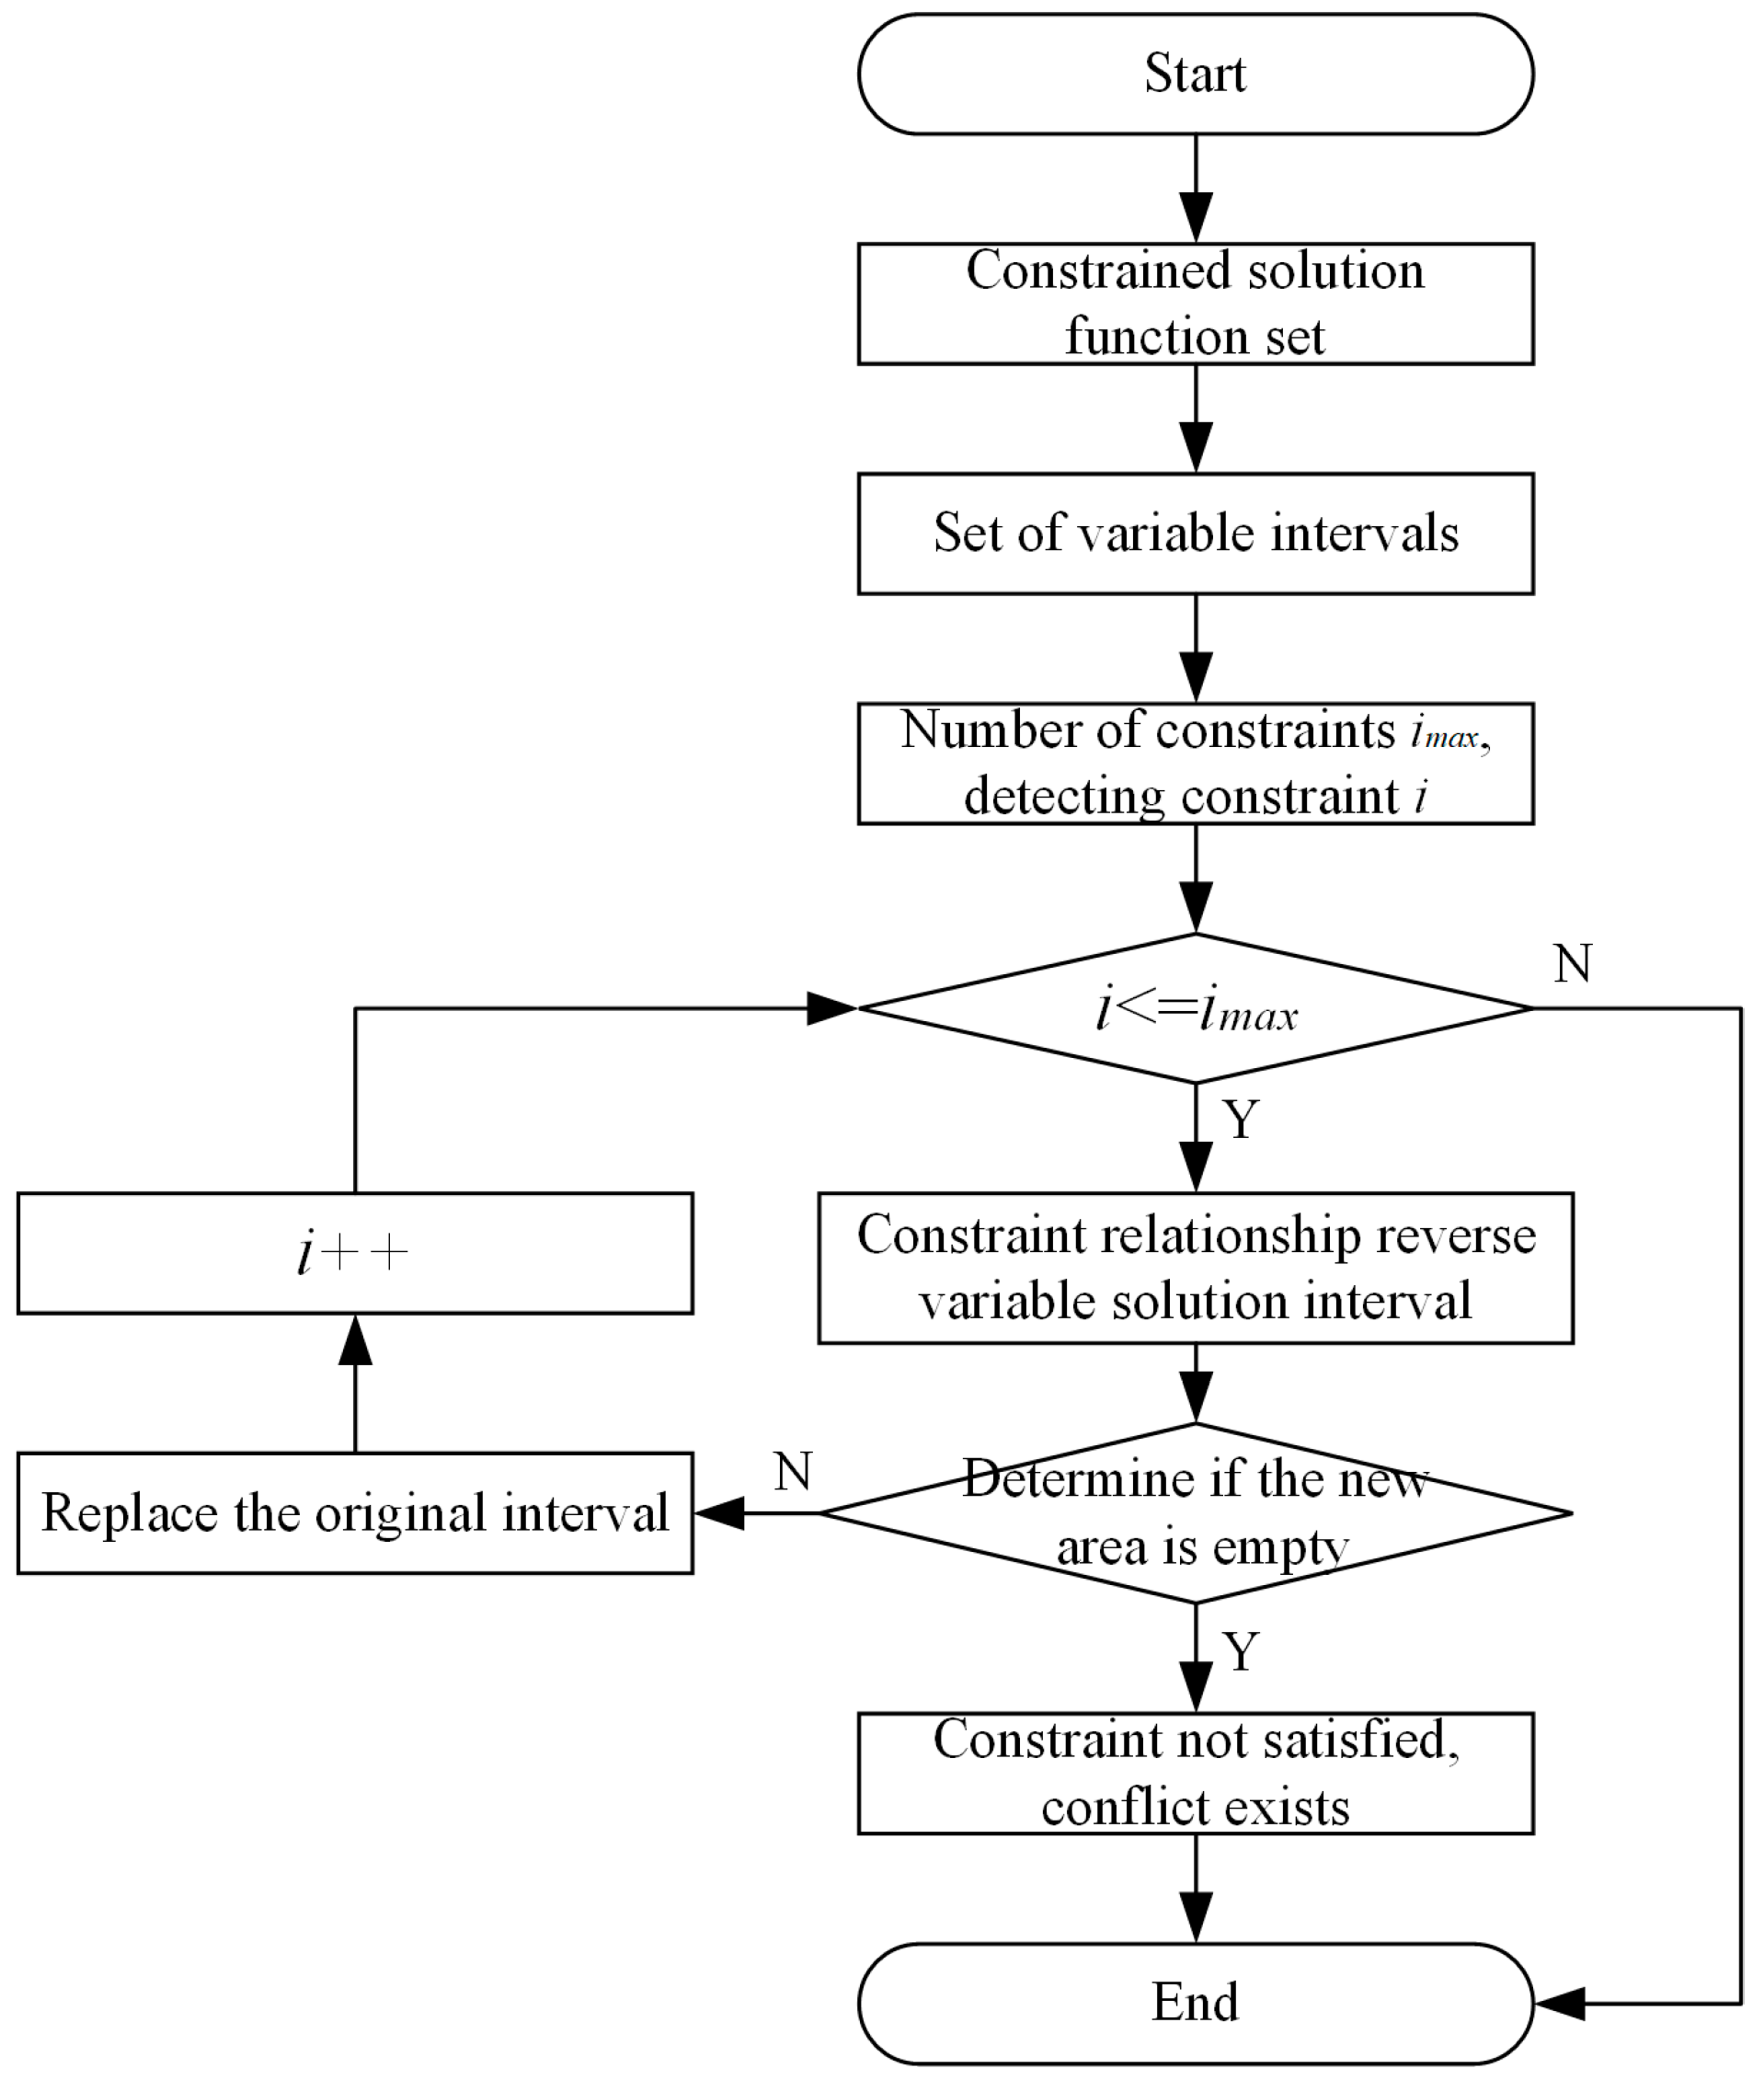
f 1 ( [ R ( C i ) ] ) | x i j represents inversely determining the feasible interval for x i j via constraint R ( C i ) . The final feasible solution intervals for each design variable are determined through the interval propagation algorithm. If the new feasible solution space for a design variable I i , the domain of design variable x i is continuously updated until a stable feasible solution interval is found or the function set becomes empty. If during the update process the feasible solution space of any design variable becomes empty, i.e., i = 1 , 2 , , n ,   I i = , it indicates that no design variable assignment satisfies all design constraints, meaning a design conflict exists during the design process. Figure 6 shows the process of interval propagation algorithm. The steps of the interval propagation algorithm are as follows:
Step 1: Initialize the function set F = { F i j i = 1 , 2 , , m ; j = 1 , 2 , , p } , and the design variable intervals I = { I 1 , I 2 , , I n } .
Step 2: For each F i j F , use the interval propagation algorithm to solve the feasible interval x i ( i = 1 , 2 , , n ) for design variable I i .
Step 3: Judge I i = I i I i . If I i = , a design conflict exists; otherwise, set I i = I i .
Step 4: Judge whether the function set F is empty. If F , execute Step 2; if F = , the interval propagation algorithm ends.
The interval propagation algorithm improves solving efficiency by continuously reducing the problem scale, does not rely on specific design experience, and gradually approaches the real design solution. Therefore, this paper uses the interval propagation algorithm to detect design conflicts in the known design constraint set C k during the cruise ship detailed design phase.

3.2. Unknown Constraint Conflict Detection Method Based on Improved PSO-RBF

At the beginning of the cruise ship detailed design phase, it is difficult to determine all design constraints, and the interval propagation algorithm cannot detect design conflicts under uncertain constraint conditions. Since the relationship between unknown constraints C u and conflicts exhibits highly complex nonlinearity, and the degree of influence between different design constraints varies, other methods are needed to detect design conflicts.
Owing to the highly complex nonlinear relationship between unknown constraints and conflicts, a powerful nonlinear mapping model is required. The Radial Basis Function (RBF) neural network was selected as the base model in this study due to its simple structure, fast convergence speed, and property of possessing a unique best approximation. However, the performance of traditional RBF neural networks is critically dependent on the selection of center values and widths, and they are prone to becoming trapped in local optima.
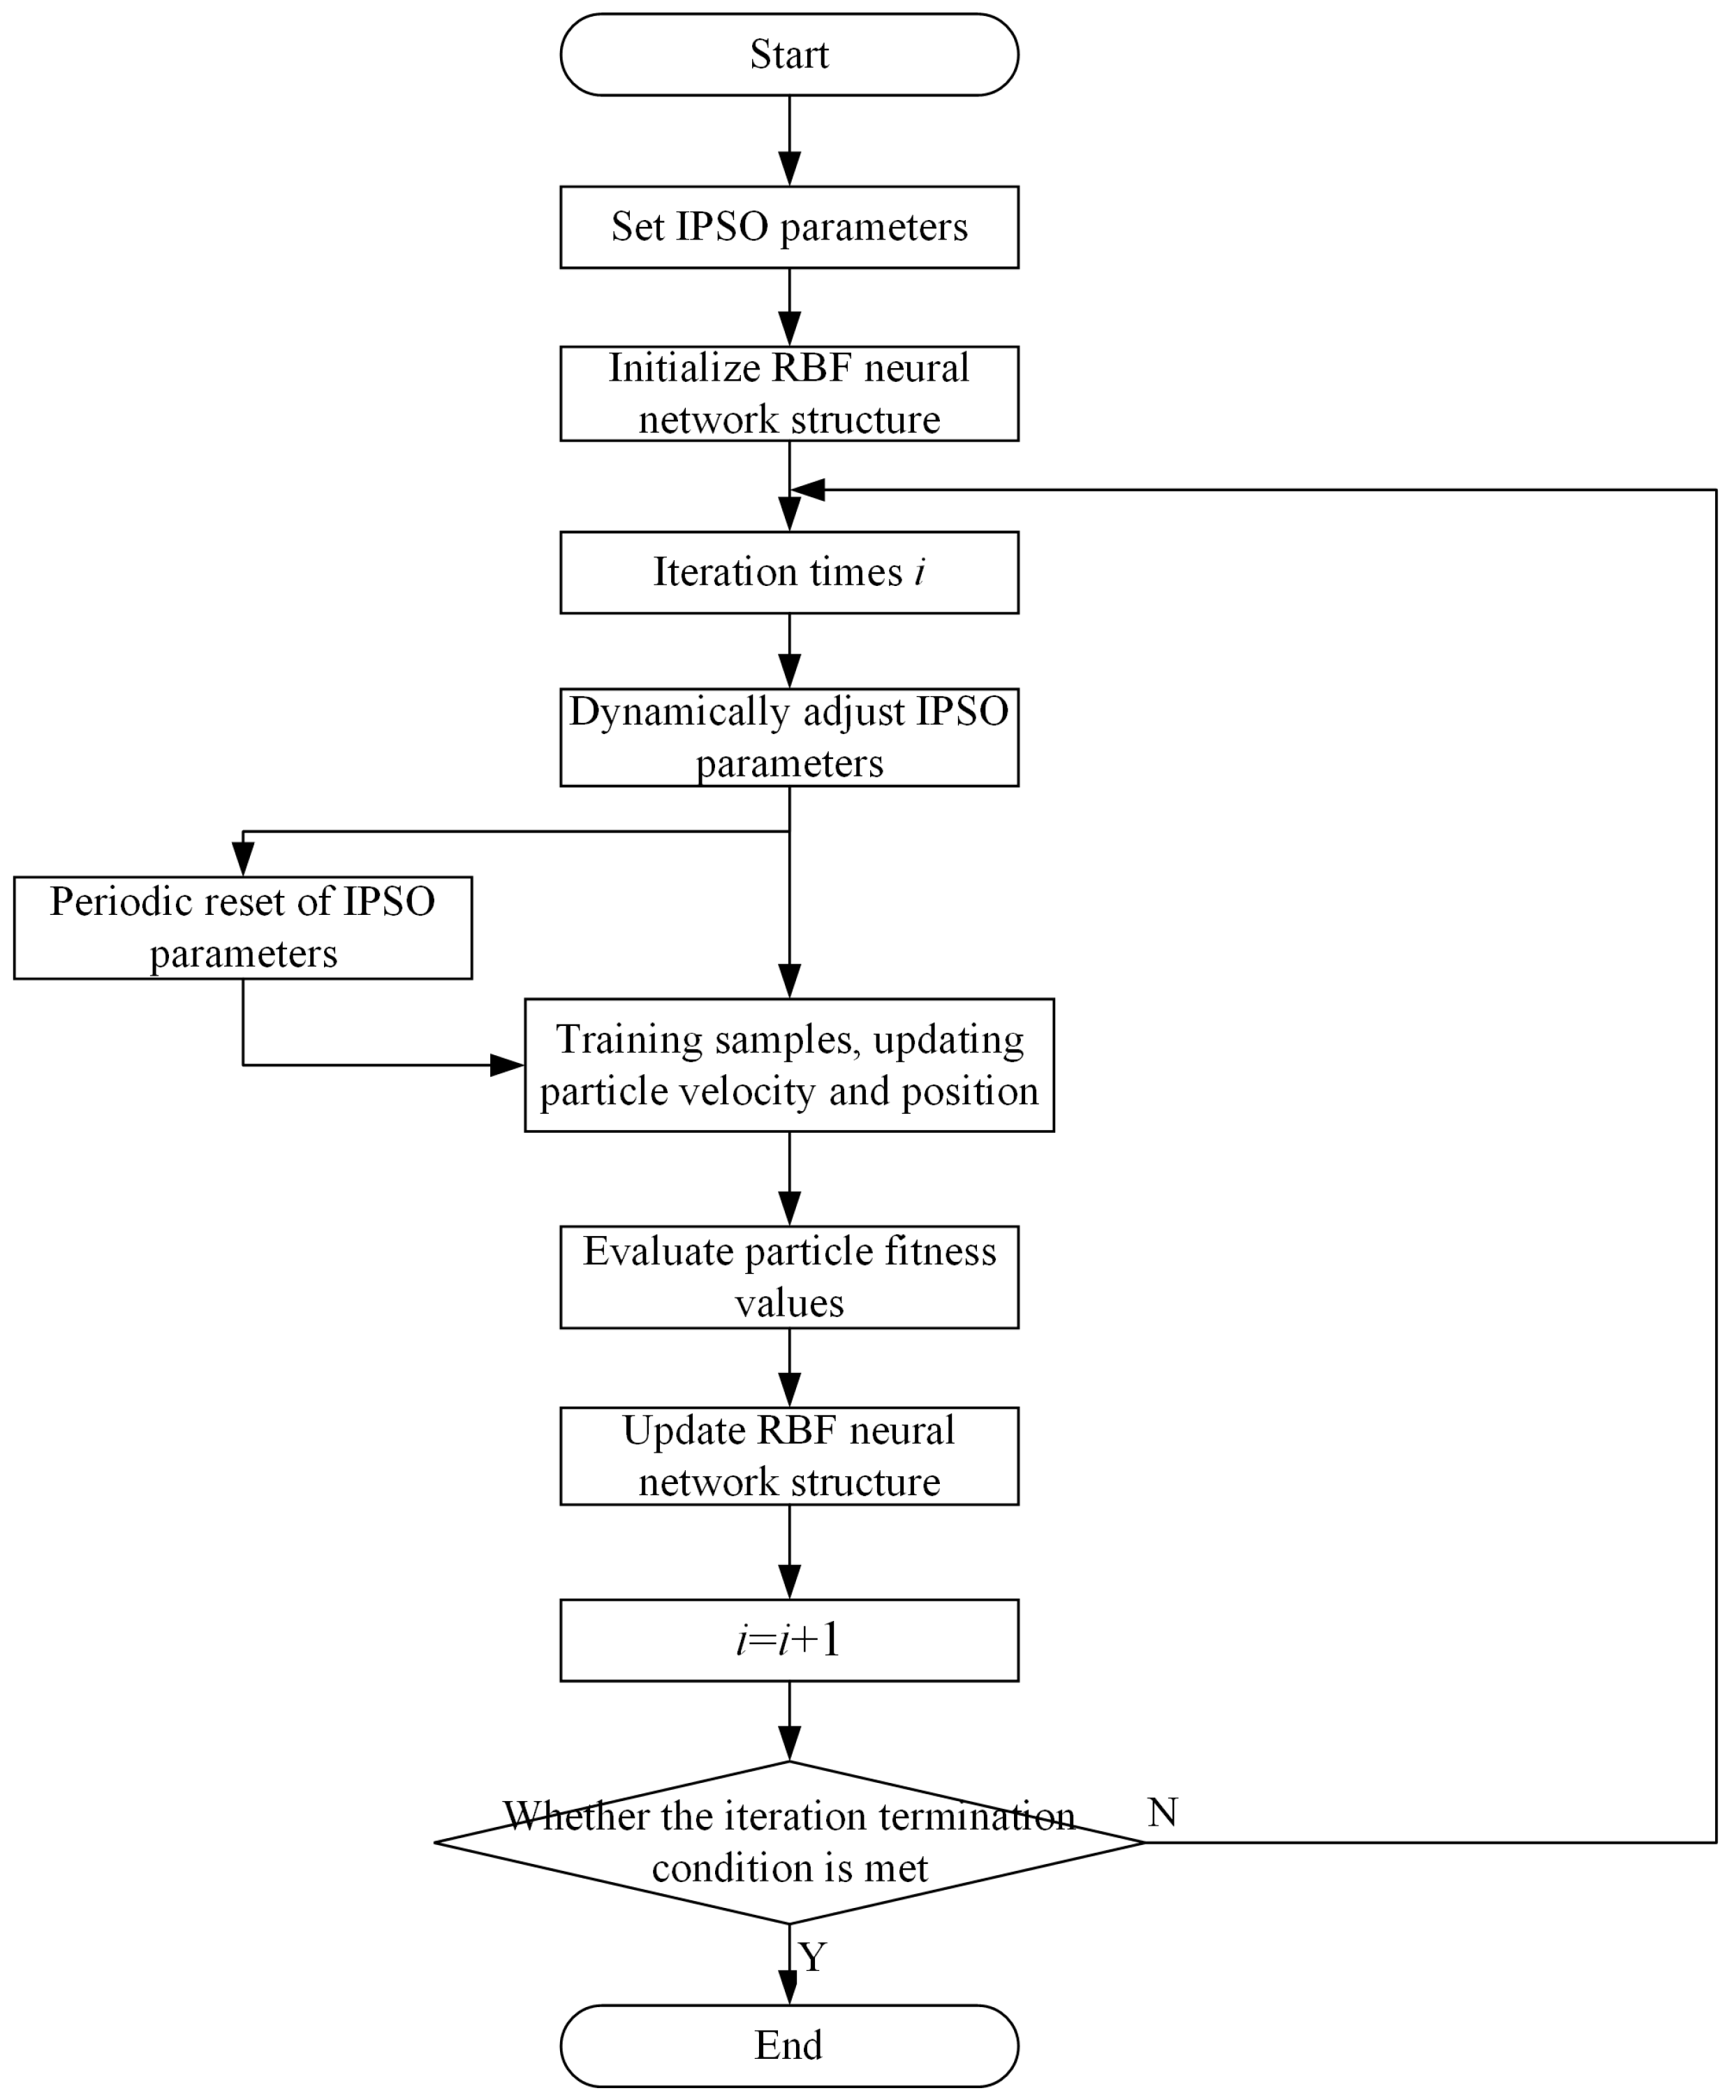
To address this, an Improved Particle Swarm Optimization (IPSO) algorithm is proposed for optimizing the parameters of the RBF neural network. The innovations and advantages of IPSO over standard PSO and other optimization algorithms are as follows: (1) Dynamic Inertia Weight: A strategy employing a decremental inertia weight, as defined in Equations (12)–(14), is adopted. This strategy maintains a higher value in the early iterations to facilitate global exploration and rapidly reduces it in the later stages to enhance local exploitation, thereby achieving a superior balance between exploration and exploitation. (2) Periodic Particle Reset Mechanism: Inspired by the mutation operator in Genetic Algorithms, this mechanism periodically resets the positions of a subset of particles. This injects new diversity into the swarm, effectively preventing premature convergence.
By jointly optimizing the centers, widths, and weights of the RBF network using IPSO, and employing the cross-entropy loss function as the optimization objective, this study aims to construct a conflict prediction model (IPSO-RBF) that exhibits both high accuracy and strong robustness, thereby addressing the challenges posed by unknown constraints in cruise ship design.

3.2.1. RBF Neural Network Model

The RBF neural network is a three-layer feedforward network, with its structure shown in Figure 7.
The RBF neural network includes an input layer, a hidden layer, and an output layer.
(1) Input Layer: Transmits input data to the hidden layer. The number of nodes is consistent with the dimensionality D of the design variables. The input layer receives normalized design parameters.
Different units of input data can degrade model performance and slow convergence; thus, data normalization is necessary for the neural network to better learn patterns within the data. Given the initial input sample data matrix x i n i t i a l = ( x 1 i n i t i a l , x 2 i n i t i a l , , x n i n i t i a l ) , this paper uses the Min-Max scaling method to scale the input cruise ship detailed design data to the range [0.1, 0.9], as shown in Equation (4).
x i = x i initial m i n ( x ) m a x ( x ) m i n ( x ) × ( 0.9 0.1 ) + 0.1
where x i i n i t i a l represents the initial input design variable; m i n ( x ) represents the minimum value of the input design variable; m a x ( x ) represents the maximum value of the input design variable; x i represents the result after normalizing the design variable data.
(2) Hidden Layer: Uses radial basis functions as activation functions. The number of hidden layer nodes H is determined by the complexity of the problem.
This paper uses the Gaussian function as the radial basis function. The radial basis function for the i-th hidden layer node is shown in Equation (5).
φ i ( x ) = e x c i 2 2 σ i 2
where x is the normalized input vector, c i is the center point of the i-th hidden layer node, and σ i is the width parameter of the i-th hidden layer node.
The conflict detection problem addressed in this paper is a binary classification problem. To improve the numerical stability of the output layer and enhance fitting quality, normalization is performed again after the hidden layer output:
φ ^ i ( x ) = φ i ( x ) μ i σ i 2 + ε
where μ i and σ i 2 are the mean and standard deviation of all sample output values for the i-th hidden layer node, respectively, n is the number of samples, and ε = 1 × 10 8 is used for numerical stability.
μ i = 1 n j = 1 n φ i x j
σ i 2 = 1 n j = 1 n φ i x j μ i 2
(3) Output Layer: Produces the prediction result through a linear weighted combination of the hidden layer outputs.
y = i = 1 H w i φ ^ i x
where y represents the output result of the neural network; w i represents the weight from the i-th hidden layer node to the output layer.

3.2.2. Improved Particle Swarm Optimization Algorithm

The PSO algorithm finds the optimal solution by simulating the information-sharing strategy in bird flock foraging behavior. During the optimization process, each particle represents a potential solution. In each iteration, particles update their velocity and position based on their individual best position p b e s t and the global best position g b e s t .
(1) Velocity and Position Update
Assume at the t-th iteration, the velocity of the k-th particle is V k t and its position is X k t . Then, the velocity and position update formulas for the next iteration are given by Equation (10):
V k t + 1 = ω V k t + c 1 r 1 ( p b e s t k X k t ) + c 2 r 2 ( g b e s t X k t )
X k t + 1 = X k t + V k t + 1
where ω is the inertia weight, c 1 is the individual learning factor, c 2 is the social learning factor, and r 1 , r 2 ( 0 , 1 ) is a random factor.
To enhance the PSO algorithm’s ability to search for the optimal solution, this paper designs dynamic parameter adjustment strategies and a particle reset mechanism.
(2) Dynamic Parameter Adjustment
The inertia weight ω : a larger ω increases the ability to search globally for potential optimal solutions, while a smaller ω enhances fine local search capability around known optimal solutions. This paper uses a linear decreasing strategy to adjust the inertia weight. Among them, ω m a x is the maximum inertia weight and ω m i n is the minimum inertia weight:
ω = ω m a x t T ( ω m a x ω m i n )
where T is the total number of iterations. Similarly, a linear decreasing strategy is used to update the individual learning factor, reducing the particle’s reliance on historical experience; a linear increasing strategy is used to update the social learning factor, enhancing the particle’s learning from the global optimum. c 1 m a x and c 1 m i n are the maximum and minimum individual learning factors, and c 2 m a x and c 2 m i n are the maximum and minimum social learning factors, respectively.
c 1 = c 1 m a x t T ( c 1 m a x c 1 m i n )
c 2 = c 2 m i n + t T ( c 2 m a x c 2 m i n )
To avoid premature convergence of the PSO algorithm during multiple optimization iterations, this paper sets a rule to reset a portion of particles every k iterations, reinitializing their velocity and position parameters. The particle initialization and reset strategies are detailed in the next section.

3.2.3. IPSO Algorithm for Optimizing RBF Neural Network Model Structure

The neural network model primarily includes three parameters: center points c i , widths σ i , and weights ω i . Among them, c i defines the central position of the “perceptive range” for each radial basis function; σ i controls the spread of the radial basis function, determining the influence radius of each node; ω i adjusts the contribution degree of hidden layer nodes to the output. These three parameters determine the detection performance of the RBF neural network. Therefore, to ensure good fitting performance of the RBF neural network, an optimal parameter combination needs to be set for the model.
(1) Parameter Encoding
Let the design variable dimensionality be D, and the number of RBF hidden layer nodes be H. The dimensionality of the RBF neural network model parameter vector is set as follows: center matrix C R H × D , width vector σ R H , weight vector ω R H . The total parameter dimensionality is P = H ( D + 2 ) .
This paper flattens the parameter vector into a 1-dimensional vector and uses this parameter vector of length P as the particle position vector X . The position vector of the k-th particle is set as. X k = [ w k , c k , σ k ] R P .
Parameter encoding is illustrated in Figure 8.
(2) Initialization Strategy
(i) Center Points c
The RBF neural network has H hidden layer nodes. Therefore, H distinct samples are randomly selected from the training data as the initial center points for the RBF, avoiding random initialization that might lead parameters to deviate from valid regions. These are then flattened into a 1-dimensional vector.
c k ( 0 ) ~ U n i f o r m ( x 1 , x 2 , , x n )
(ii) Widths σ
Given the input sample data matrix x = ( x 1 , x 2 , , x n ) used for training, values are randomly and uniformly sampled based on the value range of the training sample matrix to adapt to input features of different scales. The number of values taken is equal to the number of hidden layer nodes H:
σ k ( 0 ) ~ U n i f o r m ( m a x ( x ) m i n ( x ) 20 , m a x ( x ) m i n ( x ) 5 , s i z e ( H ) )
where m a x ( x ) and m i n ( x ) represent the maximum and minimum values in the sample matrix, respectively.
(iii) Weights w
Weights are randomly and uniformly sampled in the interval (−0.5, 0.5). The number of values taken is equal to the number of hidden layer nodes H.
w k ( 0 ) ~ U n i f o r m ( 0.5 , 0.5 , s i z e ( H ) )
(iv) Particle Position X
After initializing the above three parameters, they are concatenated and a random disturbance is added to avoid overfitting during algorithm optimization:
X k ( 0 ) = [ w k ( 0 ) , c k ( 0 ) , σ k ( 0 ) ] + Δ , Δ ~ U n i f o r m ( 0.5 , 0.5 , s i z e ( P ) )
(v) Particle Velocity V
Particle velocities are randomly and uniformly sampled in the interval (−0.1, 0.1). The number of values taken is equal to the parameter encoding size P.
V k 0 U n i f o r m 0.5 , 0.5 , s i z e P
(3) Periodic Particle Reset
To prevent overfitting when the PSO algorithm optimizes the RBF network structure, this paper refers to the mutation mechanism in Genetic Algorithms, introducing new individuals to avoid premature convergence. It is set to reset 10% of the particles every 10 iterations, reinitializing their positions and velocities. The method for generating new parameters is consistent with the initialization phase.
X k r e s e t = w k 0 , c k 0 , σ k 0 + Δ ,   Δ U n i f o r m 0.5 , 0.5 , s i z e P
V k r e s e t U n i f o r m 0.5 , 0.5 , s i z e P
(4) Velocity Limiting
To prevent oscillations or overflow due to excessively large particle velocities leading to large steps, or narrow search ranges due to excessively small velocities, this paper sets velocity limits to stabilize the convergence process. For the velocity vector of the k-th particle, the value range for each velocity element V k , p t + 1 is given by Equation (22), and V m a x is the maximum speed limit:
V k , p t + 1 = V max ,   if   V k , p t + 1 < V max V k t + 1 ,   if   V max V k , p t + 1 < V max V max ,   otherwise
(5) Fitness Function
To prevent model overfitting, the cross-entropy loss function is used as the fitness function for the PSO algorithm:
L = 1 n j = 1 n y t r u e log y j + 1 y t r u e log 1 y j
where y t r u e is the true label of the input sample, y j is the model’s predicted label, and n is the total number of samples.
After each iteration, the current fitness value is compared with the historical best fitness value, and the individual best and global best are updated.
p b e s t k t + 1 = X k t + 1 ,   i f   L X k t + 1 < L p b e s t k t p b e s t k t + 1 ,   o t h e r w i s e
g b e s t = arg m i n p b e s t i L p b e s t i
The algorithm flow of IPSO improving RBF neural network is shown in Figure 9:
(6) Conflict Detection
To achieve a binary classification result (whether a conflict exists in the large cruise ship detailed design), this paper uses the sigmoid function to transform the linearly weighted output of the RBF. A threshold judgment method is then applied to convert the processed predicted value into a binary (0, 1) label, which can be compared with the true target value in the input sample. A label of “1” indicates that the design scheme indeed triggered a conflict requiring modification in subsequent design stages, whereas a label of “0” signifies that the scheme successfully passed all reviews without any conflicts. This labeling criterion is objectively established based on whether the design scheme subsequently triggered a formally issued design change request during later project phases, such as production design or construction preparation, thereby ensuring the objectivity and accuracy of the conflict labels.
y ^ = 0 ,   i f   s i g m o i d y 0.5 1 ,   o t h e r w i s e

4. Case Verification

4.1. Cruise Ship Detailed Design Case

The cruise ship water supply system, as core infrastructure in modern cruise ships, has significantly different technical characteristics and operational requirements compared to traditional vessels. The core challenge of the cruise ship water supply system lies in constructing a complex network within limited space that can continuously and stably supply potable water to meet the high-frequency usage demands of thousands of passengers and crew. The reliable operation of this system is not only directly related to passenger living experience and satisfaction but also a crucial guarantee for cruise ship operational efficiency and brand reputation.
During the detailed design process of the cruise ship water supply system, a specific pipe section’s water supply pipeline needs to pass from the deck through a bulkhead to supply water to the potable water tank. Structural designers, considering their own design requirements, limit the diameter range for piping penetration openings. It is necessary to detect whether the diameter range limited by the structural designers meets the design requirements of the cruise ship water supply system.
The design parameters for a specific pipeline in the water supply system are summarized in Table 1.

4.2. Known Constraint Conflict Detection Experiment and Results

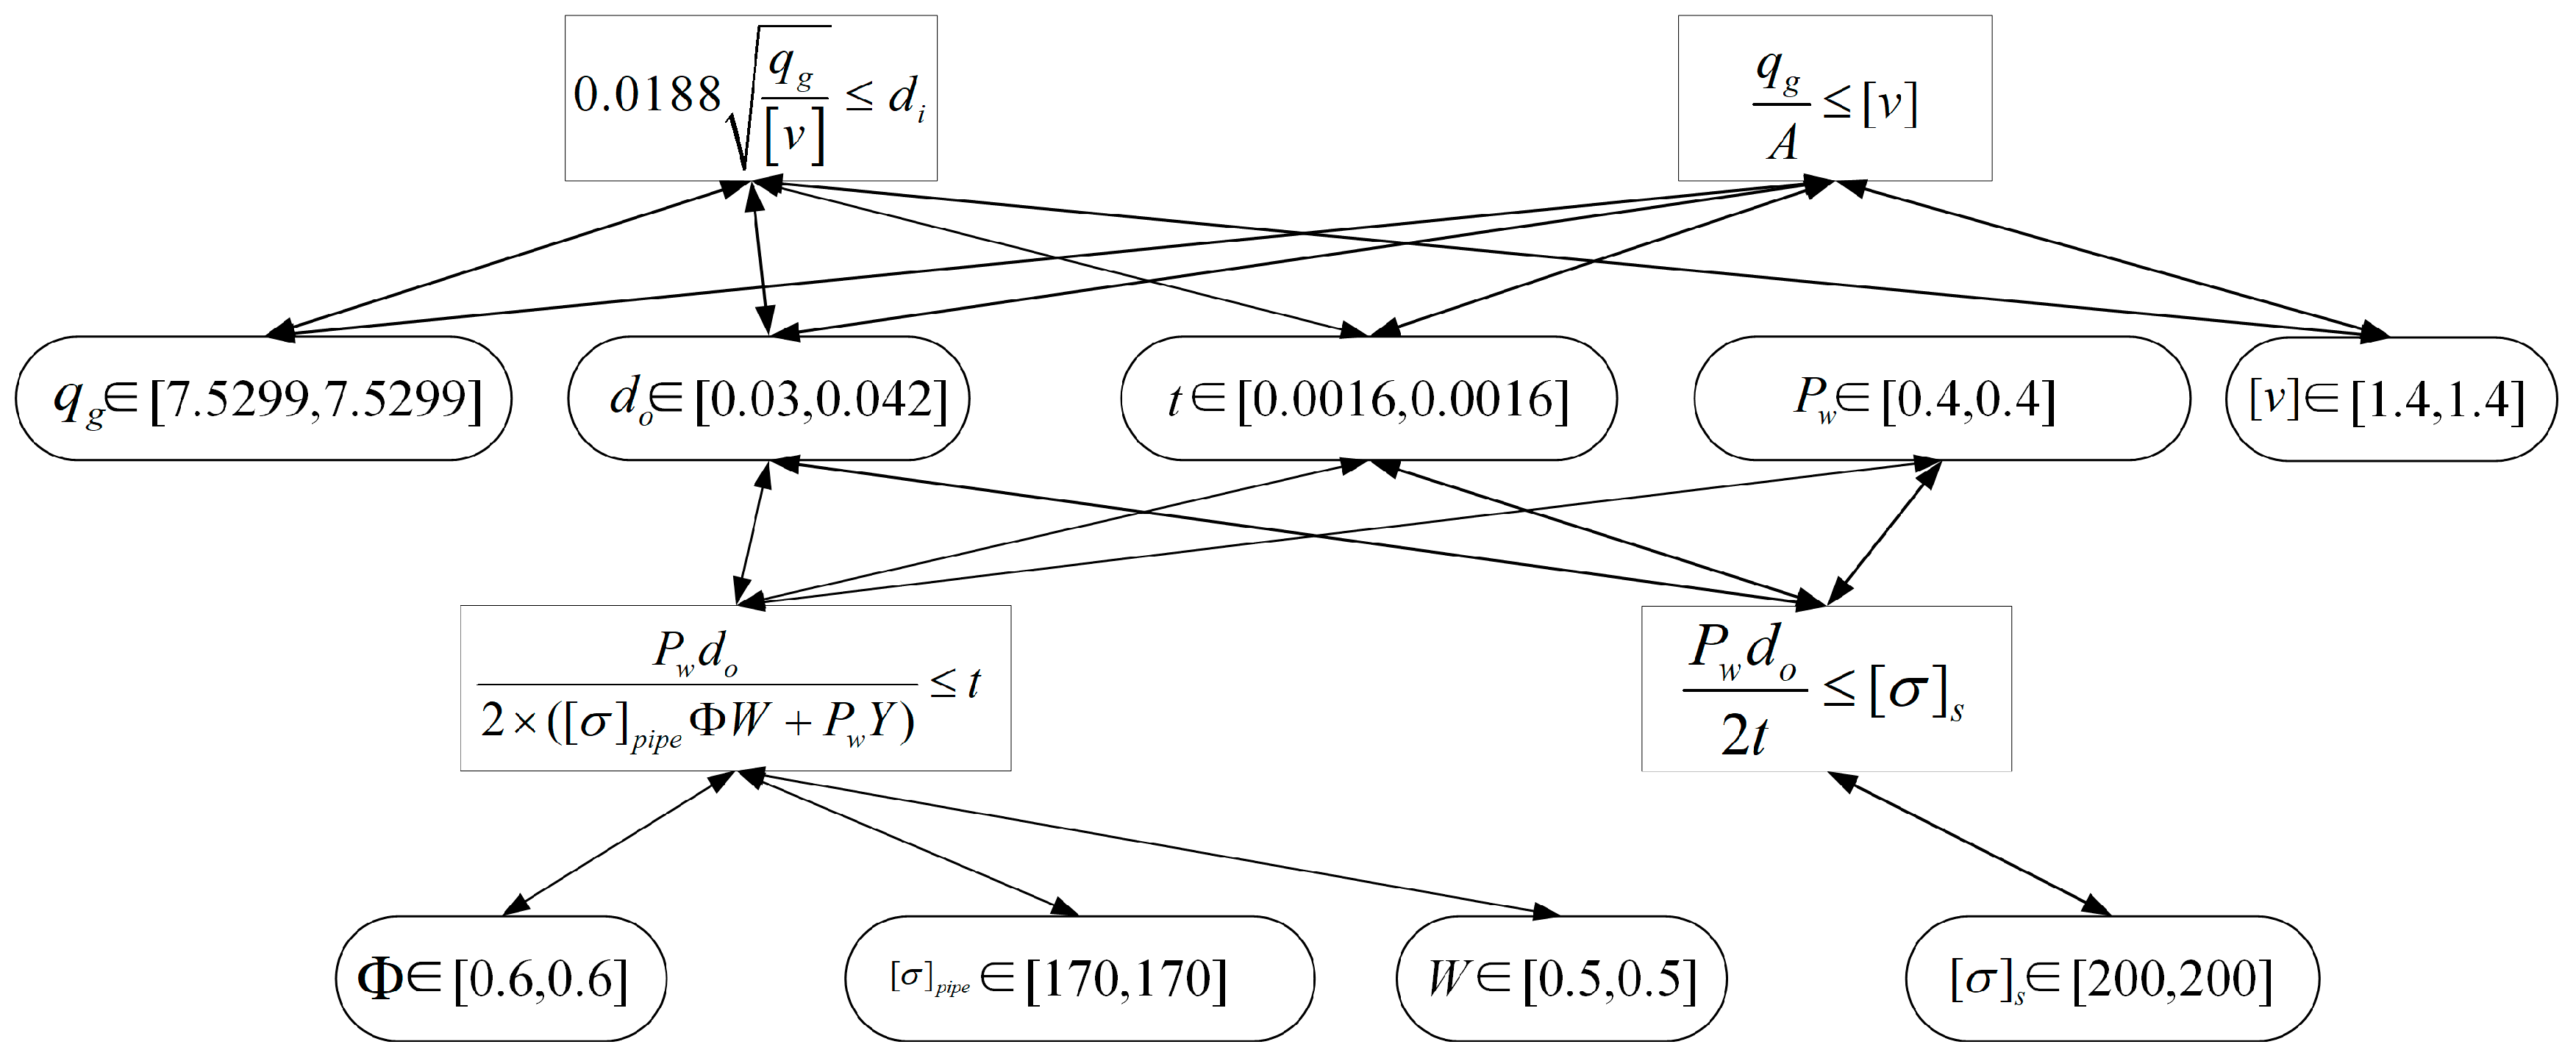
The design constraints considered for the cruise ship water supply system pipeline design are shown in Equations (27)–(30).
The pipe diameter needs to meet the peak flow demand.
0.0188 q g v d i
where q g represents the design value of the peak flow rate for the pipe section, unit is m 3 / s ; [ v ] represents the allowable flow velocity inside the pipe, unit is m/s; d i represents the design value of the pipe’s internal diameter, unit is m.
The flow velocity at the pipe penetration opening needs to be less than the allowable flow velocity of the water supply system.
q g A [ v ]
where q g represents the design value of the peak flow rate for the pipe section, unit is m 3 / s ; A represents the area of the penetration opening, unit is m 2 ; [ v ] represents the allowable flow velocity inside the pipe, unit is m/s.
The pipe wall thickness ensures the safety and reliability of the piping system.
P w d o 2 × ( [ σ ] p i p e Φ W + P w Y ) t
where P w represents the working pressure of the pipe section, unit is MPa; d o represents the design value of the pipe’s external diameter, unit is m; [ σ ] p i p e represents the allowable stress of the pipe material, unit is MPa; Φ represents the longitudinal weld joint factor or casting quality factor, value range 0.6–1; W represents the weld joint high-temperature reduction factor, value range 0.5–1; Y represents the calculation coefficient, value 0.4.
The pipe stress needs to be less than its yield strength.
P w d o 2 t [ σ ] s
where P w represents the working pressure of the pipe, unit is MPa; d o represents the design value of the pipe’s external diameter, unit is m; t represents the design value of the pipe wall thickness, unit is m; [ σ ] s represents the yield strength of the pipe material, unit is MPa. The constraint network of the water supply system is shown in Figure 10.
The interval propagation algorithm is used to detect design conflicts in the constraint network.
(1)
Initial constraint set:
C o n = { t P w d o 2 × ( [ σ ] Φ W + P w Y ) , d o 2 × ( [ σ ] Φ W + P w Y ) P w , , d 0 2 t σ s P w }
(2)
Initial variable intervals:
I = { q g = [ 7.5299 , 7.5299 ] , d o = [ 0.03 , 0.042 ] , , W = [ 0.5 , 0.5 ] }
(3)
Judging sequentially whether the constraint intervals satisfy the requirements:
t P w d o 2 × ( [ σ ] Φ W + P w Y ) I t = [ 0.016 , 0.016 ] I t I t delete   constraint   t P w d o 2 × ( [ σ ] Φ W + P w Y ) ;
d o 2 t × ( [ σ ] Φ W + P w Y ) P w I d o = [ 0.03 , 0.042 ] I d o I I o delete   constraint   d o 2 t × ( [ σ ] Φ W + P w Y ) P w ;
P w 2 [ σ ] Φ W d o 2 Y I P w = [ 0.4 , 0.4 ] I P w I P w delete   constraint   P w 2 [ σ ] Φ W d o 2 Y ;
d o 4 q g π [ v ] + 2 t I d o =
From the calculation results of the interval propagation algorithm, the conclusion for the conflict detection in the detailed design of the cruise ship water supply system is that the opening diameter limitation set by the structural discipline does not meet the peak flow demand of the cruise ship water supply system.

4.3. Unknown Constraint Conflict Detection Experiment and Results

4.3.1. Unknown Constraint Conflict Detection Indicators

The cruise ship water supply system design team designs all water supply pipelines, including main lines, circulation lines, and user lines, according to the water supply requirements during cruise ship navigation. When the design scheme satisfies its own set of constraint relationships, to prevent design conflicts between multiple disciplines, design conflicts potentially existing in the unknown constraint set C u are detected.
To validate the detection capability of the proposed method for unknown constraint conflicts, a case study was conducted focusing on the piping design within the large cruise ship water supply system. The dataset, sourced from the detailed design phase of a specific cruise ship model at a domestic shipyard, comprises 400 historical design samples. Each sample consists of 10 key design parameters (as listed in Table 1) and one binary conflict label.
The assignment of conflict labels (1: conflict; 0: no conflict) strictly adheres to a rigorous “post-validation” principle. This means labeling is determined based on whether the design was later confirmed to have caused implicit conflicts during subsequent production design, construction, or operation phases. Such conflicts typically manifest as issues like system pressure imbalance, abnormal vibration, or poor maintainability during system integration, commissioning, or maintenance, even though the design complied with all explicit specifications. The labels were ultimately adjudicated by a team of senior design engineers referencing the project’s issue report database, ensuring their authenticity and accuracy grounded in engineering practice.
To evaluate the model’s generalization performance, the 400 samples were randomly split into a training set (300 samples) and a test set (100 samples) in an approximate 3:1 ratio. The splitting procedure employed a stratified sampling strategy to maintain a consistent distribution of positive and negative samples across both the training and test sets, thereby preventing potential evaluation bias. Furthermore, to enhance the robustness of the generalization assessment, the 300 training samples were further divided into three distinct groups of 100 samples each. This grouping scheme increases the number of iterations in cross-validation, thereby reducing the randomness associated with any single data partition and yielding a more reliable evaluation of the model’s generalization capability.
Model performance was comprehensively evaluated using three key metrics: Accuracy A , Precision P , and Recall R , calculated based on the confusion matrix (shown in Table 2).
A = T P + T N T P + T N + F P + F N
P = T P T P + F P
R = T P T P + F N
Accuracy A represents the proportion of correctly predicted results; Precision P represents the proportion of samples that are actually positive among those predicted as positive; Recall R represents the proportion of samples that are actually positive that are correctly predicted as positive. Within the specific engineering context of cruise ship design conflict detection, the costs associated with different types of misclassifications are markedly asymmetric. False negatives—that is, failures to identify actual implicit conflicts—can lead to exorbitant rework costs and potential safety hazards at later stages, with severe consequences. Therefore, the model must prioritize achieving an extremely high Recall rate to minimize the risk of missing conflicts. In contrast, false positives—incorrectly flagging a conflict-free design as having a conflict—typically require only minor additional review effort by designers, representing a relatively manageable cost. Consequently, the optimization objective of this study is to maximize Recall while simultaneously improving Precision to reduce unnecessary review work. Accuracy serves as a macro-level reference for the model’s overall classification performance. While higher values for all three metrics generally indicate better model performance for binary classification, this specific metric combination strategy ensures that the model design prioritizes the most critical engineering requirement: risk control.

4.3.2. IPSO-RBF Parameter Settings

Single-hidden-layer RBF neural network architecture was adopted, with the input dimensionality dynamically determined by the sample feature dimensions. The cross-entropy loss function served as the optimization objective, combined with Gaussian radial basis functions to construct the nonlinear mapping capability—this function is a standard choice for RBF networks due to its smoothness, strong locality, and favorable analytical properties. The output layer employs linear weighting followed by a sigmoid activation function to realize binary classification decisions. Key parameters—including the centers and widths of the radial basis functions, as well as the connection weights—were adaptively optimized and determined via the IPSO algorithm.
A structured parameter optimization was conducted using a one-factor-at-a-time analysis, focusing primarily on the influence of the number of hidden layer nodes (H) and the IPSO swarm size on model performance. The candidate range for H was set to [1, 3, 5, 7, 9], which covers typical RBF network node configurations and balances model expressiveness against overfitting risks. The candidate set for the IPSO swarm size was [10, 20, 30, 40, 50], determined based on benchmarks in the swarm intelligence literature and computational efficiency considerations. The configuration of other parameters strictly followed academic consensus: the inertia weight employed a linearly decreasing strategy ( ω m a x = 0.9 , ω m i n = 0.4 ) to achieve a dynamic balance between global exploration and local exploitation; the cognitive coefficient ( c 1 ) and social coefficient ( c 2 ) utilized linearly decreasing ( c 1 m a x = 2.5 , c 1 m i n = 1.0 ) and linearly increasing ( c 2 m i n = 0.5 , c 2 m a x = 2.5 ) strategies, respectively, ensuring the synergistic optimization of individual experience and collective information; particle velocities were initialized within the range (−0.1, 0.1), with a maximum velocity limit V m a x = 0.5 set to prevent oscillations or entrapment in local optima; the number of iterations was fixed at 1000, verified via convergence curves to ensure sufficient algorithmic convergence.
The parameter values for IPSO-RBF, such as the number of hidden layer nodes, iteration count, and inertia weight, are set as shown in Table 3.
A systematic parameter sensitivity analysis for the number of hidden layer nodes and the IPSO swarm size was performed using the one-factor-at-a-time method based on the controlled variable principle. First, with the swarm size fixed at 50, the impact of different H values on the test set metrics was tested. The experimental results (Table 4) showed that when H = 5, the accuracy, precision, and recall reached their peak values of 94.00%, 94.90%, and 98.94%, respectively, confirming that a medium number of nodes achieves the optimal balance between feature mapping capability and generalization ability. Subsequently, with H fixed at 5, the performance across different swarm sizes was evaluated. The results indicated that a swarm size of 50 yielded significantly better performance across all metrics compared to other configurations, validating the rationality of the chosen swarm size.

4.3.3. Unknown Constraint Conflict Detection Results

The training set was normalized using Equation (4) before being fed into the neural network. The confusion matrices, accuracy, precision, and recall were recorded for the three training subsets. The neural network model architecture that achieved the highest accuracy on these training subsets was selected and subsequently applied to the test set to validate the feasibility of the proposed conflict detection method for cruise ship detailed design.
The results of conflict detection using IPSO-RBF on the training set are shown in Table 5.
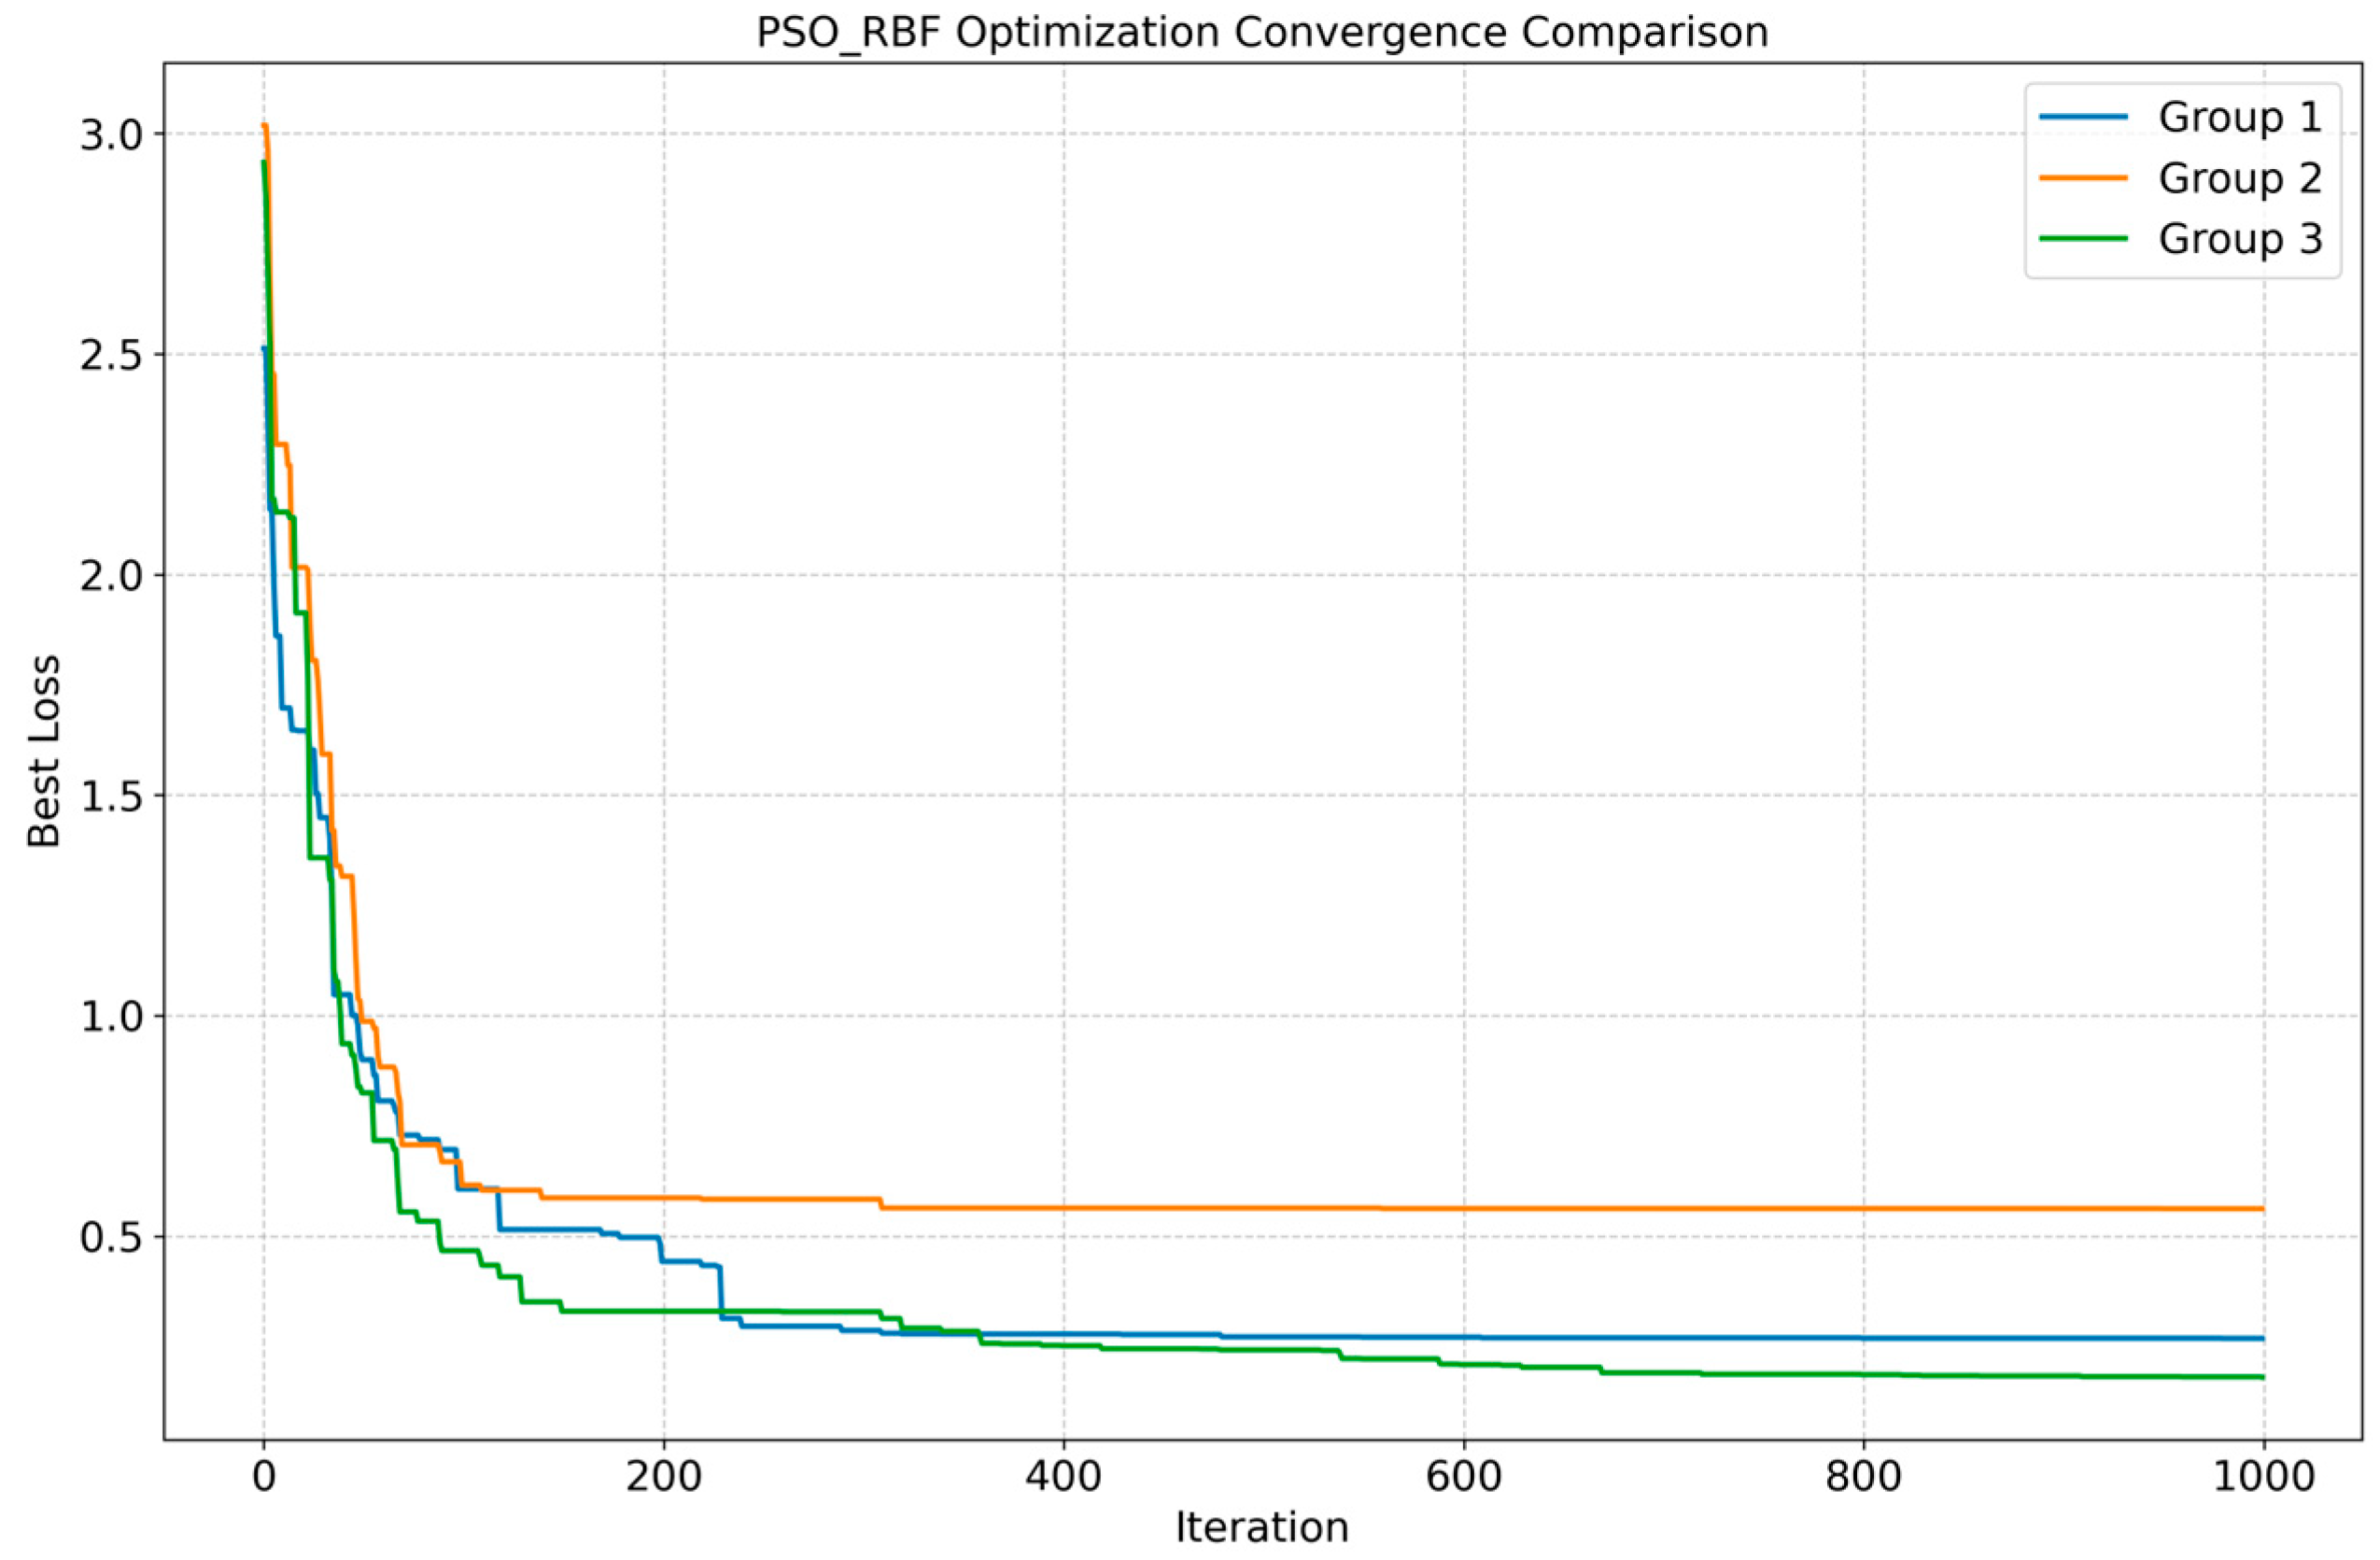
The convergence curve of the algorithm on the training set is shown in Figure 11:
After comparison, the neural network model structure from Group 2 in Table 4 is used for the IPSO-RBF validation experiment on the test set. The model structure is shown in Table 6.
The validation results on the test set are shown in Table 7.
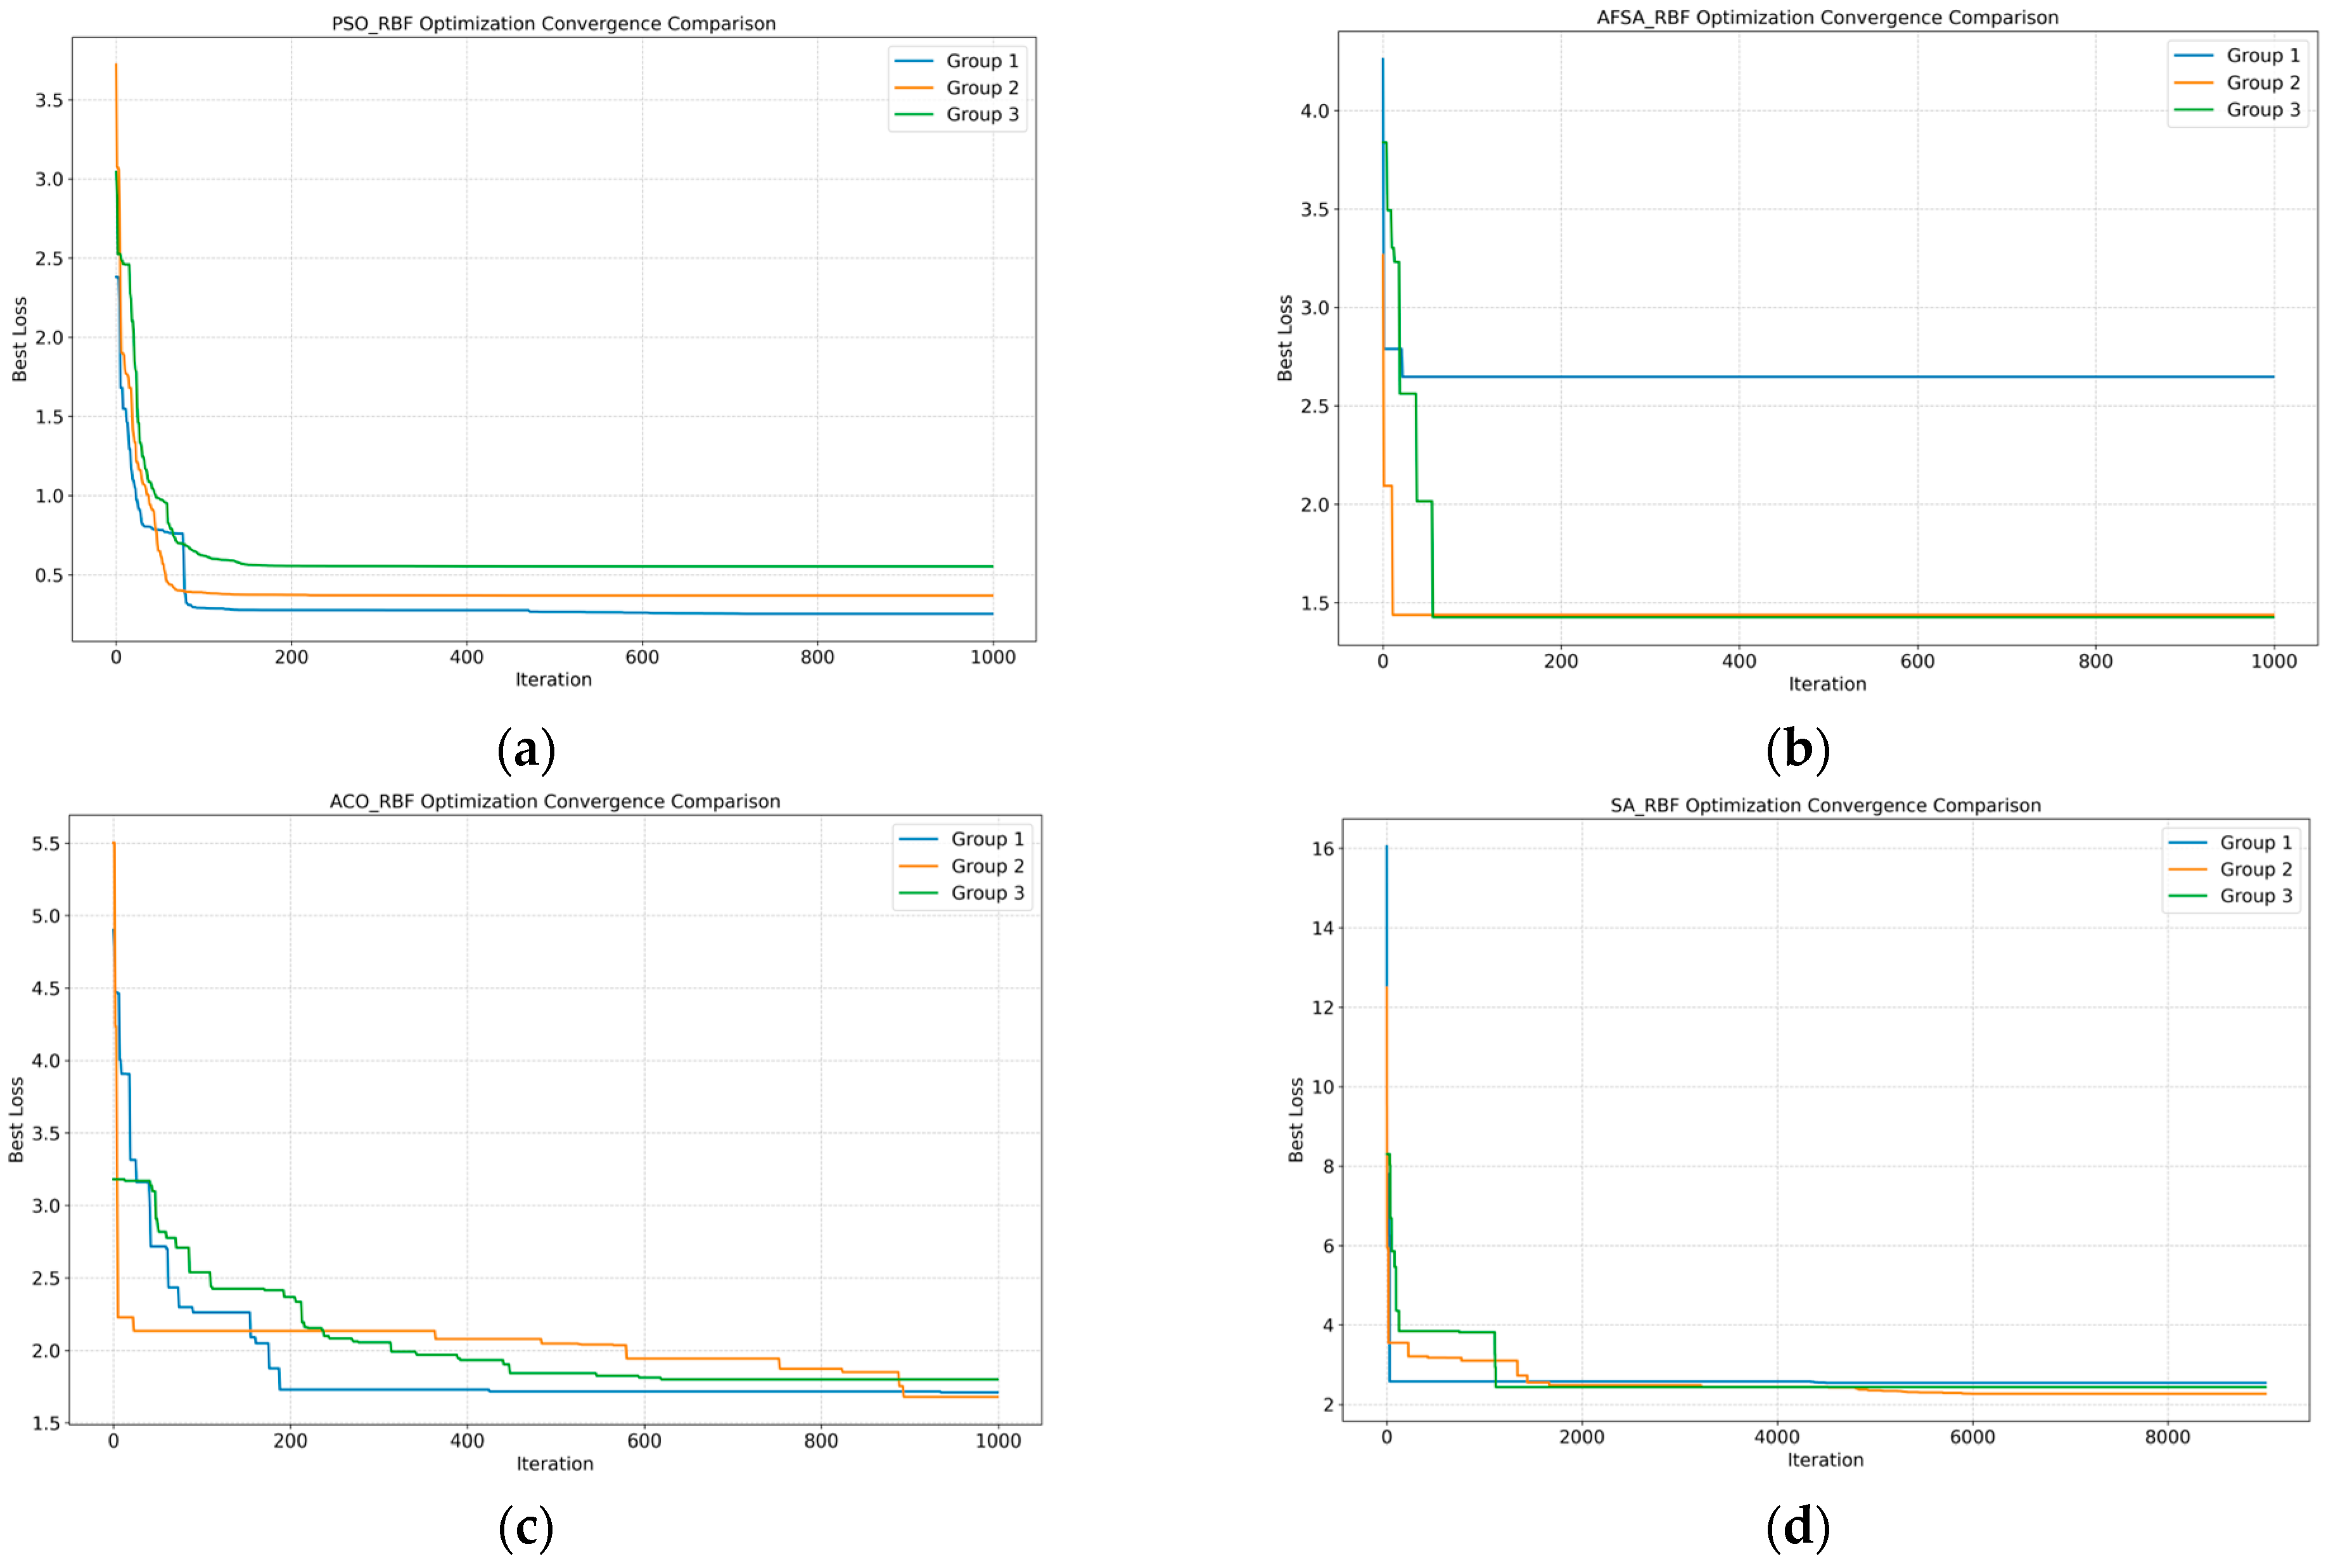
To comparatively verify the performance of the proposed IPSO-RBF in the large cruise ship detailed design conflict detection problem, classic PSO algorithm, Artificial Fish Swarm Algorithm (AFSA), Ant Colony Optimization (ACO), and Simulated Annealing (SA) are used to optimize the RBF neural network model results for comparison. Among them, the parameters for PSO-RBF are set as: w = 0.7, c1 = c2 = 2; AFSA-RBF parameters: visual range visual = 1, step size step = 0.3, maximum tries for foraging behavior try = 3, crowding factor cf = 0.8; ACO-RBF parameters: pheromone intensity Q = 1, pheromone evaporation rate r = 0.1, pheromone importance α = 1, heuristic information importance β = 2; SA-RBF parameters: initial temperature T0 = 10, final temperature T = 1 × 10⁻³, cooling coefficient r = 0.95, iterations per temperature N = 50.
The conflict detection results of the four comparison algorithms on the training set are shown in Table 8, Table 9, Table 10 and Table 11:
The convergence curves of the comparison algorithms on the training set are shown in Figure 12:
Similarly, the best model structures from the training sets of the comparison algorithms are selected for validation on the test set. The validation results are shown in Table 12:
Analyzing the metric results of IPSO-RBF and the four comparison algorithms on the training set shows that the accuracy of IPSO-RBF for conflict detection training on the three training sets is greater than 90%, achieving an excellent result of 96% accuracy on the second group. Among the comparison algorithms, only PSO-RBF and ACO-RBF achieved accuracy greater than 90% on all three training sets, with their highest accuracy being 95%, slightly lower than IPSO-RBF. Among the remaining two algorithms, AFSA-RBF’s highest accuracy was 93%, and SA-RBF’s highest accuracy was 93.88%. Meanwhile, in terms of precision and recall across the three training sets, IPSO-RBF maintained stable detection performance (97.94% precision on the second training set, 100% recall on the first and third training sets); the comparison algorithms had lower precision than IPSO-RBF on the training sets, and the average recall across the three training sets was also lower than IPSO-RBF. In summary, the RBF neural network model optimized by IPSO is more stable and exhibits superior performance in conflict detection on the training set.
In the test set validation results, IPSO-RBF achieved an accuracy of 94%, precision of 94.9%, and recall of 98.94%. Among the comparison algorithms, only ACO-RBF achieved an accuracy greater than 90% (91%) on the test set. The precision and recall of all four comparison algorithms on the test set were lower than those of IPSO-RBF.
Overall, the IPSO-RBF method designed in this paper for detecting unknown constraint conflicts has stable conflict detection performance and can meet the requirements for conflict detection under the complex design background of the large cruise ship detailed design phase.

4.3.4. Discussion on Unknown Constraint Conflict Detection Results

The proposed IPSO-RBF model demonstrated exceptional performance in detecting conflicts within the cruise ship water supply system. As shown in Table 11, its accuracy, precision, and recall on the test set were significantly higher than those of comparative models, including PSO-RBF, AFSA-RBF, ACO-RBF, and SA-RBF. The superior performance of IPSO-RBF can be attributed to its algorithmic innovations. The dynamic inertia weight and particle reset mechanism in IPSO enable it to escape local optima more effectively and identify superior parameter combinations for the RBF network compared to standard PSO or other algorithms. This directly results in a model with stronger generalization capability and higher predictive accuracy. Notably, its high recall rate indicates that the model is highly reliable in capturing genuine design conflicts, thereby substantially mitigating the later-stage engineering risks associated with missed detections.
Analysis of the performance metrics from both the training and test sets reveals that the precision of all RBF-based models is generally slightly lower than their recall. This phenomenon likely occurs because, when learning implicit constraints, the model tends to make somewhat “conservative” predictions to maximize the capture of potential conflict patterns, consequently introducing a certain number of false positives. This represents an acceptable trade-off in engineering practice.
Compared to models utilizing standard PSO, SA, or other optimization algorithms for RBF structure optimization, this study achieves superior detection performance through algorithmic enhancements within a similar metaheuristic framework. The core advantage of the proposed method over those relying on precise physical rules or predefined models lies in its learning capability for “unknown” or “implicit” constraints. This makes it particularly suitable for the complex design environment of large cruise ships, which heavily depends on historical experience and multi-disciplinary collaboration.

5. Conclusions

This paper addresses the frequent occurrence of design conflicts in multi-disciplinary collaboration during the detailed design phase of large cruise ships by proposing a hybrid conflict detection framework based on the Constraint Satisfaction Problem (CSP). The innovation of this framework lies in its “divide-and-conquer” strategy, which categorizes complex design constraints into known constraint sets and unknown constraint sets, providing targeted solutions for each.
The main conclusions and contributions of this research can be summarized as follows: (1) A hierarchical hybrid detection framework was proposed: For known, explicitly modellable constraints, an interval propagation algorithm was employed for rapid, automated reasoning and verification, enabling early screening of conflicts. For implicit constraints that are difficult to define explicitly, an IPSO-RBF intelligent prediction model was constructed. This model learns conflict patterns from historical data, achieving high-precision detection of conflicts arising from unknown constraints. (2) Algorithmic innovation and performance enhancement were achieved: The standard PSO algorithm was effectively improved by introducing a dynamic inertia weight and a periodic particle reset mechanism. The optimized IPSO algorithm significantly enhanced the ability to optimize RBF neural network parameters, overcoming the tendency to fall into local optima. Experimental results demonstrate that the IPSO-RBF model’s accuracy, precision, and recall on the test set (94.0%, 94.9%, and 98.94%, respectively) significantly outperform those of mainstream comparative models like PSO-RBF and AFSA-RBF. Particularly, its high recall rate of 98.94% adequately meets the core requirement for risk control in engineering practice. (3) Engineering integration and application value were clarified: This research does not aim to replace the basic conflict detection functions in existing CAD/PLM systems but rather serves as an enhancement and supplement. The proposed method can be integrated into the existing design workflow as an independent intelligent detection service. After completing a preliminary design in the PLM system, designers can invoke the algorithm developed herein for in-depth conflict analysis. The system then feeds the generated conflict report back to the PLM platform, guiding designers to conduct focused review and optimization, thereby forming a closed-loop workflow of “design—intelligent detection—feedback and optimization”. This front-load conflict resolution, improving overall design efficiency and quality.
Research proves that the solution framework designed in this paper for known and unknown constraint conflicts can serve as a reference tool for designers in conflict detection, effectively guiding design practice. With some component adjustments or encoding modifications, this method could also serve as a tool to support detailed design for other types of ships or to support detection involving non-numerical data, thereby providing a practical and efficient technical solution for conflict detection in the design of large cruise ships and other vessels.
However, this study has limitations that warrant future work: The IPSO process for the RBF network requires numerous iterations, resulting in computational costs higher than some simpler models. Future research will explore more efficient optimization algorithms or distributed computing to enhance efficiency. Furthermore, future work will investigate more representative feature engineering and attempt to introduce deep learning models, such as Graph Neural Networks (GNNs), into conflict detection to more naturally handle the topological and spatial relationships between design objects.

Author Contributions

Conceptualization, F.Y., Y.W. and J.L.; methodology, F.Y., Y.W. and L.W.; software, F.Y., Y.W. and L.W.; validation, F.Y., Y.W. and L.W.; formal analysis, J.L., L.W., D.S. and Q.Z.; investigation, Y.W. and L.W.; resources, J.L.; data curation, F.Y., J.L., Q.Z. and D.S.; writing—original draft preparation, F.Y., Y.W. and L.W.; writing—review and editing, J.L. and D.S.; visualization, Y.W.; supervision, J.L. and Q.Z.; project administration, J.L. and D.S.; funding acquisition, J.L. All authors have read and agreed to the published version of the manuscript.

Funding

This research is funded by the Ministerial Civil Ship Research Project of China (Grant numbers [2024]56).

Data Availability Statement

The original contributions presented in this study are included in the article. Further inquiries can be directed to the corresponding authors.

Acknowledgments

The authors are responsible for the contents of this publication. In addition, the authors would like to thank their lab classmates for their contributions to the writing quality.

Conflicts of Interest

The authors declare no conflicts of interest.

References

  1. Li, D.; Chen, Z. Progressive collapse response and ultimate strength evaluation of stiffened plates with welding residual stress under combined biaxial cyclic loads and lateral pressure. Mar. Struct. 2025, 99, 103703. [Google Scholar] [CrossRef]
  2. Yurdakul, O.; Kucuksu, G.N.; Saydam, A.Z.; Calisal, M.S. A decision-making process for the selection of better ship main dimensions by a Pareto frontier solution. Ocean Eng. 2021, 239, 109908. [Google Scholar] [CrossRef]
  3. Lee, M.H.; Park, Y.D.; Park, H.G.; Park, W.C.; Hong, S.; Lee, K.S.; Chun, H.H. Hydrodynamic design of an underwater hull cleaning robot and its evaluation. Int. J. Nav. Arch. Ocean Eng. 2012, 4, 335–352. [Google Scholar] [CrossRef]
  4. Lee, K.H.; Lee, K.-Y. Agent-based collaborative design system and conflict resolution based on a case-based reasoning approach. Artif. Intell. Eng. Des. Anal. Manuf. 2002, 16, 93–102. [Google Scholar] [CrossRef]
  5. Lee, K.H.; Lee, K.Y. Case-based conflict resolution in multi-agent ship design system. In Ai 2005: Advances in Artificial Intelligence; Zhang, S., Jarvis, R., Eds.; Lecture Notes in Artificial Intelligence; Springer: Berlin, Germany, 2005; Volume 3809, pp. 826–829. [Google Scholar]
  6. Guermouche, M.; Benkaci, M.; Hoblos, G.; Langlois, N. Sensor Fault Detection and Isolation in Diesel Air Path using fuzzy-ARTMAP Neural Network. In Proceedings of the 2013 10th IEEE International Conference on Networking, Sensing and Control (Icnsc), Evry, France, 10–12 April 2013; pp. 728–733. [Google Scholar] [CrossRef]
  7. Khorshid, E.; Alfadli, A.; Falah, A. Application of constraint infeasibility detection methods in engineering design problems. J. Eng. Des. Technol. 2018, 16, 285–312. [Google Scholar] [CrossRef]
  8. Fradi, M.; Mhenni, F.; Gaha, R.; Mlika, A.; Choley, J.-Y. Conflict Resolution in Mechatronic Collaborative Design Using Category Theory. Appl. Sci. 2021, 11, 4486. [Google Scholar] [CrossRef]
  9. Dang, P.H.; Mohamed, M.A.; Alam, S. Image-based Conflict Detection with Convolutional Neural Network under Weather Uncertainty. In Proceedings of the 2023 Integrated Communication, Navigation and Surveillance Conference, ICNS, Herndon, VA, USA, 18–20 April 2023; pp. 1–11. [Google Scholar] [CrossRef]
  10. Zhou, Z.; Zhao, G.; Chen, Z.; Yang, J.; Meng, L. Research on urban Low-Altitude UAV conflict detection method based on matrix hadamard product calculation. In Proceedings of the Eighth International Conference on Traffic Engineering and Transportation System, ICTETS 2024, Pt 1, Dalian, China, 20 December 2024; Proc. SPIE 13421. p. 134212A. [Google Scholar] [CrossRef]
  11. Han, W.M.; Bu, X.Z.; Chen, J. The Resource Conflicts Detecting Method of Virtual Manufacturing Cell Based on Bayesian Network. Adv. Mater. Res. 2013, 655–657, 1650–1655. [Google Scholar] [CrossRef]
  12. Zhao, Y.; Xiao, F.; Wang, S. An intelligent chiller fault detection and diagnosis methodology using Bayesian belief network. Energy Build. 2013, 57, 278–288. [Google Scholar] [CrossRef]
  13. Zhang, Q.; Zeng, G.; Xiao, C.; Yue, Y. A rule conflict resolution method based on Vague set. Soft Comput. 2014, 18, 549–555. [Google Scholar] [CrossRef]
  14. Bliudze, S.; Simalatsar, A.; Zolotukhina, A. Constraint-Flow Nets: A Model for Building Constraints from Resource Dependencies. In Coordination Models and Languages, Coordination 2017; Jacquet, J.M., Massink, M., Eds.; Lecture Notes in Computer Science; Springer International Publishing Ag: Cham, Switzerland, 2017; Volume 10319, pp. 197–216. [Google Scholar] [CrossRef]
  15. Sun, W. Attribute-Based Policy Evaluation Using Constraints Specification Language and Conflict Detections. Mob. Inf. Syst. 2022, 2022, 5408470. [Google Scholar] [CrossRef]
  16. Leung, T.-C.; Lee, C.-N. Flow-Based DDoS Detection Using Deep Neural Network with Radial Basis Function Neural Network. In Proceedings of the 2022 Asia-Pacific Signal and Information Processing Association Annual Summit and Conference (APSIPA ASC), Chiang Mai, Thailand, 7–10 November 2022; pp. 1774–1779. [Google Scholar] [CrossRef]
  17. Elhassan, H.; Abaker, M.; Abdelmaboud, A.; Rehman, M.B. Requirements Engineering: Conflict Detection Automation Using Machine Learning. Intell. Autom. Soft Comput. 2022, 33, 259–273. [Google Scholar] [CrossRef]
  18. Zhang, Q.; Abdullah, A.R.; Chong, C.W.; Ali, M.H. A Study on Regional GDP Forecasting Analysis Based on Radial Basis Function Neural Network with Genetic Algorithm (RBFNN-GA) for Shandong Economy. Comput. Intell. Neurosci. 2022, 2022, 8235308. [Google Scholar] [CrossRef]
  19. Ismayilova, A.; Ismayilov, M. On the universal approximation property of radial basis function neural networks. Ann. Math. Artif. Intell. 2024, 92, 691–701. [Google Scholar] [CrossRef]
  20. Zhang, Z. Pattern Classification Based on Radial Basis Function Neural Network. In Proceedings of the 2020 5th International Conference on Smart Grid and Electrical Automation (ICSGEA), Zhangjiajie, China, 13–14 June 2020; pp. 213–216. [Google Scholar] [CrossRef]
  21. Sossa, H.; Cortes, G.; Guevara, E. New Radial Basis Function Neural Network Architecture for Pattern Classification: First Results. In Progress in Pattern Recognition Image Analysis, Computer Vision, and Applications, CIARP 2014; BayroCorrochano, E., Hancock, E., Eds.; Lecture Notes in Computer Science; Springer: Berlin, Germany, 2014; Volume 8827, pp. 706–713. [Google Scholar]
  22. Stenkin, D.A.; Gorbachenko, V.I. Solving Problems of Mathematical Physics on Radial Basis Function Networks. Mosc. Univ. Phys. 2024, 79, S706–S711. [Google Scholar] [CrossRef]
  23. Rizaner, F.B.; Rizaner, A. Approximate Solutions of Initial Value Problems for Ordinary Differential Equations Using Radial Basis Function Networks. Neural Process. Lett. 2018, 48, 1063–1071. [Google Scholar] [CrossRef]
  24. Gorbachenko, V.I.; Stenkin, D.A. Physics-Informed Radial Basis-Function Networks. Technol. Phys. 2023, 68, 151–157. [Google Scholar] [CrossRef]
  25. Liu, M.; Peng, W.; Hou, M.; Tian, Z. Radial basis function neural network with extreme learning machine algorithm for solving ordinary differential equations. Soft Comput. 2023, 27, 3955–3964. [Google Scholar] [CrossRef]
  26. Muneeswaran, V.; Rajasekaran, M.P. Performance Evaluation of Radial Basis Function Networks Based on Tree Seed Algorithm. In Proceedings of the IEEE International Conference on Circuit, Power and Computing Technologies (ICCPCT 2016), Nagercoil, India, 18–19 March 2016; pp. 1–4. [Google Scholar] [CrossRef]
  27. Zhao, W.; San, Y. RBF neural network based on q-Gaussian function in function approximation. Front. Comput. Sci. China 2011, 5, 381–386. [Google Scholar] [CrossRef]
  28. Zheng, D.; Jung, W.; Kim, S. RBFNN Design Based on Modified Nearest Neighbor Clustering Algorithm for Path Tracking Control. Sensors 2021, 21, 8349. [Google Scholar] [CrossRef]
  29. Elansari, T.; Ouanan, M.; Bourray, H. Mixed Radial Basis Function Neural Network Training Using Genetic Algorithm. Neural Process. Lett. 2023, 55, 10569–10587. [Google Scholar] [CrossRef]
  30. Ma, T.; Zhang, M.; Ji, Z.; Zhang, S.; Zhang, Y. Construction Risk Monitoring Method of Subway Foundation Pit Engineering Based on Simulated Annealing Neural Network. In Advanced Hybrid Information Processing, ADHIP 2022, Pt II; Fu, W., Yun, L., Eds.; Lecture Notes of the Institute for Computer Sciences Social Informatics and Telecommunications Engineering; Springer International Publishing: Cham, Switzerland, 2023; Volume 469, pp. 571–587. [Google Scholar] [CrossRef]
  31. Likeufack, A.N.; Soh, M. A New Hybrid Algorithm Based on Ant Colony Optimization and Recurrent Neural Networks with Attention Mechanism for Solving the Traveling Salesman Problem. In Research in Computer Science, CRI 2023; Yonta, P.M., Barkaoui, K., Ndoundam, R., Yenke, O.B., Eds.; Communications in Computer and Information Science; Springer International Publishing Ag: Cham, Switzerland, 2024; Volume 2085, pp. 143–153. [Google Scholar] [CrossRef]
  32. Wang, X.; Kou, J.; Zhang, W. Unsteady aerodynamic modeling based on fuzzy scalar radial basis function neural networks. Proc. Inst. Mech. Eng. Part G J. Aerosp. Eng. 2019, 233, 5107–5121. [Google Scholar] [CrossRef]
  33. Tao, W.; Chen, J.; Gui, Y.; Kong, P. Coking energy consumption radial basis function prediction model improved by differential evolution algorithm. Meas. Control 2019, 52, 1122–1130. [Google Scholar] [CrossRef]
Figure 1. Schematic diagram of constraints in cruise ship detailed design.
Jmse 13 02138 g001
Figure 2. Detailed design conflict detection framework for large cruise ships.
Jmse 13 02138 g002
Figure 3. Simplified schematic diagram of water supply system for large cruise ships.
Jmse 13 02138 g003
Figure 4. Design conflict detection constraint network.
Jmse 13 02138 g004
Figure 5. Conflict detection using interval propagation algorithm.
Jmse 13 02138 g005
Figure 6. Flowchart of known constraint conflict detection using interval propagation algorithm.
Jmse 13 02138 g006
Figure 7. Schematic diagram of RBF neural network structure.
Jmse 13 02138 g007
Figure 8. Example of IPSO-RBF parameter encoding.
Jmse 13 02138 g008
Figure 9. IPSO-RBF algorithm flowchart.
Jmse 13 02138 g009
Figure 10. Constraint network for water supply system pipeline design.
Jmse 13 02138 g010
Figure 11. IPSO-RBF convergence curve.
Jmse 13 02138 g011
Figure 12. (a) PSO-RBF convergence curve. (b) AFSA-RBF convergence curve. (c) ACO-RBF convergence curve. (d) SA-RBF convergence curve.
Jmse 13 02138 g012
Table 1. Summary of design parameters for a deck pipeline in the water supply system.
Parameter NameParameter ValueParameter Unit
Daily Potable Water Consumption180.7176 m 3
Peak Water Flow Rate7.5299 m 3 / h
Water Pipe Diameter43.6mm
Water Pipe Nominal Diameter50mm
Water Pipe Wall Thickness1.6mm
Water Pipe Working Pressure0.4MPa
Water Pipe Working Temperature25
Water Pipe Allowable Strength170MPa
Water Pipe Yield Strength200MPa
Water Pipe Allowable Flow Velocity1.4m/s
Table 2. Confusion matrix.
ResultPredicted No Conflict (False)Predicted Conflict (True)
Actual No Conflict (False)TNFP
Actual Conflict (True)FNTP
Table 3. IPSO-RBF parameter setting information.
ParameterValueParameterValue
Input Dimension D10Hidden Layer Nodes H5
IPSO swarm size50Iterations1000
ω max 0.9 ω min 0.4
c 1 max 2.5 c 1 min 1.0
c 2 max 2.5 c 2 min 0.5
L2 Regularization0.001Patience30
V max 0.5
Table 4. Single factor parameter analysis.
FactorParametersIndicator Results
HIPSO Swarm SizeAccuracyPrecisionRecall
H perturbation15087.00%92.55%93.55%
35092.00%93.75%97.83%
55094.00%94.90%98.94%
75087.00%94.51%91.49%
95087.00%94.57%91.58%
IPSO swarm size perturbation51088.00%92.55%94.57%
52091.00%94.68%95.70%
53090.00%90.91%98.90%
54091.00%92.63%97.78%
55094.00%94.90%98.94%
Table 5. Confusion matrix and metric results of IPSO-RBF on the training set.
GroupResultPredicted No ConflictPredicted ConflictAccuracyPrecisionRecall
Group 1Actual No Conflict4892.00%91.67%100.00%
Actual Conflict088
Group 2Actual No Conflict1296.00%97.94%97.94%
Actual Conflict295
Group 3Actual No Conflict6595.00%94.68%100.00%
Actual Conflict089
Table 6. IPSO-RBF model structure from Group 2.
Weights[−0.67025099, −2.49364525, −0.91585792, 0.14586314, −5.87739357]
Centers[0.52616176, 1.02458925, 0.81251088, 0.55559363, 0.20760865, 0.27873516, 0.50252345, −2.15744421, 0.37139416, 0.67012589]
[0.37668359, 0.94724433, 0.07061667, 0.82194, 1.7356109, 0.29383859, 2.68687396, 1.09022627, −0.36405116, 0.67485741]
[0.40619574, 0.6646416, 0.59968156, 0.94369129, 0.51658143, −0.54640833, 0.61709214, 1.07480295, −0.3890624, 0.31044019]
[0.32586364, 0.68590804, 0.69969363, 0.50491914, 0.1732839, 0.30155531, 0.11350109, 0.78604398, 0.74164914, 0.7575413]
[0.43539038, 0.25911238, −0.38461611, 0.20834883, 2.62924535, 0.32966667, 0.73421963, 0.55215741, 0.16153305, 0.55679995]
Widths[0.01017427, 0.29500139, −0.17993421, 0.0351155, 0.42086028]
Table 7. Confusion matrix and metric results of IPSO-RBF on the test set.
ResultPredicted No ConflictPredicted ConflictAccuracyPrecisionRecall
Actual No Conflict1594.00%94.90%98.94%
Actual Conflict193
Table 8. Confusion matrix and metric results of PSO-RBF on the training set.
GroupResultPredicted No ConflictPredicted ConflictAccuracyPrecisionRecall
Group 1Actual No Conflict3892.00%91.75%100.00%
Actual Conflict089
Group 2Actual No Conflict3495.00%95.83%98.92%
Actual Conflict192
Group 3Actual No Conflict0791.00%92.86%97.85%
Actual Conflict291
Table 9. Confusion matrix and metric results of AFSA-RBF on the training set.
GroupResultPredicted No ConflictPredicted ConflictAccuracyPrecisionRecall
Group 1Actual No Conflict1883.00%91.11%90.11%
Actual Conflict982
Group 2Actual No Conflict2394.00%96.84%96.84%
Actual Conflict392
Group 3Actual No Conflict5493.00%95.65%96.70%
Actual Conflict388
Table 10. Confusion matrix and metric results of ACO-RBF on the training set.
GroupResultPredicted No ConflictPredicted ConflictAccuracyPrecisionRecall
Group 1Actual No Conflict3792.00%92.71%98.89%
Actual Conflict189
Group 2Actual No Conflict4495.00%95.79%98.91%
Actual Conflict191
Group 3Actual No Conflict2694.00%93.88%100.00%
Actual Conflict092
Table 11. Confusion matrix and metric results of SA-RBF on the training set.
GroupResultPredicted No ConflictPredicted ConflictAccuracyPrecisionRecall
Group 1Actual No Conflict0890.00%91.84%97.83%
Actual Conflict290
Group 2Actual No Conflict2889.00%91.58%96.67%
Actual Conflict387
Group 3Actual No Conflict0693.88%93.94%98.94%
Actual Conflict193
Table 12. Confusion matrix and metric results of comparison algorithms on the test set.
ResultPredicted No ConflictPredicted ConflictAccuracyPrecisionRecall
PSO-RBFActual No Conflict2588.00%94.51%92.47%
Actual Conflict786
AFSA-RBFActual No Conflict2781.00%91.86%86.81%
Actual Conflict1279
ACO-RBFActual No Conflict1591.00%94.74%95.74%
Actual Conflict490
SA-RBFActual No Conflict0888.00%91.67%95.65%
Actual Conflict488
Disclaimer/Publisher’s Note: The statements, opinions and data contained in all publications are solely those of the individual author(s) and contributor(s) and not of MDPI and/or the editor(s). MDPI and/or the editor(s) disclaim responsibility for any injury to people or property resulting from any ideas, methods, instructions or products referred to in the content.