Abstract
A sediment suspension model is established to predict the sediment movement beneath asymmetric waves, in which the bottom boundary condition for the sediment concentration equation is specified by means of pickup function parameterized by a modified model of the bottom shear stress. The modified model of the bottom shear stress involves velocity and acceleration processes as well as the phase difference between the near-bed orbital velocity and bottom shear stress. Moreover, the phase difference is not a constant in one wave cycle but different in the durations of positive and negative velocities. And the phase differences are parameterized into a function that is dependent on the degree of wave asymmetry based on plenty of numerical data of the boundary layer obtained by large eddy simulation (LES) of oscillatory boundary layer flows. The bottom shear stress calculated by the modified model is compared with those obtained from both the experiments and the LES model, demonstrating that the modified model can capture the unsteady characteristics of the bottom shear stress beneath asymmetric waves accurately. Then, the proposed sediment suspension model is coupled with a numerical wave flume so as to obtain the progressive wave fields and the suspended sediment movement. The velocity and sediment concentration of both reduced- and large-scale hydrodynamic conditions calculated by the coupled model are compared with experimental data with a good agreement, suggesting reliability of the proposed model to predict sediment transport induced by asymmetric waves.
1. Introduction
Wave-induced sediment transport is one of the most important problems in coastal engineering, which has a significant influence on human activities [1]. In the ocean, as waves are approaching the shore, the nonlinearity of waves becomes stronger, presenting shorter and higher crests as well as shallower and longer troughs prior to breaking [2,3]. And the nonlinear characteristics of waves can be described by the asymmetry of orbital velocity variations or acceleration variations [4], which play an important role in sediment transport in coastal areas [5]. Here, the wave with asymmetric velocity (namely the magnitudes of the maximum and minimum velocities are unequal) is concerned and the sediment transport under asymmetric waves is investigated.
So far, sediment movement beneath nonlinear waves has been simulated based on various numerical models. The essential difference in these models is how to specify the bottom boundary condition of the sediment transport equation, which is fundamentally associated with the bottom shear stress. Therefore, it is of crucial significance to properly describe the bottom shear stress beneath an asymmetric wave in order to formulate a reliable sediment suspension model under asymmetric waves. In the previous literature, researchers have developed a few parameterization methods to attain this purpose for general cases of waves.
A common approach to specify the bottom shear stress is generally based on a rough wall logarithmic law, which has been widely applied by many scholars. Hsu and Liu [6] developed a two-dimensional depth- and phase-resolving suspended sediment model based on single- and two-phase flow approaches, in which the bottom shear stress is determined by logarithmic law. Amoudry et al. [7,8] implemented a two-dimensional Reynolds-averaged Navier–Stokes model with sand ripple-averaged approach to reproduce experiments of wave-induced sediment movement in a large-scale wave flume, where the wall logarithmic law is also employed to calculate friction velocity. Kim et al. [9] developed a multi-phase Eulerian model for wave-induced sediment transport, coupling with Interform and waves2Foam. However, the wall logarithmic law used in these models is obtained from steady flows, while the behavior of boundary layers under waves here is far different from steady flow [10,11]. For steady flows, the bottom shear stress relies purely on the velocity profile, which generally obeys the logarithmic low in practice. Nonetheless, the wave-induced flow is unsteady, and the velocity profile is time-dependent or phase-dependent. Most importantly, the velocity profile does not obey the logarithmic law, especially near the phases of flow reversal. The unsteady characteristics of wave-induced bottom shear stress are worthy of particular attention, such as the phase difference between the bottom shear stress and the free stream velocity. As mentioned in Tanaka (1988) [12], the acceleration effect has a significant impact on the bottom shear stress under nonlinear waves. But the above-mentioned parameterization methods directly relate the bottom shear stress to the near-bed horizontal velocity outside boundary layers via the logarithmic law, while the phase difference between the near-bed velocity and the bottom shear stress as well as the acceleration effect is not considered.
In addition to the wall logarithmic law, the near-bed turbulence quantities have been proposed to model the bottom shear stress. Vittori [13] studied the relationship between the bottom shear stress of first-order Stokes waves and turbulence characteristics obtained by means of a direct numerical simulation and found that the turbulence production could better describe the sediment pickup rate, which is the capacity of the flow to put the sediment into suspension. But due to the cost of time and computing resources, he just modeled oscillatory flows rather than progressive wave fields. Amoudry et al. [14] mentioned that the near-bed turbulent kinetic energy can be employed to calculate the bottom shear stress and argued that the turbulence quantities can better predict the distribution of sediment concentration than wall logarithmic law by assessing all three bottom boundary conditions. Nonetheless, this approach should rely on precise numerical computation of the turbulence in the near-bottom boundary layer, which has a high cost that impedes its application.
Apart from the above two approaches, the third kind of alternative is to model the bottom shear stress of a turbulent boundary layer of waves by means of extending the analytical solution of the laminar boundary layer of waves. Nielsen [15] presented a bottom shear stress model in laminar flows, which consists of velocity and acceleration terms with the phase difference of 45° between the near-bed orbital velocity and bottom shear stress. Moreover, Tanaka and Thu [16] showed that the phase difference varies from 45° to 10° in the turbulent flow. Then, Nielsen [17], Nielsen and Callaghan [18] and Nielsen [19] modified the model to estimate sediment transport rate and pointed out that the phase difference is from 40° to 51° by comparing with experiment data. Here, the phase difference is acquired from the experiment data of sediment transport rate rather than directly from analyzing the variation in the bottom shear stress. Gonzalez-Rodriguez and Madsen [20] proposed a simple model of bed shear stress under nonlinear waves, in which the time-varying phase difference is considered through linear interpolation between the values of the wave crest and wave trough. Nonetheless, the acceleration effect was not considered in this model, leading to underestimated results compared with the experiment data of Watanabe and Sato [4]. Suntoyo [21] also modified the model which is only suitable for saw-tooth waves. It is reasonable to conclude that Nielsen’s model is a feasible choice for simulating the bottom shear stress, but the phase difference used in the model needs to be further researched.
In the present work, with the aim of establishing a suspended sediment transport model of asymmetric waves, the phase difference between the near-bed orbital velocity and the bottom shear stress beneath asymmetric waves is formulated as a function of the degree of wave asymmetry (a ratio of crest velocity and velocity amplitude) based on the data obtained by large eddy simulation of the boundary layer behavior of asymmetric waves. The formulated phase difference is then used to modify the bottom shear stress, which is well validated by comparing with experimental data and the numerical results of asymmetric waves. The modified bottom shear stress is further applied to accurately quantify the sediment pickup function by asymmetric waves and specify the bottom boundary condition of sediment transport equation. In this way, a suspended sediment transport model for asymmetric waves is developed. The numerical results of velocity and sediment concentration obtained by this model for both reduced- and large-scale conditions are compared with experiment data, demonstrating good performance of the proposed suspended sediment transport model for asymmetric waves.
2. Description of Sediment Transport Model
A classical sediment transport model coupling with a numerical wave flume is established to reproduce the sediment movement under asymmetric waves, called the suspended sediment model. The hydrodynamic characteristics are obtained by the two-dimensional Reynolds-averaged Navier–Stokes equations (RANS), and the VOF method is employed to capture the free surface of waves. The suspended sediment concentration could be acquired by solving a convection–diffusion equation and the turbulence model is applied to solve the turbulence. Based on the model, the spatial and temporal distribution of sediment concentration and hydrodynamic variables can be obtained. We first introduce the governing equations and the boundary conditions before showing the numerical solution and analysis results.
2.1. Governing Equations
The numerical wave flume for unsteady, incompressible, viscous, Newtonian fluid is governed by the RANS equations.
where is velocity in the th direction, is the ith direction coordinate, is the fluid density, is the ith component of the gravitational acceleration, is the fluid dynamic pressure, and is the dynamic viscous coefficient, composed by the molecular dynamic viscosity of fluid and the turbulent viscosity .
The turbulence model, composed by the turbulence kinetic energy equation and the turbulence dissipation rate equation, is shown as follows:
where is the turbulence production, in which , and the classical empirical values of the constant [22] in the model can be given by
Then, the turbulent eddy viscosity can be acquired as follows:
where .
The VOF method is employed to track the free surface location of waves, which is already proposed by Hirt and Nichols (1981) [23], and the volume fraction is defined to make the N–S equations of gas phase and liquid phase solve together, which is expressed as
where is the water density, is the gas density, is the water dynamic viscous coefficient, and is the gas dynamic viscous coefficient. The volume fraction satisfies the transport equation
where is the interfacial compression velocity.
The suspended sediment concentration is obtained from an advection–diffusion-settling equation
where εs is sediment diffusivity coefficient and is the sediment settling velocity in the vertical direction, which is provided in van Rijn (1993) [24].
2.2. Boundary Condition
At the free surface, the boundary condition of the turbulence quantities enforces zero normal gradient, and the sediment concentration uses the no-flux condition. At the inlet, the stream function theory [25] is used to generate specified asymmetric waves required in the numerical domain, which is expressed as
where x is the horizontal coordinate with its origin at the far left of the numerical wave flume, z is the vertical coordinate with its origin at the mean water line, h is the depth of water, L is wave length, and is wave velocity. is a set of coefficients that determines all characteristics of the wave system, and N represents the order of the stream function. According to Dean (1965) [25], higher accuracy of the theory can be achieved with larger N and the result obtained based on the eleventh-order stream function is accurate enough for non-breaking waves. In the present study, a twenty-fifth-order stream function is utilized for all wave conditions. And it should be noted that the 2-D numerical wave flume can simulate periodic waves, irregular waves, and the superposition of waves and currents. The asymmetric waves are only focused on in our study.
At the outlet, a sponge layer is employed to minimize wave reflection and a zero-gradient condition is adopted for the sediment concentration.
The no-slip condition is applied for the bottom boundary condition for the flow. For the turbulence calculations, and satisfy the following equations [8,26]:
in which is the elevation above the bed and .
In order to simulate the sediment pickup from the bed, the approach based on pickup function is adopted as the bottom boundary condition of sediment concentration, which is specified as the function of the bed shear stress. Due to the boundary condition of zero concentration at the inlet, the bed is the only source of suspended sediment. Then, a set of equations, following Garcia and Parker (1991) [27], are used to specify the bottom boundary condition, which read as follows:
where
and
where εs is the sediment diffusivity coefficient, ws is the sediment settling velocity in the vertical direction, Eu is the bottom sediment flux, C0 is the reference concentration, θu is the Shield number, ρw is the water density, is the sediment density, g is the acceleration of gravity in the vertical direction, d is the sediment diameter, is the ripple height, is the ripple length, and is the critical shield parameter for incipient motion, the calculating methods for which can be found in van Rijn (1993) [24]. is the bottom shear stress, the calculated method of which will be discussed in detail in Section 3.
The reference concentration following van Rijn (2007) [28] can be described by
where d is the sediment diameter, is the reference height, is the kinematic viscosity of water, and s is the density ratio of sediment to water, equal to 2.65 in the present study.
2.3. Sediment Diffusivity
There are three classical models for sediment diffusivity coefficient profiles to describe the diffusion process of sediment beneath waves, of which the first is constant [15], the second is a three-layer structure [24] for the whole water column, and the third is the linear increase with height [29,30]. In the present model, the expression of linear profiles [31] is employed, shown as follows:
where
and
in which is the ratio of the sediment diffusion coefficient to the turbulent diffusion coefficient, is the Von karman constant, is the scale of sediment exchange, is the velocity amplitude near bed, is the maximum friction velocity, is the sediment distribution coefficient of the wave convective mechanism, and δ is the boundary thickness beneath waves—see Li and Lu (2016) [31] for details.
2.4. Numerical Implementation
In the present study, a numerical wave flume is established to reproduce the asymmetric wave fields with given wave parameters. The numerical domain is long enough to acquire stable wave fields and sediment concentration fields, and the sections of generating waves and absorbing waves are located on the inlet boundary and outlet boundary, respectively, with length equal to a wave length. The sediment motion under wave is a quasi-steady process, so 60 periods for the same sediment concentration of adjacent cycle are simulated. Note that the data of the last 10 periods are analyzed here.
The finite volume method is employed to discretize the series of equations in the present model, and the difference scheme of the Gaussian method is adopted. The PIMPLE method [32] is used to literately solve the RANS equations, and a non-staggered grid system is employed. The Euler scheme is used to discretize time derivatives. The advection terms are discretized by using upwind scheme and a central difference method is employed in the viscous dissipation terms. Similar algorithms are also adopted to discretize the turbulence equations and the sediment concentration equation.
3. Modeling Bottom Shear Stress
3.1. Previous Models
There are many methods to calculate bottom shear stress of nonlinear waves. And for many sediment transport models, the rough wall logarithmic law is commonly employed to calculate the friction velocity [8,33]:
where is the friction velocity, u is the near-bed velocity parallel to the bed, and ks is the roughness.
In this numerical model, the velocity at the first grid is used to acquire the friction velocity, and the location of the first grid in the vertical direction is set small enough in order to satisfy the precision requirement of wall logarithmic law. As a result, the existing model is time consuming and uneconomic as the simulation of many wave periods is required. In addition, the phase difference between the near-bed velocity and bottom shear stress as well as the acceleration effect is not taken into account in this existing model.
Nielsen [17] extended the theoretical solution of bottom shear stress in laminar flow condition to the turbulent cases for nonlinear waves, which consists of the velocity and acceleration terms. Here, can be expressed as
Then, the bottom shear stress could be reasonably derived through the definition
where is the wave friction factor and is the phase difference between the bottom shear stress and free stream velocity. In laminar oscillatory, the phase difference is theoretically 45° [15]. However, for turbulent flows (the practical case), the phase difference is not well established. Nielsen [17] suggested for turbulent flows by fitting experiment data of sediment transport.
3.2. Modified Model
In order to acquire a more accurate value of the phase difference instead of just fitting with experiment data to quantify the bottom shear stress of turbulent flow, the process of the bottom shear stress in case of asymmetric waves is analyzed in detail by LES.
The boundary layer flow induced by an asymmetric wave can be modeled by oscillating an infinite horizontal plate with its asymmetric velocity, as was reported by Li et al. [34] who adopted the LES approach to solve the boundary layer flow beneath the cnoidal wave with the spatially filtered 3-D Navier–Stokes equations and Smagorinsky subgrid model [35]. In Li’s LES model, the periodic span-wise and stream-wise boundary conditions are utilized, and the near-bed orbital velocity beneath asymmetric waves is employed as the bottom boundary condition. During the simulation, the finite volume methods and the Gaussian difference scheme on a non-staggered grid system are applied. The model has been verified for a fully developed turbulent regime, as was detailed by Li et al. [34].
Hence, the phase difference between the near-bed velocity and bottom shear stress is found to be different at the wave crest and wave trough, respectively. The numerical values of the phase difference at the wave crest and wave trough are plotted in Figure 1 and Figure 2, respectively, where As is the degree of asymmetry of the near-bed orbital velocity that is used to characterize wave asymmetry in the phase difference model, defined as , in which and are the maximum and minimum velocity, respectively, as shown in Figure 3. It can be seen from Figure 1 and Figure 2 that the phase differences at both the wave crest and wave trough are dependent on the degree of asymmetry of the near-bed orbital velocity.
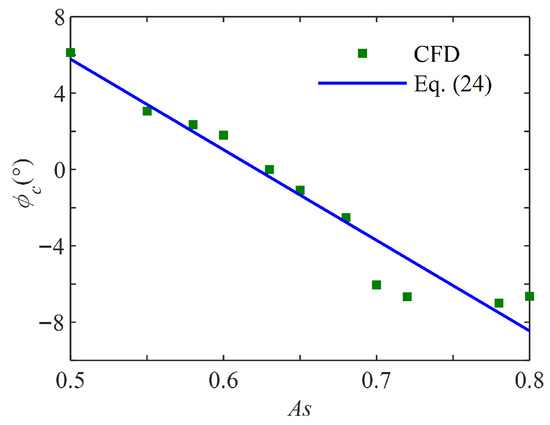
Figure 1.
Phase difference of wave crest.

Figure 2.
Phase difference of wave trough.

Figure 3.
Schematic diagram of the phase difference of asymmetric wave velocity.
By means of curve fitting, the phase differences at the wave crest and wave trough can be expressed as
where and are the phase difference at the wave crest and wave trough, respectively, as shown in Figure 3.
In this way, a piecewise formula of friction velocity can be obtained
where is proposed by Nielsen (2002) [17], ω is the wave frequency, and z0 = ks/30 is the roughness height.
In our study, the near-bed orbital velocity can be given by the RANS model, which generally is the velocity at the first grid. The piecewise formula of friction velocity can simplify the calculation of the bottom shear stress in sediment transport model. Due to the limitation of phase differences formula, the sediment model is only applicable to asymmetric waves.
3.3. Comparison with Experimental and Numerical Data
To further validate the ability of the modified model to predict the bottom shear stress, the comparisons of the modified model with experiment data and numerical results of the oscillatory flows are conducted. The experiment conditions of the section are given in Table 1 and Table 2, where h is the wave depth, T is the wave period, H is the wave height, and ks is the Nikuradse sand roughness. For the numerical conditions, As is set to 0.55, 0.6, 0.65 and 0.7, respectively, and the boundary layer Reynolds number () is set to 4000.

Table 1.
Parameters of the reduced-scale wave flume experiment [31].

Table 2.
Main experiment parameters of oscillating water tunnel.
Figure 4 presents the comparison of the maximum friction velocity between the modified model and experiment data, where the squares represent the data of wave flume conditions and the diamonds and circles represent the data of oscillating tunnel conditions. And it is evident that the modified model can well predict the shear stress in the magnitude.

Figure 4.
Comparison of the maximum friction velocity of the modified model with experiment data [10,21,31].
In order to further test the modified model, two tests from Jonsson and Carlsen (1976) [10] are chosen and simulated. In these cases, a sinusoidal oscillating flow with little asymmetry due to the natural frequency is focused. As shown in Figure 5, the bottom shear stress obtained via Equation (26), with the modified friction velocity, agrees with experimental data very well. In the meantime, the bottom shear stress obtained via Equation (22) with φ = 51°, the unmodified friction velocity, is also plotted in Figure 5, demonstrating that the modified model behaves much better than the unmodified one in terms of not only the phase difference but also the extremums.
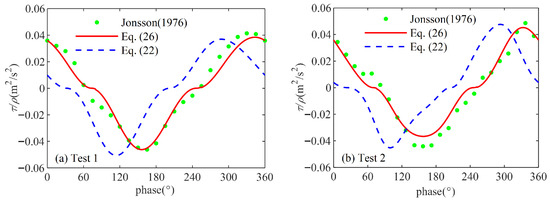
Figure 5.
Comparison of the bottom shear stress of the modified model with the results of the unmodified models and the experimental data [10]. (a) Test 1; (b) Test 2.
Comparisons are also made between the bottom shear stress of the modified model and the numerical ones of oscillatory flows with different As, shown in Figure 6. It can be seen that the modified model can capture the characteristics of the bottom shear stress of asymmetric waves and the agreement between the results of the modified model and the oscillatory flows is very good except at the phases at which the bottom shear stress is almost zero. Nonetheless, this discrepancy has little effect on sediment suspension because the bottom shear stress at these phases is too small to pick sediment particles up into the water. In the meantime, the bottom shear stress obtained via Equation (22) with φ = 51°, the unmodified friction velocity, is also plotted in Figure 6, which also demonstrates that the modified model behaves much better than the unmodified one in terms of not only the phase difference but also the extremums. The bottom shear stress directly determines the timing of sediment pickup during the wave cycle. Therefore, the modified model can be employed to parameterize the pickup function for the sediment suspension model.
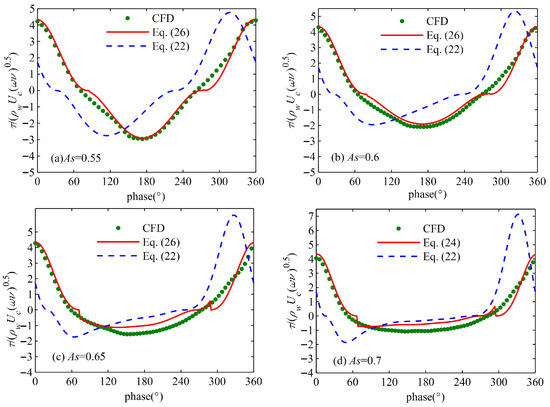
Figure 6.
Comparison of the bottom shear stress of the modified model with the results of the unmodified models and LES model at different degrees of asymmetry. (a) As = 0.55; (b) As = 0.6; (c) As = 0.65; (d) As = 0.7.
4. Results
Based on the modified model of the bottom shear stress stated in Section 3, the sediment transport model described in Section 2 is reasonably closed. In this section, two sets of experimental data of asymmetric waves are employed to test this sediment transport model in case of asymmetric waves, including wave fields and sediment concentration. One is the reduced-scale experiment carried out by Li and Lu (2016) [31] and the other is the large-scale one conducted by Lohmann et al. (2006) [35]. The parameters are provided in Table 1 and Table 3, respectively.

Table 3.
Parameters of the large-scale wave flume experiment.
4.1. Hydrodynamic Characteristics
Firstly, the numerical wave field is validated. The velocity distribution and the free surface displacement of asymmetric waves have been compared with the reduced- and large-scale experiment data to test the numerical wave flume by using the parameters of Case N3 and Case C2, respectively. As shown in Figure 7 and Figure 8, the results of wave free surface agree very well with theoretical results for both the reduced- and large-scale experiments. Figure 9 and Figure 10 present the comparison between the periodic distribution of horizontal velocity of the theoretical and numerical results. It is evident that the numerical wave flume can reproduce similar wave characteristics compared with experimental data. Therefore, it can be concluded that the numerical wave flume is sufficient to predict the hydrodynamic characteristics of asymmetric waves.
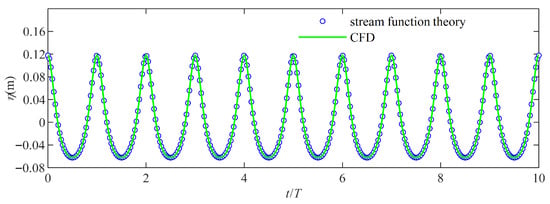
Figure 7.
Comparison of the wave free surface of theoretical and numerical model results of Case N3. The circles are the results of stream function theory, and the line is the numerical wave flume results.

Figure 8.
Comparison of the wave free surface of theoretical and numerical model results of Case C2. The circles are the results of stream function theory, and the line is the numerical wave flume results.
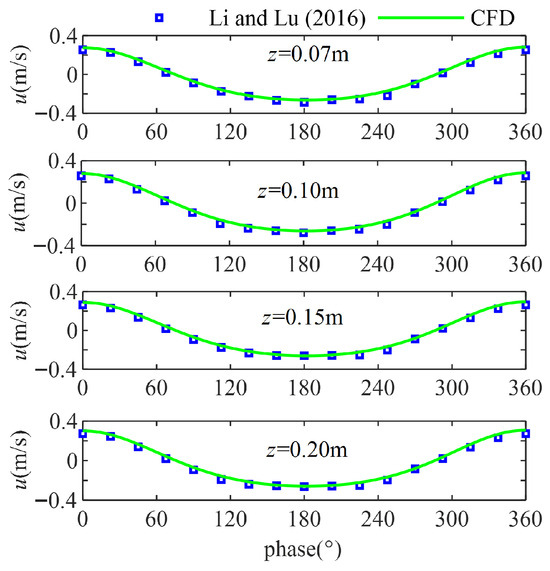
Figure 9.
Comparison of the horizontal velocity of the numerical model results with experimental data of Case N3. The squares are the experimental data, and the line is the numerical wave flume results [31].
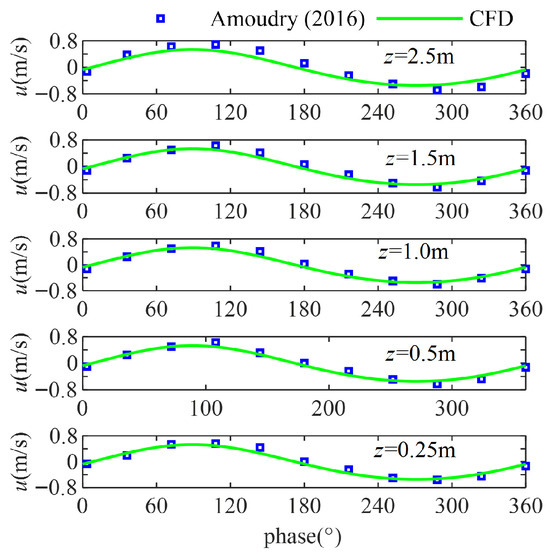
Figure 10.
Comparison of the horizontal velocity of the numerical model results with experimental data of Case C2. The squares are the experimental data, and the line is the numerical wave flume results [14].
4.2. Sediment Concentration
Secondly, the sediment transport model is tested by comparing the vertical distribution of periodically averaged concentration based on the present numerical simulations and experiment data, as shown in Figure 11 and Figure 12. Figure 11 displays the comparison between the numerical results and the experiment data obtained from Li and Lu (2016) [31] under the reduced-scale experiment conditions. It can be found that the numerical results show good agreement with the experimental data. Meanwhile, Figure 12 presents both the numerical results and the experiment data obtained from Thorne et al. (2002) [36] under the large-scale experiment conditions. And the agreement between the numerical results and the experimental data is very good, except for a little discrepancy at the region far away from the bed. These errors may come from the turbulent model, which ignores some characteristic in turbulent boundary layer and sediment resuspension such as turbulent bursts higher in the water column. It should be noted that the selected experimental data covers the conditions of different wave height, wave period, and sediment diameter, which allows reasonable validation of the prediction of the sediment transport model. Therefore, the conclusion can be drawn that the sediment transport model is capable of accurately reproducing the sediment transport process under asymmetric waves. Meanwhile, it is indicated that the modified model of the bottom shear stress is feasible for the sediment transport model.
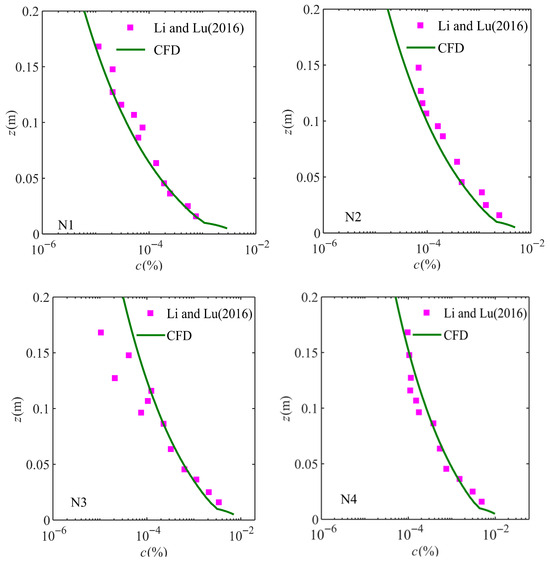
Figure 11.
Comparison for the wave-averaged volumetric concentration profiles under reduced-scale experiment conditions. The solid squares represent the pump sample concentration from Li and Lu (2016) [31].
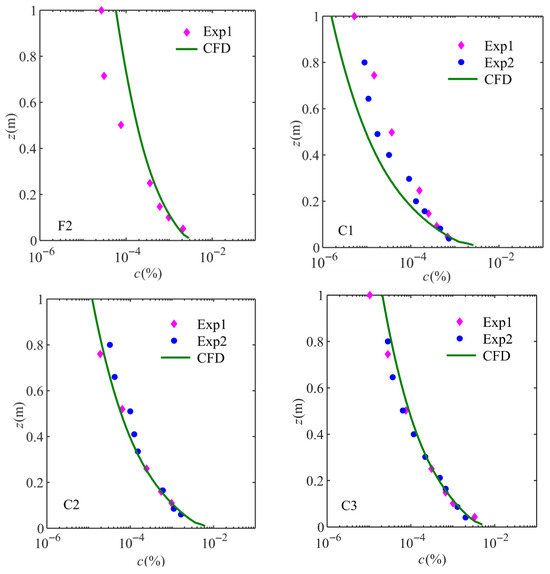
Figure 12.
Comparison for the wave-averaged volumetric concentration profiles under large-scale experiment conditions. The solid diamonds (Exp1) represent the pump sample concentration, and the solid circle (Exp2) is the ABS data from Thorne et al. (2002) [36].
5. Conclusions
A suspended sediment transport model is developed to reproduce the sediment suspension beneath asymmetric waves, in which the numerical wave flume is employed to simulate the wave fields and the sediment concentration is obtained by the sediment transport model. In particular, a modified model of the bottom shear stress beneath asymmetric waves is proposed to parameterize the pickup function of sediment, which is in turn used to reasonably specify the bottom boundary condition of sediment transport equation.
Sediment transport is fundamentally influenced by the bottom shear stress of flows. For turbulent boundary layers of waves, the bottom shear stress is dependent not only on the velocity but also on the acceleration process as well as the phase difference between the near-bed orbital velocity and the bottom shear stress. For asymmetric waves, the phase difference is not constant in a wave cycle and should be resolved in the durations of the crest and the trough of the velocity process, respectively. Therefore, the phase differences in the durations of positive and negative velocities are, respectively, parameterized into the functions of the degree of wave asymmetry based on plenty of numerical data of the boundary layer obtained by large eddy simulation (LES) of oscillatory boundary layer flows. These parameterizations of the phase difference are used to modify the previous model of the bottom shear stress. The modified model can well capture the unsteady characteristics of the bottom shear stress beneath asymmetric waves.
For sediment transport induced by asymmetric waves, the bottom boundary condition of sediment concentration equation can be specified by the pickup function of sediment, but the bottom shear stress in the pickup function should be replaced by the modified expression that considers the phase difference between the near-bed orbital velocity and the bottom shear stress in different durations of wave cycles. The sediment transport model proposed with this approach can well reproduce the experimental data of sediment concentration of both reduced- and large-scale conditions in case of asymmetric waves. Therefore, the proposed model is capable of accurately predicting the sediment transport under asymmetric waves.
Author Contributions
Conceptualization, J.Z.; methodology, J.Z. and Y.X.; software, Y.X.; validation, Y.X. and X.W.; formal analysis, Y.X.; investigation, Y.X. and J.D.; resources, Y.X. and J.Z.; Experimental data analyzing, Y.L. and S.L.; writing—original draft preparation, Y.X.; writing—review and editing, J.Z. and J.D.; visualization, Y.X. and X.W.; supervision, J.Z.; project administration, Y.X. and J.Z.; funding acquisition, Y.X. and J.Z. All authors have read and agreed to the published version of the manuscript.
Funding
This research was funded by the National Key R&D Program of China (2022YFC3204303), the National Natural Science Foundation of China (12202503, 52394254, 12132018) and the Special Project for Basic Research Funds of China Institute of Water Resources and Hydropower Research (SE110145B0012025).
Data Availability Statement
The original contributions presented in this study are included in the article. Further inquiries can be directed to the corresponding author.
Conflicts of Interest
The authors declare no conflicts of interest.
Abbreviations
The following abbreviations are used in this manuscript:
| LES | Large Eddy Simulation |
References
- Zhang, Z.; Feng, X.; Fan, X.; Lin, Y.; Zhu, C. Impact of Internal Solitary Waves on Marine Suspended Particulate Matter: A Review. J. Mar. Sci. Eng. 2025, 13, 1433. [Google Scholar] [CrossRef]
- Spiliotopoulos, G.; Katsardi, V. Nonlinear Effects on the Formation of Large Random Wave Events. J. Mar. Sci. Eng. 2025, 13, 1516. [Google Scholar] [CrossRef]
- Stokes, G.G. On the theory of oscillatory waves. Trans. Camb. Philos. Soc. 1847, 8, 441–455. [Google Scholar]
- Watanabe, A.; Sato, S. A sheet-flow transport rate formula for asymmetric, forward-leaning waves and currents. In Coastal Engineering; World Scientific: Singapore, 2004; pp. 1703–1714. [Google Scholar] [CrossRef]
- Zulberti, A.; Jones, N.L.; Ivey, G.N. Observations of Enhanced Sediment Transport by Nonlinear Internal Waves. Geophys. Res. Lett. 2020, 47, e2020GL088499. [Google Scholar] [CrossRef]
- Hsu, T.-J.; Liu, P.L.-F. Toward modeling turbulent suspension of sand in the nearshore. J. Geophys. Res. 2004, 109, C06018. [Google Scholar] [CrossRef]
- Amoudry, L.; Hsu, T.-J.; Liu, P.L.-F. Schmidt number and near-bed boundary condition effects on a two-phase dilute sediment transport model. J. Geophys. Res. 2005, 110, C09003. [Google Scholar] [CrossRef]
- Amoudry, L.O.; Bell, P.S.; Thorne, P.D.; Souza, A.J. Toward representing wave-induced sediment suspension over sand ripples in RANS models. J. Geophys. Res. Ocean. 2013, 118, 2378–2392. [Google Scholar] [CrossRef]
- Kim, Y.; Cheng, Z.; Hsu, T.J.; Mieras, R.S.; Puleo, J.A. A numerical investigation of sheet flow under non-breaking and breaking waves. In Proceedings of the Coastal Dynamics Conference, Helsingør, Denmark, 12–16 June 2017. [Google Scholar]
- Jonsson, I.G.; Carlsen, N.A. Experimental and theoretical investigations in an oscillatory turbulent boundary layer. J. Hydraul. Res. 1976, 14, 45–60. [Google Scholar] [CrossRef]
- Tanaka, H.; Chian, C.S.; Shuto, N. Experiments on an oscillatory flow accompanied with a unidirectional motion. Coast. Eng. Jpn. 1983, 26, 19–37. [Google Scholar] [CrossRef]
- Tanaka, H. Bed load transport due to non-linear wave motion. In Coastal Engineering 1988 Proceedings; ASCE: Reston, VA, USA, 1988; Chapter 133; pp. 1803–1817. [Google Scholar] [CrossRef]
- Vittori, G. Sediment suspension due to waves. J. Geophys. Res. 2003, 108, 3173. [Google Scholar] [CrossRef]
- Amoudry, L.O.; Souza, A.J.; Thorne, P.D.; Liu, P.L.-F. Parameterization of intrawave ripple-averaged sediment pickup above steep ripples. J. Geophys. Res. Ocean. 2016, 121, 658–673. [Google Scholar] [CrossRef]
- Nielsen, P. Coastal Bottom Boundary Layers and Sediment Transport; Advanced Series on Ocean Engineering; World Scientific Publication: Singapore, 1992; Volume 4. [Google Scholar] [CrossRef]
- Tanaka, H.; Thu, A. Full-range equation of friction coefficient and phase difference in a wave-current boundary layer. Coast. Eng. 1994, 22, 237–254. [Google Scholar] [CrossRef]
- Nielsen, P. Shear stress and sediment transport calculations for swash zone modeling. Coast. Eng. 2002, 45, 53–60. [Google Scholar] [CrossRef]
- Nielsen, P.; Callaghan, D.P. Shear stress and sediment transport calculations for sheet flow under waves. Coast. Eng. 2003, 47, 347–354. [Google Scholar] [CrossRef]
- Nielsen, P. Sheet flow sediment transport under waves with acceleration skewness and boundary layer streaming. Coast. Eng. 2006, 53, 749–758. [Google Scholar] [CrossRef]
- Gonzalez-Rodriguez, D.; Madsen, O.S. Seabed shear stress and bedload transport due to asymmetric and skewed waves. Coast. Eng. 2007, 54, 914–929. [Google Scholar] [CrossRef]
- Suntoyo; Tanaka, H.; Sana, A. Characteristics of turbulent boundary layers over a rough bed under saw-tooth waves and its application to sediment transport. Coast. Eng. 2008, 55, 1102–1112. [Google Scholar] [CrossRef]
- Rodi, W. Examples of calculation methods for flow and mixing in stratified fluids. J. Geophys. Res. 1987, 92, 5305–5328. [Google Scholar] [CrossRef]
- Hirt, C.W.; Nichols, B.D. Volume of fluid (VOF) method for the dynamics of free boundaries. J. Comput. Phys. 1981, 39, 201–205. [Google Scholar] [CrossRef]
- van Rijn, L.C. Principles of Sediment Transport in Rivers, Estuaries and Coastal Seas; Aqua Publications: Amsterdam, The Netherlands, 1993. [Google Scholar]
- Dean, R.G. Stream function representation of nonlinear ocean waves. J. Geophys. Res. 1965, 70, 4561–4572. [Google Scholar] [CrossRef]
- Hagatun, K.; Eidsvik, K.J. Oscillating turbulent boundary layer with suspended sediments. J. Geophys. Res. 1986, 91, 13045–13055. [Google Scholar] [CrossRef]
- Garcia, M.; Parker, G. Entrainment of bed sediment into suspension. J. Hydraul. Eng. 1991, 117, 414–435. [Google Scholar] [CrossRef]
- van Rijn, L.C. Unified view of sediment transport by currents and waves. II: Suspended transport. J. Hydraul. Eng. 2007, 133, 668–689. [Google Scholar] [CrossRef]
- Grant, W.D.; Madsen, O.S. Combined wave and current interaction with a rough bottom. J. Geophys. Res. 1979, 84, 1797–1808. [Google Scholar] [CrossRef]
- Lee, T.H.; Hanes, D.M. Comparison of field observations of the vertical distribution of suspended sand and its prediction by models. J. Geophys. Res. 1996, 101, 3561–3572. [Google Scholar] [CrossRef]
- Li, S.Q.; Lu, Y.J. Sediment Transport Process in Wave-Current Boundary Layer; Hohai University Press: Nanjing, China, 2016. (In Chinese) [Google Scholar]
- Jasak, H. Error Analysis and Estimation for the Finite Volume Method with Applications to Fluid Flows. Ph.D. Thesis, Department of Mechanical Engineering, Imperial College of Science, London, UK, 1996. [Google Scholar]
- Sumer, B.M.; Kozakiewicz, A.; Fredsøe, J.; Deigaard, R. Velocity and concentration profiles in sheet-flow layer of movable bed. J. Hydrogr. Eng. 1996, 122, 549–558. [Google Scholar] [CrossRef]
- Li, Y.J.; Chen, J.B.; Zhou, J.F.; Zhang, Q. Large eddy simulation of boundary layer flow under cnoidal waves. Acta Mech. Sin. 2016, 32, 22–37. [Google Scholar] [CrossRef]
- Lohmann, I.P.; Fredsøe, J.; Sumer, B.M.; Christensen, E.D. Large Eddy Simulation of the ventilated wave boundary layer. J. Geophys. Res. 2006, 111, C06036. [Google Scholar] [CrossRef]
- Thorne, P.D.; Williams, J.J.; Davies, A.G. Suspended sediments under waves measured in a large-scale flume facility. J. Geophys. Res. 2002, 107, 3178. [Google Scholar] [CrossRef]
Disclaimer/Publisher’s Note: The statements, opinions and data contained in all publications are solely those of the individual author(s) and contributor(s) and not of MDPI and/or the editor(s). MDPI and/or the editor(s) disclaim responsibility for any injury to people or property resulting from any ideas, methods, instructions or products referred to in the content. |
© 2025 by the authors. Licensee MDPI, Basel, Switzerland. This article is an open access article distributed under the terms and conditions of the Creative Commons Attribution (CC BY) license (https://creativecommons.org/licenses/by/4.0/).