Article

Analysis of Carbon Impacts of the Sanya Bay Ecological Restoration Project

1
State Key Laboratory of Hydraulic Engineering Intelligent Construction and Operation, Tianjin University, Tianjin 300350, China
2
Shanghai Municipal Engineering Design Institute (Group) Co., Ltd., Shanghai 200000, China
*
Author to whom correspondence should be addressed.
J. Mar. Sci. Eng. 2025, 13(11), 2126; https://doi.org/10.3390/jmse13112126
Submission received: 15 September 2025 / Revised: 31 October 2025 / Accepted: 6 November 2025 / Published: 10 November 2025

Abstract

As global warming and the greenhouse effect become increasingly evident, and in response to the “Carbon Peak” and “Carbon Neutrality” policies, extensive research has been conducted on “blue carbon” sinks in marine and coastal zones. Due to their low cost and flexibility, hydro-eco coupled numerical modeling has emerged as a prominent method for studying carbon sequestration. This study employs a two-dimensional NPZD (Nutrient-Phytoplankton-Zooplankton-Detritus) framework coupled with tidal flow dynamics to analyze changes in flow fields, ecological benefits, and carbon sequestration effects before and after the restoration project in Sanya Bay. Additionally, the impact of planting seagrass seedlings near the artificial island on carbon sequestration is investigated. The seagrass restoration achieved approximately 0.57 Mg C sequestration within one month. The project has achieved remarkable benefits. According to different working condition examples, the annual carbon sink of the artificial island and the sand replenishment restoration has increased by 83.83 Mg compared with that before the restoration.

1. Introduction

Since the Industrial Revolution, global carbon emissions have significantly increased. From 1850 to 2020, anthropogenic carbon emissions accumulated to over 46 billion tons, with 70% stemming from fossil fuel emissions [1]. The surge in CO2 emissions has exacerbated climate change, leading to global warming and a series of extreme weather events or natural disasters, causing tremendous destruction and immeasurable losses to terrestrial, nearshore, and offshore ecosystems [2,3]. Emission reduction and carbon sequestration enhancement are two fundamental pathways to achieving carbon neutrality [4,5]. The ocean, as the largest carbon reservoir on Earth, holds approximately 20 times the carbon stock of terrestrial ecosystems and 50 times that of the atmosphere [6]. Compared to other ecosystems, the ocean ecosystem has a powerful carbon storage capacity and anaerobic environment, enabling long-term carbon sequestration. It can absorb CO2 and greenhouse gases from the atmosphere through the biological carbon pump, which is crucial for mitigating and adapting to climate change [7]. However, excessive development and natural transformations during economic growth can lead to various unpredictable consequences, thereby damaging the environment, affecting the normal function of ecosystem carbon pumps, and even causing stored carbon reservoirs to leak. Consequently, analyzing the ocean’s carbon sink capacity, assessing the carbon sequestration effects of ecological restoration and understanding the impact of human activities on carbon sinks have become important research topics [8]. Tang et al. [9] analyzed the marine aquaculture yield of shellfish and seaweed in China from 1999 to 2008, demonstrating that the cultivation of shellfish and seaweed can indirectly and directly occupy substantial amounts of coastal marine carbon, with shellfish also filtering out phytoplankton and particulate organic matter. Han et al. [10] evaluated the promoting effect of seaweed and bivalve cultivation on the process of transferring CO2 from the atmosphere to sediments and analyzed the carbon sink potential of marine aquaculture in the Sanggou Bay of China. Mao et al. [11] studied the in situ sedimentation rates of phytoplankton based on the SETCOL method, finding that the size, shape, and carbon content of phytoplankton significantly influence sedimentation rates. Wang et al. [12] quantitatively analyzed the ecological, economic, and social benefit mechanisms generated by marine ecological restoration in China, including carbon benefits, using structural equation modeling.
The coastal zone is the transitional area between terrestrial and marine ecosystems, possessing characteristics of both, with rich biodiversity and frequent human activities, resulting in high carbon burial rates and carbon density. Gao et al. [13] evaluated the carbon storage in the coastal area of Lianyungang using ArcGIS-10.8 and InVEST models. While coastal zone ecological restoration projects can achieve carbon sinks from two aspects: reducing carbon release and increasing biological carbon pools, and the demolition of artificial islands belongs to the former. At present, there is abundant research progress on Marine carbon sinks, but relatively few studies about artificial island demolition projects and beach sand replenishment projects. Wu et al.’s research [14] on the artificial islands in Hangzhou Bay proved that the dual impact of storms and artificial islands would intensify carbon loss in estuaries. Therefore, artificial islands will jointly affect carbon sinks with other factors. At present, there is a gap in joint research on the carbon sink benefits of the demolition of artificial islands and other reclamation projects and other projects such as sand replenishment and seagrass bed planting.
In response to the above issues, this study employs a two-dimensional tidal flow and sediment model along with an ecological dynamic model to analyze the ecological restoration project in Sanya Bay, Hainan, China. It assesses the impacts of artificial island demolition, sand replenishment and seagrass planting projects on the water environment and carbon sink effects, providing an evaluation of the projects. This study can provide a reference for future research on the ecological environment of Sanya Bay and the carbon sink benefits of similar artificial island demolition or joint projects around the world.
The paper is organized as follows. Section 2 introduces the study area, including nature conditions and ecological restoration project. Section 3 introduces the mathematical model. Section 4 introduces the marine ecological model setup and verification. Section 5 presents the carbon sink assessment results and flow rate station analysis of different schemes and discusses the impacts of seagrass on the carbon emissions. Finally, Section 6 draws the conclusion and outlines future research directions for ecological restoration and simulations.

2. Study Area

2.1. Natural Conditions

Sanya City, located at the southernmost tip of Hainan Province, is the southernmost tropical coastal tourist city in China. It belongs to a tropical maritime monsoon climate, with an average annual temperature of 25.5 °C and an average annual precipitation of 1537.04 mm, characterized by distinct wet and dry seasons, with 90% of the rainfall concentrated from May to October during the rainy season. Sanya Bay (Figure 1) is situated in the southern part of Sanya City, featuring a coastline approximately 20 km long, dotted with numerous natural coral reefs. The prevailing wind direction in the Sanya Bay area is eastward, with a frequency of 30%. The maximum wind speed exceeds 28 m/s, and the average wind speed is greater than 2 m/s. The tidal waves are of an irregular mixed tide type, primarily dominated by semi-diurnal tides, with an average rising tide duration of 14 h and a falling tide duration of 10 h. The currents are mostly regular semi-diurnal tides, with the main wave direction-oriented SSE. The frequency of significant wave heights greater than 1 m is only 12% (Figure 2), and the average wave period ranges from 2 to 6 s. The median particle size of the bottom sediments is approximately 11–16 μm. The Sanya River is formed by the convergence of three rivers: Liuluo River, Water Jiao Stream, and Banling River, meeting before entering the sea, with the estuary located in the eastern part of Sanya Bay, having an average annual flow of 6.7 m3/s.
To meet the growing demand for tourist throughput, the second phase of the Sanya Phoenix Island International Cruise Terminal project commenced construction in April 2014 and was completed in December 2016. Due to the land reclamation associated with the Phoenix Island project, the flow patterns in the adjacent sea areas have changed, reducing water exchange capacity and resulting in adverse effects such as the erosion of the western coastline of Sanya Bay and increased pollution of the Sanya River.

2.2. Ecological Restoration Project

The Sanya Bay ecological restoration project is mainly divided into three parts: the demolition of the second phase of the artificial island on Phoenix Island, the beach replenishment project in the eastern section of Sanya Bay, and the coral reef restoration project (Figure 1). The demolition project involves dismantling the under-construction artificial island of the second phase of Phoenix Island to improve the ecology of the Sanya River estuary. The beach replenishment project involves artificially adding approximately 60,000 m3 of sand using land-based filling methods along a beach approximately 2.6 km long and 50 m wide in the eastern section of Sanya Bay, with a median particle size of the sand source ranging from 0.4 to 0.7 mm. The coral reef restoration project aims to establish a coral reef restoration area between the first and second phases of the artificial island, deploying artificial reefs and corals while also setting up multiple coral reef protection zones near Luhuitou Island.

3. Mathematical Model

3.1. Hydrodynamic Model

The basic form of the control equations for the two-dimensional tidal current model is given by Equations (1)–(3):
h t + h u ¯ x + h v ¯ y = h S
h u ¯ t + h u ¯ 2 x + h v u ¯ y = f v ¯ h g h η x g h 2 2 ρ 0 ρ x + τ s x ρ 0 τ b x ρ 0 + x h T x x + y h T x y + h u s S
h v ¯ t + h v u ¯ x + h v ¯ 2 y = f u ¯ h g h η y g h 2 2 ρ 0 ρ y + τ s y ρ 0 τ b y ρ 0 + x h T x y + y h T y y + h v s S
where h = η + d is the total water depth (m); η is the free surface elevation (m); d is the static water depth (m); x and y represent the horizontal axis coordinates (m); t is time (s); u ¯ and v ¯ are the vertically averaged flow velocities in the x and y directions, respectively, (m/s); S is the vertically averaged point source flow rate (s−1); f is the Coriolis force coefficient (s−1); g is the acceleration due to gravity (s−1); ρ is the water density (kg/m3); ρ 0 is the reference density (kg/m3); u s and v s are the point source velocities (m/s); the surface stress vector τ s = τ s x ,   τ s y (Pa) and bottom stress vector τ b = τ b x ,   τ b y (Pa) is calculated using Equation (4):
τ s = ρ a c f u s u s τ b = ρ 0 c f u b u b
where ρ a is the air density (kg/m3), c f is the drag coefficient(nondimensional), which can be computed from the Chezy coefficient C (m1/2·s−1) or Manning’s coefficient M (m−1/3·s), as shown in Equations (5) and (6):
c f = g C 2
c f = g M h 1 / 6 2
and the stress term T i j = T x x T x y T y x T y y (m2/s2) is a two-dimensional horizontal turbulent stress tensor, which includes viscous stress, turbulent stress, and convection and relates to the velocity gradient. T i j is calculated by Equation (7):
T i j = ν t S i j
The horizontal eddy viscosity coefficient ν t (m2/s) is solved using the Smagorinsky sub-grid scale model, which can effectively describe the formation of various eddies. The eddy viscosity coefficient is taken as:
ν t = C s 2 l 2 2 S i j S i j
where Cs (nondimensional) is an adjustable coefficient, typically set to 0.28; Sij (s−1) is a two-dimensional tensor, which is the rate of deformation and related to the velocity gradient, given by:
S i j = 1 2 u i x j + u j x i , ( i , j = 1 , 2 )
The control equations are solved explicitly using the finite volume method, and the wet-dry grid judgment method is employed to simulate the exposure phenomenon.

3.2. Ecological Dynamics Model

To couple with the two-dimensional hydrodynamic model, the ecological dynamics model employs the NPZD framework [16], which has been widely used in various studies [17,18,19] and has demonstrated good reliability, even yielding satisfactory results with a limited number of state variables [20,21]. This model is relatively balanced in terms of complexity and robustness. It not only involves the main elements of Marine ecological models but also does not require excessive parameter debugging. It is more suitable for this study with a small amount of field data.
The NPZD model developed in this study comprises four components: nutrients, phytoplankton, zooplankton, and detritus, with each component abstracted as a combination of various elemental constituents. The phytoplankton component incorporates four elements: carbon, nitrogen, phosphorus, and chlorophyll. The zooplankton component considers only carbon. The nutrient module accounts for three components: inorganic nitrogen, inorganic phosphorus, and dissolved oxygen. The detritus component includes three constituents: carbon, nitrogen, and phosphorus. The dynamics of each component are governed by the following differential equations, where each term on the right side of the equations represents a specific ecological process:
d P d t = p r o d u c t i o n g r a z i n g s e d i m e n t a t i o n d e a t h
d Z d t = p r o d u c t i o n d e a t h
d D d t = g e n e r a t i o n s e d i m e n t a t i o n
d N d t = r i v e r _ i n p u t u p t a k e
The dimensions at both ends of the equation are g/m3/day. In addition to hydrodynamic factors, the ecological model also considers the impacts of temperature, salinity, nitrogen limitation, phosphorus limitation, suspended particulate matter, and light on biological processes. A minimum nutrient concentration is established to ensure the stable operation of the model. The specific cyclic processes are described as follows:
(1) Phytoplankton growth equation:
production = k g f ( L ) f ( T ) f ( N , P ) k r k d r P C
where k g = 0.3 (day−1) represents the maximum growth coefficient at 20 °C, k r = 0.9 (nondimensional) denotes the relative day length, k d r   = 1.3 (nondimensional) is the dark reaction correction factor, while f ( L ) , f ( T ) , and f ( N , P ) correspond to the light attenuation function, temperature influence function, and nitrogen-phosphorus limitation function, respectively:
f ( L ) = I / I S , I I S 1 , I > I S
f ( T ) = k T ( T 20 )
f ( N , P ) = 2 1 f ( N ) + 1 f ( P )
f ( N ) = P N / P C P N min P N max P N min
f ( P ) = ( P P / P C P P min ) ( K C + P P max P P min ) ( P P max P P min ) ( K C + P P / P C P P min )
In the equations, k T = 1.01 (nondimensional) signifies the growth temperature factor, I S (E/m2/day) indicates the light saturation constant, P C , P N , and P P (g/m3) represent the carbon, nitrogen, and phosphorus contents in phytoplankton, P N max = 0.18 , P N min = 0.07 , P P max = 0.01 , and P P min = 0.002 (nondimensional) denote the maximum and minimum nitrogen and phosphorus contents in phytoplankton, respectively, and K C = 0.01 (nondimensional) stands for the half-saturation constant of phytoplankton for phosphorus. The phytoplankton mortality equation is shown below:
death = k d f d ( N , P ) P C
where the subscript d indicates that this restriction function is related to the death process. k d = 0.01 (day−1) represents the mortality rate of phytoplankton under optimal nitrogen-phosphorus concentrations, and f d ( N , P ) is the nitrogen-phosphorus limitation function:
f d ( N , P ) = 1 2 P N max P N / P C + P P max P P / P C
The phytoplankton sedimentation equations are shown below:
sedimentation = k s f d ( N , P ) P C , h 2 m w s h f d ( N , P ) P C , h > 2 m
where k s = 0.05 (day−1) denotes the sedimentation rate, h (m) signifies water depth, and w s = 0.1 (m/day) represents the settling velocity of particulate matter.
(2) Zooplankton growth equation:
production = k z f ( T ) f ( D O ) f ( P C ) Z C
where k z = 1.5 (day−1) indicates the zooplankton max grazing rate, and the subscript z indicates that this parameter is related to zooplankton. While f ( T ) , f ( D O ) , and f ( P C ) correspond to the temperature limitation function, dissolved oxygen limitation function, and phytoplankton limitation function, respectively:
f ( T ) = k T z ( T 20 )
f ( P C ) = 1 + e ( k 1 k 2 P C )
f ( D O ) = D O 2 D O 2 + k D O
In the equations, k T z = 1.05 (nondimensional) represents the growth temperature factor, k 1 = 5 (nondimensional) and k 2 = 50 (day−1) are constants related to zooplankton grazing and phytoplankton biomass, D O (g/m3) represents the concentration of dissolved oxygen, and k D O = 2 (g/m3) reflects the reduction in grazing due to hypoxia. The production term of zooplankton is numerically equal to the grazing term of phytoplankton, that is, in the model, it is considered that phytoplankton are only preyed on by zooplankton. Zooplankton mortality equation:
death = k d z 1 Z C + k d z 2 Z C 2
where k d 1 = 0.1 (day−1) and k d 2 = 12 (m3/g/day) are constants associated with zooplankton mortality.
(3) Detritus equation:
The generation term in the detritus equation is numerically equal to the sum of the death terms of phytoplankton and zooplankton. The sedimentation term equals to 0.05 D C ., which indicates the sedimentation rate is linear.
(4) Nutrient equation:
The river input item only exists at the estuary boundary, and the uptake item is calculated by multiplying the value of the phytoplankton production item by the Redfield ratio (C:N:P = 41:7.2:1).

4. Model Setup and Verification

4.1. Model Setup

The simulation covers a range of approximately 108.85° E to 109.75° E and 17.52° N to 18.5° N, utilizing a Cartesian coordinate system and an unstructured grid. Grid refinement is implemented near the study area, with an average grid size of 1600 m for the open boundary offshore and an average grid size of 20 m in the vicinity of the artificial island and the Sanya River. The model consists of a total of 13,806 nodes and 26,617 grids (Figure 3). The open boundary is forced using predicted water levels from OTPS-2021 (OSU Tidal Prediction Software 2021) and tidal, current, and sediment validation is carried out using the topography prior to the removal of the artificial island. Based on geotechnical survey results, the sediment is classified into three regions: the median particle size of the beach sediment along the northern coastline of Sanya Bay is set at 0.2 mm, the particle size of the flower stone mound north of the western island of Sanya Bay is set at 0.5 mm, and the median particle size of the sediment in the remaining marine areas is set at 0.03 mm. Three topographical scenarios are utilized for the ecological restoration project benefit analysis: (1) original topography, (2) removal of the artificial island, and (3) removal of the artificial island plus beach nourishment. In scenario 2, the boundary of the second phase of the artificial island is removed, and the area post-demolition is dredged back to the state prior to the construction of the artificial island. Scenario 3 builds upon scenario 2 by enhancing the beach shoreline in northern Sanya Bay according to the construction plan. The simulation period is set from 1 October to 31 October 2024, with all three cases featuring identical hydrodynamic, carbon input, and nutrient input conditions at the open sea and river boundaries to ensure the rationality of subsequent analyses. Although the wave energy in Sanya Bay is relatively weak, it may still influence the ecological model. As shown in Figure 2, the majority of waves originate from the SSE and S directions. Waves with heights below 0.5 m were disregarded, and considering that Sanya Bay is occasionally affected by typhoons, four hydrodynamic scenarios were established for each topographic condition: (1) Tide-only scenario; (2) Tide + S-direction waves; (3) Tide + SSE-direction waves; (4) Tide + typhoon-induced waves. A total of 12 scenarios were simulated. The wave heights for the S and SSE directions were calculated according to the wave rose formula (Equation (27)), where p represents the probability of each wave height, and H p denotes the mean wave height under probability p . The calculation accounted for wave probabilities from both the primary and adjacent directions. The computed results indicated that the wave heights at the Dongdao monitoring site were 0.79 m for the S direction and 0.82 m for the SSE direction. The open boundary wave parameters were calibrated based on these values, and the wave periods were derived from the empirical relationship between design wave height and period.
H = H p 2 p
The initial conditions for the ecological model were determined based on publicly available data and field survey reports [22]. The key parameters were set as follows: Phytoplankton biomass: 0.02 mg C/L, 0.0028 mg N/L, 0.0004 mg P/L and 0.0005 mg Chl/L. Zooplankton biomass: 0.003 mg C/L. Suspended particulate organic matter, which derived from sediment content: 0.5 mg C/L, 0.3 mg N/L and 0.02 mg P/L. Dissolved inorganic nutrients: Nitrogen (DIN): 0.0304 mg N/L and Phosphorus (DIP): 0.0015 mg P/L. Dissolved oxygen (DO): 6.72 mg/L.

4.2. Model Verification

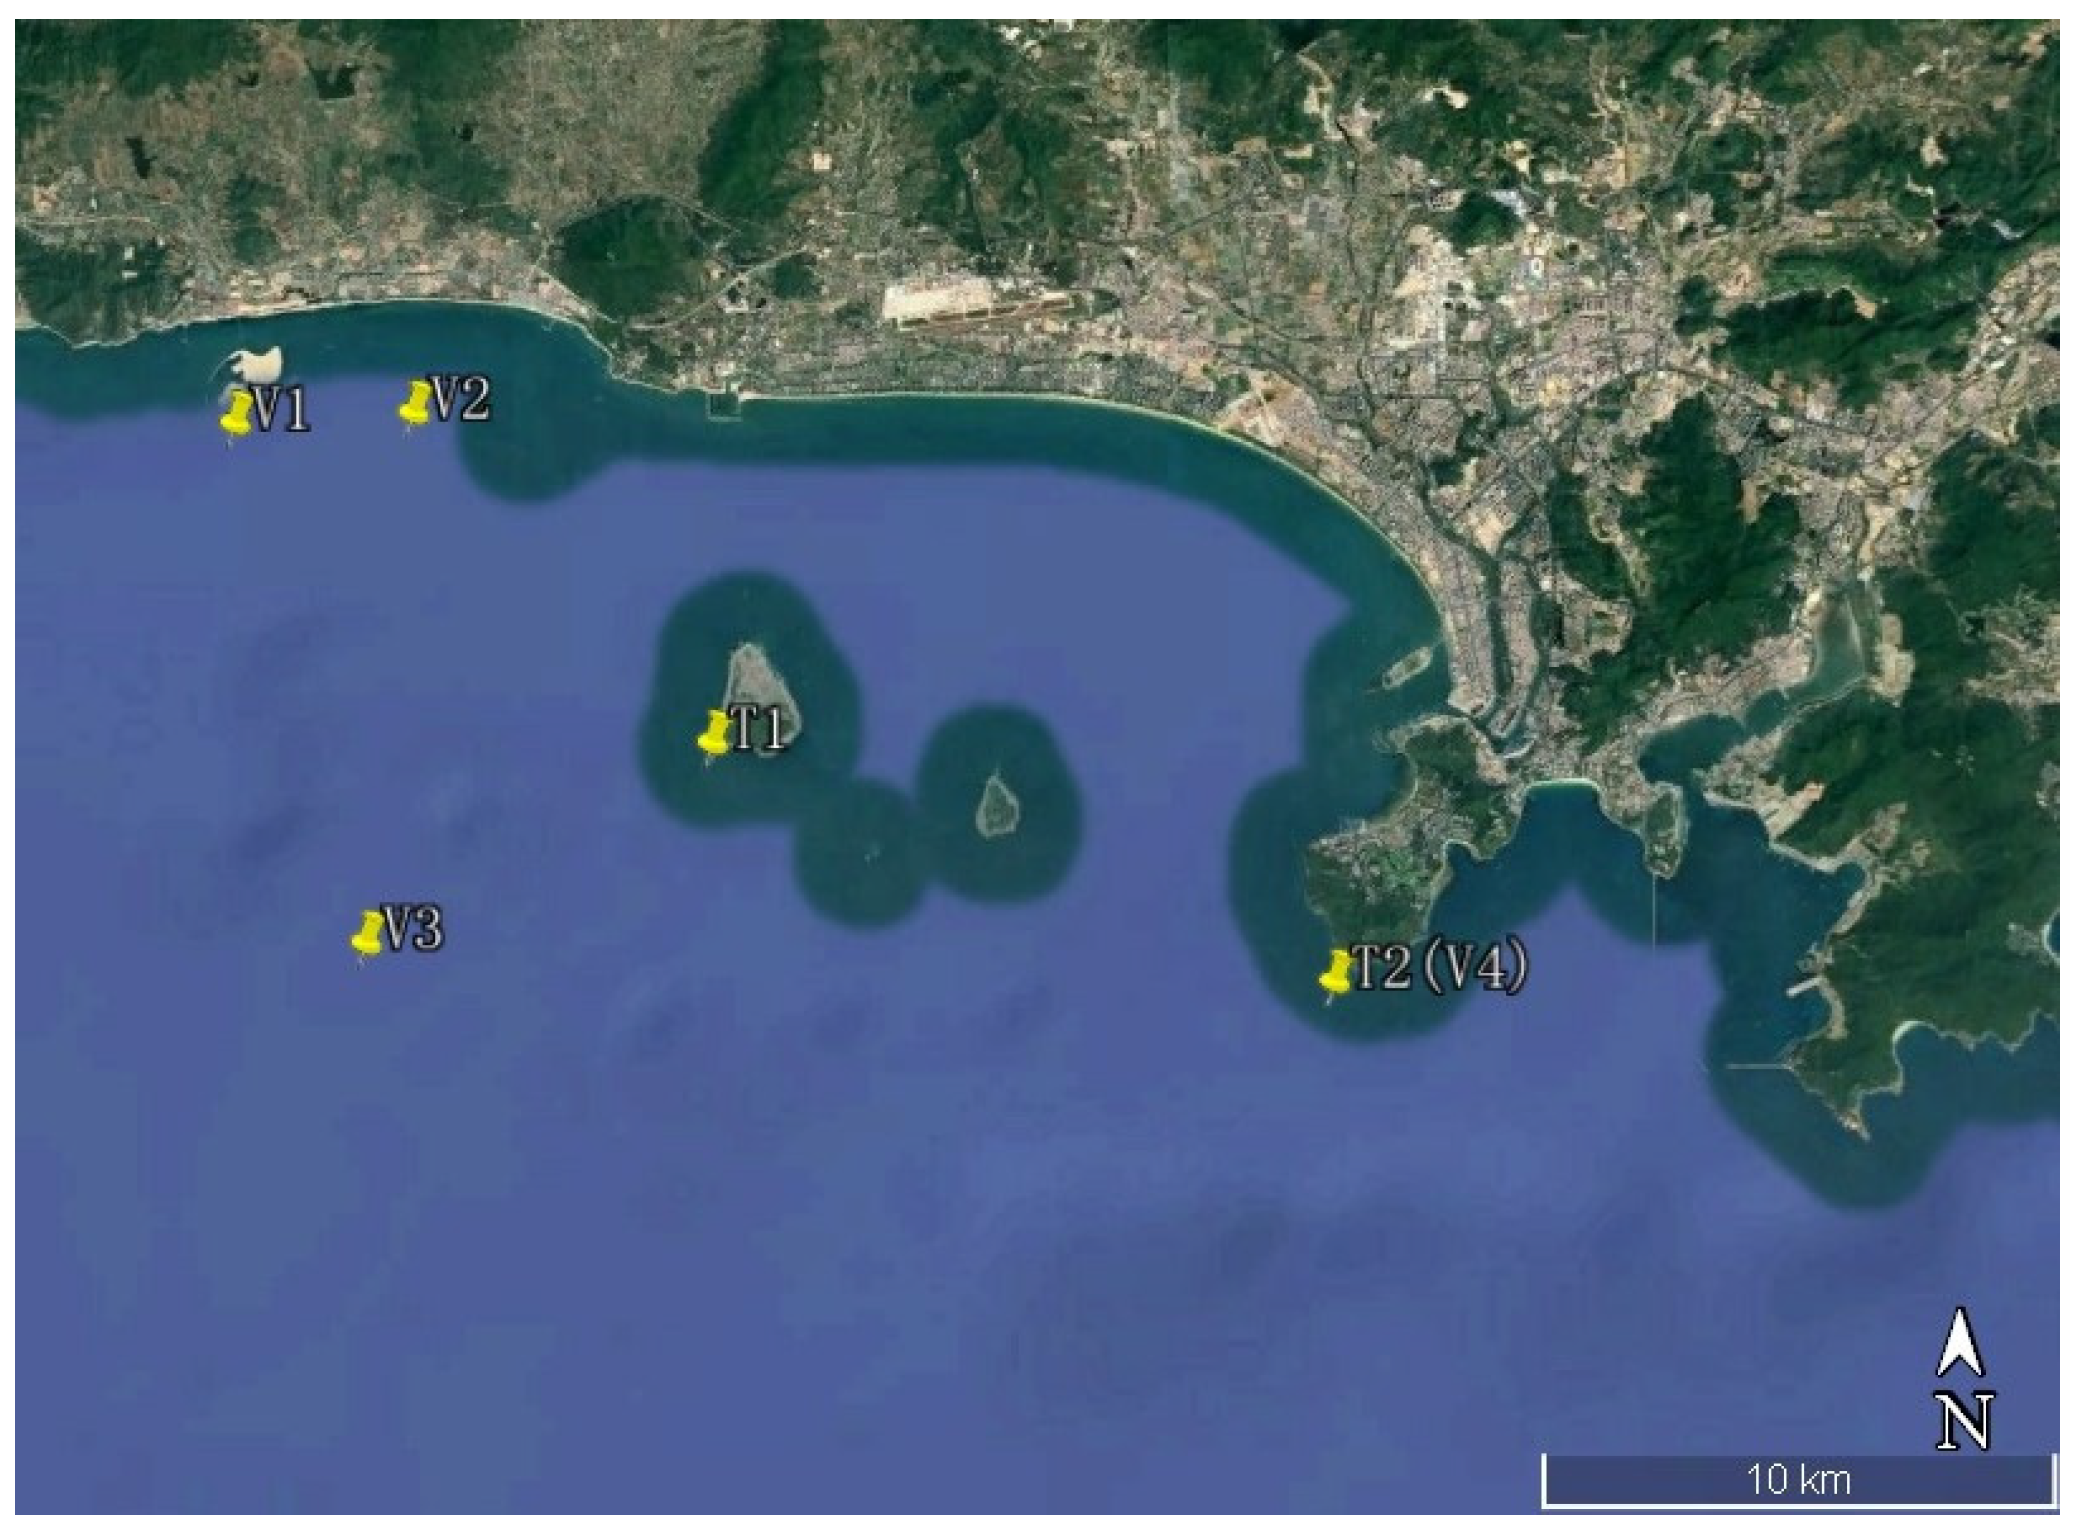
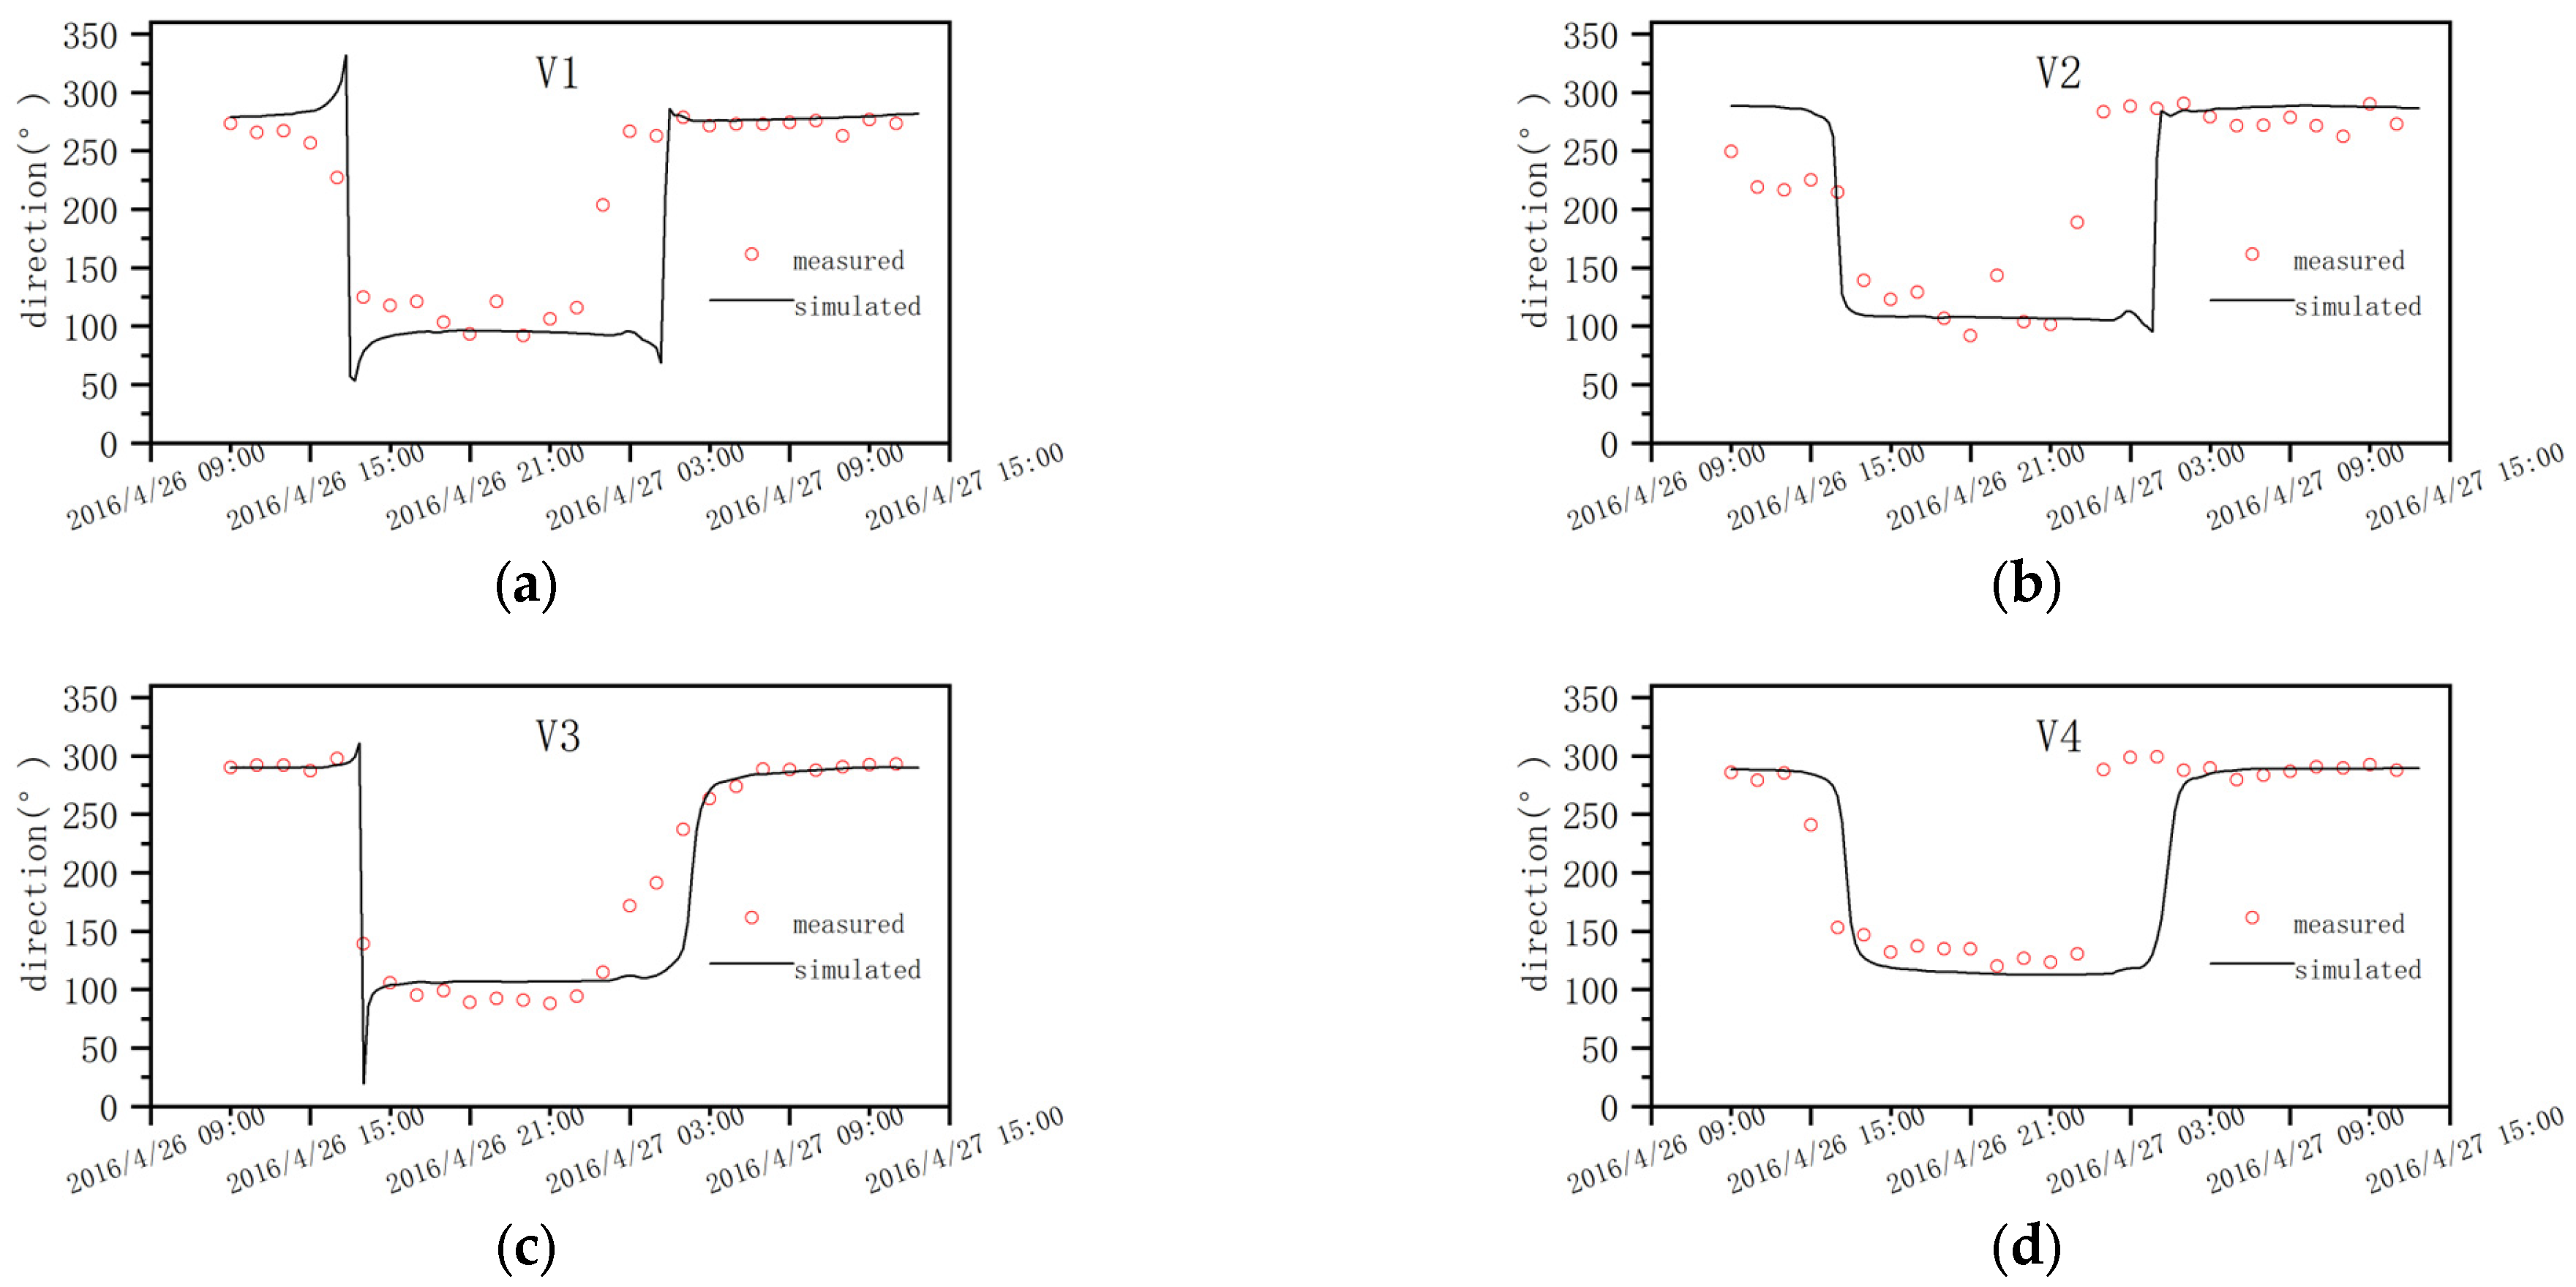
The tidal wave verification period selected includes actual data from 26 April 2016, 12:00, to 27 April 13:00. The locations of the tidal and current verification stations are shown in Figure 4, where T1–T2 represent tidal stations and V1–V4 represent current stations. The verification results are illustrated in Figure 5, Figure 6 and Figure 7. The root-mean-square error (RMSE) of the tidal level at the T1 and T2 measurement points was 0.19 m and 0.13 m, respectively. The RMSE flow velocities at measurement points V1–V4 are 0.09 m/s, 0.18 m/s, 0.17 m/s and 0.23 m/s, respectively. The RMSE flow direction at measurement points V1–V4 are 54°, 65°, 43° and 59°, respectively. Combining images and statistical data, the computational results align well with the measured data, indicating that the developed model accurately reflects the tidal current dynamics in the marine areas near the project zone.

5. Results and Discussions

5.1. Overall Assessment

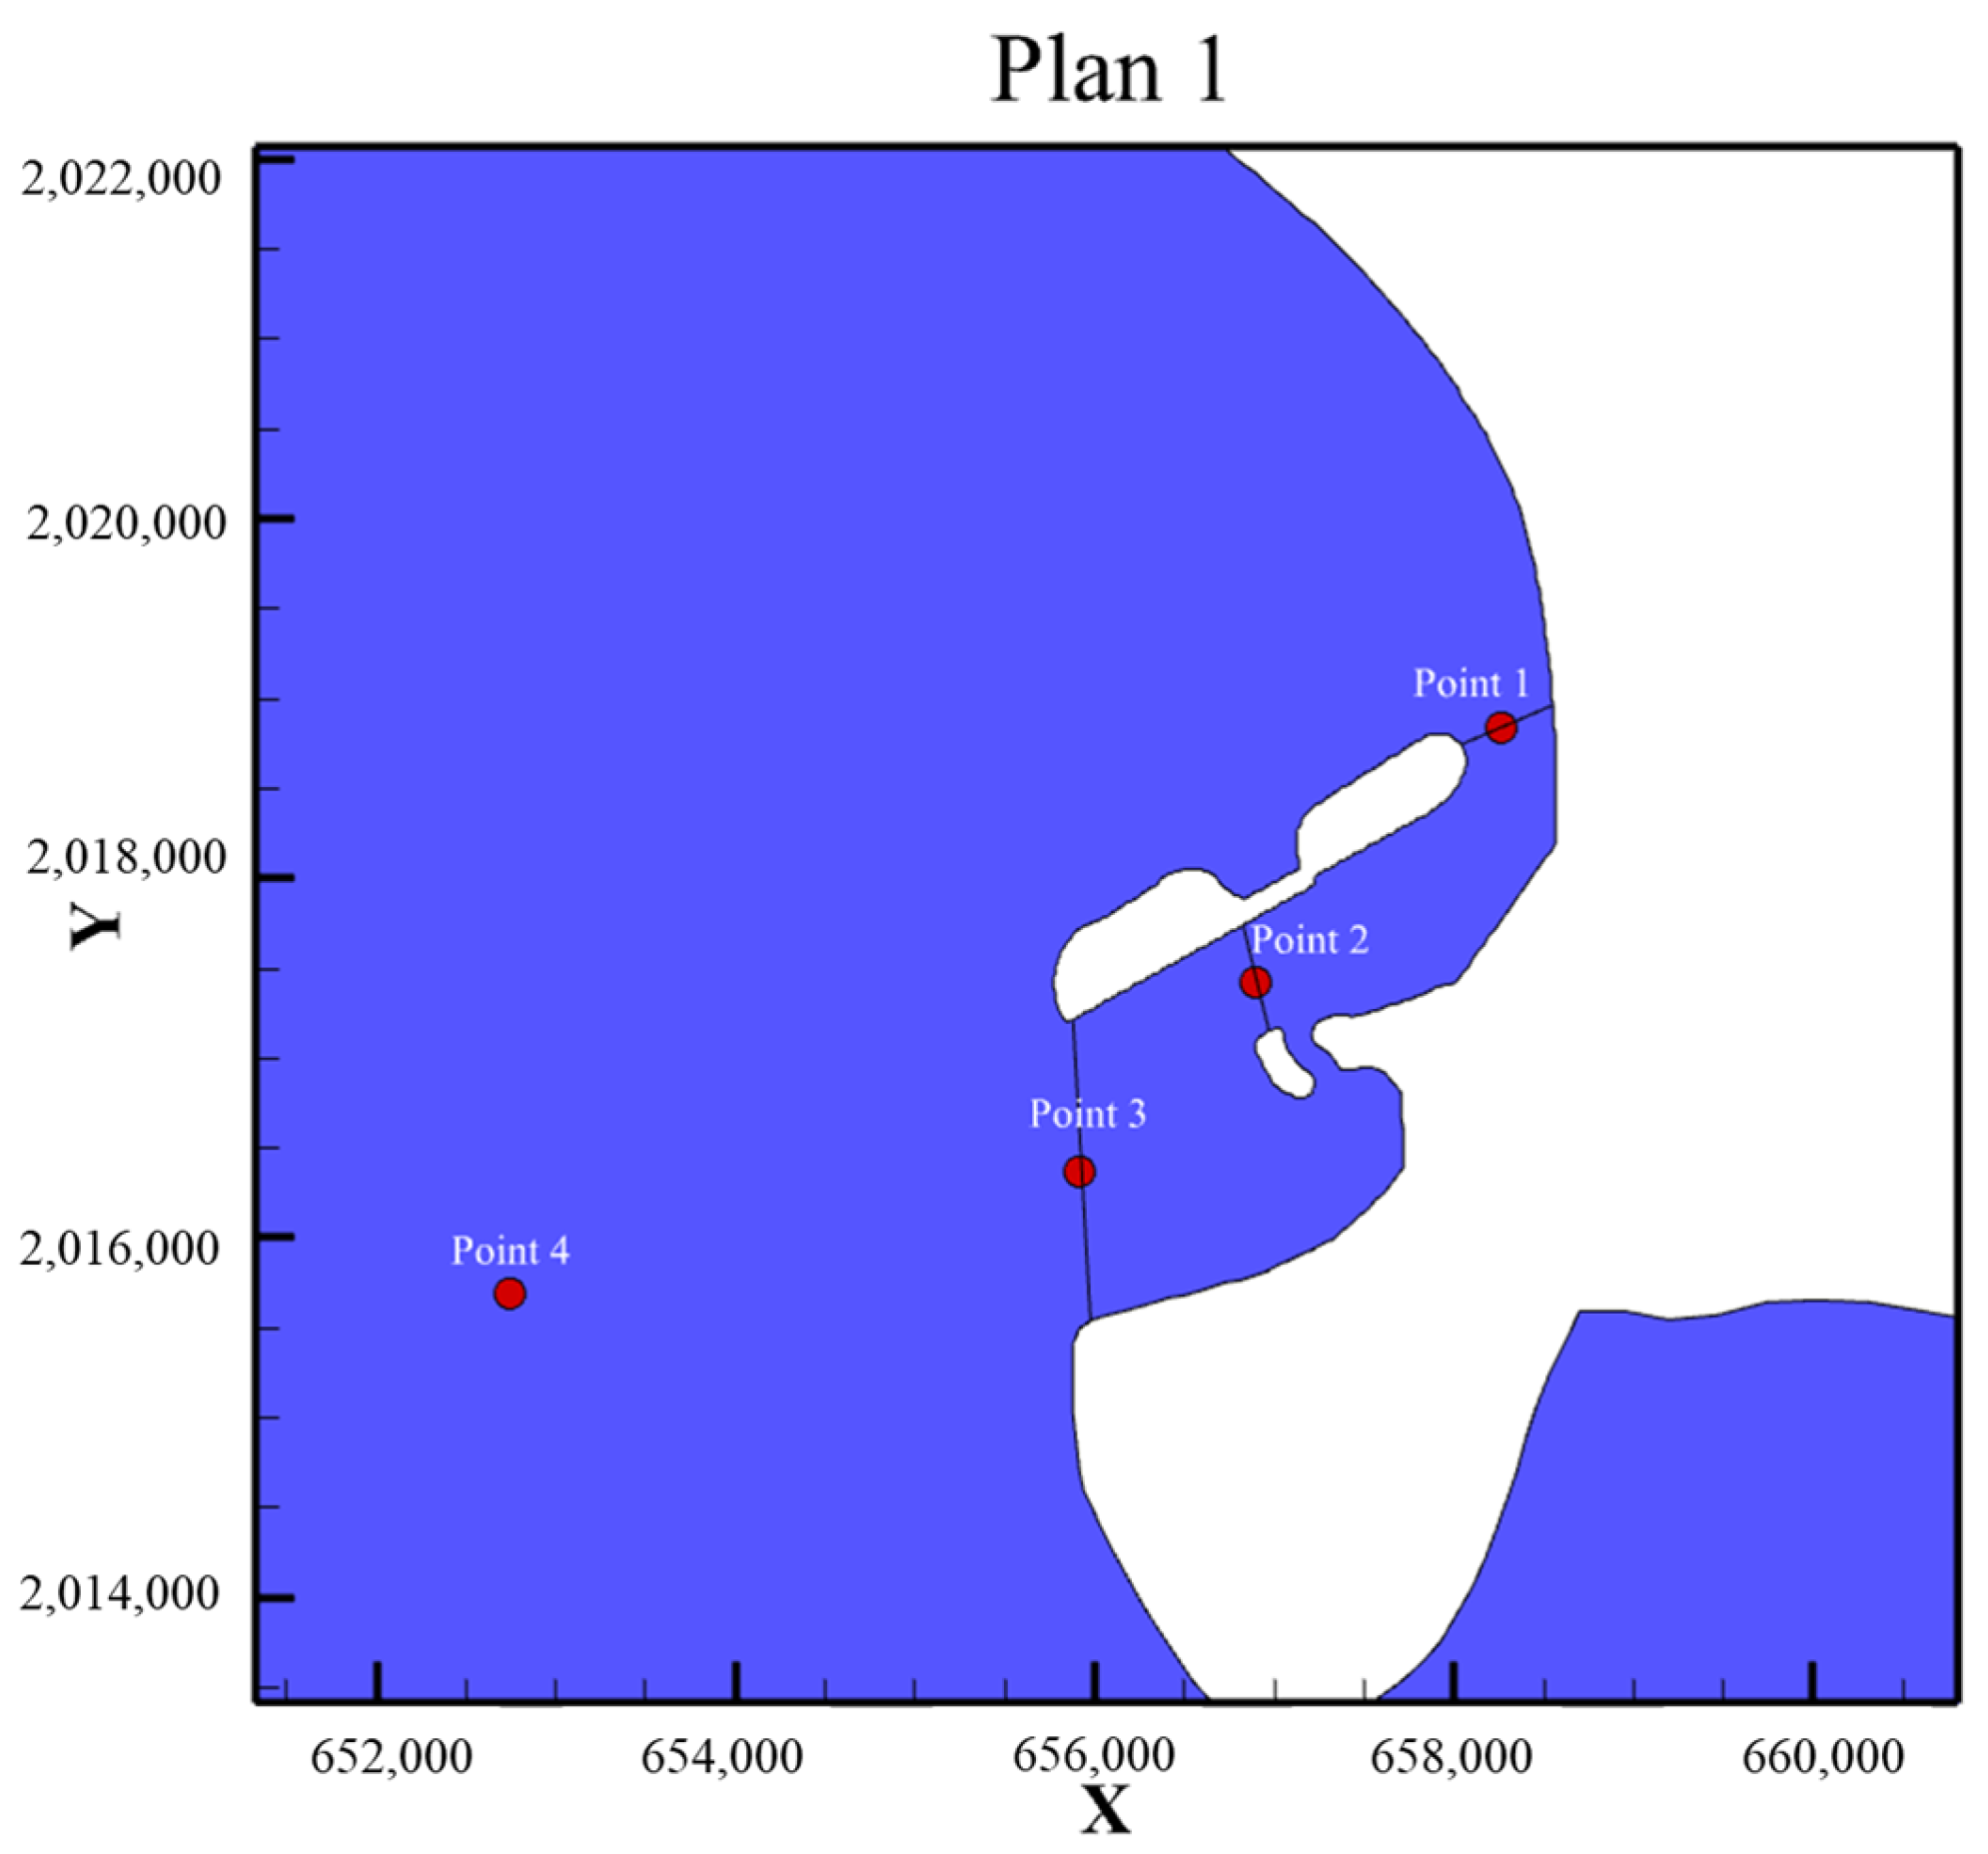
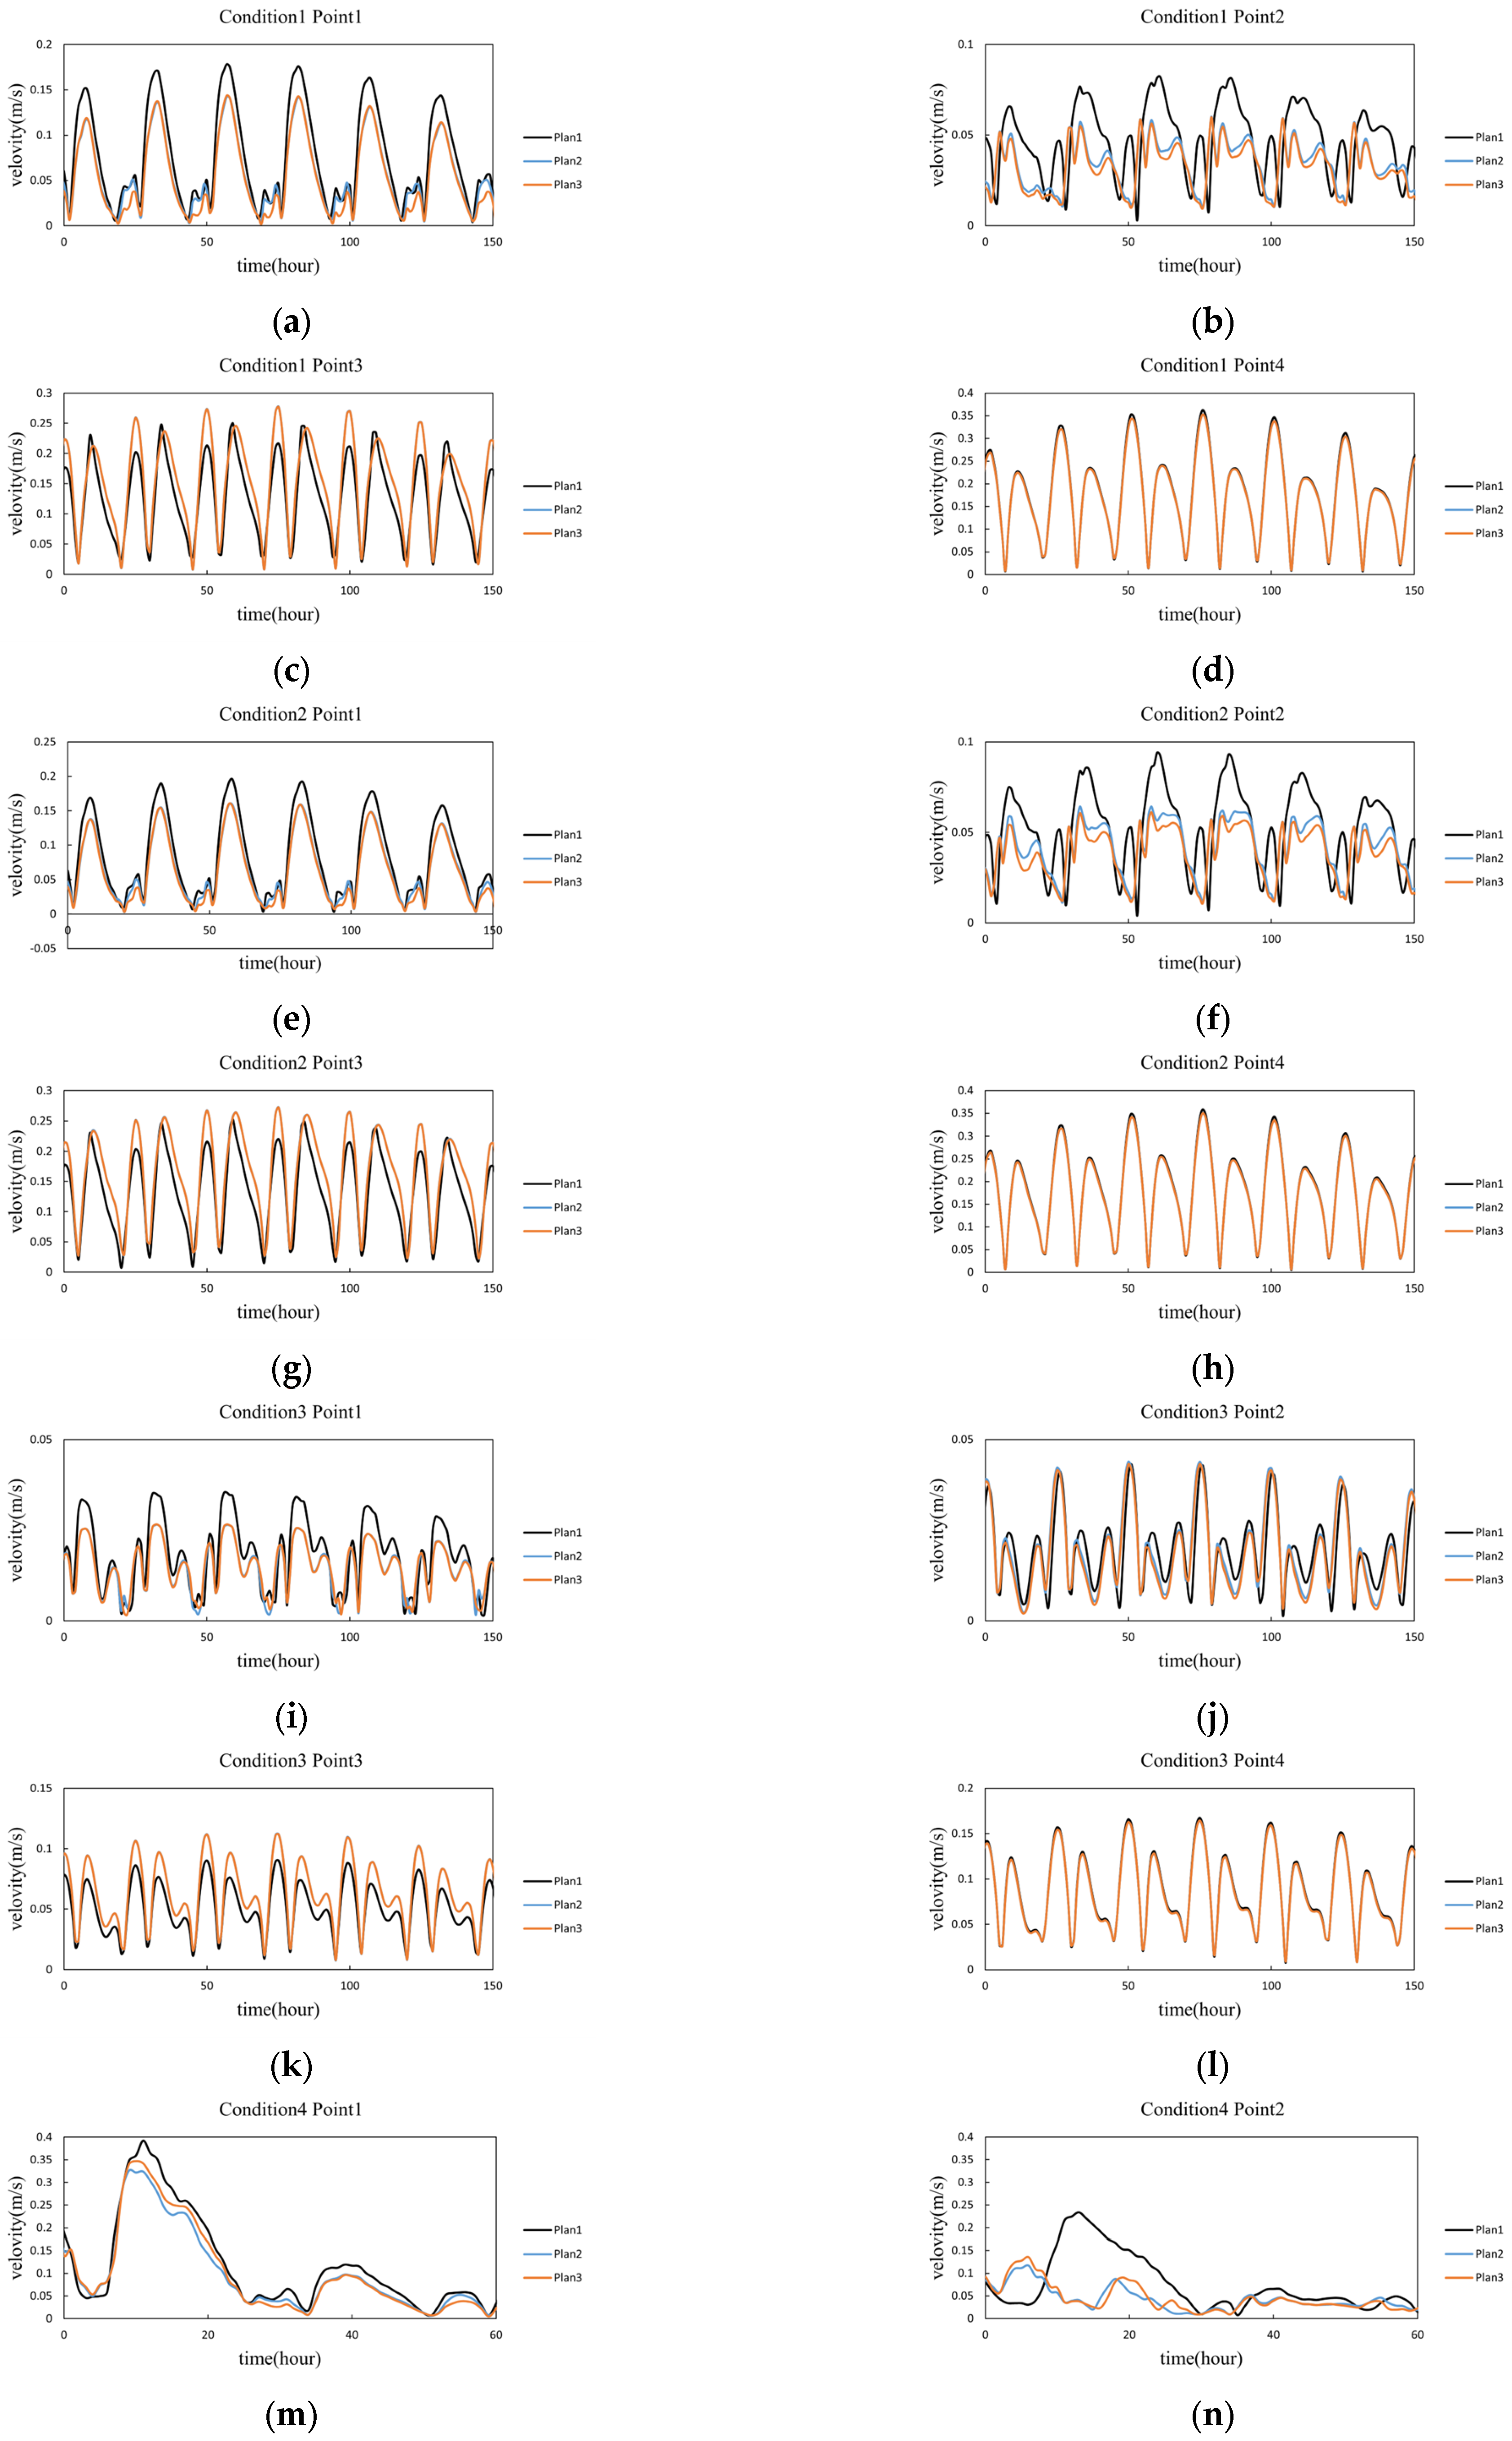
Considering the influence range of the ecological restoration project, an analysis is conducted within the area covering Sanya Bay, specifically between 18.19° N–18.30° N and 109.34° E–109.51° E. Figure 8 shows the tidal current velocity distribution near the artificial island under the tide-only condition during spring high tide for the three plans. As illustrated in Figure 8, the removal of the artificial island results in a more open sea area. Compared with Plan 1, the velocity contour lines in Plan 2 advance toward the coastline, with an overall increase in flow velocity in the western part of the artificial island, while the flow field distribution shows minimal difference between Plan 2 and Plan 3. Figure 9 shows the wave height and wave direction distribution under the three working conditions of S, SSE and typhoon waves before the project. It can be seen that, except for the relatively large wave height near the artificial island under the typhoon wave condition, due to the cover of Luhuitou Island, there are almost no waves near the artificial island under the two normal wave direction conditions. This conclusion also holds true for the working conditions after the project. For detailed analysis, representative cross-sectional monitoring points (red points in Figure 10) were selected to compare different plans and conditions (Figure 11).
The results indicate that the implementation of Plan 2 and Plan 1 increases the cross-sectional area at the estuary inlet, reducing the flow velocity at Point 1 and Point 2. Under Condition 1 and Condition 2, the average flood and ebb peak velocities decrease by approximately 5 cm/s. The maximum reduction (about 15 cm/s) occurs at Point 2 under Condition 4. After the project, the flow velocity at Point 3 increases under all four conditions, with a rise of approximately 3–8 cm/s during flood and ebb peaks. The velocities at Point 4 are nearly identical across all three plans, suggesting minimal impact on open-sea areas. The velocities at the four monitoring points in Plan 2 and Plan 3 are almost the same, indicating that the coastal sand replenishment project has little influence on the flow field. Overall, the ecological restoration project affects the flow velocity near the Sanya River estuary, showing a trend of decrease in the inner area, increase in the middle area, and no significant change in the outer area. Considering that due to the influence of artificial activities upstream, the concentration of nutrients near the estuary is relatively higher than that in the open sea, after the project, the flow velocity in the inner area decreased, which prolonged the retention time of nutrients near the estuary, weakened the nutrient limit, and thereby increased the carbon of plankton.
Table 1 presents the mean daily primary productivity (Mg C/day) in Sanya Bay under 12 conditions after computational stabilization, as well as the differences in primary productivity between the two engineering plans and the pre-project scenario. Analyzing different conditions under the same plan reveals that the tide-only case yields the highest primary productivity, followed by the tide + wave case, while the tide + typhoon wave case shows the lowest. This may be attributed to enhanced material exchange between Sanya Bay and adjacent waters under stronger hydrodynamic conditions, leading to reduced productivity. Comparing different plans under the same condition, most cases demonstrate a significant increase in primary productivity for Plan 2 and Plan 3 relative to Plan 1, except for a slight decrease in the tide + typhoon wave case. Under typhoon conditions, the primary productivity of Schemes 2 and 3 slightly decreases compared to Scheme 1. This is because the demolition project of the artificial island makes the sea area more open, resulting in an increase in the flow velocity near the estuary during typhoon weather. This can be seen in Figure 11. The increased flow velocity will to some extent reduce the concentration of nutrients, thereby resulting in a decrease in the production capacity of phytoplankton. However, considering that the number of typhoon days throughout the year is relatively small, such an impact is negligible, and the lost carbon sink can also be compensated for through the fixation effect of seagrass bed culture and sand replenishment projects on benthic organisms. Assuming the values in Table 1 represent the annual average primary productivity and considering the occurrence probability of each condition throughout the year, the annual carbon sequestration capacity of phytoplankton under different plans can be estimated (Table 2), with the typhoon wave condition calculated for 10 days per year. Plan 2 and Plan 3 can sequester an additional 70.8 Mg C and 83.83 Mg C annually, respectively. Based on the carbon sink rate of 543.5 g C/m2/yr of a typical seagrass bed [23], the increase in carbon sink after implementation Plan 3 is equivalent to the carbon sequestration capacity of approximately 154,200 m2 of a mature seagrass bed, indicating that the project has a good carbon sink benefit.
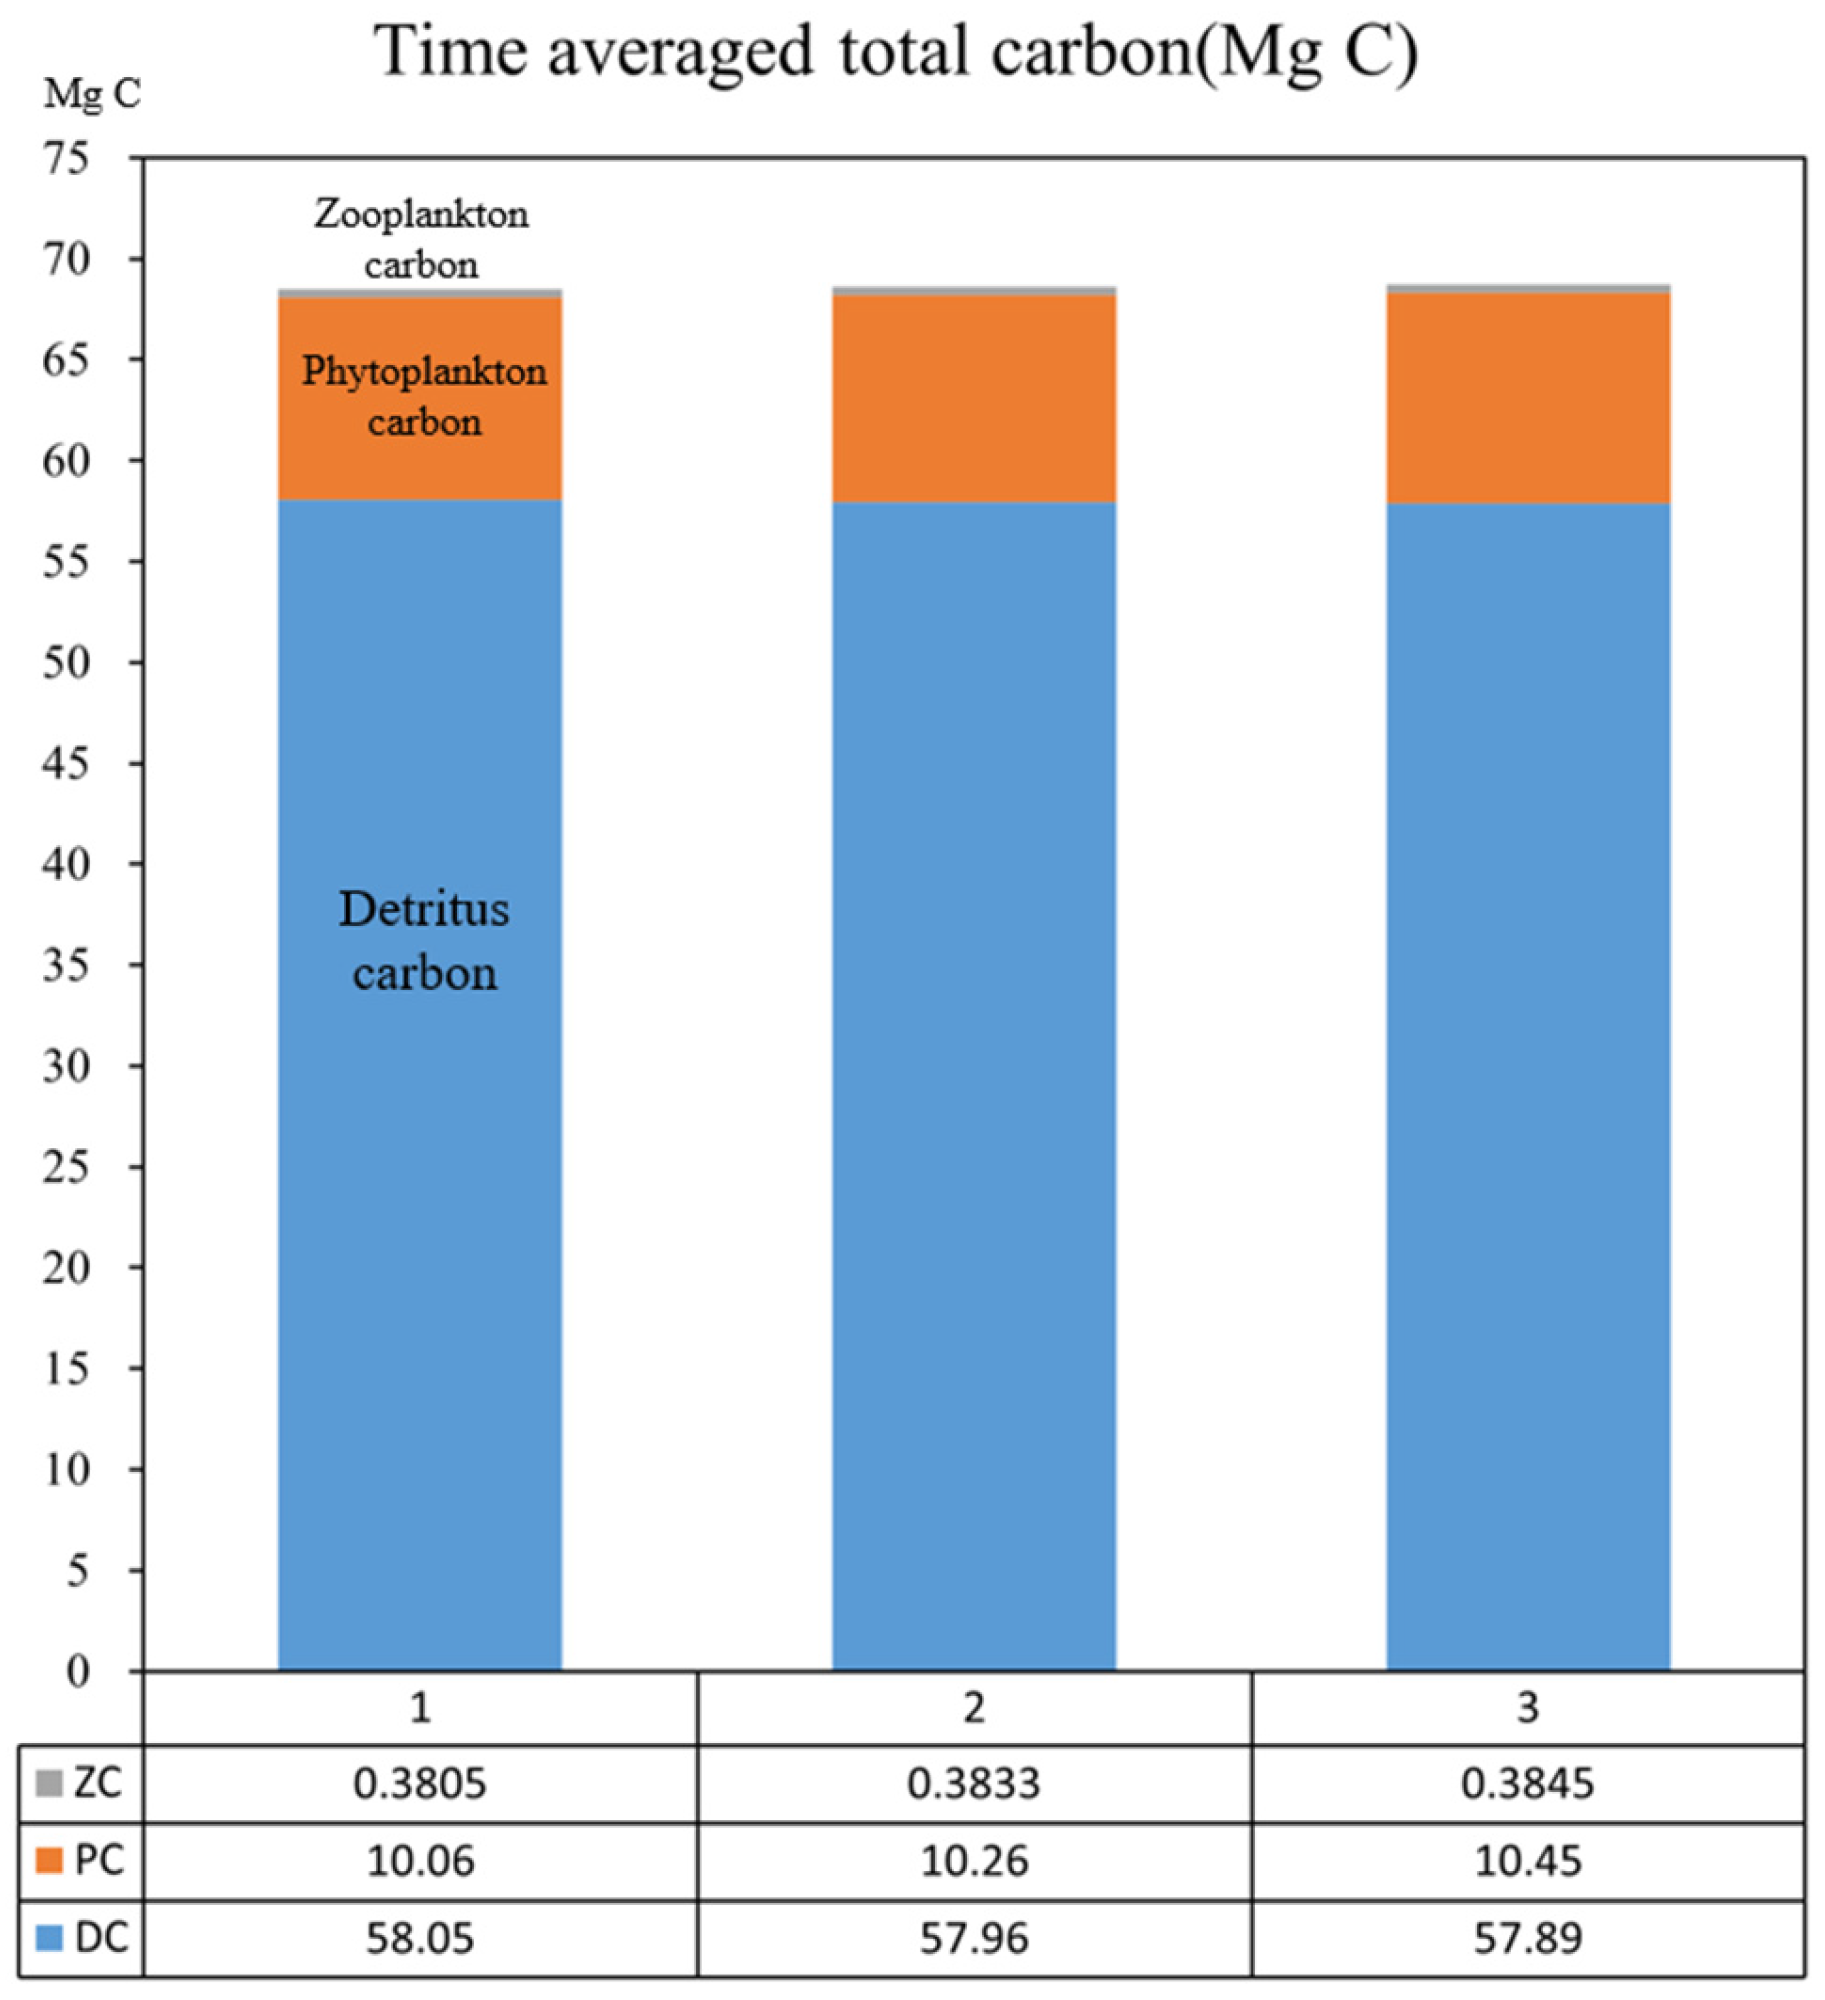
The total phytoplankton biomass, total zooplankton biomass (in carbon equivalent), total suspended particulate carbon content, and their combined sums for the three plans are shown in Figure 12. The results demonstrate that suspended particulate organic carbon dominates in all three plans, followed by phytoplankton carbon, while zooplankton carbon contributes minimally. Compared with Plan 1, Plans 2 and 3 exhibit increased plankton carbon storage and a slight reduction in particulate carbon, but the total carbon storage increases by 0.11 Mg C and 0.24 Mg C, respectively. The sand used for sand replenishment does not contain organic matter, and plankton cannot obtain nutrients from it. This process will not generate carbon sinks in the short term. In fact, compared with the situation without sand replenishment, it may temporarily lead to a reduction in carbon sinks. However, in the long run, the sediment can attach to benthic organisms and has certain carbon sink benefits.

5.2. Effects to Seagrass Carbon Sink

5.2.1. Model and Initial Conditions

It is assumed that seagrass bed restoration will be implemented in the southern area of Phase I of the artificial island. Considering the growth characteristics of seagrass, the growth process is divided into two components: increase in shoot number and increase in biomass per shoot. The growth equations for the seagrass bed are as follows:
P c a r b o n = G c a r b o n × L × k T T 20 × r d × m a x E C w , E C s
P s h o o t = G s h o o t × L × k T T 20 × r d
where G c a r b o n and G s h o o t represent the biomass growth rate per shoot and maximum shoot growth rate at 20 °C, respectively (day−1). L is the light attenuation function, k T is the temperature influence factor, T is the water temperature, rd is the relative day length, E C w and E C s denote the potential relative growth rates of nitrogen and phosphorus uptake from water and sediment by the seagrass bed, respectively. The light attenuation function and nutrient limitation follow formulations similar to those for phytoplankton. Mortality Equation:
D c a r b o n = d c a r b o n × H × k T T 20
D s h o o t = d s h o o t × S
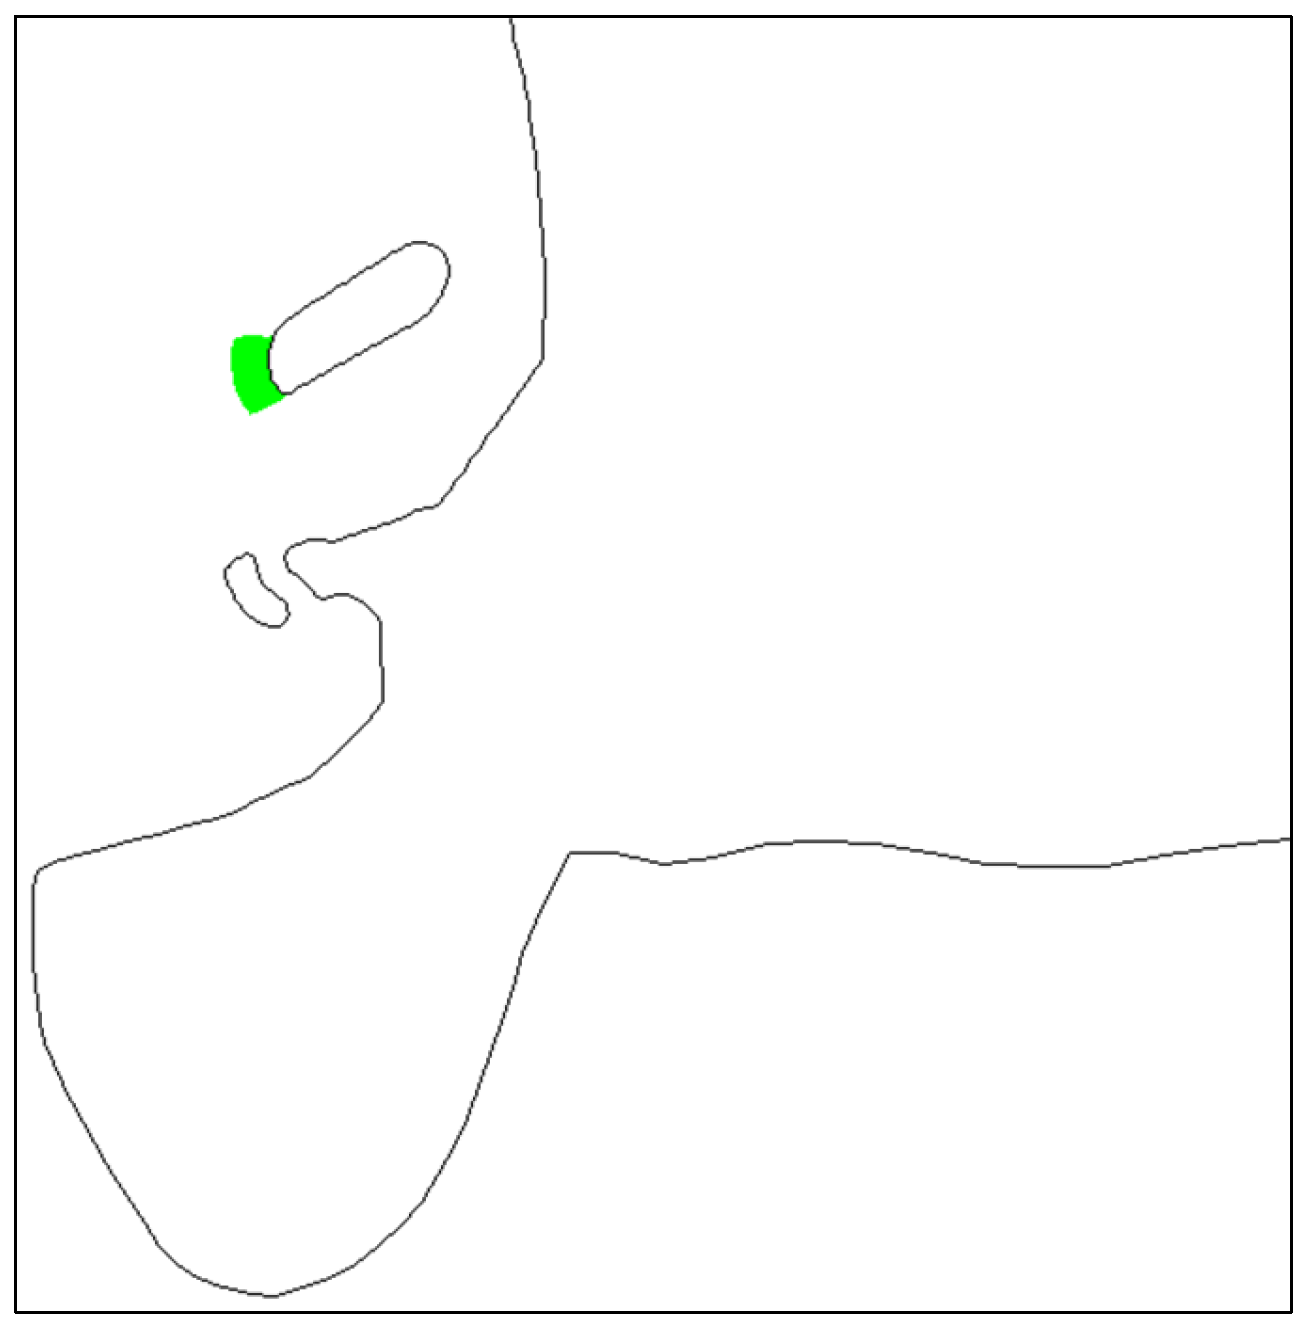
where d c a r b o n and d s h o o t are the biomass mortality rate per shoot and shoot mortality rate (day−1) at 20 °C, H is the water depth-influenced mortality function for seagrass. The selected seagrass species for restoration is Thalassia hemprichii (turtle grass), planted at a density of 10 shoots/m2. Given that each Thalassia plant typically produces 5 shoots on average, the shoot density is 50 shoots/m2. For seedlings, the initial carbon density is assumed to be 15 g C/m2. The restoration area (highlighted in green in Figure 13) covers approximately 6.5 hectares. The simulation duration is set to 1 month, with all other parameters consistent with previous cases.

5.2.2. Results

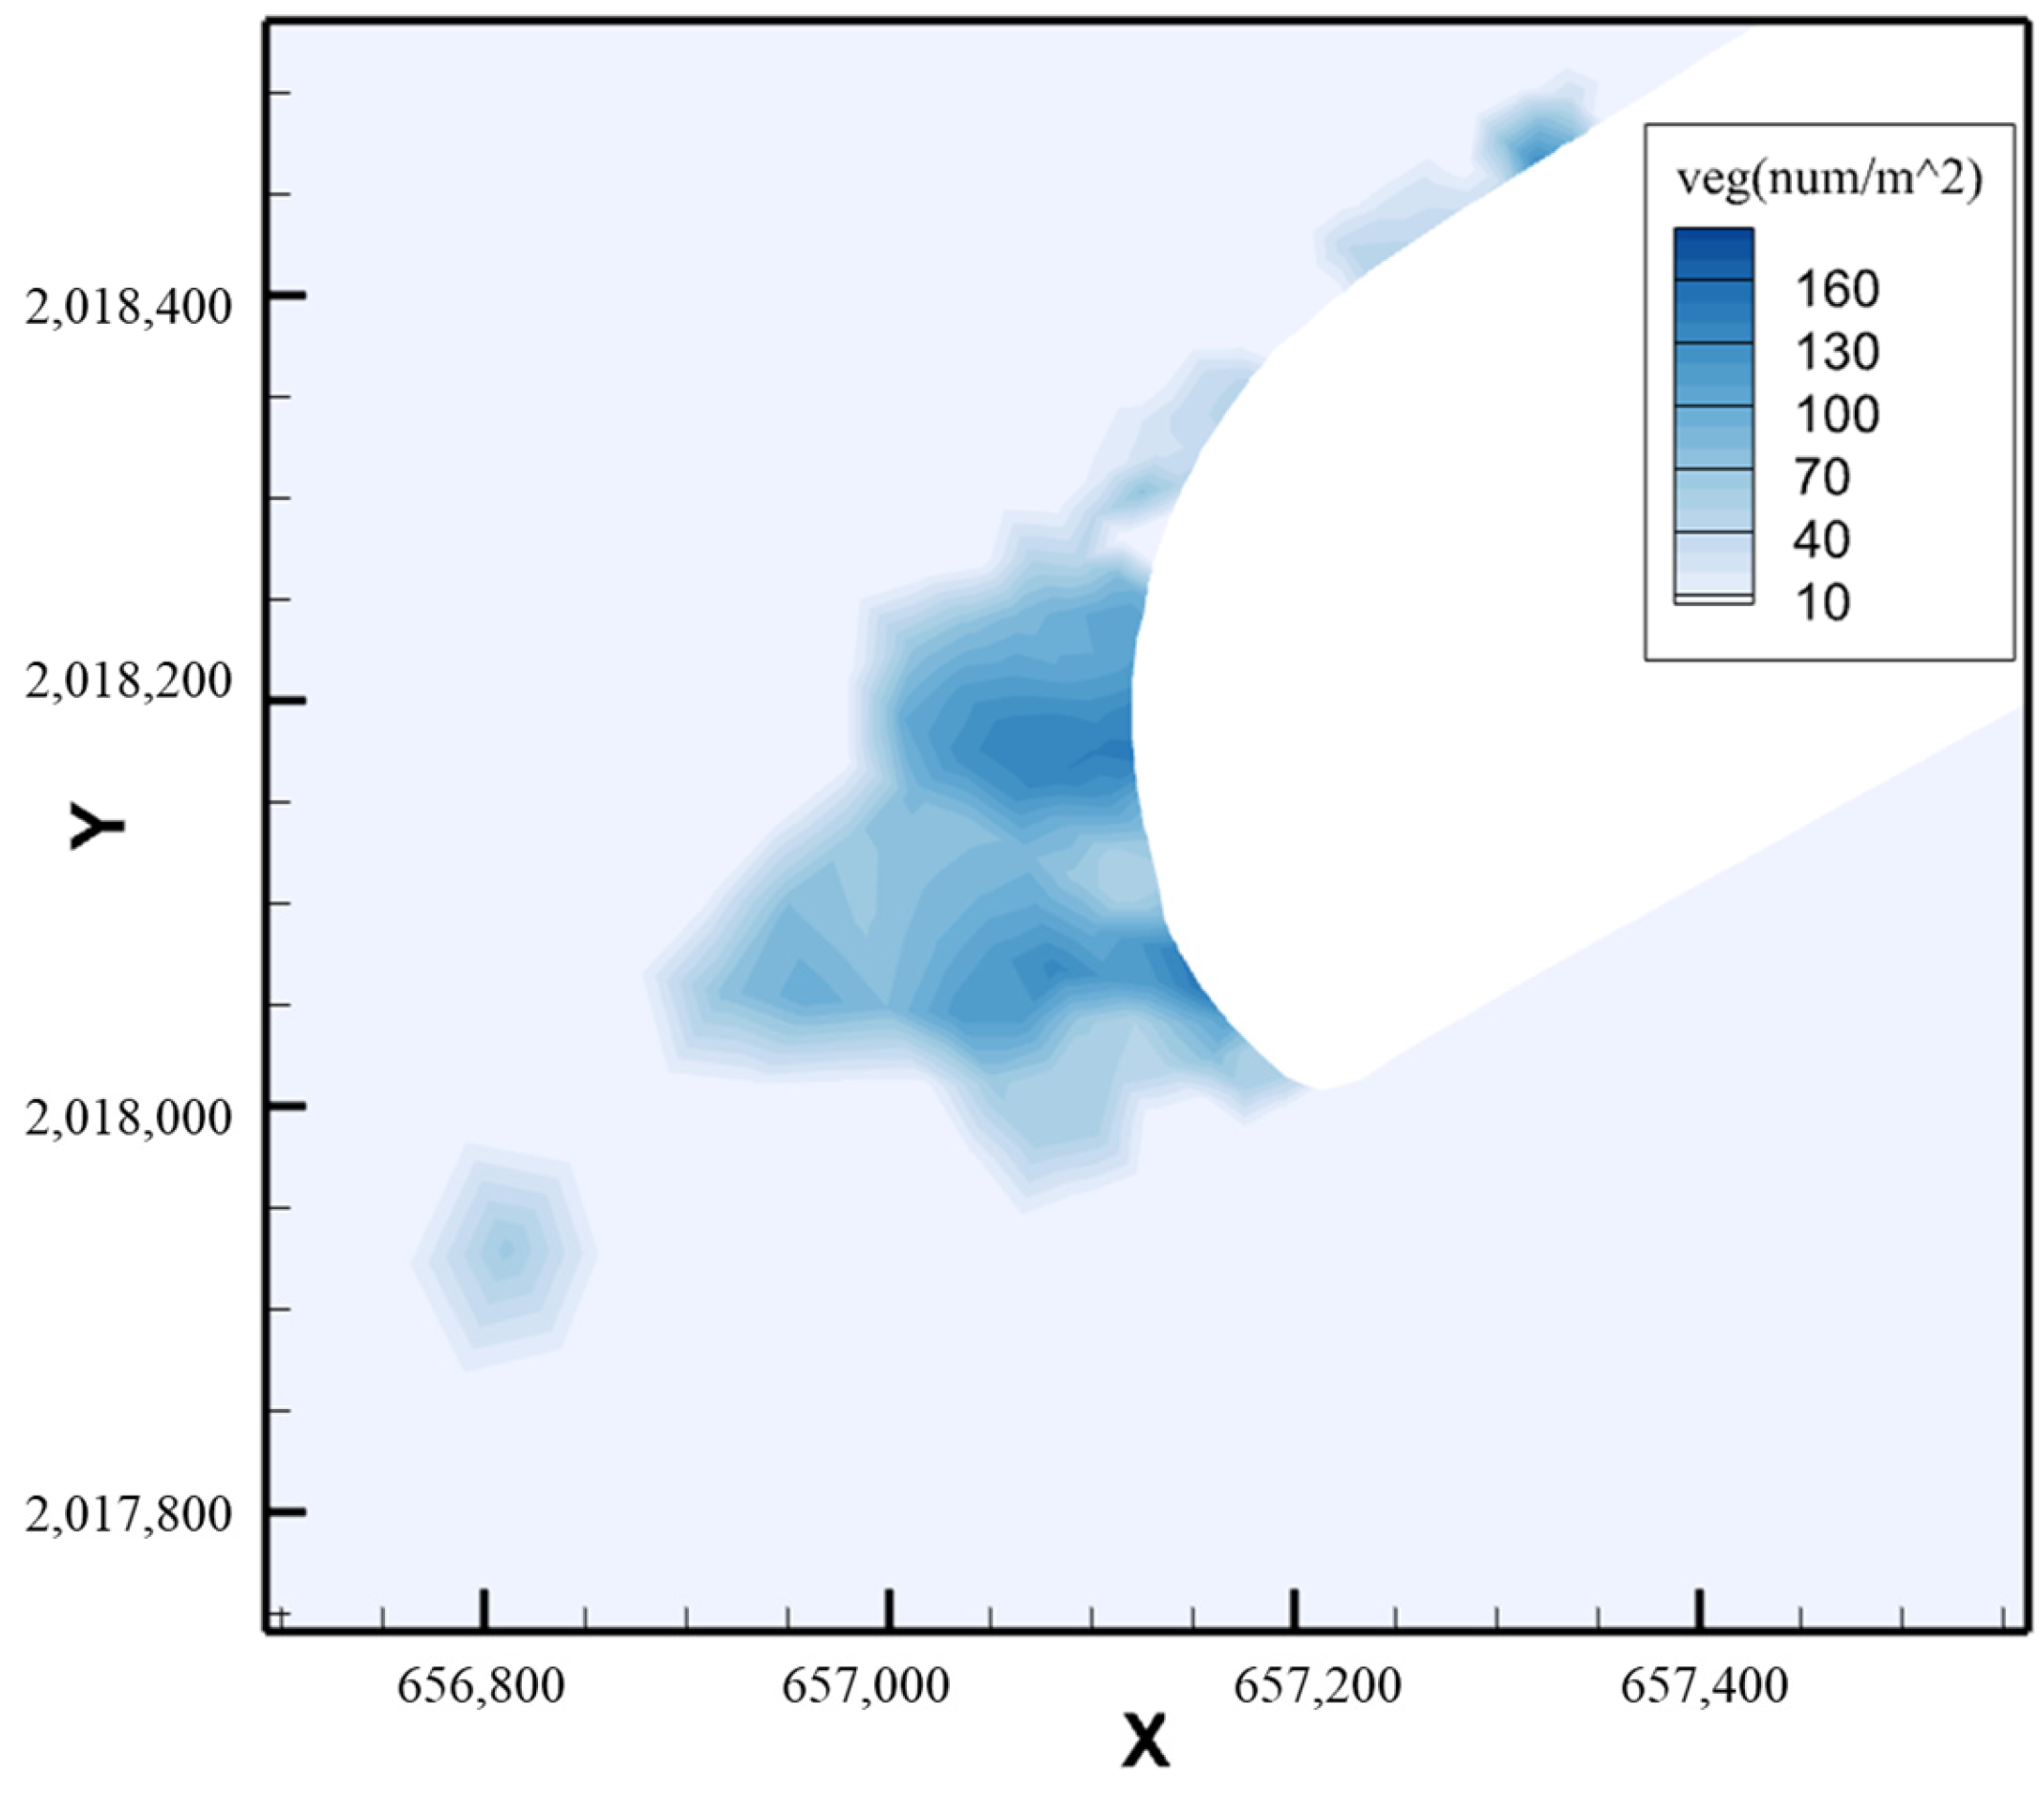
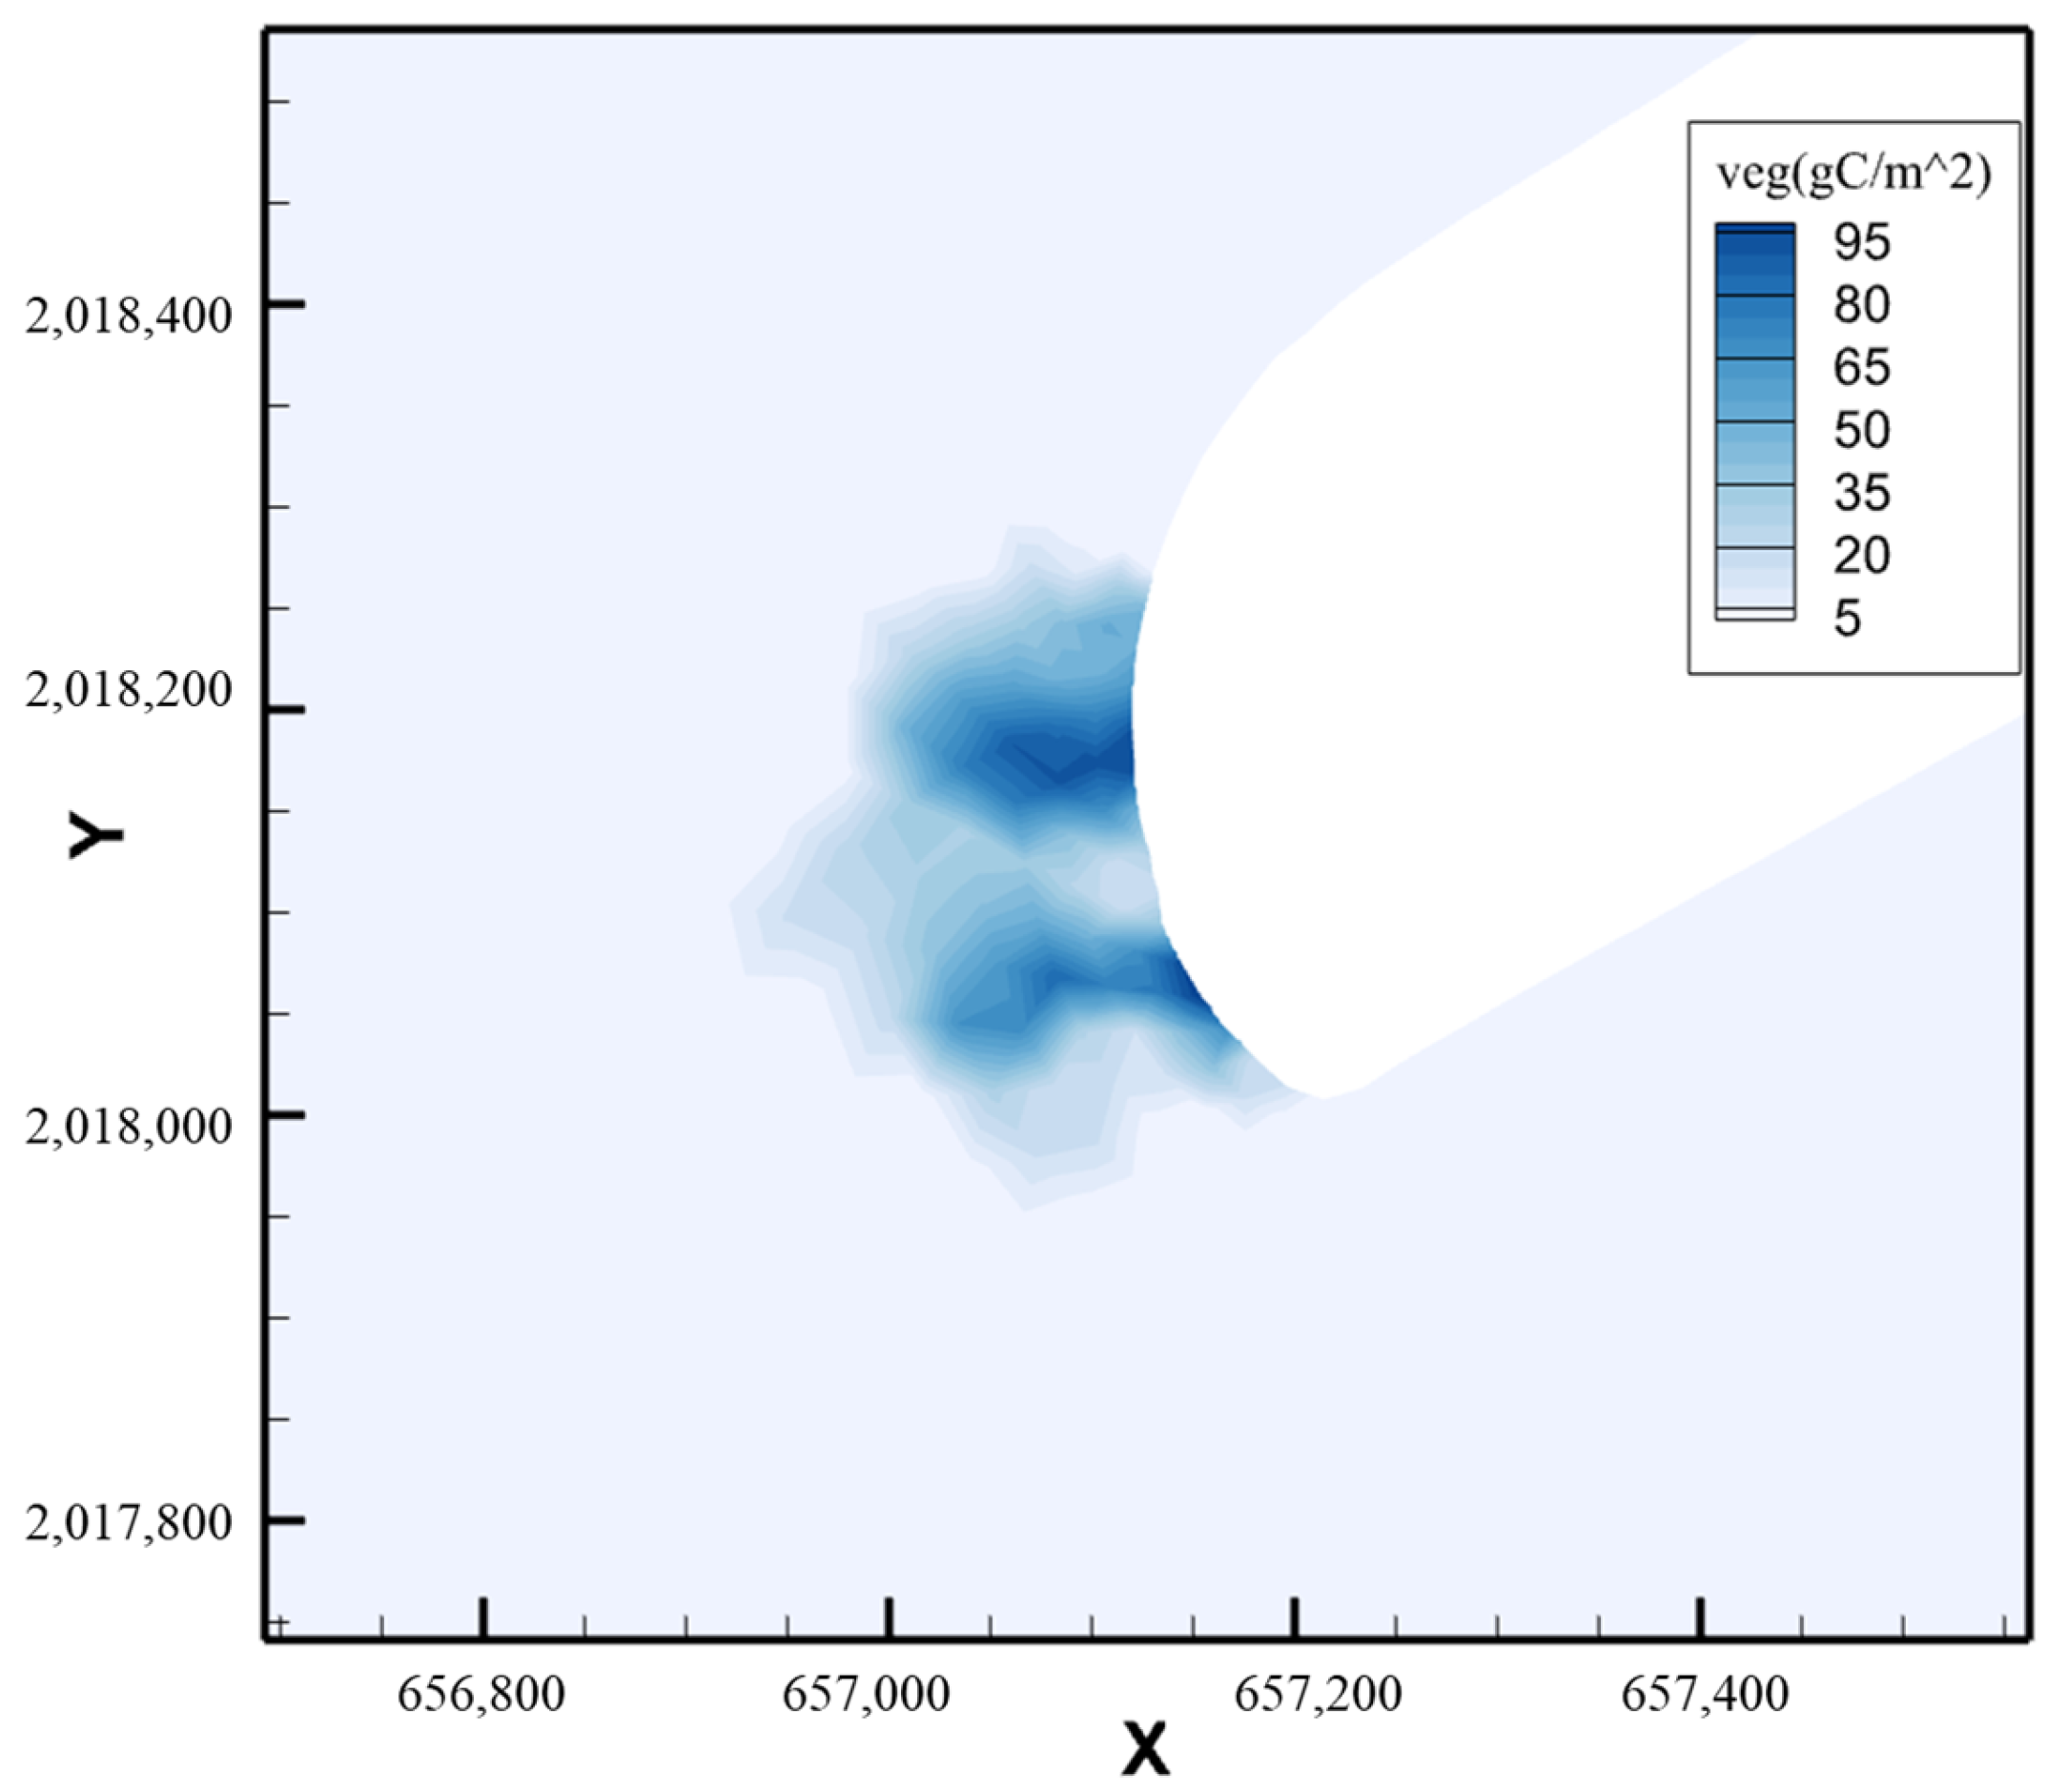
Figure 14 and Figure 15 present the biomass (g C/m2) and shoot density (shoots/m2) after one month of restoration. Key observations include:
(1) The northern and central zones exhibit faster growth, with carbon storage increasing from 15 g C/m2 to over 35 g C/m2 and shoot density rising from 50 to 80 shoots/m2.
(2) The southern zone shows slower growth, with some areas experiencing net mortality (carbon loss exceeding growth rates).
(3) Overall, the restored seagrass bed achieves a total carbon sequestration of ~0.57 Mg within one month, demonstrating its significant carbon sink potential.
(4) Assuming 300 shoots/m2 as the threshold for a restored seagrass bed to approximate natural conditions [24], the results conservatively estimate that natural abundance could be attained within 1 year.
Figure 14. Biomass after one month of seagrass bed restoration.
Jmse 13 02126 g014
Figure 15. Shoot density after one month of seagrass bed restoration.
Jmse 13 02126 g015

6. Conclusions

This study establishes a coupled hydrodynamic tide–wave–ecological model and constructs unstructured grids for different engineering scenarios, followed by tidal level and current validations. The changes in flow fields near the project area and the flow velocities under different schemes and conditions at key monitoring stations were analyzed. Additionally, the carbon sequestration capacities of phytoplankton, zooplankton, suspended particulate matter, and seagrass seedlings were evaluated.
The results indicate that the restoration project influences flow velocities near the Sanya River estuary, showing a trend of reduction in the inner region, increase in the central region, and minimal change in the outer region. The primary productivity in Sanya Bay decreases with the enhancement of hydrodynamic factors (i.e., intensified material exchange). Plan 2 and Plan 3 can sequester an additional 70.8 Mg C and 83.83 Mg C per year, respectively. The restored seagrass bed achieves a total carbon sequestration of approximately 0.57 Mg within one month and can reach natural abundance levels within one year. The long-term effects of sand replenishment engineering require further investigation.
In addition, the particle size of the sediment replenished along the coast, the frequency of sediment replenishment and the stability of the beach may have certain impacts on the survival pressure of benthic organisms. More detailed studies can be conducted in the future.

Author Contributions

Conceptualization, L.W. and Q.Z.; Methodology, L.W., Q.Z. and J.Z.; Software, F.L.; Validation, L.W., F.L. and G.L.; Formal analysis, L.W. and F.L.; Investigation, L.W., G.G. and F.Y.; Resources, L.W., Q.Z. and J.Z.; Data curation, L.W., G.G. and J.Z.; Writing—original draft, L.W., F.L. and F.Y.; Writing—review & editing, L.W., Q.Z., G.G. and G.L.; Visualization, F.L.; Supervision, Q.Z.; Project administration, Q.Z.; Funding acquisition, L.W., J.Z. and G.L. All authors have read and agreed to the published version of the manuscript.

Funding

The authors gratefully acknowledge the financial support from the National Key Research and Development Project of China (2024YFE0101000), Shanghai Municipal Engineering Design Institute (Group) Co., Ltd. Qimingxing Plan Funding (K2023N031), and the Open Funds of State Key Laboratory of Hydraulic Engineering Simulation and Safety of China (Grant No. HESS-2221).

Data Availability Statement

The original contributions presented in the study are included in the article material, further inquiries can be directed to the corresponding author.

Conflicts of Interest

Authors Lulu Wang, Gaogui Guo and Fei Yan were employed by the company Shanghai Municipal Engineering Design Institute (Group) Co., Ltd. The remaining authors declare that the research was conducted in the absence of any commercial or financial relationships that could be construed as a potential conflict of interest.

References

  1. Friedlingstein, P.; Jones, M.; O’Sullivan, M.; Andrew, R.M.; Bakker, D.C.; Hauck, J.; Le Quéré, C.; Peters, G.P.; Peters, W.; Pongratz, J.; et al. Global Carbon Budget 2021. Earth Syst. Sci. Data 2022, 14, 1917–2005. [Google Scholar] [CrossRef]
  2. Wang, Y.Z.; Cai, H.Y.; Yan, Y.; Wang, B.Z.; Pan, H.M.; Zhang, P.; Li, B.; Zhao, T.T.G. Regime shifts in the thermal dynamics of offshore China due to accelerated global warming. Sci. Total Environ. 2024, 949, 174882. [Google Scholar] [CrossRef] [PubMed]
  3. Zhang, B.Y.; He, Y.L.; Guan, X.D. Increasing trends of land and coastal heatwaves under global warming. Atmos. Res. 2025, 318, 108007. [Google Scholar] [CrossRef]
  4. Wang, B.; Liu, Q.; Wang, L.; Chen, Y.Z.; Wang, J.S. A review of the port carbon emission sources and related emission reduction technical measures. Environ. Pollut. 2023, 320, 121000. [Google Scholar] [CrossRef]
  5. Ge, M.; Ren, L.; Yang, D.; Li, X.Z.; Huang, Y.; Tang, J.W.; Hans, B. Invasion of Spartina species enhance blue carbon functions by increasing CO2 uptake and reducing methane emissions in Chinese and Danish coastal wetlands. J. Clean. Prod. 2025, 508, 145596. [Google Scholar] [CrossRef]
  6. Jiao, N.Z. Developing ocean negative carbon emission technology to support national carbon neutralization. Bull. Chin. Acad. Sci. 2021, 36, 179–187. [Google Scholar]
  7. Wang, W.L.; Fu, W.W.; Moigne, F.A.C.; Letscher, R.T.; Liu, Y.; Tang, J.M.; Primeau, F.W. Biological carbon pump estimate based on multidecadal hydrographic data. Nature 2023, 624, 579–585. [Google Scholar] [CrossRef]
  8. Yang, X.Y.; Wang, C.J.; Liu, C.; Liu, Z.; Liu, B.Q.; Xu, C.X. Assessing the spatio evolution of carbon sequestration and optimizing ecological restoration strategies using the InVEST model: A case study of the Yellow River Estuary, China. Mar. Environ. Res. 2025, 209, 107204. [Google Scholar] [CrossRef]
  9. Tang, Q.S.; Zhang, J.H.; Fang, J.G. Shellfish and seaweed mariculture increase atmospheric CO2 absorption by coastal ecosystems. Mar. Ecol. Prog. Ser. 2011, 424, 97–104. [Google Scholar] [CrossRef]
  10. Han, T.T.; Shi, R.J.; Qi, Z.H.; Liu, Q.X.; Huang, H.H. Role of intensive mariculture on CO2 absorption and carbon burial, and the carbon sink potential of Sanggou Bay, China. Aquaculture 2025, 597, 741936. [Google Scholar] [CrossRef]
  11. Mao, Y.J.; Sun, J.; Guo, C.C.; Yang, S.; Wei, Y.Q. Sinking rates of phytoplankton in response to cell size and carbon biomass: A case study in the northeastern South China Sea. J. Mar. Syst. 2023, 240, 103885. [Google Scholar] [CrossRef]
  12. Wang, N.; Li, J.M.; Zhou, Y.F. Mechanism of action of marine ecological restoration on ecological, economic, and social benefits—An empirical analysis based on a structural equation model. Ocean Coast. Manag. 2024, 248, 106950. [Google Scholar] [CrossRef]
  13. Gao, J.Z.; Ding, J.; Gu, X.Y.; Li, G.Q.; Yang, X.; Sun, M.; Zhang, K.C. Developing ecological restoration strategies based on carbon storage assessment. J. Sea Res. 2024, 202, 102539. [Google Scholar] [CrossRef]
  14. Wu, Y.J.; Su, J.F.; Yang, Y.; Fan, D.D. Artificial island construction exacerbates storm-induced loss of buried estuarine carbon. Limnol. Oceanogr. Lett. 2025, 10, 782–791. [Google Scholar] [CrossRef]
  15. Google Earth. Google Earth [Software], Google Earth: Mountain View, CA, USA, 2024. Available online: https://www.google.com/earth/ (accessed on 1 October 2024).
  16. Fasham, M.J.R.; Ducklow, H.W.; McKelvie, S.M. A nitrogen-based model of plankton dynamics in the oceanic mixed layer. J. Mar. Res. 1990, 48, 591–639. [Google Scholar] [CrossRef]
  17. Heinle, A.; Slawig, T. Internal dynamics of NPZD ecosystem models. Ecol. Model. 2013, 254, 33–42. [Google Scholar] [CrossRef]
  18. Fennel, K.; Losch, M.; Schröter, J.; Manfred, W. Testing a marine ecosystem model: Sensitivity analysis and parameter optimization. J. Mar. Syst. 2001, 28, 45–63. [Google Scholar] [CrossRef]
  19. Thi, N.Y.; Hang, M.; Cao, N.Y.; Hiroyuki, Y.; Kenichi, K. Applications of a new ecosystem model to study the dynamics of phytoplankton and nutrient in the Ariake Sea west coast of Kyushu Japan. J. Mar. Syst. 2009, 75, 1–16. [Google Scholar] [CrossRef]
  20. Fulton, E.A.; Smith, A.D.M.; Johnson, C.R. Effect of complexity on marine ecosystem models. Mar. Ecol. Prog. Ser. 2003, 253, 1–16. [Google Scholar] [CrossRef]
  21. Raick, C.; Soetaert, K.; Grégoire, M. Model complexity and performance: How far can we simplify? Prog. Oceanogr. 2006, 70, 27–57. [Google Scholar] [CrossRef]
  22. Seawater Quality Monitoring Information Disclosure System. 2025. [Website]. Available online: http://ep.nmemc.org.cn:8888/Water/ (accessed on 1 October 2024).
  23. Gao, Y.P.; Fang, J.G.; Tang, W.; Zhang, J.H.; Ren, L.H.; Du, M.R. Seagrass meadow carbon sink and amplification of the carbon sink for eelgrass bed in Sanggou Bay. Prog. Fish. Sci. 2013, 34, 17–21. (In Chinese) [Google Scholar]
  24. Wu, Z.J.; Chen, S.Q.; Shi, Q.; Cai, Z.F.; Shen, J.; Luo, L.Z.; Wang, D.R. Analysis of distribution change and restoration suggestion of the seagrass beds in Hainan Island. Mar. Environ. Sci. 2021, 4, 542–549. [Google Scholar]
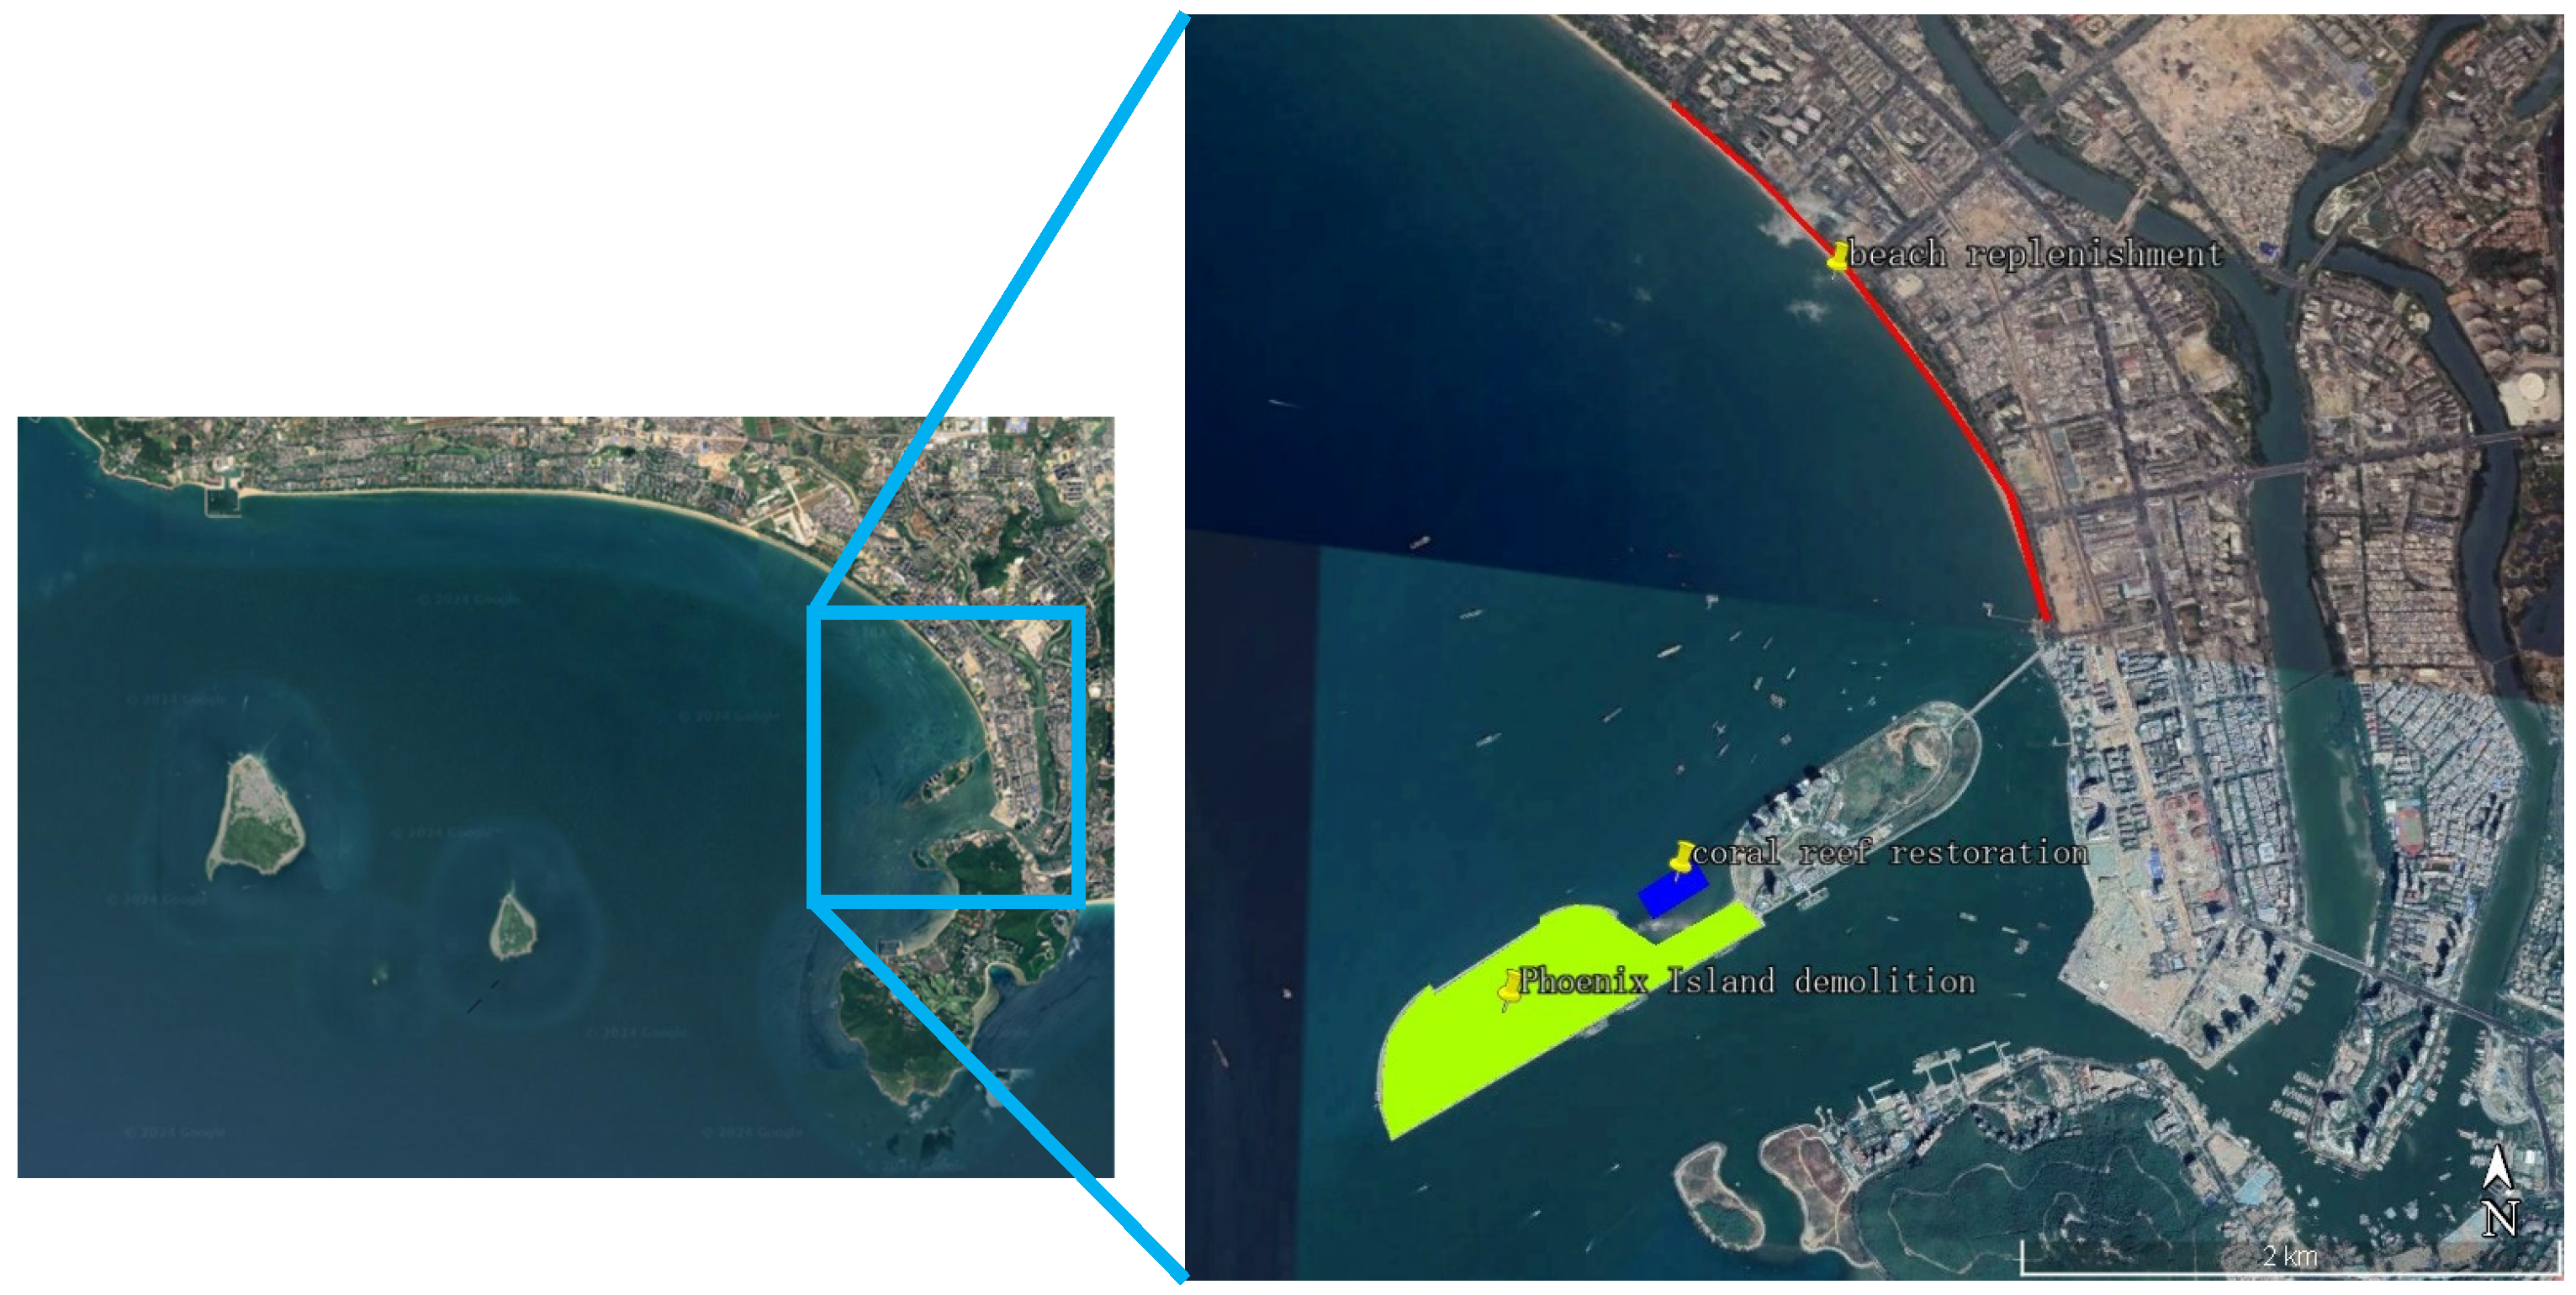
Figure 1. Sanya Bay’s satellite image and ecological restoration project location from google earth [15].
Jmse 13 02126 g001
Figure 2. Wave rose diagram of Dongdao Island in Sanya Bay from April 2017 to April 2018.
Jmse 13 02126 g002
Figure 3. Grid Topography: (a) Complete Grid; (b) Sanya Bay Grid Before Removal of Artificial Island; (c) Sanya Bay Grid After Removal of Artificial Island. The red rectangular frame in (a) represents the position of Sanya Bay.
Jmse 13 02126 g003
Figure 4. Distribution of Tide and Current Verification Stations (google earth, 2024).
Jmse 13 02126 g004
Figure 5. Comparison of Measured and Calculated Tide Levels from 26 to 27 April 2016: (a) T1; (b) T2.
Jmse 13 02126 g005
Figure 6. Comparison of Measured and Calculated Current Velocities from 26 to 27 April 2016: (a) V1; (b) V2; (c) V3; (d) V4.
Jmse 13 02126 g006
Figure 7. Comparison of Measured and Calculated Current Directions from 26 to 27 April 2016: (a) V1; (b) V2; (c) V3; (d) V4.
Jmse 13 02126 g007
Figure 8. Tidal current velocity distribution near the artificial island under the tide-only condition during spring high tide for the three plans: (a) Plan 1; (b) Plan 2; (c) Plan 3.
Jmse 13 02126 g008
Figure 9. Wave height and wave direction distribution under the three working conditions of (a) S, (b) SSE and (c) typhoon waves before the project. Yellow colors in images referred to mainland or islands.
Jmse 13 02126 g009
Figure 10. Locations of current velocity stations.
Jmse 13 02126 g010
Figure 11. Velocity at monitoring points under four conditions: (a) Condition 1 Point 1; (b) Condition 1 Point 2; (c) Condition 1 Point 3; (d) Condition 1 Point 4; (e) Condition 2 Point 1; (f) Condition 2 Point 2; (g) Condition 2 Point 3; (h) Condition 2 Point 4 (i) Condition 3 Point 1; (j) Condition 3 Point 2; (k) Condition 3 Point 3; (l) Condition 3 Point 4; (m) Condition 4 Point 1; (n) Condition 4 Point 2; (o) Condition 4 Point 3; (p) Condition 4 Point 4.
Jmse 13 02126 g011aJmse 13 02126 g011b
Figure 12. Total carbon storage in Sanya Bay under the three plans.
Jmse 13 02126 g012
Figure 13. Seagrass bed restoration area (green zone).
Jmse 13 02126 g013
Table 1. Comparison of phytoplankton primary productivity in Sanya Bay under different conditions (Mg C/d).
PlanPlan 1Plan 2Plan 3Plan2-Plan1Plan3-Plan1
Pure tide12.5512.7912.890.2450.347
Tide + S11.7411.8911.850.1550.110
Tide + SSE12.1412.3012.270.1700.134
Tide + typhoon6.966.956.94−0.0148−0.0255
Table 2. Annual carbon sequestration calculation for different plans.
Plan 1Carbon Sink (Mg C)
Plan 123
Pure tide51.32349.922394.862413.59
Tide + S20857.02867.97865.05
Tide + SSE261152.091167.271164.42
Tide + typhoon2.768.5968.4968.39
Total1004427.624498.604511.45
Disclaimer/Publisher’s Note: The statements, opinions and data contained in all publications are solely those of the individual author(s) and contributor(s) and not of MDPI and/or the editor(s). MDPI and/or the editor(s) disclaim responsibility for any injury to people or property resulting from any ideas, methods, instructions or products referred to in the content.