1. Introduction
Against the dual backdrop of global climate change and energy transition, the development of clean, stable, and low-carbon energy sources has become a consensus within the international community. Among various types of renewable energies, nuclear power plays a pivotal role in China’s energy strategy. It serves as a crucial clean energy source to meet the national growing electricity demand, optimize the energy mix, ensure energy security, thus promoting sustainable economic growth [
1]. As the “first line of defense” for reactor cooling source safety, the water intake structure is recognized as an important part of nuclear power plants, of which the reliable functionality directly determines the safety of operation and the economic effectiveness [
2]. Consequently, ensuring unimpeded water intake and maintaining the security of cooling sources are paramount for the stable operation of coastal nuclear power plants.
However, the alterations in marine environment caused by global warming have accelerated the melting of Arctic ice sheets and intensified sea ice fragmentation. In cold regions, driven by wind and tidal currents, the water intake facilities might face the challenge of being invaded by floating ice. The substantial accumulation and blocking caused by floating ice will lead to the clogging of trash racks, the decrease in circulating water pump efficiency, and even severe consequences such as the unit load reduction or shutdown [
3]. To date, multiple blockage incidents at global nuclear power plants have been reported [
4]. For instance, at a nuclear power plant in Bohai Bay, China, the blockage of coarse trash racks generated by floating ice in winter reduces the circulating water pump efficiency by up to 18%, which will trigger safety shutdowns in severe cases. Under the circumstance, the safety of nuclear power cooling systems is receiving increasing attention worldwide [
5,
6,
7]. Knowledge of the accumulation evolution of floating ice within the pump house and its interaction with the flow field is essential for guiding the design and construction of water intake facilities for nuclear power plants.
The internal structure of water intake pump-houses at coastal nuclear power plants is complex. During operation, vortical flows are generated at different levels [
8]. The strong rotational effects in the bottom water flow can cause floating ice originally on the water surface to be suddenly entrained into the bottom layer and drawn into the intake [
9]. Additionally, some large floating ice will be fragmented into more small pieces. Due to the complexity of the internal flow field, the entrained ice is subjected to the influences of changing buoyancy and suction in different areas, which will make the motion and accumulation behaviors of ice be complicated [
10].
The interaction between floating ice and water intake structures can alter the flow passage geometry, induce local flow separation, enhance turbulent kinetic energy dissipation, reduce cooling water transport efficiency, and threaten the structural integrity of pumping units. The development of numerical simulation approach offers an effective tool for the in-depth investigation of these phenomena. In recent years, the Discrete Element Method (DEM) has been recognized as one of the preferred approaches for simulating the motion, accumulation, and collision of floating ice. Its fundamental principle is treating floating ice on the water surface as a set of discrete units, each of which obeys the motion equations. Using a time-stepping algorithm, the motion patterns of individual ice units can be determined [
11]. To date, the DEM model has been widely used to simulate the interactions between ice pieces and the interactions between ice and structures. Hopkins and Daly [
12] applied the DEM to river ice interactions with bridge piers, revealing ice accumulation mechanisms and loads on structures. However, such early models often employed significant simplifications of the ice (e.g., uniformly sized circular ice floes) and were typically coupled with one-dimensional or simplified hydrodynamic models, which limited the precise capture of the complex ice-water-structure coupling within intricate three-dimensional flow fields. Similarly, the review by Islam et al. [
13] focused on the interactions between floating ice and ships and offshore platforms, highlighting the critical importance of Ice Management and Dynamic Positioning systems in such engineering applications. Their work systematically categorized various numerical methods but also pointed out that most high-fidelity computational methods, including DEM (as well as FEM and SPH), typically incur high computational costs, making them unsuitable for real-time simulations—a major bottleneck for their application in engineering decision support.
Furthermore, Stockstill et al. [
14] introduced the DEM into numerical simulations of sea ice, specifically modeling the ice transport capacity of the Harlan Water Tunnel. Tang et al. [
15] employed the DEM to simulate the interaction between a ship’s hull and floating ice, revealing the impact of ice collision and accumulation on hull resistance. Long et al. [
16] used the DEM to simulate ice failure modes and loads on a conical structure during interaction with sea ice. While these studies contributed to advancing DEM applications, they primarily focused on collision problems in open-water scenarios. Their models also exhibited limitations in accurately reproducing the highly complex, strongly recirculating flow fields characteristic of confined spaces like nuclear power plant pump houses, which represents the key gap the present study aims to address.
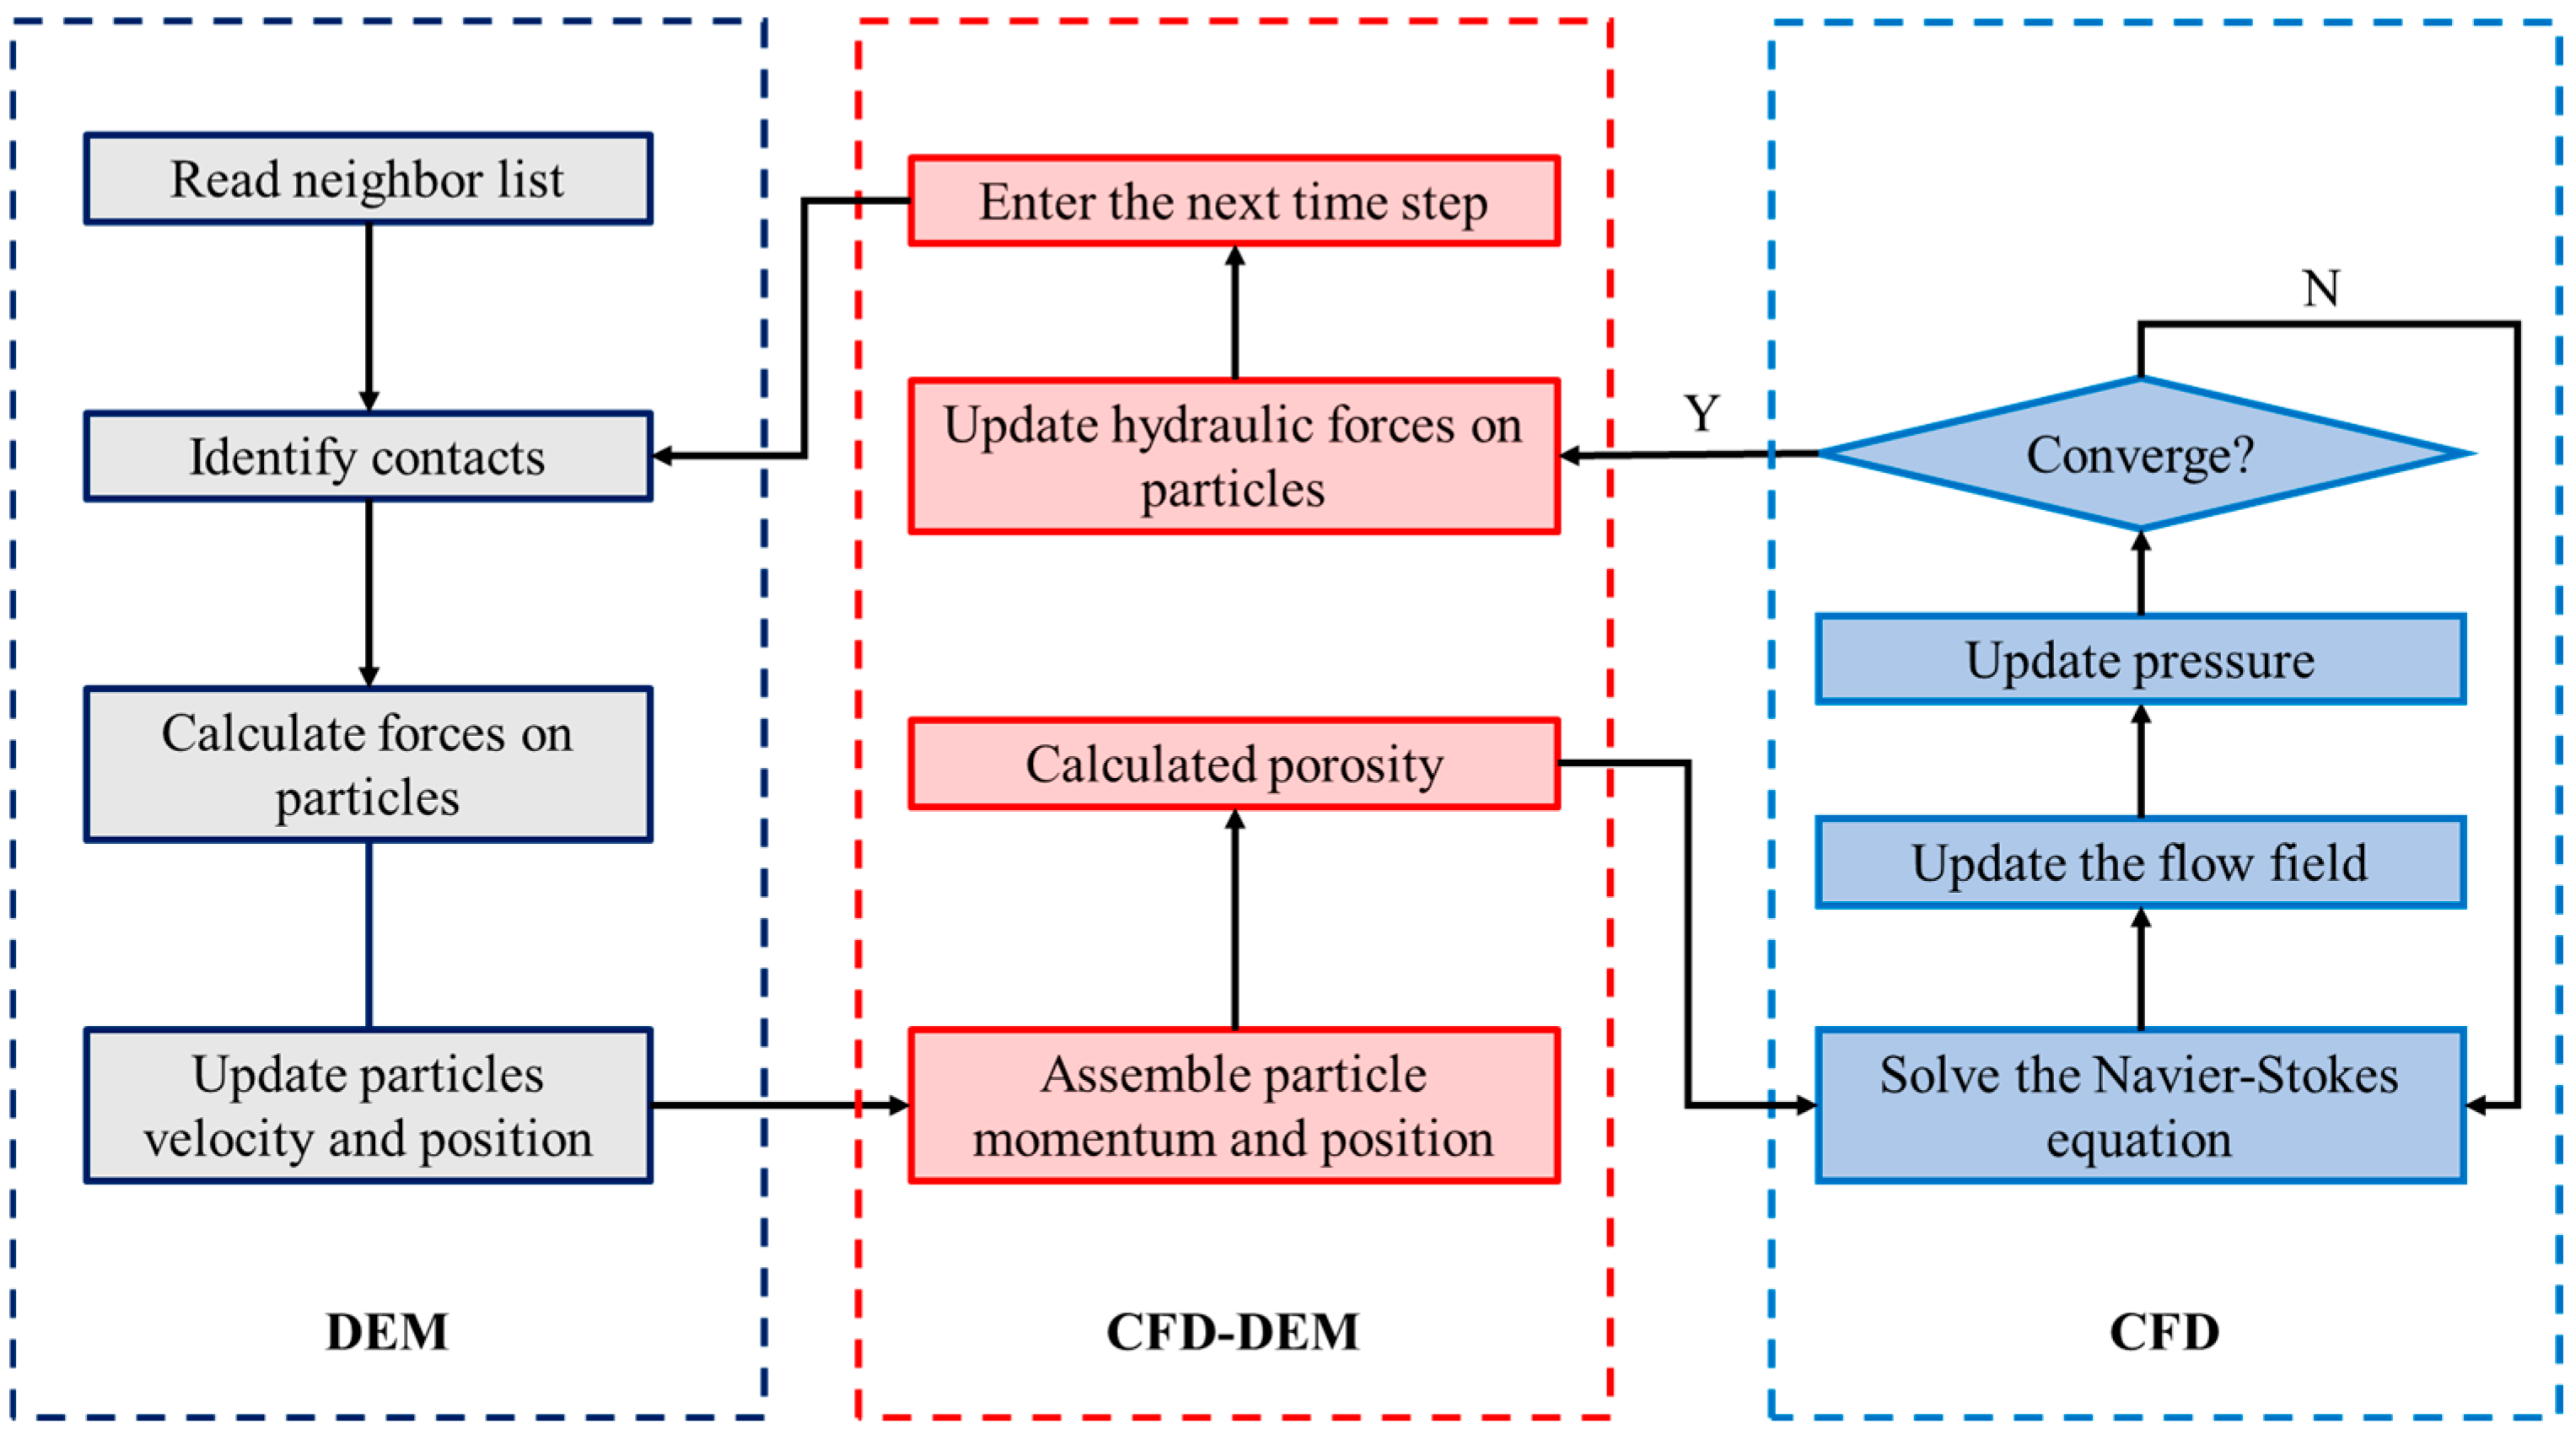
To solve more complex problems involving ice-water-structure interaction, the Computational Fluid Dynamics (CFD) method coupled with DEM (CFD-DEM) has gradually been adopted [
17,
18]. The CFD-DEM approach offers a fundamentally augmented capability over the standalone DEM by quantitatively resolving key fluid-particle interaction forces, such as drag and buoyancy. This capacity thereby enables a more physically accurate representation of both the macroscopic dynamics and mesoscopic mechanisms within particulate systems under fluid influence. The fidelity of this quantitative resolution is underscored by two principal advancements. Firstly, resolved coupling models directly compute the local flow field around particles, obviating the need for empirical drag closures [
19]. Secondly, refined algorithms in unresolved coupling schemes substantially diminish the influence of numerical parameters on force calculation accuracy [
20]. It is by virtue of these capabilities that the CFD-DEM framework proves paramount for addressing complex multiscale fluid-solid interaction challenges, spanning from fundamental mesoscopic investigations to practical engineering-scale analyses [
21]. Regarding CFD-DEM based research on floating ice, Luo et al. [
22] investigated the influence of different particle shapes. Ning et al. [
23] simulated the mechanical behavior of floating ice under different conditions using DEM, noting the influence of the ratio of ice thickness to particle diameter on flexural strength during simulation. Hayo et al. [
24] developed a model for the dynamic response of an offshore structure interacting with a drifting ice floe failing in crushing, accurately predicting multiple modes of ice motion.
Although many studies associated with ice–flow interactions have been presented in the previous literature, their focus lies in the contact models and methodological implementations for areas such as structure collisions, ship–ice interactions, and river ice jams. However, limited attention has been paid to the internal floating-ice dynamics that occur within confined engineering systems, particularly in the intake pump houses of nuclear power plants. Currently, there is a lack of research that reveals the motion and accumulation characteristics of floating ice inside water intake pump houses for cooling sources at nuclear power plants, the results of which can provide references for the design, construction, and optimization of water intake facilities. While the CFD–DEM framework has been widely applied to ice–structure and ship–ice interaction problems, its application to the internal floating-ice dynamics of nuclear power plant intake pump houses represents a new and critical research direction. To the best of our knowledge, no study has systematically applied a fully coupled CFD–DEM model to investigate the transient accumulation and transport of floating ice and its bidirectional interaction with the confined, highly recirculating flow field within coastal intake systems.
With the aim of addressing the potential threat posed by floating ice within the pump houses of nuclear power plants in cold regions to operational safety, this study employs a bidirectional CFD–DEM coupling method to investigate the migration and accumulation processes of small-scale floating ice released from different locations and their dynamic impact on the flow field. The main objectives of this study are: (1) simulate the transient migration and accumulation of small-scale floating ice released from different positions within the pump house; (2) quantify the resulting variations in the internal flow field and vortex dynamics; and (3) evaluate the spatial characteristics of hydrodynamic disturbances induced by ice accumulation. The central hypothesis is that the initial release position and elevation of floating ice are the dominant factors governing both the final accumulation morphology and the spatial intensity of flow-field disturbances, providing a physical basis for anti-ice design and safety assessment of nuclear intake systems. The novelty of this work lies in establishing quantitative predictive relationships between ice-release parameters and flow responses, and in uncovering new physical mechanisms governing flow-field reorganization and secondary accumulation under different ice-release scenarios. The remainder of this paper is summarized as follows.
Section 2 briefly introduces the methodology consisting of the governing equations and coupling procedure. In
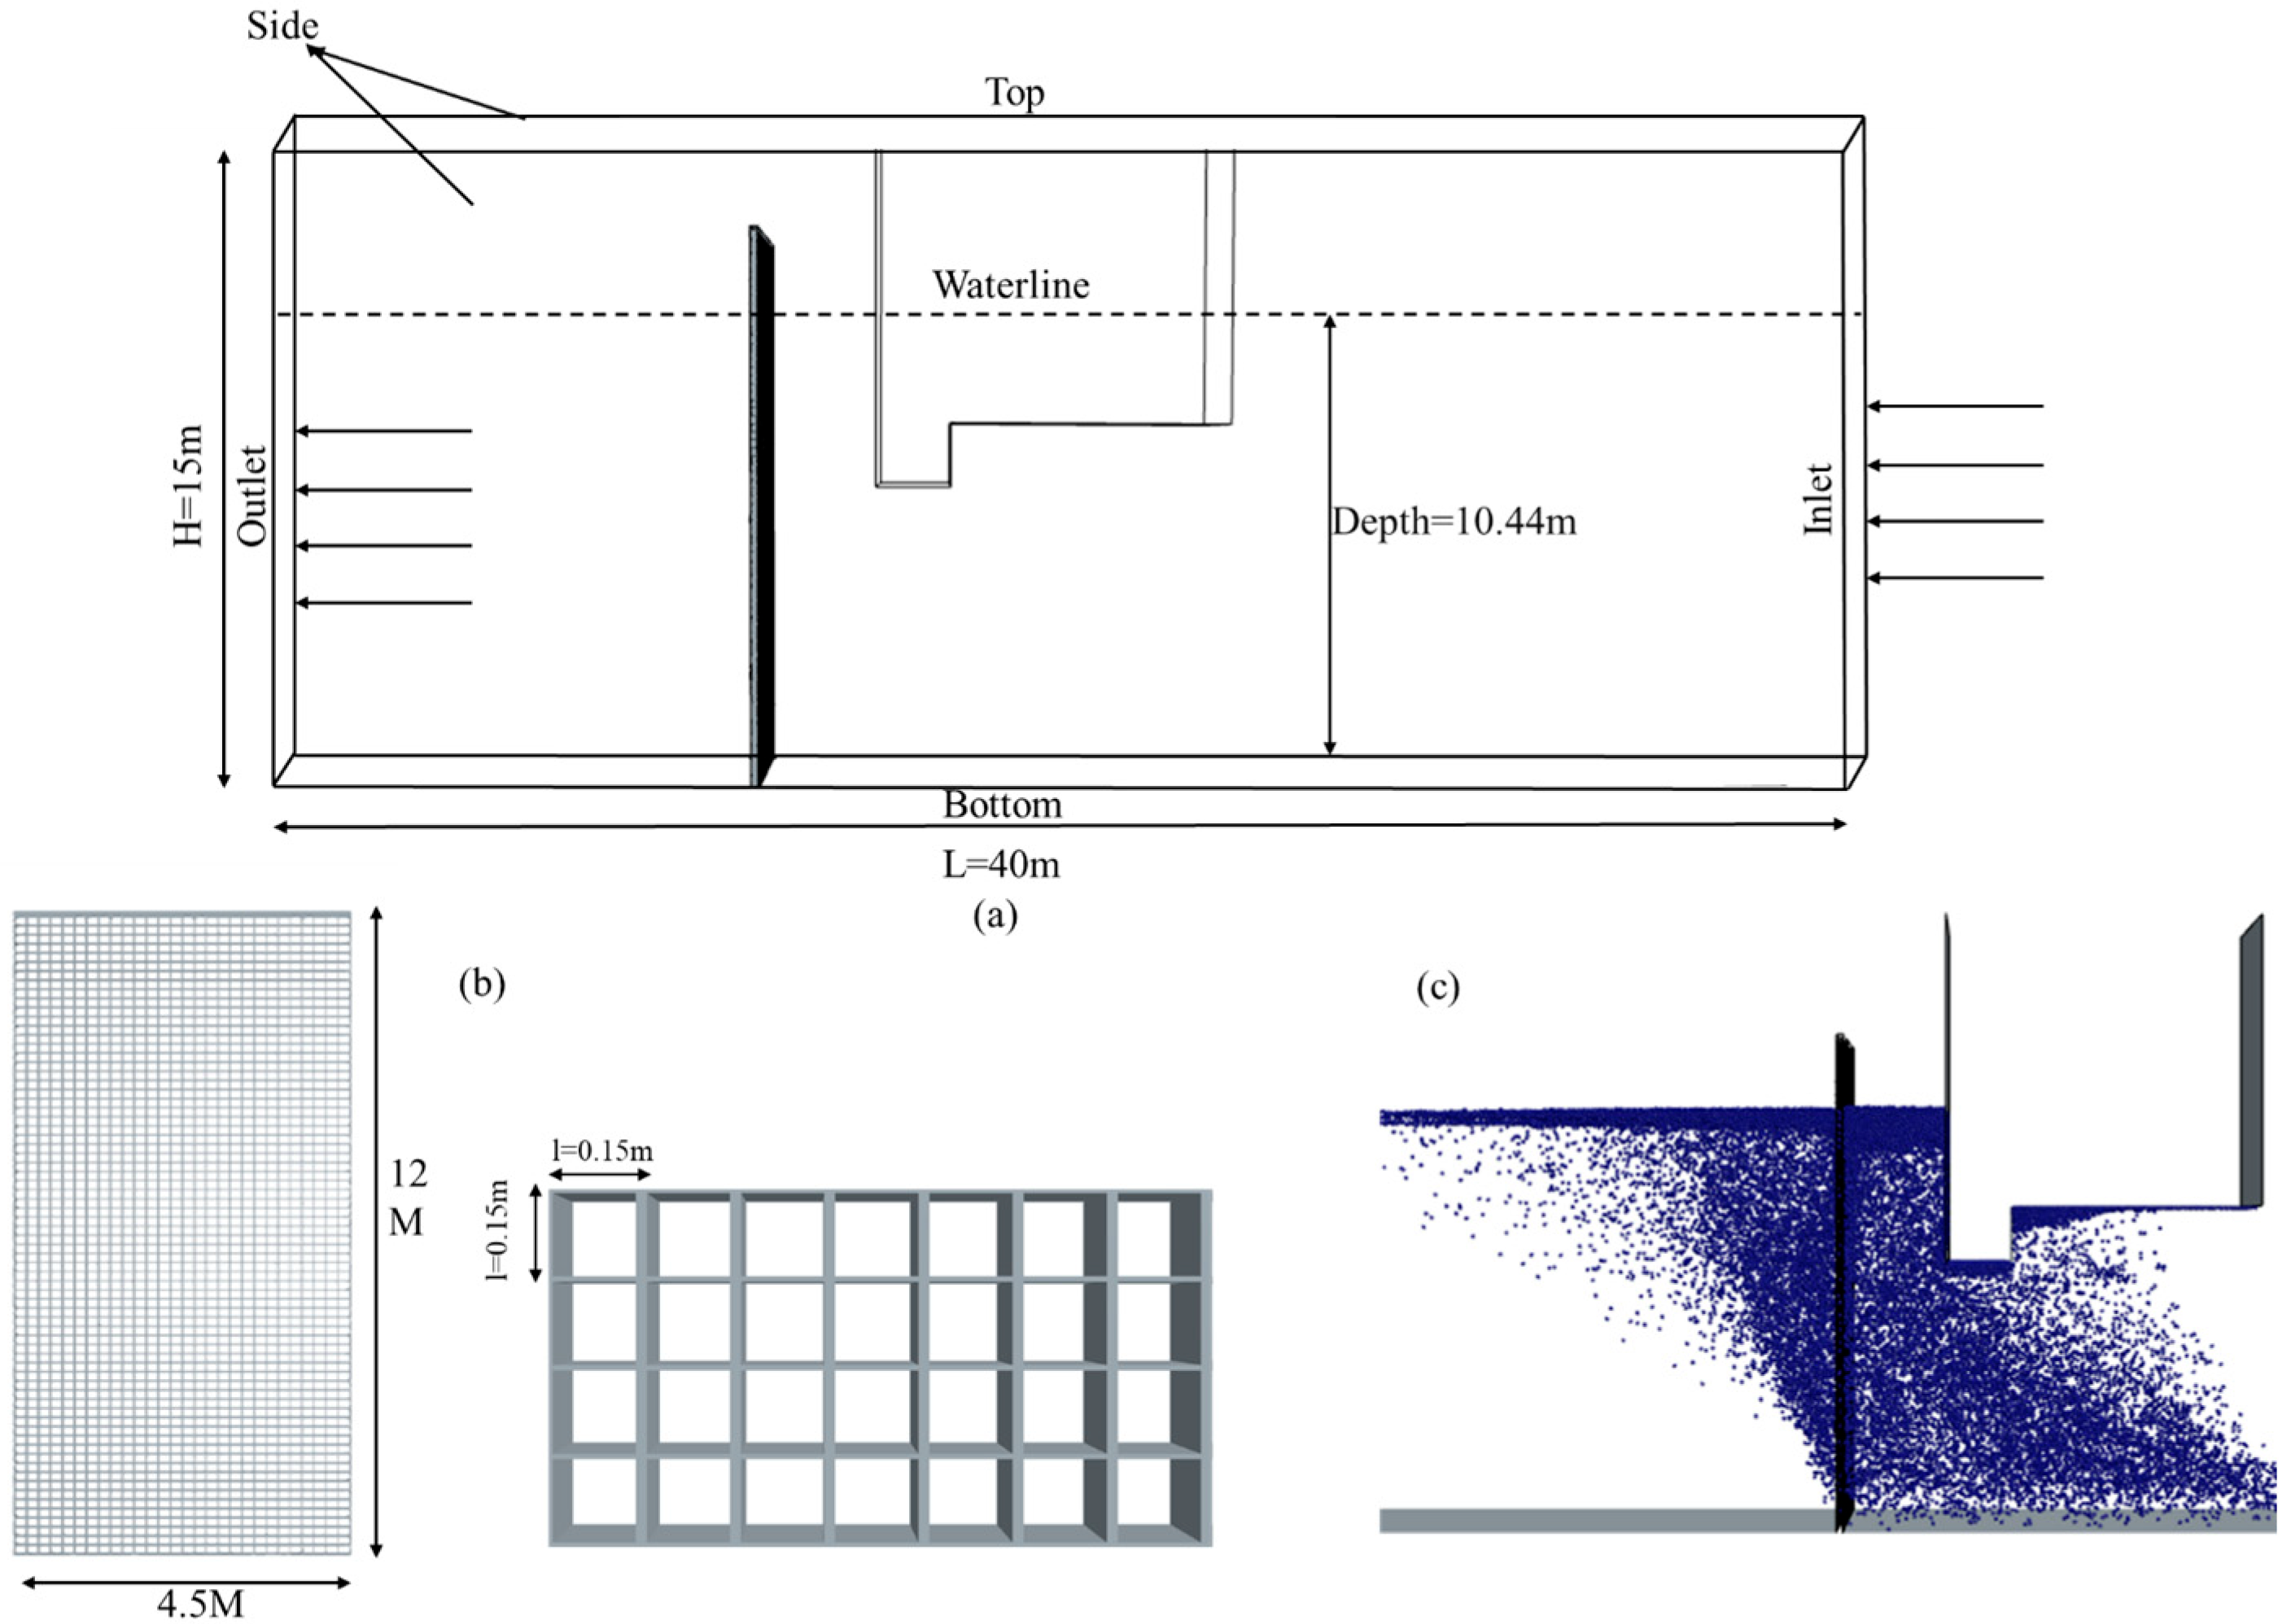
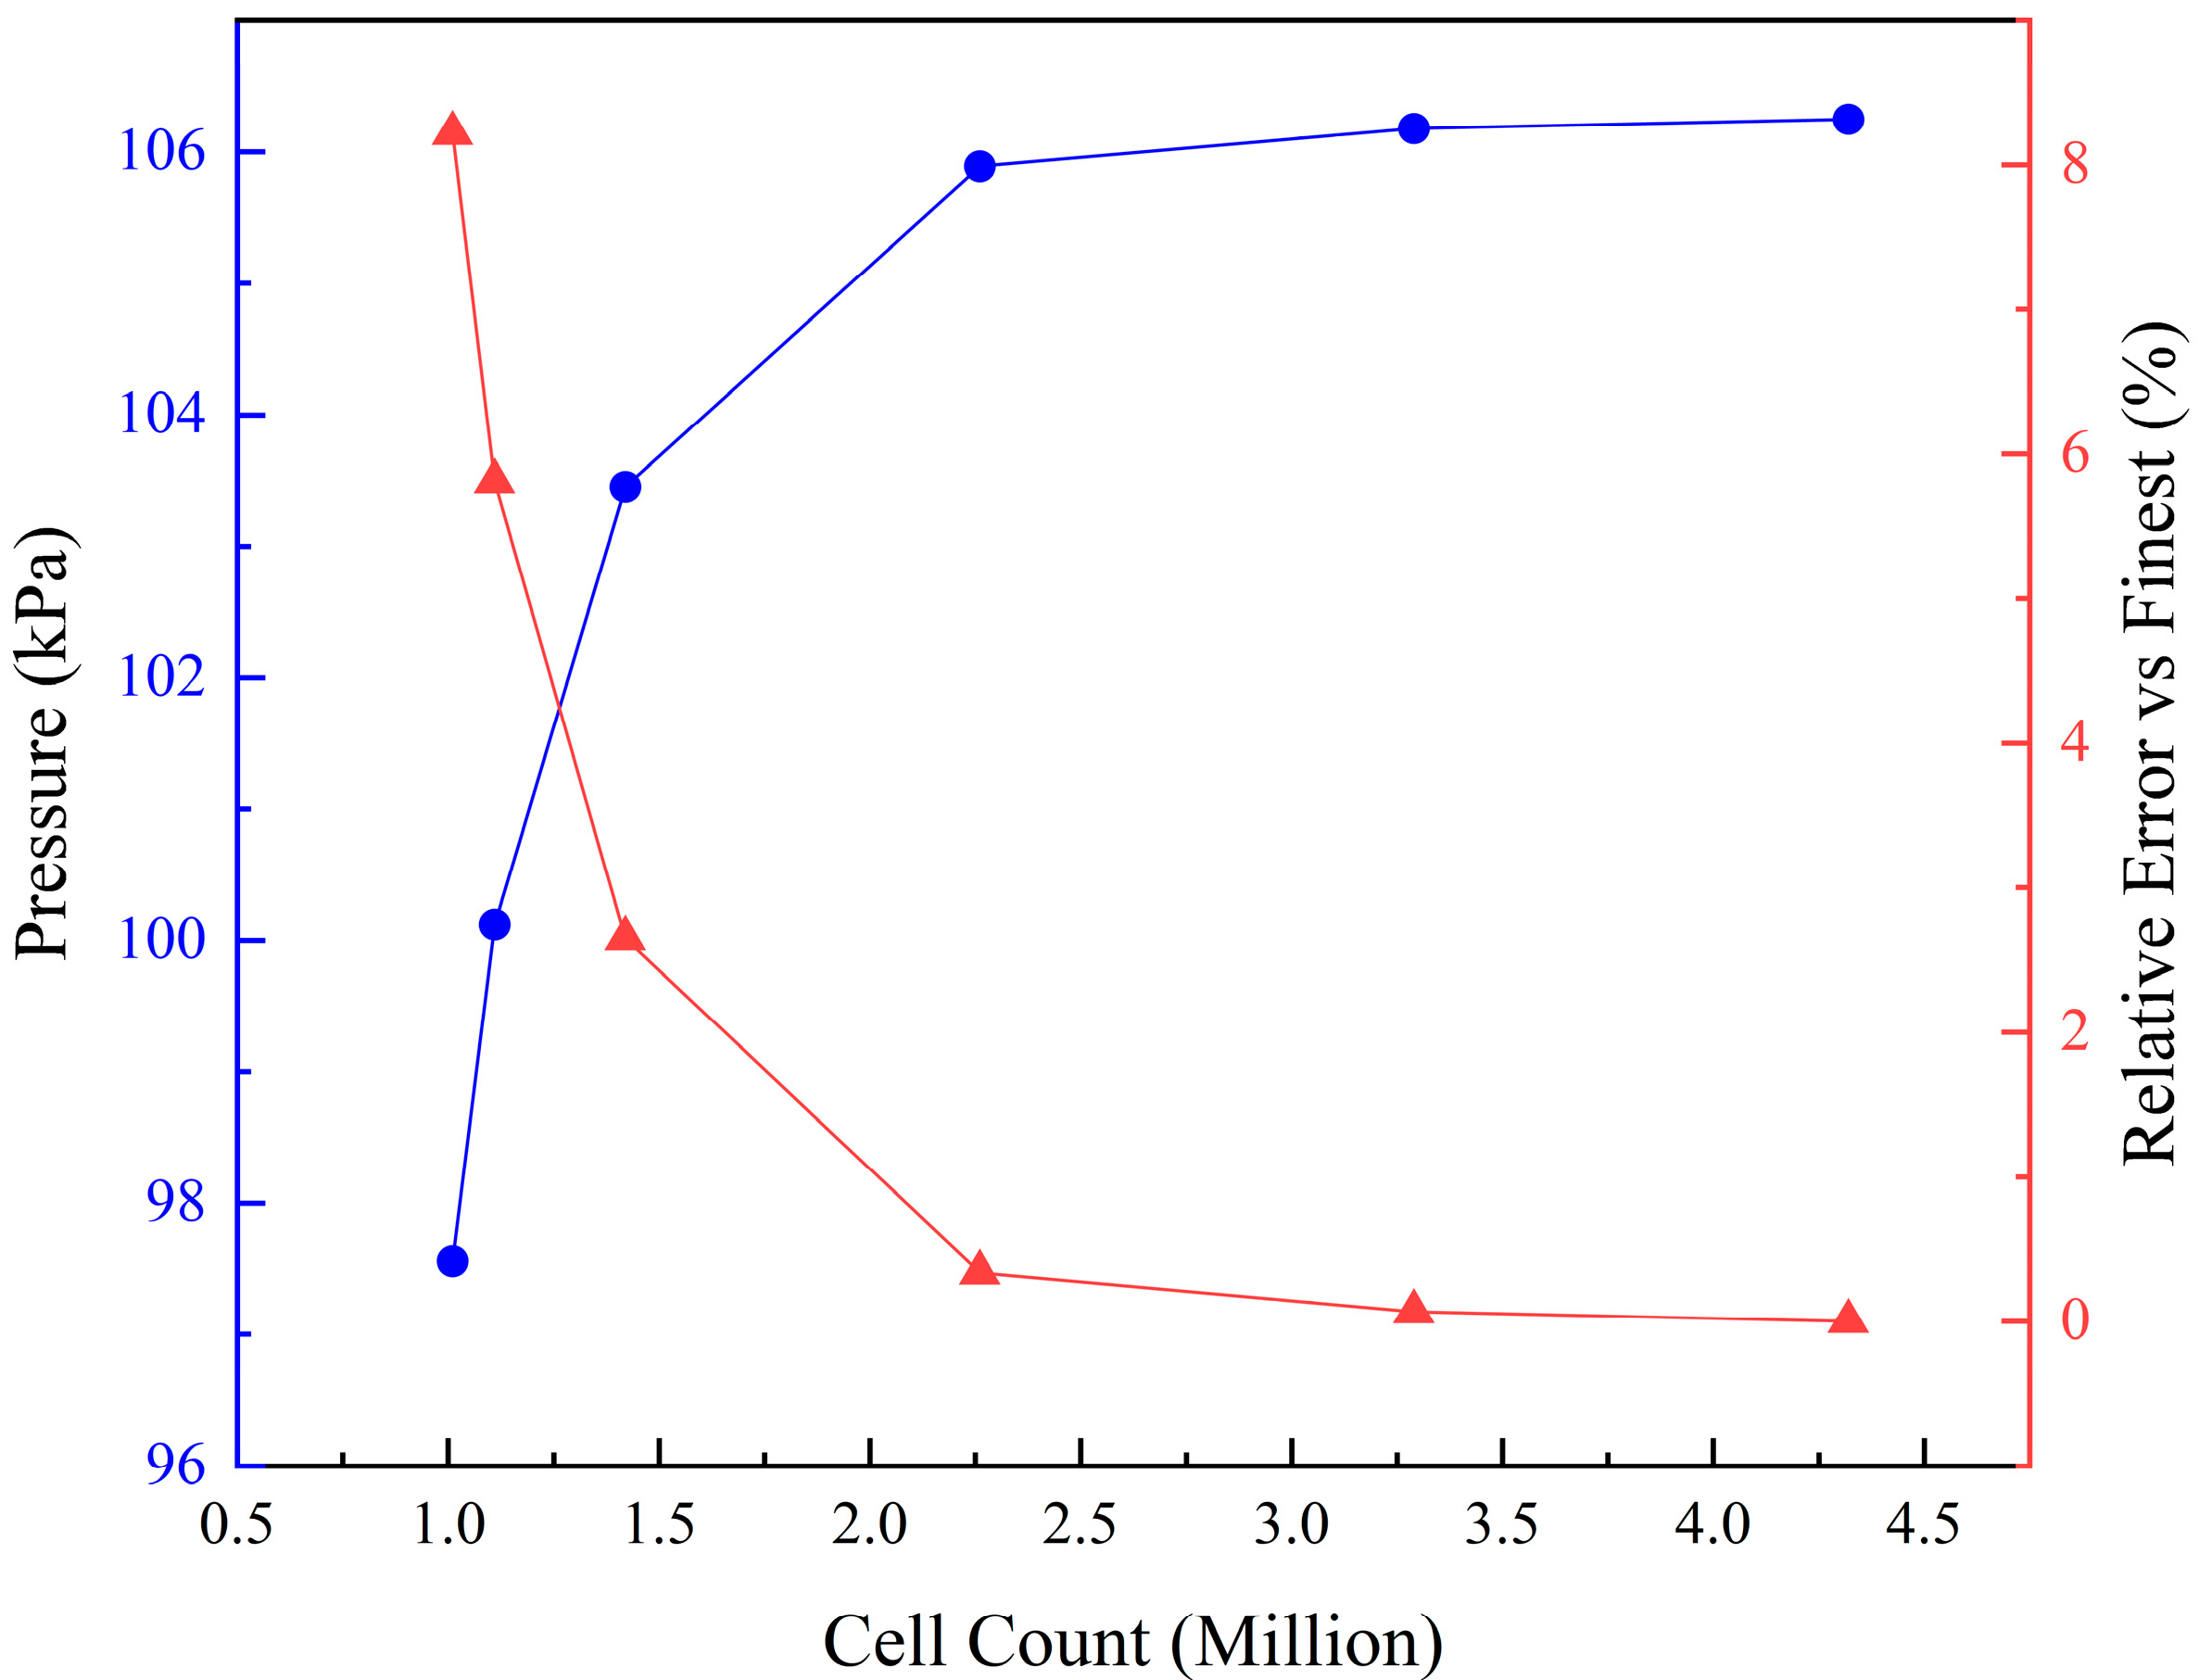
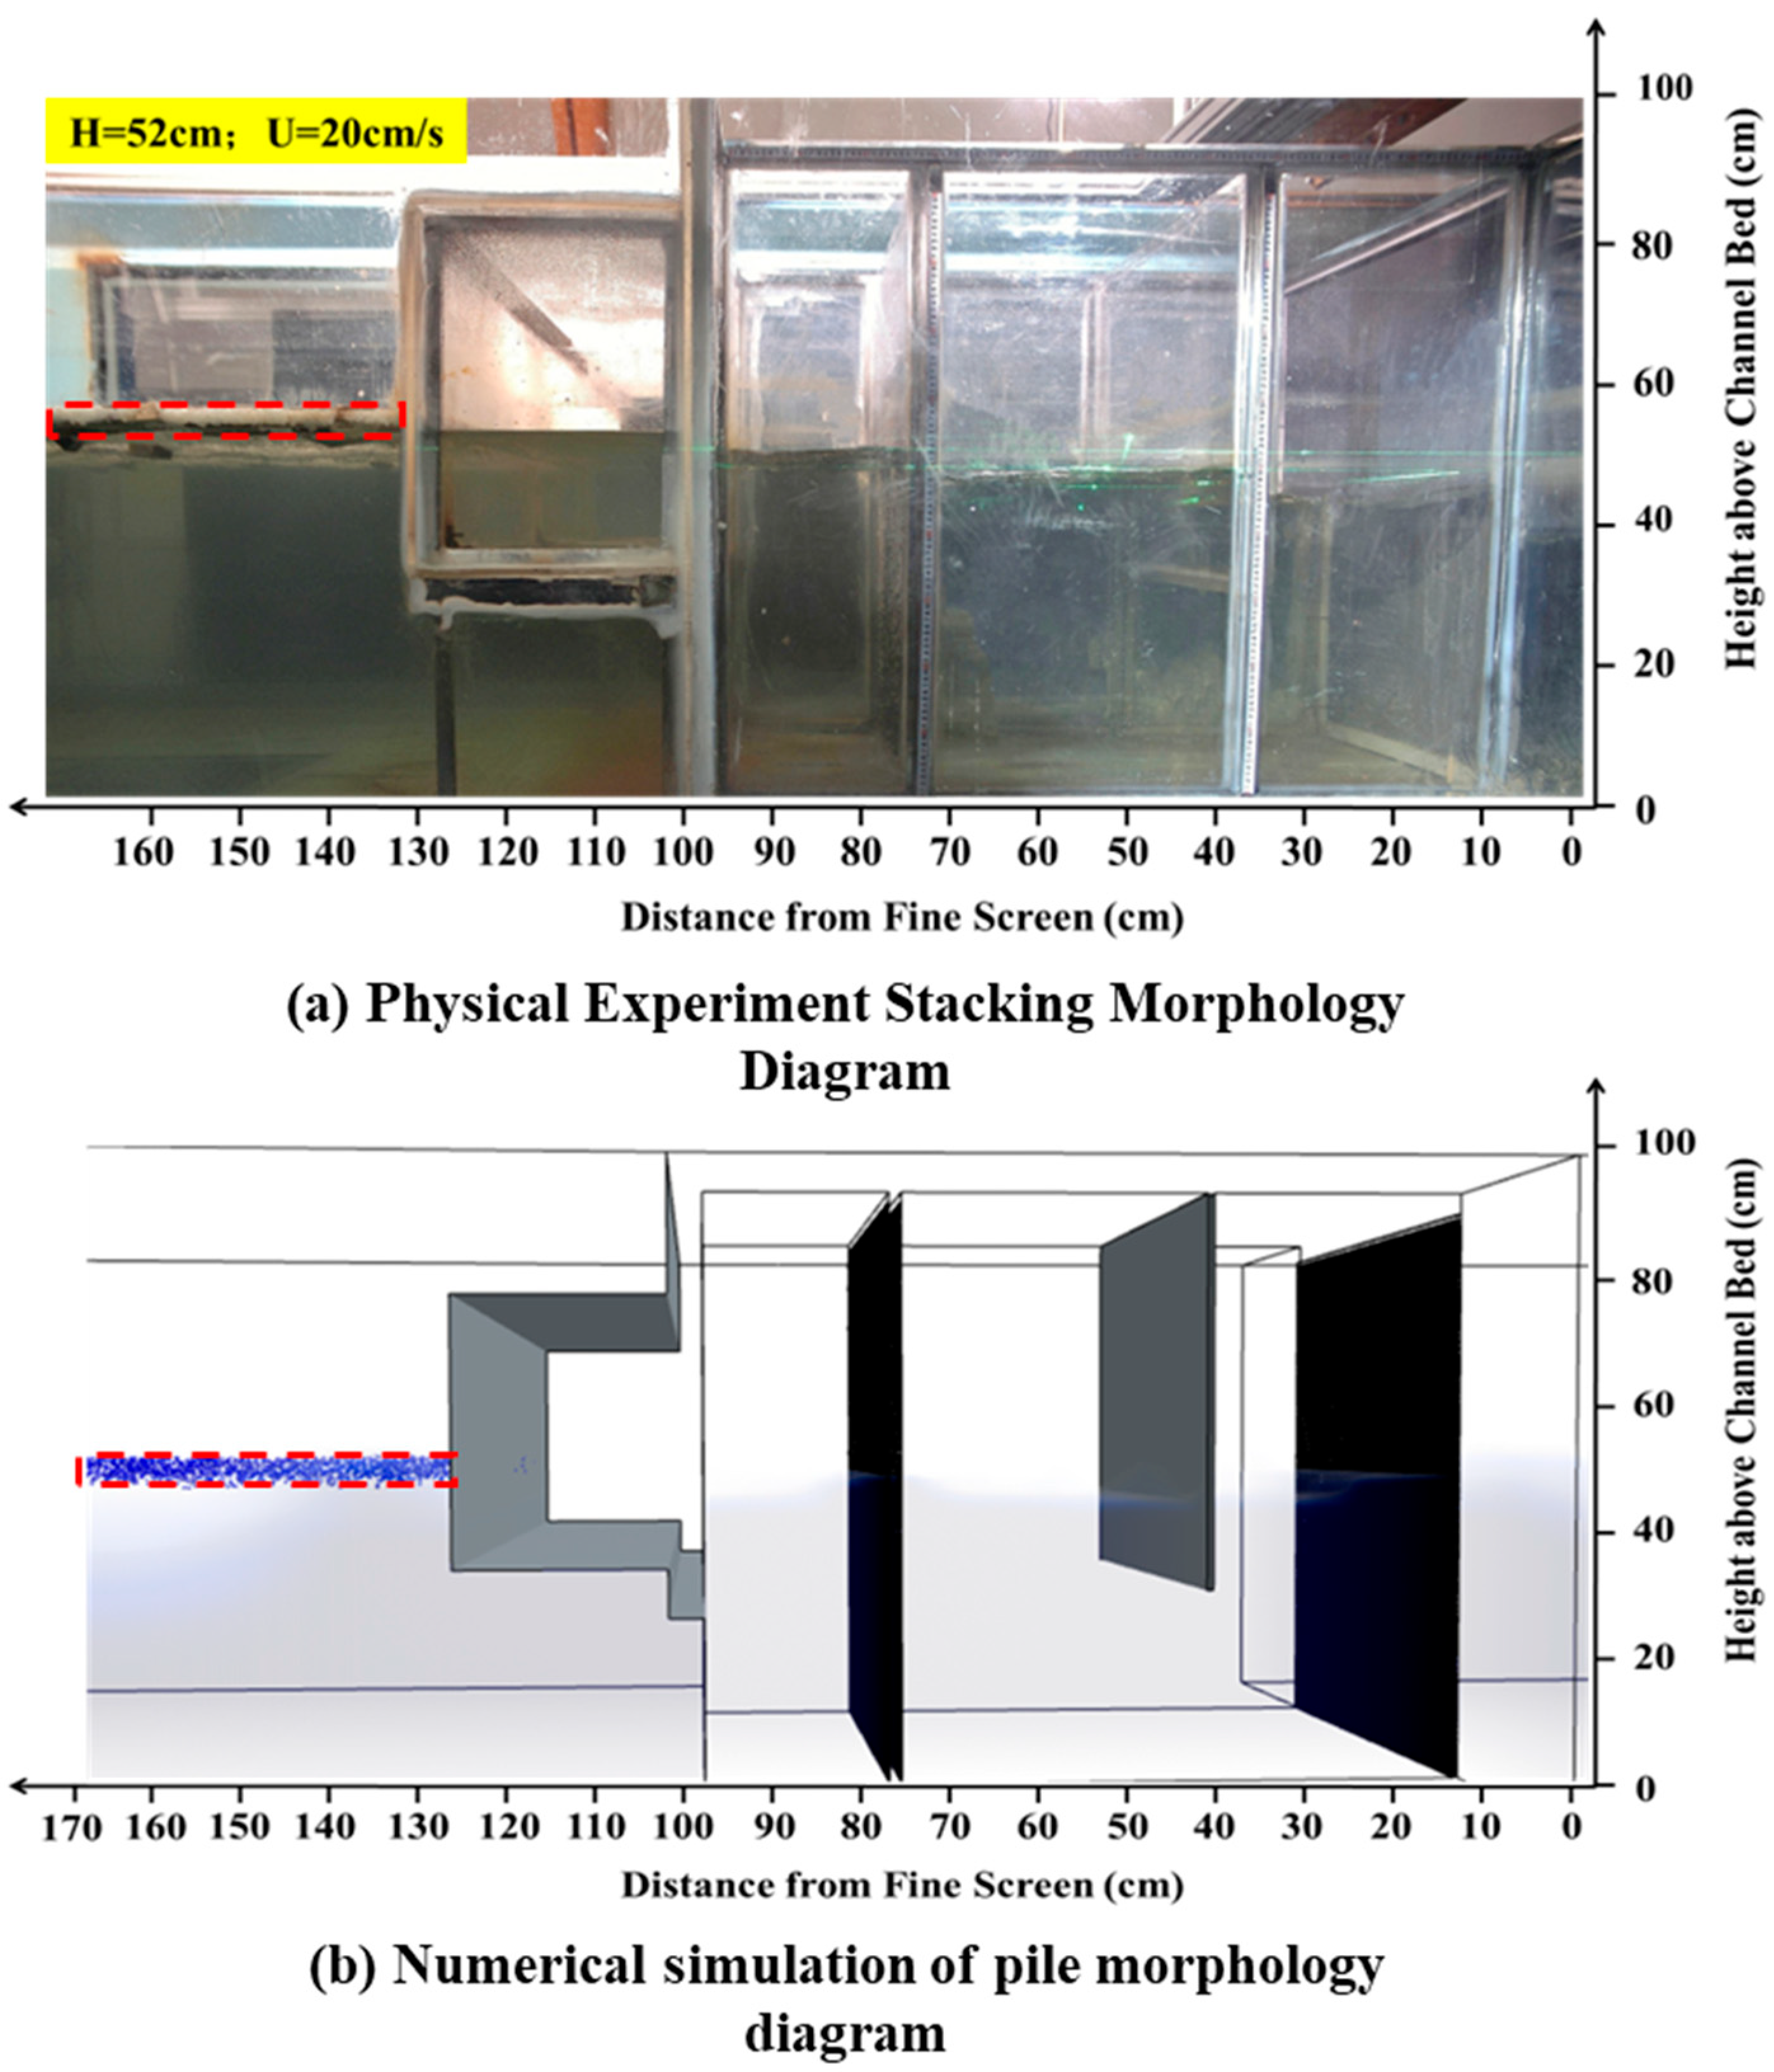
Section 3, the numerical simulation framework based on CFD–DEM is presented and the grid verification results are provided. The numerical model validation results are presented in
Section 4.
Section 5 describes the simulation cases with varying ice-release conditions and discusses the results of ice accumulation patterns.
Section 6 analyzes the alterations in the flow field induced by floating-ice accumulation, focusing on vortex dynamics and disturbance characteristics. Finally, the main conclusions are summarized in
Section 7.
5. Accumulation Patterns and Thickness Variation in Floating Ice
5.1. Model Operating Conditions
To systematically investigate the effects of the floating ice release height on the accumulation of ice and the flow field disturbance characteristics within the water intake pump house, two representative simulation scenarios, i.e., the Multilevel Inlet Release (MIR) series and the Intrachamber Release at Varied Depths (ICR) series, were designed in this study in
Table 6. The innovation of this experimental design lies in its close alignment with two typical ice intrusion scenarios encountered in the actual operation of coastal pumping stations.
For the MIR series, the processes of floating ice released at different vertical heights from the pump house inlet were simulated. Seven release heights (1.2 m, 2.4 m, 3.6 m, 4.8 m, 6.0 m, 7.2 m, and 8.4 m) were defined and the corresponding cases were, respectively, denoted as MIR1, MIR2, MIR3, MIR4, MIR5, MIR6, and MIR7. This series aims to reproduce real-world scenarios that the floating ice enters the intake under the influence of waves, wind, and surface currents with varying initial conditions. It focuses on evaluating the movement paths, accumulation trends, and disturbances to the main flow region during the entry process of floating ice released at different inlet levels. Higher release heights reflect the movement characteristics of ice driven by large waves or strong winds, while lower release heights represent the transport behavior of partially submerged ice affected by turbulent disturbances.
As for the ICR series, the floating ice was released at specific locations inside the pump house. Five release heights (1.2 m, 2.4 m, 3.6 m, 4.8 m, and 6.0 m) were defined and the corresponding cases were, respectively, signified as ICR1, ICR2, ICR3, ICR4, and ICR5. This series directly addresses the entrainment phenomenon in pump station operation—where powerful suction generated by operating pumps draws surface floating ice underwater and transports it to various depths inside the pump house. It focuses on analyzing the accumulation behavior, upward diffusion process, and regulatory effects on local vortices and velocity fluctuations of the ice within the internal space. This design enables the study of the subsequent fate of entrained ice, i.e., whether it resurfaces and accumulates due to buoyancy or is carried toward critical equipment areas by the complex internal flow field.
All release heights were calibrated relative to the bottom of the water tank with the consistency of particle size, quantity, and initial velocity being strictly maintained, thus enabling a systematic single-variable (release height and location) analysis. This rigorous experimental scheme can provide a reliable data foundation for exploring the influence of floating ice release parameters on the accumulation distribution and flow field evolution. More importantly, the close relationship between the experiments and real engineering problems offers solid logical support and a theoretical basis for translating research results into practical engineering solutions.
5.2. Model Monitoring Locations
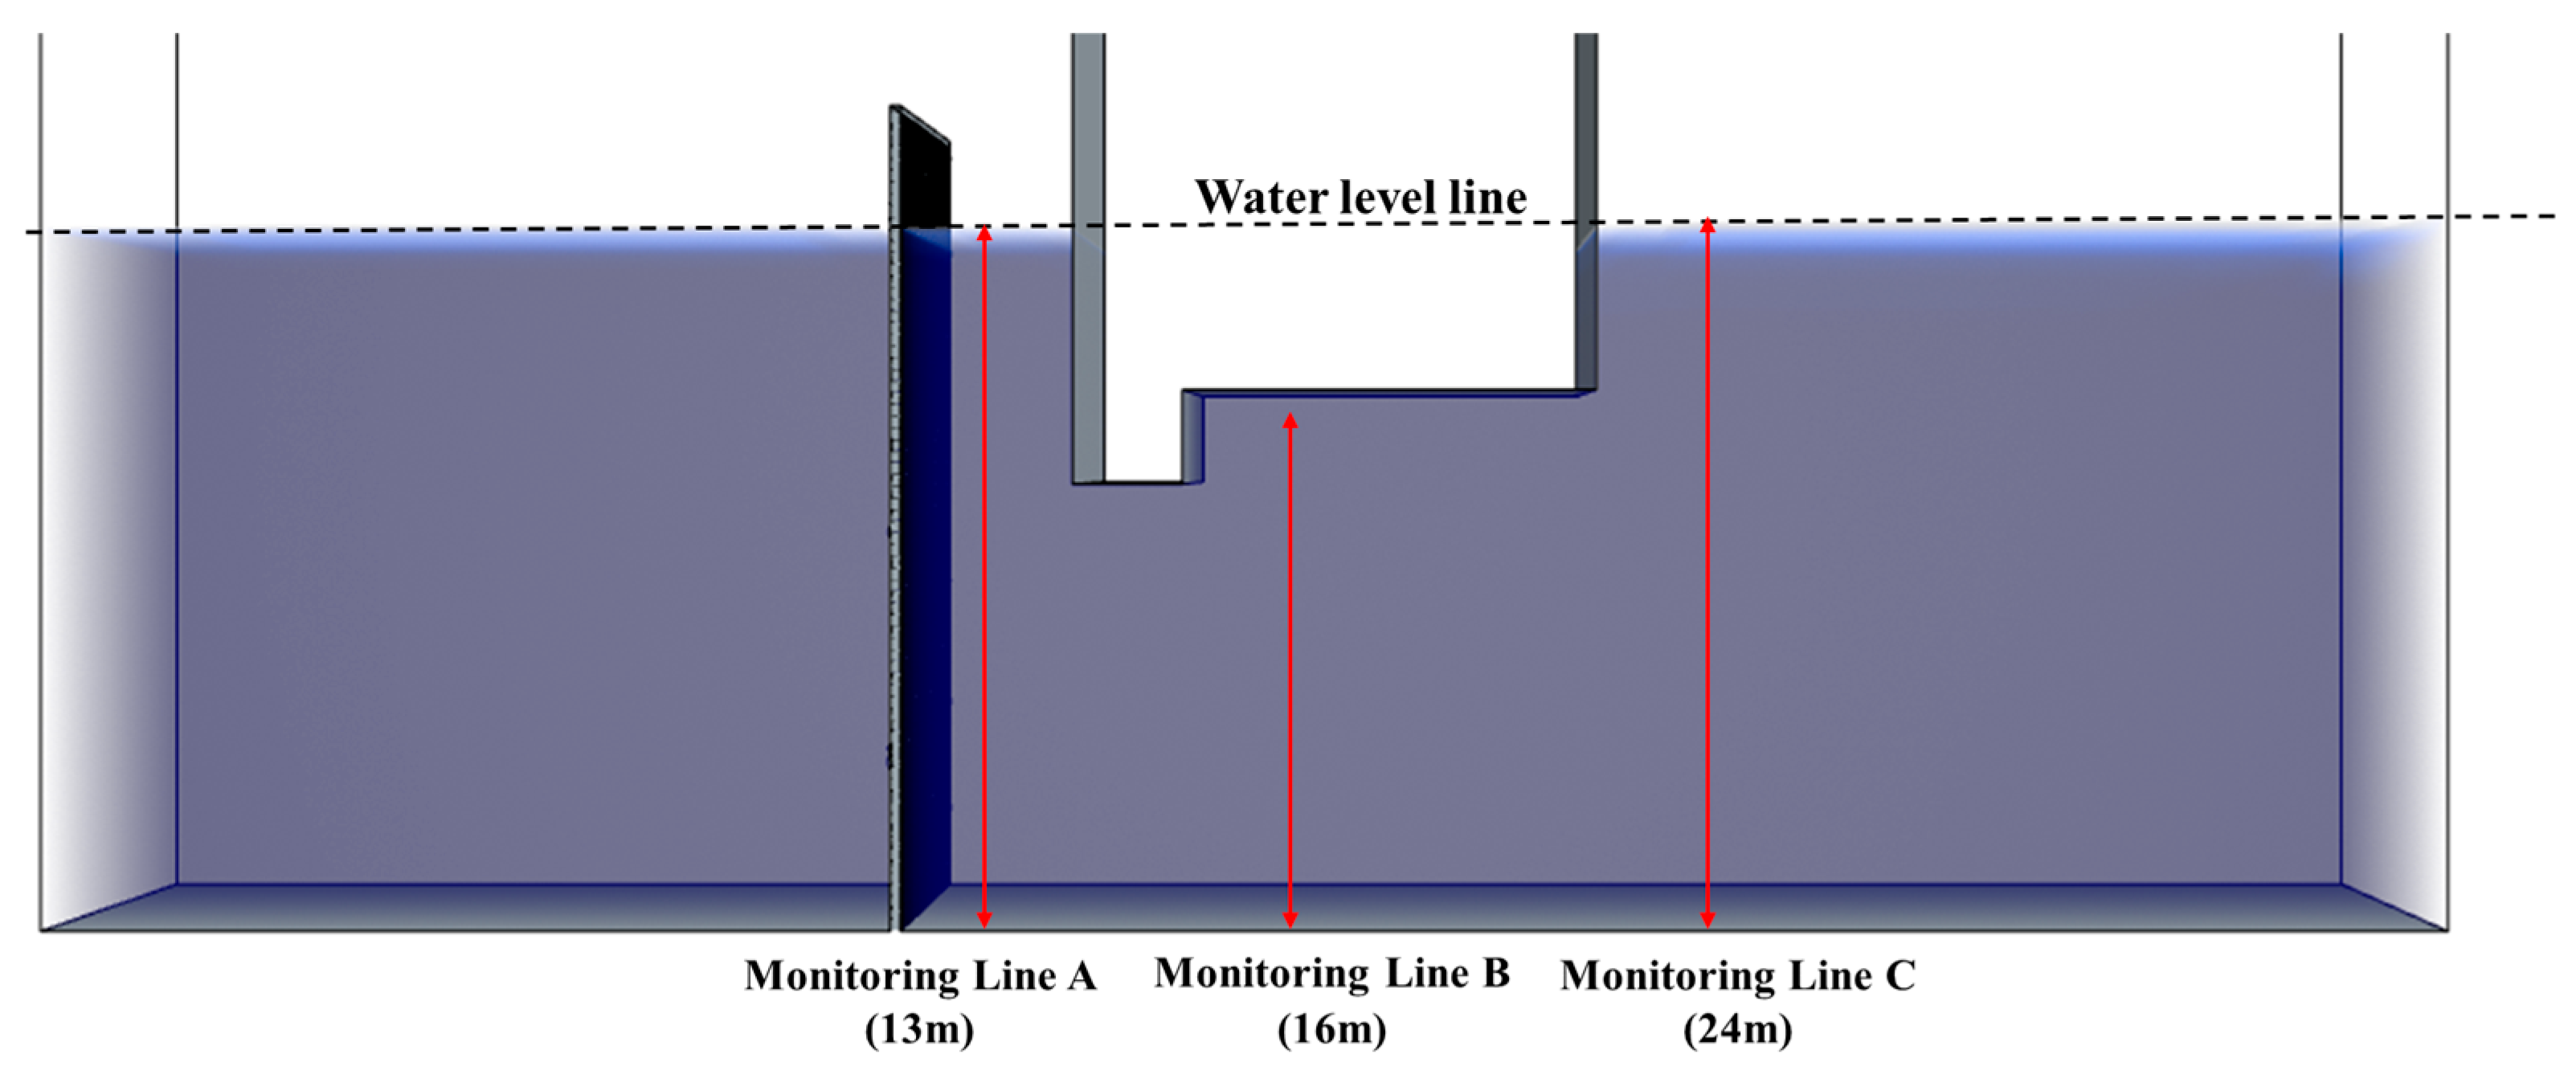
To investigate the spatiotemporal evolution characteristics of floating ice accumulation within the water intake pump house, three typical monitoring areas were selected, as shown in
Figure 10. These areas are located in front of the coarse trash rack (Monitoring Line A), below the straight-wall intake (Monitoring Line B), and in the upstream region of the straight-wall intake (Monitoring Line C).
The area in front of the coarse trash rack can capture the initial accumulation behavior of floating ice near the intake entrance. The region below the straight-wall intake is employed to monitor the accumulation process of ice along the flow-facing side of the structure. The upstream area of the straight-wall intake is used to characterize the interaction between floating ice and the flow within the main stream region and the structurally disturbed zone.
Based on the simulation results of flow field and vorticity contours, seven key hydraulic monitoring locations (M1, M2, …, M7) were established along measurement lines to track flow velocity variations, as shown in
Figure 11. M1 is situated 30 m from the outlet at the pump house inlet to monitor changes in inflow boundary conditions. M2 is located 20 m from the outlet at the lower section of the straight-wall intake, where flow separation and vortex shedding are prone to occur due to abrupt geometric changes. This point captures low-frequency, high-amplitude velocity fluctuations associated with such large-scale vortex structures, which serve as critical indicators of flow instability. M3 is positioned 16 m from the outlet at the rear section of the straight-wall intake, where flow accelerates due to the geometric contraction. This location is adopted to monitor the stability of the accelerated flow and detect high-frequency turbulence potentially induced by interactions among the flow, wall, and incoming ice. M4 is set 1 m upstream of the coarse trash rack to quantify the direct blocking effect of ice accumulation on the incoming flow. Velocity variations here directly reflect flow obstruction caused by upstream ice jams. M5 and M6 are located on the upstream and downstream faces of the coarse trash rack, respectively, with the aim of evaluating the spatial extent of the rack-influenced zone and the flow recovery process. M7 is placed 1 m downstream of the coarse trash rack to characterize the wake properties after flow passes through the rack.
5.3. Comparison of the Accumulation Patterns at Different Positions and Heights
A comparative analysis of the accumulation morphology was conducted under varying release positions and heights. The results revealed that the spatial distributions and accumulation patterns of floating ice are jointly affected by the release location and height, which are key factors that can govern the ice blockage conditions within the pump house.
For the ICR series, the accumulation characteristics of floating ice are shown in
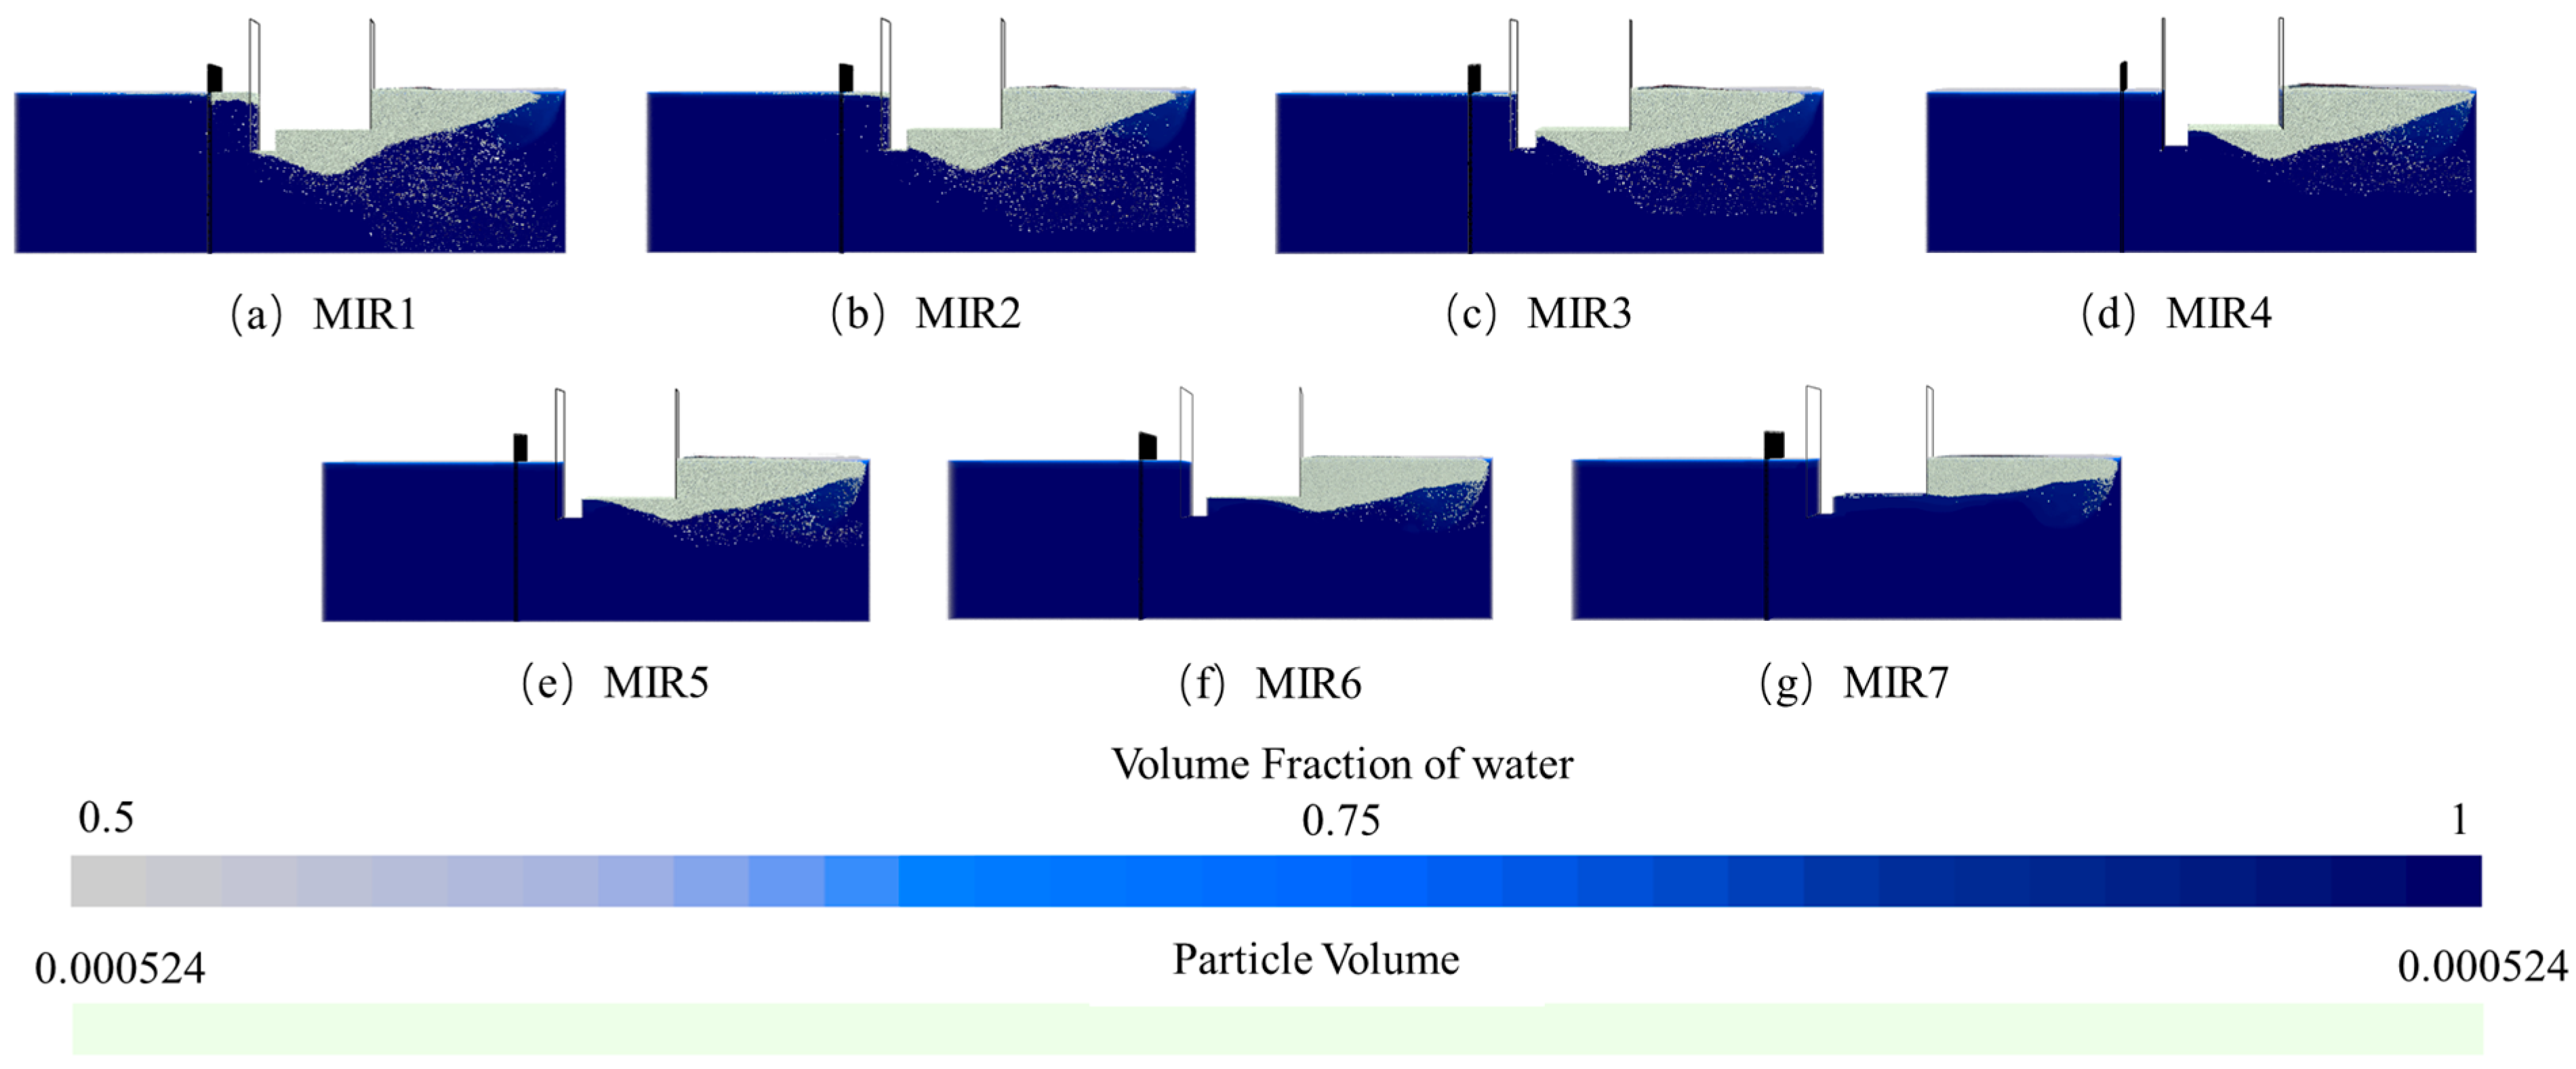
Figure 12. As can be see, the accumulation is predominantly controlled by the coarse trash rack. Most ice was intercepted and accumulated upstream of the rack, nearly completely occupying the main flow passage between the straight-wall intake and the rack. This indicates that once the floating ice entering the pump house, the accumulation is mainly constrained by the trash rack, resulting in a blockage near the rack structure. Moreover, higher release heights allow more ice to pass through the rack openings and accumulate behind it, while the accumulation thickness downstream decreases with the increasing release height. This demonstrates that the release height significantly affects ice particle trajectories. As for the MIR series, the accumulation characteristics of floating ice are illustrated in
Figure 13. It can be observed that the regulatory role of release height is more pronounced. Lower release heights (e.g., MIR at 1.2 m) led to the concentrated ice accumulation at the base of the straight-wall intake. As the release height increases, the accumulation thickness at the wall base gradually decreases. When the height exceeds 7.2 m, the accumulation in this region almost completely disappeared, indicating that the initial entry position of floating ice directly determines its ability to reach and affect critical structural areas.
To further investigate the accumulation patterns, a coordinate system was established with its origin at the bottom of the outlet of the pump house model, the accumulation thicknesses in different regions under the ICR conditions are presented in
Figure 14. The results indicate that the release height significantly regulates both the macroscopic morphology and spatial distribution of floating ice accumulation, affecting not only the accumulation scale but also the location of its core region.
In the region from the coarse trash rack to the outlet, the scale of accumulation is strongly suppressed by the release height. Under the ICR1 condition, the maximum accumulation thickness reaches 2.0 m, while under ICR5, it sharply decreases to approximately 0.5 m, with a reduction of 75%. Concurrently, the accumulation width also contracts significantly with the increasing release height, with the difference between widths reaching up to 10 m. This clearly demonstrates that higher release heights substantially weaken the ability of floating ice to reach and accumulate in this region. In the area around the coarse trash rack and the middle section of the straight-wall intake, the release height exhibits a fine regulatory effect on the location of the accumulation core. The position of the maximum accumulation point systematically shifts toward the inlet direction as the release height increases. In terms of the accumulation volume, the maximum thickness under ICR2 was about 3.5 m, while it decreased to 2.4 m under ICR5, a reduction of 31.4%. This indicates that the release height not only determines the accumulation thickness but also governs the accumulation location, directly altering the accumulation morphology.
A reverse transport phenomenon emerges in the region from the front of the straight-wall intake to the inlet. The accumulation in this area only occurs under higher release height conditions (ICR4 and ICR5), with a thickness of about 0.5 m, while no accumulation is observed under lower release heights (ICR1, ICR2, and ICR3). This phenomenon reveals a unique flow-structure interaction under high release heights, i.e., high-speed inflow may generate recirculation or vortices in this region, thereby transporting some floating ice reversely toward the area near the inlet. This constitutes a secondary accumulation mechanism that does not occur under low release heights.
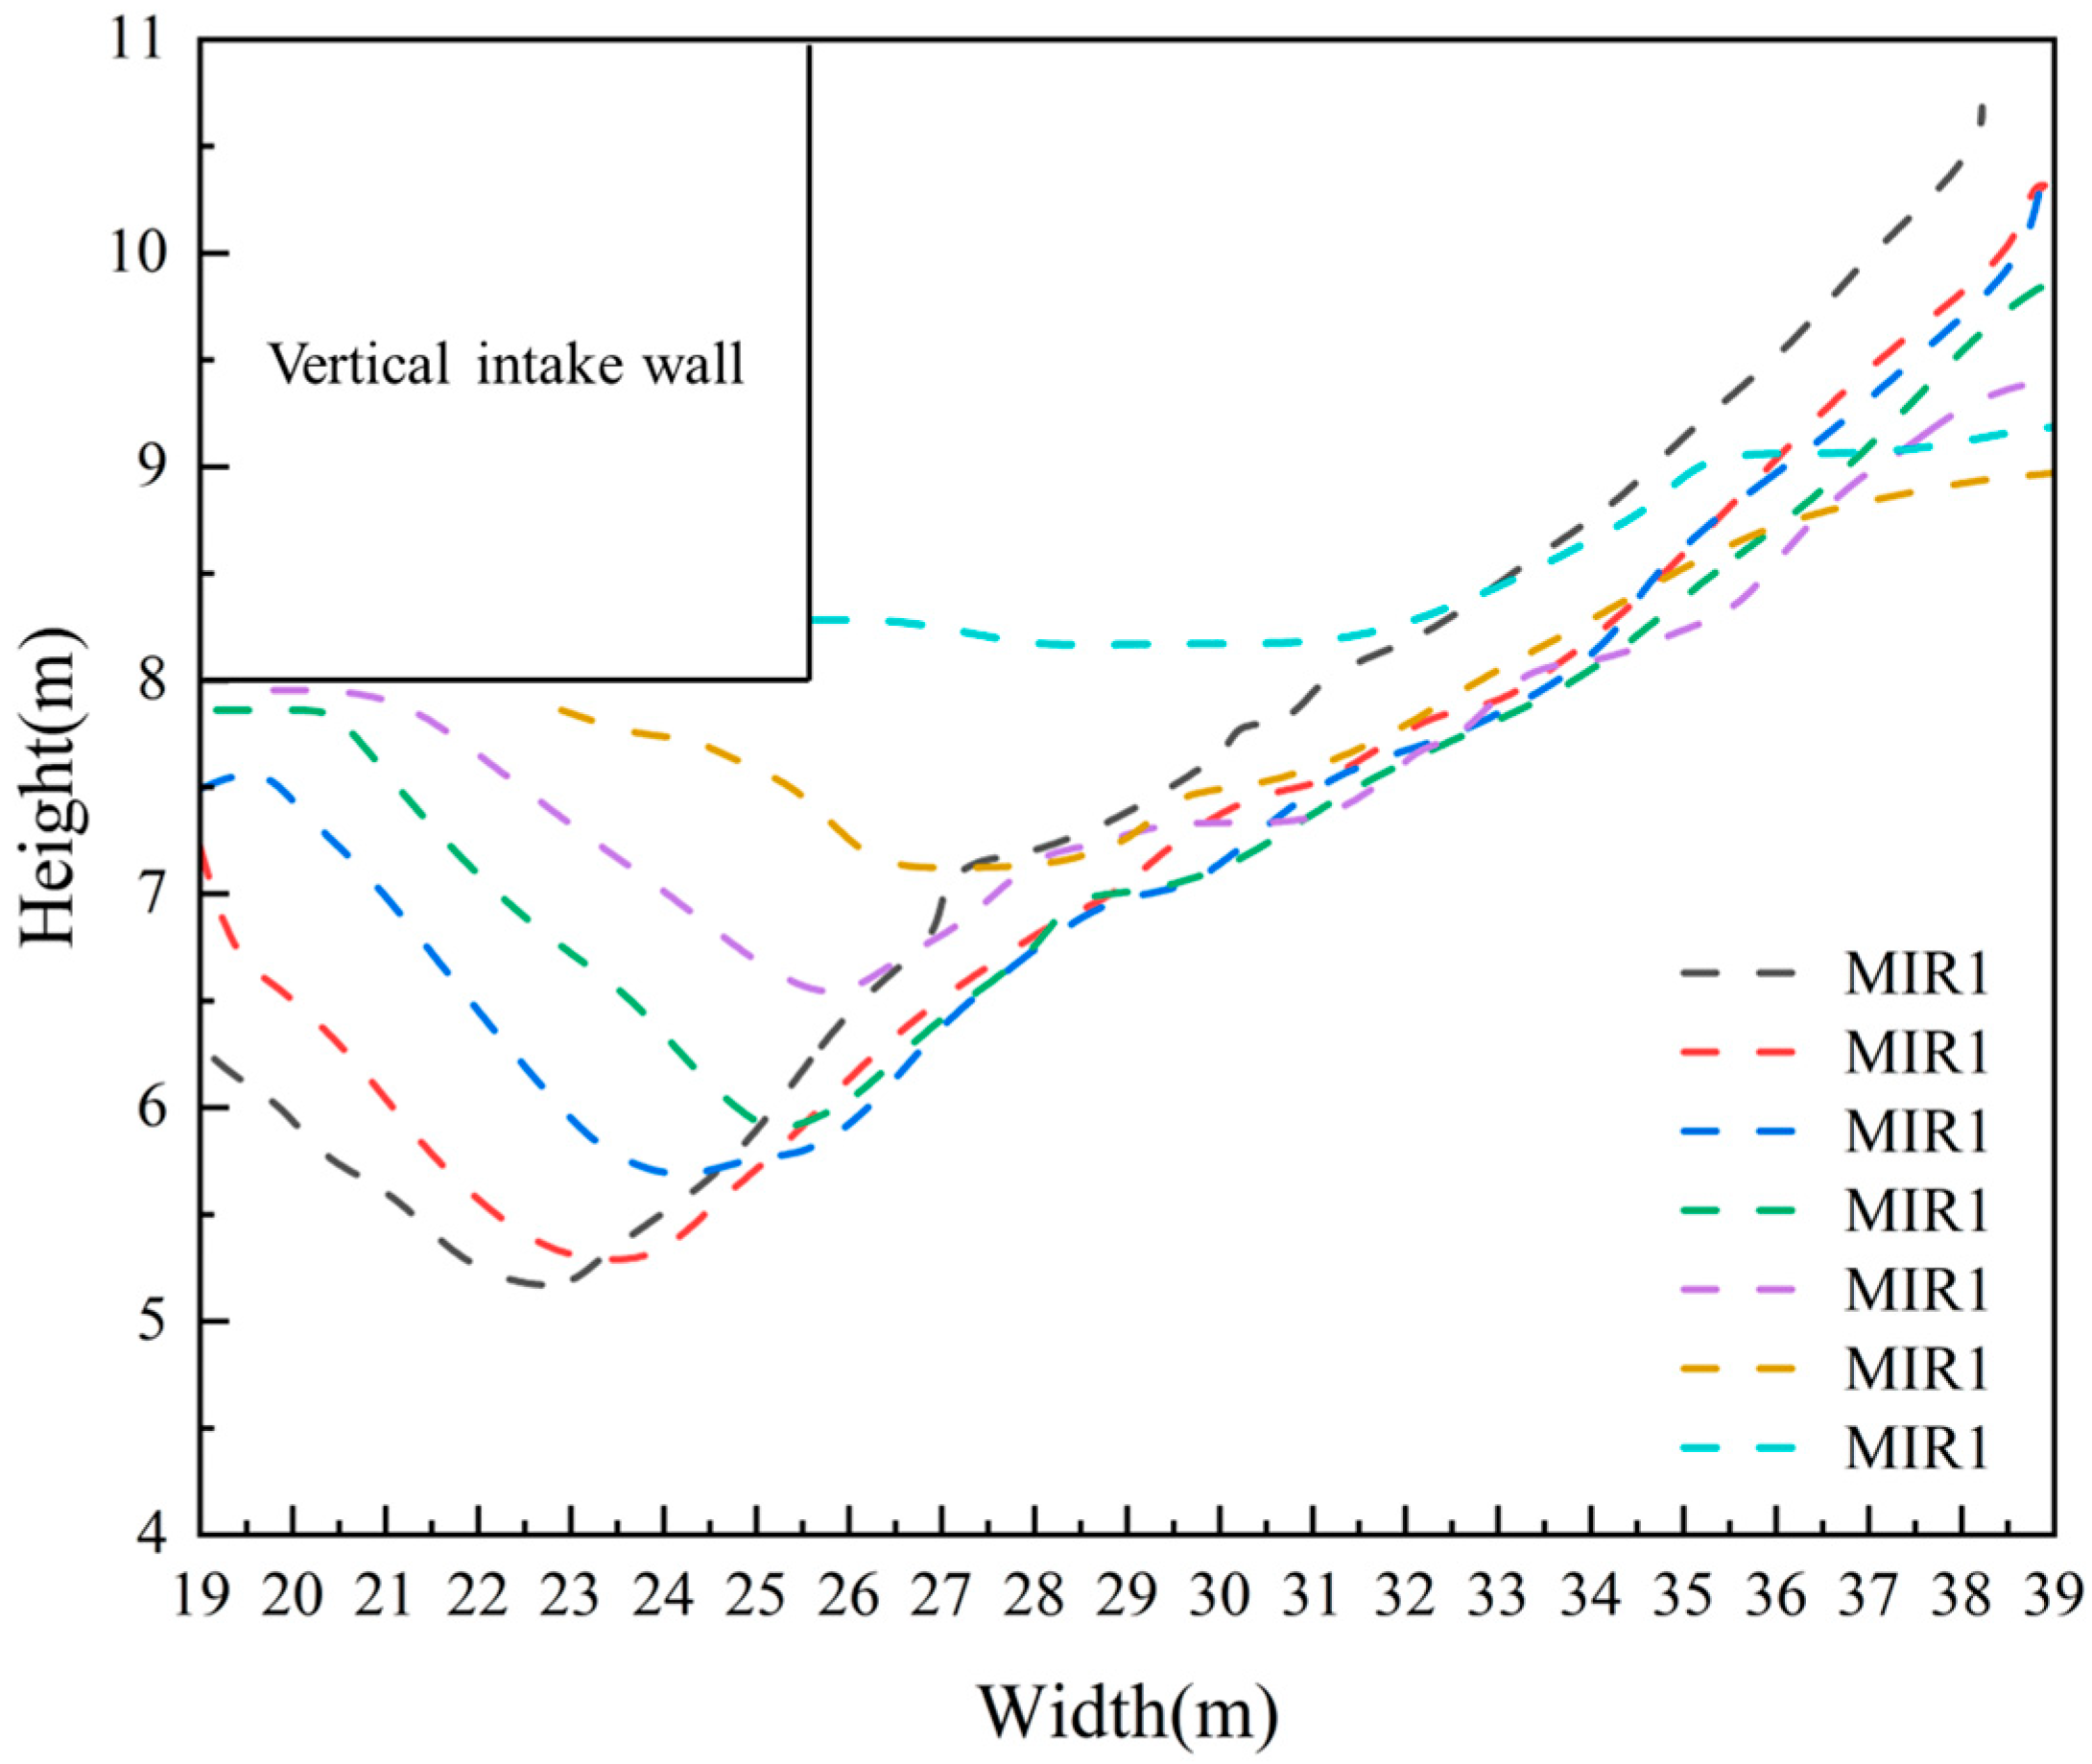
The results of the accumulation thickness in different regions for the MIR series are illustrated in
Figure 15. The core accumulation area continuously migrates as the release height increases from 1.2 m to 8.4 m, with the location of the maximum accumulation thickness shifting consistently toward the inlet direction. At the lowest release height (h = 1.2 m), the maximum accumulation thickness reached 6 m, located in the downstream region of the straight-wall intake. In contrast, when the release height increases to 8.4 m, the ice accumulated entirely in the upstream region of the straight-wall intake, with almost no accumulation below the wall.
This indicates that under higher release heights, the horizontal transport distance of floating ice is shortened due to the combined effects of buoyancy and hydrodynamic forces, leading to earlier deposition and a consequent shift in the accumulation center toward the inlet. The accumulation morphology also exhibits significant differences. Under low release heights, the accumulation profile shows a sharp peak in the downstream region of the straight-wall intake, reflecting a concentrated and intense local accumulation. In contrast, under high release heights, the profile in the upstream region displays a broader and gentler peak, suggesting a widely distributed and mild accumulation.
The abovementioned morphological differences further demonstrate that the release height not only alters the location of accumulation but also fundamentally regulates the degree of ice dispersion and the final accumulation configuration.
5.4. Temporal Variation in the Accumulation Thickness Under Different Scenarios
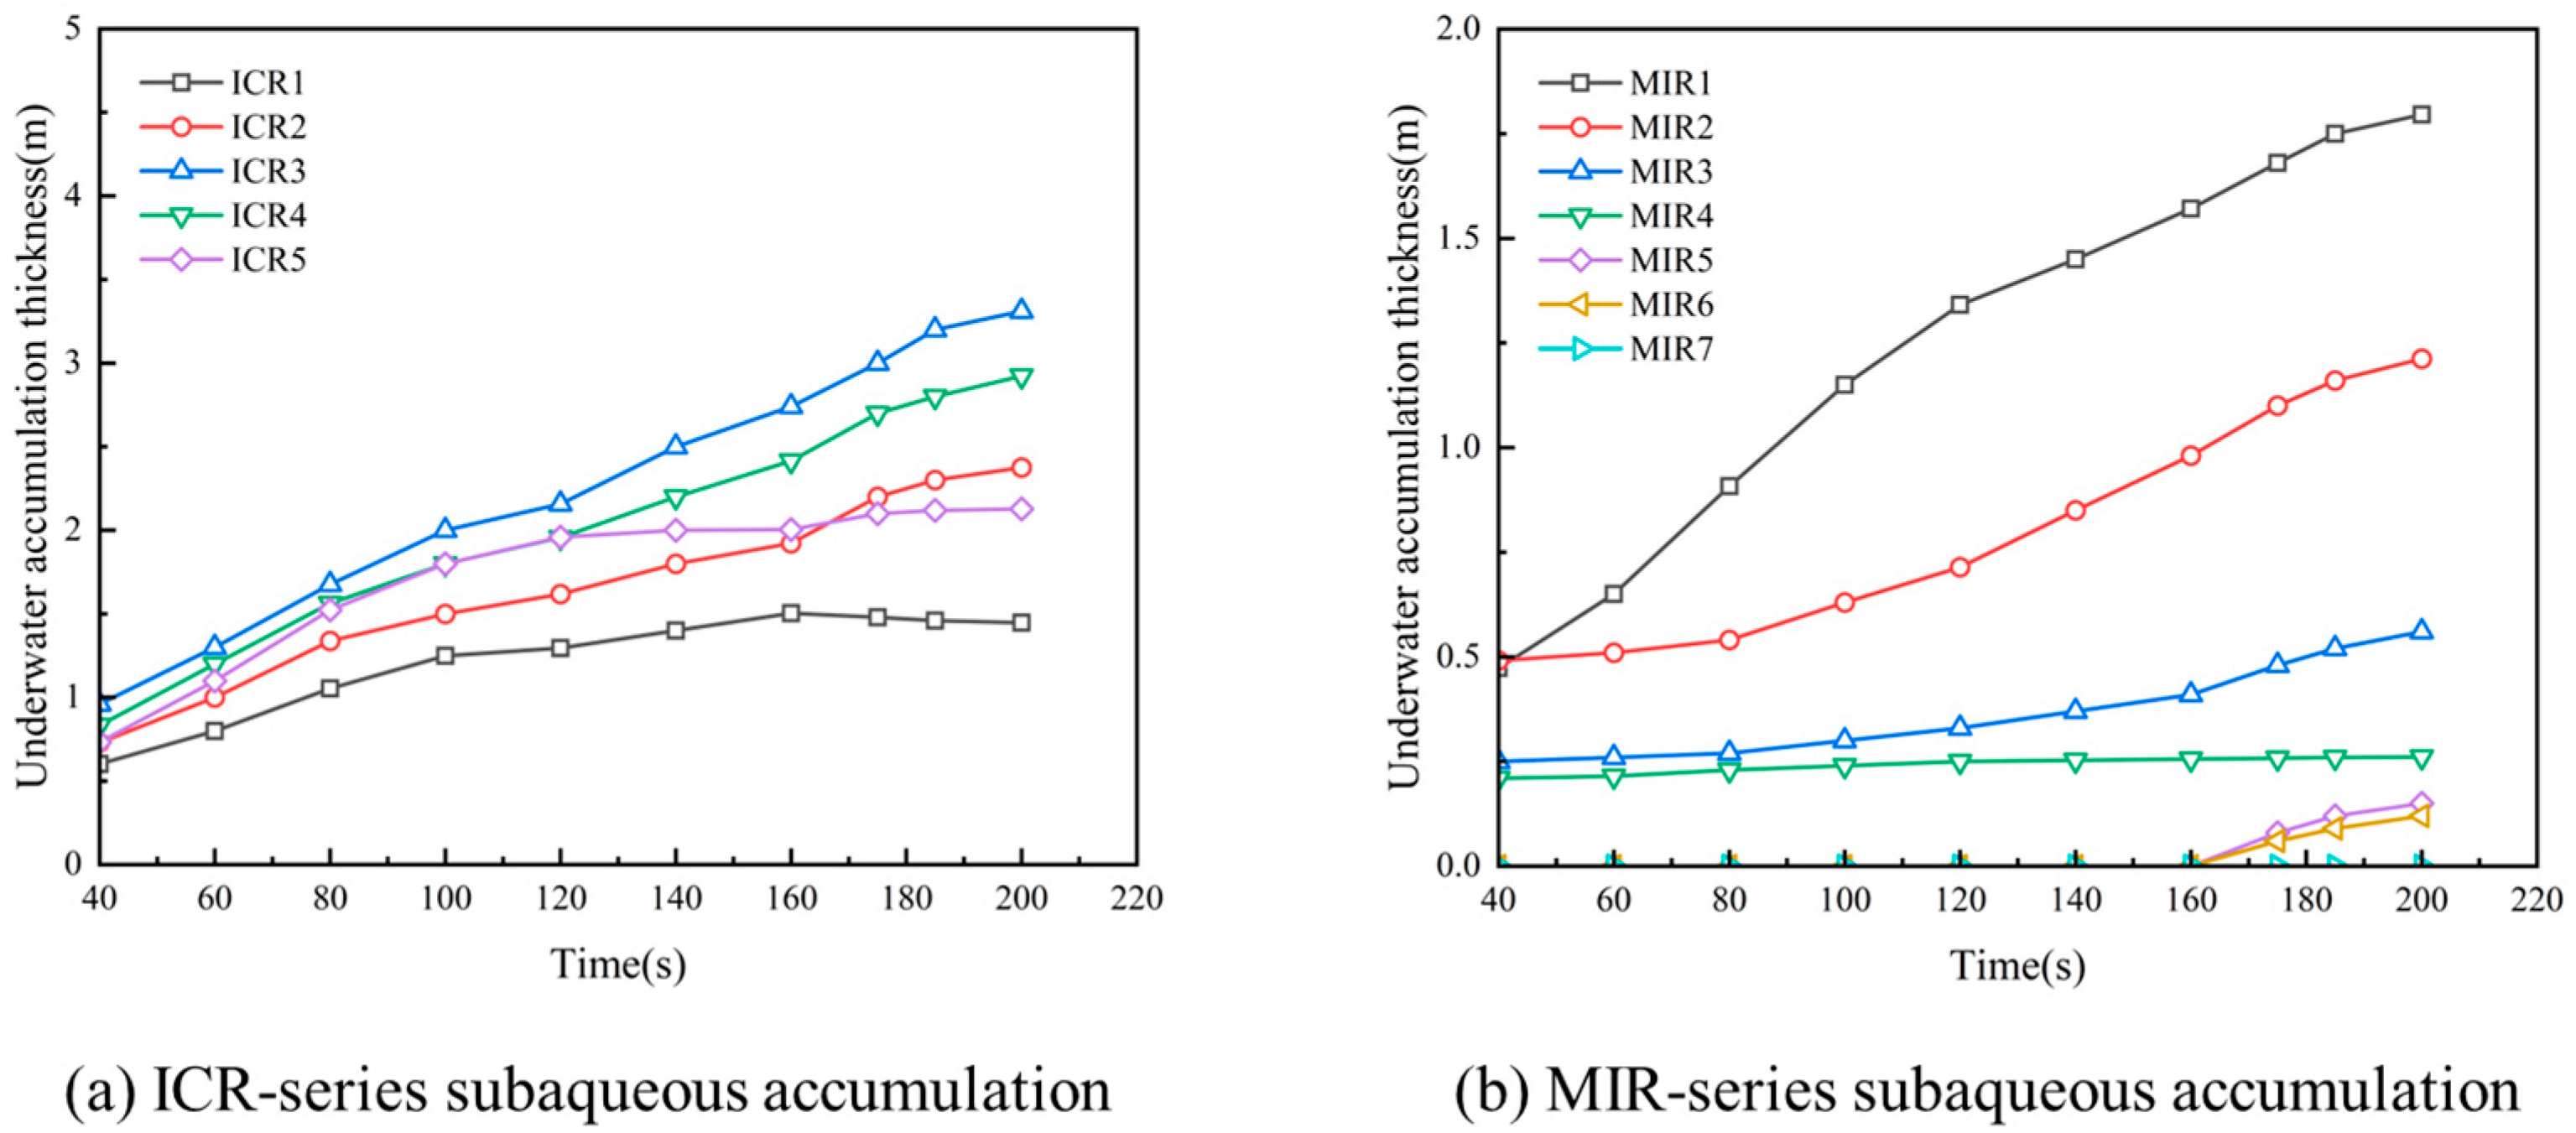
Based on the bidirectional CFD-DEM coupled model, the dynamic tracking of floating ice released at different locations inside the pump house and at the water intake was carried out, of which the results are presented in
Figure 16. From the results, it can be easily observed that the accumulation thickness evolves with time and space nonlinearly.
For the ICR series, the underwater and above-water accumulation thicknesses under different release heights are shown in
Figure 16a and
Figure 16b, respectively. In the early stages of accumulation, lower release heights result in steeper slopes of the accumulation thickness curves. In the later stages, the accumulation thickness at positions ICR1 and ICR3 gradually stabilized, while it continued to increase at ICR2, ICR4, and ICR5. In the above-water accumulation curves, except for ICR2, the thickness at other positions initially increases and then tends to stabilize. Notably, at ICR2, the accumulation thickness experiences a brief decrease at 160 s, followed by a rapid increase. This phenomenon may be related to disturbances in the overall flow field. Overall, the accumulation thickness at ICR2 was greater than at other positions. As for the MIR series, the accumulation thickness under different release heights is shown in
Figure 16c. The accumulation in front of the coarse trash rack only occurs at positions MIR1, MIR2, and MIR3, which indicates that at lower release heights, floating ice can reach the front of the trash rack under the combined action of buoyancy and hydrodynamic forces. However, when the release height exceeds 4.2 m, the ice, which is primarily influenced by buoyancy, accumulates in front of the straight-wall intake, and only a little ice reaches the coarse trash rack. This demonstrates that release height significantly affects the accumulation location of floating ice.
In the lower region of the straight-wall intake, the variation in floating ice accumulation thickness over time exhibits significant nonlinear characteristics, as shown in
Figure 17.
From
Figure 17a, it can be observed that moderate release heights promote the most pronounced accumulation, with the thickness demonstrating marked nonlinear growth over time. Among these, the thickness under the ICR3 condition exhibits the most rapid growth, with the magnitude increasing from 0.96 m to 1.676 m. The corresponding growth rate is 74.6%, which indicates that at this release height, the buoyancy and hydrodynamic forces reach an optimally coupled state, thus driving the ice accumulation in the lower region of the straight-wall intake most effectively. The trends existed in the ICR1 and ICR5 conditions are similar but with smaller growth magnitudes, while in the ICR2, ICR3, and ICR4 conditions, sustained increasing trends are observed, which reflects the fine control exerted by the release height on accumulation dynamics. For the MIR series, the changes in the accumulation thickness under different release heights are presented in
Figure 17b. From the results, a critical height of h = 6 m can be identified, beyond which a negative correlation between the release height and accumulation thickness is existed. When the release height is below the critical height, the accumulation occurs in the lower region of the straight-wall intake, and the accumulation thickness is negatively correlated with the release height. Otherwise, the floating ice rarely reaches this area, with only minor accumulation observed after 160 s. This suggests that at higher release heights, the influence of hydrodynamic forces on the ice movement is weakened and the buoyancy becomes the dominant factor resulting in the accumulation of ice near the water surface preferentially. Only after a certain level of surface accumulation has developed can a small amount of ice be transported into the lower region of the straight-wall intake under the influence of complex flow conditions.
For the accumulation of floating ice in front of the straight-wall intake, the results are shown in
Figure 18.
Figure 18a and
Figure 18b are, respectively, the above-water and underwater accumulation under different inlet release depths.
Overall, the above-water and underwater accumulation exhibit distinct patterns. The slope of the above-water accumulation thickness curve increases with the release height, and the overall accumulation rate slows after 120 s. Among them, the maximum above-water accumulation thickness appears in the MIR5 condition, indicating that higher release heights promote rapid accumulation of floating ice near the water surface. In contrast, the underwater accumulation thickness decreases with the rise in the release height, with the maximum accumulation occurring in the MIR3 condition. This suggests that at moderate release heights, the balance between buoyancy and hydrodynamic forces allows ice to be effectively transported to the front of the structure, thus resulting in significant accumulation. For the ICR series, the results of the accumulation thickness are shown in
Figure 18c. Notably, the accumulation near the water surface exists only at higher release heights. This implies that ice released at greater heights alters the local flow structure, potentially inducing return currents or horizontal vortices near the structure. These flow structures subsequently transport some surface ice backward toward the region in front of the straight-wall intake, forming the secondary accumulation.
6. The Impact of Floating Ice Accumulation on the Flow Field
6.1. Comparison of Global Flow Field Under Different Scenarios with Ice-Free Conditions
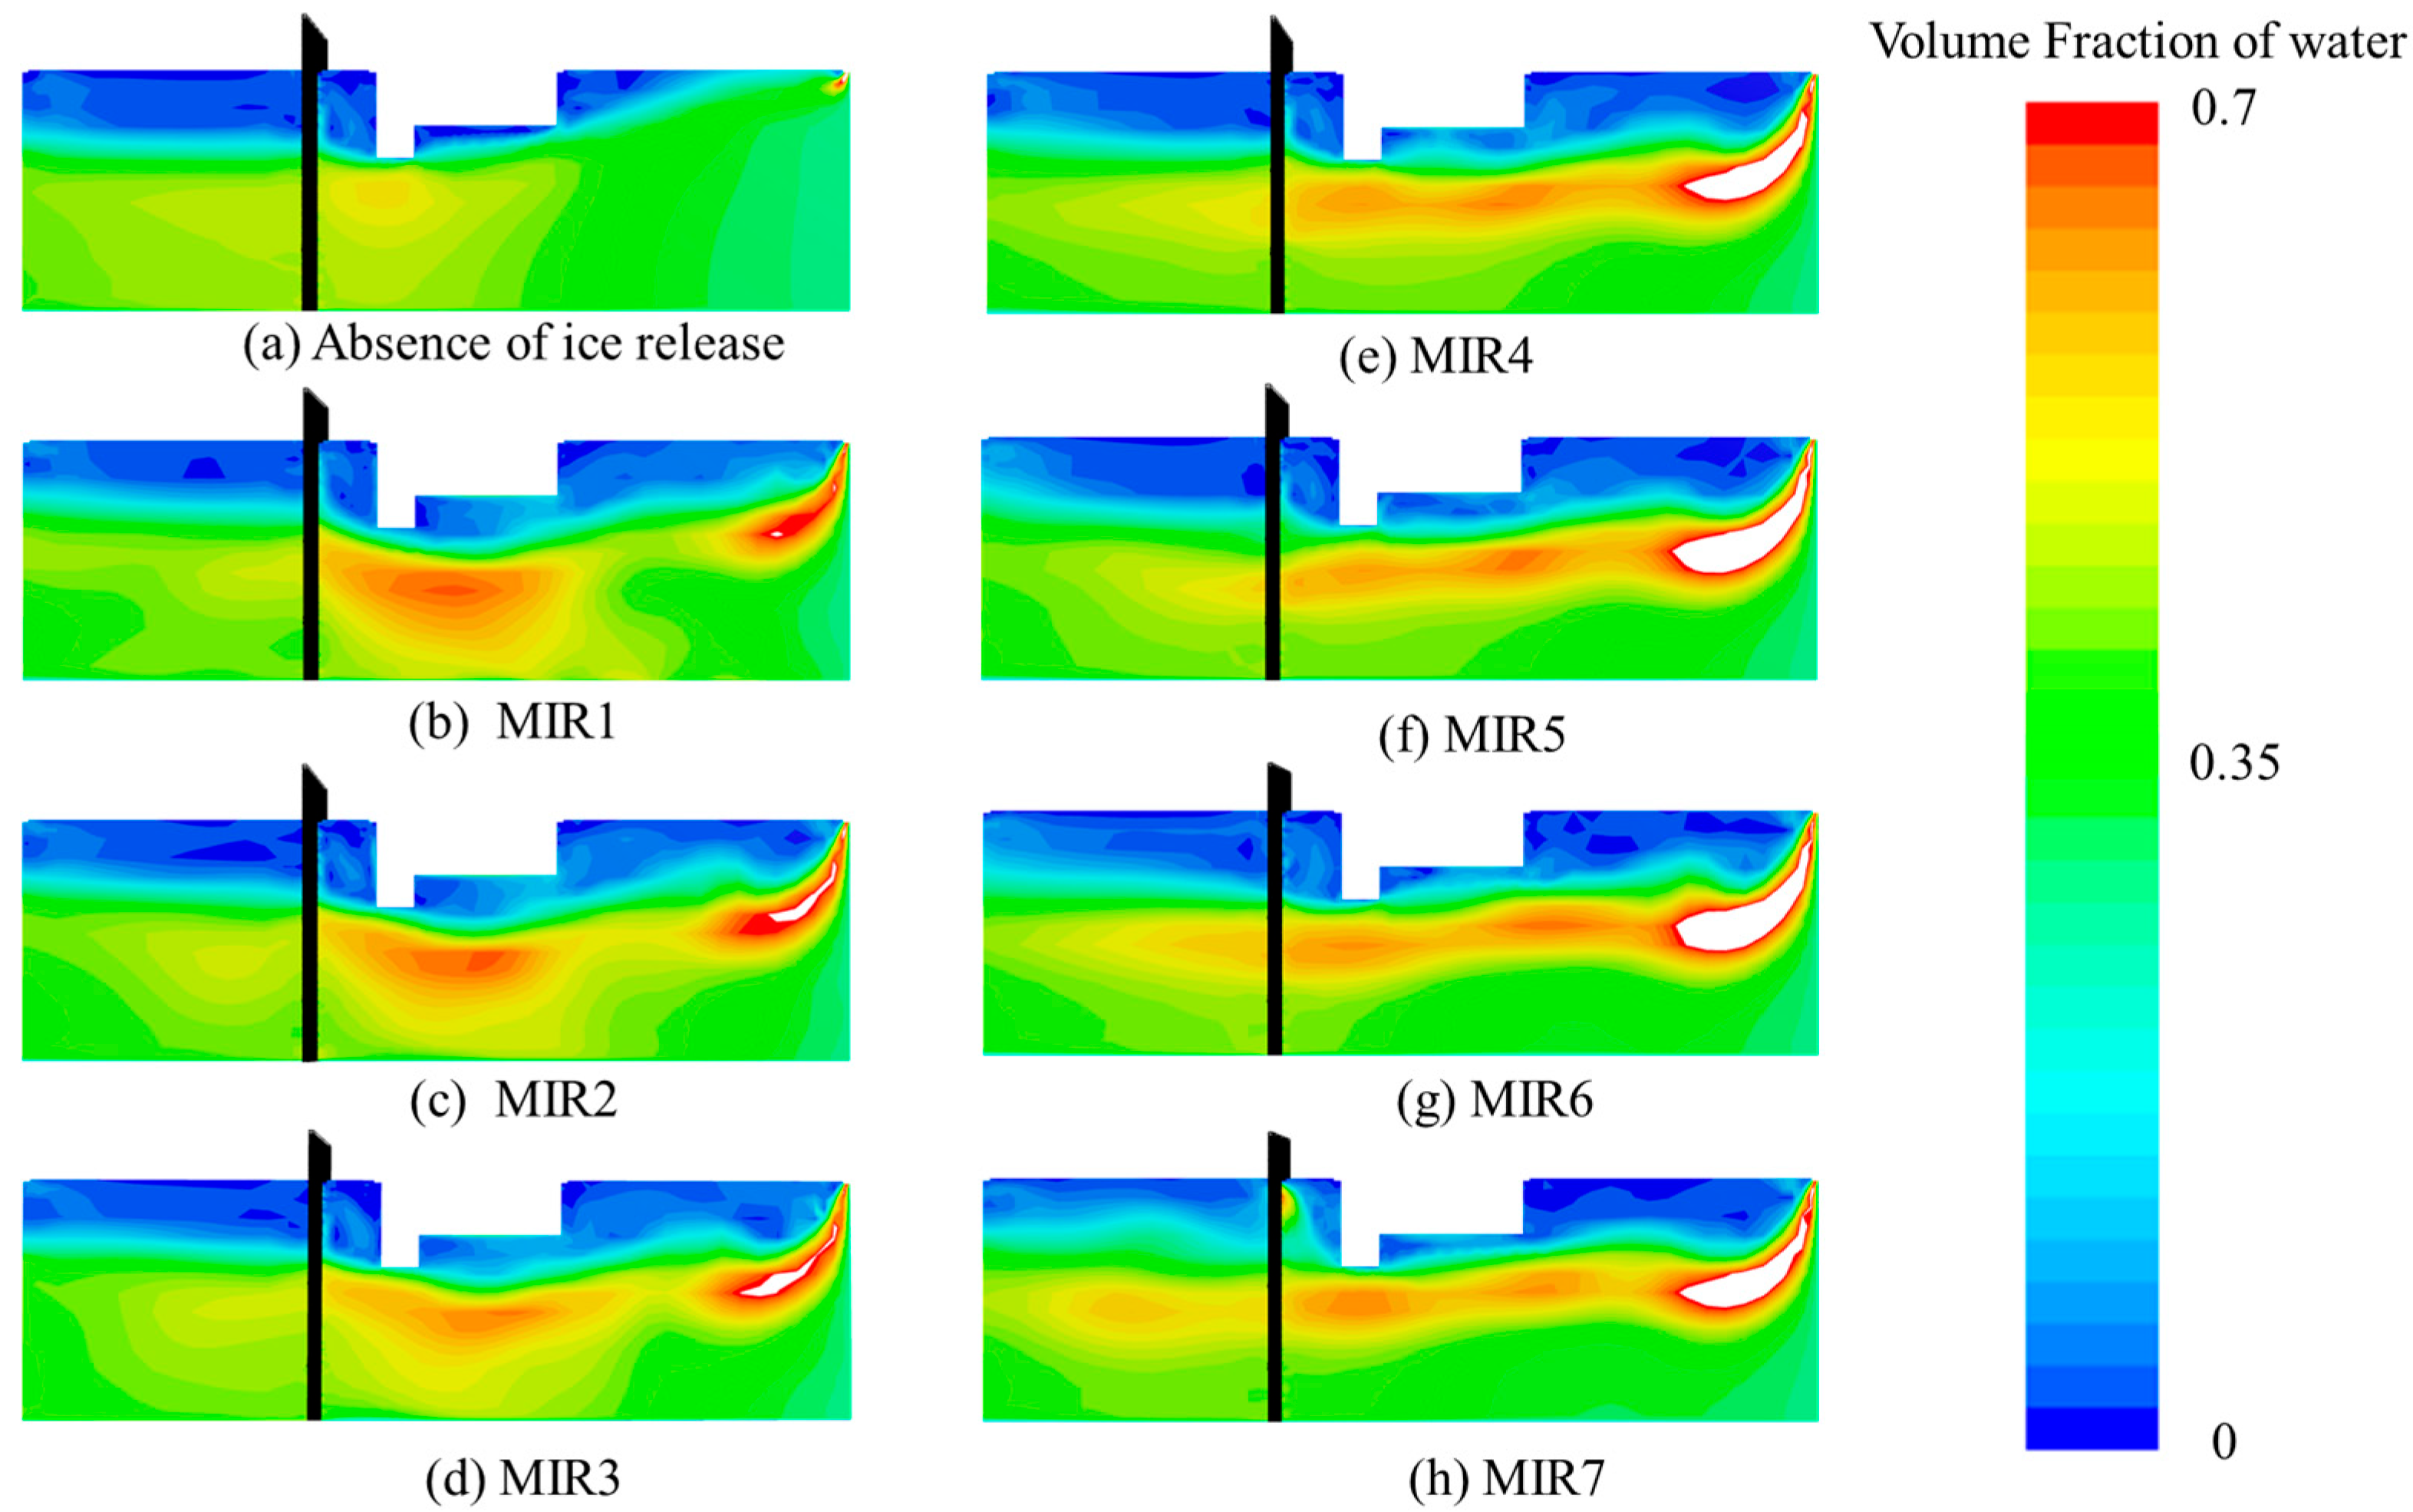
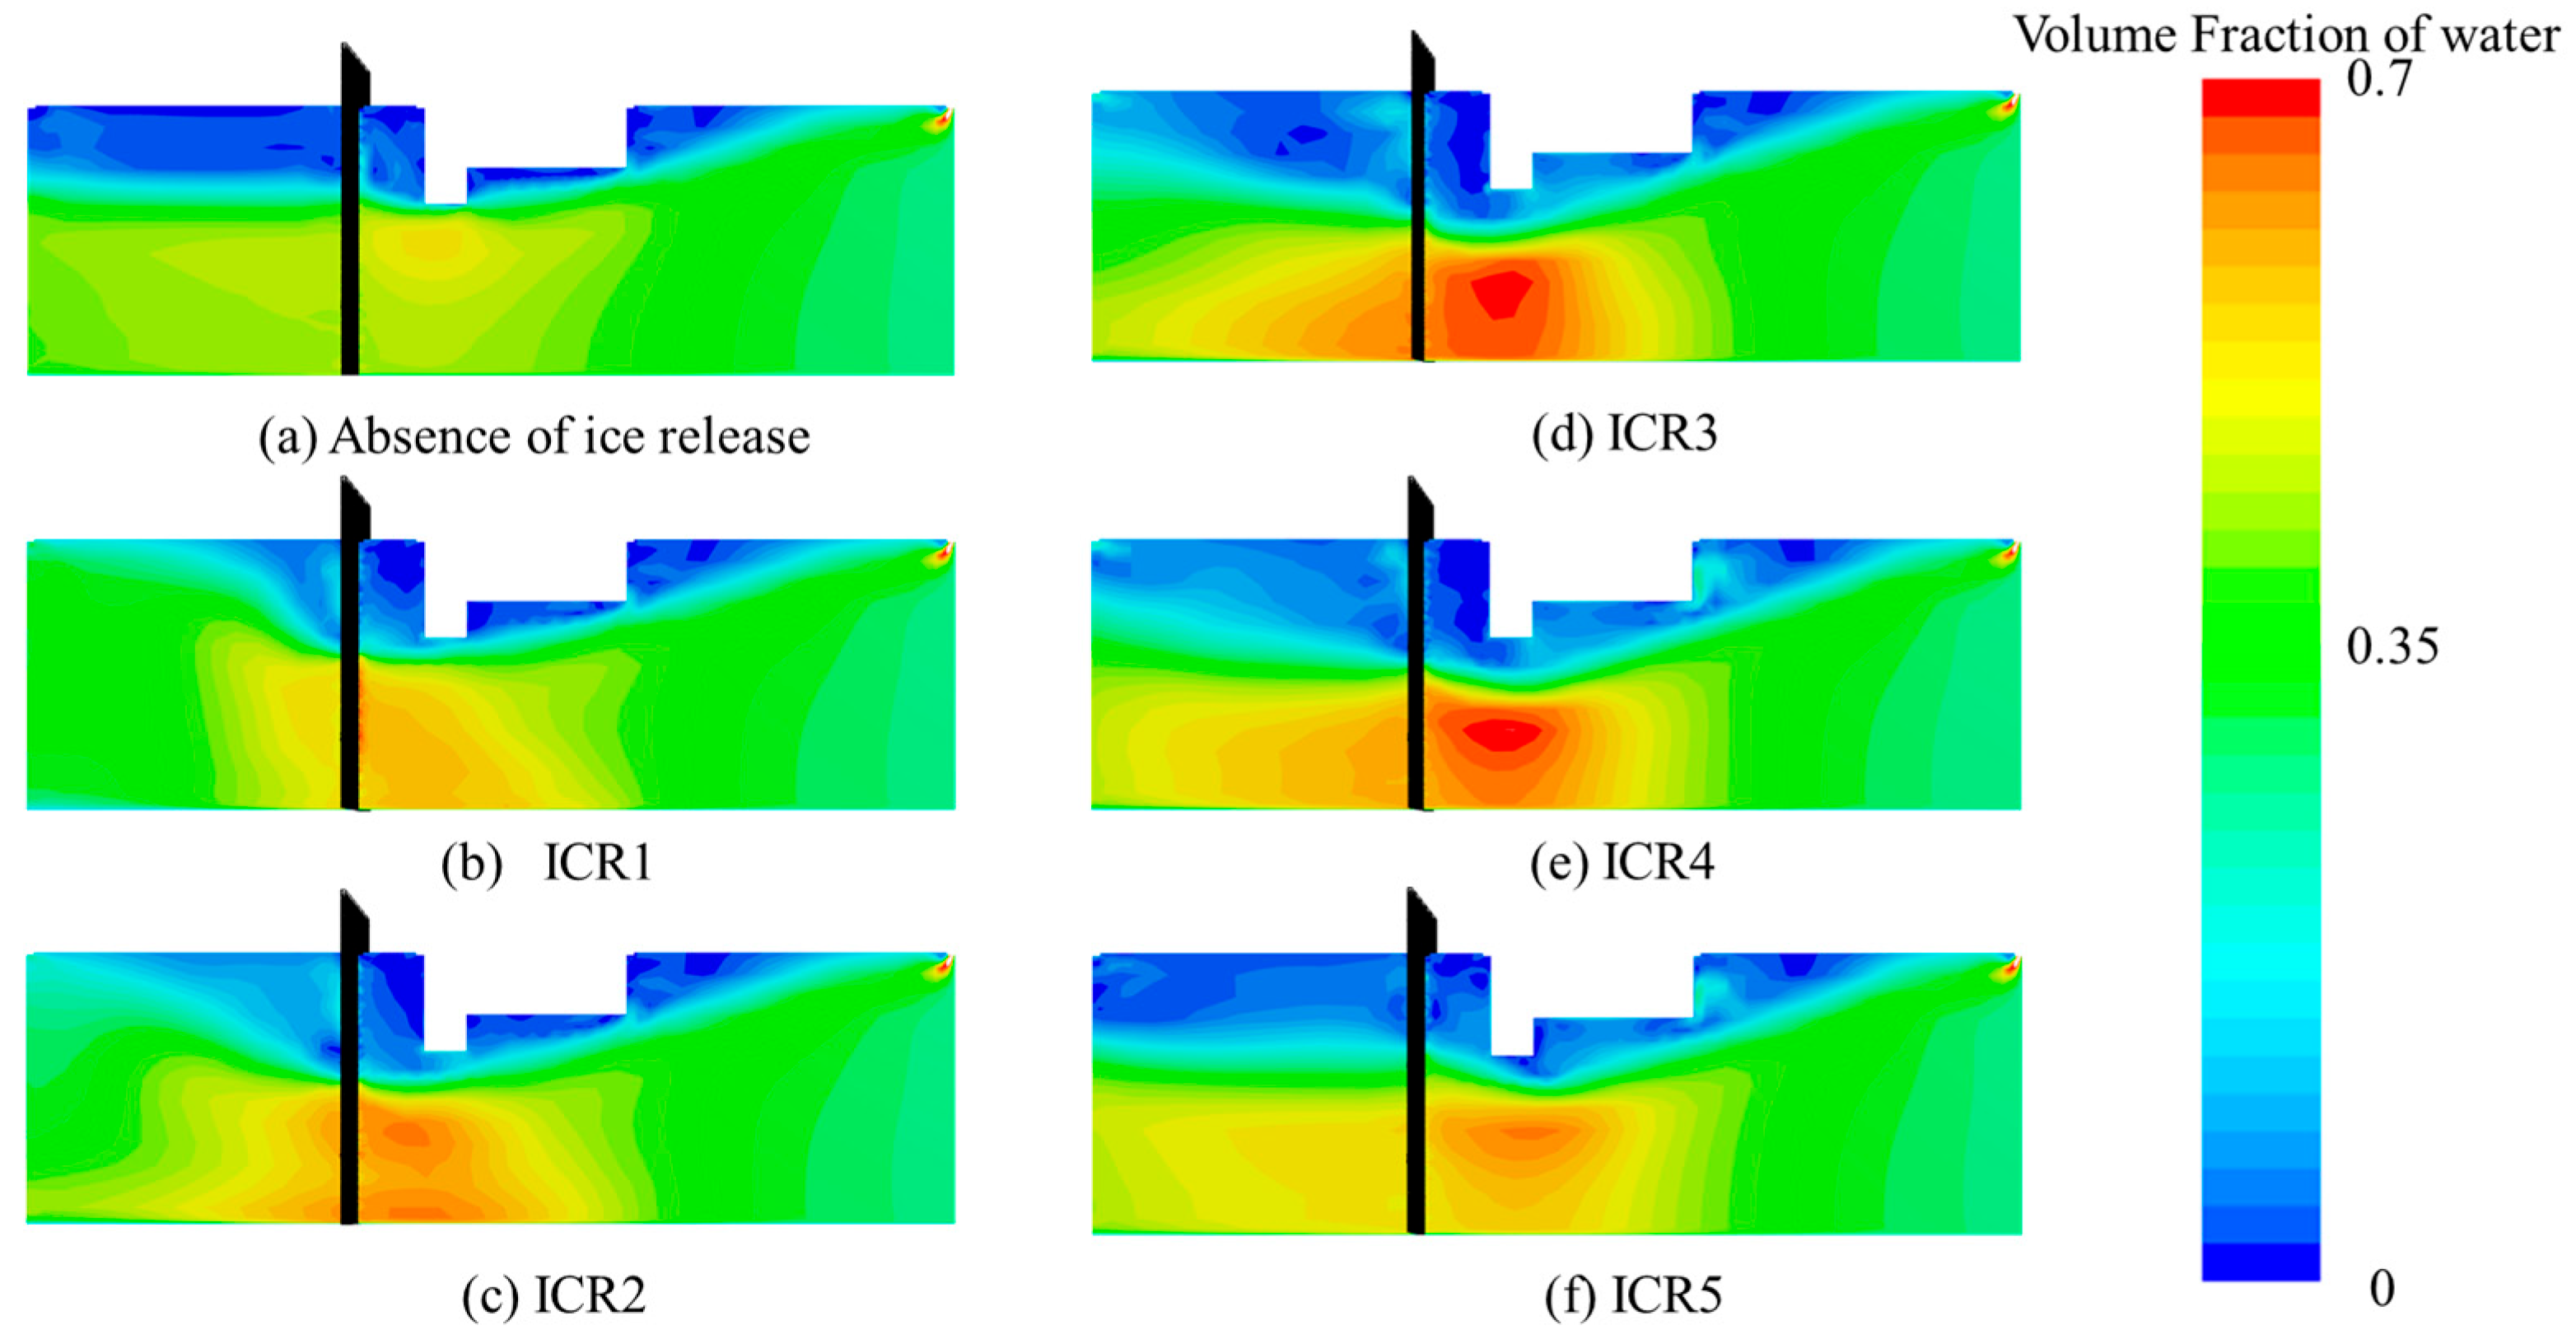
The release height of floating ice is a key factor controlling the changes in structure and the energy redistribution in the flow field of the water intake. The variations in the release height can significantly induce a nonlinear evolution of the flow field, meaning that the flow field will transition from a stable distribution to the development, coupling, and eventual restructuring of localized high-velocity zones. A comparison of flow field characteristics under ice-free conditions and different release heights in the intake is shown in
Figure 19.
From
Figure 19, it can be found that the release height alters the high-velocity zone distribution and flow field structure. Under ice-free conditions, a low-velocity core region exists in the flow field in front of the coarse trash rack, with the velocity being approximately 0.52 m/s. By contrast, the high-velocity zones are distributed uniformly. As the release height increases, the structure of the flow field undergoes noticeable changes, and distinct high-velocity bands gradually develop near the structural elements.
At lower release heights (MIR1, MIR2, and MIR3), the flow field demonstrates a dual acceleration mechanism. One acceleration is due to the cross-sectional contraction at the coarse trash rack and the other acceleration resulted from the reduced flow area caused by the ice accumulation in front of the vertical wall. The two effects synergistically form localized high-velocity zones and enhance the spatial heterogeneity of the flow field. Higher release heights trigger nonlinear restructuring of the flow field. When the release height exceeds 4.8 m, the evolution of the flow field exhibits nonlinear characteristics. The high-velocity zone near the intake gradually expands, while the high-velocity zone in front of the vertical wall increases in the range but experiences a reduction in the peak velocity. The two acceleration zones couple and interact hydrodynamically, reflecting significant changes in the energy distribution within the system and the formation of a distinct high-velocity flow channel. Furthermore, a threshold effect exists in the downstream response of the flow field. When the release height is below 4.8 m, the velocity profile from the coarse trash rack to the outlet remains stable. At release heights below 7.2 m, a mid-channel acceleration zone forms and propagates downstream, indicating that the release height also governs the development of downstream flow structures.
The varying heights at which floating ice is entrained into the pump house result in different degrees of alteration in the flow field. This is because that the release height serving as a key factor influences the extent of flow field evolution.
Figure 20 provides the comparison results of the evolution patterns under the ice-free condition and multiple release height conditions.
Under the ice-free condition, the flow field exhibits uniform and stable laminar characteristics. The velocity distribution transitions along the flow path smoothly, and no significant velocity gradients or localized acceleration phenomena are observed. As the floating ice accumulation height gradually increases from the bottom, changes are detected in the flow field, which exhibit height-dependent characteristics in spatial heterogeneity. When the floating ice is released at ICR1, a distinct vertical stratification emerges in the flow field in front of the coarse trash rack. The velocity in the lower region increases to 0.65 m/s, forming a band-shaped high-velocity zone that extends toward the outlet along the flow direction, while the upper velocity is suppressed below 0.35 m/s due to the blocking effect of the floating ice. The difference between the velocities in the upper and lower regions stems from the dual effects induced by floating ice accumulation.
As the release height increases to ICR2, independent high-velocity core zones develop simultaneously in front of the coarse trash rack and below the straight-wall intake. When the release height reaches ICR3, the two high-velocity zones become spatially coupled, forming a horseshoe-shaped acceleration zone below the straight wall with a maximum velocity of 0.7 m/s. The velocity field in this region exhibits a typical three-dimensional radial distribution pattern, with the peak velocity in the core area gradually decaying toward the inlet and outlet directions. This phenomenon reveals that the nonlinear flow response is triggered by the increased floating ice accumulation density. Under the circumstances, the solid–liquid interphase momentum transfer begins to dominate the energy redistribution process. When the release height further increases to ICR4, the shape of the high-velocity zone expands from compact and circular to an elliptical band, with the increase rate being 40% in coverage area, but the peak velocity decreases to 0.66 m/s. This trade-off between “area and velocity” reflects a shift in energy dissipation mechanisms, i.e., the enhanced interaction between the surface shear flow and bottom blocking flow leads to an increased turbulent fluctuation energy.
At the release height of ICR5, the core velocity of the high-velocity zone further decreases to 0.63 m/s, while a transition zone appears between the coarse trash rack and the outlet.
6.2. Local Flow Velocity Variations Under Different Floating Ice Release Positions
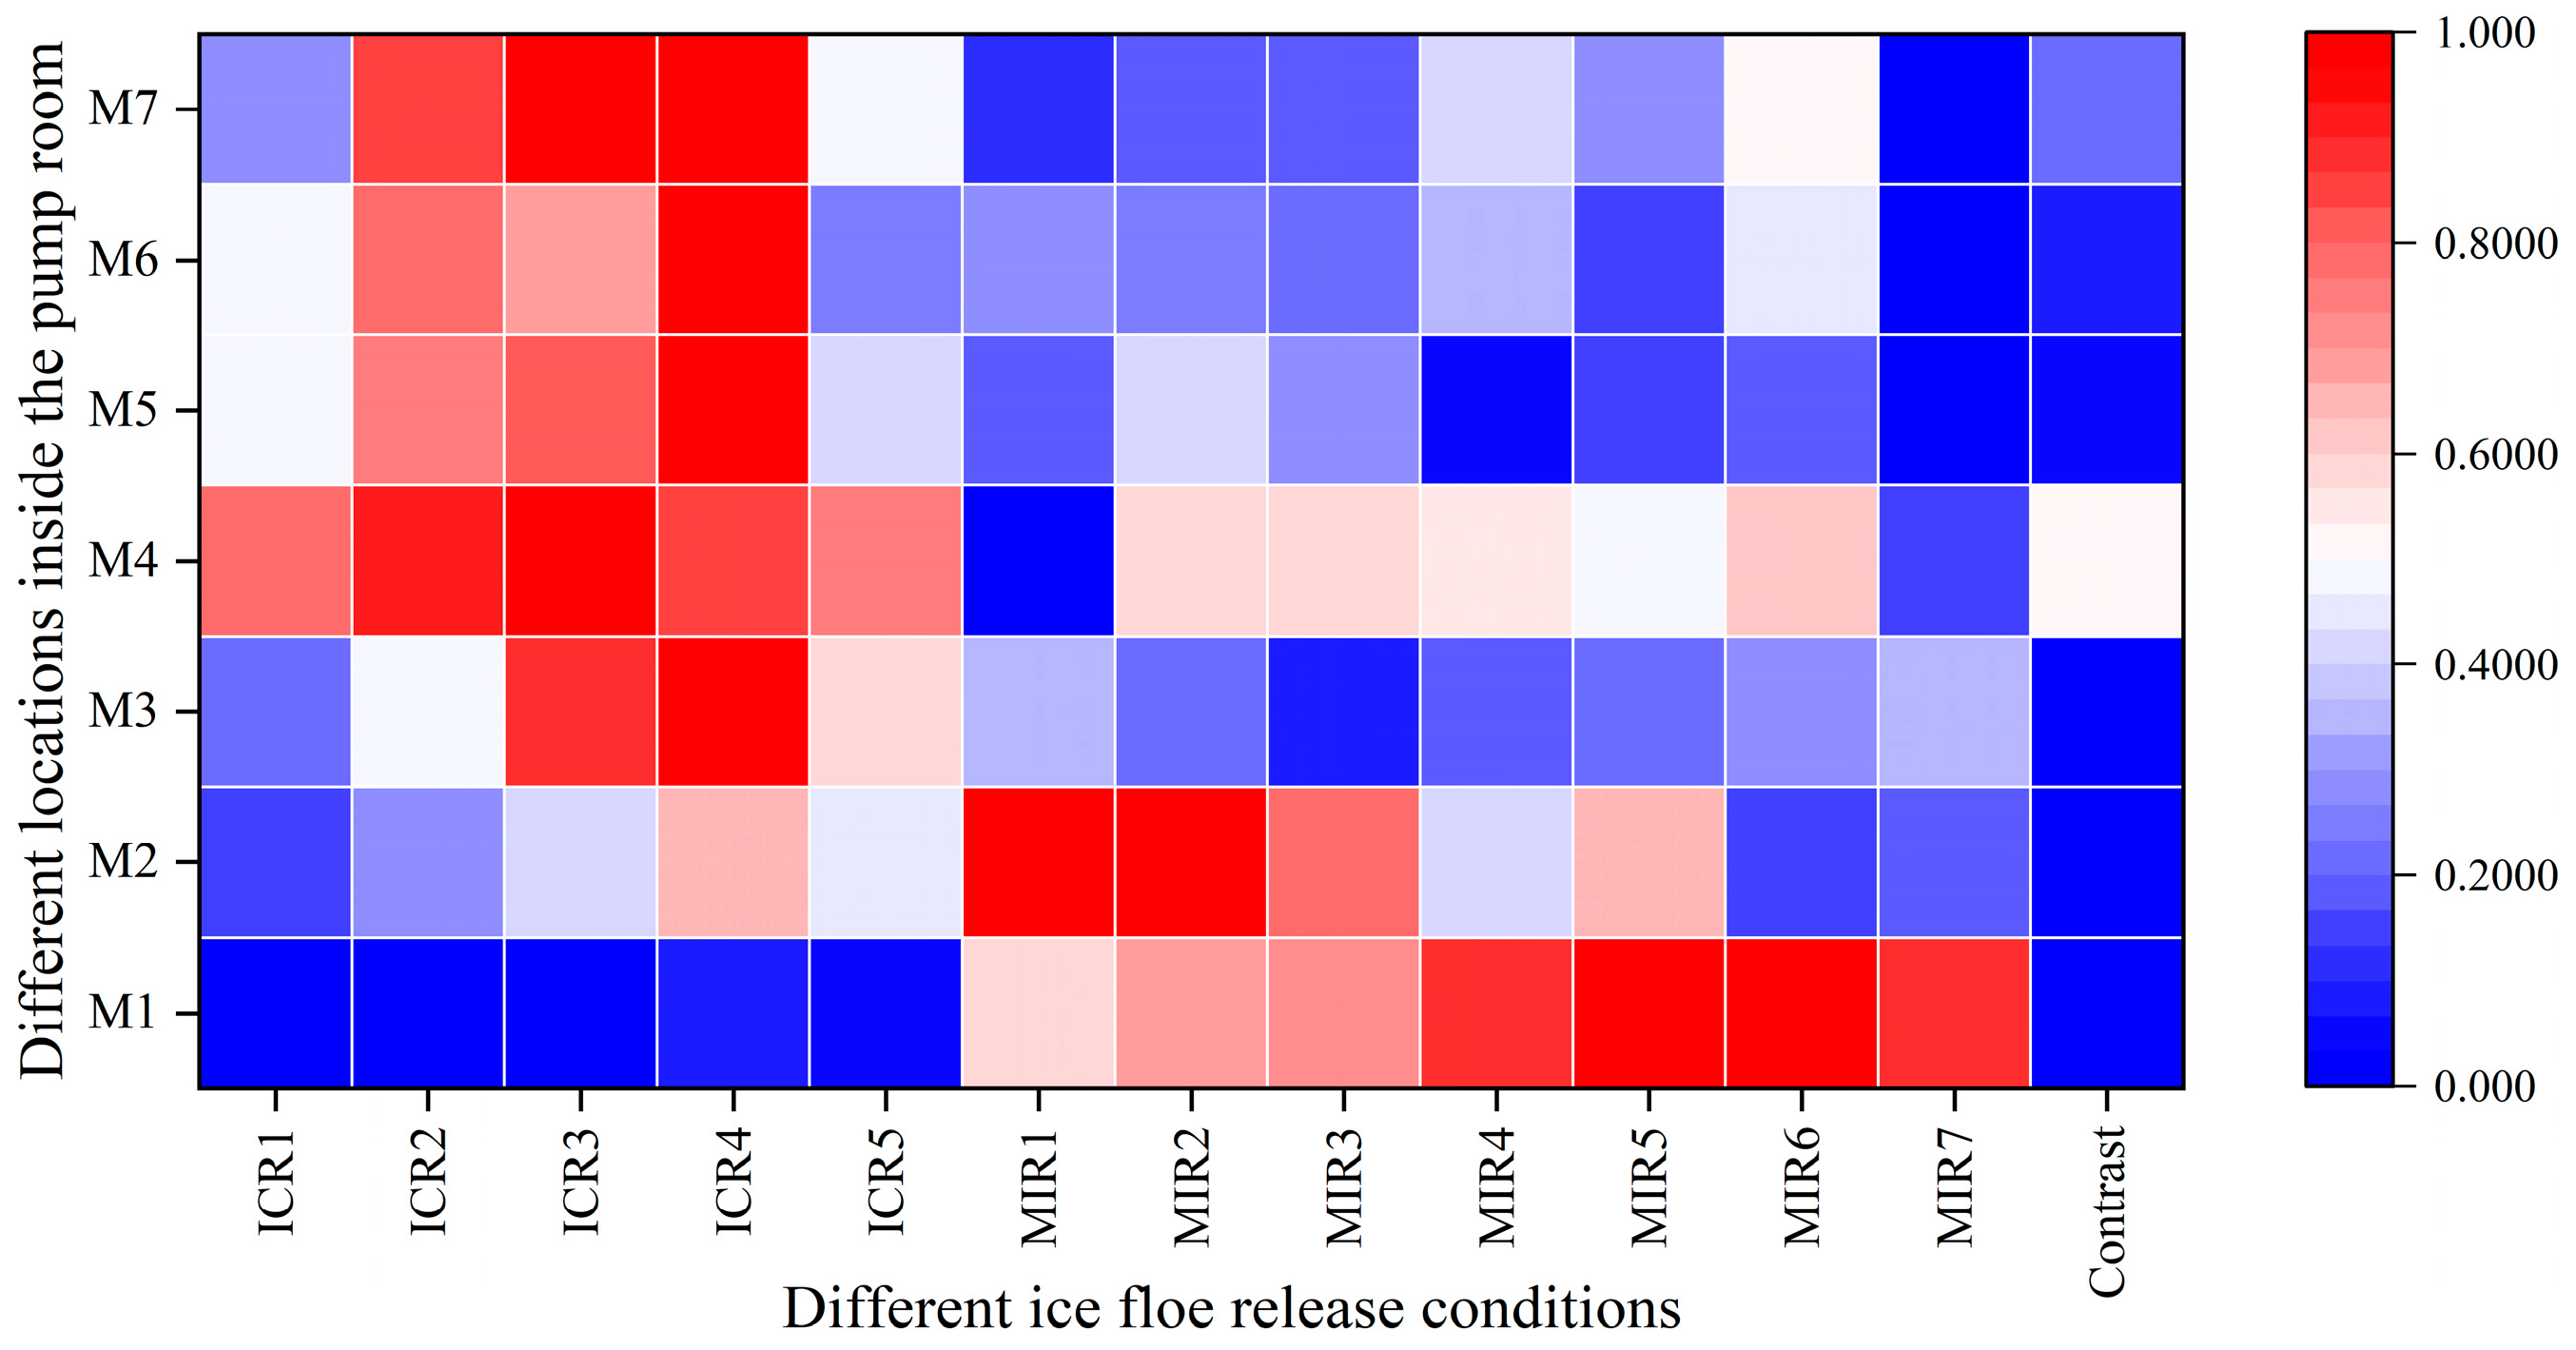
To characterize the flow field, seven representative monitoring points mentioned above were selected. The fluctuation characteristics of flow velocity at these points were analyzed using the standard deviation metric [
41]. The results indicate that the release height of floating ice has a significant spatial response effect on flow disturbances.
As can be seen in
Figure 21, compared to the ice-free control condition, the internal release condition ICR4 induces the strongest disturbance across the domain. The peak standard deviation values at M3–M7 all reach 1.0, representing a 98.3% increase relative to the baseline, and exhibited a unimodal distribution pattern. In contrast, the high release condition ICR5 results in significantly weaker disturbances, with the standard deviation at M3 decreasing by 42.7% compared to ICR4.The MIR series exhibits a typical bimodal response pattern. Specifically, MIR1 produces the highest disturbance intensity near the field at M2, but this intensity decayed rapidly at downstream points M4–M7, dropping to values between 0.103 and 0.193—a spatial attenuation rate of 89.7%. Conversely, MIR7 showed the lowest disturbance level across all monitoring points. Overall comparison reveals that the spatial extent of disturbance in the ICR group was 1.8 times larger than that in the MIR group, while the MIR group exhibited approximately 31.6% higher disturbance intensity in the near-field region compared to the ICR group. These results demonstrate that the differences in the spatial release position of floating ice can cause variations in the standard deviation of flow velocity fluctuations by a factor of 2.7 to 4.8, significantly affecting the stability of the internal flow field and the structure of local turbulence within the pump house.
6.3. Changes in Local Vortex Intensity Under Different Scenarios Compared to Ice-Free Conditions
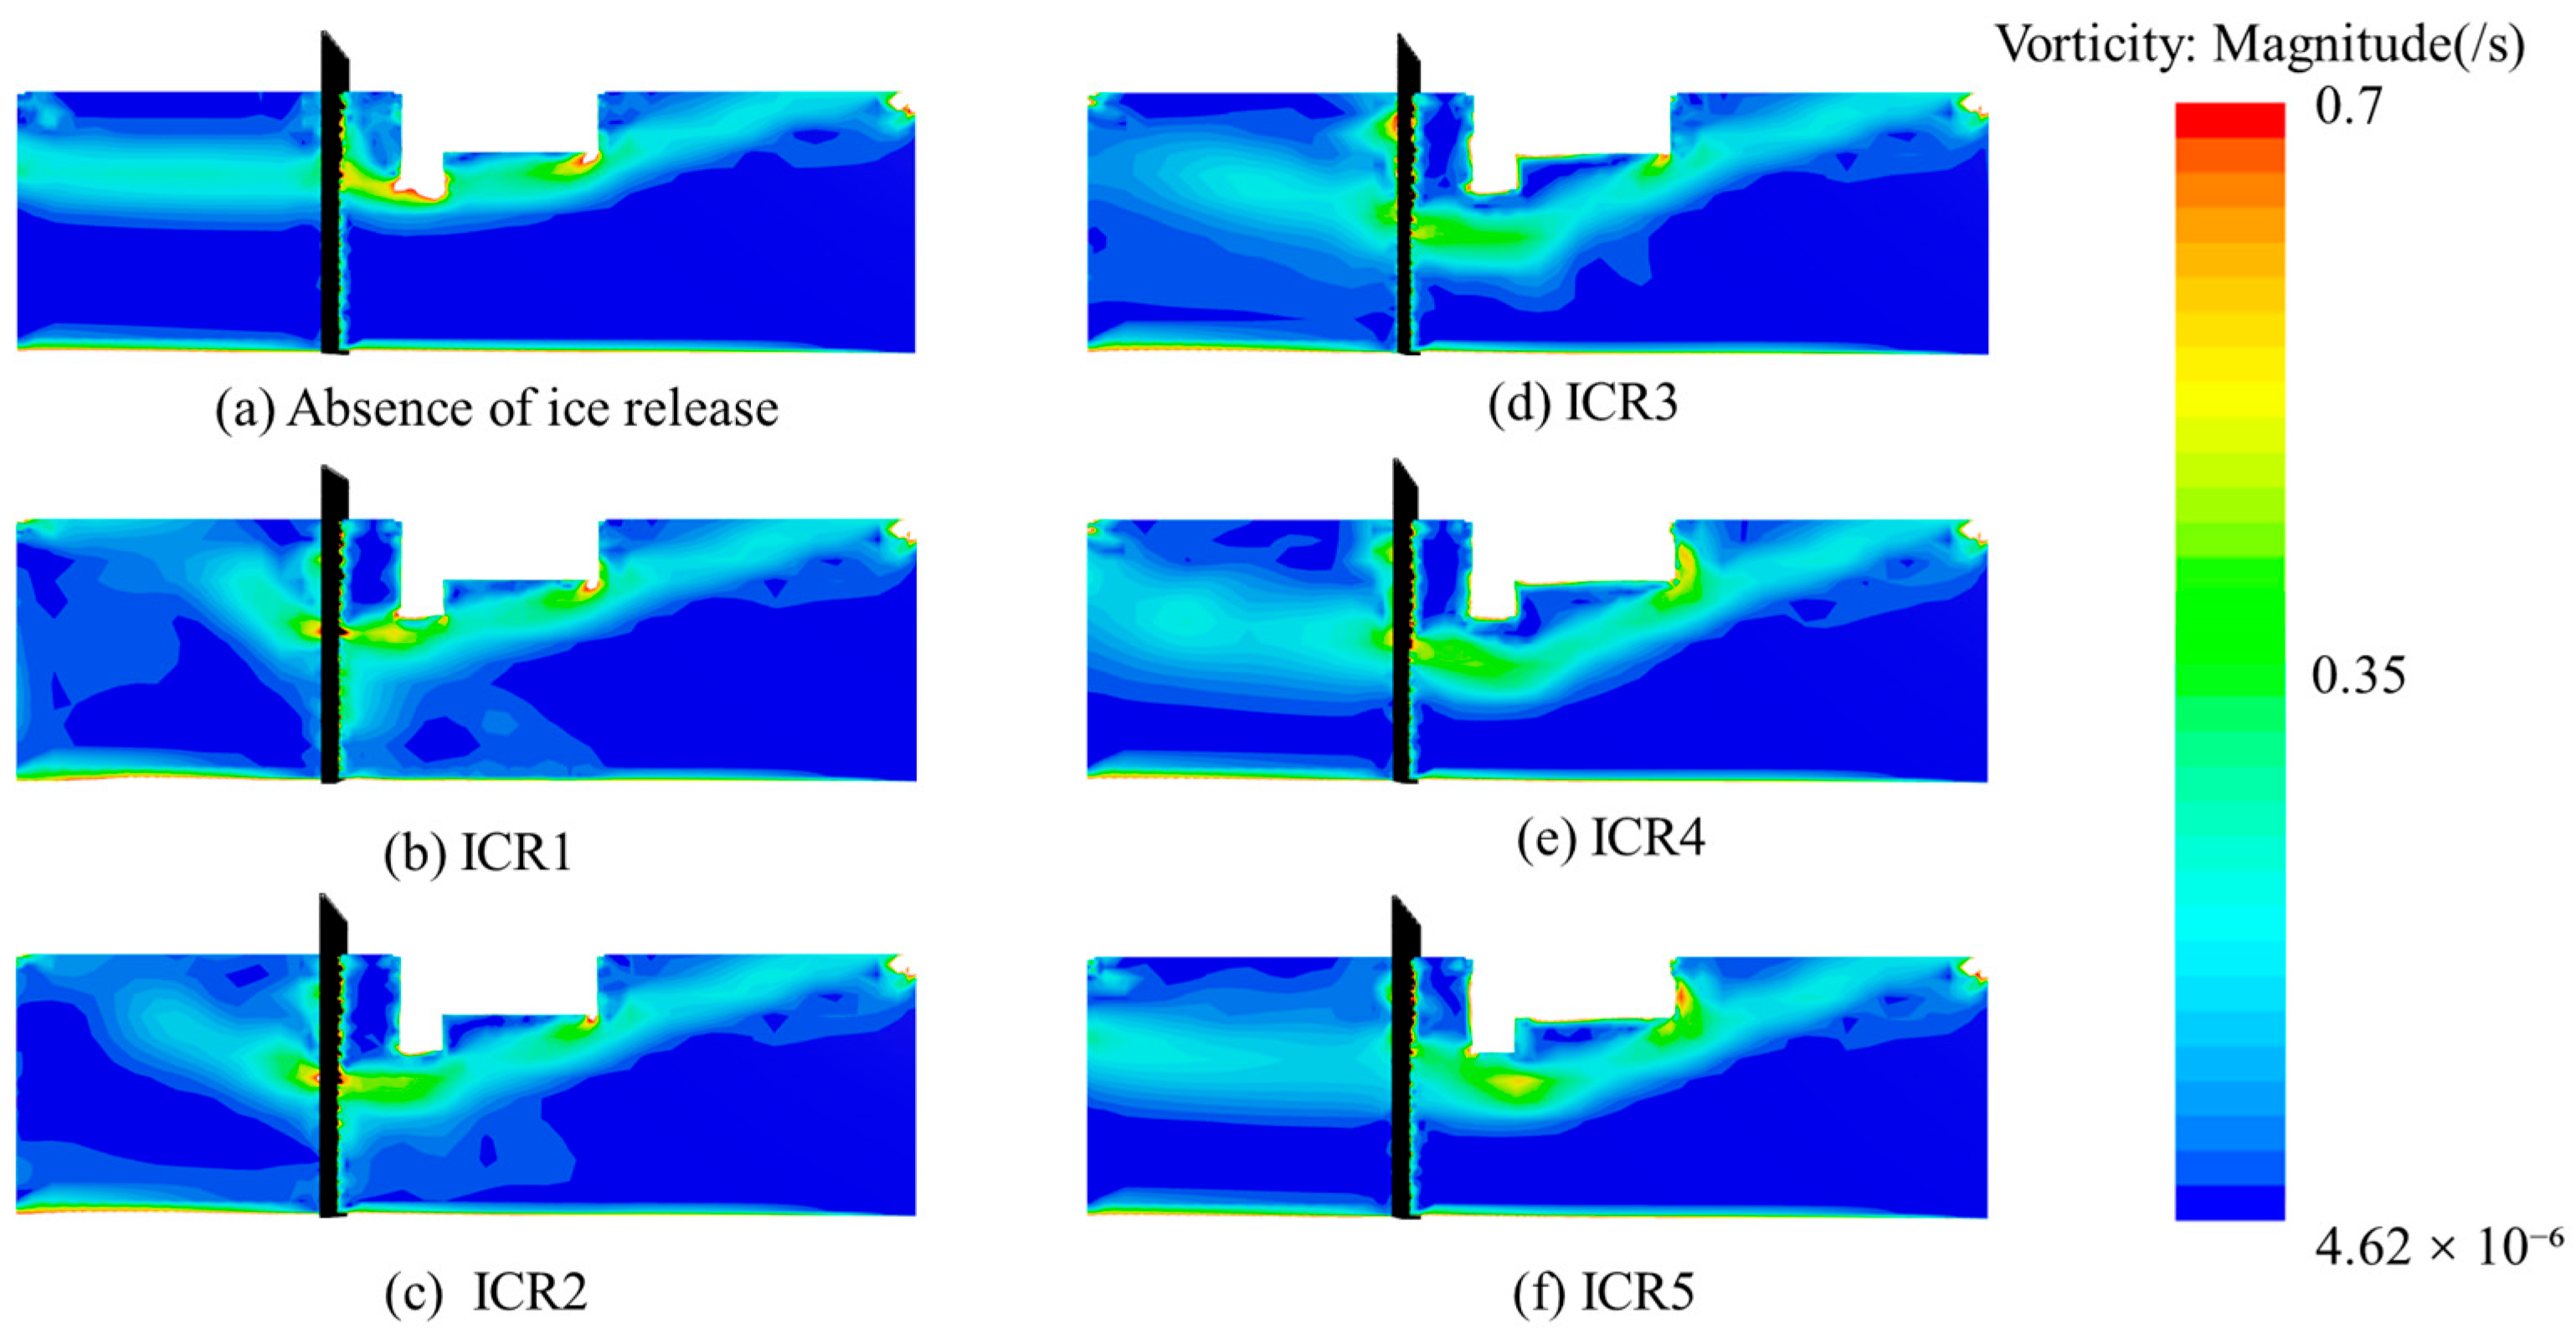
The accumulation of floating ice under different operating conditions alters the hydrodynamic environment inside the pump house, leading to a redistribution of vorticity intensity and changes in local hydraulic stability. The vorticity distribution under the ice-free condition is shown in
Figure 22a. A stable and continuous vortical structure exists between the coarse trash rack and the inlet region. The highest vorticity magnitude is primarily concentrated along the edges of the straight-wall intake, reaching the maximum value of approximately 7 s
−1, indicating well-developed rotational flow and natural energy dissipation in this area.
Under the ICR1 condition, vorticity disturbances begin to propagate from the upper to the lower water layers. A complex vortex structure forms near the coarse trash rack, accompanied by the increased vorticity intensity, suggesting that the floating ice accumulation significantly disturbs the flow path. Local high-vorticity zones develop both upstream and downstream of the trash rack, likely due to the flow blockage caused by the ice accumulation. As the release height increases, the vorticity band below the straight-wall intake extends upstream and connects with the high-vorticity zone near the trash rack, forming an inclined vorticity corridor. The extent of vorticity expands in the outlet region, while a vorticity-free zone appears between the trash rack and the straight wall due to the reduced flow velocity. This indicates that the influence of ice accumulation propagates to the midstream and downstream areas, suppressing local flow activity. At the ICR3 release height, the vorticity field begins to stabilize. The coverage area of vorticity in the outlet region increases significantly, and the maximum vorticity zone shifts toward the water surface, while a vorticity-free band emerges near the bottom. The vorticity distribution becomes more dispersed with decreased values in some areas, which is possibly due to the global energy redistribution resulting from ice-induced flow alterations.
At higher release heights, as shown in
Figure 22e,f, the vorticity field stabilizes further. The high-vorticity zone contracts to the vicinity of the coarse trash rack, and vorticity intensities in other regions approach those under ice-free conditions, indicating partial recovery of the flow structure. Simultaneously, the vorticity core below the straight-wall intake shifts toward the inlet, and the width of the vorticity band increases, suggesting that the disturbance caused by the ice accumulation extends from local to global scales. The accumulation of floating ice regulates the vorticity field through two primary mechanisms. One is that it occupies the flow passage space, alters the local velocity distribution, induces the shear instability, and generates or enhances the vorticity. The other is that it increases the flow resistance and converts part of the kinetic energy into turbulent fluctuating energy, thereby dynamically adjusting the vorticity intensity and distribution.
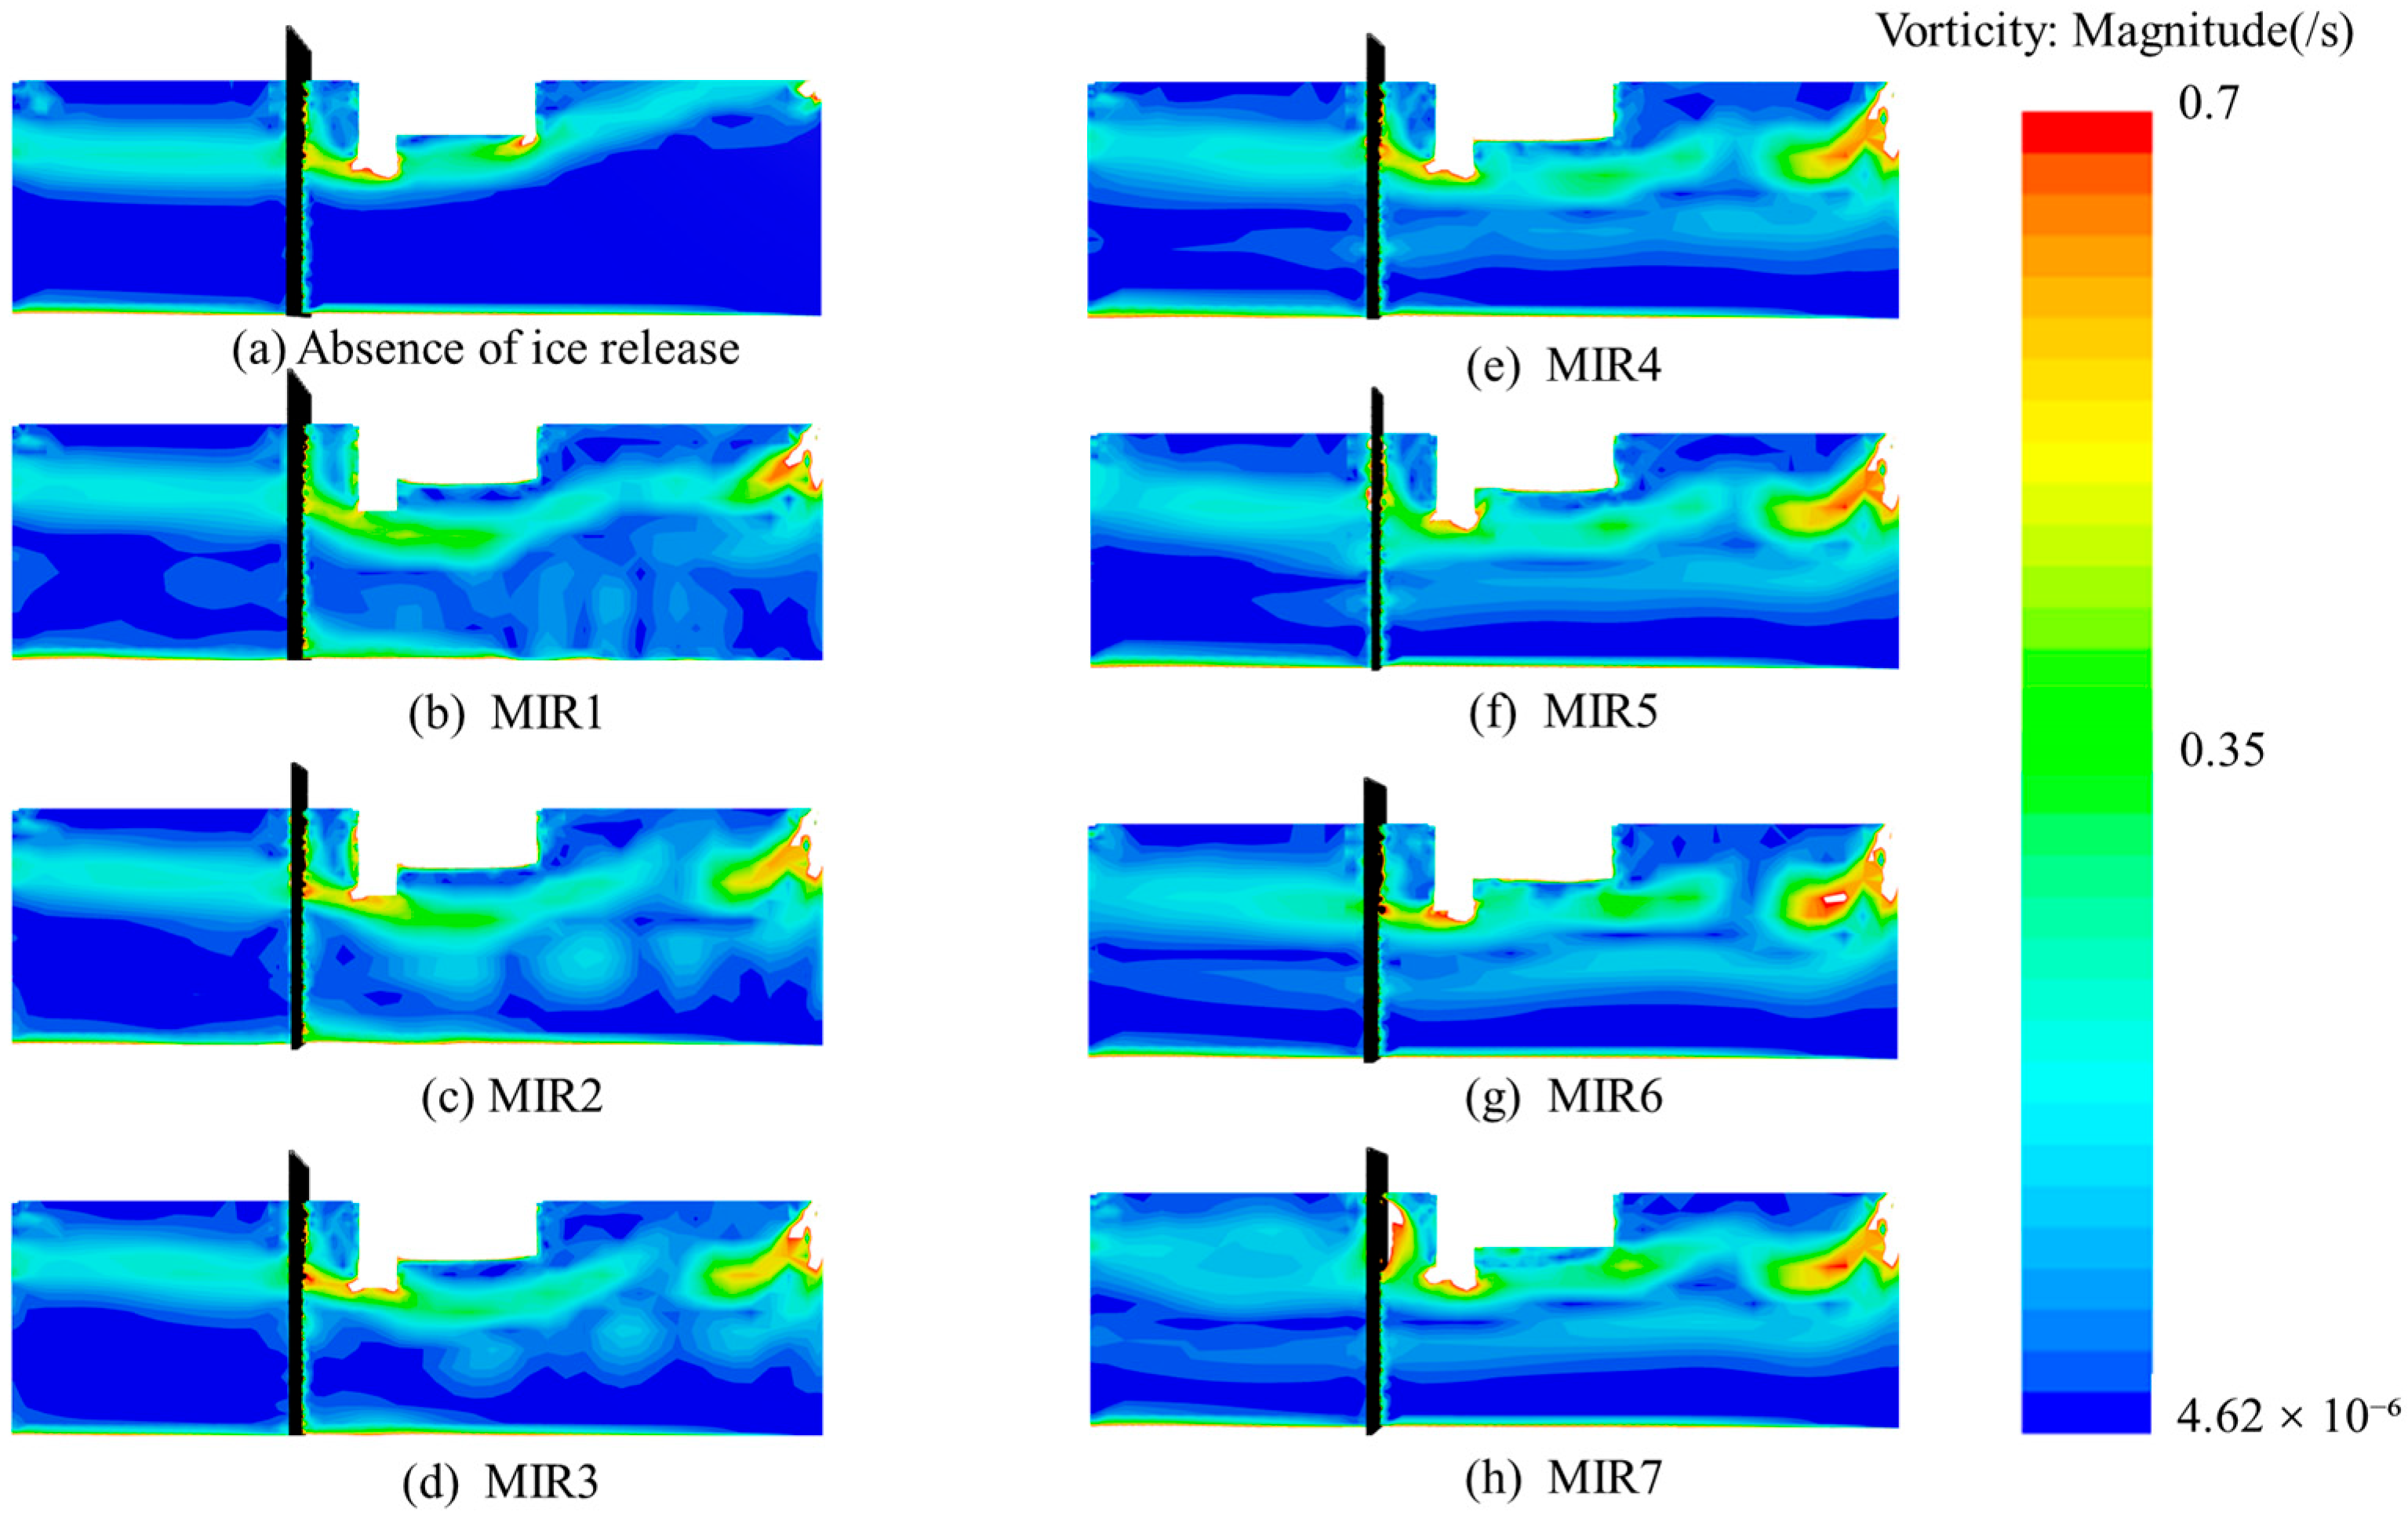
The release height of floating ice at the inlet significantly regulates the spatial distribution, intensity, and energy dissipation mechanisms of the vorticity field within the pump house, as shown in
Figure 23. Lower release heights primarily enhance vorticity through localized shear instabilities, resulting in a highly disturbed flow field with multiple vortex cores. As the release height increases, the flow field evolves from intense instability toward a vertically stratified and structured pattern. At high release heights, it tends to stabilize into a quasi-laminar state, reflecting the multi-mode control of release parameters on vortex dynamics.
Under the MIR condition, disturbances significantly intensify in the region from the inlet to the front of the coarse trash rack. The area of high vorticity (shown in red) expands by 30%, and multiple vortex cores emerge. The vorticity differentiation in front of the trash rack is highly coupled with flow contraction caused by the ice accumulation, while the vorticity energy below the straight-wall intake decreases. This can be explained by that the ice accumulation enhances the shear instability, generating new vortex structures. As the release height increases, the vorticity distribution from the inlet to the trash rack changes: bottom vorticity exhibits a circular pattern, and the vorticity band below the straight-wall intake extends, increasing its coverage area by 25%. The accumulation of floating ice alters streamline curvature, inducing multi-scale vortex interactions.
Under the MIR3 condition, the vorticity intensity distribution becomes more organized, with vortex cores shifting toward the inlet. A blue-green low-vorticity band appears in the middle of the trash rack, indicating a vorticity redistribution due to the ice accumulation. At higher release heights, the vorticity field exhibits vertical stratification, forming a uniform vorticity layer from the inlet to the trash rack. Under MIR7, a high-intensity vortex band reappears between the trash rack and the straight wall, but with a larger spatial scale. The surface ice accumulation cause a vertical momentum redistribution in the main flow, shifting the energy dissipation mode from turbulent to quasi-laminar.
In summary, at lower release heights, the ice accumulation enhances shear instability through localized blockage, thus increasing the coverage of high-vorticity zones and the number of vortex cores. At moderate release heights, the vertical energy transfer dominates the flow field, reducing the coverage of high-vorticity regions as layered dissipation structures gradually replace discrete vortex clusters.
6.4. Comparison of Vorticity Intensity Under Different Release Positions
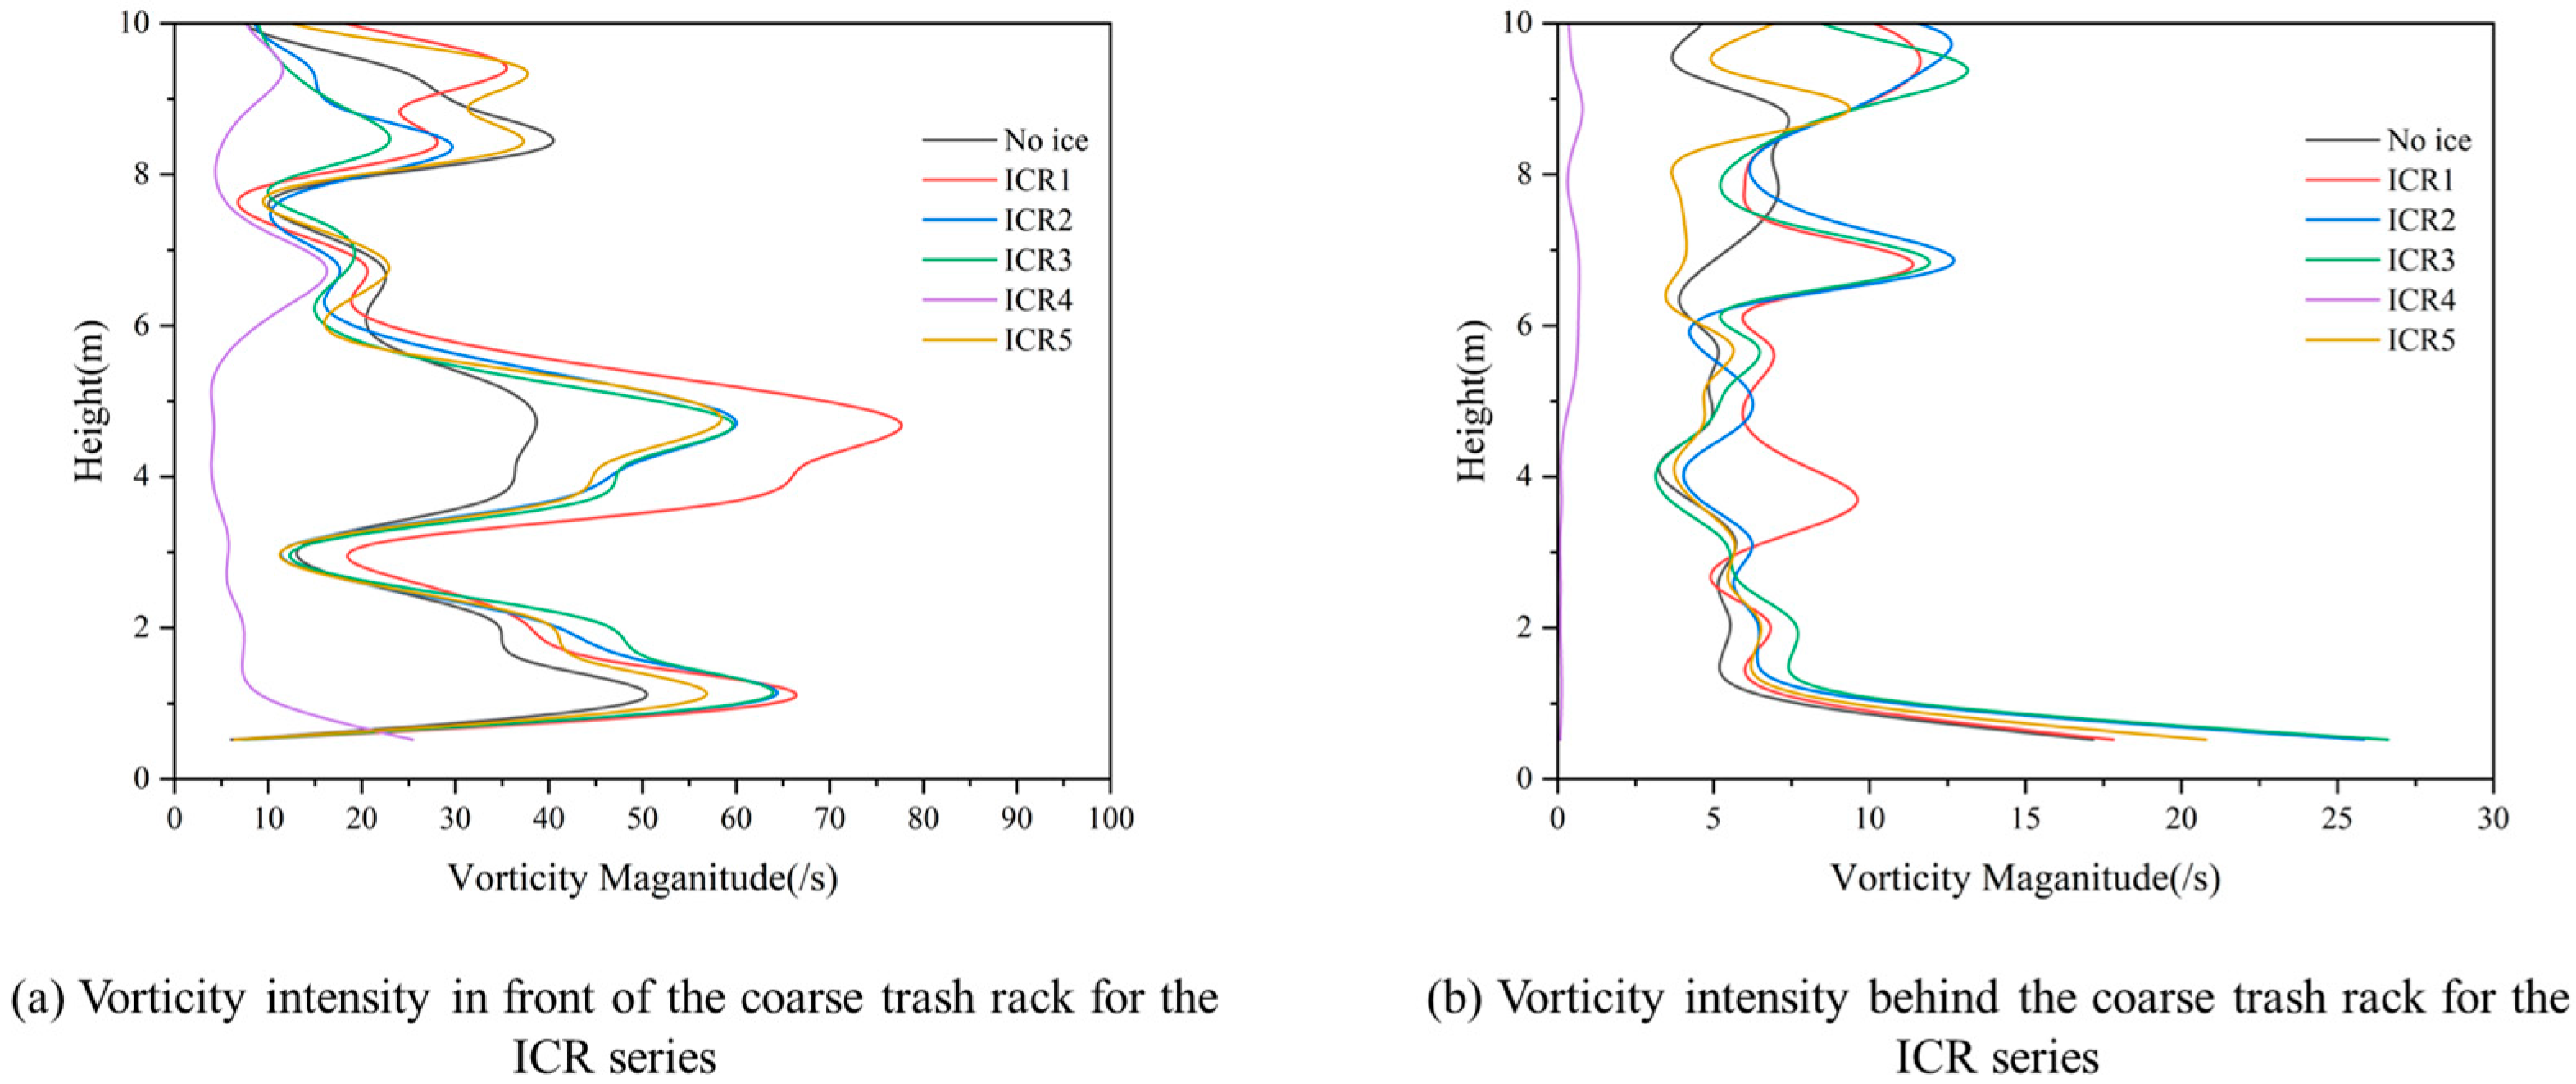
The release height of floating ice inside the pump house has a decisive influence on the distribution of vorticity intensity. Lower release heights (ICR1–ICR3) induce strong vorticity in the middle and lower water layers in front of the coarse trash rack, while higher release heights (ICR4, ICR5) significantly reduce the disturbance effect. The coarse trash rack structure exhibits notable attenuation and homogenization effects on vorticity intensity, effectively suppressing flow disturbances in the downstream region.
As shown in
Figure 24, the influence of floating ice on the vorticity intensity varies significantly with the release height. In front of the coarse trash rack, the ICR1–ICR3 groups generally exhibit higher vorticity intensity in the middle and lower water layers. Specifically, ICR1 reaches a maximum value of 86.89 s
−1 at a depth of 1.044 m, while ICR2 and ICR3 reach 81.24 s
−1 and 51.94 s
−1, respectively—all significantly higher than the control group value of 65.39 s
−1. In contrast, higher release positions such as ICR4 and ICR5 show markedly lower vorticity intensity in the same depth range. For example, at 3.132 m depth, ICR5 registers only 4.00 s
−1, considerably lower than the 9.05 s
−1 observed for ICR1.
Behind the coarse trash rack, the vorticity intensity of all groups attenuates overall, with reduced differences between conditions, indicating significant suppression of turbulent vorticity. For instance, at 1.044 m depth, the vorticity intensity for ICR1 decreases from 86.89 s−1 (in front of the rack) to 6.08 s−1 (behind the rack), while for ICR5, it drops from 7.26 s−1 to 0.14 s−1—a reduction of over 98%.
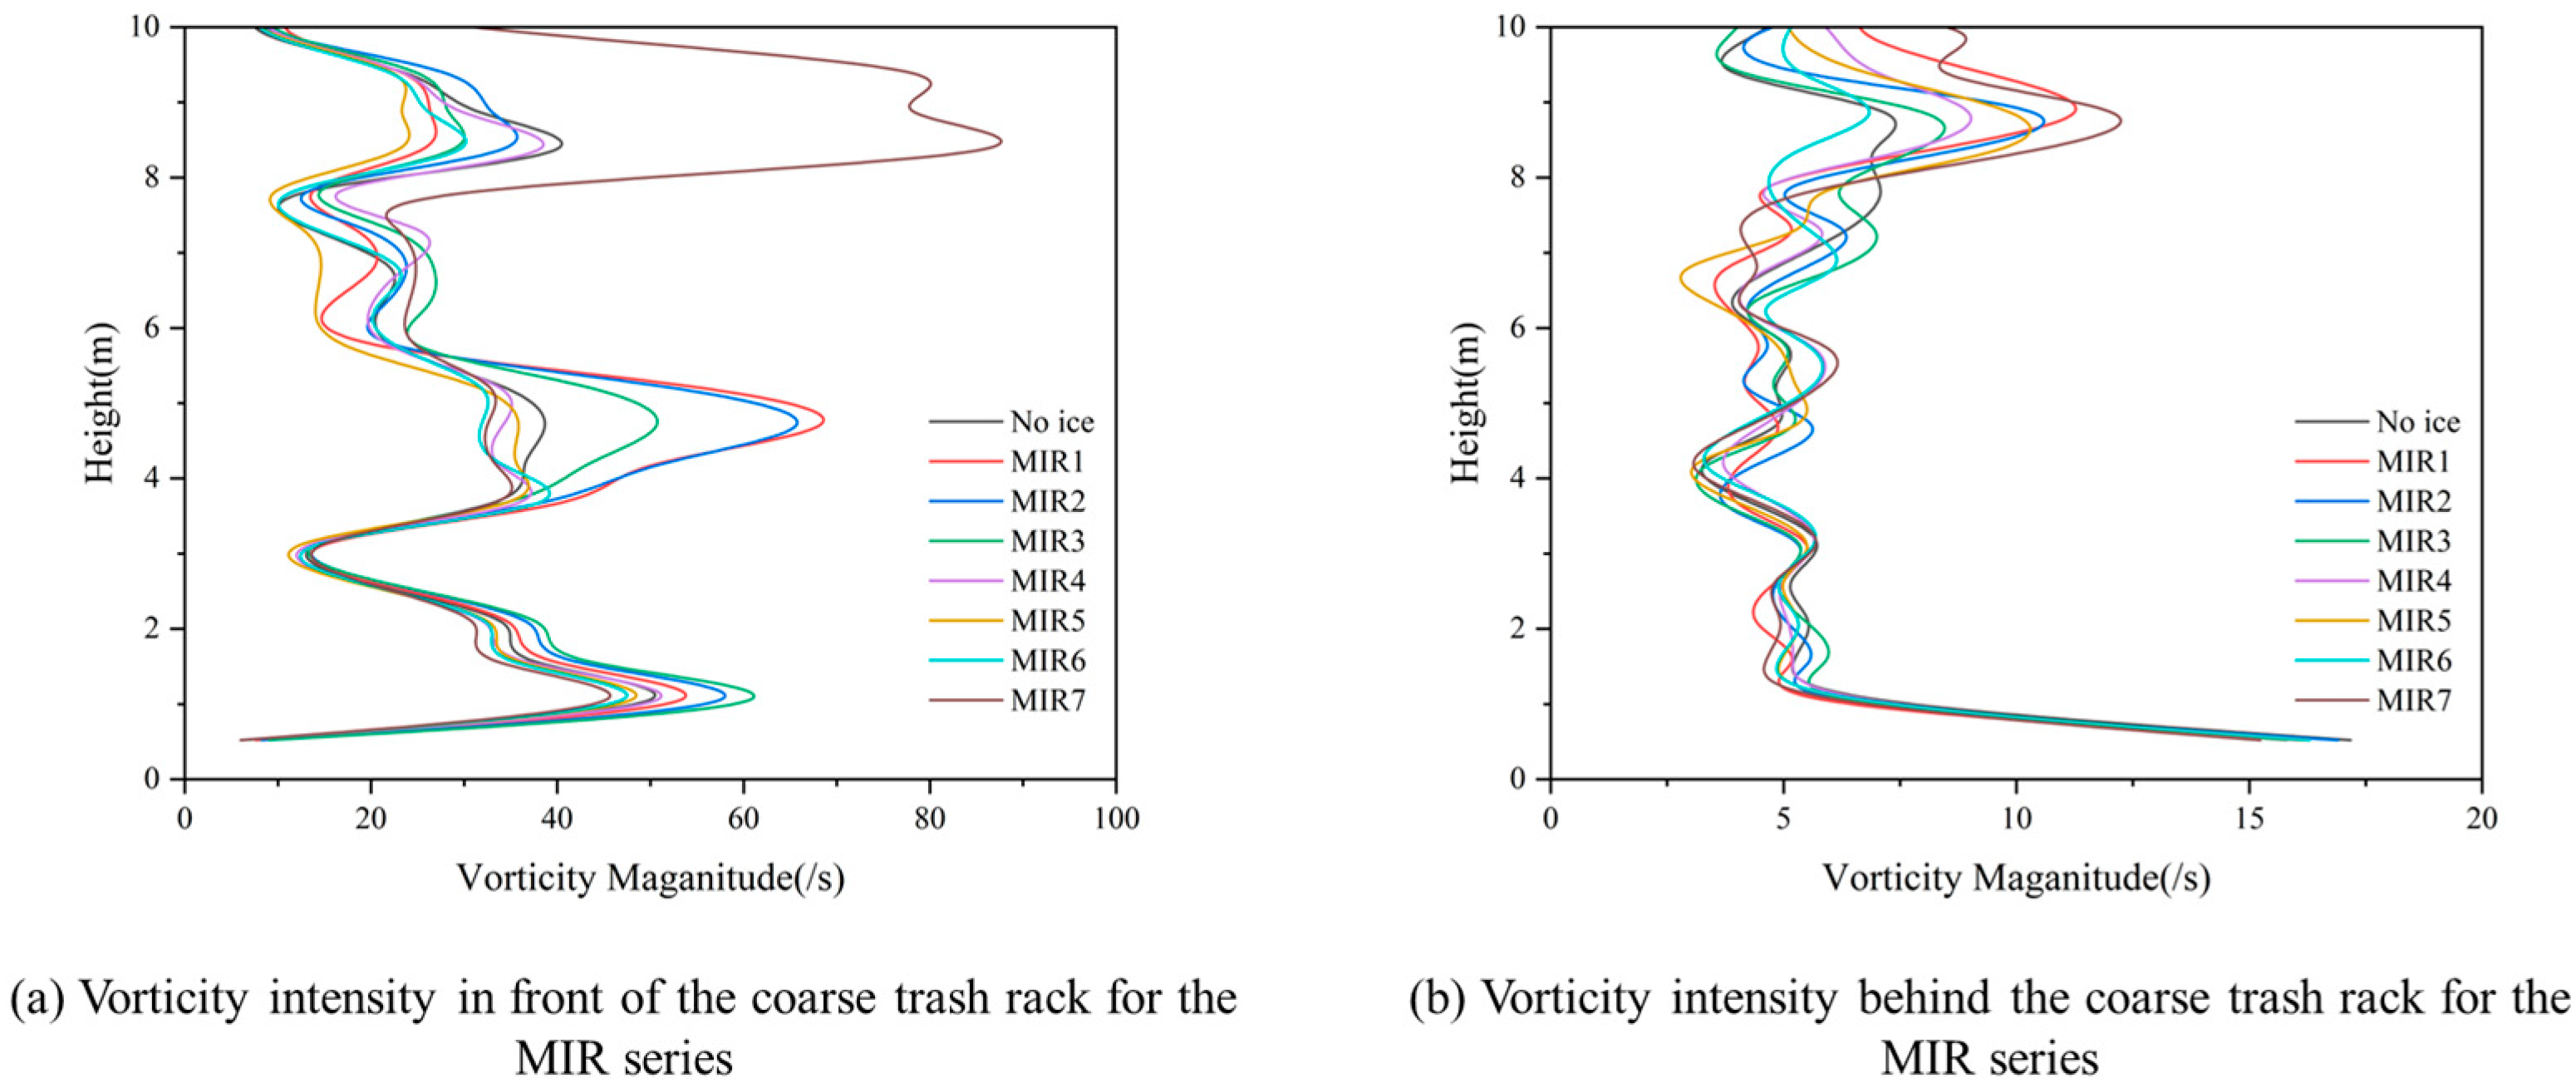
The release height of floating ice at the pump house inlet significantly affects the distribution of vorticity intensity. Lower release heights (MIR1–MIR3) induce stronger and more concentrated vorticity disturbances in front of the coarse trash rack, while higher release heights (MIR4–MIR7) result in weaker and more widely distributed effects. Although the coarse trash rack substantially attenuates the overall vorticity intensity, it does not alter the controlling influence of release height on disturbance distribution. Lower release heights continue to dominate flow field disturbances, as illustrated in
Figure 25.
In front of the coarse trash rack, the vorticity intensities corresponding to lower release heights (MIR1, MIR2, and MIR3) are, respectively, 69.46 s−1, 75.34 s−1, and 79.68 s−1 in the middle and lower water layers, which are significantly higher than those of higher release heights MIR4 to MIR7, with the magnitudes ranging from 66.91 s−1 to 59.29 s−1 in the same layers. This indicates that lower release heights induce stronger local vorticity disturbances. A similar trend is observed at the height of 2.088 m, where lower release heights maintain vorticity intensities around 39 s−1, while higher release heights decrease to approximately 35 s−1, further confirming that lower releases produce more significant vorticity disturbances. At a lower monitoring point of 0.522 m, vorticity intensities for lower releases range between 7.6 s−1 and 9.1 s−1, whereas higher releases remain around 6.0 s−1.Behind the coarse trash rack, the overall vorticity intensity is significantly reduced, yet the influence of release height remains consistent. At the 1.044 m depth, vorticity intensity for lower release heights decreases to between 3.44 s−1 and 4.25 s−1, while higher release heights maintain a value of 45.12 s−1, indicating that disturbances under higher releases are relatively stable and slightly exceed some lower release conditions. At the mid-low layer height of 3.132 m, the average vorticity intensity is approximately 6.0 s−1, with diminished variability among different release heights. Higher releases generally result in lower and less fluctuating vorticity intensity, highlighting their broader but weaker disturbance influence.
In summary, the release height influences the vorticity intensity distribution substantially. Lower release heights can cause stronger and more concentrated vorticity disturbances, whereas higher release heights lead to weaker and more dispersed effects. Although the coarse trash rack reduces overall vorticity intensity, it does not change the trends governed by the release height. In particular, lower release heights contribute most significantly to flow field disturbances, underscoring their importance in subsequent studies on flow stability and the development of targeted control strategies.
6.5. Discussion
While the selected DEM parameters (
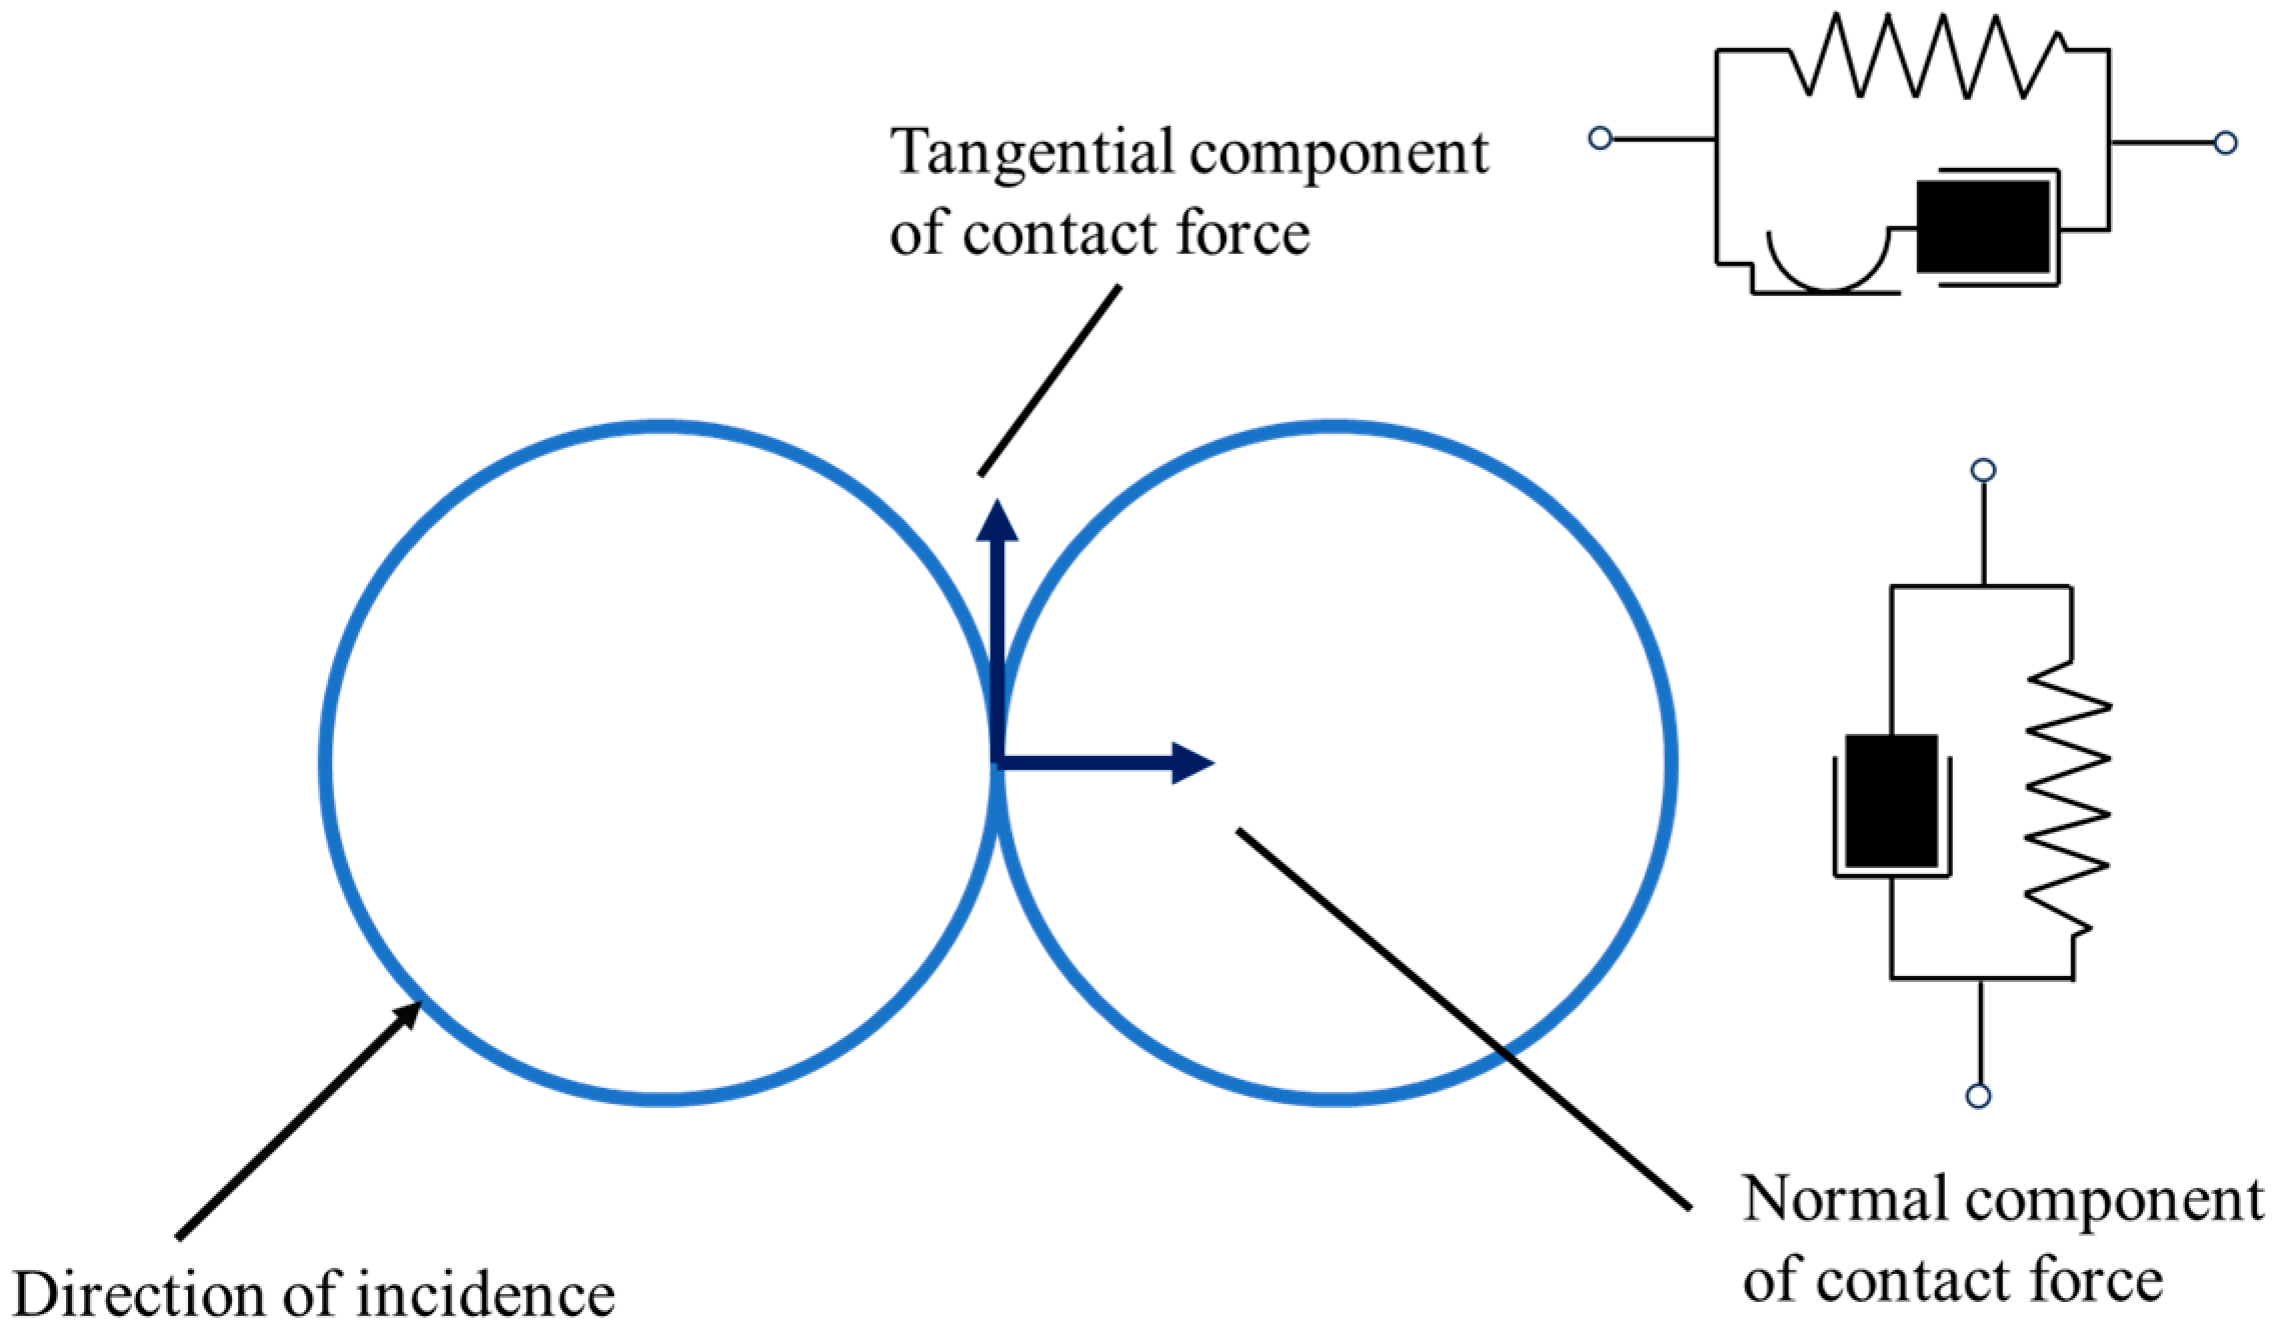
Table 2) were chosen based on established literature for granular ice [
35,
36,
37], their values, particularly the coefficient of restitution and ice-ice friction, are subject to uncertainty due to factors like ice temperature and micro-scale roughness. A qualitative analysis of their potential influence is therefore warranted.
A lower coefficient of restitution (more inelastic collisions) would increase energy dissipation, potentially leading to slightly denser and thicker accumulations, as particles would be less likely to rebound from the trash rack or the accumulation front. Conversely, a higher value would promote particle dispersion. A higher static friction coefficient would increase the shear strength of the ice accumulation, potentially stabilizing steeper slopes and altering the local morphology of the jam. However, the global accumulation patterns and the primary conclusions regarding the dominant role of release location and height are governed by first-order flow physics and system geometry. Therefore, these key findings are expected to be robust to reasonable variations in these contact parameters.
Regarding the drag coefficient, the Haider-Levenspiel model is well-suited for spherical particles. For non-spherical ice pieces, the drag force could vary, which might modestly affect particle trajectories and the precise value of critical release heights identified in this study. Nevertheless, the fundamental physical mechanism—the existence of a threshold governed by the competition between buoyancy and hydrodynamic forces—would remain valid.
In summary, while parametric uncertainties can modulate quantitative specifics (e.g., exact local thickness values), they do not invalidate the primary qualitative trends and comparative conclusions drawn from this work, which are the main focus of this study.
7. Conclusions
In this study, a coupled CFD–DEM numerical model was employed to systematically investigate the accumulation evolution of floating ice and its influence on the flow field structure and stability within a pump house under various release heights and positions. The main conclusions are as follows:
(1) The release height and position are key factors governing the accumulation morphology and spatial distribution of floating ice. Under inlet release conditions, lower release heights (e.g., MIR1) readily induce the formation of a wedge-shaped dense accumulation in front of the coarse trash rack. The accumulation thickness increases by 57.69% compared to higher release heights (MIR7), and the accumulation location shifts toward the inlet by 38.16%. Higher release heights enhance the ice dispersion, extending the disturbance range to the central part of the pump house and increasing overall flow field heterogeneity. Under bottom release conditions, the release height significantly influences the ice transport and deposition. Under the ICR2 condition, the maximum accumulation thickness emerges, the magnitude of which is 21.74% greater than the minimum value, with a positional shift of 17.42%.
(2) The release height plays a decisive role in local vortex structure and disturbance intensity. Lower release heights significantly enhance the localized shear and vorticity, with a peak vorticity intensity of 79.68 s−1, which is approximately 300% higher than that under higher release heights. This can be attributed to the dense accumulation along the bottom wall and the secondary flow lifting effects. In contrast, higher release heights promote the vertical momentum redistribution and quasi-laminar flow transformation, significantly reducing disturbance intensity.
(3) The release location directly determines the spatial distribution and attenuation behavior of disturbance intensity. The internal release produces widespread and slowly attenuating disturbances. Under the ICR4 condition, the peak standard deviation of flow velocity reaches 1.0 at monitoring points M3–M7, which means a 98.3% increase compared to the ice-free condition, and its disturbance coverage is 1.8 times that of inlet release. The inlet release exhibits a typical bimodal response with strong near-field and weak far-field effects. For instance, under the MIR1 condition, the disturbance intensity at M2 reaches 1.0 but rapidly to 0.103–0.193 at M4–M7, with an attenuation rate of 89.7%. However, the near-field disturbance intensity of inlet release is 31.6% higher than that of the internal release.
(4) The coarse trash rack plays a dual role as both a “disturbance generator” and an “attenuator” in the interaction between the floating ice and the flow field. Its upstream region, due to ice jam effects, triggers high-velocity bands and multi-vortex structures, while the downstream flow field experiences significantly reduced disturbances under the homogenizing influence of the rack, with the vorticity attenuation exceeding 98%.
The CFD–DEM framework used is mature; however, this work provides new mechanistic understanding and establishes relevant conclusions that lay a foundation for future investigations into ice–flow–structure interactions within confined hydraulic environments. And the observed redistribution of vorticity and the alteration of velocity fluctuations induced by ice accumulation suggest a significant shift in the flow’s energy distribution, likely involving a transfer between turbulent kinetic energy and the energy of coherent structures. A formal quantification of this energy budget represents a valuable and recommended direction for future, more detailed investigations.
And this study does not include detailed analyses or recommendations on trash-rack geometry design or operational strategies under varying wind and wave conditions, but these aspects will be investigated in future work.
The findings can provide theoretical and data-driven insights into the interplay between ice release parameters, accumulation patterns, and flow field response, supporting an enhanced design and operation of cold-region pump houses against ice-related challenges.
