Article

Numerical Investigation of Hydrodynamic Characteristics of Circular Cylinder with Surface Roughness at Subcritical Reynolds Number

1
Central Southern China Electric Power Design Institute Co., Ltd. of China Power Engineering Consulting Group, Wuhan 430071, China
2
State Key Laboratory of Coastal and Offshore Engineering, Dalian University of Technology, Dalian 116024, China
*
Author to whom correspondence should be addressed.
J. Mar. Sci. Eng. 2025, 13(11), 2075; https://doi.org/10.3390/jmse13112075
Submission received: 2 October 2025 / Revised: 26 October 2025 / Accepted: 30 October 2025 / Published: 31 October 2025
(This article belongs to the Special Issue New Era in Offshore Wind Energy)

Abstract

This study investigates the hydrodynamic behavior of rough cylinders, focusing on how surface roughness influences vortex shedding patterns and forces in cross-flow. To achieve this objective, a three-dimensional large-eddy simulation was conducted to study the hydrodynamic coefficients and flow fields of cylinders with different relative roughness, height, and coverage ratios at a Reynolds number of 3900. The results show that the coverage ratio plays a more significant role in determining hydrodynamic characteristics than relative roughness, with a critical coverage ratio identified at approximately 0.4. Below this threshold, both drag and lift coefficients exhibit a marked increase with higher relative roughness. However, beyond a 0.4 coverage ratio, the impact of roughness diminishes, with the coefficients approaching those of a smooth cylinder. Additionally, the Strouhal number decreases with increasing roughness height and increases with coverage ratio. Flow visualization shows that these changes are closely related to the position and magnitude of the wake vortex shedding in the wake region of a rough cylinder. These findings provide new insights into the fundamental mechanisms of the hydrodynamic characteristics and vortex shedding of rough cylinders and offer valuable guidance for optimizing engineering design and enhancing performance in practical applications.

1. Introduction

In marine engineering applications, cylindrical structures such as pipelines and cables are widely used in fields like energy transportation and submarine communication networks. The structural stability of these structures plays a critical role in ensuring the reliability and safety of engineering projects. Over the past century, the flow past a circular cylinder, as one of the benchmark cases of flow around a blunt body, has been extensively studied by numerous scholars due to its complex flow phenomena and the wide application of cylindrical structures in engineering [1,2]. For incompressible flows, the flow characteristics of this problem are mainly governed by the Reynolds number Re (Re = UD/ν, U is the characteristic velocity, D is the characteristic length, and ν is the kinematic viscosity coefficient of fluid). According to the parameters corresponding to the wake flow structure of the cylinder, it can be roughly divided into several stages, such as wake transition, shear layer transition, and boundary layer transition. When the Reynolds number is small, the viscous force of the fluid plays a dominant role, and the wake of the cylinder is a laminar flow state; as the Reynolds number increases, the dominant role of viscous forces gradually weakens, and the wake begins to become unstable, forming periodic shedding vortices behind the cylinder, known as the “Karman vortex street”. As the Reynolds number continues to increase, the transition point gradually moves upstream of the cylinder, causing the originally stable laminar shear layer to undergo turbulent transformation until the Reynolds number is large enough, whereupon the laminar boundary layer transitions to a turbulent boundary layer, leading to a “drag crisis” phenomenon of a sudden drop in drag force [2,3,4,5,6].
Although previous research on the flow around a smooth cylinder provides rich theoretical references for understanding the flow around a blunt body, in practical engineering, ideal smooth cylindrical structures are almost non-existent, and the surface of cylindrical structures inevitably suffers from roughness effects caused by the attachment of mussels and corals [7,8]. This leads to substantial difference in flow behavior compared to a smooth cylinder, rendering the existing theories for smooth cylinders no longer applicable. Therefore, it is essential to account for the impact of surface roughness changes on cylindrical structures and their resulting hydrodynamic performance under these conditions.
Previous studies have quantified the surface roughness of cylindrical structures mainly through the parameter of relative roughness K/D, where K is the average height of surface roughness and D is the diameter of the cylinder. The relevant physical experiments mainly simulate the changes in surface roughness by applying different specifications of sandpaper, iron wire, etc., to the surface of a smooth cylinder and placing the wrapped cylinder in a water tank or wind tunnel under certain inflow conditions to observe the changes in wake structure and hydrodynamic coefficients [9,10,11,12].
Among these, Fage and Warsap [13] conducted a groundbreaking experiment that simulated the roughness of a cylinder surface by wrapping it in five grades of sandpaper. The study showed that when the cylindrical surface became rough, the development of the boundary layer was hindered, and the shear layer separation point moved upstream, resulting in an increase in the drag coefficient. Güven et al. [14] also used five different particle sizes of sandpaper to construct rough surfaces within the Reynolds number range of 7 × 10⁴ to 5.5 × 10⁵ and systematically measured the time-averaged pressure distribution and the evolution of the boundary layer. It was found that at high Reynolds numbers, surface roughness significantly affects the pressure distribution characteristics of cylindrical surfaces. Sarpkaya [15] compared the hydrodynamic coefficients of smooth and rough cylinders, with a length to diameter ratio L/D of two, under oscillatory flow. The results showed that the drag coefficient of the rough cylinder was significantly increased compared to the smooth cylinder, while the inertia coefficient was significantly reduced. It was also pointed out that this was related to the enhanced flow separation and weakened fluid inertia effect caused by surface roughness. Similarly, Achenbach [16] tested cylinders wrapped in sandpaper with three equivalent degrees of sand roughness, K/D = 0.11%, 0.45%, and 0.9%, at high Reynolds numbers in a high-pressure wind tunnel. They monitored and obtained the friction and pressure distribution on the cylinder’s surface at five Reynolds numbers, as well as the variation in the circumferential angle of the boundary layer transition with Reynolds number Re. Adachi et al. [17] used PIV flow visualization technology to simultaneously measure the pressure distribution and velocity profile on the surface of cylinder in order to examine the effect of relative roughness on flow transition. They also discussed the classification of the influence of relative roughness on these flow phenomena, dividing them into four regions based on the Reynolds number. In addition, Wolfram and Naghipour [18] analyzed the wave forces acting on rough cylinders through wave flow simulation experiments and evaluated the inversion methods for different Morrison coefficients. Huang et al. [19] studied the hydrodynamic load response of smooth, rough, and slotted cylinders in a towing tank. Their research results showed that spiral grooves can reduce resistance by 10–20%, depending on the surface roughness and Reynolds number.
The above studies have primarily focused on cases with relatively small levels of roughness. However, in practical engineering applications, pipes and cables with small diameters are often characterized by high relative roughness. Consequently, researchers have increasingly focused on the hydrodynamic characteristics of large, rough, and special cylindrical structures in recent years. Sun et al. [20] conducted physical experiments using 3D printed physical models and found that as the coverage increased, the length of vortex formation gradually increased, the Strouhal number gradually decreased, and the turbulence energy and Reynolds stress also increased. A purely Lagrangian vortex method is employed by Moraes et al. [21] to investigate turbulent flows past a rough circular cylinder under a moving-wall effect at large-gap regime. The primary objective of this work is to discuss the accuracy of the numerical method employed and to investigate the effects of variations in relative roughness on the flow around the cylinder. In addition, Suzuki et al. [22] carried out physical experiments in a water tank to investigate the effects of surface roughness on the flow structure around a cylinder. In contrast to previous studies, the cylinder in that experiment was rotating rather than stationary, and the surface roughness was simulated by attaching sandpaper to the cylinder’s surface. The results showed that, in a quiescent fluid, surface roughness significantly alters the velocity gradients and Reynolds stresses around the cylinder. Similarly, Wang et al. [23] conducted a numerical simulation to investigate the effects of relative roughness and Reynolds number on the aerodynamic characteristics of a finite-length cylinder within the Reynolds number range of 3.9 × 10³ to 4.8 × 10⁵. The results indicate that both factors influence the aerodynamic characteristics of the cylinder by altering the flow patterns around it. The impact of surface roughness on the aerodynamic coefficients of the finite-length cylinder is primarily attributed to changes in the pressure behind the cylinder.
While significant progress has been made in studying the flow past a rough cylinder, there remain certain limitations in the current research. Most studies only consider the influence of the relative roughness height K/D, and there is limited research on the roughness coverage rate CR (the ratio of roughness to cylinder surface area) and the combined effect of these parameters on the hydrodynamic characteristics of the cylinder. In addition, while a substantial body of research has focused on physical mechanisms in fluid flow, there remains a lack of in-depth understanding of their behavior under high-Reynolds-number conditions. These mechanisms play a critical role in complex flow environments, particularly in cases involving high-roughness elements. Therefore, the main objective of this study is to systematically investigate the effects of coverage ratio and relative roughness on the hydrodynamic and vortex shedding of cylinders. By doing so, this study aims to reveal their significant influence on fluid behavior, provide new insights into understanding complex flow phenomena, and contribute to advancing knowledge in this field.
The remainder of this paper is organized as follows: Section 2 presents the details of the control equations and numerical models. Section 3 gives the numerical results and the analysis, with a focus on the hydrodynamic characteristics and flow behavior of rough cylinders. Finally, Section 4 concludes the paper with summary of the key findings, limitations, and suggestions for future research.

2. Control Equations and Numerical Model

This article mainly relies on the Large Eddy Simulation (LES) method provided by STAR-CCM+ (18.04.008) for numerical simulation calculation, and the sub-grid model adopts the Smagorinsky model. Large eddy simulation (LES) serves as an intermediate approach, offering higher accuracy compared to the Reynolds-averaged Navier–Stokes (RANS) method while being more cost-effective than direct numerical simulation (DNS). In addition, it is noted that the numerical simulation for this study was conducted on a Dell PowerEdge R750 server equipped with an Intel(R) Xeon(R) Platinum 8380 CPU operating at 2.30 GHz, featuring 40 cores. The manufacturer of the Dell PowerEdge R750 is Dell Inc., headquartered in Round Rock, TX, USA. To ensure efficient and accurate computation, all cases were computed using multi-threaded parallel processing, with each case requiring approximately fifty- five hours of computational time.

2.1. Control Equations

The large eddy simulation method filters the solved physical quantities using a filtering function, dividing them into large-scale and small-scale quantities. The large-scale quantities are solved through solving equations, while the small-scale ones are handled through modeling. Within the framework of large eddy simulation, the continuity equation and the momentum equation are represented as Equations (1) and (2), respectively:
u ¯ i x i = 0
u ¯ i t + u ¯ i u ¯ j x j + u i u j ¯ u ¯ i u ¯ j x i = 1 ρ p ¯ x i + 1 ρ x j τ ¯ i j + τ i j , S G S
In the above Equations (1) and (2), “-” indicates the variable after filtering by grid filter, with a filtering width of Δ, where Δ = V1/3, and V denotes the volume of the grid cell. In addition, (x1, x2, x3) = (x, y, z) are the Cartesian coordinate components, ui is the velocity component corresponding to the xi direction, t is time, ρ is the fluid density, and p is the pressure. In Equation (2),
τ ¯ i j = 2 μ S ¯ i j = μ u ¯ i x j u ¯ j x j
τ i j , S G S = ρ u i u j ¯ u ¯ i u ¯ j
To make the equations closed, Smagorinsky introduced the Boussinesq hypothesis into a large-eddy simulation and proposed a relationship between sub-grid stress and sub-grid eddy viscosity as follows:
τ i j , S G S 1 3 τ k k , S G S δ i j = 2 μ S G S S ¯ i j
where τ i j , S G S is the sub-grid eddy viscosity stress, and μ S G S is the sub-grid eddy viscosity coefficient. To solve the sub-grid eddy viscosity, it is necessary to establish a turbulence model. The Smagorinsky model is employed, i.e., μ S G S = ρ ( C S ) 2 S ¯ , C S is the Smagorinsky constant, which is taken as 0.1 in this paper, δ i j is the Kronecker function, S ¯ i j is the strain rate tensor, S i j ¯ = 1 2 u - i x j + u - j x i , and the theory related to large eddy simulation can be found in references [24,25,26,27]. In addition, the SIMPLEC algorithm in the separated flow algorithm is used for calculation.
In order to facilitate subsequent expressions, some flow quantities are provided here. CD and CL are the drag coefficient and lift coefficient of the cylinder, respectively. Cp is the pressure coefficient, defined as follows:
C D = F D ρ U 2 A / 2 , C L = F L ρ U 2 A / 2
C P = P P ( ρ U 2 ) / 2
where F D and F L represent the drag force in the streamwise direction and lift force in the transverse direction per unit length of the cylinder, U is the characteristic velocity, A is the projected area of the cylinder cross-section, P is the local static pressure of the cylinder, and P is the static pressure of the natural inflow.
The dimensionless vortex shedding frequency St is defined as follows:
S t = f v D U
where f v is the vortex shedding frequency of the wake on the back flow side of the cylinder, and D is the inner diameter of the rough cylinder, which is the diameter of the smooth cylinder.
The mean and standard deviation of the drag coefficient and lift coefficient are defined as follows:
C ¯ D = i = 1 N C D i N , C ¯ L = i = 1 N C L i N
C ¯ D , r m s = i = 1 N C D i C ¯ D 2 N , C ¯ L , r m s = i = 1 N C L i C ¯ L 2 N
In the above equation, N is the number of samples. It is worth noting that the statistical periods for all the physical quantities presented begin after the flow field has stabilized, covering at least 60 vortex shedding cycles.

2.2. Computational Domain and Definite Solution Conditions

Referring to the research of previous scholars on numerical simulations of smooth cylinders at Re = 3900 [28], the computational domain shown in Figure 1 is selected, with the size defined as Ω = [−5D, 15D] × [−5D, 5D] × [−πD/2, πD/2], and the origin of the Cartesian coordinate system is located at the center of the cylinder’s z = 0 section. Previous studies have shown that when the spanwise length is greater than twice the diameter of the cylinder, the three-dimensional effect of the flow field around the cylinder can be well demonstrated, and the numerical calculation results have good consistency with experimental data [29,30].
For the cylinder, a stationary no-slip wall boundary condition is adopted (u = v = w = 0, ∂p/∂n = 0). The inlet is set as a specified velocity inlet (u = U, v = 0, w = 0, ∂p/∂n = 0). The outlet is a free outflow boundary (∂ui/∂n = 0, p = 0). Both the upper–lower and front–rear boundaries are symmetry boundaries (v = 0, ∂ui/∂n = 0, ∂p/∂n = 0; w = 0, ∂ui/∂n = 0,p/∂n = 0).
The front view of the computational domain’s mesh division is shown in Figure 2a. To accurately capture the flow structure of the flow field near the cylinder wall, local refinement is performed on the horizontal and vertical directions of the cylinder as well as the region within the range of 0.3D around the cylinder. The local mesh division around the cylinder is shown in Figure 2b.

2.3. Verification of Convergence and Accuracy of the Numerical Model

Convergence verification and accuracy verification are performed on the above numerical model. Grid convergence verification is conducted from the cylinder’s extension direction (z), circumferential direction (θ), and radial direction (r). The grid parameters and calculation results of different cases are shown in Table 1.
As can be seen from Table 1, the three different numbers of nodes in the cylinder’s extension direction (z) have almost no impact on the calculation results. To reduce the computational cost, 30 nodes are adopted in this direction. When the number of nodes in the cylinder’s circumferential direction (θ) and radial direction (r) is 240 and 70, respectively, the statistical variation in the hydrodynamic coefficients is no longer significant. Therefore, 240 and 70 nodes are selected, respectively. For the height of the first layer of mesh near the cylinder surface, the value of the dimensionless distance y+ is set to 1.
As shown in Table 2, three different time steps (0.01, 0.005, 0.002) are used to verify the convergence of the time step. It can be seen from Table 2 that when the time step is 0.002, the change in results is no longer significant, so the time step is set to 0.002.
To verify the accuracy of the numerical model in this paper, the results calculated by the numerical model in this paper are compared with the experimental and numerical results of flow around a cylinder at a Reynolds number of 3900 that were obtained by previous scholars. The comparison results are shown in Table 3.
From the data presented in Table 3, the time-averaged drag coefficient C ¯ D and Strouhal number (St) obtained in this study are 1.034 and 0.216, respectively. These results are in good agreement with previous experimental and numerical findings, thereby validating the accuracy and reliability of the current computational approach.
To verify the time-averaged flow field characteristics around the cylinder, three characteristic locations were selected at the xOy section (z = 0) as well as the centerline within the range of 10D at y/D = 0. The time-averaged velocity distribution in the streamwise direction on the centerline (y/D = 0) is illustrated in Figure 3b. Furthermore, Figure 4, Figure 5 and Figure 6 present the time-averaged velocity distribution in the streamwise and cross-flow directions at the three characteristic positions of x/D = 1.06, 1.54, and 2.02, respectively. These visualizations provide a comprehensive understanding of the flow behavior at different locations relative to the cylinder, thereby validating the accuracy of the computational model.
From the time-averaged velocity distribution in the x and y directions at the three characteristic locations, as shown in Figure 4, Figure 5 and Figure 6, it can be observed that the present findings align well with the experimental and numerical results reported by Parnaudeau et al. [34]. Therefore, the computational approach and numerical model employed in this study have been validated for reliability and accuracy, ensuring precise calculations.

3. Results and Discussion

3.1. Calculation Condition Settings

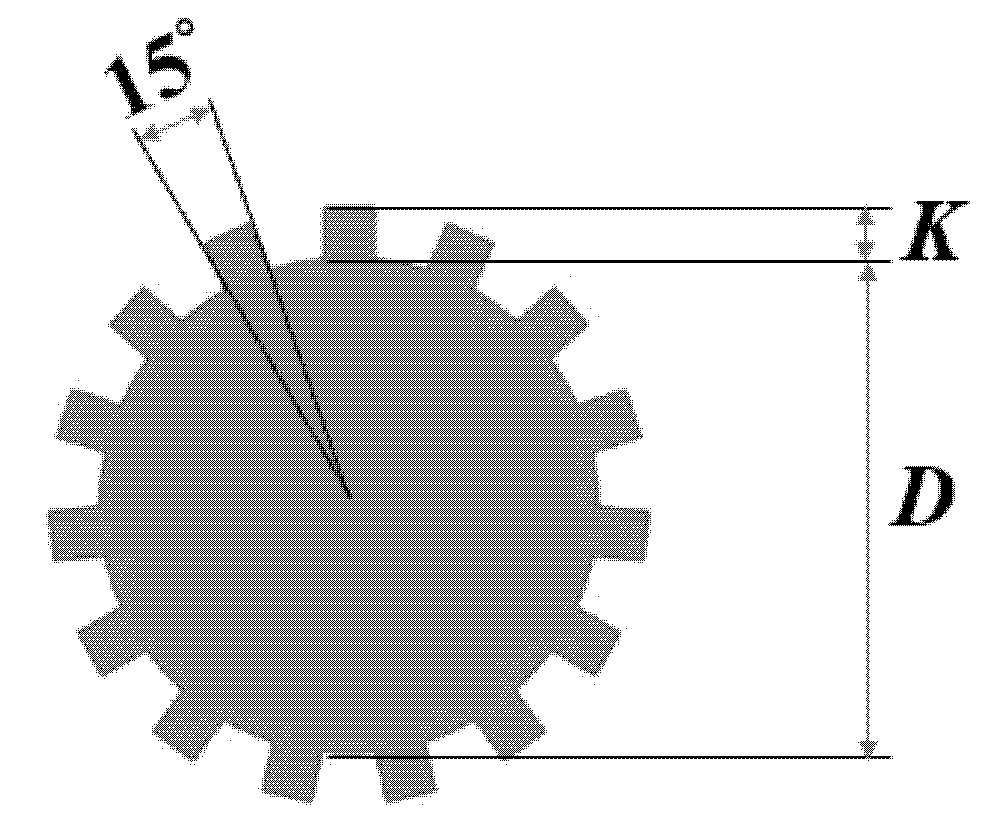
This article presents a comprehensive investigation of roughness effects by considering five different relative roughness ratios (K/D), and seven different roughness coverage ratios (CR). The relative roughness ratios are selected as 0.02, 0.05, 0.10, 0.15, and 0.20, covering a wide range of practical roughness conditions. The roughness coverage ratios are set to 0.167, 0.25, 0.333, 0.417, 0.50, 0.75, and 0.917. By combining these five K/D values with the seven CR values, a total of thirty-five distinct cases are systematically investigated. Each case represents a unique combination of relative roughness height and coverage ratio. For instance, consider the case of CR0.167_K/D0.02. In this scenario, the roughness coverage ratio is 0.167, meaning that approximately 16.7% of the cylinder’s surface is covered by roughness elements. Simultaneously, the relative roughness height is 0.02, indicating that the roughness height is 2% of the cylinder diameter. The sketch of the rough cylinder cross-section is illustrated in Figure 7.

3.2. Hydrodynamic Coefficients

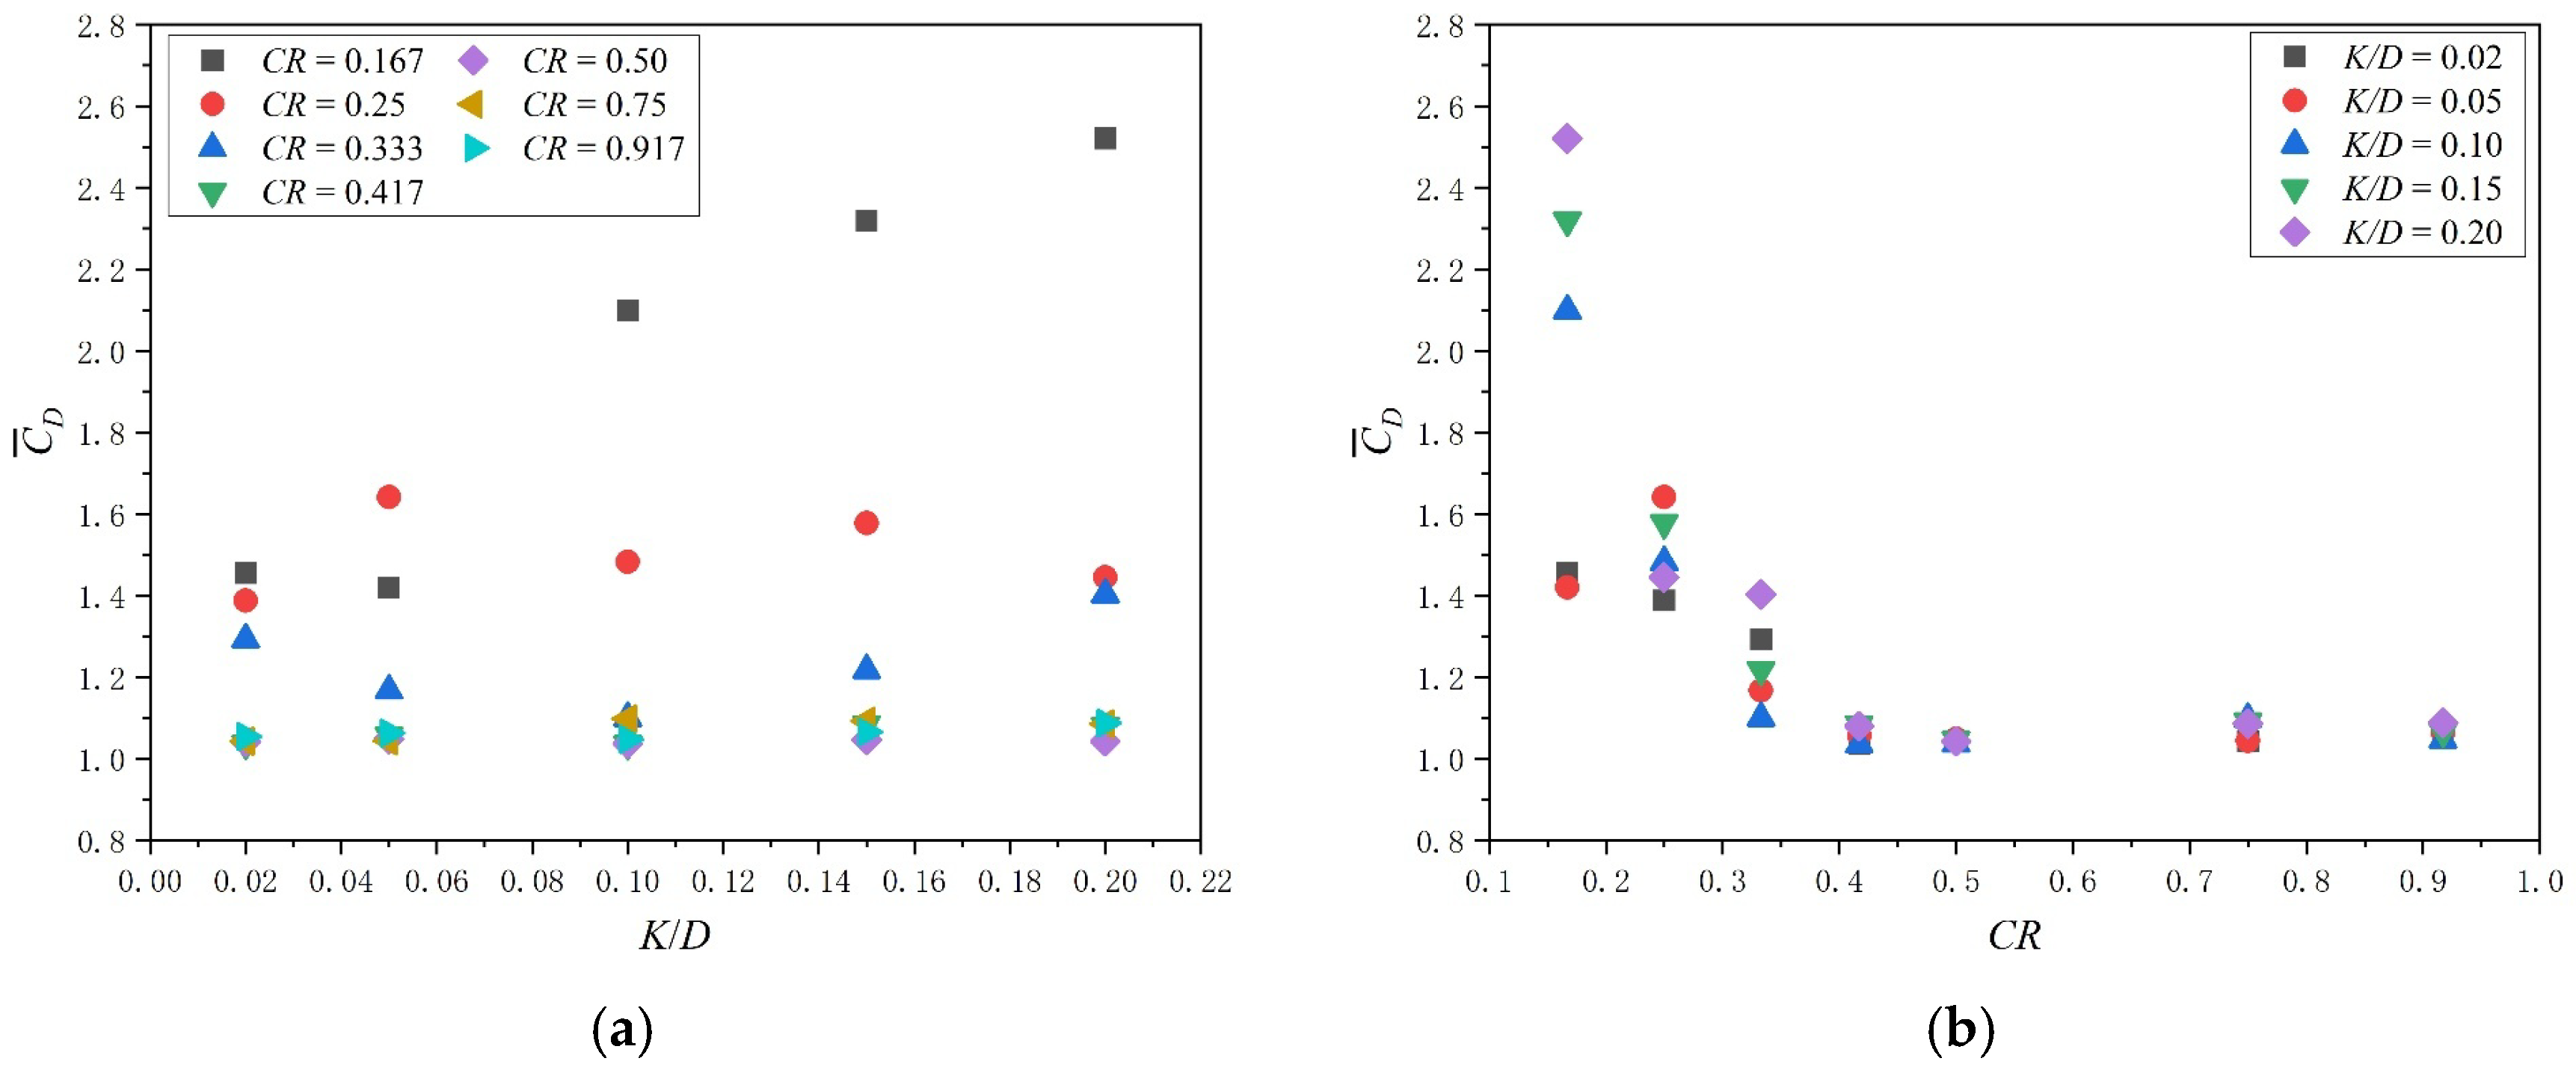
Figure 8 illustrates the dependence of the time-averaged drag coefficient ( C ¯ D ) on the relative roughness (K/D) and roughness coverage ratio (CR). The C ¯ D is calculated using Equation (9), with the projected area A defined as the cross-sectional projected area of the rough cylinder’s outer diameter. From Figure 8a, it can be seen that the value of C ¯ D exhibits a significant increase when the CR is within the range of 0.167 to 0.333 as compared to a smooth cylinder. A particularly significant observation is that at CR = 0.167 and K/D = 0.20, the value of C ¯ D reaches approximately 2.5 times that of a smooth cylinder. Conversely, when CR is between 0.417 and 0.917, C ¯ D exhibits a smaller growth trend and almost no significant change.
In addition, it can be clearly found that C ¯ D decreases as CR increases and gradually tends to stabilize from Figure 8b. There is a clear critical point where the value of CR is about 0.4. When CR is greater than 0.4, the value of C ¯ D no longer changes significantly as K/D increases. This indicates that, within the scope of this study, the influence of K/D on C ¯ D can be almost ignored at a CR greater than 0.4.
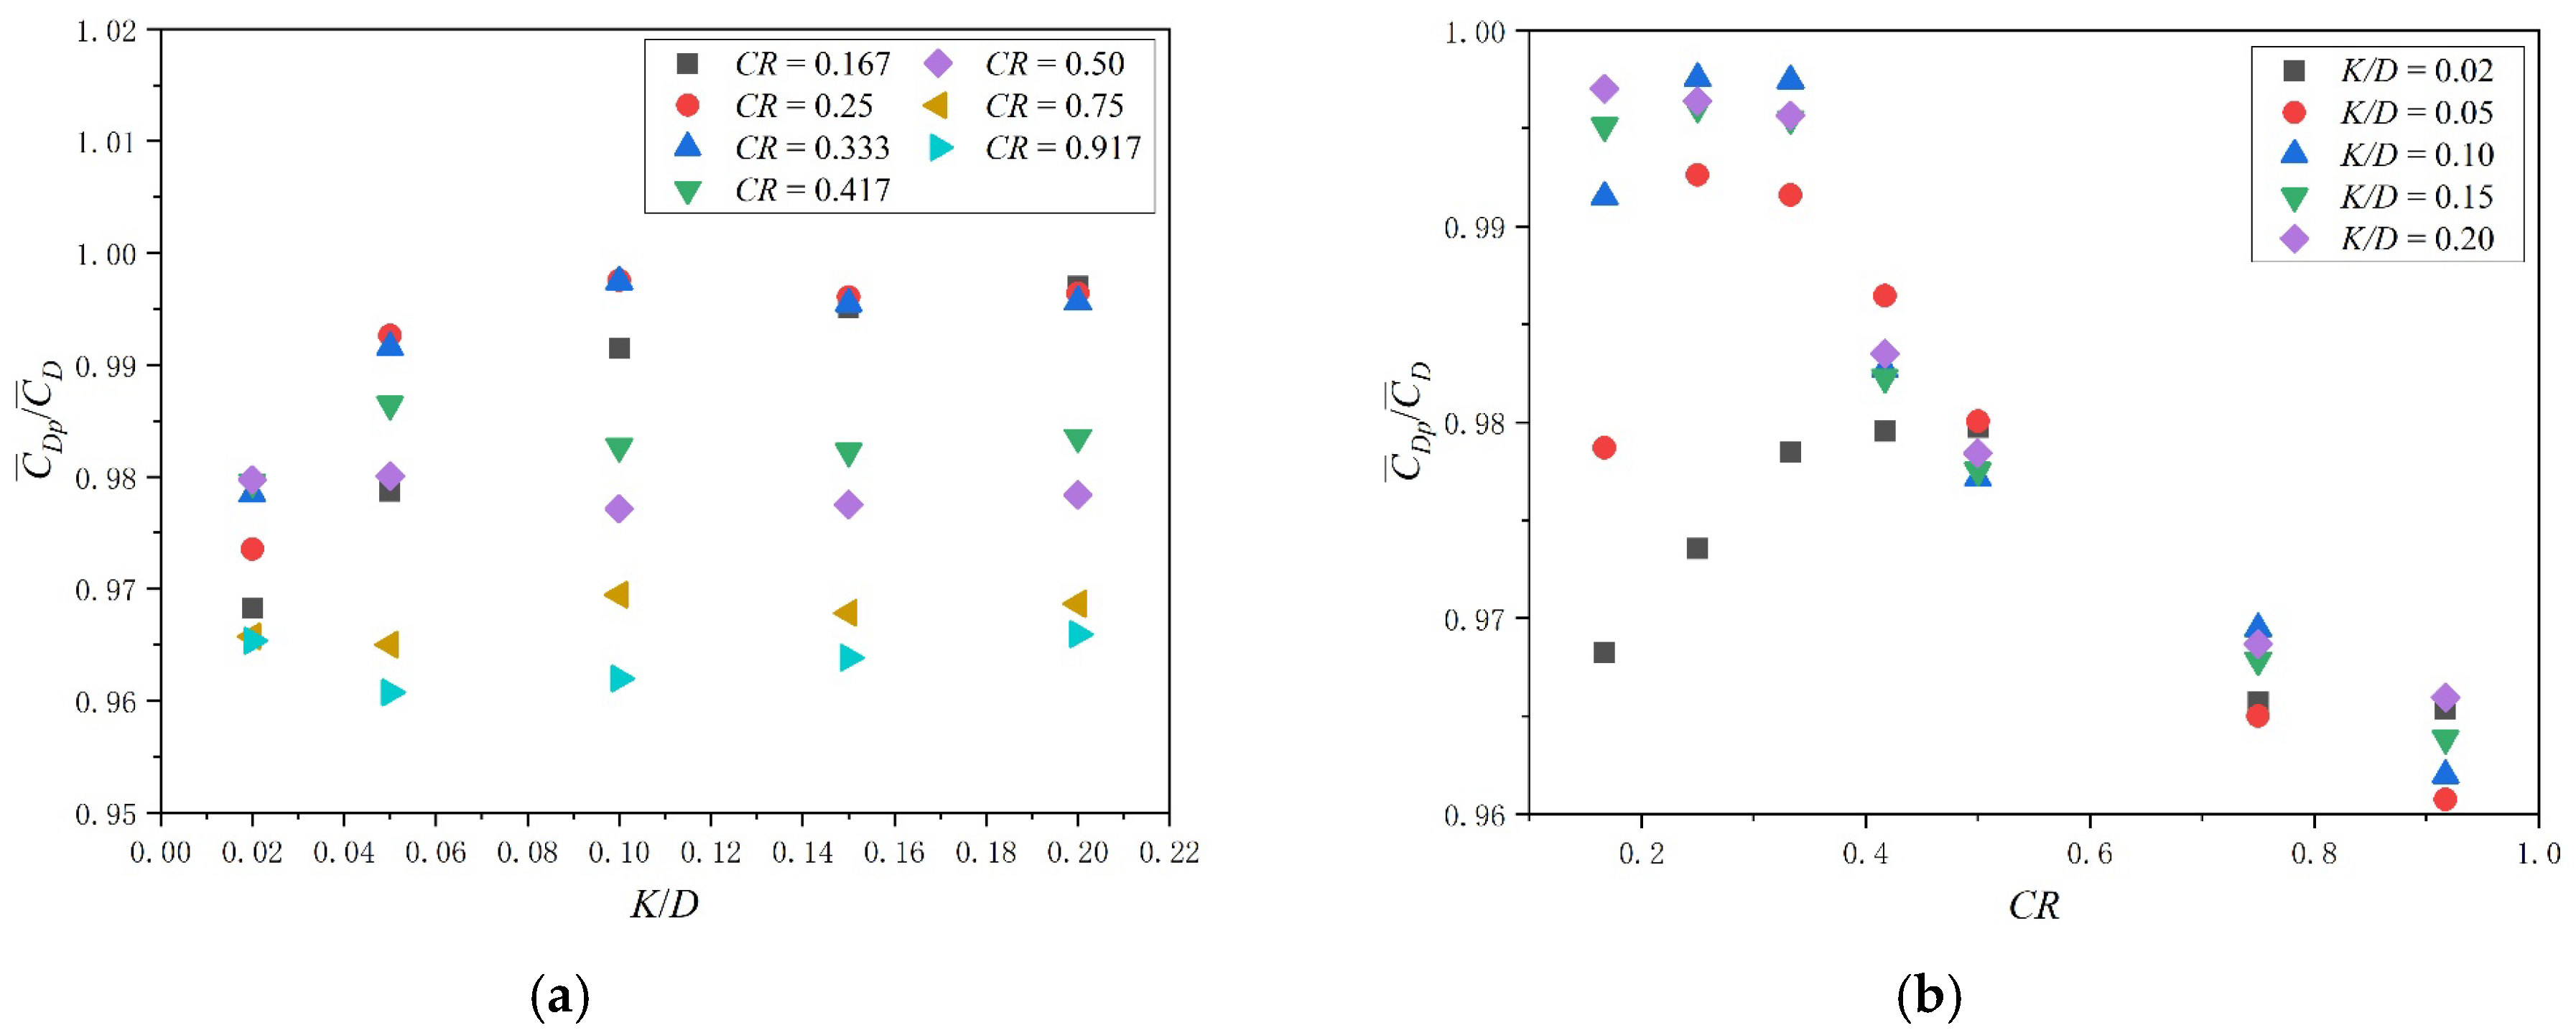
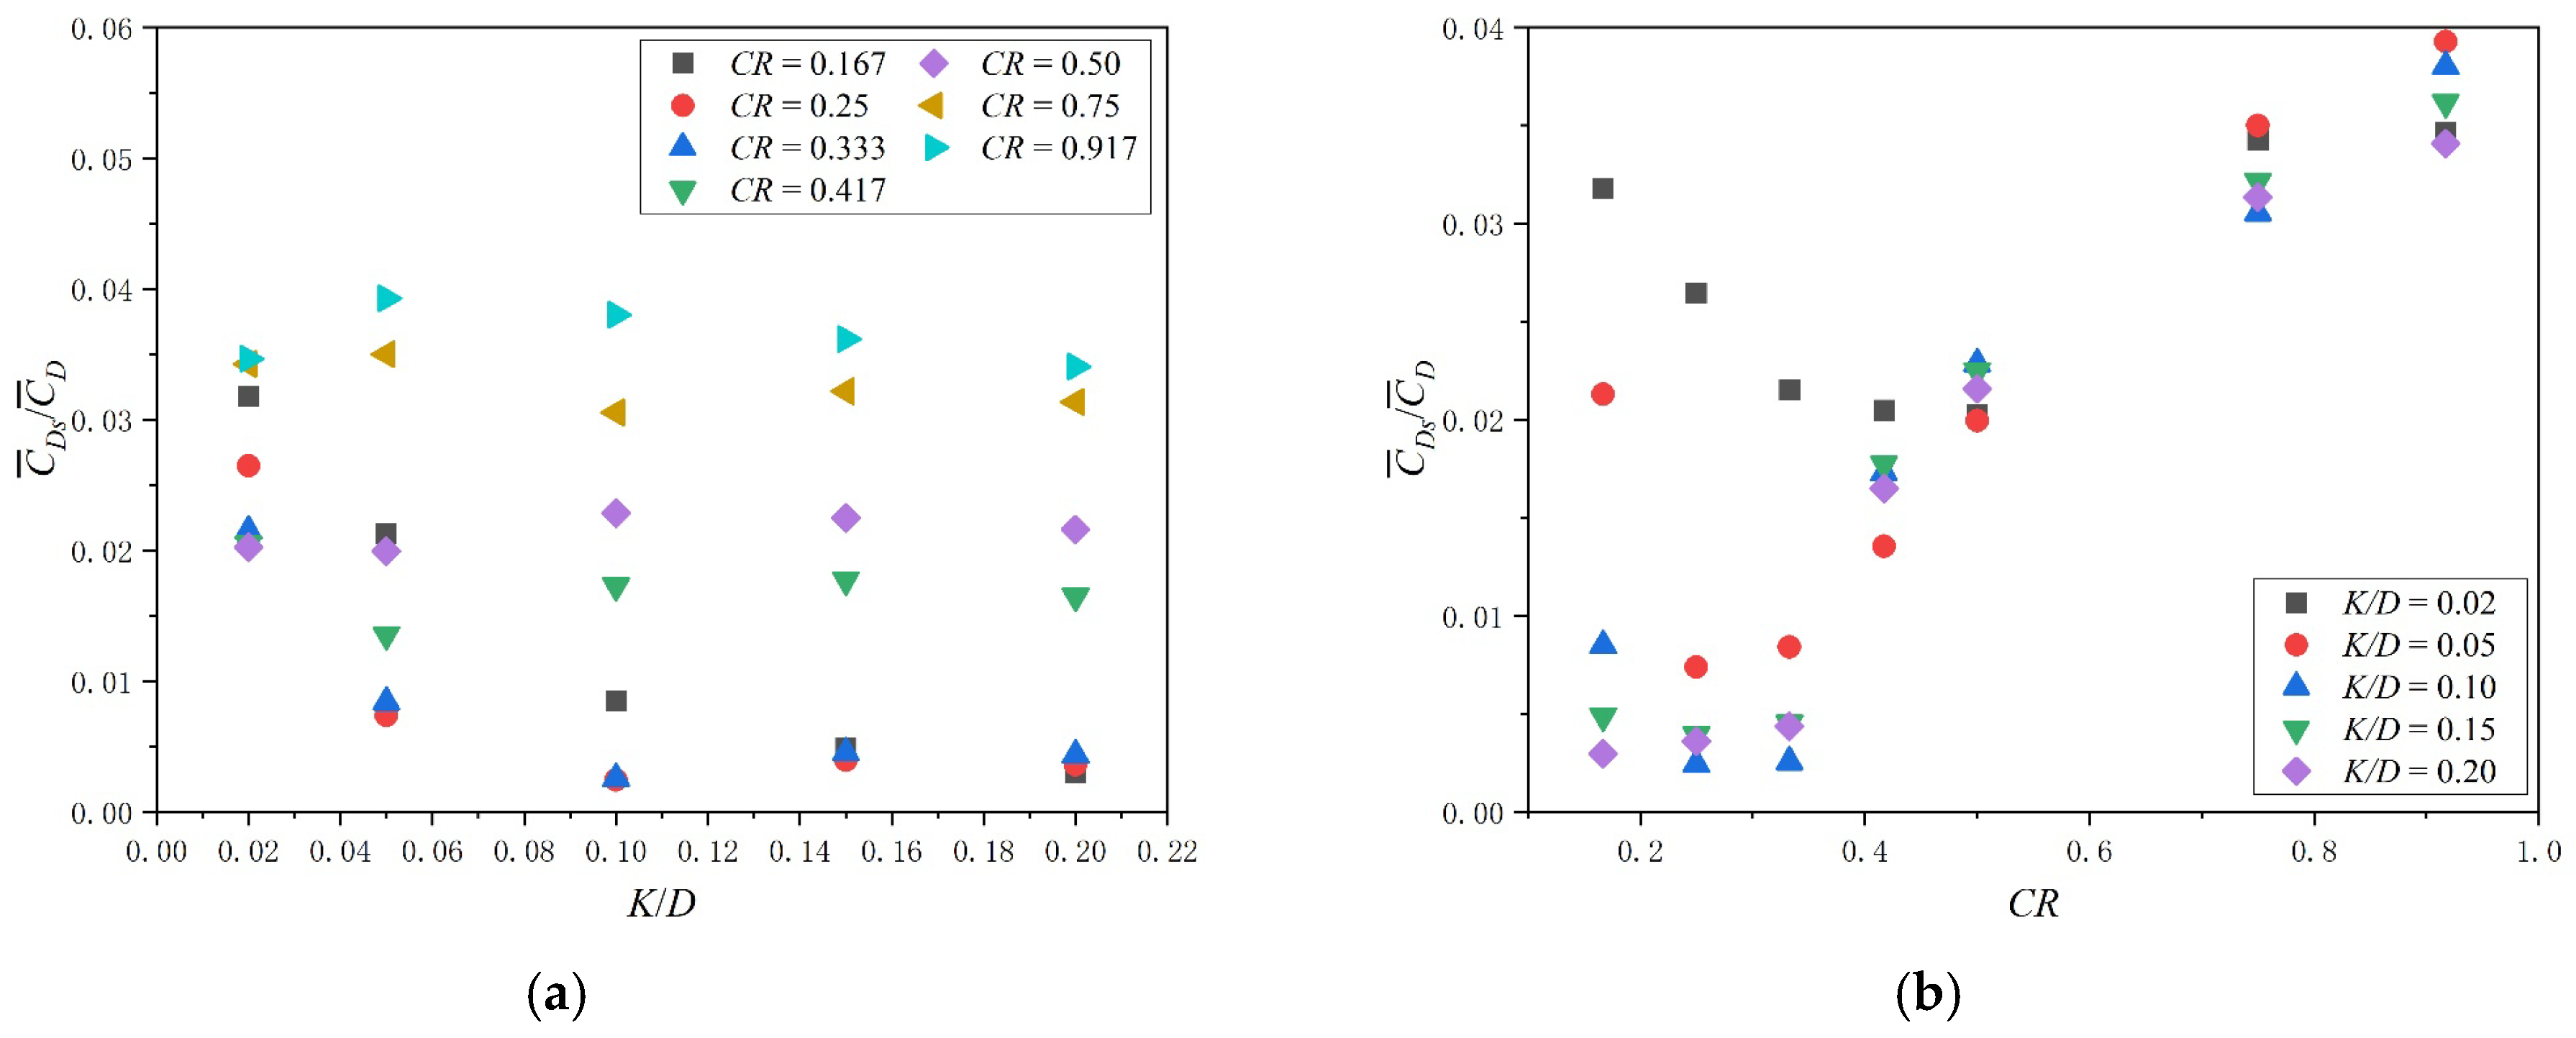
The drag force ( C ¯ D ) of a cylinder mainly originates from two components, one is the pressure-induced drag ( C ¯ D p ) resulting from the asymmetric pressure distribution upstream and downstream of the cylinder, and the other is the frictional drag force ( C ¯ D s ) on the surface of the cylinder. Previous research has demonstrated that for a smooth cylinder, the C ¯ D s accounts for a negligible portion of C ¯ D , typically less than 2%, while the C ¯ D p accounts for the overwhelming majority.
Figure 9 and Figure 10, respectively, illustrate the dependence of the proportions of C ¯ D p and C ¯ D s in the total drag force ( C ¯ D ) on the relative roughness (K/D) and roughness coverage ratio (CR). These figures clearly demonstrate that for a rough cylinder, the C ¯ D p remains the dominant contributor to the C ¯ D , comprising over 96% of C ¯ D . Under an identical roughness coverage ratio, this proportion exhibits minimal variation with increasing K/D. However, when the CR exceeds 0.4, the proportion of the cylindrical pressure difference force C ¯ D p / C ¯ D with five different K/D gradually decreases. However, the proportion of frictional drag force in the total drag force ( C ¯ D s / C ¯ D ) shows an opposing trend to that of the pressure difference part. As is evident from Figure 10a, at a higher coverage ratio, such as CR = 0.917, the proportion of frictional drag force significantly increases to approximately 4%. In contrast, at a lower coverage ratio, such as CR = 0.167, the proportion remains minimal, around 1%. Furthermore, as shown in Figure 10b, the ratio of frictional drag force to the total drag also shows a distinct change at coverage ratio of 0.4.
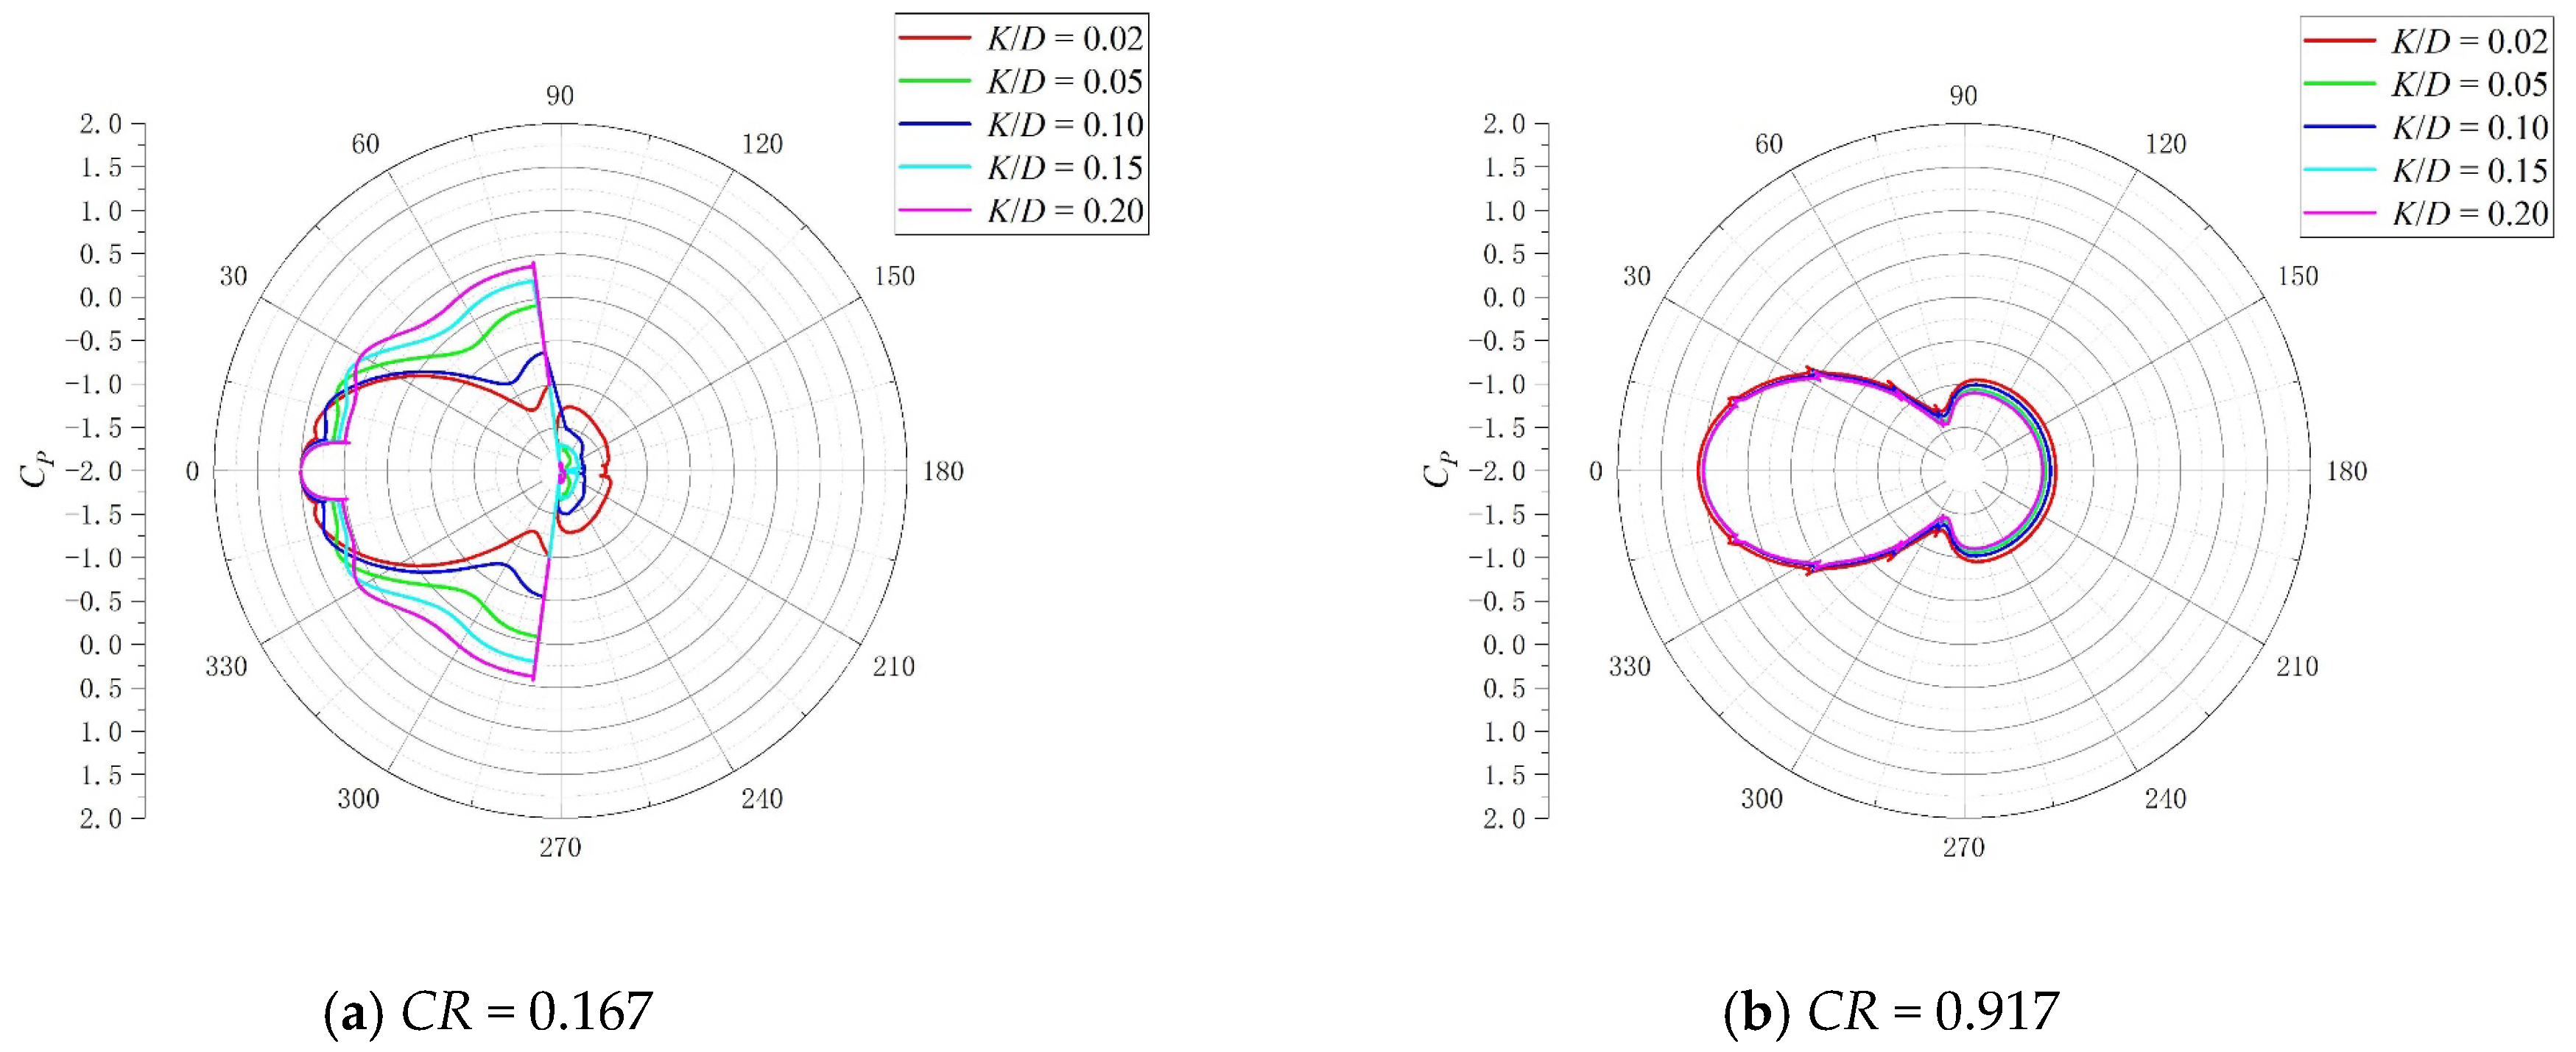
By nondimensionalizing the pressure on the rough cylinder using Equation (7), the distribution of the pressure coefficient (CP) at different positions on the surface of rough cylinder is obtained. Figure 11 shows the distribution of CP around the cylinder’s surface at different K/D ratios for the xOy section at z = 0 with a CR value of 0.167 and 0.917. From Figure 11a, it is evident that under a low coverage ratio, the K/D has a significant effect on the distribution of pressure.
As the K/D increases, the value of CP on the upstream side of the rough cylinder gradually increases, while the CP on the downstream side decreases, resulting in a significant increase in the upstream and downstream pressure difference with higher K/D. However, under a higher coverage ratio, as shown in Figure 11b, it can be observed that an increase in K/D does not result in a significant change in the surface pressure coefficient of the cylinder, and there is almost no change in the pressure difference between the upstream and downstream of the cylinder.
It is evident that the variations in the pressure coefficient correlate well with the changes in the drag coefficient observed in Figure 8. The variations in the drag coefficient under different coverage ratios are primarily attributed to the pressure difference between the upstream and downstream ends of the cylinder.
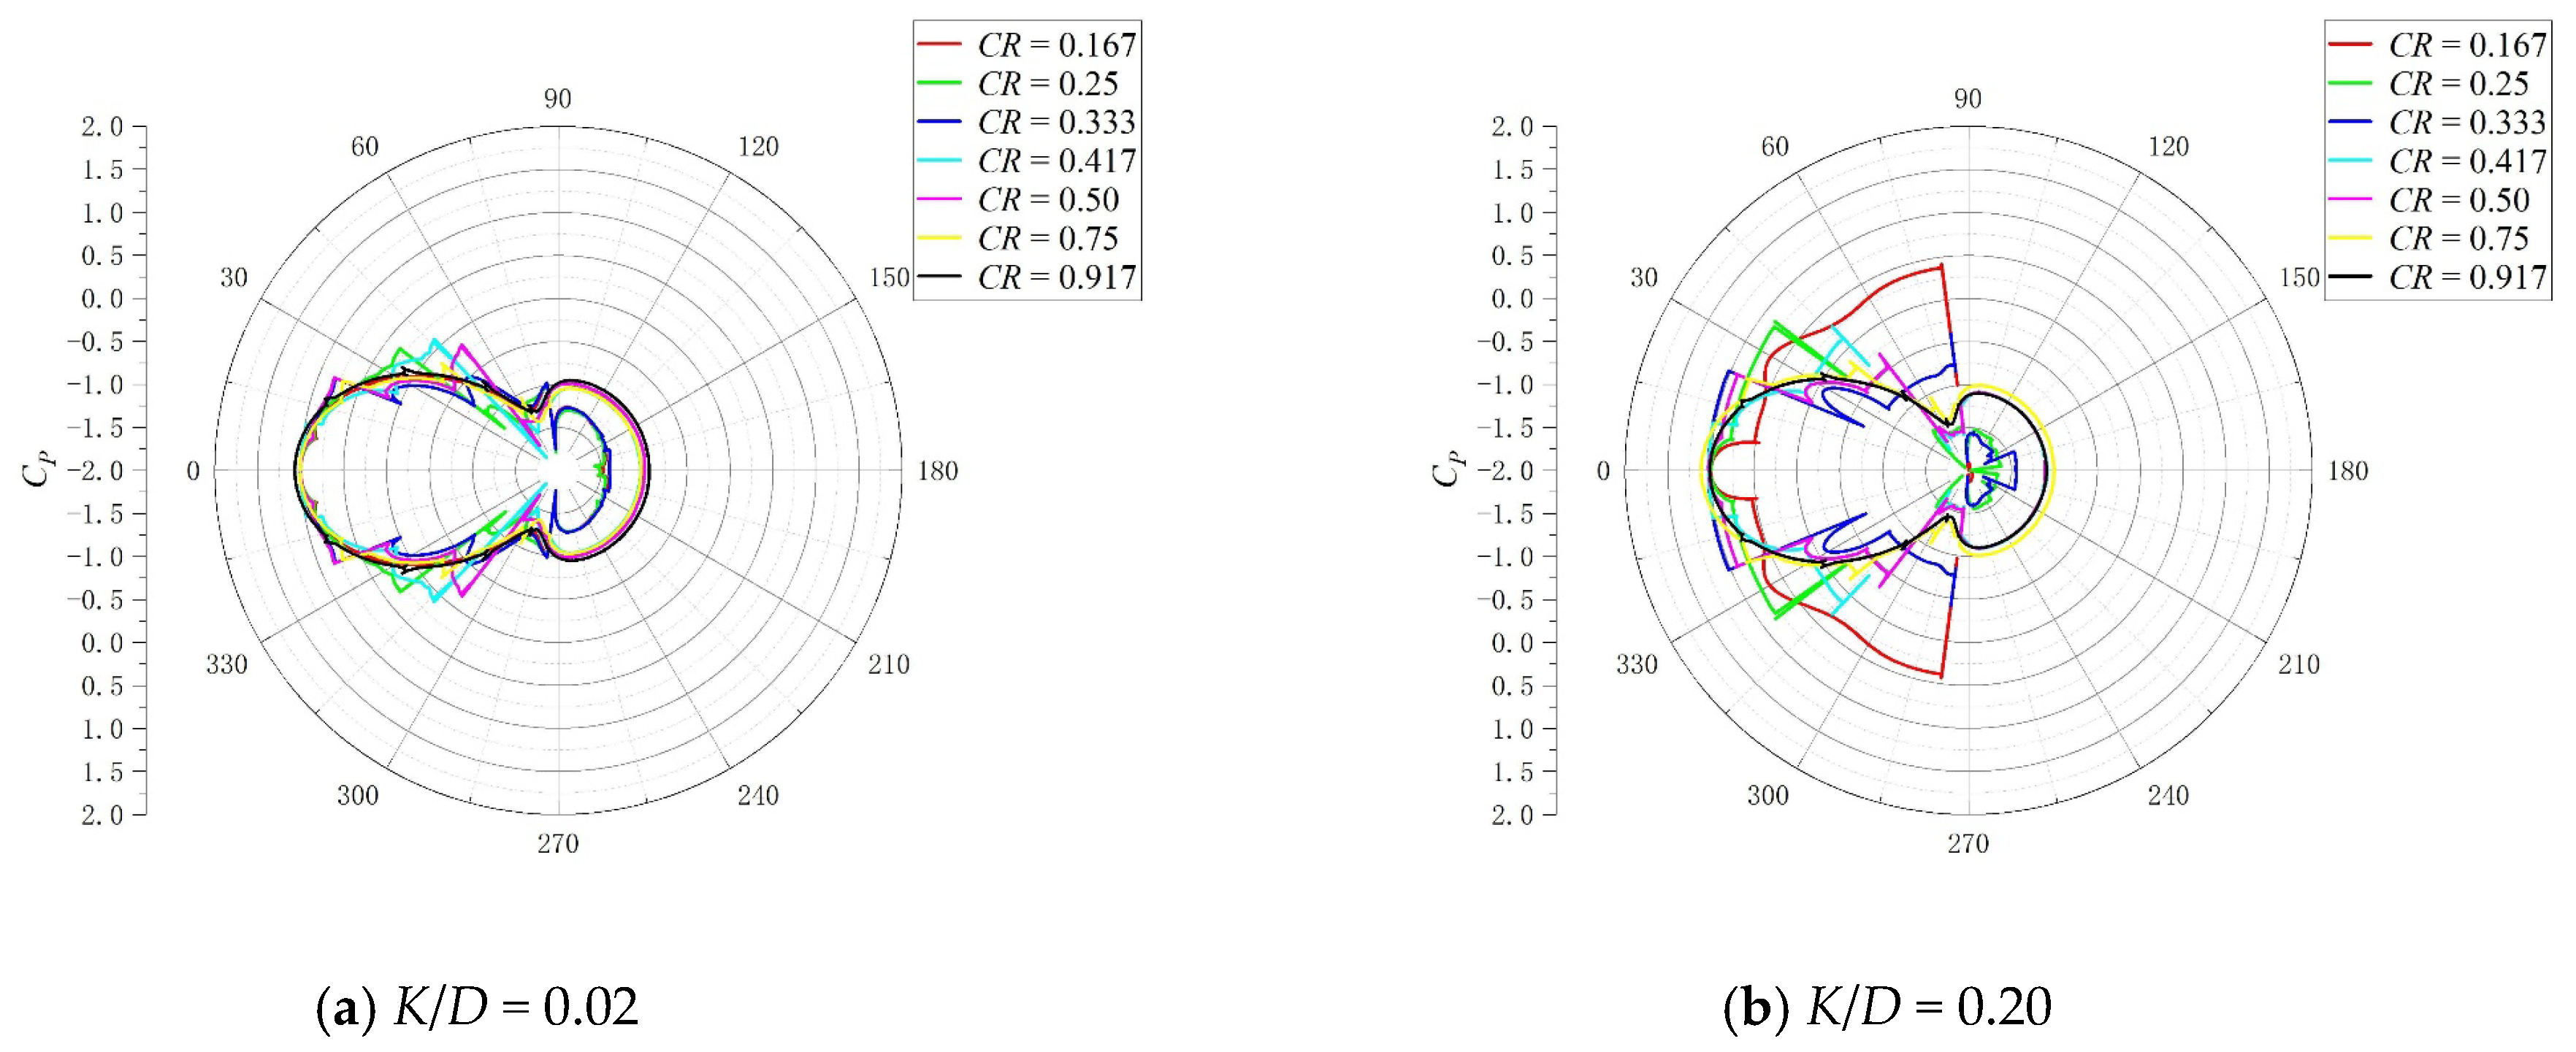
Similarly, to analyze the effect of the coverage ratio (CR) on the surface pressure of the cylinder, Figure 12 presents the distribution of the pressure coefficient (CP) around the cylinder’s surface at different CR with K/D values of 0.02 and 0.20. As shown in Figure 12a, at the lower K/D ratio (0.02), the value of CR has little impact on the pressure coefficient on the upstream side of the cylinder, but significant variations in CP are observed on the downstream side. Specifically, the value of CP remains approximately −1.0 when CR is in the range of 0.417 to 0.917 but decreases to −1.5 when CR is between 0.167 and 0.333.
In contrast, as demonstrated in Figure 12b, at a higher K/D ratio (0.20), the value of CR influences not only the distribution of the CP on the downstream side but also alters the distribution on the upstream side. Notably, when CR is 0.167, the pressure coefficient (CP) on the upstream side exhibits a sharp increase, accompanied by a significant expansion in its range. This further underscores that the variations in the drag coefficient ( C ¯ D ) are predominantly due to pressure differences across the cylinder’s upstream and downstream regions.
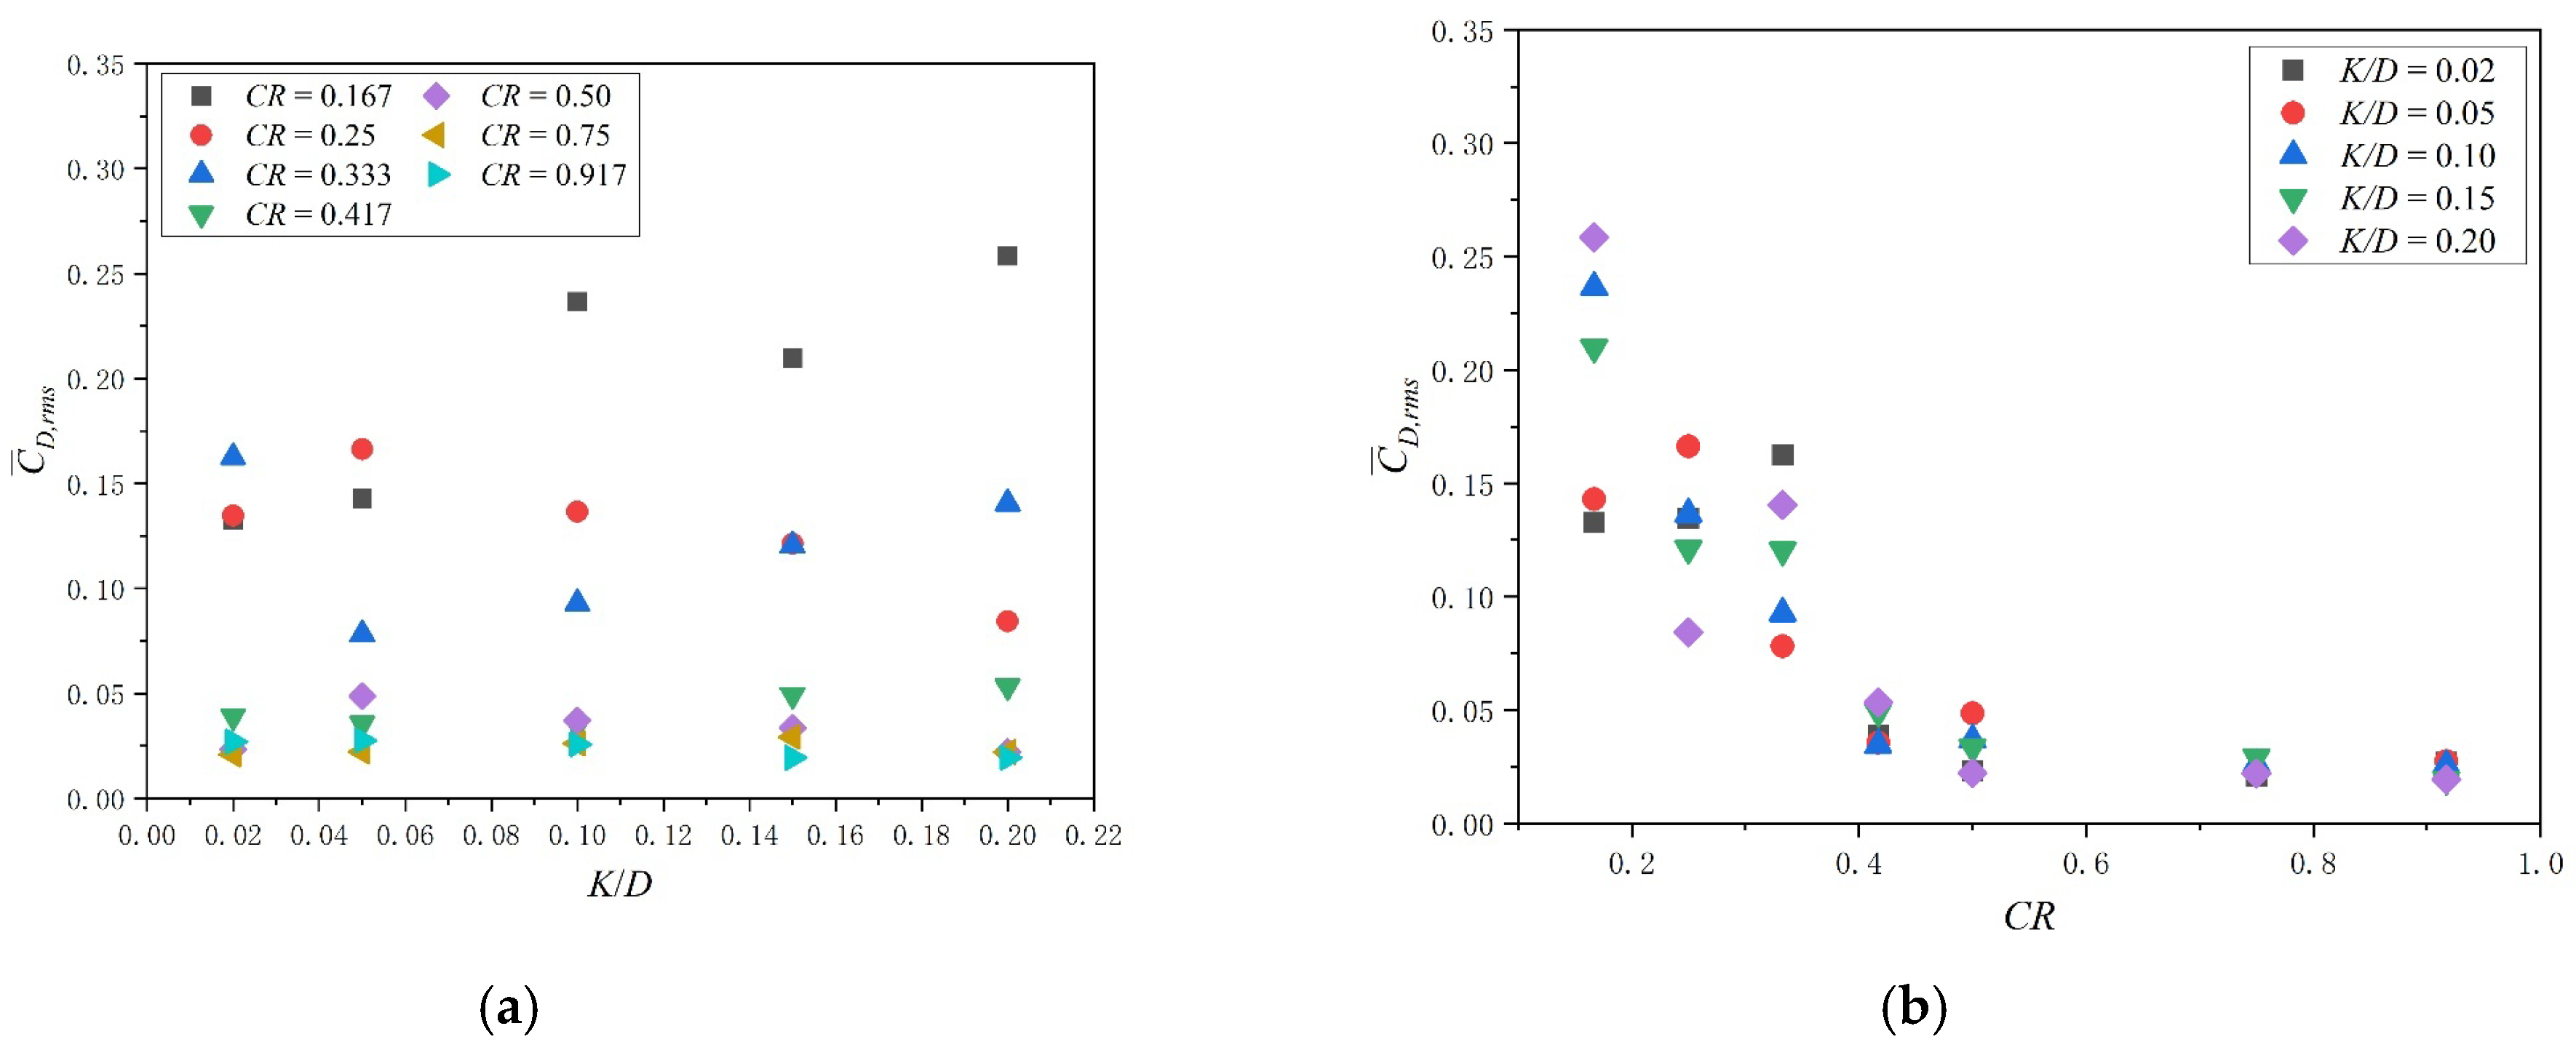
The root–mean–square of the drag coefficient and lift coefficient ( C ¯ D , r m s ,   C ¯ L , r m s ) were calculated using Equation (10), and the results are shown in Figure 13 and Figure 14. As shown in these figures, it is evident that the C ¯ D , r m s and C ¯ L , r m s for rough cylinders exhibit significantly larger values when the CR is less than 0.4 compared to cases where CR exceeds 0.4. This indicates that at smaller coverage rates (CR = 0.167, 0.25, 0.333), the disturbance of roughness on the flow field around the cylinder is more pronounced. Meanwhile, the interaction between vortices of different scales around the cylinder is more intense, leading to more momentum exchange and a greater momentum deficit within the flow field. On the contrary, at larger roughness coverage ratios (CR = 0.417, 0.50, 0.75, 0.917), the cross-sectional profile of the rough cylinder increasingly resembles that of a smooth cylinder. In such cases, the roughness causes minimal disturbance to the surrounding flow field, resulting in a relatively smaller momentum deficit.
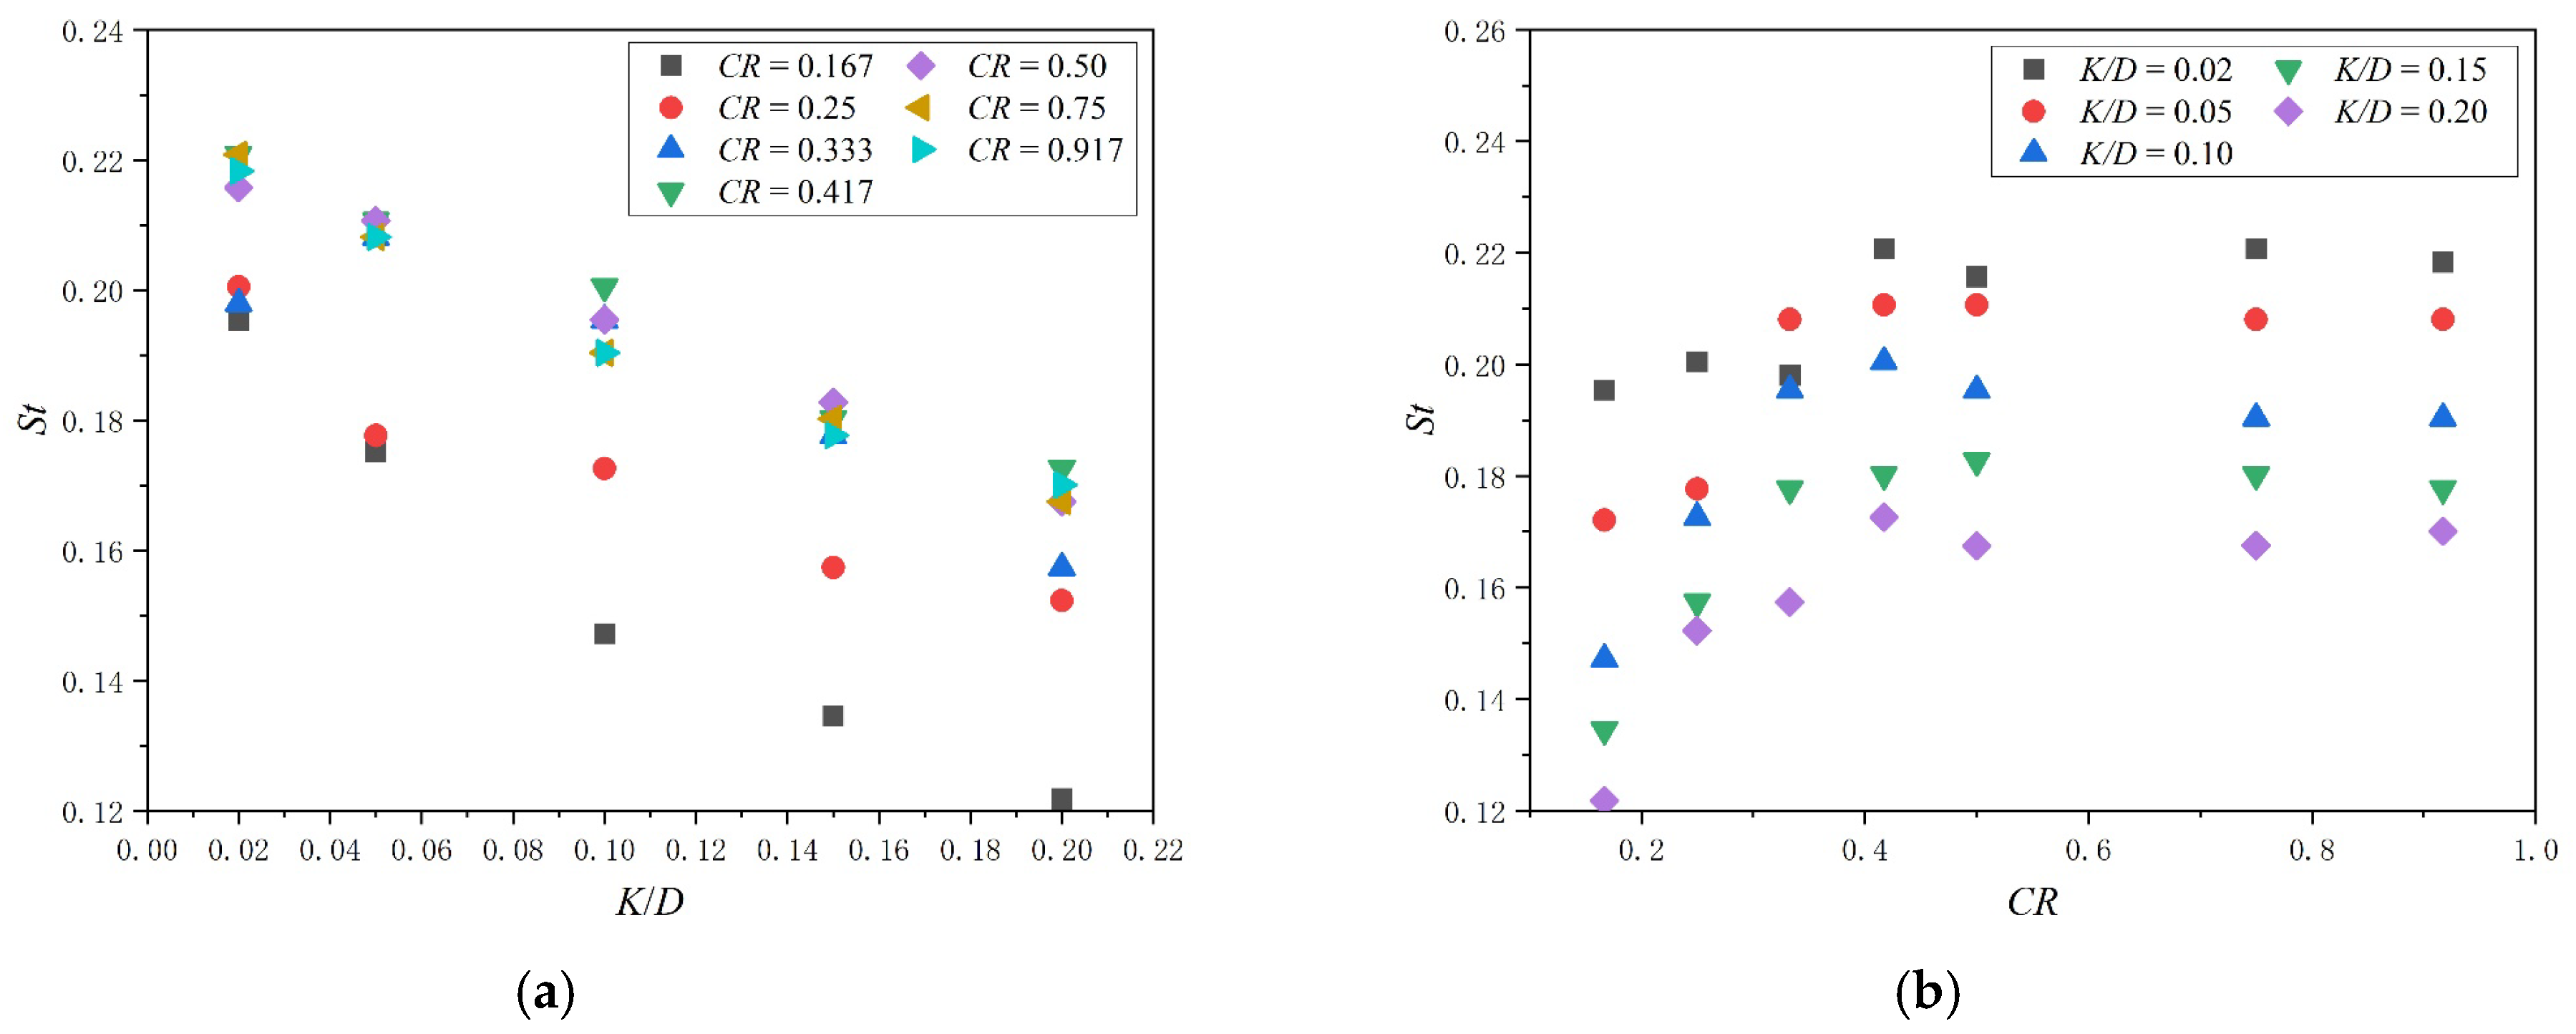
By conducting fast Fourier transform on the time history of the lift coefficient for rough cylinders and utilizing Equation (8), the normalized nondimensional wake shedding frequency Strouhal number (St) can be obtained. As illustrated in Figure 15, the Strouhal number exhibits high sensitivity to variations in K/D and CR. The value of St decreases sharply with increasing K/D and slowly increases as CR increases. When CR is 0.167 and K/D is 0.02, the value of St is only 0.12, which is approximately 45% lower than the St value of 0.216 for smooth cylinders.
This result indicates that the presence of roughness significantly alters the flow structure around the cylinder, which affects the frequency characteristics of vortex shedding. Additionally, higher relative roughness generates stronger interference in the flow, while an increase in roughness coverage ratio reduces this interference, leading to an increase in the St value. Given the effects of surface roughness on the cylinder’s drag force, lift force, and Strouhal number, it is evident that roughness significantly influences flow characteristics. Therefore, in designing engineering applications involving cylindrical structures, it is crucial to fully account for the impact of surface roughness on the flow field to optimize performance and mitigate potential adverse effects.

3.3. Flow Field Characteristic Analysis

In the previous section, the influence of rough coverage ratio (CR) and relative roughness (K/D) on the hydrodynamic coefficients of a cylinder was primarily analyzed and discussed. Through comparative analysis, it is evident that the CR and K/D significantly influence the hydrodynamic characteristics of the cylinder. This section will mainly explore the influence of both parameters on the flow field characteristics around the cylinder.
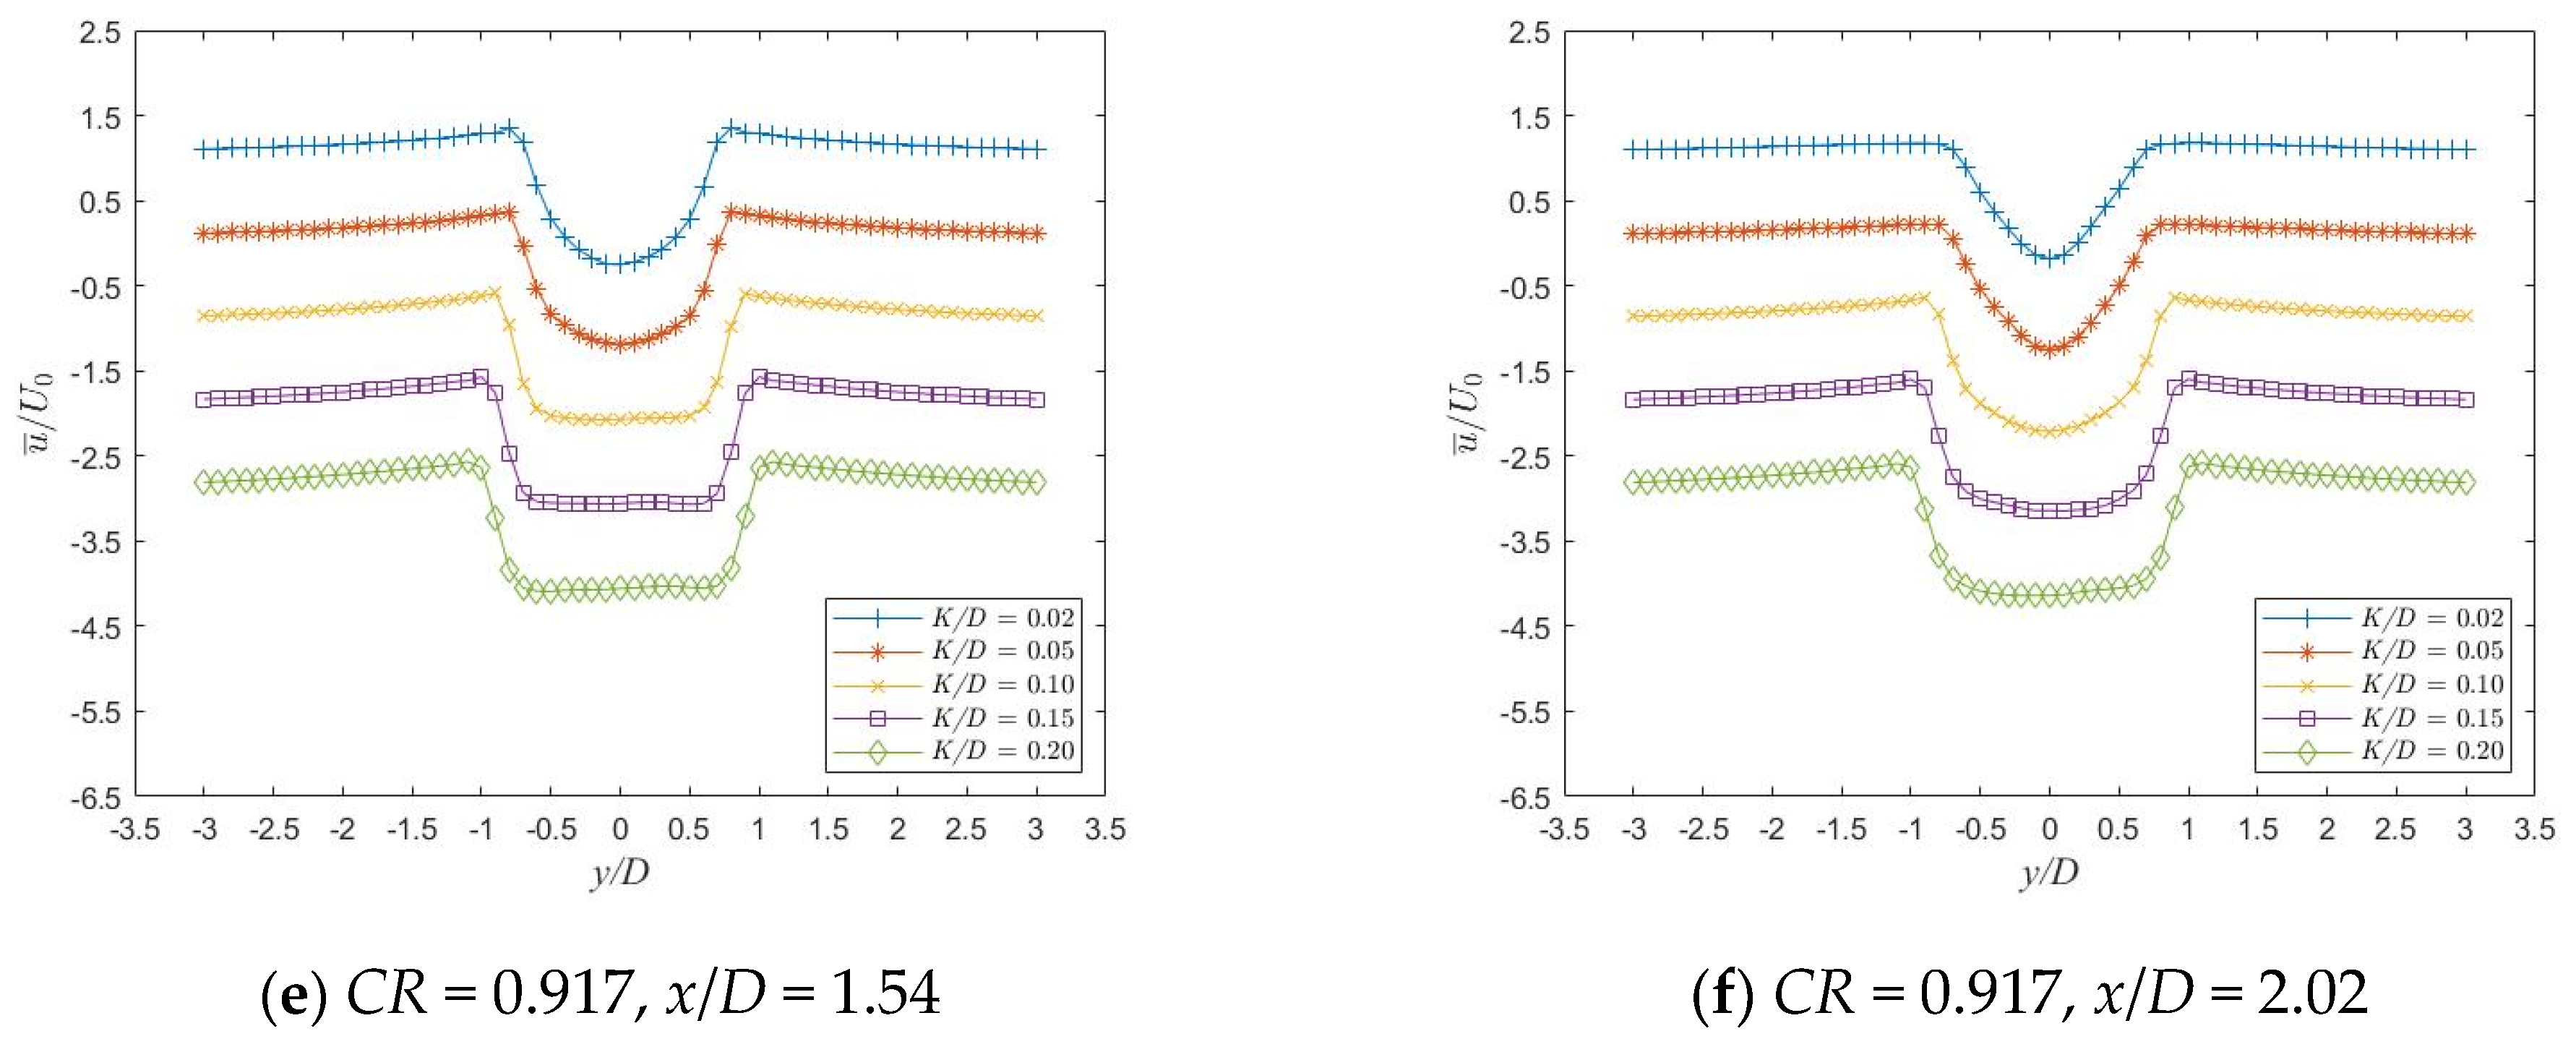
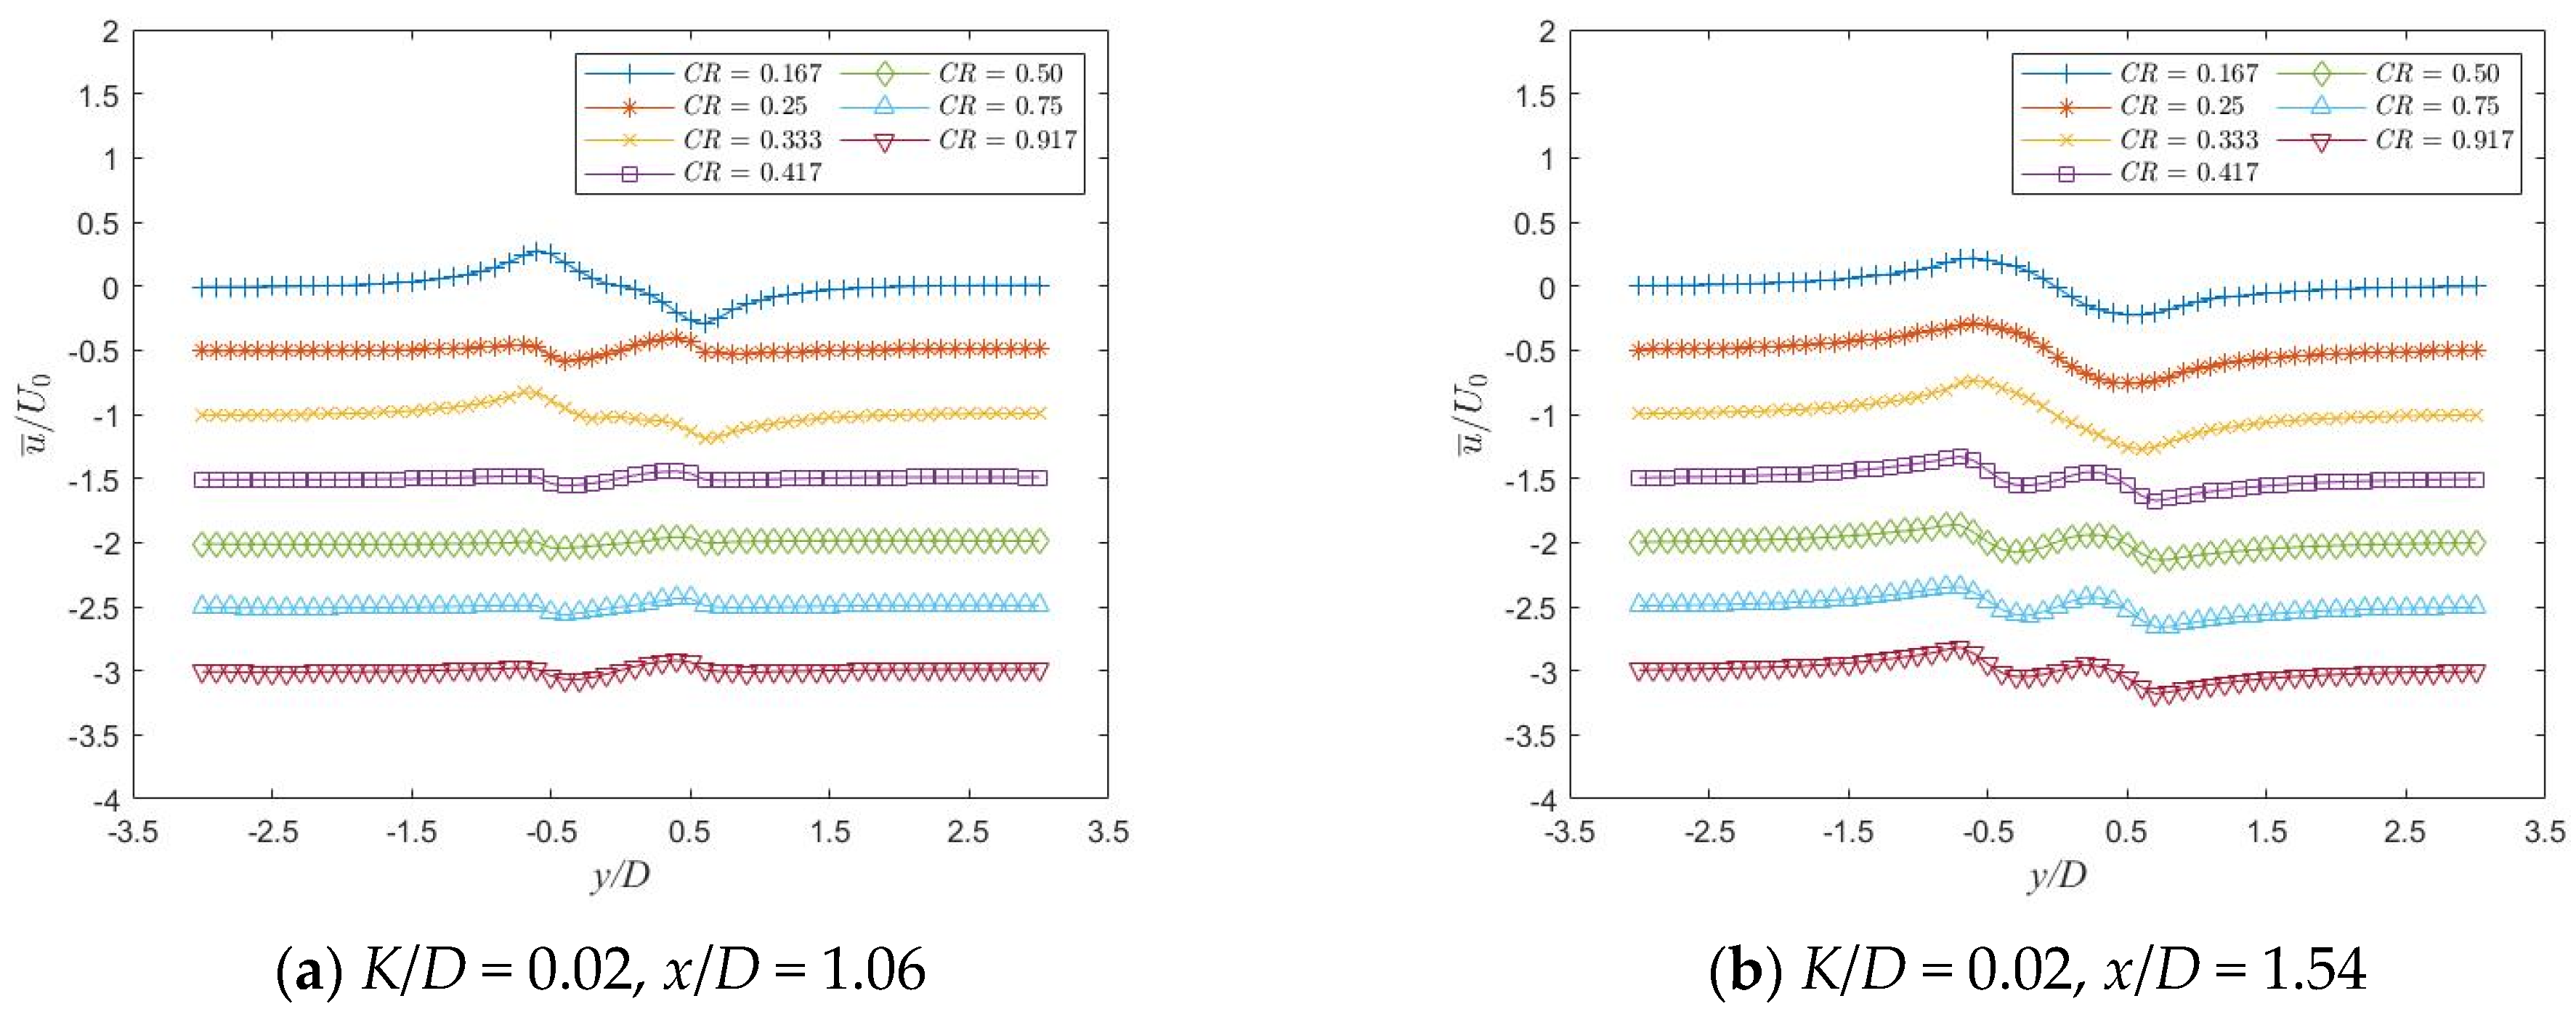
Figure 16 first illustrates the time-averaged velocity distribution in the x-direction at three characteristic positions (x/D = 1.06, 1.54, and 2.02) behind the cylinder on the xOy section at z = 0, corresponding to roughness coverage ratios (CR) of 0.167 and 0.917. To facilitate comparative analysis, the velocity distribution curves have been vertically shifted by one to four unit lengths during plotting. The results reveal that the time-averaged velocity distribution curves in the x-direction are symmetrically distributed with y/D = 0. However, the velocity distribution curves exhibit significant differences under different coverage ratios. Notably, when the CR is 0.167, the time-averaged velocity distribution curves at the three characteristic positions show a “V”-shaped distribution, while at CR = 0.917, a “U”-shaped distribution is observed. This indicates that a higher coverage ratio enhances the uniformity of the velocity in the wake region of cylinder.
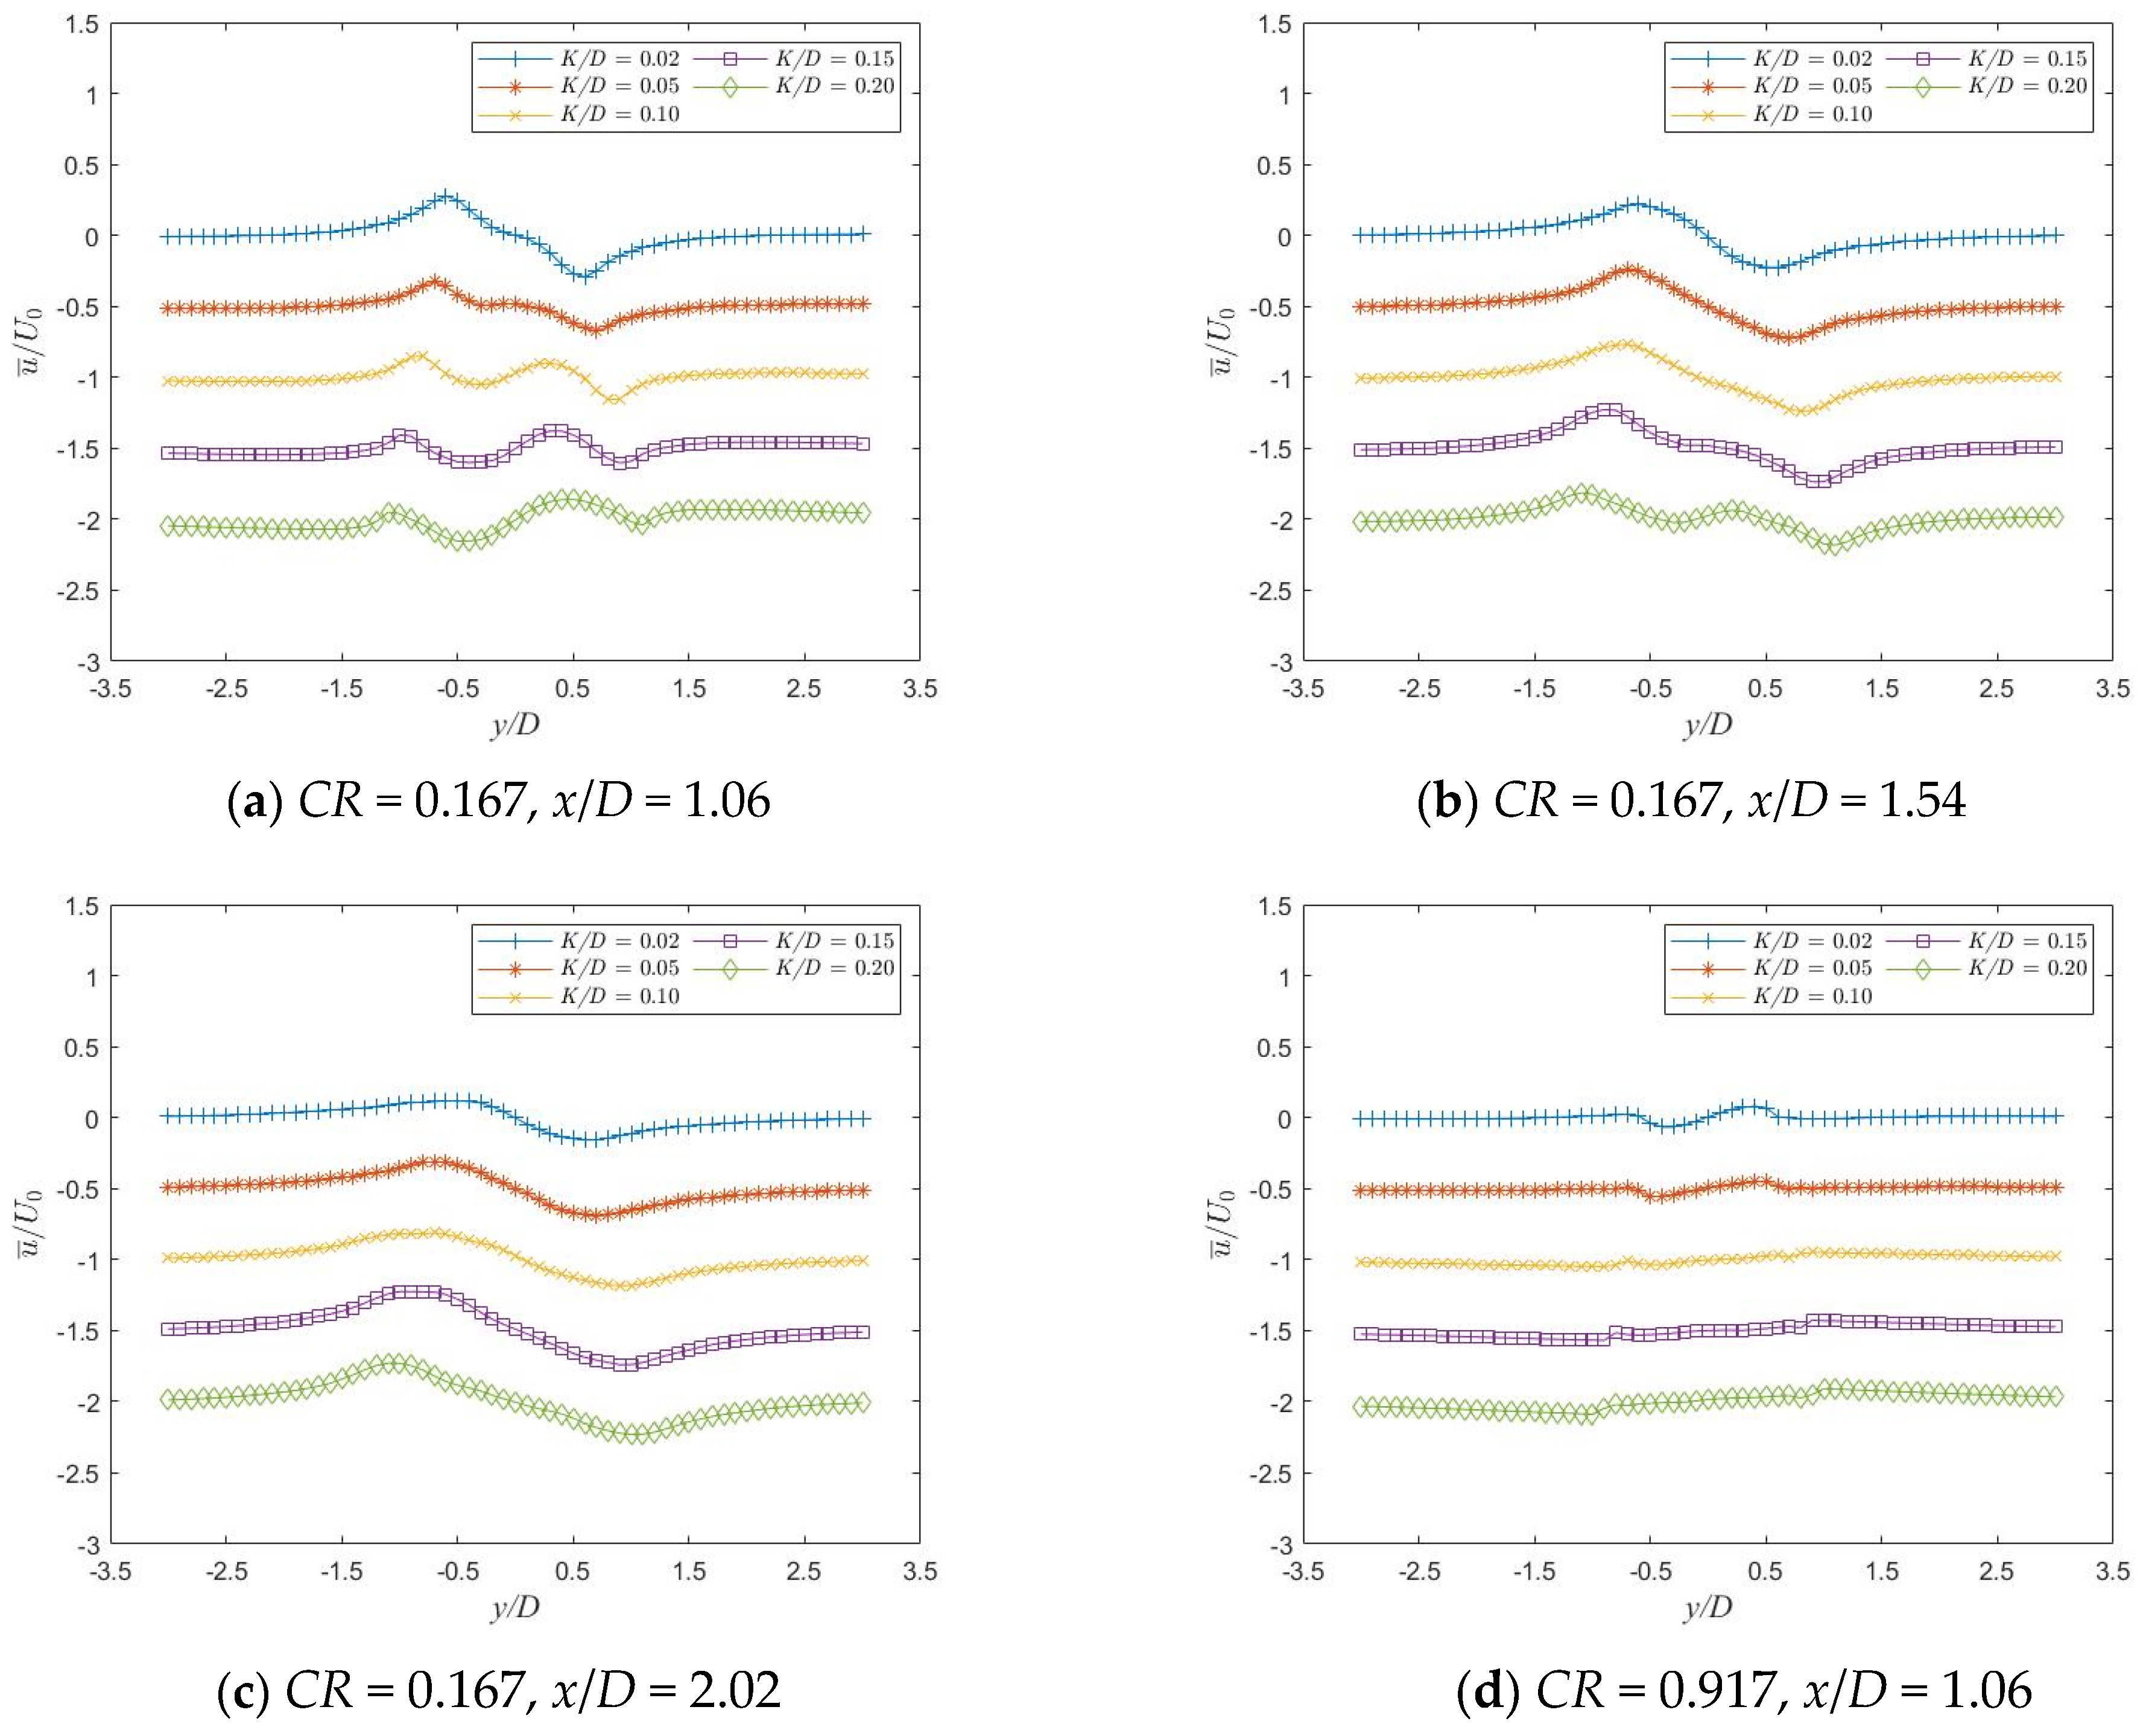
Similarly to Figure 17, Figure 18 illustrates the time-averaged velocity distribution in the y-direction at three characteristic positions, also offset downwards by a unit length ranging from 0.5 to 2. It can be found that the time-averaged velocity in the y-direction exhibits an asymmetric distribution relative to y/D = 0. With an increase in K/D, the outer diameter of the rough cylinder also increases. Consequently, the fluctuation amplitude of the velocity distribution curve gradually increases in the y-direction as K/D.
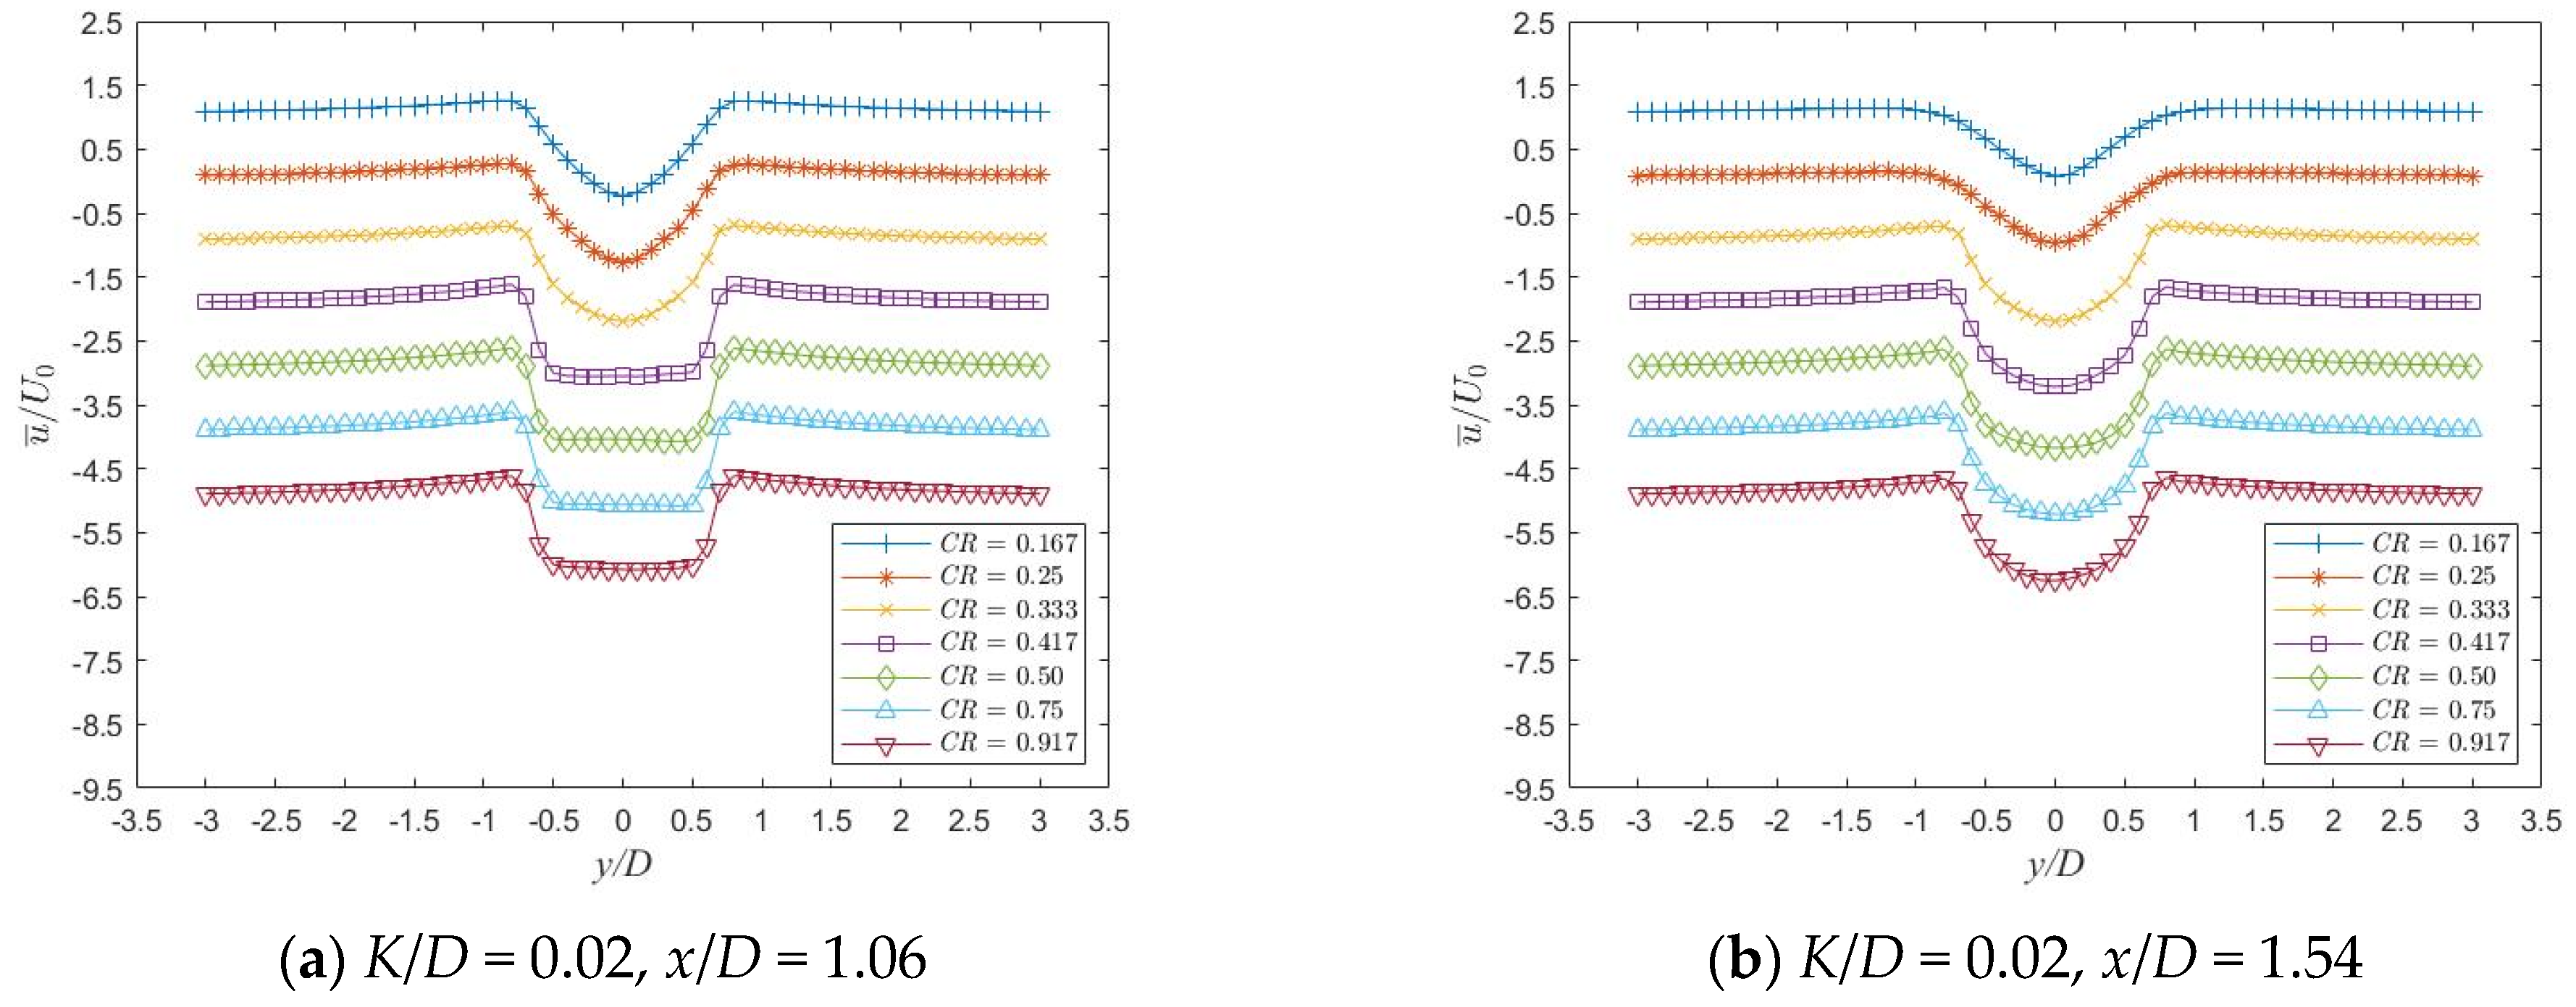
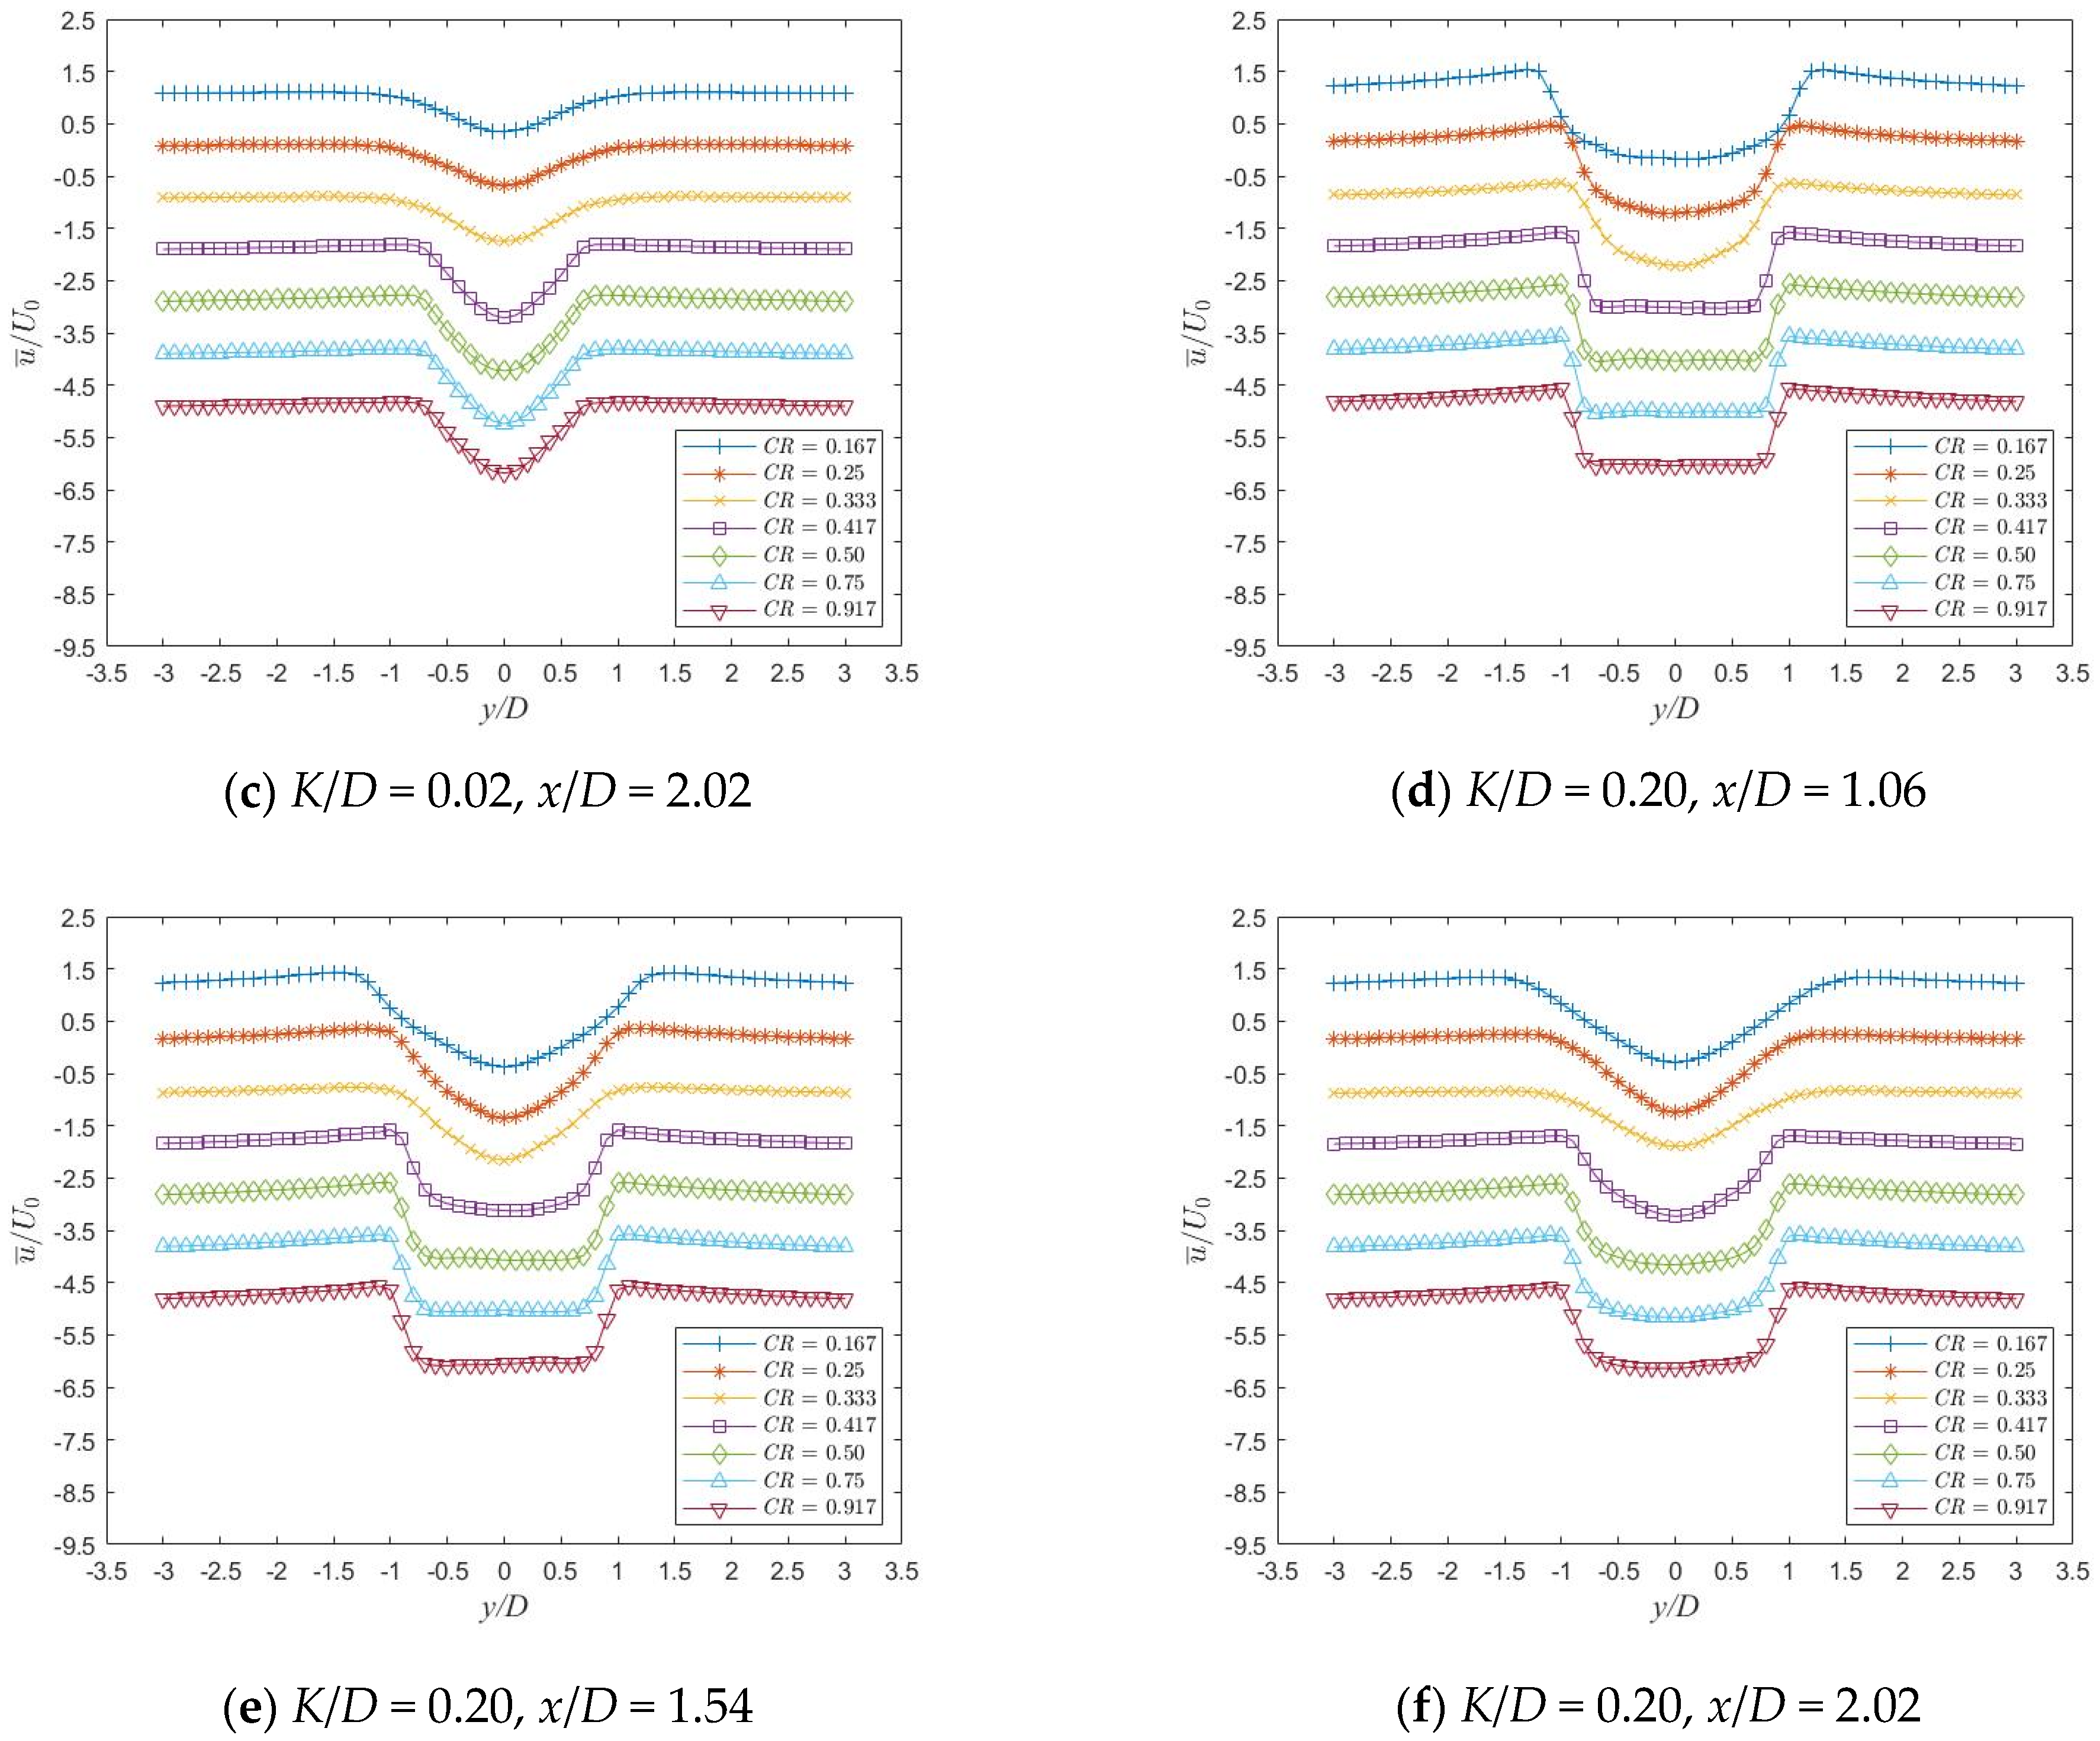
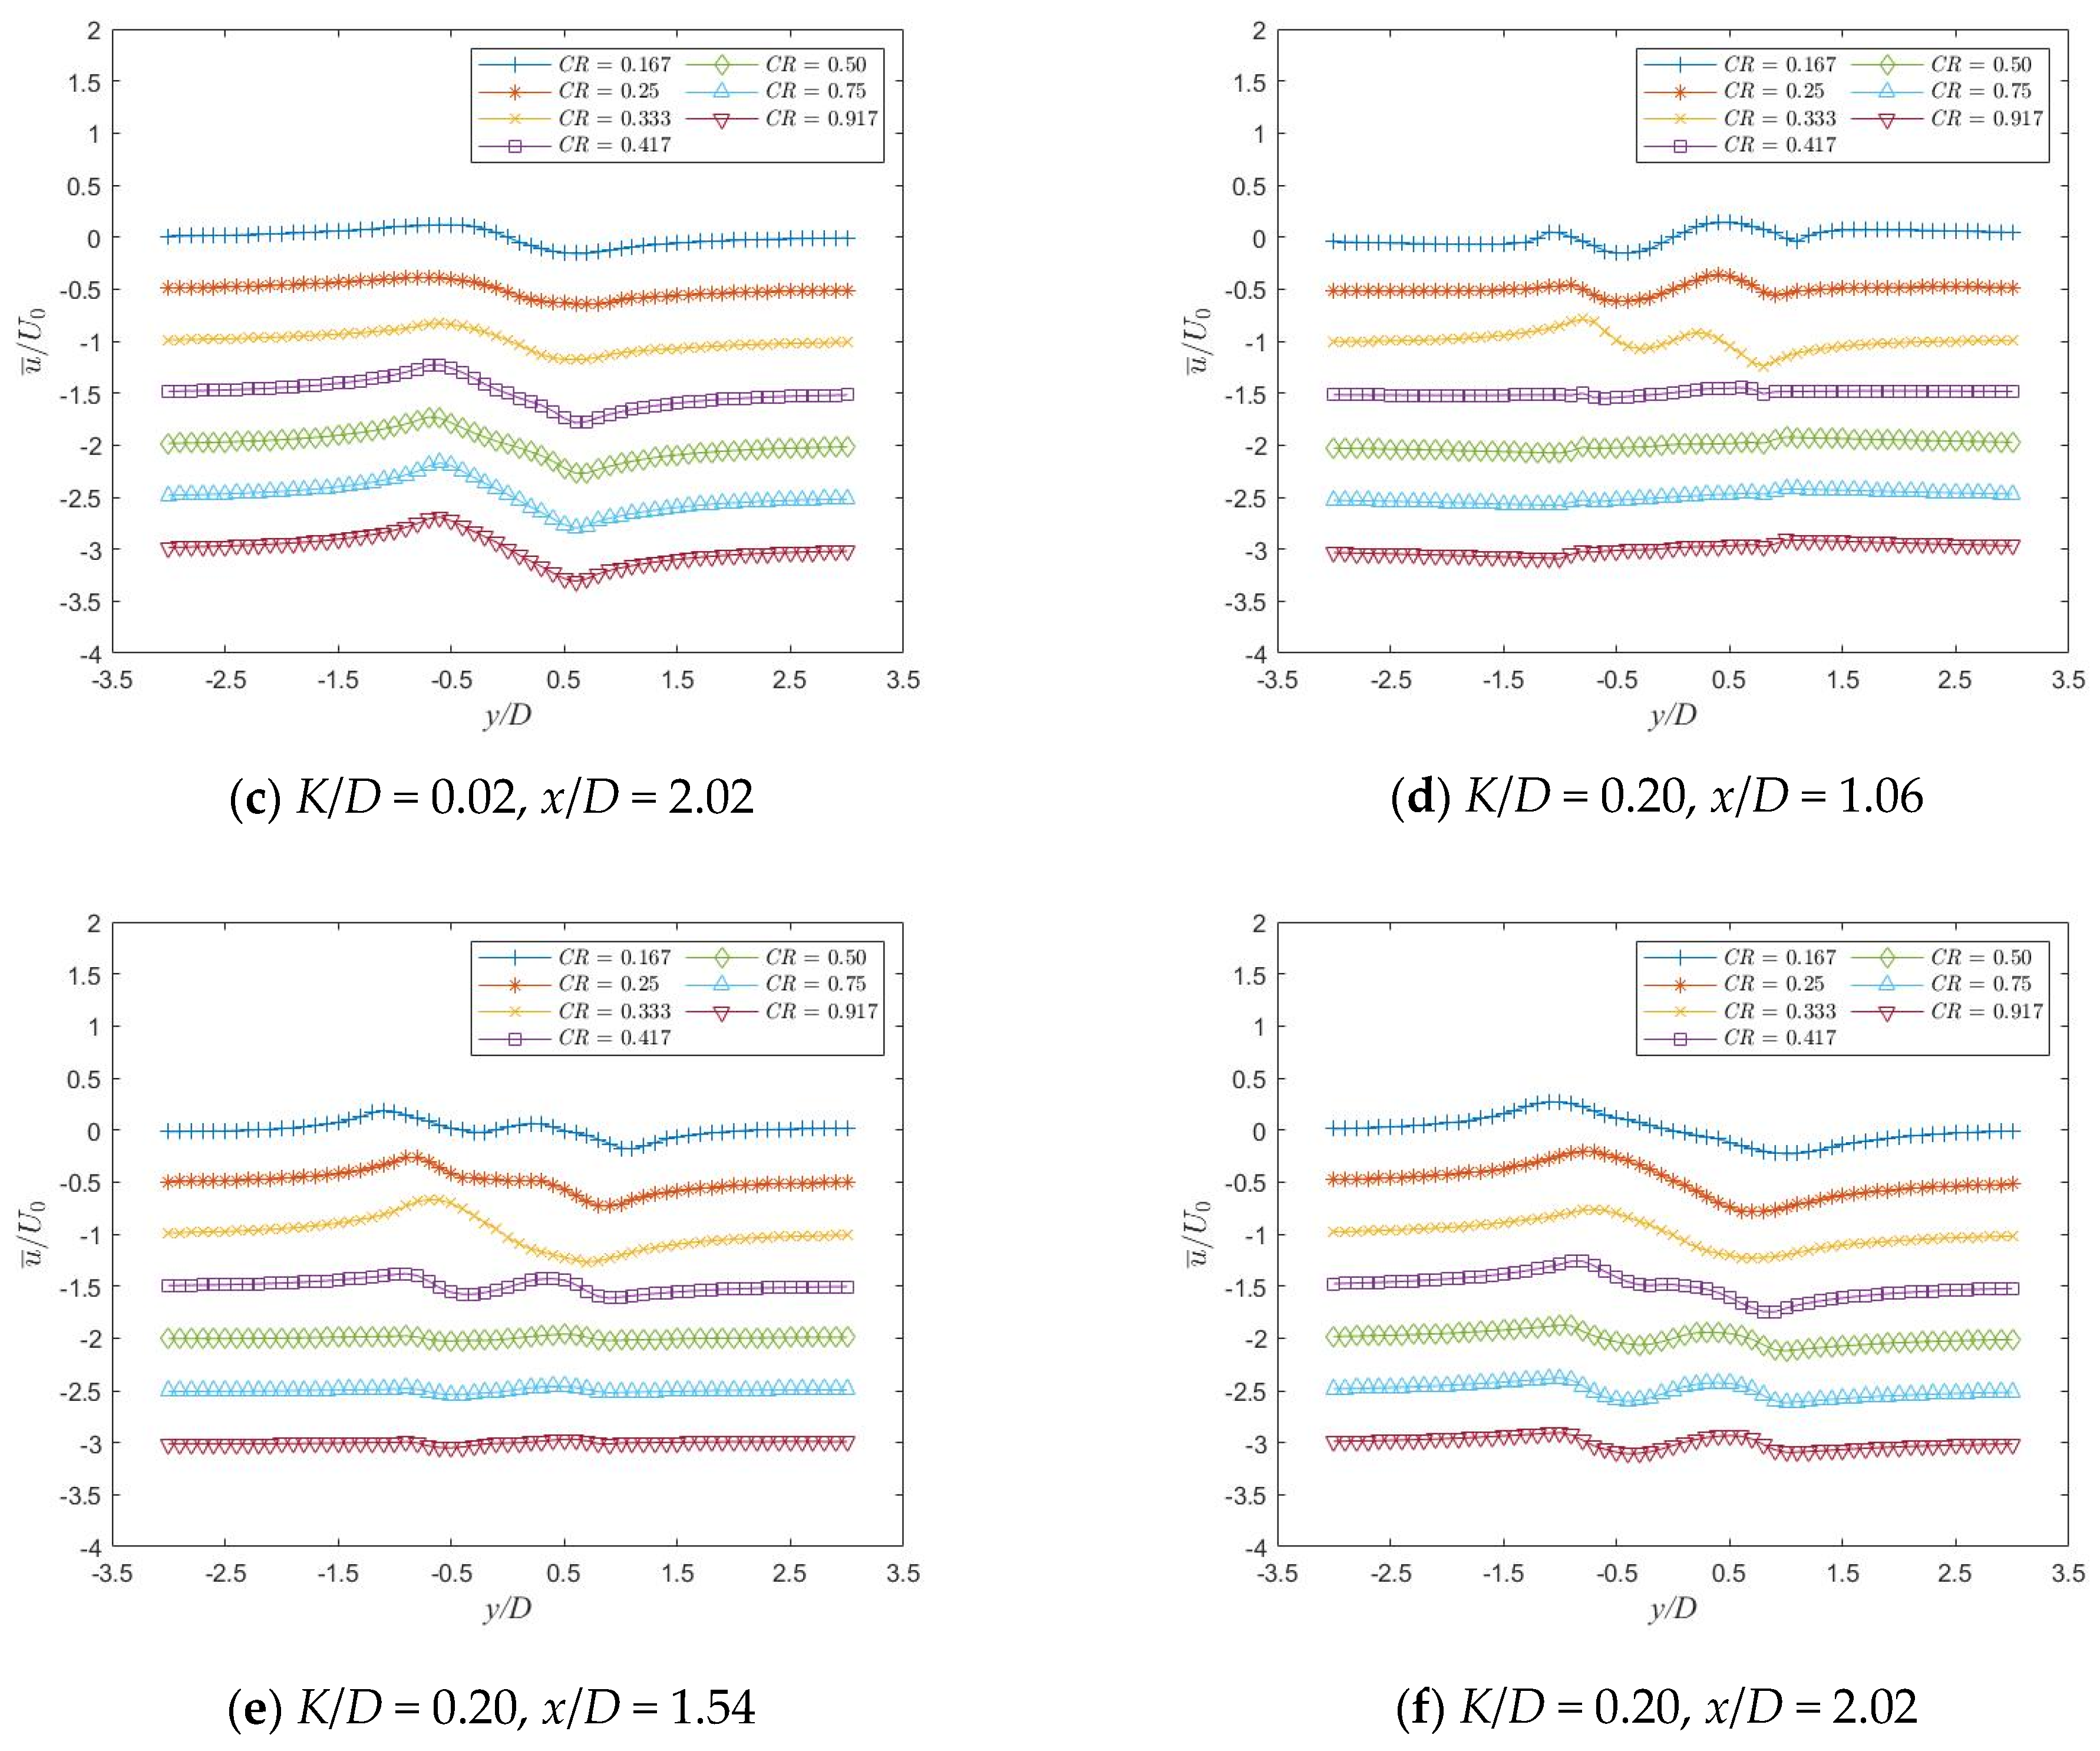
Figure 18 and Figure 19 present the velocity distributions in the x- and y- directions at three characteristic positions under seven different coverage ratios (CR) with relative roughness (K/D) values of 0.02 and 0.20, respectively. It can be observed that the velocity distribution curves in both directions exhibit marked differences around a critical coverage ratio of approximately CR = 0.4.
For the time-averaged velocity distribution in the x-direction, when the CR is less than 0.4, it mainly exhibits a “V”-shaped pattern, with the opening of the “V” increasing as CR decreases. Conversely, for CR > 0.4, the distribution tends to adopt a “U”-shaped pattern. This indicates that at a lower CR, the shear layer thickness at the same characteristic position is greater, while at a higher CR, the flow of the rough cylinder behaves more like a smooth cylinder, resulting in a relatively thinner shear layer.
Similarly, the time-averaged velocity distribution in the y-direction also demonstrates a critical coverage ratio of CR = 0.4. For CR < 0.4, the fluctuation amplitude of the velocity distribution curve in the y-direction is significantly larger compared to cases with CR > 0.4. This suggests that at lower CR, the roughness induces greater disturbance to the flow field around the cylinder. In contrast, at higher CR, the disturbance is relatively reduced, consistent with the earlier findings regarding the root–mean–square values of the drag coefficient ( C ¯ D , r m s ) and lift coefficient ( C ¯ L , r m s ). This result further emphasizes the importance of roughness coverage ratio in influencing both the hydrodynamic coefficients of the cylinder and the flow structure within the wake region.
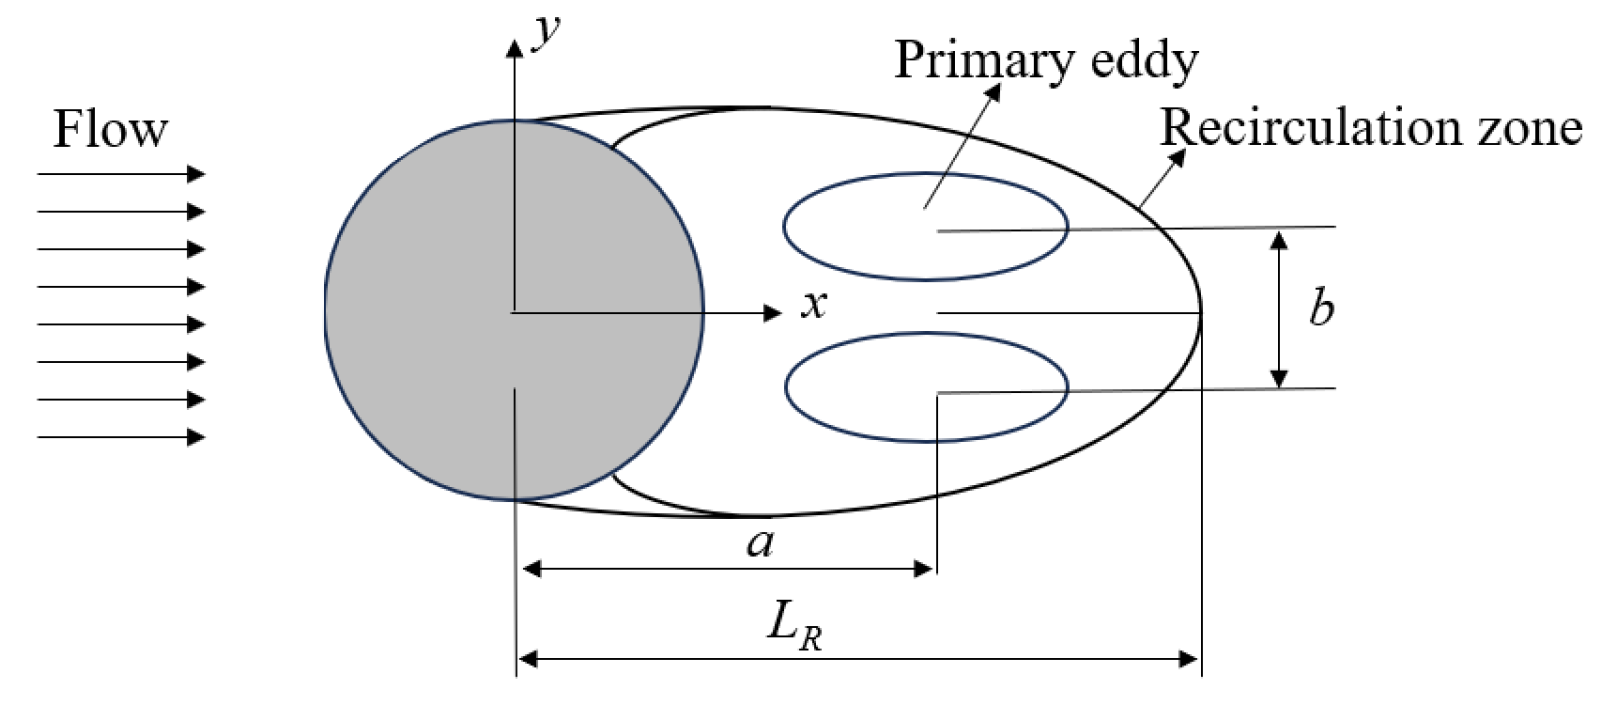
As is well known, when flow passes a cylinder, due to the viscous effect of the fluid, the velocity of the fluid near the surface of the cylinder slows down, forming a boundary layer. Under the influence of a reverse pressure gradient, the boundary layer separates at the shoulder of the cylinder, leading to vortex formation downstream. These vortices form a closed-loop flow structure in the wake, commonly referred to as the recirculation zone. The sketch of the flow structure of the uniform flow field in the smooth cylindrical recirculation zone is shown in Figure 20. The recirculation zone’s length, denoted as L R , refers to the length from the center of the cylinder along the x-direction to the termination of the primary vortex formation. The distance from the main vortex downstream to the center of the cylinder is represented by a, and the distance between the two main vortices is represented by b.
As illustrated in Figure 21, the time-averaged vorticity and streamline fields around a rough cylinder are presented for K/D = 0.02, 0.10, and 0.20 under the values of CR = 0.167 and 0.917. It is observed that when the CR is 0.167, the development of the separating shear layer is hindered by roughness elements, which results in the position of the separation point moving significantly upstream on the cylinder. This is also consistent with the significant increase in the drag coefficient observed in the earlier discussion. Meanwhile, small-scale vortices are formed near the rough elements on the downstream side of the cylinder. In addition, as the K/D increases, the scale of the primary vortex in the wake region of the rough cylinder gradually expands, and the distance (b) between the two main vortices also gradually increases, resulting in a significant widening of the recirculation zone. Larger-scale vortices indicate that their formation, development, and shedding require more time, thereby reducing the vortex shedding frequency and causing a substantial decrease in Strouhal number (St) with increasing relative roughness (K/D).
Furthermore, the above dependency relationship is influenced by the coverage ratio (CR). Specifically, at CR = 0.167, the increase in the scale of the main vortex becomes more pronounced as K/D increases. In contrast, at CR = 0.917, although the primary vortex scale also increases, the magnitude of the increase is relatively smaller. In addition, the obstructive effect of the rough element on the development of the separating shear along the flow direction diminishes, resulting in a thinner shear layer that rolls up into the primary vortex farther from the cylinder. This explains the observed trend in Figure 15, where the value of St decreases with increasing K/D. Additionally, the rate of decrease in St is more significant at smaller coverage ratios (CR < 0.4).
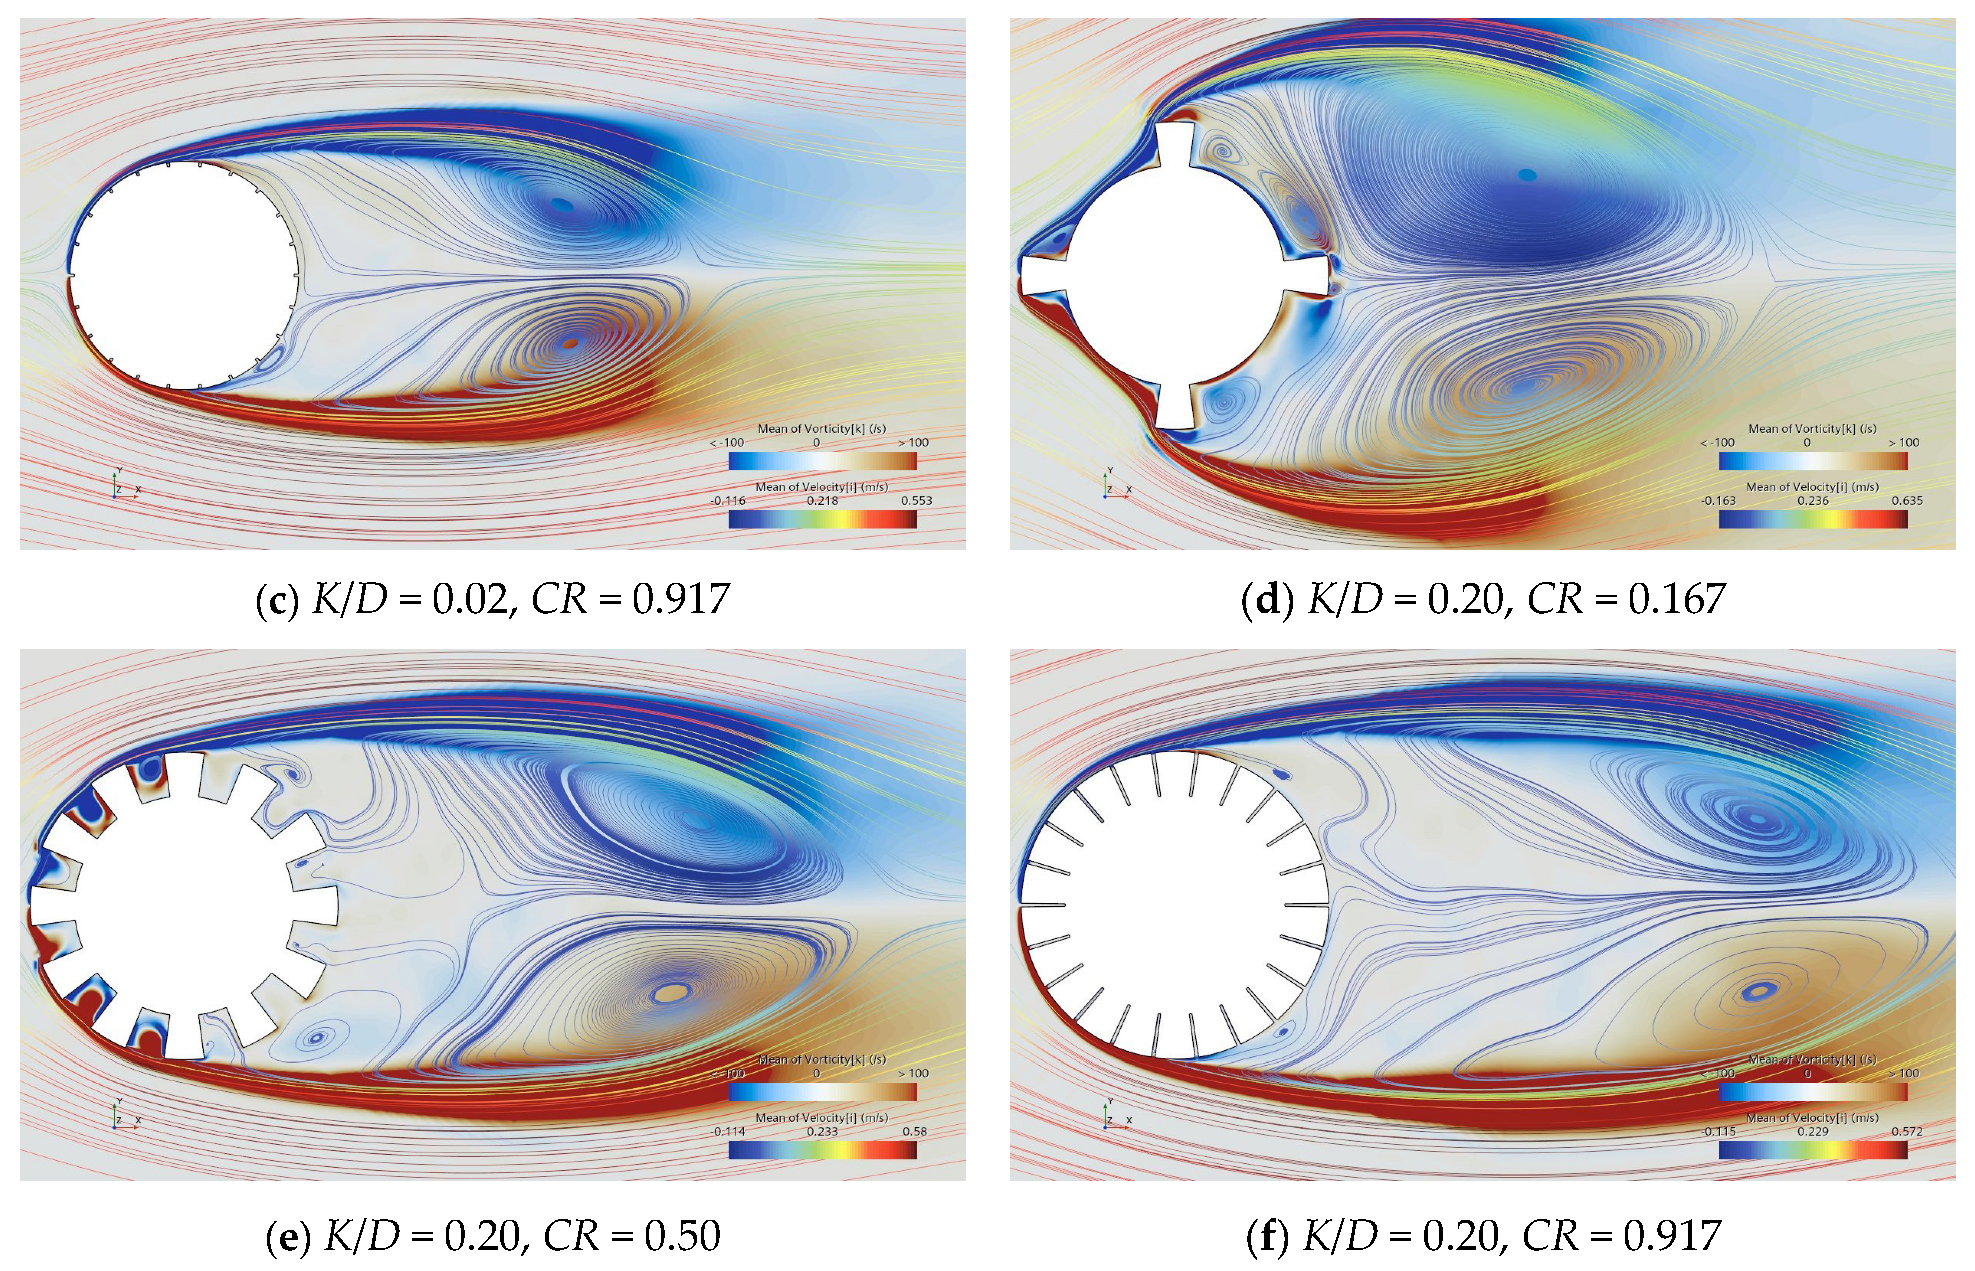
Similarly to Figure 21, Figure 22 illustrates the time-averaged vorticity and streamline fields with CR = 0.167, 0.50, and 0.917 for the values of K/D = 0.02 and 0.20. It can be clearly found that as CR increases, the distance (a) between the main vortex and the center of the cylinder gradually increases. This indicates that the main vortex gradually moves away from the center of the cylinder, elongates in the downstream direction, and the cross-flow direction gradually narrows. Meanwhile, a buffer zone with relatively sparse streamlines between the main vortex and the cylinder is formed. As a result, the pressure difference between the upstream and downstream of the rough cylinder decreases, manifested in the drag coefficient ( C ¯ D ) gradually decreasing as CR increases. In addition, due to the increase in CR, the scale of the main vortex begins to decrease, the formation and development of the main vortex accelerate, and the vortex shedding frequency increases, so the Strouhal number (St) gradually increases.
In addition, when the CR is 0.917, due to the very small spacing between rough elements, the cross-sectional shape of the rough cylinder is close to that of a smooth cylinder. There are almost no small-scale vortices between the rough elements on the upstream and downstream sides of the cylinder, and the influence of the roughness on the surrounding flow field of the cylinder is no longer significant.
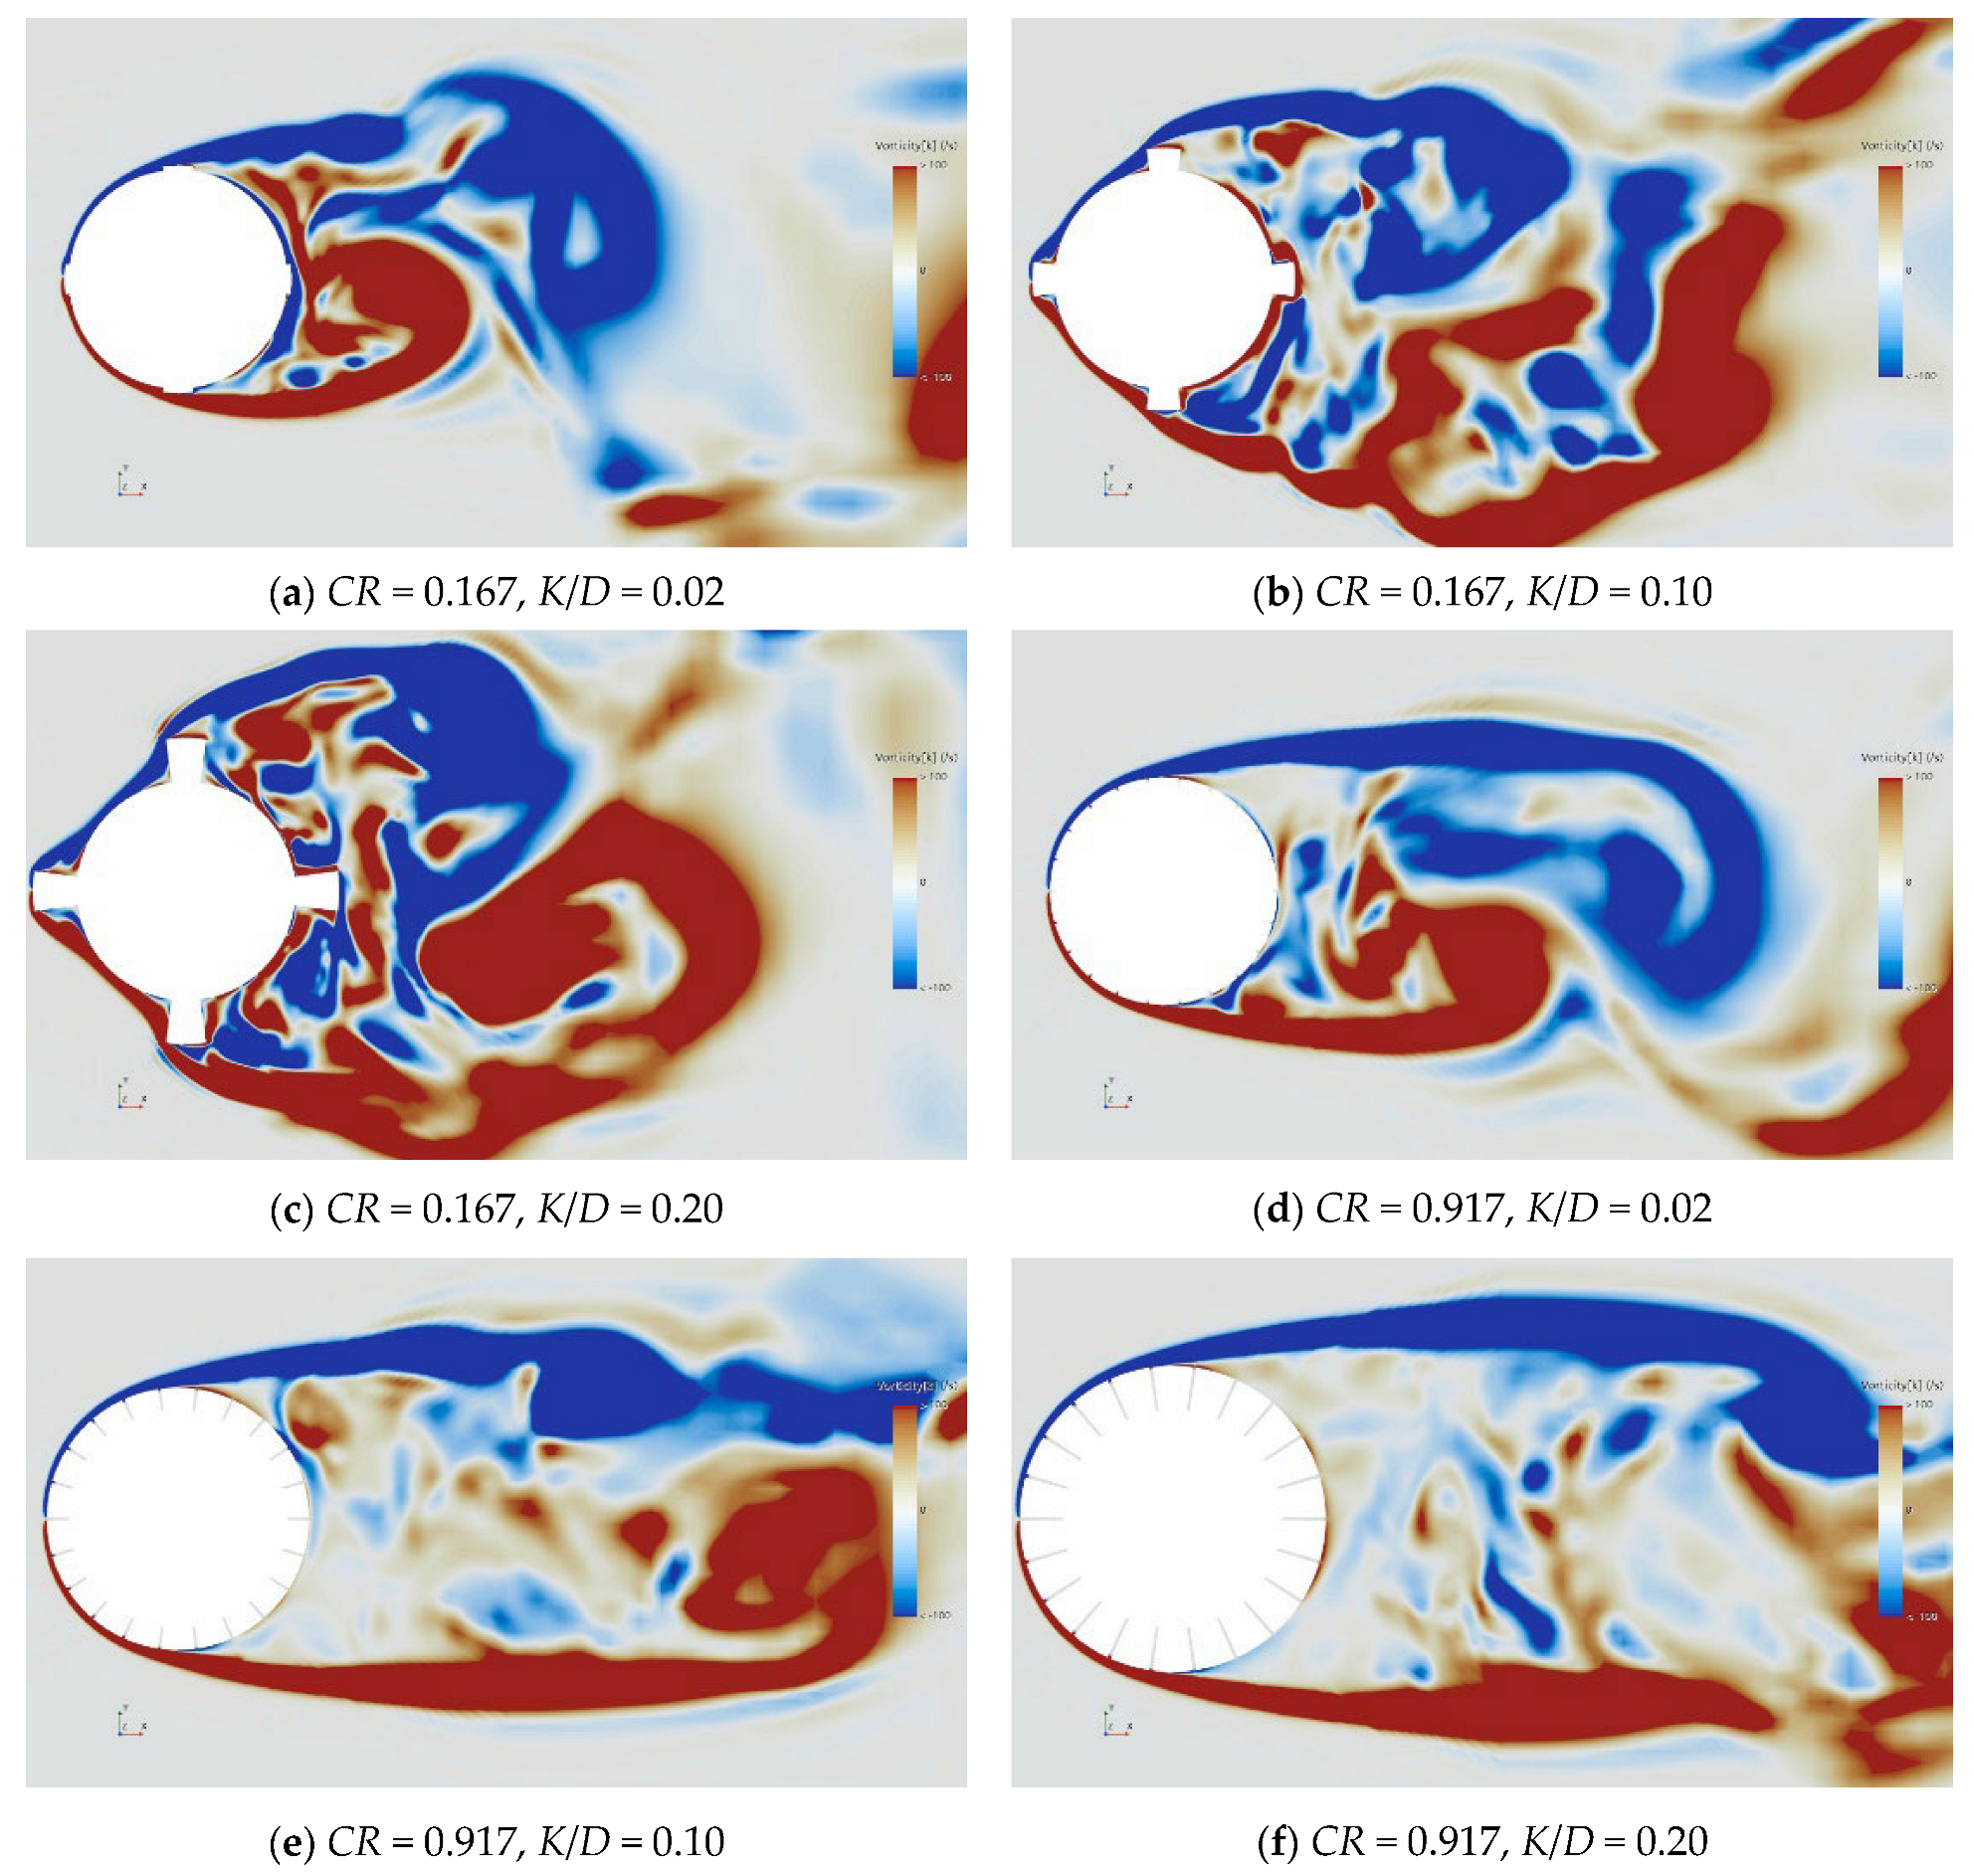
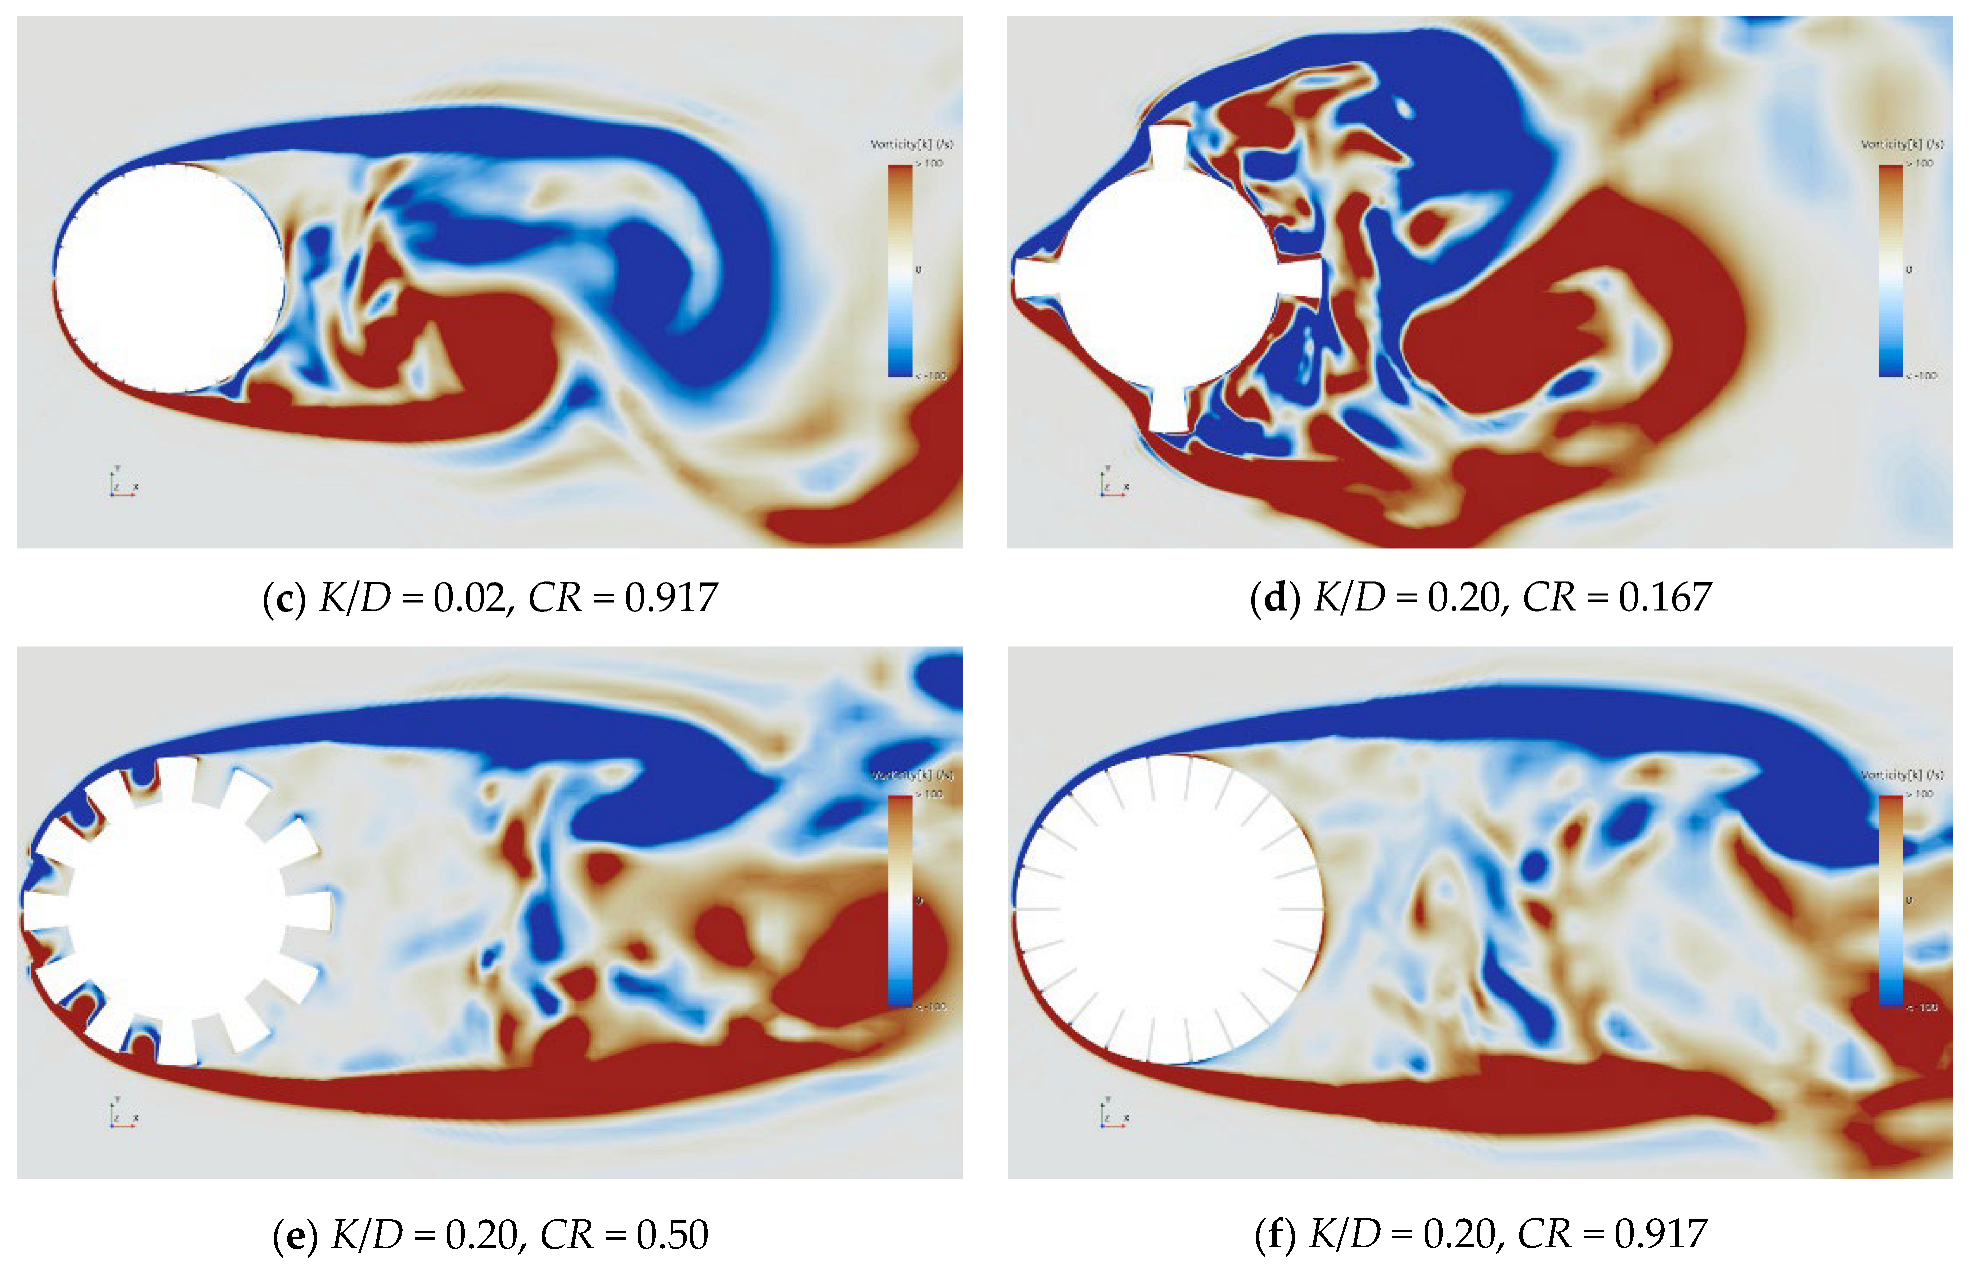
Compared to the time-averaged flow field, the instantaneous flow field can capture the dynamic characteristics and complex flow details of the flow field. Therefore, Figure 23 and Figure 24, respectively, present the instantaneous vorticity field when the CR is 0.167 and 0.917, and the K/D is 0.02, 0.10, and 0.20, as well as the instantaneous vorticity field when the K/D is 0.02 and 0.20, and the CR is 0.167, 0.50, and 0.917. It can be found that, under a lower coverage ratio (CR = 0.167), the separated shear layer becomes more unstable due to the obstruction and interference of rough elements and rolls up near the cylinder downstream. Meanwhile, secondary vortices of different scales form behind the cylinder. In addition, as K/D increases, the separating shear layer no longer develops along the streamwise direction but gradually inclines toward both sides of the cylinder. A chaotic and disordered wake region forms behind the cylinder.
However, under a higher coverage ratio (CR = 0.917), it can be found that the cross-sectional profile of the rough cylinder is closer to that of a smooth cylinder. Correspondingly, the disturbance of the flow field around the cylinder caused by the rough elements is reduced. Compared with rough cylinders with lower coverage ratios, the stable shear layer rolls up at a downstream position far from the cylinder, eventually forming alternating shedding vortices. Small-scale vortex structures are almost invisible near the wall on the back flow side of the cylinder.

4. Conclusions

This study compares the numerical simulation results of seven rough coverage ratio configurations and five relative roughness types for cylinders at a Reynolds number of 3900. The focus is on how these factors affect the hydrodynamic coefficients and wake structure of the cylinder. By identifying the critical coverage ratios and their effects on hydrodynamic characteristics, the findings reveal new insights into the fundamental mechanisms of the hydrodynamic behavior and vortex shedding of rough cylinders, providing practical guidance for enhancing engineering designs and performance in marine applications. Within the scope of this study, the main conclusions are as follows:
Compared to the relative roughness (K/D), the roughness coverage ratio (CR) has a more significant impact on the hydrodynamic coefficients of the cylinder. When the CR is less than 0.4, the mean drag coefficient ( C ¯ D ) and the standard deviations of both drag ( C ¯ D , r m s ) and lift coefficients ( C ¯ L , r m s ) are significantly higher than those of a smooth cylinder. However, when the CR exceeds 0.4, these coefficients do not change significantly and closely resemble those of a smooth cylinder. Additionally, the Strouhal number (St) decreases sharply with increasing K/D but increases gradually with increasing CR.
The flow visualization results indicate that the aforementioned effects can be attributed to the changes in the flow field around the cylinder. At a smaller roughness coverage ratio (CR < 0.4), the relative roughness (K/D) induces significant disturbances in the wake structure. Specifically, as the relative roughness (K/D) increases, the shear layer becomes more unstable, while the main vortex grows in scale and forms near the cylinder. A large number of disordered small-scale vortices are formed and interact near the downstream surface of the cylinder, resulting in significant momentum loss in the flow field. Therefore, the time-averaged drag coefficient ( C ¯ D ) increases, and the Strouhal number (St) decreases.
At a higher roughness coverage ratio (CR > 0.4), the influence of relative roughness (K/D) becomes negligible. Under these conditions, the cross-sectional profile of the rough cylinder approaches that of a smooth cylinder, resulting in a minimal impact of the flow field around the cylinder. Meanwhile, smaller scale main vortices form and expand at positions far away from the cylinder, and the pressure difference between the upstream and downstream of the cylinder is reduced compared to a cylinder with a smaller coverage ratio (CR < 0.4). Therefore, the statistics of the hydrodynamic coefficients ( C ¯ D , C ¯ D , r m s and C ¯ L , r m s ) show no significant changes and approach the values of a smooth cylinder.
Finally, it is noteworthy that the current study has certain limitations, including the focus on specific a Reynolds number and a limited range of roughness configurations. Consequently, future research could expand this work by exploring more complex roughness patterns and a broader range of Reynolds numbers, potentially combining experimental and numerical approaches to validate the findings and deepen the understanding of the underlying physical mechanisms.

Author Contributions

Conceptualization, E.Z. and S.Y.; methodology, E.Z.; software, E.Z. and S.Y.; validation, E.Z., S.Y. and H.F.; formal analysis, E.Z. and H.F.; investigation, H.F.; resources, E.Z.; data curation, S.Y.; writing—original draft preparation, E.Z. and Z.J.; writing—review and editing, Z.J. and G.T.; visualization, Z.J.; supervision, G.T. All authors have read and agreed to the published version of the manuscript.

Funding

The author Guoqiang Tang would like to acknowledge the support from the National Nature Science Foundation of China (Grant No. 52371262).

Data Availability Statement

The original contributions presented in this study are included in the article. Further inquiries can be directed to the corresponding author.

Conflicts of Interest

Erxian Zeng, Songsong Yu, and Heng Feng are employed by the Central Southern China Electric Power Design Institute Co., Ltd. of China Power Engineering Consulting Group. The remaining authors declare that the research was conducted in the absence of any commercial or financial relationships that could be construed as a potential conflict of interest.

Abbreviations

The following abbreviations are used in this manuscript:
LESLarge-Eddy Simulation
PIVParticle Image Velocimetry
RMSRoot Mean Square
CRCoverage Ratio

References

  1. Ong, L.; Wallace, J. The velocity field of the turbulent very near wake of a circular cylinder. Exp. Fluids 1996, 20, 441–453. [Google Scholar] [CrossRef]
  2. Williamson, C.H.K. Vortex dynamics in the cylinder wake. Annu. Rev. Fluid Mech. 1996, 28, 477–539. [Google Scholar] [CrossRef]
  3. Brede, M.; Eckelmann, H.; Rockwell, D. On secondary vortices in the cylinder wake. Phys. Fluids 1996, 8, 2117–2124. [Google Scholar] [CrossRef]
  4. Williamson, C.H.K. Defining a universal and continuous Strouhal–Reynolds number relationship for the laminar vortex shedding of a circular cylinder. Phys. Fluids 1988, 31, 2742–2744. [Google Scholar] [CrossRef]
  5. Catalano, P.; Wang, M.; Iaccarino, G.; Moin, P. Numerical simulation of the flow around a circular cylinder at high Reynolds numbers. Int. J. Heat Fluid Flow. 2003, 24, 463–469. [Google Scholar] [CrossRef]
  6. Ong, M.C.; Utnes, T.; Holmedal, L.E.; Myrhaug, D.; Pettersen, B. Numerical simulation of flow around a smooth circular cylinder at very high Reynolds numbers. Mar. Struct. 2009, 22, 142–153. [Google Scholar] [CrossRef]
  7. Marty, A.; Berhault, C.; Damblans, G.; Facq, J.-V.; Gaurier, B.; Germain, G.; Soulard, T.; Schoefs, F. Experimental study of hard marine growth effect on the hydrodynamical behaviour of a submarine cable. Appl. Ocean Res. 2021, 114, 102810. [Google Scholar] [CrossRef]
  8. Marty, A.; Schoefs, F.; Soulard, T.; Berhault, C.; Facq, J.-V.; Gaurier, B.; Germain, G. Effect of roughness of mussels on cylinder forces from a realistic shape modelling. J. Mar. Sci. Eng. 2021, 9, 598. [Google Scholar] [CrossRef]
  9. Nasr Esfahani, V.; Rajavarothayam, V.; Quan, K.; Hanson, R.; Lavoie, P. Effect of roughness and trips on the drag of a circular cylinder at subcritical flow. J. Wind Eng. Ind. Aerod. 2024, 253, 105847. [Google Scholar] [CrossRef]
  10. Kiu, K.Y.; Stappenbelt, B.; Thiagarajan, K.P. Effects of uniform surface roughness on vortex-induced vibration of towed vertical cylinders. J. Sound Vib. 2011, 330, 4753–4763. [Google Scholar] [CrossRef]
  11. Zhou, B.; Wang, X.; Gho, W.M.; Tan, S.K. Force and flow characteristics of a circular cylinder with uniform surface roughness at subcritical Reynolds numbers. Appl. Ocean Res. 2015, 49, 20–26. [Google Scholar] [CrossRef]
  12. Hover, F.S.; Tvedt, H.; Triantafyllou, M.S. Vortex-induced vibrations of a cylinder with tripping wires. J. Fluid Mech. 2001, 448, 175–195. [Google Scholar] [CrossRef]
  13. Fage, A.; Warsap, J.H. The Effects of Turbulence and Surface Roughness on the Drag of a Circular Cylinder. Aeronautical Research Committee. No. 1283. 1929. Available online: https://reports.aerade.cranfield.ac.uk/bitstream/handle/1826.2/1414/arc-rm-1283.pdf?sequence=1&isAllowed=y (accessed on 1 October 2025).
  14. Güven, O.; Farell, C.; Patel, V.C. Surface-roughness effects on the mean flow past circular cylinders. J. Fluid Mech. 1980, 98, 673–701. [Google Scholar] [CrossRef]
  15. Sarpkaya, T. In-Line and Transverse Forces on Smooth and Rough Cylinders in Oscillatory Flow at High Reynolds Numbers; Interim Report; Naval Postgraduate School: Monterey, CA, USA, 4 July 1986. [Google Scholar]
  16. Achenbach, E. Influence of surface roughness on the cross-flow around a circular cylinder. J. Fluid Mech. 1971, 46, 321–335. [Google Scholar] [CrossRef]
  17. Adachi, T.; Ono, H.; Matsuuchl, K.; Kawai, T.; Cho, T. Flow around a circular cylinder in the high Reynolds number range. Effect of surface roughness. Trans. JSME Part B 1989, 55, 685–692. [Google Scholar] [CrossRef]
  18. Wolfram, J.; Naghipour, M. On the estimation of Morison force coefficients and their predictive accuracy for very rough circular cylinders. Appl. Ocean Res. 1999, 21, 311–328. [Google Scholar] [CrossRef]
  19. Huang, S.; Clelland, D.; Day, S.; James, R. Drag reduction of deepwater risers by the use of helical grooves. In Proceedings of the International Conference on Offshore Mechanics and Arctic Engineering 2007, OMAE2007, San Deigo, CA, USA, 10–15 June 2007. [Google Scholar]
  20. Sun, C.; Zhou, T.; An, H.; Zhu, H.; Cheng, L. On the study of vortex-induced vibration of circular cylinders covered with different roughness. Appl. Ocean Res. 2022, 124, 103215. [Google Scholar] [CrossRef]
  21. de Moraes, P.G.; de Oliveira, M.A.; de Andrade, C.L.; Bimbato, A.M.; Pereira, L.A.A. Effects of surface roughness and wall confinement on bluff body aerodynamics at large-gap regime. J. Braz. Soc. Mech. Sci. Eng. 2021, 43, 397. [Google Scholar] [CrossRef]
  22. Suzuki, M.; Ikoma, T.; Rheem, C.; Aida, Y. Experimental investigation of roughness effect on flow field around cylinder in steady flow. In Proceedings of the ASME 2022 41st International Conference on Ocean, Offshore and Arctic Engineering, Volume 4: Ocean Space Utilization, Hamburg, Germany, 5–10 June 2022. [Google Scholar]
  23. Wang, Z.; Liu, K.; Liu, F.; Wei, H.; Liu, Q. A comprehensive numerical study of the effects of surface roughness on a finite-length cylinder with an aspect ratio of 1.5 for Reynolds numbers ranging from 3.9 × 10³ to 4.8 × 10⁵. Phys. Fluids 2024, 36, 055114. [Google Scholar] [CrossRef]
  24. Germano, M.; Piomelli, U.; Moin, P.; Cabot, W.H. A dynamic subgrid-scale eddy viscosity model. Phys. Fluids 1998, 3, 1760–1765. [Google Scholar] [CrossRef]
  25. Addad, Y.; Gaitonde, U.; Laurence, D.; Rolfo, S. Optimal unstructured meshing for large eddy simulations. In Quality & Reliability of Large Eddy Simulations; Springer: Dordrecht, The Netherlands, 2008; pp. 93–103. [Google Scholar]
  26. Vreman, B.; Geurts, B.; Kuerten, H. Realizability conditions for the turbulent stress tensor in large-eddy simulation. J. Fluid Mech. 1994, 278, 351–362. [Google Scholar] [CrossRef]
  27. Balaras, E.; Benocci, C.; Piomelli, U. Two-layer approximate boundary conditions for large-eddy simulations. AIAA J. 2012, 34, 1111–1119. [Google Scholar] [CrossRef]
  28. Kravchenko, A.G.; Moin, P. Numerical studies of flow over a circular cylinder at ReD = 3900. Phys. Fluids 2000, 12, 403–417. [Google Scholar] [CrossRef]
  29. Lysenko, D.A.; Ertesvåg, I.S.; Rian, K.E. Large-Eddy Simulation of the Flow Over a Circular Cylinder at Reynolds Number 3900 Using the OpenFOAM Toolbox. Flow Turbul. Combust. 2012, 89, 491–518. [Google Scholar] [CrossRef]
  30. Khan, N.B.; Ibrahim, Z.; Badry, A.B.B.M.; Jameel, M.; Javed, M.F. Numerical investigation of flow around cylinder at Reynolds number = 3900 with large eddy simulation technique: Effect of spanwise length and mesh resolution. Proc. Inst. Mech. Eng. Part M J. Eng. Marit. Environ. 2018, 233, 417–427. [Google Scholar] [CrossRef]
  31. Wornom, S.; Ouvrard, H.; Salvetti, M.V.; Koobus, B.; Dervieux, A. Variational multiscale large-eddy simulations of the flow past a circular cylinder: Reynolds number effects. Comput. Fluids 2011, 47, 44–50. [Google Scholar] [CrossRef]
  32. Ouvrard, H.; Koobus, B.; Dervieux, A.; Salvetti, M.V. Classical and variational multiscale LES of the flow around a circular cylinder on unstructured grids. Comput. Fluids 2010, 39, 1083–1094. [Google Scholar] [CrossRef]
  33. Dong, S.; Karniadakis, G.E.; Ekmekci, A.; Rockwell, D. A combined direct numerical simulation–particle image velocimetry study of the turbulent near wake. J. Fluid Mech. 2006, 569, 185–207. [Google Scholar] [CrossRef]
  34. Parnaudeau, P.; Carlier, J.; Heitz, D.; Lamballais, E. Experimental and numerical studies of the flow over a circular cylinder at Reynolds number 3900. Phys. Fluids 2008, 20, 085101. [Google Scholar] [CrossRef]
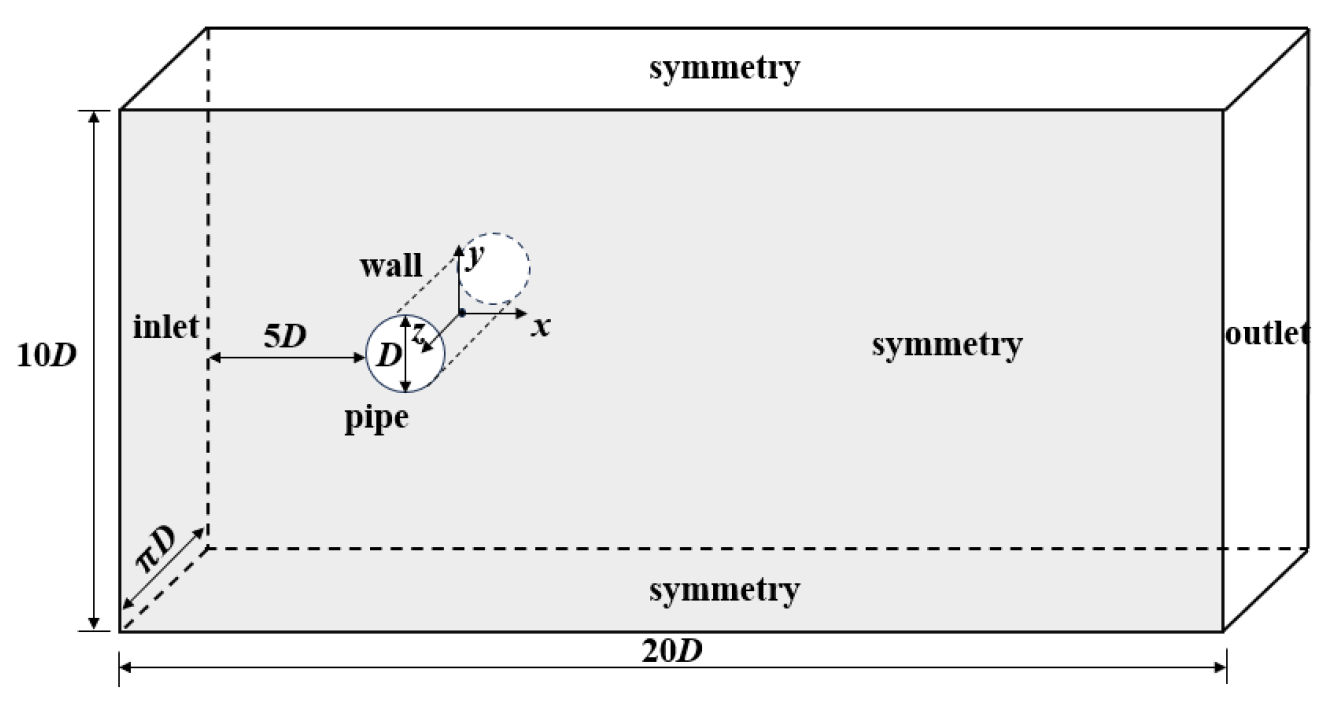
Figure 1. Computational domain for flow around a cylinder.
Jmse 13 02075 g001
Figure 2. The sketch of computational domain mesh. (a) The mesh division of the entire computational domain. (b) The mesh division around the cylinder.
Jmse 13 02075 g002
Figure 3. The characteristic locations near the cylinder and streamwise mean velocity on the center line. (a) Characteristic position of cylindrical wake region. (b) Time averaged velocity distribution in the x-direction on y/D = 0 [34].
Jmse 13 02075 g003
Figure 4. Profiles of streamwise and cross-flow time-averaged velocity distribution at x/D = 1.06 [34].
Jmse 13 02075 g004
Figure 5. Profiles of streamwise and cross-flow time-averaged velocity distribution at x/D = 1.54 [34].
Jmse 13 02075 g005
Figure 6. Profiles of streamwise and cross-flow time-averaged velocity distribution at x/D = 2.02 [34].
Jmse 13 02075 g006
Figure 7. The sketch of the rough cylinder.
Jmse 13 02075 g007
Figure 8. Variations in the mean drag coefficient for different relative roughness and coverage ratio. (a) The dependency relationship between C ¯ D and K/D. (b) The dependency relationship between C ¯ D and CR.
Jmse 13 02075 g008
Figure 9. The ratio of C ¯ D P to C ¯ D for different relative roughness and coverage ratios. (a) The dependency relationship between C ¯ D p / C ¯ D and K/D. (b) The dependency relationship between C ¯ D p / C ¯ D and CR.
Jmse 13 02075 g009
Figure 10. The ratio of C ¯ D s to C ¯ D for different relative roughness and coverage ratios. (a) The dependency relationship between C ¯ D s / C ¯ D and K/D. (b) The dependency relationship between C ¯ D s / C ¯ D and CR.
Jmse 13 02075 g010
Figure 11. The distribution of pressure coefficient on the surface of cylinder at different K/D ratios for CR values of 0.167 and 0.917.
Jmse 13 02075 g011
Figure 12. The distribution of pressure coefficient on the surface of the cylinder at different CR for K/D ratio values of 0.02 and 0.20.
Jmse 13 02075 g012
Figure 13. Variations in the root–mean–square drag coefficient for different relative roughness and coverage ratios. (a) The dependency relationship between C ¯ D , r m s and K/D. (b) The dependency relationship between C ¯ D , r m s and CR.
Jmse 13 02075 g013
Figure 14. Variations in the root–mean–square lift coefficient for different relative roughness and coverage ratios. (a) The dependency relationship between C ¯ L , r m s and K/D. (b) The dependency relationship between C ¯ L , r m s and CR.
Jmse 13 02075 g014
Figure 15. Variations in the Strouhal number for different relative roughness and coverage ratios. (a) The dependency relationship between St and K/D. (b) The dependency relationship between St and CR.
Jmse 13 02075 g015
Figure 16. Profiles of streamline mean velocity at three different x/D positions behind the cylinder for CR values of 0.167 and 0.917.
Jmse 13 02075 g016aJmse 13 02075 g016b
Figure 17. Profiles of cross-flow mean velocity at three different x/D positions behind the cylinder for CR values of 0.167 and 0.917.
Jmse 13 02075 g017aJmse 13 02075 g017b
Figure 18. Profiles of streamline mean velocity at three different x/D positions behind the cylinder for K/D ratios of 0.02 and 0.20.
Jmse 13 02075 g018aJmse 13 02075 g018b
Figure 19. Profiles of cross-flow mean velocity at three different x/D positions behind the cylinder for K/D ratios of 0.02 and 0.20.
Jmse 13 02075 g019aJmse 13 02075 g019b
Figure 20. Sketch of the recirculation zone.
Jmse 13 02075 g020
Figure 21. Contours of time-averaged streamlines and vorticity for K/D ratios of 0.02, 0.10, and 0.20 at CR values of 0.167 and 0.917.
Jmse 13 02075 g021aJmse 13 02075 g021b
Figure 22. Contours of time-averaged streamlines and vorticity for CR values of 0.167, 0.50, and 0.917 at K/D ratios of 0.02 and 0.20.
Jmse 13 02075 g022aJmse 13 02075 g022b
Figure 23. Contours of instantaneous vorticity for K/D ratios of 0.02, 0.10, and 0.20 at CR values of 0.167 and 0.917.
Jmse 13 02075 g023
Figure 24. Contours of instantaneous vorticity for CR values of 0.167, 0.50, and 0.917 at K/D ratios of 0.02 and 0.20.
Jmse 13 02075 g024aJmse 13 02075 g024b
Table 1. Different grid node case parameters.
CaseGrid Node
( θ × z × r )
C ¯ D C ¯ L , r m s St
A1 200   ×   30   × 601.0520.0700.228
A2 200   ×   40   ×  601.0610.0840.228
A3 200   ×   50   ×  601.0540.0780.228
B1 240   ×   30   ×  601.0640.0900.226
B2 280   ×   30   × 601.0380.0550.226
B3 320   ×   30   × 601.0430.0640.226
C2 280   ×   30   × 701.0310.0570.223
C3 280   ×   30   × 801.0420.0590.223
Table 2. Different time step cases parameters.
CaseTime Step C ¯ D C ¯ L , r m s St
D10.011.0370.0620.216
D20.0051.0310.0570.223
D30.0021.0340.0880.216
Table 3. Comparison of calculation results.
Numerical Model C ¯ D C ¯ L , r m s St
Wornom et al. [31]LES0.990.1080.21
Ouvrard et al. [32]LES0.92–1.020.051–0.2190.218–0.228
Previous experimental values [1,28,33,34]-0.94–1.04-0.20–0.22
The present studyLES1.0340.0880.216
Disclaimer/Publisher’s Note: The statements, opinions and data contained in all publications are solely those of the individual author(s) and contributor(s) and not of MDPI and/or the editor(s). MDPI and/or the editor(s) disclaim responsibility for any injury to people or property resulting from any ideas, methods, instructions or products referred to in the content.