Article

Multiscale Numerical Modeling of Wave Overtopping for Pedestrian Hazard Classification and Risk Assessment

Marine Information Technology Inc., Seoul 08592, Republic of Korea
*
Author to whom correspondence should be addressed.
J. Mar. Sci. Eng. 2025, 13(10), 2022; https://doi.org/10.3390/jmse13102022
Submission received: 11 September 2025 / Revised: 15 October 2025 / Accepted: 20 October 2025 / Published: 21 October 2025

Abstract

The risk of wave overtopping is amplifying under sea-level rise and increased frequency of extreme coastal events. Conventional empirical and physical methods for estimating overtopping characteristics are limited by site-specific assumptions, which underscores the need for robust and efficient approaches. This study develops a multiscale numerical modeling framework that couples the regional ADCIRC–UnSWAN (Advanced CIRCulation and Unstructured Simulating WAves Near-shore) model with DualSPHysics (SPH) model to simulate overtopping responses under varying sea states. ADCIRC-UnSWAN provides regional-scale hydrodynamic and wave forcing, which is nested into localized SPH model to resolve wave-structure interactions. The proposed framework accurately reproduces overtopping responses including water thickness and velocity while leveraging GPU acceleration for computational efficiency. The model outputs are further analyzed to classify overtopping hazard levels and perform probabilistic pedestrian risk as sessments that account for uncertainties in wave characteristics and human vulnerability. The results supports the development of early warning systems and provide a foundation for dynamic hazard level updates in real or near-real time, contributing to improved coastal risk governance under uncertainties.

1. Introduction

Gradual sea-level rise, together with the increasing frequency and intensity of extreme coastal events, poses a growing challenge to the resilience of coastal infrastructure and the safety of communities. Recent studies have reported that globally aggregated annual overtopping hours have increased by nearly 50% over the last two decades [1]. Considering gradual sea-level rise, the frequency of overtopping events is expected to increase, thereby exacerbating coastal flooding hazards and increasing risks to coastal facilities and the public. In addition to potential injuries and fatalities, overtopping events can cause erosion, deposition, and significant economic losses [2].
To mitigate such risks, the development of overtopping hazard maps and the implementation of early warning systems (EWS) are essential. Quantification of overtopping hazard and risk alongshore can be conducted through multiple approaches, including physics-based and empirical modeling, deep learning, coastal video monitoring, and hybrid techniques. However, empirical formulations face significant limitations due to underlying assumptions and site specific conditions affecting their generalizability and accuracy of application for all coastal environments [3]. Due to differences in calculating the mean overtopping discharge through various methods, a unified approach to quantify overtopping impacts on pedestrians and coastal facilities is lacking [4]. Furthermore, the use of empirical based overtopping discharges have validation challenges when applied under different wave, structure, and bathymetric conditions. The alternative is physical modeling, which, under most circumstances require significant resources as well as time if the modeling results are intended for replicating field scale conditions, making them less suitable for iterative design or scenario testing [5].
Numerical models offer a relatively economical, faster, and reliable solution to the challenges mentioned for empirical and physical models. Moreover, the availability of robust open-source numerical models and open-access field data has, to a large degree, addressed the challenges of validating numerical simulations. This study adopts a multi-scale modeling approach by coupling regional hydrodynamic and wave models with high-resolution local models. We used tightly coupled Advanced CIRCulation (ADCIRC) [6,7] and Unstructured Simulating WAves Near-shore (UnSWAN) [8,9] models to simulate regional-scale wave-current interactions. The ADCIRC model is responsible for passing hydrodynamic parameters and wind characteristics to UnSWAN, which in turn feeds radiation stress gradients to ADCIRC. Although the coupled ADCIRC-UnSWAN model has been widely used and validated for investigating nearshore wave phenomenon for coastal hazards [10,11,12], it lacks the ability to resolve local phenomenon such as wave-structure interaction involving wave overtopping. It is a common practice to use high-resolution local models such as XBeach (eXtreme Beach) [13], SWASH (Simulating WAves till SHore) [14], and SPH (Smoothed Particle Hydrodynamics) [15], among others, to simulate detailed wave processes (run-up, run-down, transformation, breaking, shoaling, overtopping, etc.) at coastal structures. These localized models are often nested within regional models (such as coupled ADCIRC-UnSWAN model in this study) utilizing wave properties from regional models to simulate local wave transformation processes [16,17].
This study employs DualSPHysics [18], an SPH model capable of simulating wave interaction with coastal structures with acceptable level of accuracy and computational efficiency. DualSPHysics (hereafter called DSPH) achieves computational efficiency by utilizing much smaller domain than typically required for regional or other localized models in addition to leveraging Graphics Processing Units (GPUs) acceleration. DSPH has been validated by several studies for its accuracy on simulating overtopping events [12,19,20]. A comparison between mesh-based and SPH method for wave transformation over steeped-slope dikes demonstrated similar levels of performance with enhanced computational efficiency for SPH models [5].
The novelty of this study lies in assessing overtopping hazards by performing probabilistic overtopping derived from realistic site-specific high-resolution numerical model simulations, rather than from laboratory experiments. While previous studies have classified overtopping hazard and pedestrian overtopping risks based on flow depth and velocity, many of these relied on controlled physical model data [3,21,22,23]. In contrast, the multiscale modeling framework of this study allows to obtain overtopping responses that reflect realistic wave–structure interactions at a site-specific breakwater under varying sea states. These results are then used to conduct a probabilistic pedestrian risk analysis and hazard classification, accounting for uncertainty in wave forcing, structure conditions, and human vulnerability factors highlighted by [23]. The results enhance the operational relevance of overtopping hazard classification and pedestrian risk assessments. The resulting framework supports the development of data-informed early warning systems and provides a foundation for dynamic hazard level updates in real-time or near-real-time contexts. This integration is vital for enabling evidence-based emergency response strategies and informing coastal risk governance under increasing climate-induced hazards.
The objectives of this study are: (1) to model overtopping responses through a validated, site-specific, multi-scale coupled regional-local numerical framework, and (2) to translate those responses into classifying overtopping hazard and developing probabilistic risk framework for assessing pedestrian-level overtopping hazard.

2. Numerical Modeling

2.1. ADCIRC-UnSWAN Model

The ADCIRC-UnSWAN model was run in a parallel mode on unstructured triangular mesh. The computational domain, shown in Figure 1, covered Yellow Sea, East China Sea, Korea strait, East Sea/Sea of Japan, and Pacific Ocean (outer boundary of domain). The domain consisted of 1,888,531 nodes and 978,776 triangular elements. For ADCIRC model, eight tidal constituents including M2, S2, K1, O1, N2, K2, P1, and Q1 were enforced on the ocean boundary for tidal forcing. The wind input data for the ADCIRC model was obtained from KMA (Korea Meteorological Administration). The UnSWAN model was simulated in non-stationary mode and the data exchange between ADCIRC and UnSWAN model was set to 20 minutes. Further details about the model settings can be found in a related study by Mun et al. [24].
The ADCIRC-UnSWAN model was simulated for typhoons and strong wind conditions, observed in the study area (Samcheok port) between January 2013 and December 2022. In this study, strong wind events at Samcheok Port corresponded to significant wave heights of approximately 6–8 m, while typhoon events reached up to 12.5 m, based on ADCIRC–UnSWAN hindcasts for 2013–2022. The term “strong wind events” is used here instead of “storms” to distinguish these non-typhoon, high-wave conditions from typhoon-induced storm events. At Samcheok port, the typhoon period typically lasts from August to October, while the strong wind events are dominant between November and January each year. To validate the model, the hindcasts were performed for all the typhoons and strong wind events during the study period. For demonstration purpose, Figure 2a,b present the significant wave height observed for most extreme cases for strong wind and typhoon conditions, respectively, for comparisons between predicted and observed significant wave height at Samcheok buoy (37°24′00.0″ N, 129°14′05.2″ E). After validation, the wave period and wave height obtained from the coupled ADCIRC-UnSWAN model were subsequently used as boundary conditions in the DSPH model after scaling down.

2.2. DualSPHysics Model Simulation

The numerical experiments were conducted with DSPH v5.2 CFD solver capable of modeling wave breaking, wave interaction with coastal structures, and overtopping [12,19,25]. A total of 112 cases were simulated in DSPH by varying wave characteristics and freeboard to measure wave overtopping responses including its depth and velocity. The experimental analysis considered wave periods from 2 to 5 s in increments of 0.5 s, with wave heights between 0.10 and 0.25 m (0.05 m step). Freeboard varied from 0.0 to 0.375 m (0.125 m step), and the water depth was fixed at 0.66 m. These prototype conditions were derived from a 10-year ADCIRC-UnSWAN hindcast dataset (2013–2022), from which the extreme value analysis of significant wave heights and periods identified design conditions corresponding to a 50-year return period. These statistical results were used to define the upper and lower bounds of the simulated wave parameters, ensuring that the numerical experiments captured the range of storm and typhoon events typically observed at Samcheok Port. These prototype values correspond to Froude scaling of approximately 1:40. The prototype wave heights, obtained from coupled ADCIRC-UnSWAN mode, were in the range of 6~12.5 m based on severe storm events from 2013 to 2022. This geometric scale gives prototype wave heights of 4~10 m, which is sufficient to represent the majority of peak events that ranged between 6~10 m.
The experiments were performed in numerical flume 10 m in length with a piston at the left boundary for wave generation. The flume shown in Figure 3, carries a tank on the right boundary to measure volume of water collected during overtopping. Similar to wave characteristics, the flume was modeled following the typical breakwater geometry at Samcheok Port, South Korea. Ten gauges were fixed at breakwater crest to measure overtopping depth and velocity along crest’s length. The crest elevation across the ten gauges was same. A wave gauge (WG) was fixed within the flume at 4 m from the left boundary to record time series of wave elevations.
The simulations were performed on a high-performance workstation with Windows 11 Pro 64-bit OS, a 13th Gen Intel® Core™ i9-13900K 3.00GHz CPU (Intel Corporation, Santa Clara, CA, USA), 128 GB of RAM, and an NVIDIA GeForce RTX 4090 GPU (NVIDIA Corporation, Santa Clara, CA, USA). The inter-particle distance (dp) of 0.01 m was used in all experiments. Except for coefficient (coefh) for smoothing length calculation, which was set as 1.2, all the model’s constants were defined with default values. The incident waves were generated with a piston-type wave maker with second-order wave theory and imposition of dynamic boundary conditions [26] at the wave generator boundary. The wave reflection boundary was minimized with AWAS (Active Wave Absorption System) that was activated five seconds after wave generation started. Ramping was applied over a single wave period for smoothing the piston movement. A default Wendland smoothing kernel was selected. In this study, an artificial viscosity factor of 0.01 is adopted, which is reported in previous studies to yield accurate simulations for both wave propagation and wave-structure interaction scenarios [27,28]. The total simulation time was varied in each case to accommodate generation of 500 ~ 1000 waves for waves with different periods. A fixed CFL number of 0.4 was used in all the experiments. The time integration was performed with Symplectic algorithm. A summary of main input parameters’ values is listed in Table 1; default values were selected for input parameters not listed in Table 1.
For demonstration purposes, the time series of water surface elevation by the DSPH model at WG1 is shown in Figure 4 for Case#53 that reported overtopping. The significant wave height, time period, relative freeboard for this case were 0.1 m, 5 s, and 0.125, respectively. The figure shows that water surface elevation at WG1 becomes stable at around 60 s; furthermore, the application of AWAS reduces the wave reflection at the wave boundary effectively. Figure 5 shows the velocity distribution along the breakwater crest. Although the crest is only 1 m long, Figure 5 shows significant differences in velocity distribution/variation across stations. The seaward stations (1 and 2) show continued variations in velocity throughout the simulation period, while the following stations demonstrate diminishing velocity that can be attributed to spreading of wave as they move inward as well losing the energy. The velocity fluctuations between positive and negative across all the stations show the scale of non-linearity the of velocity distribution due to overtopping. Finally, Figure 6 shows the overtopping thickness at stations 1, 3, 5, and 7. The overall thickness decreases away from the seaward edge with station 1 recording overtopping throughout the simulation duration while the following stations show reduced thickness as well early stop to overtopping occurrences.
Since overtopping thickness and velocity were not directly measured at Samcheok Port, the DSPH output for overtopping discharge was verified against empirical overtopping discharges reported in EurOtop manual [29]. Equations (1) and (2) show overtopping discharge equations valid for high freeboards and for very low or zero freeboards, respectively.
q g H m 0 3 = a exp b R c H m 0
q g H m 0 3 = a exp b R c H m 0 c for R c 0
where q, g, Hm0, and Rc are overtopping discharge, gravitational acceleration, significant wave height, and freeboard, respectively; while a and b are the coefficients obtained from best-fit line.
The DSPH experiments reported in this study cases involved both low and zero freeboard, therefore, we analyze overtopping discharge with both Equations (1) and (2) to find values of coefficients a, b, and c and verify them with those reported in literature. These exponents are the result of fitting to data; the differences have no basis in any analytical framework or in physical reasoning [30].
Considering the insignificant difference in coefficient values of a and b obtained by Equations (1) and (2), both equations are equally suitable to find overtopping discharge for test cases considered in this analysis. The best fit line shown in Figure 7a,b for Equations (1) and (2), respectively, follows the trend of the data points reasonably well, especially in the lower range of relative freeboard. However, there are some deviations in the higher range where the data points are more scattered, which is consistent with the observations of previous studies listed in Table 2. The fitted curve also follows the general trend of the data points but may capture the variability in the higher range slightly better due to the additional coefficient c for zero or low freeboards. Table 2 shows the comparisons of coefficients estimated in this study with literature.
Over 80% of the cases simulated with DSPH were found to be non-impulsive (please refer to the Supplementary Data), which was confirmed by computing discriminating parameter given by Equation (3)
h * = 1.3 h H m 0 2 π h g T m 1 , 0 2
where h * is measure of impulsiveness, Tm-1,0 is wave period that varied in increments of 0.5 s from 2 to 5 s, and h is water depth. Given the non-impulsive nature of incident waves, the exponential form (Equations (1) and (2)) are suitable for finding overtopping discharge for DSPH predictions. The coefficients listed in Table 2 for previous studies are applicable under non-impulsive waves for vertical walls or steep structures. The variations in the coefficients values is documented in EurOtop manual [29] because of empirical nature of the overtopping discharge formulae that is affected by relative freeboard, structure, and wave characteristics. The coefficients in this study are lower than those proposed in earlier works listed in Table 2. The reduction in a and b results in systematically lower overtopping discharges, while the smaller exponent c decreases the sensitivity of predicted discharges to relative freeboard. Importantly, these differences remain within the expected uncertainty range of overtopping prediction, where confidence bands typically span factors of 2.5–20 [29]. Therefore, while the present coefficients reflect site and condition-specific calibration, the overall predictive reliability is consistent with established overtopping models.

3. Hazard and Risk Assessment

3.1. Overtopping Hazard Rating

In order to evaluate the pedestrian safety implications due to overtopping flows, this study adopts the hazard rating system originally developed by DEFRA (Department for Environment, Food, and Rural Affairs, UK) [33]. The formulation links flow depth (D) and velocity (V) through following empirical equation
HR (hazard rating) = D (V + 0.5)
The hazard rating equation relates human stability with overtopping responses including depth and velocity providing a practical measure of human exposure to hazardous flow conditions. For the present experiments, representative values of overtopping responses, exceeded by 2% of the incident waves, were obtained from DSPH simulations. Thickness and velocity of overtopping water were measured at the initiation of seaward edge of breakwater crest. Among the 112 modeled wave conditions in DSPH, overtopping was observed in 63 cases. The Hazard Index (HR) in this study was derived from the overtopping flow thickness and velocity measured at the breakwater crest in the DSPH experiments. The crest freeboard was defined relative to the still water level, and sea-level rise effects were not included, as they were beyond the scope of this study. These data form the basis for assigning hazard categories to different hydraulic conditions. Thresholds reported in previous investigations [12,33] were used to classify hazard severity into four levels, ranging from cautionary to extreme as shown in Table 3. The distinction between severity levels is based to highlight the effect of individual characteristics (mass and height) in defining the degree of flood hazard.
Figure 8 presents the distribution of hazard categories derived from all 63 DSPH cases that resulted in overtopping. The distribution of overtopping cases across the four hazard categories, shown in Figure 8, indicates that the majority of events (76.2%) fall within the HR2 class, which corresponds to moderate hazard levels. A smaller fraction of cases (19.0%) reached HR3, signifying conditions dangerous for most adults, while only 4.8% of cases were classified as HR1. Notably, no events exceeded the HR4 threshold (HR ≥ 2.5) that represents extreme hazard. This distribution suggests that although extreme hazard conditions were absent in the present dataset, a substantial portion of overtopping cases still posed risks beyond cautionary levels, emphasizing the relevance of HR2–HR3 conditions in evaluating pedestrian safety at breakwaters.

3.2. Risk Analysis for Pedestrians

While the hazard index provides a useful hydraulic classification, translating these thresholds into actual pedestrian risk requires considering body size and stability parameters, which is discussed in this section. This section performs a risk assessment for individuals positioned at the breakwater crest by considering two demographic groups: children aged 2–10 years and adults aged 24–34 years. Subject characteristics are adapted from previously established anthropometric datasets of Korean standard physical body models used in overtopping impact stability analysis [21]. The details of the test subjects are presented in the Table 4. For each subject, instability due to overtopping was quantified using a curve-fitting approach, expressed as
D (V + 0.5) = α (Instability)
where α represents the instability coefficient for tiptoe lifting and slipping/tumbling responses. The resulting coefficients provide a means of linking hydraulic forcing with pedestrian vulnerability. Figure 9 shows the bar chart to distinguish between tiptoe lifting and slipping/tumbling responses, enabling direct comparison across individuals. As expected, instability coefficients (α) were consistently larger for adults (A1-A6) than for children (C1-C3). It is obvious that greater body size (height and mass) requires stronger overtopping conditions before instability is initiated.
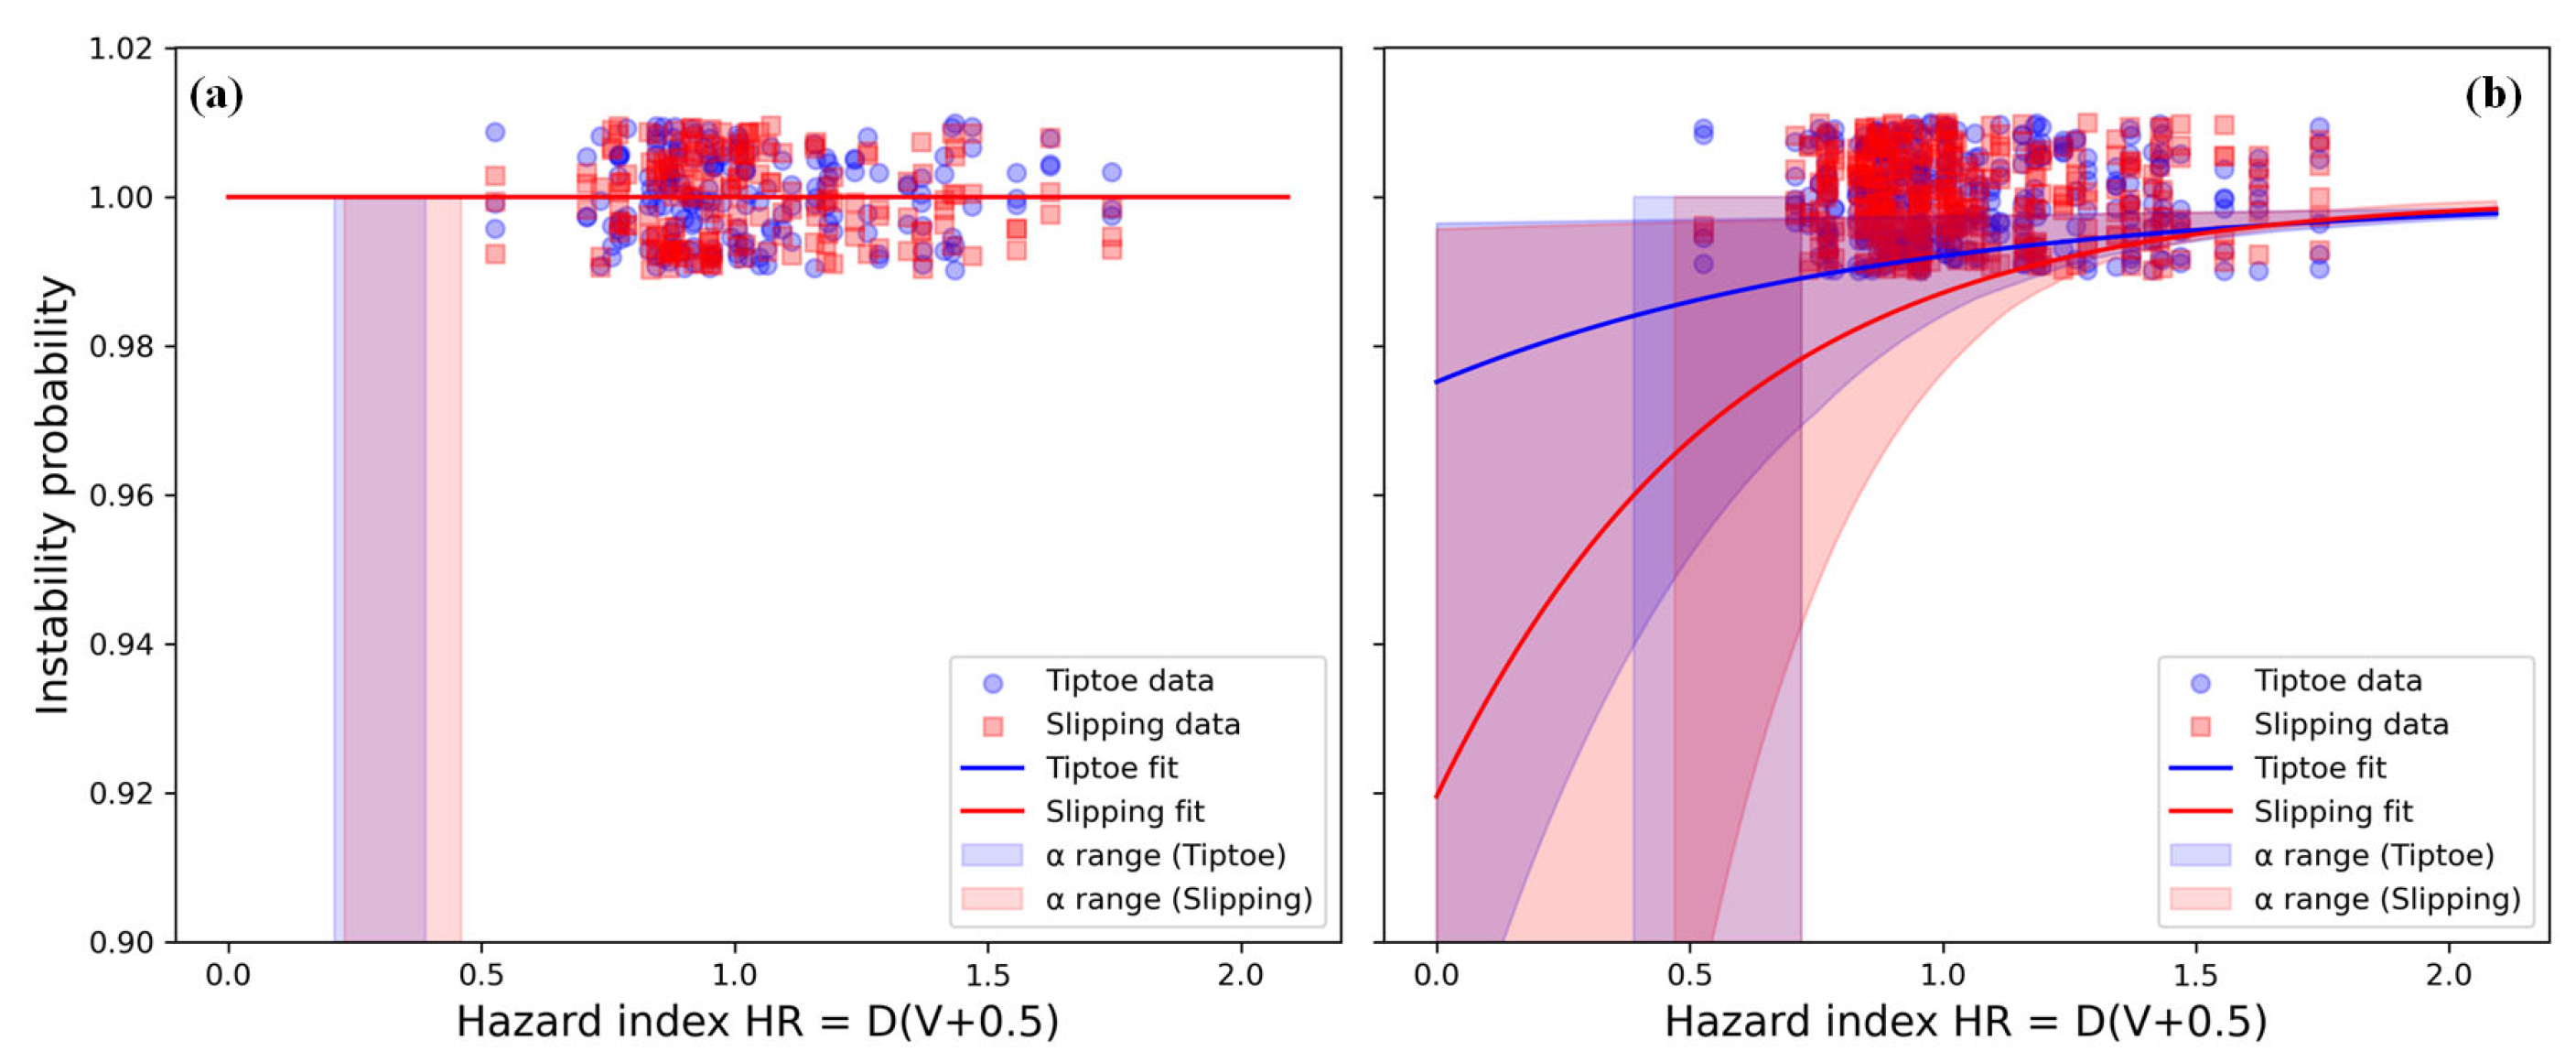
Figure 10 presents the instability probability for children and adults as a function of the hazard index. Scatter points correspond to reconstructed instability outcomes for each overtopping case, where blue circles denote tiptoe lifting responses and red squares denote slipping/tumbling responses. The solid blue and red curves represent logistic regression fits, with shaded envelopes indicating the 95% confidence intervals. In addition to showing the full probability range (0–1) in Figure 10, a zoomed-in version (0.9–1.0) is also provided in Figure 11 to highlight differences between groups and instability modes that would otherwise be obscured, since most observed outcomes lie close to 1.0. Some markers in Figure 11 appear slightly above the theoretical probability limit of 1.0, which is due to applying a small vertical jitter to the binary outcomes (0 = stable, 1 = unstable) in order to show the density of observations. The jitter improves visibility of overlapping data points, but does not affect the fitted logistic regression curves or the interpretation of probabilities.
Vertical shaded bands illustrate the ranges of subject-specific instability thresholds (α), derived from Table 4 and presented in Figure 10 and Figure 11. Blue bands indicate the variability in tiptoe lifting thresholds, while red bands indicate the variability in slipping/tumbling thresholds. These bands capture the spread of α values across individuals (C1–C3 for children, A1–A6 for adults). Figure 10a, for children, shows all instability outcomes are equal to 1, resulting in a probability of instability of nearly unity across the entire HR range. The shaded α bands confirm that even the lowest HR values in the experiments exceeded the subject-specific thresholds, making children consistently unstable under overtopping flows. In contrast, Figure 10b, for adults, show a transition from stable to unstable conditions. Logistic regression curves capture this gradual increase, with instability probability rising steeply around HR ≈ 0.5–0.7. The shaded α bands show that thresholds vary between individuals, but most adult subjects reach instability before HR = 1.0. This highlights the higher resilience of adults compared to children, but also shows that instability is still likely at relatively modest hazard index values.

3.3. Probabilistic Risk Assessment for Pedestrians

Section 3.2 treats the instability threshold as a fixed value and does not account for variability in pedestrian characteristics (age, clothing, shoes, orientation, and ground conditions) or overtopping responses [12]. To address this limitation and enhance reliability of risk quantification, a probabilistic framework is introduced in this section. Instead of relying solely on deterministic thresholds, the framework incorporates uncertainties in body dimensions, frictional resistance, and overtopping flow conditions by modeling instability indices as probability distributions. This approach provides an expanded evaluation of hazard likelihood addressing the inherent uncertainties in wave and pedestrian features.
The common failure mechanisms encountered at breakwaters during overtopping events, sliding and overturning, discussed in previous section, were selected as indicators of instability. Their formulations follow the methodology of Cao et al. [23] and are expressed as
I 1 = F D F f = F D μ s W B
I 2 = M D M s = F D h D W B
where FD, Ff, μ s , W, B, MD, Ms, and h present drag forces, friction force, body weight, buoyant force, drag moment, friction moment, and half of overtopping depth, respectively. The sliding (I1) is treated as the primary critical instability parameter (Ic) while overturning (I2) provides a complementary measure. Ic is treated as a random variable (Is). Instability probability is obtained by converting I1 into a probabilistic variable and integrating over its distribution
P i n s = P I c < I s = p α k < l n I s = 0.5 1 + erf 2.0 l n I s
where α k is the probability density function of the logarithm of the sliding index. The distribution of α k was derived from DSPH simulation results.
Using this PDF, the probability of sliding instability (Pins) was computed for various threshold values of Is. Table 5 compares the results with those of Cao et al. [23]. A notable difference is observed at low values of Is, where the present study predicts substantially higher probabilities. This is attributed to the inclusion of children (aged 2–10 years) in the dataset, who are more susceptible to overtopping-induced sliding. For larger Is (>1), the probabilities converge with the reference study, suggesting that once overtopping forces are sufficiently strong, instability risk is uniformly high regardless of body size.
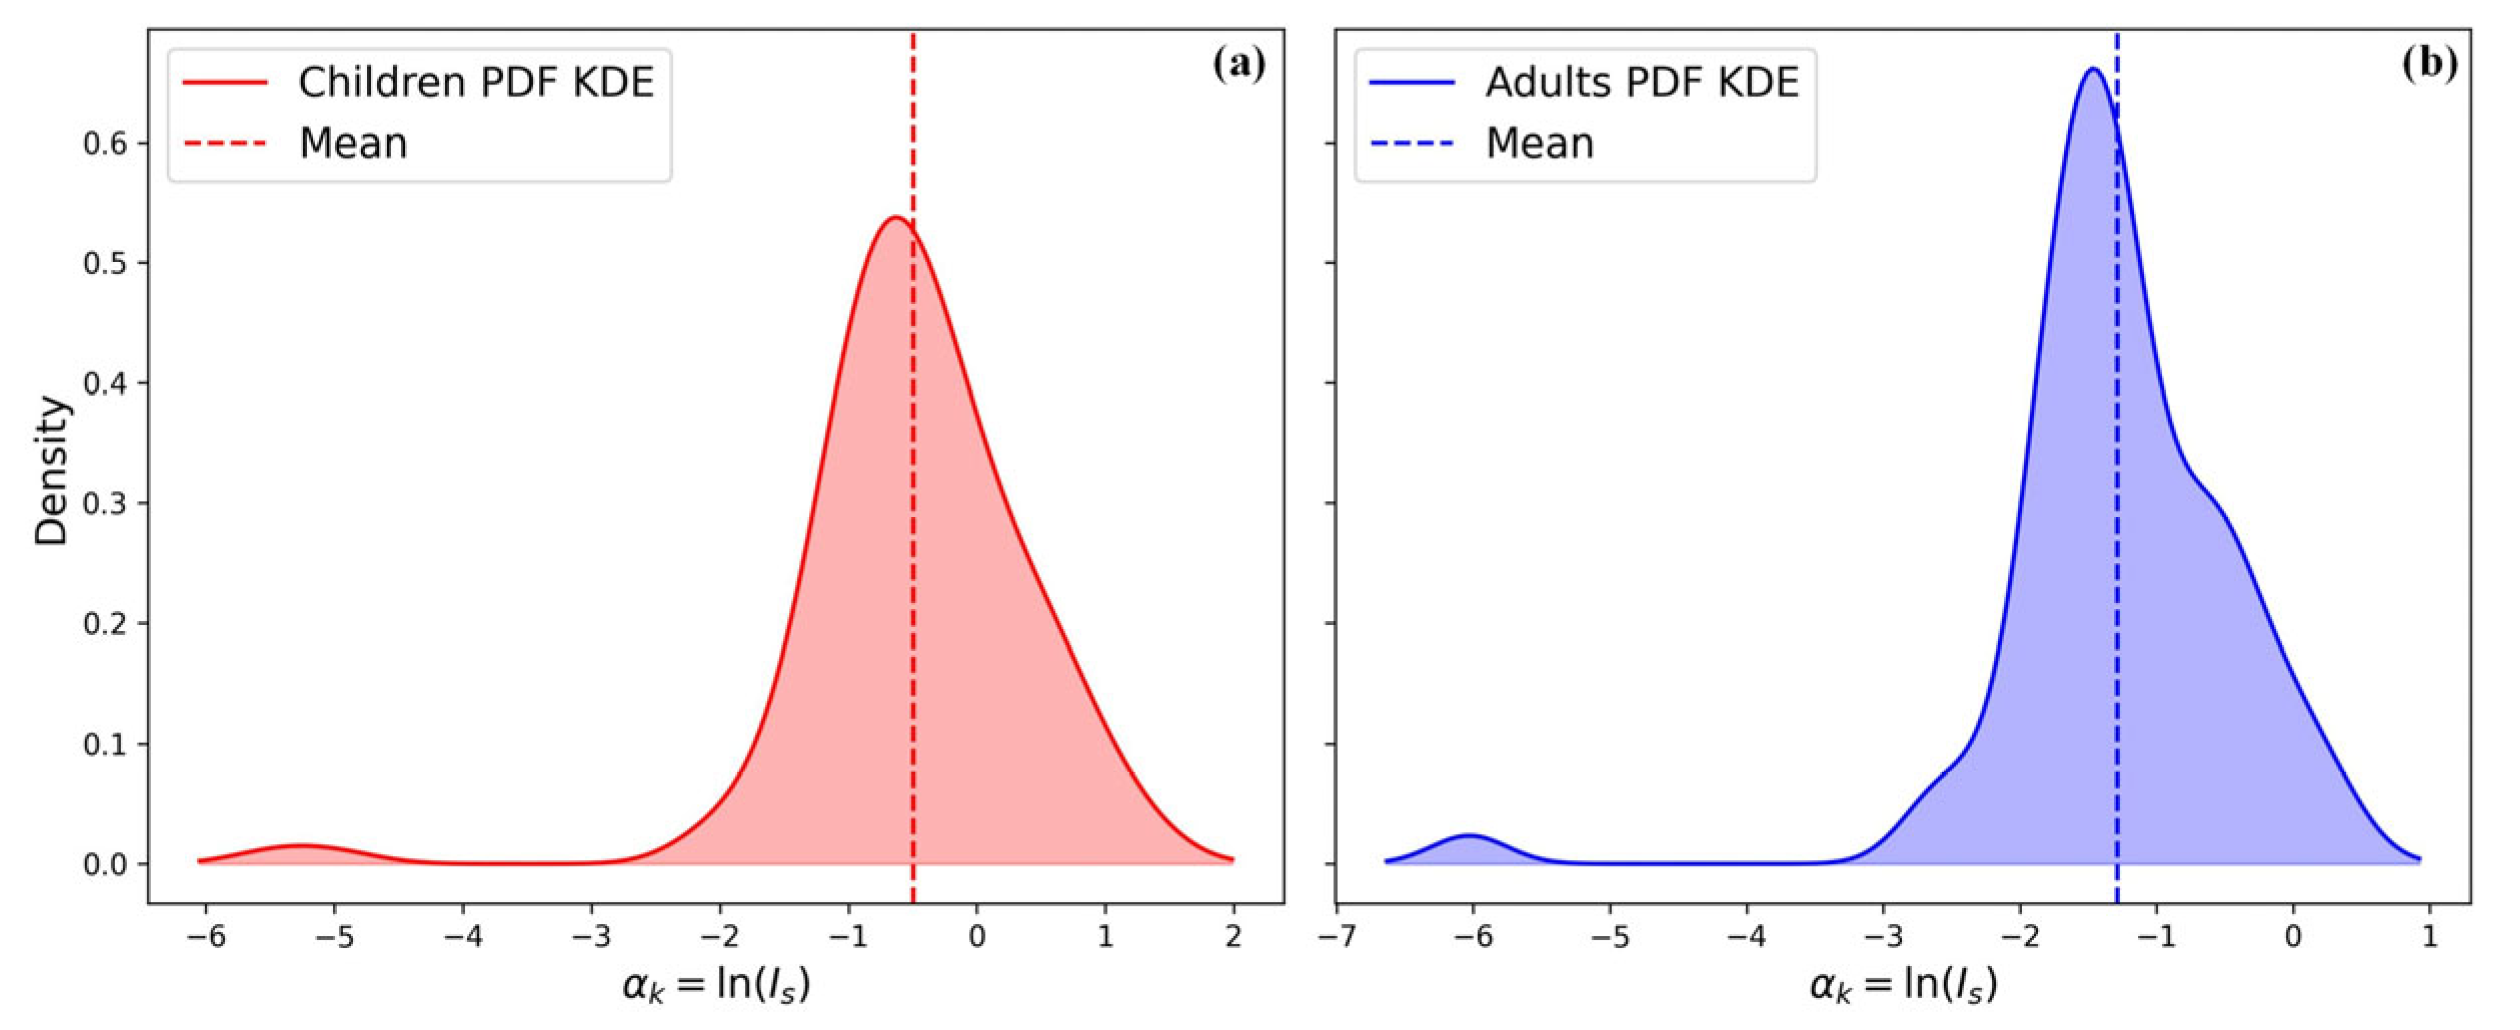
Figure 12 presents the probability density functions (PDFs) of the log-transformed sliding instability index, α k = l n I s for children and adults in Figure 12a,b, respectively. The red and blue curves correspond to kernel density estimates (KDEs) fitted to the experimental data, with shaded regions representing the distribution spread. Dashed vertical lines indicate the mean values of α k for each group. Children exhibit a distribution centered at lower α k , consistent with their smaller body size and higher susceptibility to overtopping instability. Adults show a right-shifted distribution, reflecting greater resistance to instability due to larger body mass and height. The extended tail towards lower α k is due to logarithmic transformation of very small I s values. When I s is close to zero, l n I s becomes negative, producing a long left tail in the distribution, which is due to the log scale and also highlights that a subset of overtopping cases corresponds to very low instability conditions, especially when overtopping depth and velocity are minimal.

4. Discussion

This study quantifies instability probabilities within a probabilistic framework demonstrating how variability in overtopping flow conditions produces a wide distribution of hazard indices. An important contribution of this work is nesting a high-resolution SPH domain within a regional model that enabled the generation of site-specific overtopping conditions representative of real-world scenarios. The combined deterministic modeling and probabilistic analysis show that nearly all overtopping cases analyzed in this study lead to instability for children, whereas adults display a gradual transition from stable to unstable conditions with increasing hazard index values. These distinctions signify the value of integrating numerical models with probabilistic risk assessment to provide reliable risk quantification for varying sea states and different human vulnerabilities.
These findings are broadly consistent with earlier overtopping risk assessments based on experimental and empirical data. For instance, compared with Cao et al. [23], our probabilistic framework predicts substantially higher instability probabilities at low sliding indices, particularly due to the inclusion of children in the dataset. Similarly, Bae et al. [12] demonstrated instability thresholds for human subjects in controlled flume conditions, whereas the present work expands these insights to site-specific conditions. In terms of overtopping discharges, the coefficients obtained here are somewhat lower than those reported in literature, which can be attributed to differences in structure geometry, wave characteristics, and bathymetric conditions. Nevertheless, they remain within the uncertainty ranges summarized in the EurOtop manual, underscoring the reliability of the multiscale modeling approach used in this study.
Despite these advances, some limitations remain. First, the DSPH simulations used second-order regular waves rather than irregular wave trains. This choice allowed systematic control of wave parameters, but it does not capture the short-term variability of natural irregular seas. As such, the overtopping responses should be interpreted as representative values for hazard classification rather than detailed irregular time histories. Second, the analysis used a limited set of human subjects’ experimental data, and factors such as posture, movement, and clothing were not explicitly included. Moreover, while the numerical framework was validated, real-world environments may introduce additional uncertainties, including rapidly changing wave conditions and complex human behavior. Finally, it is noted that the present DSPH simulations were conducted under shore-normal wave incidence to enable controlled evaluation of overtopping responses. In natural conditions, waves often approach with an oblique angle, introducing three-dimensional effects such as asymmetric overtopping jets, lateral flow along the crest, and spatial variability in overtopping discharge. Oblique incidence tends to reduce average overtopping volumes but may locally intensify flow velocity on one side of the crest. Therefore, the present results likely represent an upper bound for total overtopping discharge under equivalent wave heights, whereas localized hazard levels could vary under oblique approach. Incorporating such 3D effects in future extensions of the coupled modeling framework would further improve realism of hazard classification and risk assessment.
Future studies should broaden the database of subject characteristics, incorporate field observations of pedestrian responses during overtopping events, include irregular waves, and explore the application of machine learning to capture nonlinear interactions between wave forcing and human stability. Future studies should also assess the implications of sea-level rise, which would effectively reduce crest freeboard and likely increase overtopping risks under otherwise identical storm conditions. Expanding the spatial and temporal scope of the numerical simulations would further enhance predictive capability. These developments will strengthen coastal risk assessments and support the design of early warning systems.

5. Conclusions

This study developed and applied a framework to classify hazards and evaluate risks to pedestrians exposed to wave overtopping on breakwaters. Quantification of overtopping danger levels was defined through hazard rating curves, and a probabilistic hazard assessment method was employed to account for variability and uncertainty in sea states and human characteristics. Overtopping responses were obtained from numerical experiments using a multiscale numerical framework including tightly coupled ADCIRC-UnSWAN model (regional scale) and DualSPHysics (local scale) under wave conditions representative of a 50-year return period at Samcheok Port, South Korea. The analysis indicated that test subjects considered in this work were generally susceptible to sliding and overturning during overtopping, although the level of risk differed depending on the characteristics of each subject. Importantly, results showed that not every overtopping event translates into equally high risk, which highlights the value of a probabilistic framework for quantifying instability likelihood.
Quantitatively, overtopping occurred in 56% of the simulated wave conditions, with the majority of cases (76.2%) falling in the HR2 category, 19.0% in HR3, and 4.8% in HR1, while no cases reached the extreme HR4 threshold. Instability analysis showed that children were unstable in nearly all overtopping cases, whereas adults exhibited a sharp transition to instability at hazard index values of approximately HR = 0.5–0.7. The fitted coefficients for overtopping discharge (a = 0.03, b = 1.44–1.47, c = 0.93) achieved R2 ≈ 0.66, consistent with the ranges reported in previous studies. Furthermore, comparison with Cao et al. [23] revealed that at a sliding instability index of Is = 0.5, the predicted probability of instability was 0.63 in this study versus 0.05 in the reference, highlighting the critical influence of including children in the analysis dataset.
The findings emphasize the importance of integrating deterministic, conceptual, and probabilistic methods when assessing pedestrian safety under uncertain conditions. Furthermore, advancing non-linear and ensemble-based modeling strategies, supported by diverse datasets, offers a pathway toward more accurate overtopping risk forecasts and improved guidance for coastal infrastructure design and public safety.

Supplementary Materials

The following supporting information can be downloaded at: https://www.mdpi.com/article/10.3390/jmse13102022/s1, Dataset S1: Experimental and numerical parameters for all wave overtopping cases, including wave characteristics, freeboard ratios, run-up values, and wave-type classifications used in this study.

Author Contributions

Conceptualization, J.Y.M. and W.H.C.; software, K.R.; validation, J.Y.M., W.H.C. and K.R.; data curation, K.R.; writing—original draft preparation, J.Y.M. and K.R.; writing—review and editing, W.H.C. and K.R.; project administration, J.Y.M. and W.H.C.; funding acquisition, J.Y.M. and W.H.C.; All authors have read and agreed to the published version of the manuscript.

Funding

This research was conducted with the support of the Korea Institute of Marine Science and Technology Promotion (Development of Wave-Overtopping Quantitative Observation Technology: RS-2022-KS221567) from the Ministry of Oceans and Fisheries in 2025.

Data Availability Statement

The data used for DSPH experimental setup and analysis is available upon request from corresponding author.

Conflicts of Interest

All authors were employed by the company Marine Information Technology Inc. Authors declare that the research was conducted in the absence of any commercial or financial relationships that could be construed as a potential conflict of interest.

References

  1. Almar, R.; Ranasinghe, R.; Bergsma, E.W.J.; Diaz, H.; Melet, A.; Papa, F.; Vousdoukas, M.; Athanasiou, P.; Dada, O.; Almeida, L.P.; et al. A Global Analysis of Extreme Coastal Water Levels with Implications for Potential Coastal Overtopping. Nat. Commun. 2021, 12, 3775. [Google Scholar] [CrossRef] [PubMed]
  2. Koosheh, A.; Etemad-Shahidi, A.; Cartwright, N.; Tomlinson, R.; van Gent, M.R.A. Individual Wave Overtopping at Coastal Structures: A Critical Review and the Existing Challenges. Appl. Ocean Res. 2021, 106, 102476. [Google Scholar] [CrossRef]
  3. Koosheh, A.; Etemad-Shahidi, A.; Cartwright, N.; Tomlinson, R.; van Gent, M.R.A. Wave Overtopping Layer Thickness on the Crest of Rubble Mound Seawalls. Coast. Eng. 2024, 188, 104441. [Google Scholar] [CrossRef]
  4. Garzon, J.L.; Ferreira; Reis, M.T.; Ferreira, A.; Fortes, C.J.E.M.; Zózimo, A.C. Conceptual and Quantitative Categorization of Wave-Induced Flooding Impacts for Pedestrians and Assets in Urban Beaches. Sci. Rep. 2023, 13, 7251. [Google Scholar] [CrossRef] [PubMed]
  5. Gruwez, V.; Altomare, C.; Suzuki, T.; Streicher, M.; Cappietti, L.; Kortenhaus, A.; Troch, P. Validation of RANS Modelling for Wave Interactions with Sea Dikes on Shallow Foreshores Using a Large-Scale Experimental Dataset. J. Mar. Sci. Eng. 2020, 8, 650. [Google Scholar] [CrossRef]
  6. Westerink, J.J.; Luettich, R.A.; Blain, C.A. ADCIRC: An Advanced Three-Dimensional Circulation Model for Shelves, Coasts, and Estuaries; Report 2. User’s Manual for ADCIRC-2DDI; U.S. Army Engineer Waterways Experiment Station: Vicksburg, MS, USA, 1994. [Google Scholar]
  7. Luettich, R.A.; Westerink, J.J.; Scheffner, N.W. ADCIRC: An Advanced Three-Dimensional Circulation Model for Shelves Coasts and Estuaries; Report 1: Theory and Methodology of ADCIRC-2DDI and ADCIRC-3DL, Dredging Research Program Technical Report DRP-92-6; Coastal Engineering Research Center (U.S.): Duck, NC, USA; Engineer Research and Development Center (U.S.): Vicksburg, MS, USA, 1992. [Google Scholar]
  8. Ris, R.C.; Holthuijsen, L.H.; Booij, N. A Third-Generation Wave Model for Coastal Regions 2. Verification. J. Geophys. Res. Oceans 1999, 104, 7667–7681. [Google Scholar] [CrossRef]
  9. Booij, N.; Ris, R.C.; Holthuijsen, L.H. A Third-Generation Wave Model for Coastal Regions 1. Model Description and Validation. J. Geophys. Res. Ocean. 1999, 104, 7649–7666. [Google Scholar] [CrossRef]
  10. Wang, N.; Hou, Y.; Mo, D.; Li, J. Hazard Assessment of Storm Surges and Concomitant Waves in Shandong Peninsula Based on Long-Term Numerical Simulations. Ocean Coast. Manag. 2021, 213, 105888. [Google Scholar] [CrossRef]
  11. Yin, C.; Huang, H.; Wang, D.; Liu, Y. Tropical Cyclone-Induced Wave Hazard Assessment in Hainan Island, China. Nat. Hazards 2022, 113, 103–123. [Google Scholar] [CrossRef]
  12. Mun, J.-Y.; Cho, W.-H.; Rehman, K. Hazard Classification and Risk Evaluation for Pedestrians at Sea Dikes Due to Wave Overtopping. In Proceedings of the 35th International Ocean and Polar Engineering Conference, Seoul, Republic of Korea, 1–6 June 2025; p. ISOPE-I-25-446. [Google Scholar]
  13. McCall, R.T.; Masselink, G.; Poate, T.G.; Roelvink, J.A.; Almeida, L.P.; Davidson, M.; Russell, P.E. Modelling Storm Hydrodynamics on Gravel Beaches with XBeach-G. Coast. Eng. 2014, 91, 231–250. [Google Scholar] [CrossRef]
  14. Ibrahim, M.S.I.; Baldock, T.E. Swash Overtopping on Plane Beaches – Reconciling Empirical and Theoretical Scaling Laws Using the Volume Flux. Coast. Eng. 2020, 157, 103668. [Google Scholar] [CrossRef]
  15. Akbari, H. Simulation of Wave Overtopping Using an Improved SPH Method. Coast. Eng. 2017, 126, 51–68. [Google Scholar] [CrossRef]
  16. Ryu, K.H.; Shin, C.H.; Jeong, W.M.; Baek, W.D. Applicability of Swash Model for Wave Field Data Reproduction in Namhangjin Coastal Area. In APAC 2019—Proceedings of the 10th International Conference on Asian and Pacific Coasts, Hanoi, Vietnam, 25–28 September 2019; Springer: Singapore, 2020; pp. 945–951. [Google Scholar] [CrossRef]
  17. Umesh, P.A.; Behera, M.R. On the Improvements in Nearshore Wave Height Predictions Using Nested SWAN-SWASH Modelling in the Eastern Coastal Waters of India. Ocean Eng. 2021, 236, 109550. [Google Scholar] [CrossRef]
  18. Crespo, A.J.C.; Domínguez, J.M.; Rogers, B.D.; Gómez-Gesteira, M.; Longshaw, S.; Canelas, R.; Vacondio, R.; Barreiro, A.; García-Feal, O. DualSPHysics: Open-Source Parallel CFD Solver Based on Smoothed Particle Hydrodynamics (SPH). Comput. Phys. Commun. 2015, 187, 204–216. [Google Scholar] [CrossRef]
  19. Altomare, C.; Gironella, X.; Crespo, A.J.C. Simulation of Random Wave Overtopping by a WCSPH Model. Appl. Ocean Res. 2021, 116, 102888. [Google Scholar] [CrossRef]
  20. Vanneste, D.F.A.; Altomare, C.; Suzuki, T.; Troch, P.; Verwaest, T. Comparison of Numerical Models for Wave Overtopping and Impact on a Sea Wall. Coast. Eng. Proc. 2014, 1, 5. [Google Scholar] [CrossRef]
  21. Bae, H.U.; Yun, K.M.; Yoon, J.Y.; Lim, N.H. Human Stability with Respect to Overtopping Flow on the Breakwater. Int. J. Appl. Eng. Res. 2016, 11, 111–119. [Google Scholar]
  22. Maranzoni, A.; D’Oria, M.; Rizzo, C. Quantitative Flood Hazard Assessment Methods: A Review. J. Flood Risk Manag. 2023, 16, e12855. [Google Scholar] [CrossRef]
  23. Cao, D.; Tan, W.; Yuan, J. Assessment of Wave Overtopping Risk for Pedestrian Visiting the Crest Area of Coastal Structure. Appl. Ocean Res. 2022, 120, 102985. [Google Scholar] [CrossRef]
  24. Mun, J.-Y.; Cho, W.-H.; Rehman, K. Estimation of Overtopping Discharge Using Real-Time Monitoring, Numerical, Empirical, and Neural Network Methods. J. Korean Soc. Mar. Environ. Saf. 2024, 30, 527–540. [Google Scholar] [CrossRef]
  25. Gruwez, V.; Altomare, C.; Suzuki, T.; Streicher, M.; Cappietti, L.; Kortenhaus, A.; Troch, P. An Inter-Model Comparison for Wave Interactions with Sea Dikes on Shallow Foreshores. J. Mar. Sci. Eng. 2020, 8, 985. [Google Scholar] [CrossRef]
  26. Crespo, A.J.C.; Gómez-Gesteira, M.; Dalrymple, R.A. Boundary Conditions Generated by Dynamic Particles in SPH Methods. Comput. Mater. Contin. 2007, 5, 173–184. [Google Scholar]
  27. Altomare, C.; Domínguez, J.M.; Crespo, A.J.C.; González-Cao, J.; Suzuki, T.; Gómez-Gesteira, M.; Troch, P. Long-Crested Wave Generation and Absorption for SPH-Based DualSPHysics Model. Coast. Eng. 2017, 127, 37–54. [Google Scholar] [CrossRef]
  28. Crespo, A.J.C.; Altomare, C.; Domínguez, J.M.; González-Cao, J.; Gómez-Gesteira, M. Towards Simulating Floating Offshore Oscillating Water Column Converters with Smoothed Particle Hydrodynamics. Coast. Eng. 2017, 126, 11–26. [Google Scholar] [CrossRef]
  29. Van der Meer, J.W.; Allsop, N.W.H.; Bruce, T.; De Rouck, J.; Kortenhaus, A.; Pullen, T.; Schüttrumpf, H.; Troch, P.; Zanuttigh, B. EurOtop: Manual on Wave Overtopping of Sea Defences and Related Structures; 2nd edition 2018. Available online: https://www.overtopping-manual.com/ (accessed on 19 October 2025).
  30. van der Meer, J.; Bruce, T. New Physical Insights and Design Formulas on Wave Overtopping at Sloping and Vertical Structures. J. Waterw. Port. Coast. Ocean Eng. 2014, 140, 04014025. [Google Scholar] [CrossRef]
  31. Franco, L.; de Gerloni, M.; van der Meer, J. Wave overtopping on vertical and composite breakwaters. In Proceedings of the 24th International Conference on Coastal Enegineering, Kobe, Japan, 23–28 October 1994; pp. 1030–1045. [Google Scholar]
  32. Allsop, N.W.H. Overtopping Performance of Vertical and Composite Breakwaters, Seawalls and Low Reflection Alternatives. In Paper to Final MAST-MCS Project Workshop; University of Hannover: Alderney, UK, 1995. [Google Scholar]
  33. Wade, S.; Ramsbottom, D.; Floyd, P.; Penning-rowsell, E.; Surendran, S. Risks to People: Developing New Approaches for Flood Hazard and Vulnerability Mapping. In Proceedings of the 40th DEFRA Flood and Coastal Management Conference, York, UK, 5–7 July 2005. [Google Scholar]
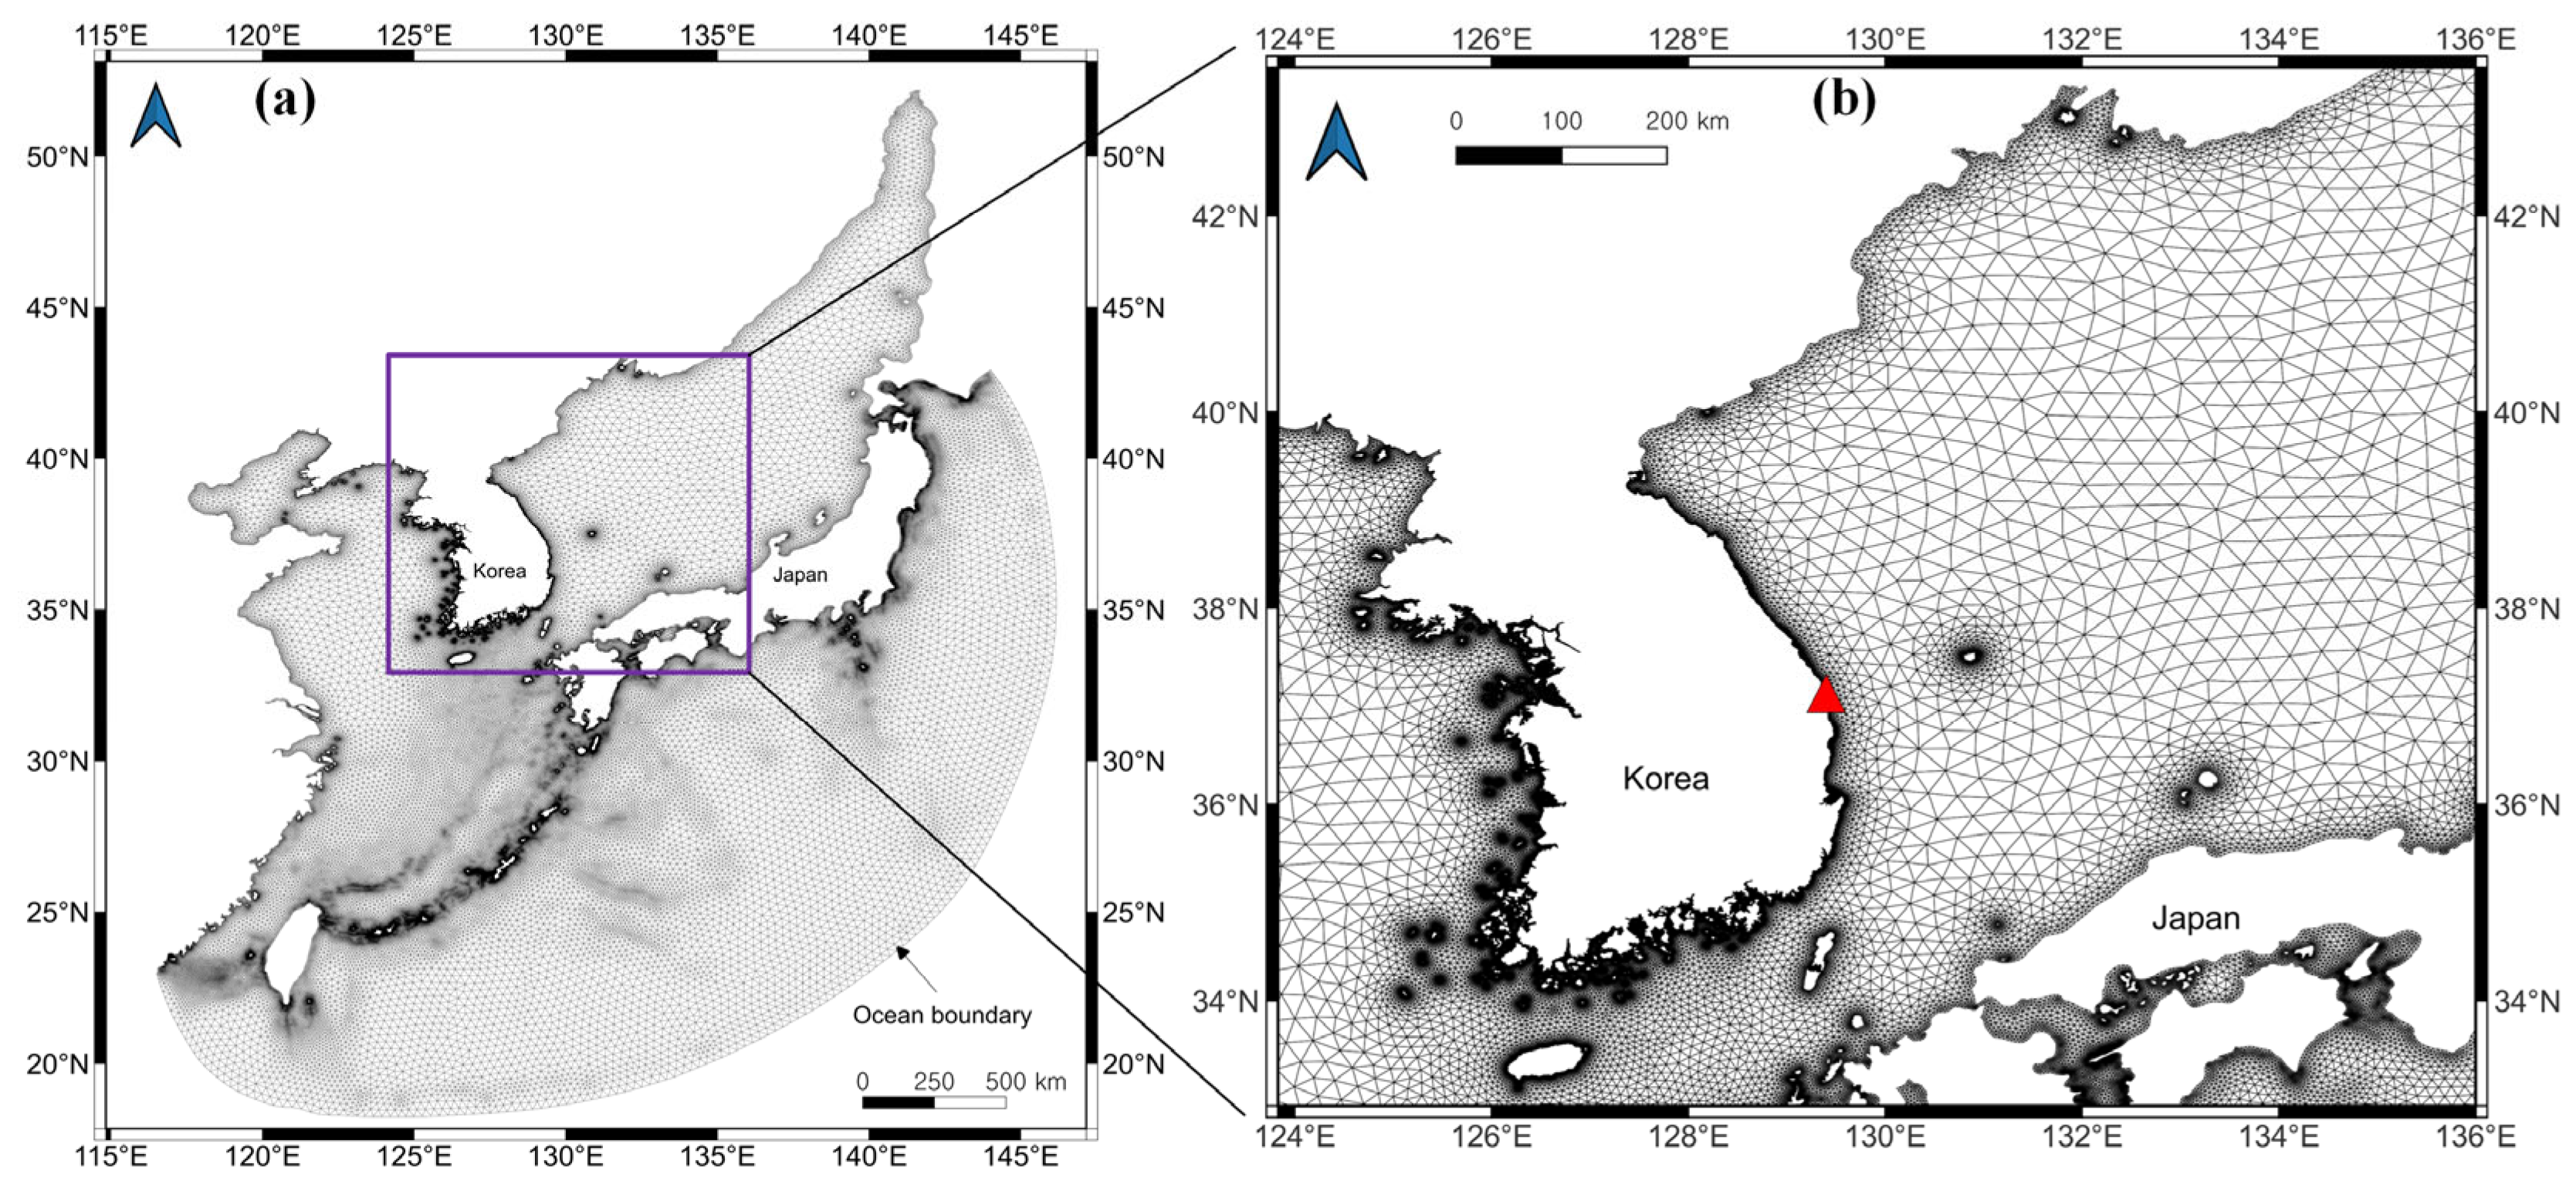
Figure 1. ADCIRC-UnSWAN computational domain and mesh. (a) Complete domain; (b) zoomed in version with red triangle showing location of Samcheok Port on the mesh.
Jmse 13 02022 g001
Figure 2. Significant (Sig.) wave height comparison between field observations and numerical predictions (based on KMA wind data) by ADCIRC-UnSWAN model at Samcheok Port (a) Wave heights for strong wind conditions; (b) wave heights for typhoon conditions.
Jmse 13 02022 g002
Figure 3. Schematics of setup for DSPH experiment. WG1 is the wave gauge for checking water surface elevation and velocity within the flume. Ten observation stations (numbered 1–10 and spaced 0.1 m apart) are located above the breakwater crest to record overtopping thickness and velocity. The numbers above the structure indicate these stations used for overtopping extraction. The overtopping volume is measured in ‘Tank’. The piston is fixed on the left boundary.
Jmse 13 02022 g003
Figure 4. Water surface elevation record at WG1 at 4 m from piston.
Jmse 13 02022 g004
Figure 5. Velocity distribution across stations 1–10 at breakwater crest.
Jmse 13 02022 g005
Figure 6. Overtopping thickness (depth) at selected stations across the breakwater crest.
Jmse 13 02022 g006
Figure 7. Relative overtopping rate versus relative freeboard. Blue circles show DSPH outputs for overtopping discharge based on model input for Hm0 and RC and the red line indicates the best fit line. (a) for Equation (1), a, b: [0.03 1.44]; R2: 0.6552; (b) for Equation (2), a, b, c: [0.03 1.47 0.929]; R2: 0.6556.
Jmse 13 02022 g007
Figure 8. Distribution of overtopping cases classified by hazard index HR = D(V + 0.5). Hazard categories (HR1–HR4) represent increasing severity from low to extreme hazard.
Jmse 13 02022 g008
Figure 9. Instability coefficients (α) derived from the curve-fitting relation Equation (5) for children (C1–C3) and adults (A1–A6) listed in Table 4.
Jmse 13 02022 g009
Figure 10. Probability of instability as a function of hazard index for children (a) and adults (b). Scatter points represent reconstructed experimental instability outcomes (blue = tiptoe lifting, red = slipping/tumbling). Solid curves denote logistic regression fits, and shaded envelopes indicate 95% confidence intervals. Vertical shaded bands show the range of subject-specific instability thresholds (α) for tiptoe (blue) and slipping (red). The regression curves are interpreted only within the observed HR range (up to ≈1.8); extrapolation beyond this range is shown illustratively and not used for analysis.
Jmse 13 02022 g010
Figure 11. Zoomed-in probability of instability (0.9–1.0) as a function of hazard index for children (a) and adults (b). As in Figure 10, regression curves are valid only within the observed HR range (up to ≈1.8); extrapolated values are not interpreted.
Jmse 13 02022 g011
Figure 12. Probability density functions (PDFs) of the log-transformed sliding instability index α k = l n I s . (a) for children; (b) for adults. Solid curves show kernel density estimates (KDEs) of experimental data.
Jmse 13 02022 g012
Table 1. Summary of selected DSPH input parameters.
Parameter KeyValueDescription
Boundary1DBC (Dynamic Boundary Condition)
StepAlgorithm2Step algorithm: 2: Symplectic
Kernel2Interaction kernel: 2 = Wendland
ViscoType1Viscosity formulation: 1 = Artificial viscosity
Visco0.01Artificial viscosity coefficient
DensityDiff2Density diffusion term: 2 = Fourtakas
RigidAlgorithm1Rigid body algorithm: 1 = SPH
CoefDtMin0.05Coefficient for minimum time step
TimeOut1Time step for data output (seconds)
Table 2. Comparison of estimated overtopping discharge coefficients with literature.
CoefficientsFranco et al. [31]
for Relatively Deep Water
Allsop
[32]
Van der Meer et al.
[23]
This Study
a0.20.050.0470.03
b4.32.782.121.47
c--1.30.93
Table 3. Flood hazard classification based on Hazard Index HR = D(V + 0.5). Adapted from [33].
Hazard
Category
Hazard Index
HR = D(V + 0.5)
Severity LevelDescription
HR1HR < 0.75Jmse 13 02022 i001 LowFlood zone with shallow or slow-moving water (caution only)
HR20.75 ≤ HR < 1.25Jmse 13 02022 i002ModerateFlood zone with deeper/faster water, risk for children
HR31.2 ≤ HR < 2.5Jmse 13 02022 i003SignificantFlood zone with deep, fast water, hazardous for most adults
HR4HR ≥ 2.5Jmse 13 02022 i004 ExtremeFlood zone with deep, fast water, extremely dangerous for all
Table 4. Subject demographics and fitted instability coefficients (α) derived from Equation (5). H and M denote subject height and mass, respectively. Adapted from [12].
Subject IDAge (yrs.)Height (m)Mass (kg)H × M (m.kg)
C12~30.931514
C26~71.22328
C39~101.373649
A1241.7268117
A2341.7170120
A3281.6872121
A4261.8371130
A5271.875135
A6261.7790159
Table 5. Comparison of sliding instability between this study and Cao et al. [23] observations.
Sliding Instability (Is)Pins Cao et al. [23]Pins (This Study)Difference
0.05-0.02-
0.3-0.43-
0.50.050.63+0.58
0.7-0.75-
1.790.950.950.00
2.0>0.950.96≈0.00
Disclaimer/Publisher’s Note: The statements, opinions and data contained in all publications are solely those of the individual author(s) and contributor(s) and not of MDPI and/or the editor(s). MDPI and/or the editor(s) disclaim responsibility for any injury to people or property resulting from any ideas, methods, instructions or products referred to in the content.