Article

From Kelvin Wave Patterns to Ship Displacement: An Inverse Prediction Framework Based on a Hull Form Database

1
Key Laboratory of High Performance Ship Technology, Wuhan University of Technology, Ministry of Education, Wuhan 430063, China
2
School of Naval Architecture, Ocean and Energy Power Engineering, Wuhan University of Technology, Wuhan 430063, China
*
Author to whom correspondence should be addressed.
J. Mar. Sci. Eng. 2025, 13(10), 2019; https://doi.org/10.3390/jmse13102019
Submission received: 14 September 2025 / Revised: 8 October 2025 / Accepted: 16 October 2025 / Published: 21 October 2025
(This article belongs to the Special Issue Advancements in Marine Hydrodynamics and Structural Optimization)

Abstract

The estimation of a ship’s displacement volume, ∇, from remote sensing data is of considerable practical value for maritime surveillance and vessel characterization. This paper introduces a practical framework for the inverse estimation of displacement volume from Kelvin ship waves, building upon a prior study through two key extensions. First, the wave amplitude function is recovered using Fourier series expansions combined with the stationary phase method. The displacement volume is then estimated via a two-step procedure: an initial estimate is obtained by identifying a hull with similar amplitude characteristics from a database, followed by a refinement that incorporates discrepancies between the target and candidate wave amplitude functions. In the case studied, the proposed approach achieves a prediction error of 4.02 % , demonstrating its potential for non-invasive extraction of hull information from remote sensing data.

1. Introduction

Kelvin ship waves, which can propagate over vast oceanic areas, offer a valuable opportunity to non-invasively extract hull information for vessel tracking and classification, particularly useful for identifying ships involved in illicit activities. Consequently, the collection and inverse analysis of such wave signals across large marine zones are of considerable importance for both commercial and national security applications. Of particular interest is the ship displacement volume, a key parameter that cannot be directly observed through conventional remote sensing because the submerged hull is concealed beneath the waterline.
Early research on the inverse prediction of ship hull geometric information was conducted by several authors. Specifically, Fan et al. [1] introduced a straightforward approach to estimate ship speed based on the wavelength of Kelvin ship waves. Shariati & Hossein [2] proposed a practical technique for determining submarine size using the surface wave information via the Bernoulli relations. Newman [3] and Wu [4] made pioneering contributions to the inverse prediction of hull form details through Kelvin wave patterns, as noted by Zilman et al. [5]. In particular, Newman [3] developed a method based on Michell’s ship wave theory and Legendre polynomial representations of the hull surface to recover specific geometric features. Wu [4] employed Hilbert and Fourier transforms to estimate wave spectra from Kelvin waves and derived a theoretical model for the wave amplitude function, facilitating the estimation of ship length and hull form based on Michell’s theory.
Recent studies have further expanded the scope of the inverse Kelvin ship wave problem. For instance, Wang et al. [6], O’Connor et al. [7], and Zhai L et al. [8] developed numerical methods to simulate synthetic aperture radar (SAR) or optical images of Kelvin ship waves, accounting for the influences of wind and speckle noise. Song et al. [9] and Xu et al. [10] proposed different approaches to detect Kelvin ship waves in real marine environments, considering rough sea surface effects, using mechanism-based and artificial intelligence methods (e.g., the KelvinPointNet model), respectively. Furthermore, Hao et al. [11] predicted ship velocity with an accuracy of 99.7 % using a convolutional neural network. In addition, Liang et al. [12] and Gao et al. [13] inversely estimated ship speed and motion direction from Kelvin wake patterns via either mechanistic or data-driven intelligent techniques. Shariati and Hossein [2] developed an algorithm to identify hull form information, including overall dimensions, velocity, and submergence depth of underwater vehicles, based on the ship waves. In particular, the algorithm determines the speed of the vehicle based on the far-field wavelength. The submergence depth is estimated using a non-dimensional diagram that illustrates the relationship between non-dimensional depth, non-dimensional amplitude, and Froude number. Additionally, the diameter of the body is approximated using either the near-field Kelvin wake or the Bernoulli hump. Rizaev and Achim [14] employed a deep learning method to classify ten different ship hulls using SAR imagery of their ship waves. They created a dataset of 46,080 images to train the neural network for accurate classification.
Despite these advances, a direct and practical relationship between the Kelvin wake and principal ship dimensions (such as length, beam, and displacement volume, which are critical for ship detection) remains unestablished, presenting a key gap.
In an attempt to address this gap, Ma et al. [15] proposed a straightforward method for estimating principal ship dimensions via a simplified relation between the principal ship dimensions and the wave amplitude function. This approach, however, introduces two subsequent limitations. Firstly, it does not resolve the challenge of extracting the wave amplitude function from raw wave pattern data. Second, the influence of realistic hull geometry on prediction accuracy is not adequately considered, potentially restricting the method’s applicability to diverse ship types.
Therefore, two extensions are necessary for the reverse prediction of the ship’s displacement volume: (1) determination of the wave amplitude function directly from Kelvin ship waves, and (2) the incorporation of hull form characteristics to account for their influence on prediction accuracy.

2. Theory and Prediction of Kelvin Ship Waves

The Kelvin ship wave pattern, denoted by η , can be represented as a superposition of elementary plane waves E ˜ . The amplitude of these elementary waves, termed the wave amplitude function A ( q ) , is determined by the hull form of the steadily moving vessel. Accordingly, this section is structured as follows: Section 2.1 presents the mathematical formulation of the Kelvin ship wave elevation η ; Section 2.2 derives the expression for the wave amplitude function A ( q ) and briefly outlines its numerical implementation; and Section 2.3 describes a computationally suitable representation of the wave elevation η for numerical prediction.

2.1. Analytical Formulation of Wave Elevation

This subsection presents the analytical formulation of Kelvin ship waves associated with the wave amplitude function. The ship has a length L s and advances steadily at a speed V s along a straight path in calm water of effectively infinite depth and lateral extent. The analysis adopts the conventional idealization of Kelvin wake theory, in which random wave effects are neglected; these will be addressed in future studies. The Froude number F r is defined as
F r V s / g L s
where g denotes the gravitational acceleration.
A right-handed moving coordinate system is adopted to describe the flow around the ship hull. Points on the mean wetted hull surface or within the mean flow domain are denoted by X ( X , Y , Z 0 ) and X ˜ ( X ˜ , Y ˜ , Z ˜ 0 ) , respectively. The corresponding non-dimensional coordinates are defined as
x ( x , y , z ) X / L s and x ˜ ( x ˜ , y ˜ , z ˜ ) X ˜ / L s
Within the classical and realistic framework of linear potential-flow theory adopted here, the wave field aft of the ship can be expressed as a linear superposition of elementary plane waves E ˜ , which is defined as
E ˜ = e ( 1 + q 2 ) z ˜ / F r 2 + i 1 + q 2 ( x ˜ + q y ˜ ) / F r 2
The resulting potential ϕ ˜ is then given by
ϕ ˜ ( x ˜ ) = F r 2 π Im q q A ( q ) 1 + q 2 E ˜ d q
where Im denotes the imaginary part, and A ( q ) is the wave amplitude function, which will be discussed in detail later. The wavenumber parameter q is related to the physical wavenumber k by k = ( 1 + q 2 ) / F r 2 , and can also be expressed in terms of the ray angle ψ :
ψ arctan ( y ˜ / x ˜ )
The wavenumber parameters q D or q T , corresponding to the divergent or transverse wave systems, are related to the ray angle via
q D = 1 + 1 8 tan 2 ψ 4 tan ψ , q T = 1 2 q D .
Here, q D > q c > q T 0 with q c = 1 / 2 0.71 . The upper bound is set at q 2.64 , which corresponds to divergent waves with a very high wavenumber k 88.6 . Since this portion of the wave pattern with such a high wavenumber is physically negligible and computationally insignificant, divergent waves for q > 2.64 are consequently disregarded in the subsequent analysis. Further details regarding the fundamental relations (2)–(4) can be found in Noblesse [16,17] and are not repeated here.
The wave elevation η of the free surface at the field point x ˜ = ( x ˜ , y ˜ , 0 ) aft of the ship stern can be non-dimensionalized as
η E g V s 2 = ϕ ˜ ( x ˜ ) x = 1 π R e q q A ( q ) e i 1 + q 2 ( x ˜ + q y ˜ ) / F r 2 d q
where R e denotes the real part of the complex-valued expression.

2.2. Determination of the Wave Amplitude Function

The numerical determination of the wave amplitude function A ( q ) is considered here. Specifically, A ( q ) is evaluated within the framework of Neumann–Michell (NM) theory as
A ( q ) A ˜ H ( q ; x ˜ ) + A ˜ ψ ( q ; x ˜ )
as previously introduced by Noblesse et al. [16] and Huang et al. [18]. Here, the component A ˜ H associated with the Hogner potential is defined by
A ˜ H 1 + q 2 F r 2 H H ˜ n x E d a
using the slender-ship approximation, in which the source strength on the hull surface is explicitly taken as the x-component n x of the normal vector ( n x , n y , n z ) . To satisfy the impermeable surface condition, the wave amplitude function A in (6) is modified by a correction term A ˜ ψ , given as
A ˜ ψ 1 + q 2 F r 2 H H ˜ [ ( q ν y + i 1 + q 2 ν z ) ϕ t + n x ( q ν z i 1 + q 2 ν y ) ϕ d ] E d a .
where the parameter E in (7) and (8) is defined as
E e ( 1 + q 2 ) z / F r 2 i 1 + q 2 ( x + q y ) / F r 2
Here, H ˜ = H ˜ ( x ˜ x ) is the Heaviside unit-step function. The terms ϕ t and ϕ d represent the partial derivatives of the flow potential ϕ along the directions of the vectors d and t , respectively. The unit vector t along the ship hull surface H is defined as
t = ( n y , n x , 0 ) / ( n x ) 2 + ( n y ) 2
and the orthogonal unit vector is given by d n × t . The unit normal vector n ( n x , n y , n z ) , pointing outward from the ship hull into the water, is used to define the following parameters:
ν ( n y ) 2 + ( n z ) 2 , ( ν y , ν z ) ( n y , n z ) / ν
The flow potential ϕ in (8) is determined numerically by solving the linear system
ϕ i j = 1 N n o d e A i j ϕ j = ϕ H i with ϕ ˜ i = ϕ i
as proposed by Ma et al. [19]. Here, N n o d e denotes the total number of nodes, with indices 1 i N n o d e . The coefficient matrix A i j depends on the Froude number F r and the geometry of the ship hull. This numerical approach, based on an extension of the Neumann–Michell theory, offers improved computational efficiency. It operates directly on the flow potential ϕ rather than its derivatives, and the matrix A i j remains unchanged during iterative computations, eliminating the need for repeated updates.

2.3. Simplified Expression for the Kelvin Ship Waves

The wave elevation η given in (5) can be expressed as
η = 2 / π / h · [ Re W ( h , ψ ) ]
where the complex function W is defined by the integral
W ( h , ψ ) h 2 π q + q A ( q ) e i h φ ( q , ψ ) d q
and the scaled radial distance h is given by
h x ˜ 2 + y ˜ 2 / F r 2 = X ˜ 2 + Y ˜ 2 g / V 2
The stationary phase function φ is defined as
φ 1 + q 2 ( q sin ψ cos ψ )
For the far-field or near-field waves at arbitrary points ( x ˜ , y ˜ ) on the free-surface plane z ˜ = 0 , the function W is modified as W W ˜ , where
W ˜ h 2 π q + q A ( q ) e i h φ σ ( φ ) 4 d q
where the factor σ is determined as described by Zhang et al. [20], and
φ = [ ( 1 + 2 q 2 ) sin ψ q cos ψ ] / 1 + q 2
For the far-field ship waves, the function W can be approximated via the stationary phase method, which is predicated on the principle that the dominant contribution to the integral arises from the point where the phase function is stationary. This approach is well-documented in the literature on Kelvin ship waves, as exemplified in [20] as
W W R + W I
where the component W R , associated with the real part A R of the wave amplitude function A = A R + i A I , is given by
W R = A R ( q T ) cos ( h φ T π / 4 ) φ T + A R ( q D ) cos ( h φ D + π / 4 ) φ D
and the component W I , associated with the imaginary part A I of the wave amplitude function A, is given by
W I = A I ( q T ) sin ( h φ T π / 4 ) φ T A I ( q D ) sin ( h φ D + π / 4 ) φ D
Here, φ T , φ D or φ T , φ D denotes the values of φ or φ , respectively, evaluated using the relation (14) or
φ = [ ( 2 q 2 1 ) / ( 1 + q 2 ) ] / 1 + 4 q 2
where the wavenumber parameter q is taken as the transverse wavenumber q T , or the divergent wavenumber q D , as defined in (4). Since far-field waves are most relevant for detection and far-field expressions (17) differ only marginally from near-field waves (15) for X < L s , the far-field expression is used here for inverse analysis.
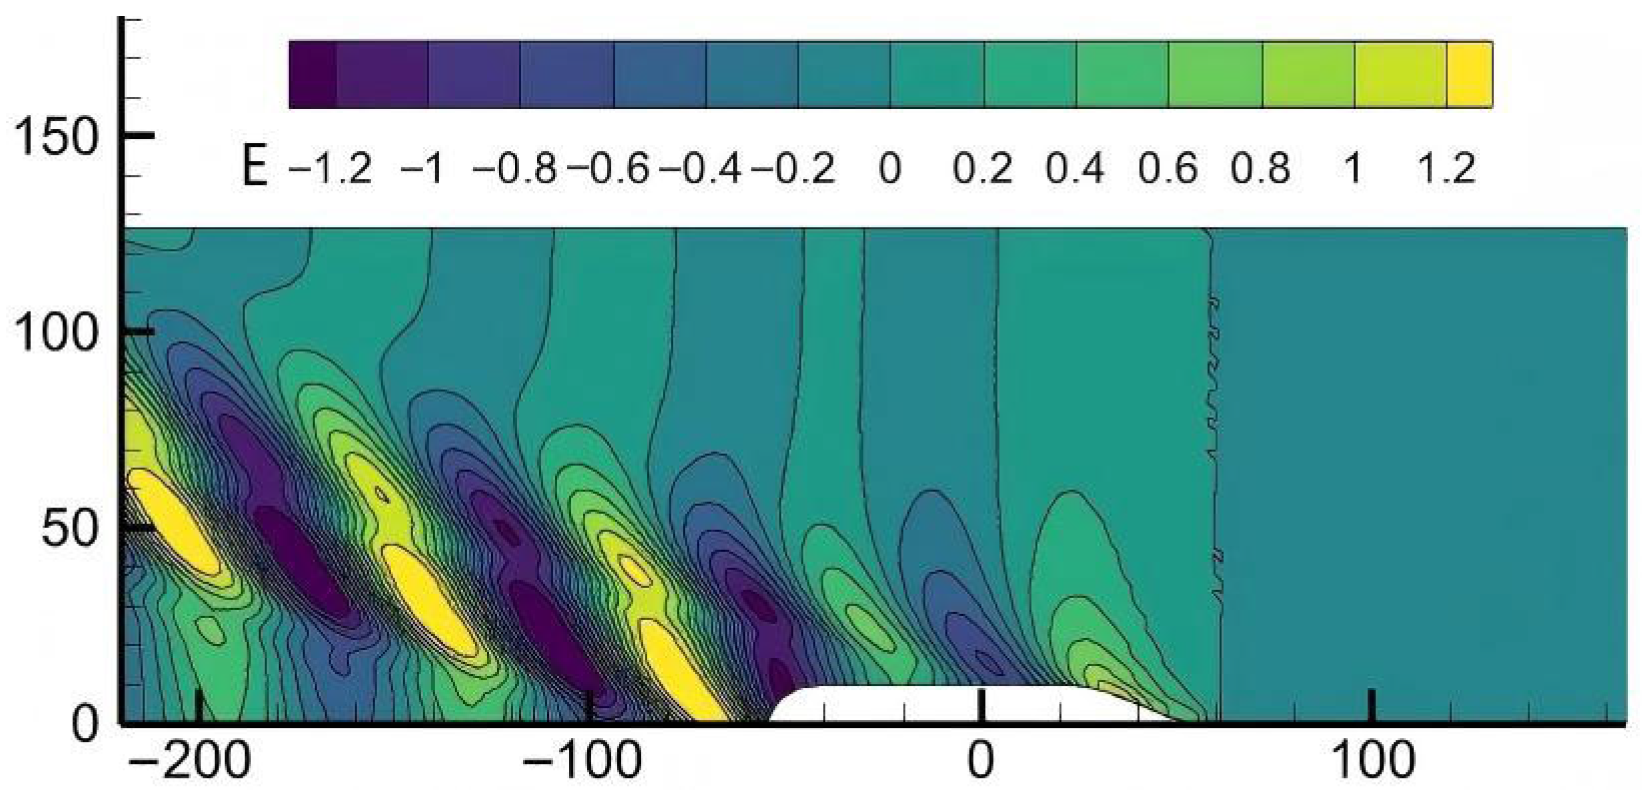
Figure 1 shows the magnitude | A | of the wave amplitude function A = A R + i A I , along with its real part A R and the imaginary part A I , as predicted from flow computations using (6)–(10). The red circles indicate the positions of the peaks (local maxima) of | A | . Correspondingly, Figure 2 presents the Kelvin ship wave pattern generated by the target hull, determined via (11)–(16). The target hull form is derived through a combination of the principal dimension transformation method and the Lackenby hull form transformation method. The side and bottom views of the target ship hull are illustrated in Figure 3. The principal dimensions of this hull are summarized in Table 1. The Kelvin ship wave pattern generated by the target hull is used hereafter to investigate the inverse estimation of its displacement volume.

3. Fourier Series Representation of the Wave Elevation η

3.1. Fourier Series Approximation of A R and A I

The real part A R and the imaginary part A I of the wave amplitude function A = A R + i A I can be represented as Fourier series expansions A R A ^ R and A I A ^ I , where
A ^ R ( q ) = a R 0 / 2 + n = 1 N [ a R n cos ( n ω q ) + b R n sin ( n ω q ) ]
A ^ I ( q ) = a I 0 / 2 + n = 1 N [ a I n cos ( n ω q ) + b I n sin ( n ω q ) ]
These expressions offer a concise alternative to the original Neumann–Michell integral form of the wave amplitude function. By considering a limited number of elementary wave components, the Fourier series effectively captures the dominant features of the Kelvin ship wake while filtering out less significant details. Here, the Fourier coefficients a R n , b R n and a I n , b I n for n = 0 , 1 , 2 , 3 , 4 are determined through the following integrals of the wave amplitude functions A R and A I :
a R n = 2 T 0 T A R ( q ) cos ( n ω q ) d q
b R n = 2 T 0 T A R ( q ) sin ( n ω q ) d q
a I n = 2 T 0 T A I ( q ) cos ( n ω q ) d q
b I n = 2 T 0 T A I ( q ) sin ( n ω q ) d q
Here, ω denotes the angular frequency and the period T, which are related by
ω = 2 π / T

3.2. Realistic Determination of Parameters T And N

This section discusses the determination of the period T and the number of retained terms N in the Fourier series expansion given in (19a)–(20d).

3.2.1. Extension of the Period T

The period is initially chosen as T T 1 :
T 1 = q q 0
is considered here. Here, q 0 and q denote the minimum and maximum values of the wavenumber q used in the steady ship flow computations, respectively. Specifically, q 0 = 0 corresponds to transverse waves along the ship track ( ψ = 0 ), where the wavenumber parameter q reaches its minimum. The upper bound is set to q = 2.64 , which corresponds to divergent waves at ψ = 10 . Divergent waves with larger values of q for ψ < 10 are physically unrealistic and negligible.
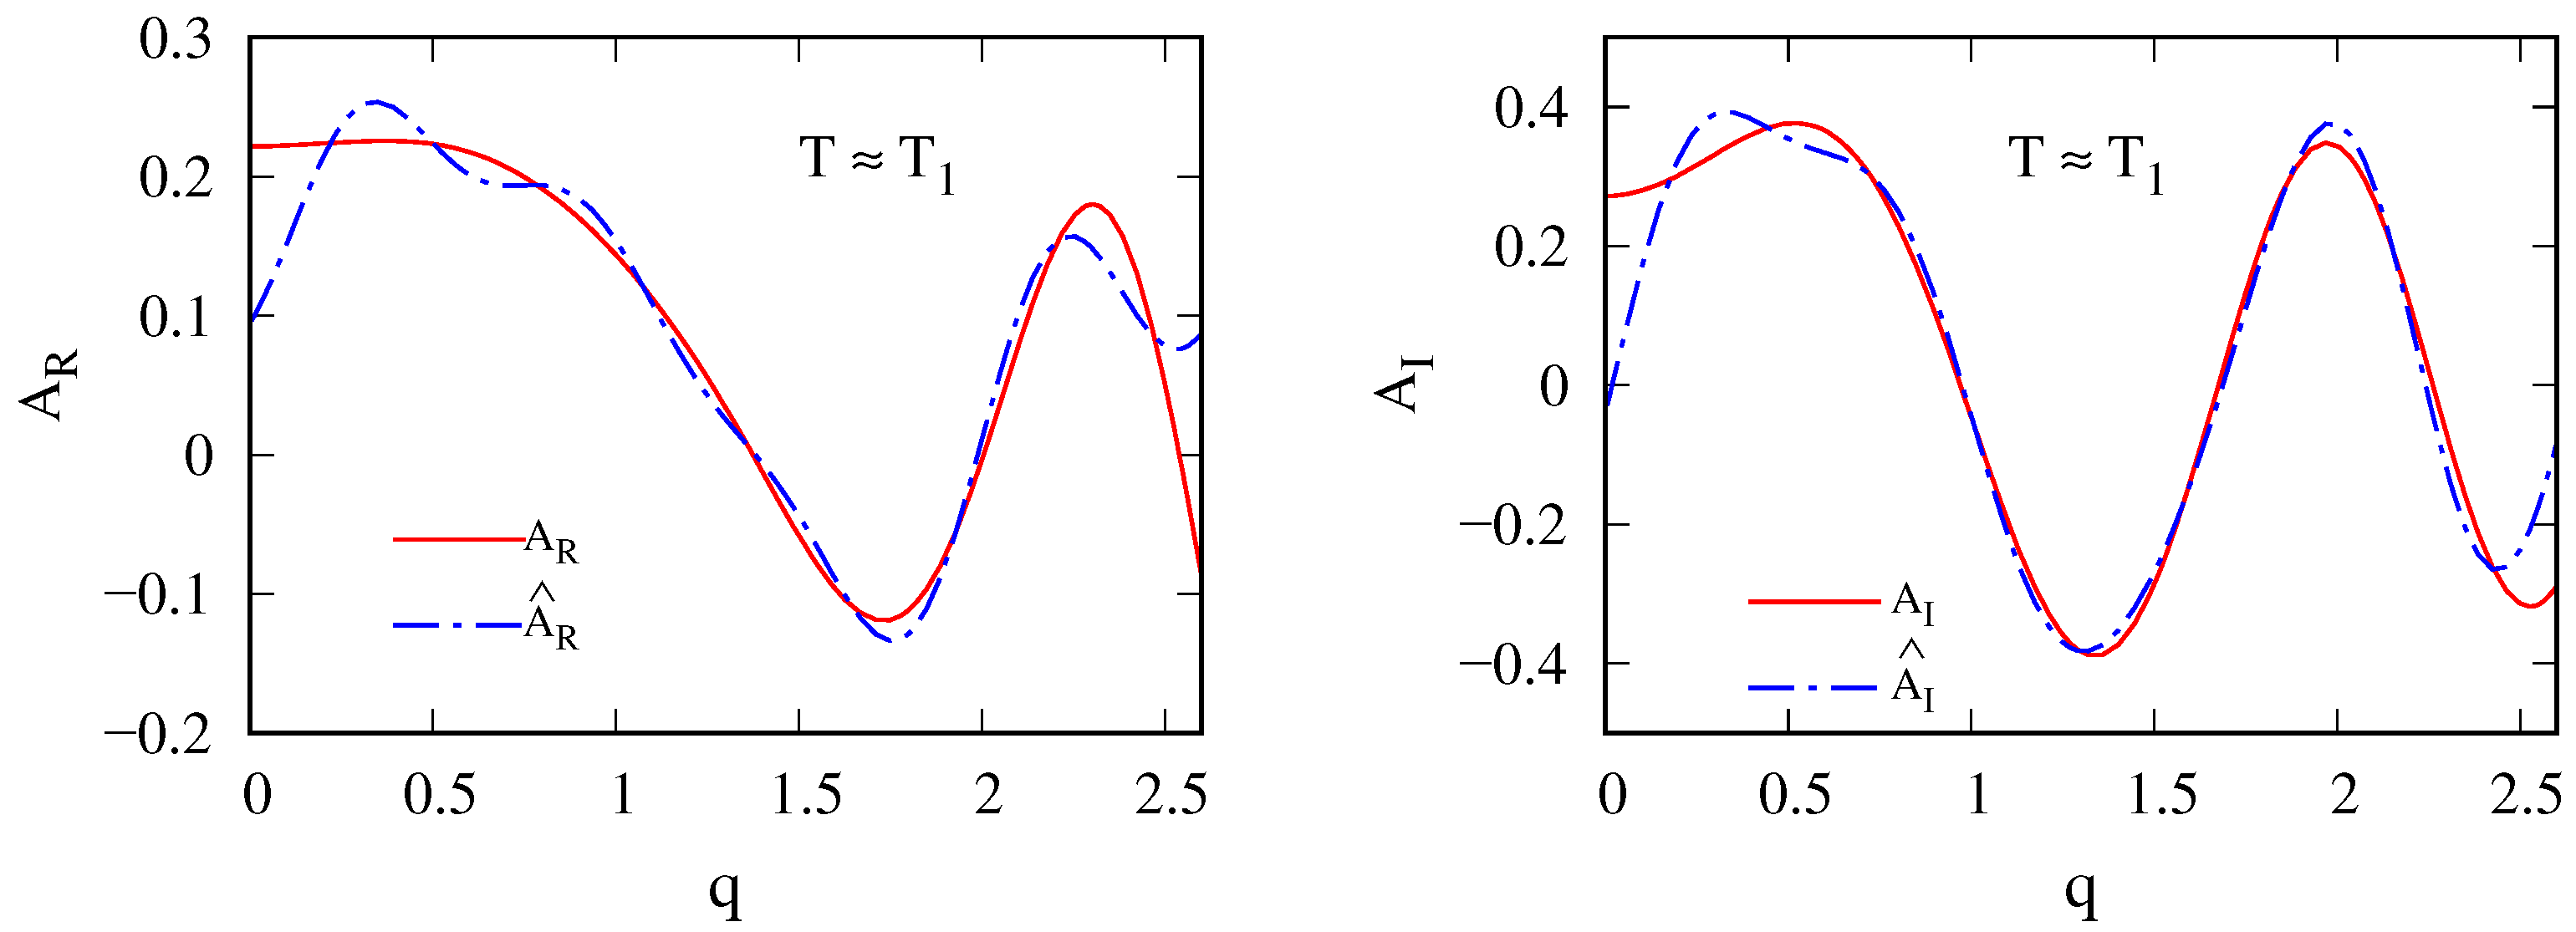
Figure 4 compares the real and imaginary parts of the wave amplitude function, A R and A I , for the target ship hull as obtained from the Neumann–Michell (NM) theory (red solid lines) using (6)–(10), with the corresponding Fourier series approximations A ^ R and A ^ I (blue dot-dashed derived from (19) and (20). The period is taken as T T 1 according to Equation (22), and the number of terms retained in the Fourier series is N = 4 .
As illustrated in Figure 4, noticeable discrepancies appear near the endpoints of the interval q [ 0 , 2.6 ] between the Fourier series approximations A ^ R and A ^ I and the original amplitude functions A R and A I . These deviations stem from the discontinuities at the boundaries q 0 = 0 and q = 2.6 , where A R ( q 0 ) A R ( q ) and A I ( q 0 ) A I ( q ) . Such endpoint jumps violate the periodicity requirement underlying the Fourier series representation.
To enforce continuity at the boundaries, required for an accurate Fourier expansion, the wave amplitude functions A R and A I are extended as follows:
A R = A R with 0 q q A R ( q ) + [ A R ( 0 ) A R ( q ) ] ( q q ) with q q q + 1
A I = A I with 0 q q A I ( q ) + [ A I ( 0 ) A I ( q ) ] ( q q ) with q q q + 1
Here, a linear extension is appended over the interval [ q , q + 1 ] to ensure continuity at q = q , thereby mitigating Gibbs-type oscillations in the Fourier approximation.
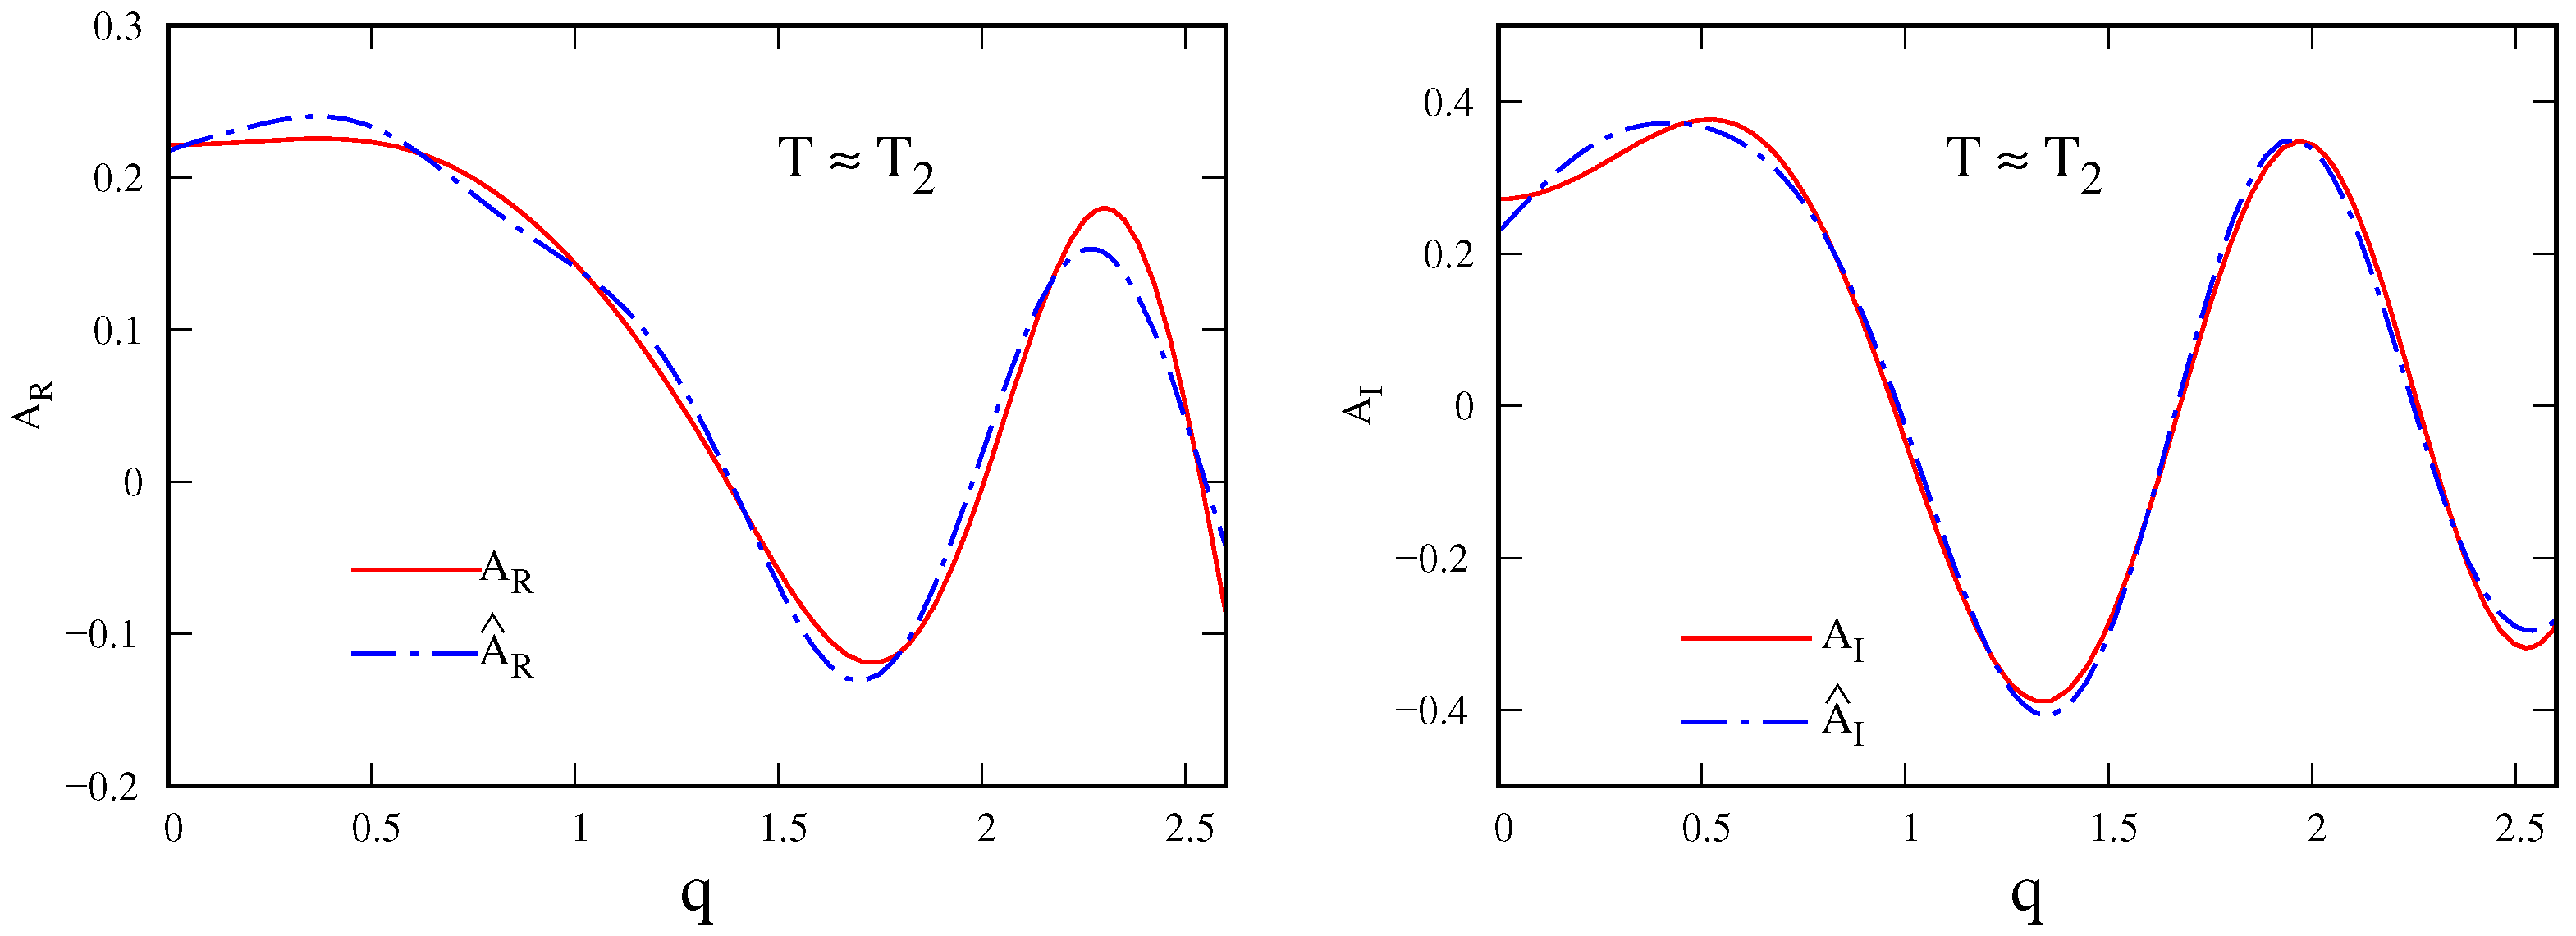
Figure 5 depicts the real part A R (left side) and the imaginary part A I (right side) of the wave amplitude function A = A R + i A I predicted via the NM theory predictions (6)–(10) (red solid lines), and the Fourier series fits (19) and (20) (blue dash–dot lines). Here, the extended period
T T 2
is used, and the amplitude functions are replaced by their extended versions A R and A I as defined in (23). It can be observed that the blue dashed lines ( A ^ R and A ^ I ) agree much more closely with the red solid lines ( A R and A I ) over the entire domain q [ 0 , 2.6 ] , including the endpoints q q 0 = 0 and q q = 2.6 . This improved fit demonstrates that the extended period T 2 associated with the extended functions A R and A I is more appropriate than T 1 for the Fourier series representation. Therefore, the extended period T 2 associated with the extended functions A R and A I is used hereafter.

3.2.2. Determination of the Number of Retained Terms N

To investigate the influence of the number of retained terms N, we considered three different values, N = 3 , 4 , 5 .
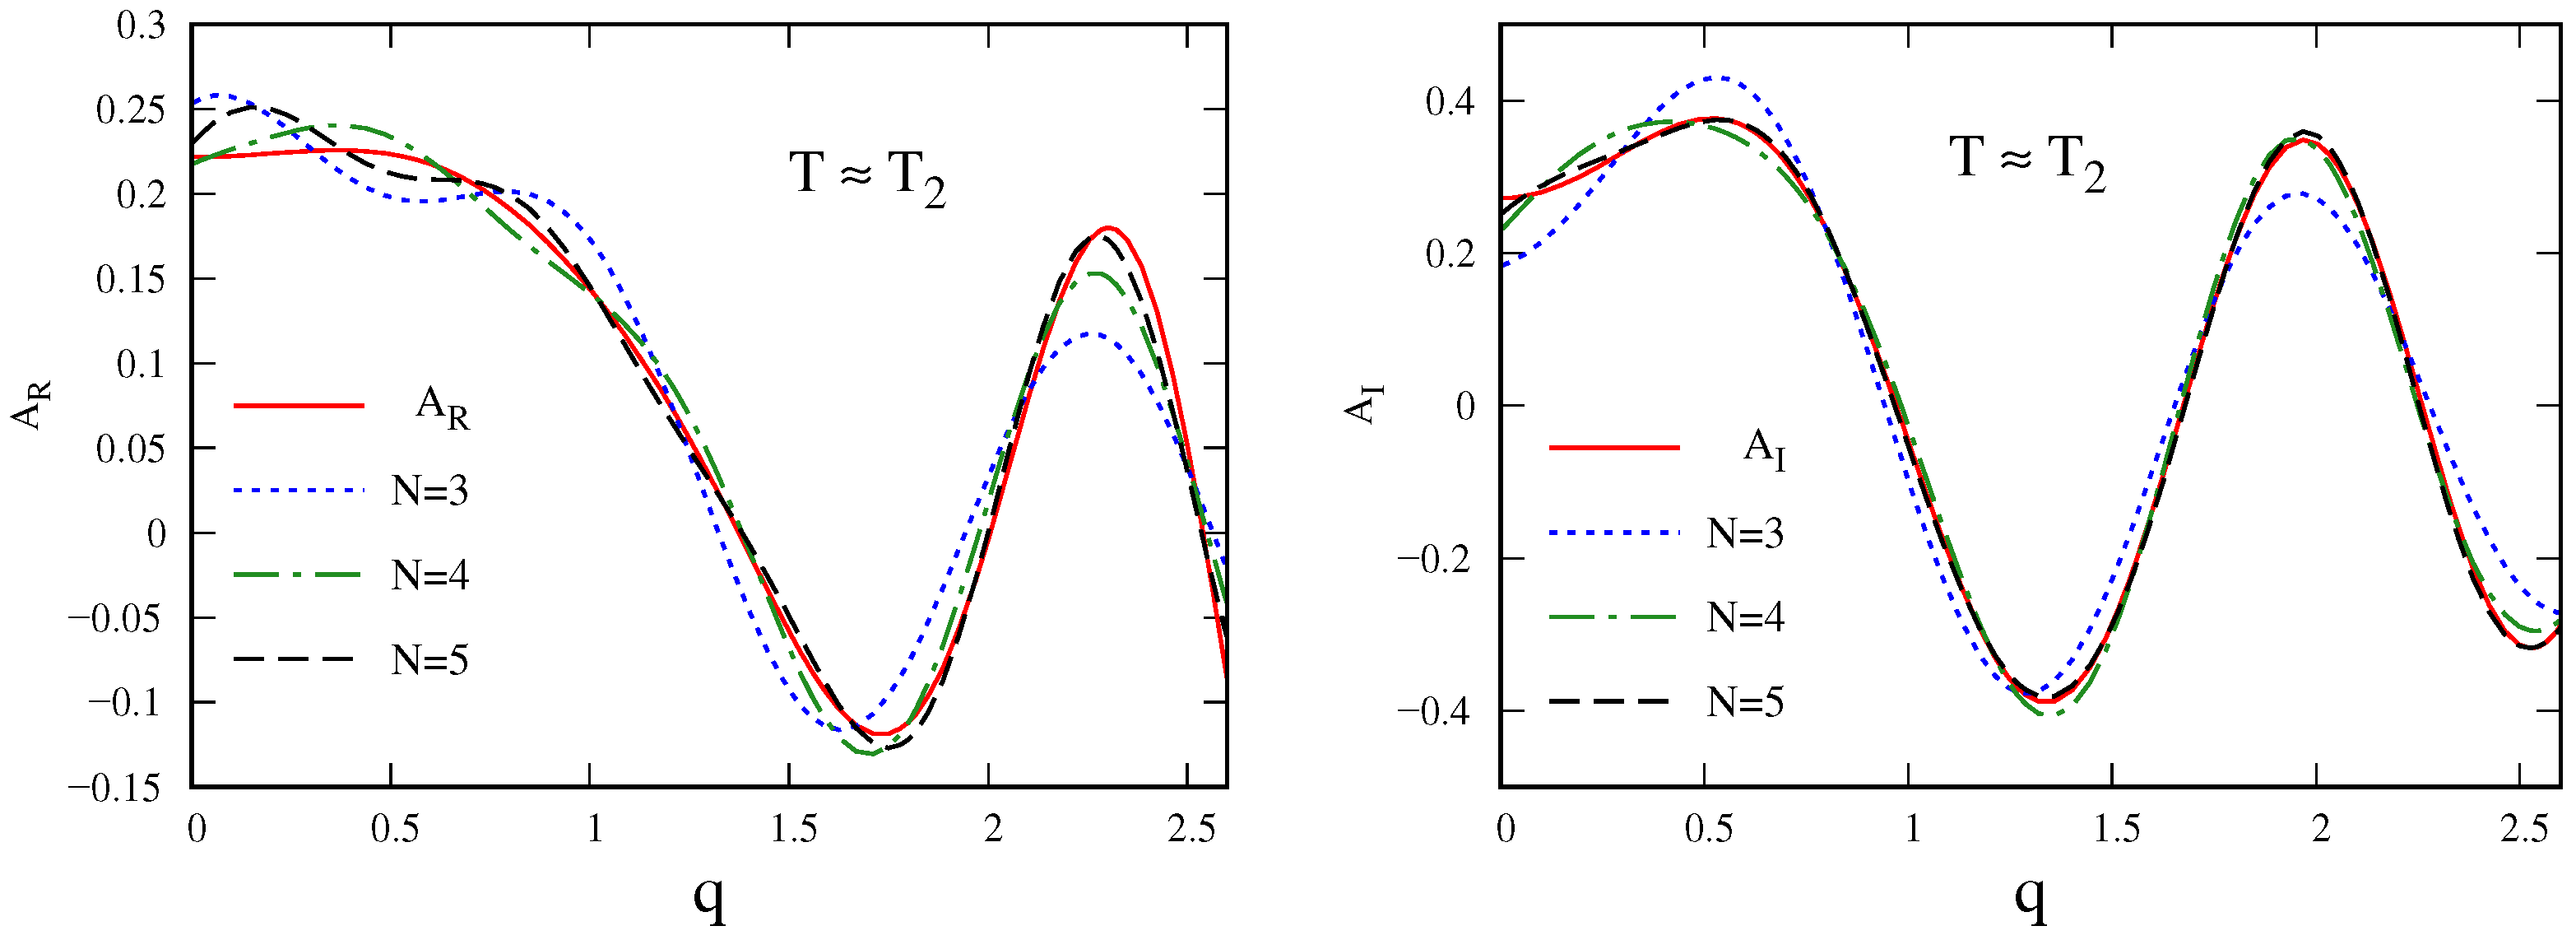
Figure 6 presents the wave amplitude functions A R (left) and A I (right) from NM theory (red solid lines), along with their Fourier series approximations using N = 3 (blue short-dashed lines), N = 4 (forest-green dot-dashed lines), and N = 5 (black long-dashed lines). The period is set to T = T 2 .
On the left side of Figure 6, the Fourier approximation A ^ R with N = 3 (blue short-dashed lines) exhibits significant deviations from the theoretical A R (red solid line) near q 0 and q 2.2 . Similarly, the right side shows clear discrepancies between the theoretical A I (red solid line) and its Fourier approximation A ^ I with N = 3 (blue short-dashed line) around q 0 , 0.5 , 2 , 2.5 . These results demonstrate that the Fourier series approximation with N = 3 introduces substantial errors.
However, the Fourier series approximations with N = 4 (forest-green dot-dashed lines) and N = 5 (black long-dashed lines) closely approximate the theoretical amplitude functions A R and A I (red solid lines) on both sides of Figure 6. This indicates that both N = 4 and N = 5 yield accurate representations of the amplitude functions.
Therefore, the lower value of N = 4 was selected for the Fourier series expansion in subsequent analyses.

3.3. Fourier Expansions of Wave Elevation

The wave elevation η in (11) can be expressed as the Fourier series expansions
η = η R + η I
η R = 1 π [ a R 0 2 R c 0 + n = 1 N ( a R n R c n + b R n R s n ) ]
η I = 1 π [ a I 0 2 I c 0 + n = 1 N ( a I n I c n + b I n I s n ) ]
based on the relation (17), where the Fourier series approximation A ^ of (19) is used. These expressions can be written in matrix form as
η R = C R B R
η I = C I B I
where the coefficient vectors C R and C I in (26a) and (26b) are defined as follows (with N = 4 as justified earlier):
C R 1 π [ R c 0 2 , R c 1 , R c 2 , R c 3 , R c 4 , R s 1 , R s 2 , R s 3 , R s 4 ]
C I 1 π [ I c 0 2 , I c 1 , I c 2 , I c 3 , I c 4 , I s 1 , I s 2 , I s 3 , I s 4 ]
The coefficients R c n , I c n , R s n , and I s n in (27a) and (27b) are defined as follows:
R c n = cos ( n ω q T ) cos ( φ ˜ T ) φ T + cos ( n ω q D ) cos ( φ ˜ D ) φ D
I c n = cos ( n ω q T ) sin ( φ ˜ T ) φ T + cos ( n ω q D ) sin ( φ ˜ D ) φ D
R s n = sin ( n ω q T ) cos ( φ ˜ T ) φ T + sin ( n ω q D ) cos ( φ ˜ D ) φ D
I s n = sin ( n ω q T ) sin ( φ ˜ T ) φ T + sin ( n ω q D ) sin ( φ ˜ D ) φ D
The parameters φ ˜ T and φ ˜ D are defined as
φ ˜ T = h φ T π / 4 and φ ˜ D = h φ D + π / 4
where h denotes the distance given in (13). Here, φ T and φ D are the phase functions defined in (14), where the wavenumber parameter q is taken as the transverse wavenumber q T or the divergent wavenumber q D , respectively.
The wave amplitude coefficient vectors B R T and B I T in (26a) and (26b) are defined as follows:
B R T [ a R 0 , a R 1 , a R 2 , a R 3 , a R 4 , b R 1 , b R 2 , b R 3 , b R 4 ]
B I T [ a I 0 , a I 1 , a I 2 , a I 3 2 , a I 4 , b I 1 , b I 2 , b I 3 , b I 4 ]

3.4. Inverse Estimation of the Wave Amplitude Function

The Kelvin ship wave elevations at 18 field points ( X ˜ , Y ˜ ) for the target hull are summarized in Table 2. These points are randomly selected within the Kelvin wake angle ψ 19 . 47 , and the corresponding wave elevations are numerically computed using Equations (11)–(16). The resulting wave patterns are also illustrated in Figure 2. These data, together with the ship length L s = 110 m and the ship speed V s = 9.85 m/s, are used to inversely determine the wave amplitude function via (25)–(29). The resulting Fourier coefficients a R n , b R n , a I n , and b I n (for n = 0 , 1 , 2 , 3 , 4 ) of the wave amplitude function A ^ are listed in Table 3 and Table 4.
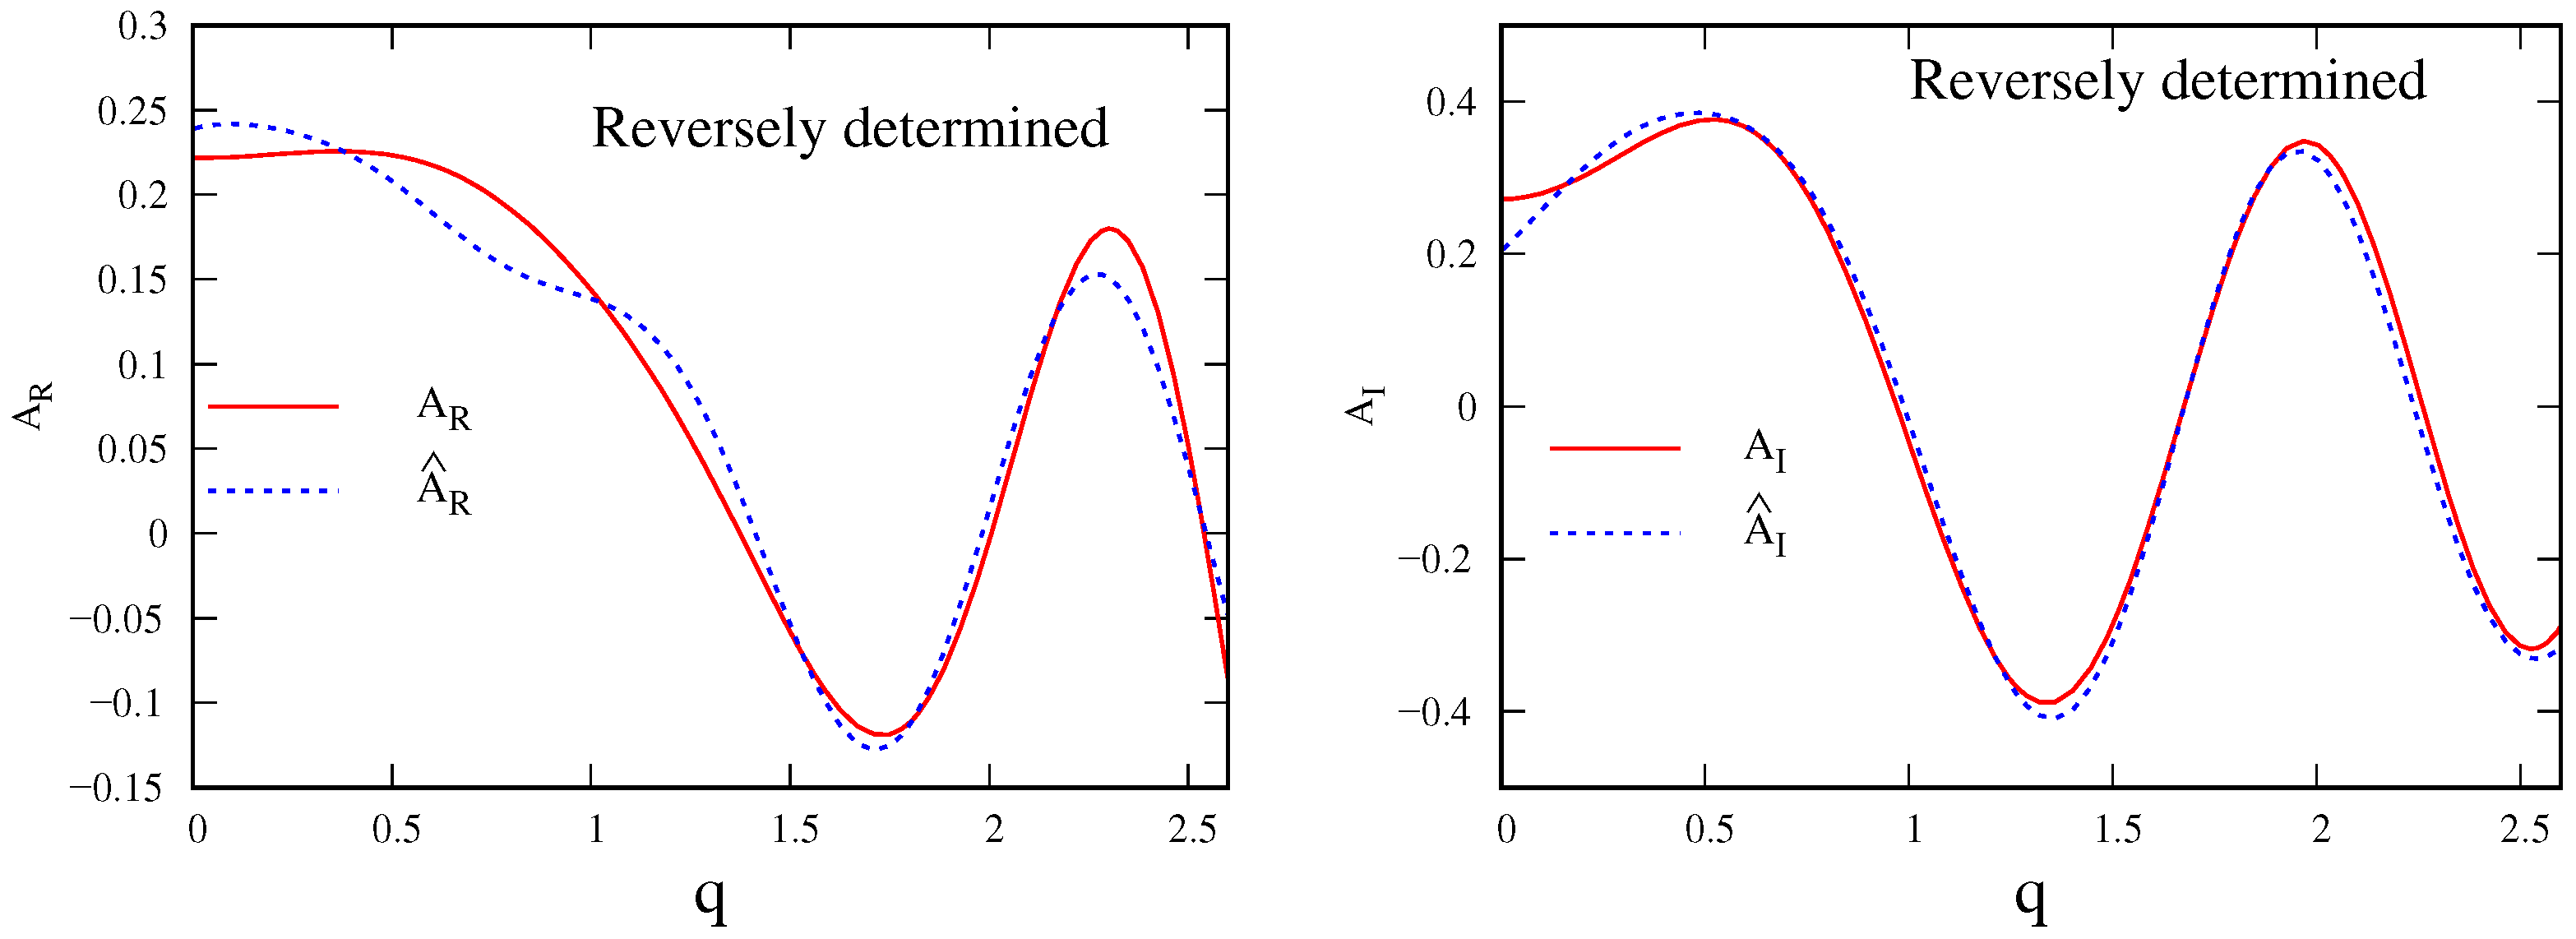
In Figure 7, the red solid lines represent the real part A R (left) and the imaginary part A I (right side) of the wave amplitude function A = A R + i A I , which corresponds to the simulated Kelvin wave pattern of the target ship hull shown in Figure 2. The blue dashed lines indicate the inversely determined approximations A ^ R and A ^ I , derived from the 18 Kelvin wave points listed in Table 2. Note that the simulated A R and A I have previously been presented in Figure 1, Figure 2, Figure 3 and Figure 4, and the resulting Fourier coefficients a R n , b R n , a I n , and b I n (for n = 0 , 1 , 2 , 3 , 4 ) of A ^ R and A ^ I are provided in Table 3.
Figure 7 demonstrates that the inversely reconstructed wave amplitude functions A ^ R and A ^ I (blue dashed lines) agree closely with the simulated values A R and A I (red solid lines). This agreement confirms that the proposed method effectively recovers the wave amplitude function.
The recovered wave amplitude components A ^ R and A ^ I shown in Figure 7 will be further employed to estimate the displacement volume of the ship below the calm water surface.

4. Determination of Ship Displacement Volume

4.1. Candidate Hull Form Database

A candidate hull form database consisting of four distinct hull series is used to identify hull forms similar to a given target vessel by comparing their wave amplitude functions. Each series is constructed by scaling one of four established benchmark hulls (namely the Wigley, S60, DTMB 5415, and KCS) using separate scaling factors r b for the beam and r d for the draught. These four benchmark hulls were selected for their significant geometric differences, ensuring a diverse and representative candidate set.
The non-dimensional beam b B / L s and draught d D / L s of the original Wigley, S60, DTMB5415, and KCS ship hulls are given by
( b w , b s , b d , b k ) = ( 0.100 , 0.130 , 0.134 , 0.139 )
( d w , d s , d d , d k ) = ( 0.063 , 0.052 , 0.043 , 0.0465 )
The beam ratio r b and the draught ratio r d are defined as
r b = b / b w , s , d , k and r d = d / d w , s , d , k
where the superscript ( w , s , d , k ) denotes the Wigley, S60, DTMB 5415, and KCS hulls, respectively.
Each of the four hull series comprises nine variations, generated by systematically varying the beam and draught ratios r b and r d according to the following combination sequence:
r b = { 1 , 0.8 , 0.9 , 1.1 , 1.2 , 1 , 1 , 1 , 1 }
r d = { 1 , 1 , 1 , 1 , 1 , 0.8 , 0.9 , 1.1 , 1.2 }

4.2. Characteristics of the Wave Amplitude Function

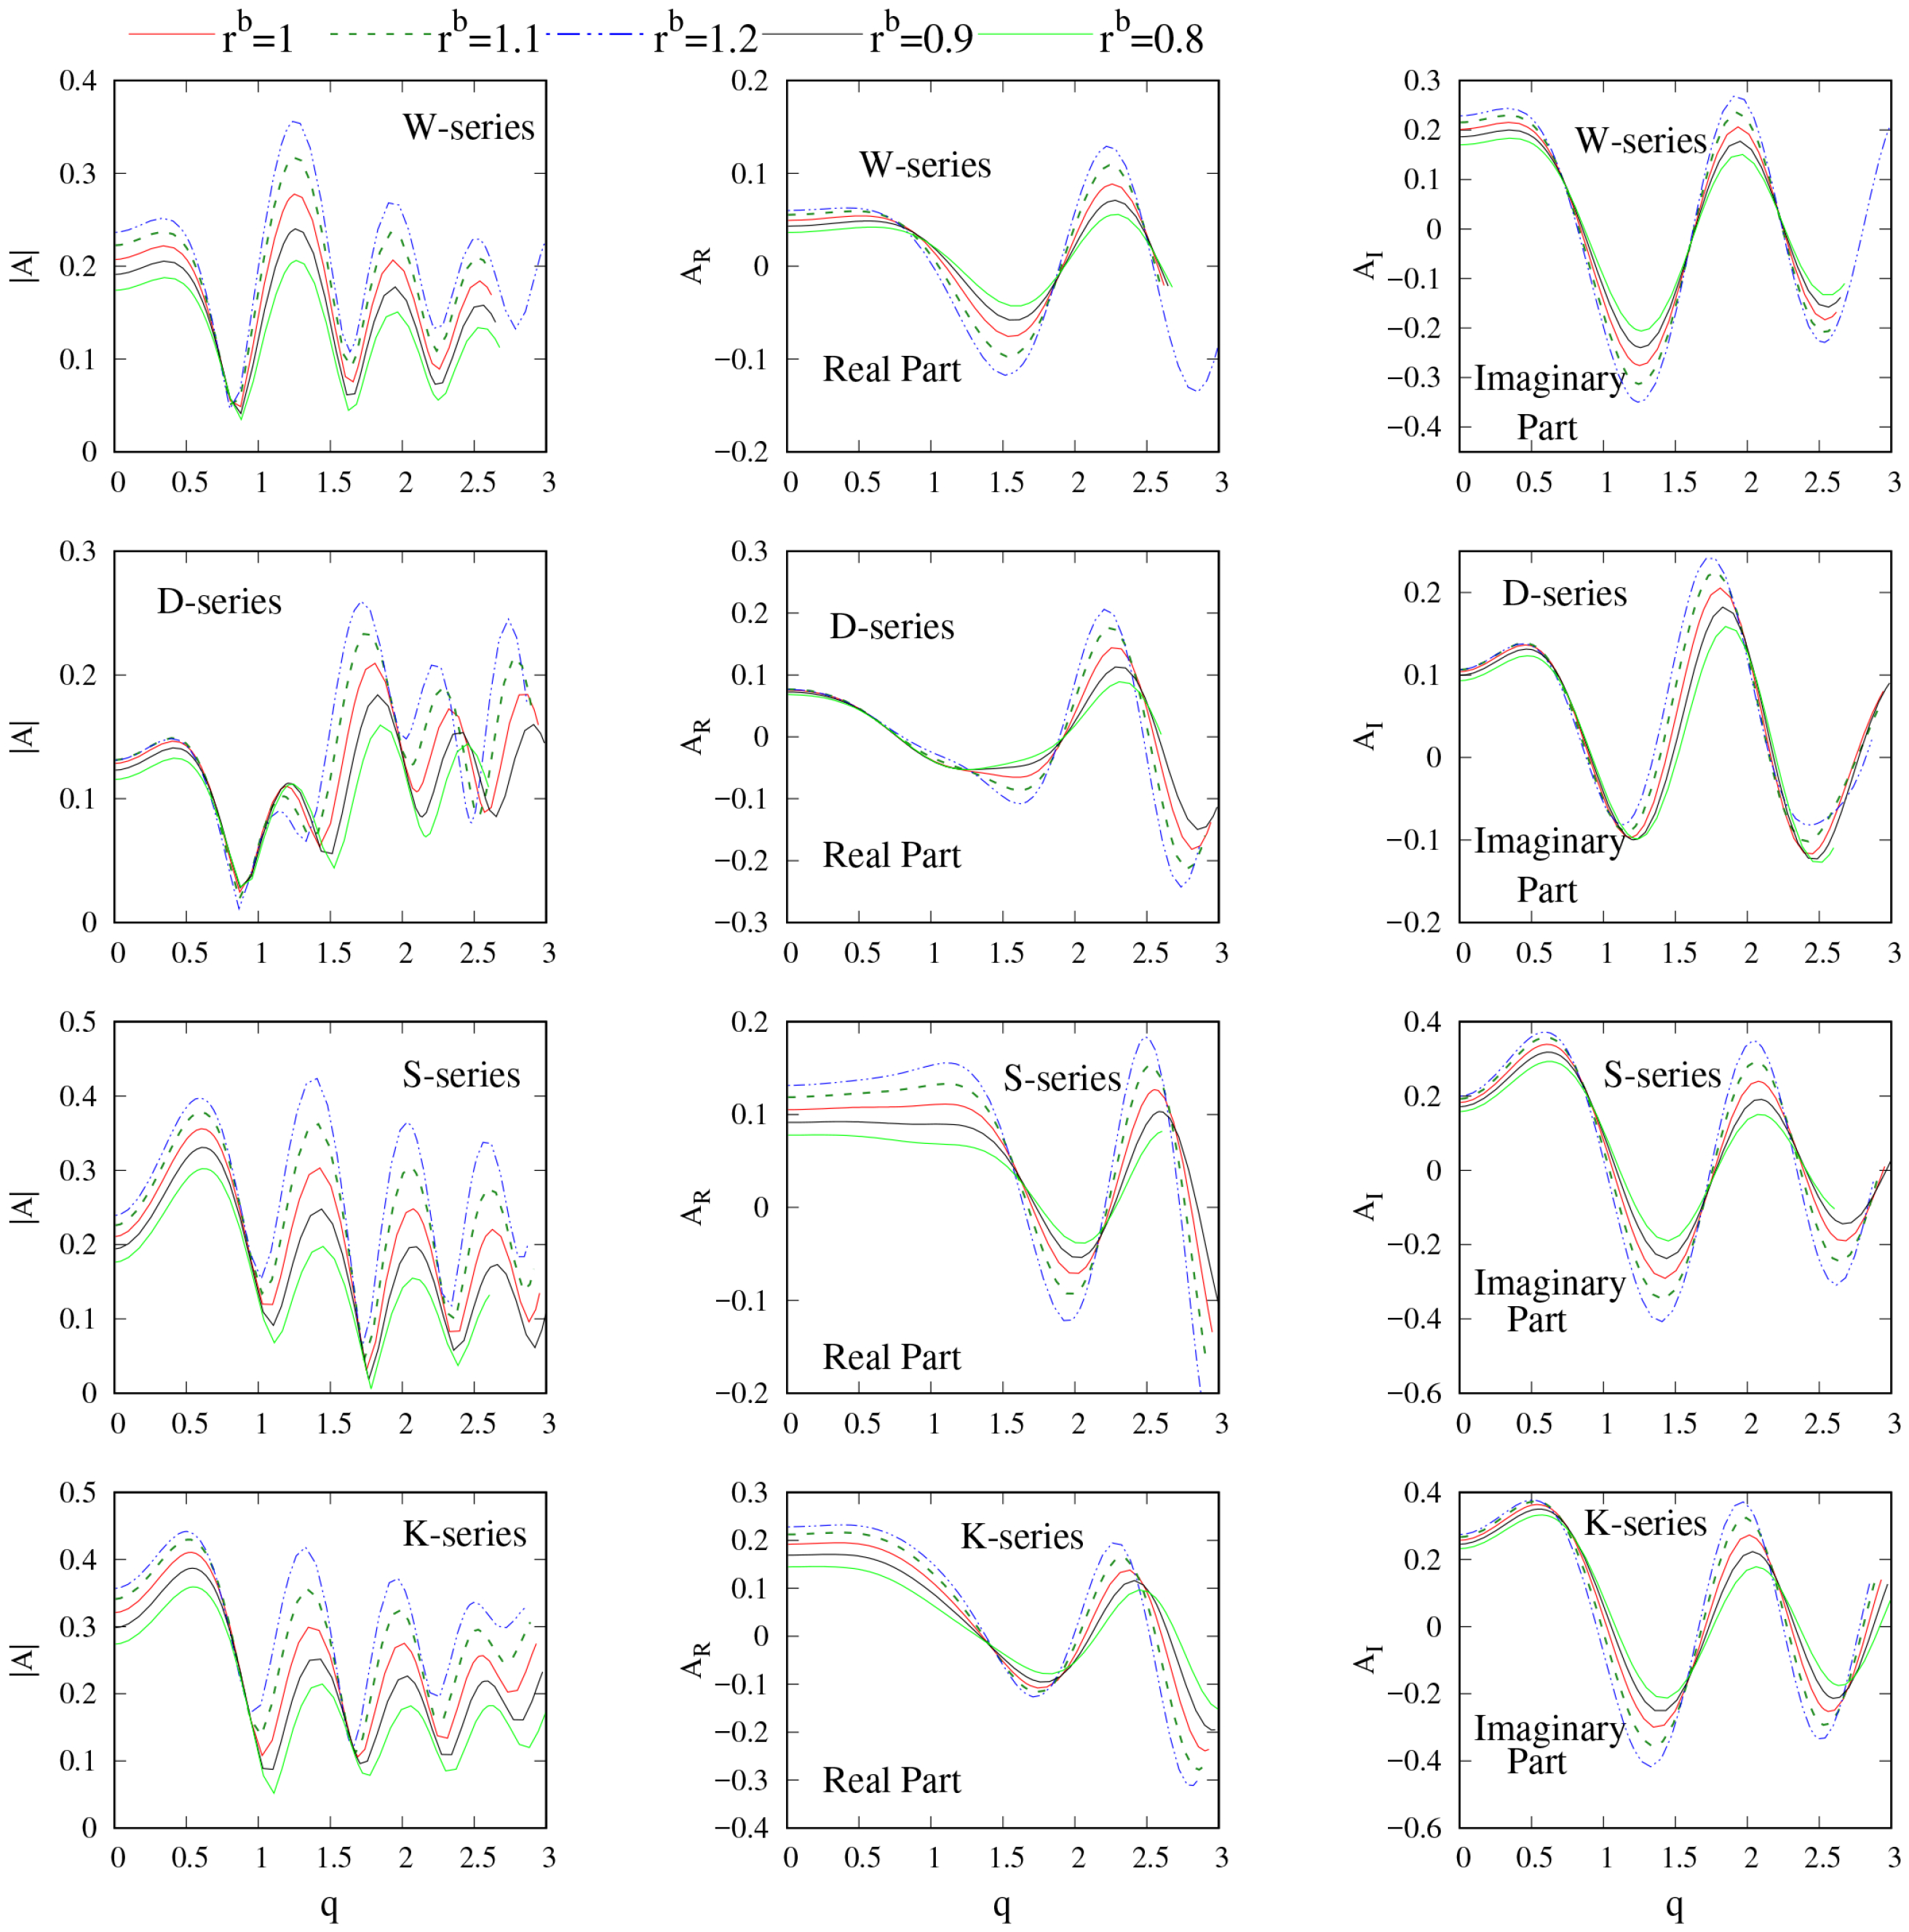
The influence of the beam ratio r b on the wave amplitude function A = A R + i A I is illustrated in Figure 8. Figure 8 presents the magnitude | A | along with the real part A R and the imaginary part A I of the wave amplitude function for hulls derived from the parent hull forms, including Wigley (top row), DTMB 5415 (second row), S60 (third row), and KCS (bottom row), with beam ratios r b = 0.8 , 0.9 , 1 , 1.1 , 1.2 . Note that the draught remains unscaled in these cases, i.e., r d = 1 .
Figure 8 shows that the peak values (i.e., the local maxima, also indicated in Figure 1) of | A | , A R , and A I follow a consistent descending order: blue dot-dashed line ( r b = 1.2 ), forest-green dashed line ( r b = 1.1 ), solid red line ( r b = 1 ), black solid line ( r b = 0.9 ), and light-green solid line ( r b = 0.8 ). This order aligns precisely with the decreasing beam ratio r b : 1.2 > 1.1 > 1.0 > 0.9 > 0.8 . Furthermore, the peak values are approximately proportional to the increase in ship beam b for a given hull form, as already reported by Ma et al. [15].
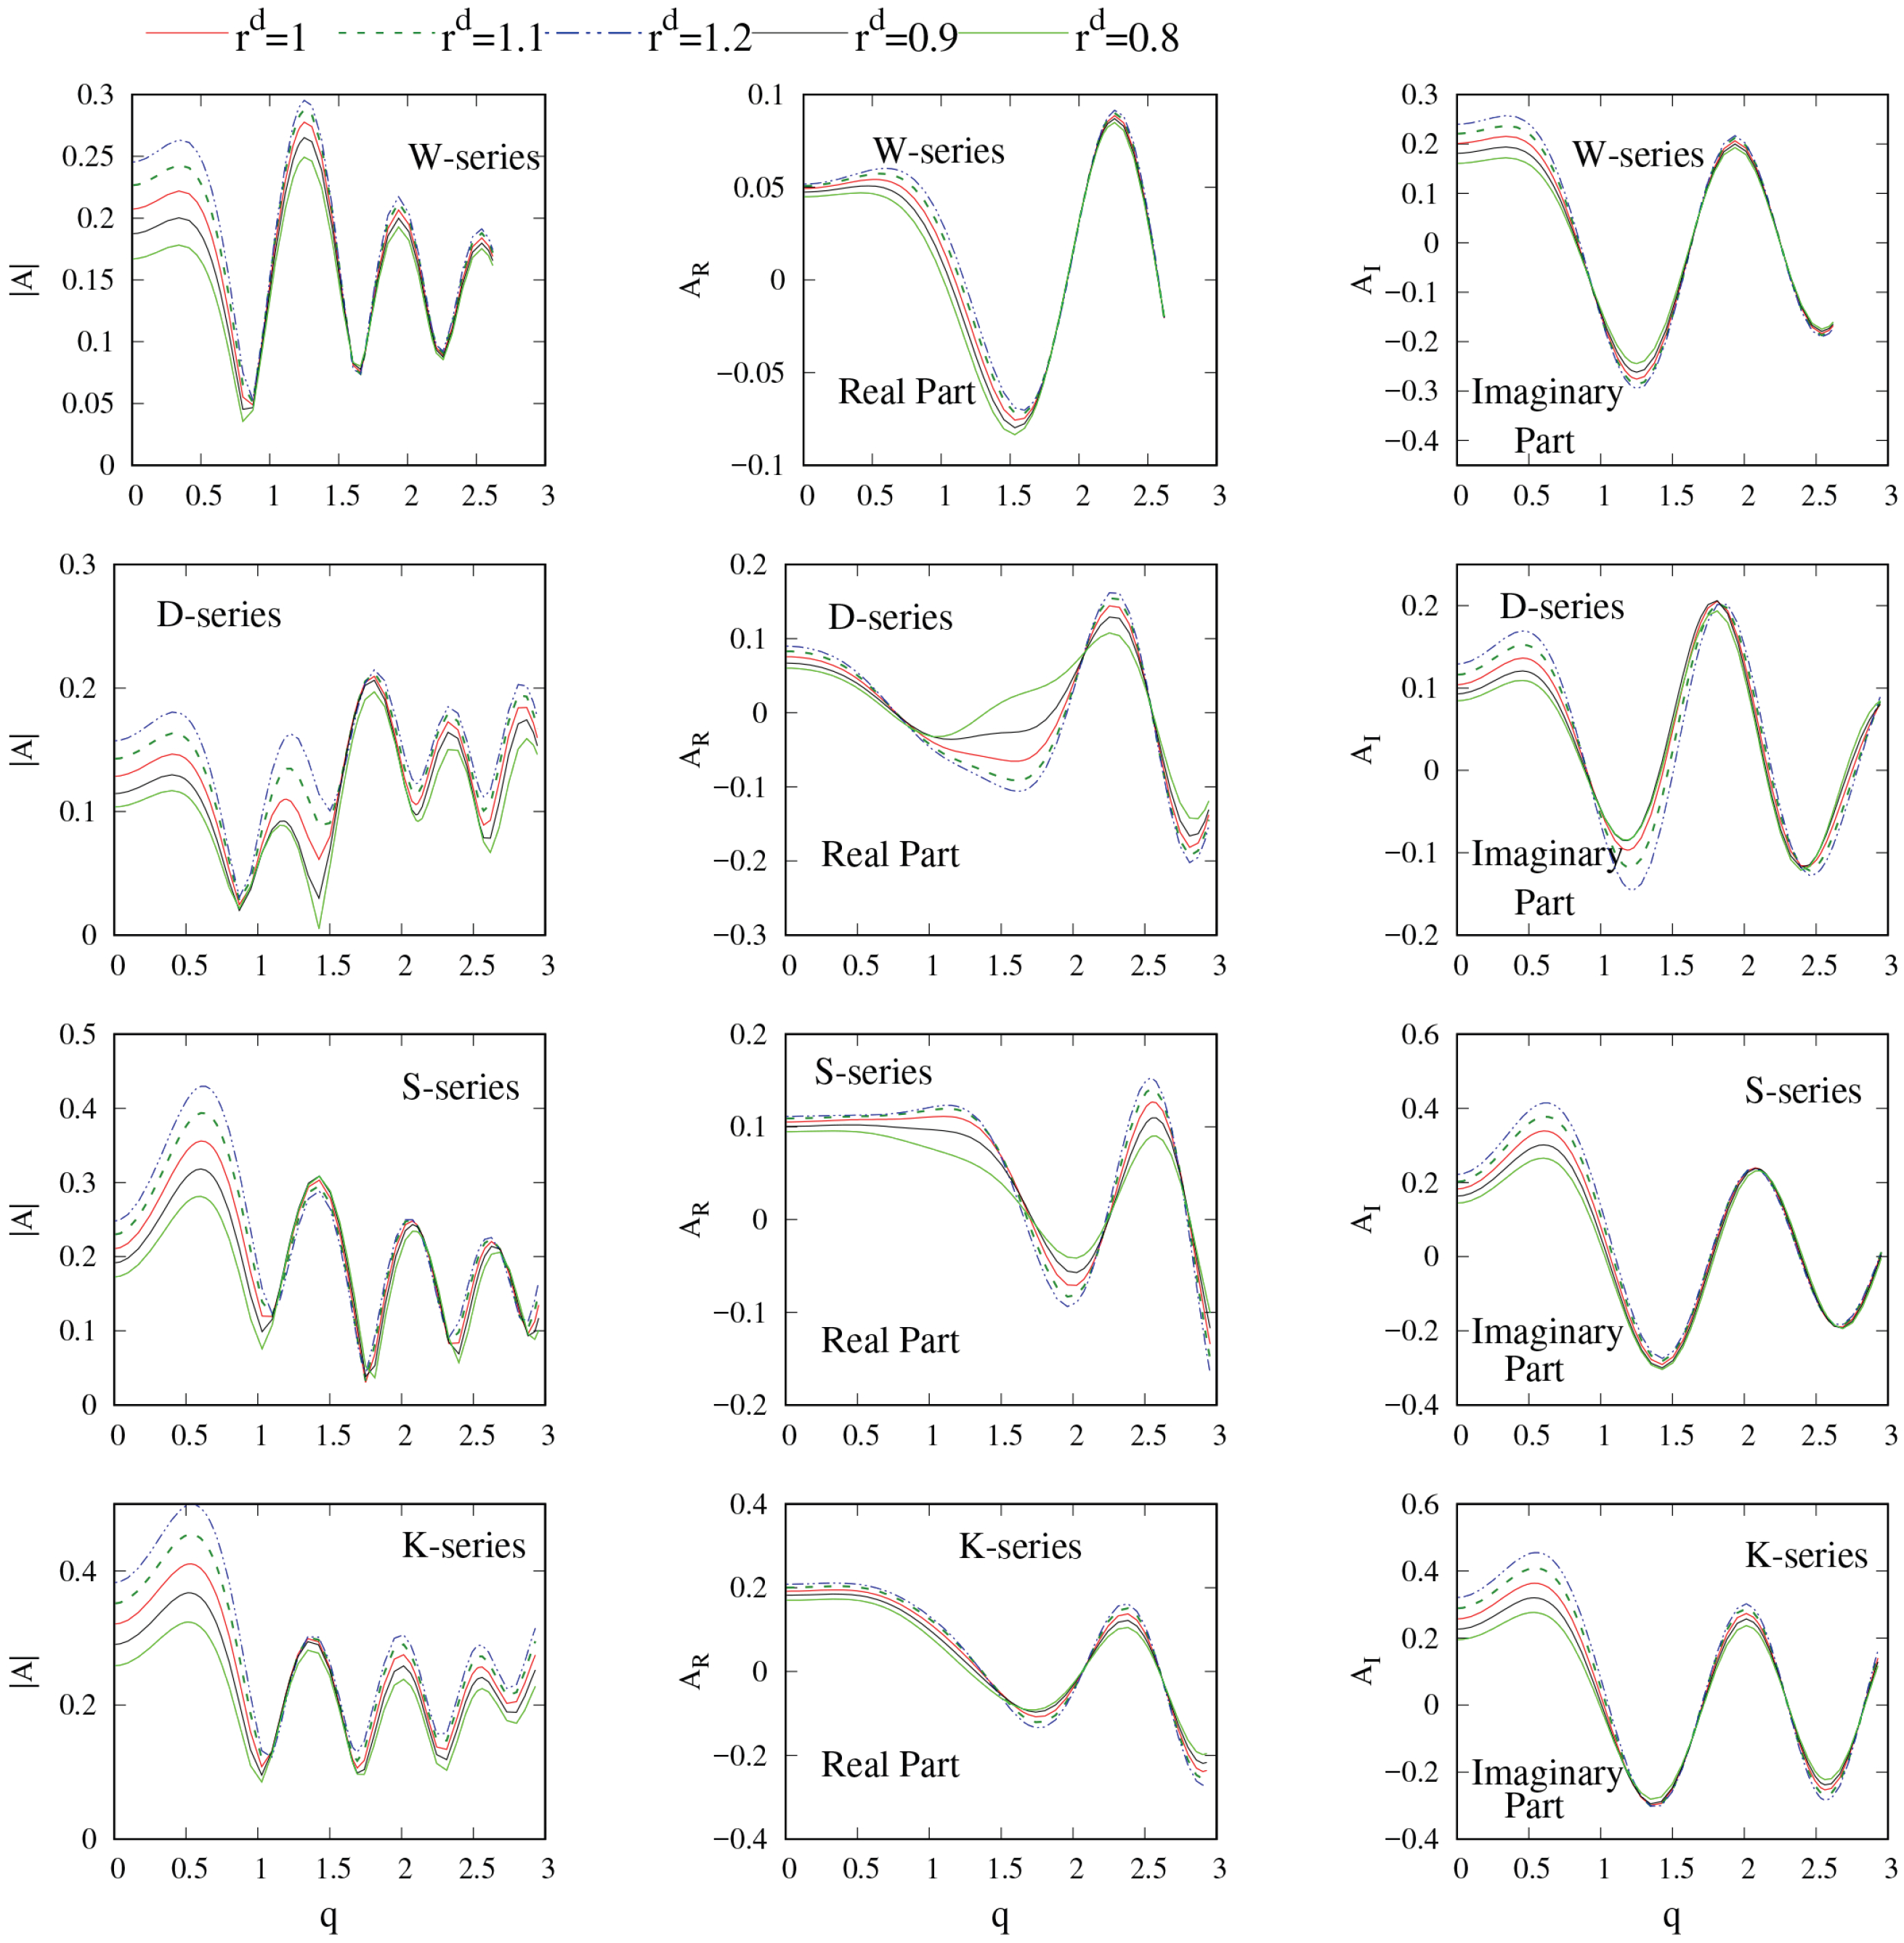
The influence of the draught ratio r d on the the wave amplitude function A = A R + i A I is illustrated in Figure 9. This figure illustrates the magnitude | A | , the real part A R , and the imaginary part A I of the wave amplitude function A = A R + i A I for ship hulls with different draught ratios r d = 0.8 , 0.9 , 1 , 1.1 , 1.2 , derived from the same parent hulls: Wigley (top row), DTMB5415 (second row), S60 (third row), and KCS (bottom row). Here, the beam remains unscaled (i.e., r b = 1 ).
Figure 9 demonstrates that the peak values (i.e., the local maxima, also indicated in Figure 1) of | A | , A R , and A I exhibit the same descending order across line styles, which corresponds to the decreasing draught ratio: 1.2 > 1.1 > 1.0 > 0.9 > 0.8 . Moreover, the peak values are approximately proportional to the increase in draught for a given hull form, as already reported by Ma et al. [15].
Therefore, the amplitudes of peaks and troughs in the wave amplitude function can serve as identifying features of the hull form type and may further be used to estimate its volume.

4.3. Inverse Prediction of Displacement Volume

The discrepancy between the Fourier series-fitted wave amplitude function A ^ for the target hull and the reference function A for the four candidate hull form series, as shown in Figure 8 and Figure 9, is quantified by the following measure:
= i = 1 3 | A ^ i p | | A i p | + | A ^ i v | | A i v |
Here, | A ^ i p | and | A i p | (for n = 1 , 2 , 3 ) denote the magnitudes of the first three peaks of A ^ p and A p , respectively, while | A ^ i v | and | A i v | (for n = 1 , 2 , 3 ) represent the magnitudes of the first three valleys. The first three peaks and valleys are the most prominent features of the Kelvin ship wake pattern and are therefore used in this comparison.
The objective function
m i n ( )
is minimized to identify the most similar ship hull and provide an initial estimate of its displacement volume, denoted as 1 , as summarized in Table 5.
Table 5 lists the magnitudes of the first three peaks and valleys of the wave amplitude function | A | for each of the four candidate hull forms in the database, along with the discrepancy defined in Equation (31) between | A | and the inversely recovered wave amplitude function A ^ of the target ship hull.
Among the 36 candidate hulls, the minimum value of is found to be 0.116 , corresponding to hull No. 8 in the K-series, which is thus selected as the most similar hull. For this hull, the scaling ratios correspond to the 8th element in the sequence given by Equation (30), namely r b = 1 and r d = 1.1 . The block coefficient C b for the KCS ship hull is C b k = 0.651 , and the non-dimensional beam b k and draught d k are b k = 0.139 and d k = 0.0465 . Hence, the displacement volume 1 of the target ship hull is then calculated as
1 = C b k × b k × d k × ( L s ) 3 × r b × r d = 6160.55 m 3
where the coefficients C b k , b k , d k , r b , and r d collectively represent the geometric characteristics of the similar hull. Here, L s = 110 m denotes the length of the target ship. In practical applications, the ship length can be determined through measurements of the hull geometry or inferred from features of the Kelvin wake pattern.
The actual ship length L s = 110 m is taken here, and the ship length can be determined in a real case via the measurements of the ship’s geometry or the characteristics of Kelvin ship waves.
The magnitude of the wave amplitude function is approximately proportional to the ship’s beam and draft (and thus to the displacement volume) for a given hull type, as illustrated in Figure 8 and Figure 9 and previously shown in [19]. Therefore, the initially estimated displacement volume 1 is further adjusted by incorporating the difference in wave amplitude function between the target ship hull and the selected candidate hull. The correction is applied using a factor α as follows:
α 1
where the factor α is defined as
α = 1 3 i = 1 3 | A ^ i p | | A i p |
This yields a corrected displacement volume of
6591.80 m 3 with α = 1.07
The prediction error is calculated as
E r r o r = | 1 t | 4.02 %
where t = 4337 m 3 denotes the actual displacement volume of the target ship, as provided in Table 1.

5. Conclusions

A practical framework for the inverse estimation of a ship’s displacement volume is presented, incorporating two key extensions.
First, the wave amplitude function is reconstructed using Fourier series expansions combined with the stationary phase method, parameterized by the period T and the number of retained terms N. The displacement volume is then determined via a two-step estimation–refinement procedure: an initial estimate identifies the most similar hull from a candidate database, and a subsequent refinement incorporates discrepancies between the target and candidate wave amplitude functions.
The hull corresponding to the minimum discrepancy measure , No. 8 in the K-series, is selected as the most similar. The resulting inversely predicted displacement volume for this case is = 6591.8   m 3 , with a relative error of 4.06 % , demonstrating the accuracy of the proposed approach.
To improve practical applicability, future work should incorporate real random wave effects and address uncertainties in ship length, speed, and location. The risk of misidentifying similar hulls should also be systematically evaluated.

Author Contributions

Software, B.C.; Validation, L.W., Y.Z. and H.Y.; Investigation, H.H.; Writing—original draft, C.M. All authors have read and agreed to the published version of this manuscript.

Funding

This research was funded by the Open Fund of Key Laboratory of High Performance Ship Technology (Wuhan University of Technology), Ministry of Education (No. gxnc23052802), and the National Natural Science Foundation of China [grant numbers 52301383].

Data Availability Statement

The original contributions presented in this study are included in the article. Further inquiries can be directed to the corresponding author(s).

Conflicts of Interest

The authors declare no conflicts of interest.

References

  1. Fan, K.; Zhang, H.; Liang, J.; Chen, P.; Xu, B.; Zhang, M. Analysis of ship wake features and extraction of ship motion parameters from SAR images in the Yellow Sea. Front. Earth Sci. 2019, 13, 588–595. [Google Scholar] [CrossRef]
  2. Shariati, S.; Hossein, M. Identification of underwater vehicles using surface wave pattern. Appl. Ocean. Res. 2018, 78, 281–289. [Google Scholar] [CrossRef]
  3. Newman, N. The Inverse Ship-Wave Problem. In Proceedings of the Sixth International Workshop on Water Waves and Floating Bodies, Manchester, UK, 25–28 March 1990; MIT: Cambridge, MA, USA, 1991; pp. 193–197. [Google Scholar]
  4. Wu, Z. On the Estimation of a Moving Ship’s Velocity and Hull Geometry Information from its Wave Spectra. Ph.D. Thesis, University of Michigan, Ann Arbor, MI, USA, 1991. [Google Scholar]
  5. Zilman, G.; Zapolski, A.; Marom, M. SAR Imaging of Ship Wakes and Inverse Ship Wake Problem; IWWWFB Workshop: Ramat-Aviv, Israel, 2004. [Google Scholar]
  6. Wang, J.; Guo, L.; Wei, Y.; Chai, S. Study on ship Kelvin wake detection in numerically simulated SAR images. Remote Sens. 2023, 15, 1089. [Google Scholar] [CrossRef]
  7. O’Connor, L.; Lecoanet, D.; Anders, E.H.; Augustson, K.C.; Burns, K.J.; Vasil, G.M.; Brown, B.P. Iterative methods for Navier-Stokes inverse problems. Phys. Rev. 2024, 109, 045108. [Google Scholar] [CrossRef] [PubMed]
  8. Zhai, L.; Gong, Y.; Zhang, X. An ALoGI PU Algorithm for Simulating Kelvin Wake on Sea Surface Based on Airborne Ku SAR. Sensors 2025, 25, 4508. [Google Scholar] [CrossRef] [PubMed]
  9. Song, M.; Wang, S.; Zhao, P.; Chen, Y.; Wang, J. Modeling Kelvin wake imaging mechanism of visible spectral remote sensing. Appl. Ocean. Res. 2021, 113, 102712. [Google Scholar] [CrossRef]
  10. Xu, C.; Qi, R.; Wang, X.; Sun, Z. Identifiability of Kelvin wakes in SAR imageries: The role of time-varying characteristics and decoherence effect of wake. IEEE J. Sel. Top. Appl. Earth Obs. Remote Sens. 2025, 18, 20197–20213. [Google Scholar] [CrossRef]
  11. Hao, X. Inferring free surface disturbance properties from Kelvin wakes using convolutional neural network. Flow 2025, 5, E9. [Google Scholar] [CrossRef]
  12. Liang, H.; Li, Y.; Chen, X. An Earth-fixed observer to ship waves. J. Fluid Mech. 2024, 984, A14. [Google Scholar] [CrossRef]
  13. Gao, M.; Fang, S.; Wan, L.; Kang, W.; Ma, L.; He, Y.; Zhao, K. Ship-VNet: An algorithm for ship velocity analysis based on optical remote sensing imagery containing Kelvin wakes. Electronics 2024, 13, 3468. [Google Scholar] [CrossRef]
  14. Rizaev, G.; Achim, A. A Synthetic SAR dataset for deep learning classification of ships at sea. Remote Sens. 2022, 14, 3999. [Google Scholar] [CrossRef]
  15. Ma, C.; Liu, Z.; Yang, Y.; Zhan, C.; Chen, X.; Feng, B.; Chang, H. The reverse prediction of the ship principal dimensions based on the Kelvin ship waves. Ocean. Eng. 2023, 285, 115308. [Google Scholar] [CrossRef]
  16. Noblesse, F.; Huang, F.; Yang, C. The Neumann–Michell theory of ship waves. J. Eng. Math. 2013, 79, 51–71. [Google Scholar] [CrossRef]
  17. Noblesse, F.; He, J.; Zhu, Y.; Hong, L.; Zhang, C.; Zhu, R.; Yang, C. Why can ship wakes appear narrower than Kelvin’s angle. Eur. J. Mech. B Fluids 2014, 46, 164–171. [Google Scholar] [CrossRef]
  18. Huang, F.; Yang, C.; Noblesse, F. Numerical implementation and validation of the Neumann–Michell theory of ship waves. Eur. J. Mech. B Fluids 2013, 42, 47–68. [Google Scholar] [CrossRef]
  19. Ma, C.; Zhan, C.; Peng, S.; Wu, D.; Dong, Z.; Fan, L.; Liu, Z. The near-field wave interference of the steadily advancing monohull ships. Ocean. Eng. 2023, 275, 114147. [Google Scholar] [CrossRef]
  20. Zhang, C.; He, J.; Zhu, Y.; Li, W.; Noblesse, F.; Huang, F.; Yang, C. Stationary phase and numerical evaluation of far-field and near-field ship waves. Eur. J. Mech. B Fluids 2015, 52, 28–37. [Google Scholar] [CrossRef]
Figure 1. The magnitude | A | of the wave amplitude function A = A R + i A I , along with its real part A R and the imaginary part A I , as predicted from flow computations using (6)–(10). The red circles indicate the positions of the peaks (local maxima) of | A | .
Jmse 13 02019 g001
Figure 2. The Kelvin wave pattern of the target ship hull determined via (11)–(16), which corresponds to the wave amplitude function shown in Figure 1.
Jmse 13 02019 g002
Figure 3. Side and bottom views of the target ship hull (below the calm waterline).
Jmse 13 02019 g003
Figure 4. The real part A R (left side) and the imaginary part A I (right side) of the wave amplitude function A = A R + i A I predicted via the NM theory predictions (6)–(10) (red solid lines), and the Fourier series fits (19a)–(20d) (blue dash–dot lines) with the period T T 1 .
Jmse 13 02019 g004
Figure 5. The real part A R (left side) and the imaginary part A I (right side) of the wave amplitude function A = A R + i A I predicted via the NM theory predictions (6)–(10) (red solid lines), and the Fourier series fits (19a)–(20d) (blue dash–dot lines). Here, the extended period T T 2 is used, and the amplitude functions are replaced by their extended versions A R and A I as defined in (23).
Jmse 13 02019 g005
Figure 6. The real part A R (left side) and the imaginary part A I (right side) of the wave amplitude function A = A R + i A I predicted via the NM theory predictions (6)–(10) (red solid lines), and the Fourier series fits (19a)–(20d) (blue dash-dot lines) with the retained term number N = 3 , 4 , or 5.
Jmse 13 02019 g006
Figure 7. The red solid lines represent the real part A R (left) and the imaginary part A I (right) of the wave amplitude function A = A R + i A I , corresponding to the simulated Kelvin wave pattern for the target ship hull shown in Figure 2. The blue dashed lines denote the inversely determined components A ^ R and A ^ I , obtained from the 18 Kelvin wave points provided in Table 2. The simulated A R and A I have been previously illustrated in Figure 1, Figure 2, Figure 3 and Figure 4, and the resulting Fourier coefficients a R n , b R n , a I n , and b I n (for n = 0 , 1 , 2 , 3 , 4 ) of A ^ R and A ^ I are listed in Table 3.
Jmse 13 02019 g007
Figure 8. The wave amplitude functions | A | (left), A R (midle), and A I (right) of the four hull series (W-series, D-series, K-series, and S-series) with different beam ratios r b = 1 , 1.1 , 1.2 , 0.9 , 0.8 .
Jmse 13 02019 g008
Figure 9. The wave amplitude functions | A | (left), A R (midle), and A I (right) of the four hull series (W-series, D-series, K-series, and S-series) with different draught ratios r d = 1 , 1.1 , 1.2 , 0.9 , 0.8 .
Jmse 13 02019 g009
Table 1. Principal dimensions of the target ship hull.
L s   ( m ) B  ( m ) D  ( m ) ( m 3 )
11017.525.116337
Table 2. The 18 Kelvin wave elevations of the target ship hull, associated with the coordinates ( X ˜ , Y ˜ ) .
No.E (m) X ˜ (m) Y ˜ (m)
11.335−214.13856.796
21.485−210.22854.214
30.201−208.2423.235
40.376−206.28930.98
50.113−206.2532.582
60.335−204.31218.071
7−1.456−180.89349.051
8−0.088−178.83923.235
9−1.322−175.02749.051
10−0.547−169.00115.49
11−1.108−161.2430.98
12−0.263−159.31136.143
130.551−157.38341.306
14−0.414−155.27115.49
15−0.428−151.38120.653
160.236−147.47823.235
170.092−145.417.745
180.34−141.54115.49
Table 3. The resulting Fourier coefficients a R n , b R n , a I n , and b I n (for n = 0 , 1 , 2 , 3 , 4 ) of the reversely determined wave amplitude function A ^ .
n01234
a R n 0.1430.0970.0290.077−0.036
b R n -0.0820.077−0.058−0.006
a I n 0.0960.1610.135−0.1770.036
b I n -0.0690.158−0.1030.057
Table 4. The resulting Fourier coefficients a R n , b R n , a I n , and b I n (for n = 0 , 1 , 2 , 3 , 4 ) of the reversely determined wave amplitude function A ^ .
Target Ship
10 | A 1 p | 10 | A 2 p | 10 | A 3 p | 10 | A 1 v | 10 | A 2 v | 10 | A 3 v |
4.414.113.353.161.391.25
Table 5. The magnitudes of the first three peaks | A 1 p | , | A 2 p | , and | A 3 p | and the first three valleys | A 1 v | , | A 2 v | , and | A 3 v | of the wave amplitude function A = A R + i A I for each of the four ship series. Each series comprises nine individual hulls, generated according to the parameter combinations specified in Equation (30). Additionally, the table includes the discrepancy , defined in Equation (31), between the candidate wave amplitude function A ˜ and the reconstructed wave amplitude function A ^ of the target ship hull (provided in Table 3).
W-Series
No. 10 | A 1 p | 10 | A 2 p | 10 | A 3 p | 10 | A 1 v | 10 | A 2 v | 10 | A 3 v | 10
12.222.782.072.070.490.757.29
21.782.491.931.670.360.88.64
322.6521.870.450.787.92
42.432.882.122.270.510.746.72
52.632.952.172.450.530.746.2
61.882.061.511.740.350.459.68
72.052.41.781.910.410.618.51
82.373.172.362.220.510.926.12
92.523.562.682.360.461.085.01
D-series
No. 10 | A 1 p | 10 | A 2 p | 10 | A 3 p | 10 | A 1 v | 10 | A 2 v | 10 | A 3 v | 10
11.471.12.091.290.250.6110.86
21.170.891.971.040.220.0512.33
31.30.922.061.150.20.311.74
41.631.352.121.430.280.899.97
51.81.632.151.570.31.019.21
61.331.121.591.160.290.4411.74
71.411.131.841.230.280.5611.22
81.491.022.331.310.190.7110.62
91.490.92.61.310.110.6610.6
S-series
No. 10 | A 1 p | 10 | A 2 p | 10 | A 3 p | 10 | A 1 v | 10 | A 2 v | 10 | A 3 v | 10
13.563.032.482.111.190.35
22.813.082.341.730.760.376.58
33.183.092.431.920.990.385.68
43.942.962.52.31.210.334.43
54.32.882.52.481.230.413.87
63.021.981.551.760.680.068.62
73.312.481.971.940.910.186.88
83.783.623.042.261.340.443.19
93.984.233.652.391.540.62.41
K-series
No. 10 | A 1 p | 10 | A 2 p | 10 | A 3 p | 10 | A 1 v | 10 | A 2 v | 10 | A 3 v | 10
14.112.992.753.211.081.062.58
23.242.822.382.590.850.974.82
33.672.952.592.910.960.983.61
44.553.012.93.521.21.172.32
553.023.053.831.221.292.87
63.592.141.822.740.520.796.07
73.872.512.272.980.870.964.21
84.33.563.253.411.381.121.16
94.424.183.723.571.711.21.23
Disclaimer/Publisher’s Note: The statements, opinions and data contained in all publications are solely those of the individual author(s) and contributor(s) and not of MDPI and/or the editor(s). MDPI and/or the editor(s) disclaim responsibility for any injury to people or property resulting from any ideas, methods, instructions or products referred to in the content.