Article

Research on Lightweight Design Performance of Offshore Structures Based on 3D Printing Technology

1
School of Electronics and Information Engineering, Guangdong Ocean University, Zhanjiang 524088, China
2
Ship and Maritime College, Guangdong Ocean University, Zhanjiang 524005, China
*
Author to whom correspondence should be addressed.
J. Mar. Sci. Eng. 2025, 13(10), 2007; https://doi.org/10.3390/jmse13102007
Submission received: 17 September 2025 / Revised: 16 October 2025 / Accepted: 17 October 2025 / Published: 19 October 2025

Abstract

Traditional manufacturing methods struggle to incorporate complex internal configurations within structures, thus restricting the potential for enhancing the strength of offshore structures through internal design. However, the advent of 3D printing technology presents innovative solutions to this challenge. Previous research has investigated the use of 3D printing to integrate lattice-like structures within conventional frameworks to achieve lightweight designs. Building upon this foundation, this paper models an embedded structure and other marine structures subjected to similar loads using simplified models and conducts a thorough investigation into their mechanical properties. Specifically, it examines the effects of the 3D-printed infill structure, infill rate, and tilt angle of printed specimens on the mechanical properties of 3D-printed components. The goal is to identify the optimal parameter combinations that ensure structural strength while also achieving a lightweight design and a secondary lightweight design for the embedded structure. This paper concludes, from tensile, torsional, and compressive experiments, that honeycomb infill structures, with specimens printed at an inclination angle of 0°, exhibit superior performance across all properties. Additionally, the bonding between the layers of the printed parts is identified as a key factor influencing the tensile and torsional properties. While increasing the infill rate can significantly improve the overall mechanical properties of specimens, it also results in a corresponding reduction in the lightweighting index.

1. Introduction

With growing global attention on clean energy, developing and utilizing renewable energy sources such as hydropower and tidal energy has become a key strategy for achieving a sustainable, low-carbon future [1,2,3]. Hydropower, characterized by its cleanliness, efficiency, and low-carbon footprint, has emerged as a vital renewable energy source driving sustainable development. Its flexibility and energy storage capabilities provide significant advantages in electricity generation and grid stability [4,5,6]. Tidal power generation serves dual functions of energy storage and electricity generation, playing a vital role in regulating power supply and maintaining grid frequency stability. These characteristics render hydropower and tidal power indispensable for achieving low-carbon economies and sustainable energy strategies [7,8]. Among these, the collection of mechanical energy has garnered increasing attention due to the widespread availability of target resources [9,10,11,12,13,14,15,16,17,18]. This approach effectively harnesses the flow of liquid earth in oceans and rivers to drive generators and generate energy [19]. Head height significantly impacts turbine efficiency and output power. Micro-hydropower generation (MHPG) systems must be installed at low heads, resulting in low turbine rotational speeds. Conversely, conventional generators exhibit low power conversion efficiency at low speeds, necessitating speed enhancement via gearboxes and/or belts [20]. To enhance hydropower efficiency, researchers have pursued multiple avenues. For instance, Wei et al. developed a 1 kW low-speed high-efficiency permanent magnet generator (LHPM generator) aimed at enabling direct-drive MHPG systems to boost power generation efficiency [21]. Brian et al. utilized vibration measurements and frequency domain analysis to locate vibrations within a series of hard-to-reach checkpoints in hydropower installations, thereby improving efficiency [16]. Yadav and Chauhan [22] proposed a micro-hydropower system based on generating electricity from household water tanks. Ridzuan et al. [23] investigated a system harnessing water flowing through domestic pipelines. H. Zainuddin [24] introduced a system utilizing domestic pipeline water energy for power generation. However, none of these experiments considered enhancing hydroelectric generator efficiency through material innovations. Substituting materials for bearings and blades in hydroelectric generators necessitates consideration of mechanical properties. This paper evaluates the mechanical performance of new materials through tensile, compression, and torsion tests, thereby demonstrating the feasibility of replacing conventional materials in hydroelectric generators.
In recent years, 3D printing technology has emerged as a focal point for exploration across various research domains and is widely considered one of the groundbreaking and emblematic technologies of the third industrial revolution. Its diverse applications, ranging from the design and production of small items like children’s toys [25] to intricate tasks such as the manufacturing and repair of aircraft engines in the aerospace industry [26], clearly illustrate its immense potential. What is particularly noteworthy is that in the medical field, 3D printing technology has created a new connection between living and non-living matter. For instance, by utilizing biomaterials that closely resemble the composition of human bone tissue, researchers have successfully printed artificial bones with excellent biosafety and osteogenic properties [27].
Also referred to as additive manufacturing (AM), 3D printing technology is an innovative process that constructs products by stacking materials layer by layer [28]. This method contrasts with traditional subtractive manufacturing, which involves physical processes such as cutting, chipping, and grinding to remove excess material. As illustrated in Figure 1, Attaran Mohsen outlines five key advantages of 3D printing technology for product manufacturing: speed; cost-effectiveness; quality optimization; potential for innovation and transformation; and a broader impact on the environment, logistics, and other sectors [29]. He also forecasts that from 2013 to 2023, the printing speed of metal 3D printing will increase significantly, while costs will decrease markedly.
For rod elements, drive shafts, columns at the intersections of strong crossbeams and reinforcing ribs, and other columnar pressurized structures of various sizes, conventional manufacturing methods impose significant limitations, making it challenging to create complex internal structures. As a result, traditional weight reduction strategies typically involve material removal, such as designing shafts to be hollow or incorporating weight-reducing holes into plates. Importantly, a lattice-structured unit cell can be seen as an alternative rod element to conventional support structures. Moreover, 3D printing technology offers considerable advantages for the fabrication of such intricate structures [30,31,32].
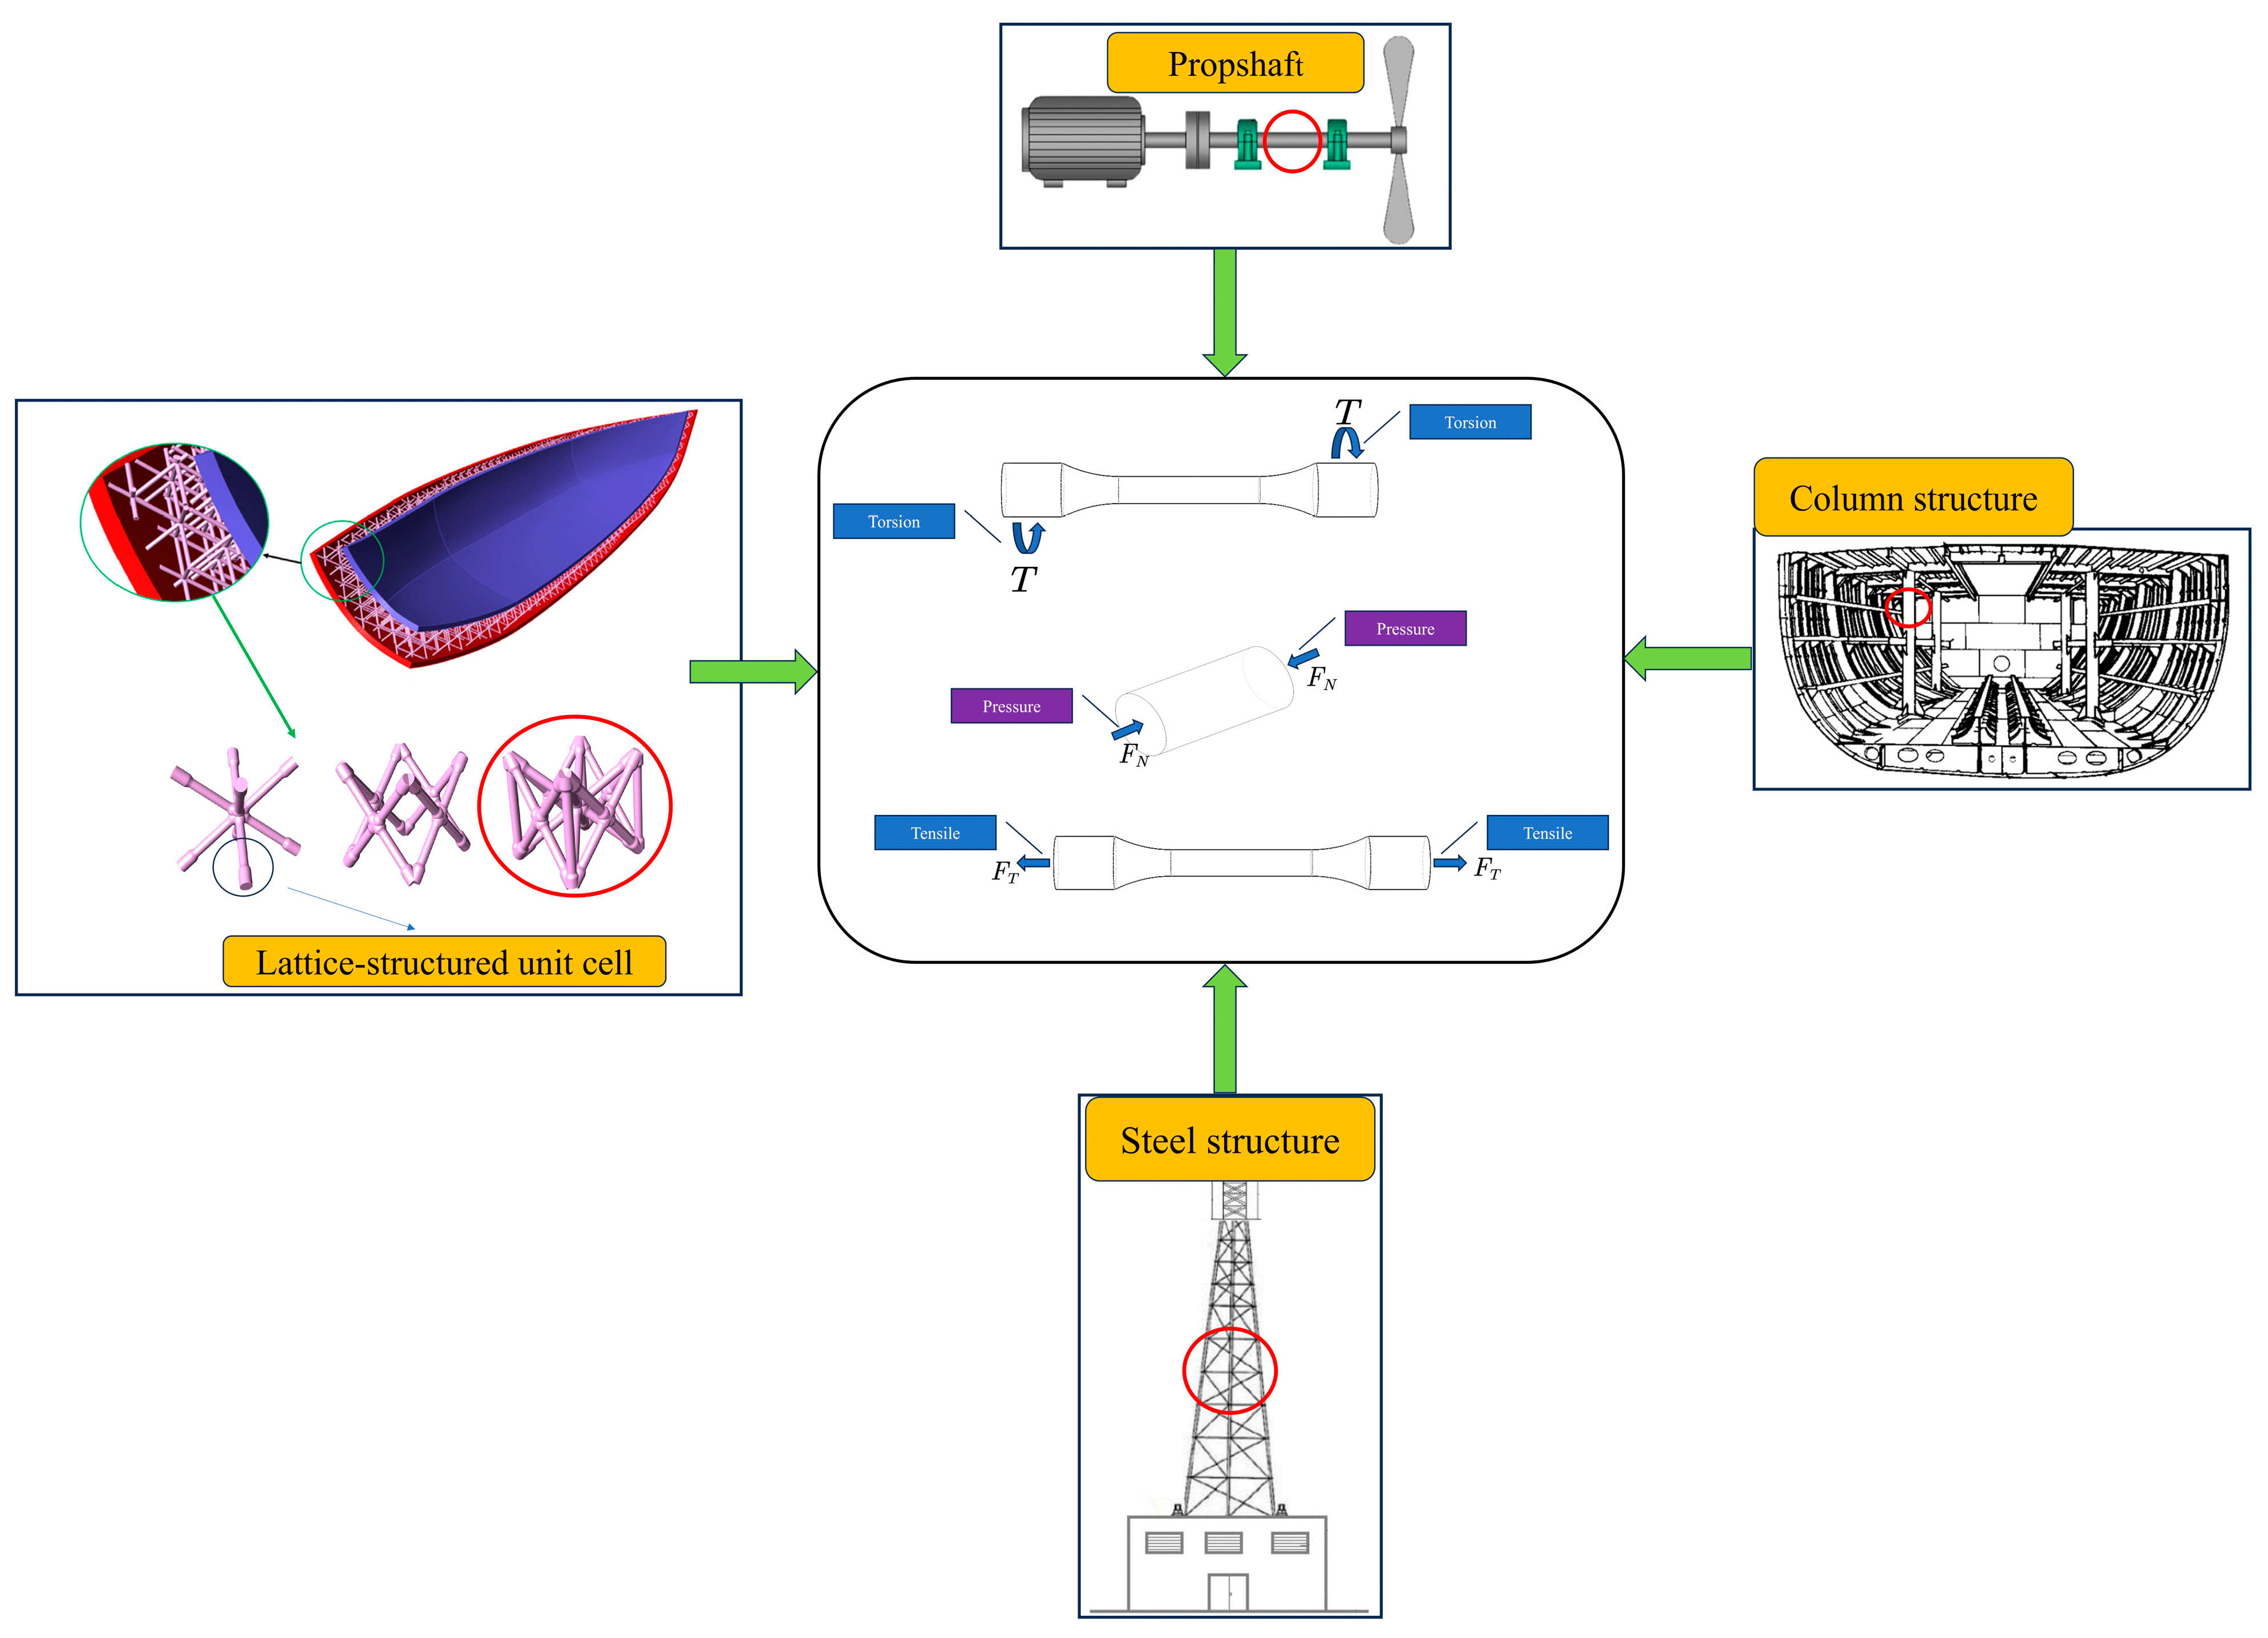
In summary, this paper simplifies the truss rod element, lattice structure unit, drive shaft, and column into physical models that are subjected to single tension, single torque, and single pressure. According to international standards [33,34], we developed models for the compression, tensile, and torsion specimens, as illustrated in Figure 2 (notably, the tensile specimen and the torsion specimen share the same model). The specific dimensions of each specimen will be detailed later.
In this paper, we will utilize 3D printing technology to manufacture these specimen models by modifying their internal structures and printing parameters, with the goal of investigating the mechanical properties of specimens exhibiting different internal configurations and printing parameters under various load conditions. This research aims to identify a parametric design solution that satisfies lightweighting requirements while maintaining excellent mechanical properties. We anticipate that this paper will further advance the application of 3D printing technology in the field of ship and ocean engineering and contribute to the development of this discipline.

2. Experiment

2.1. Specimen Size

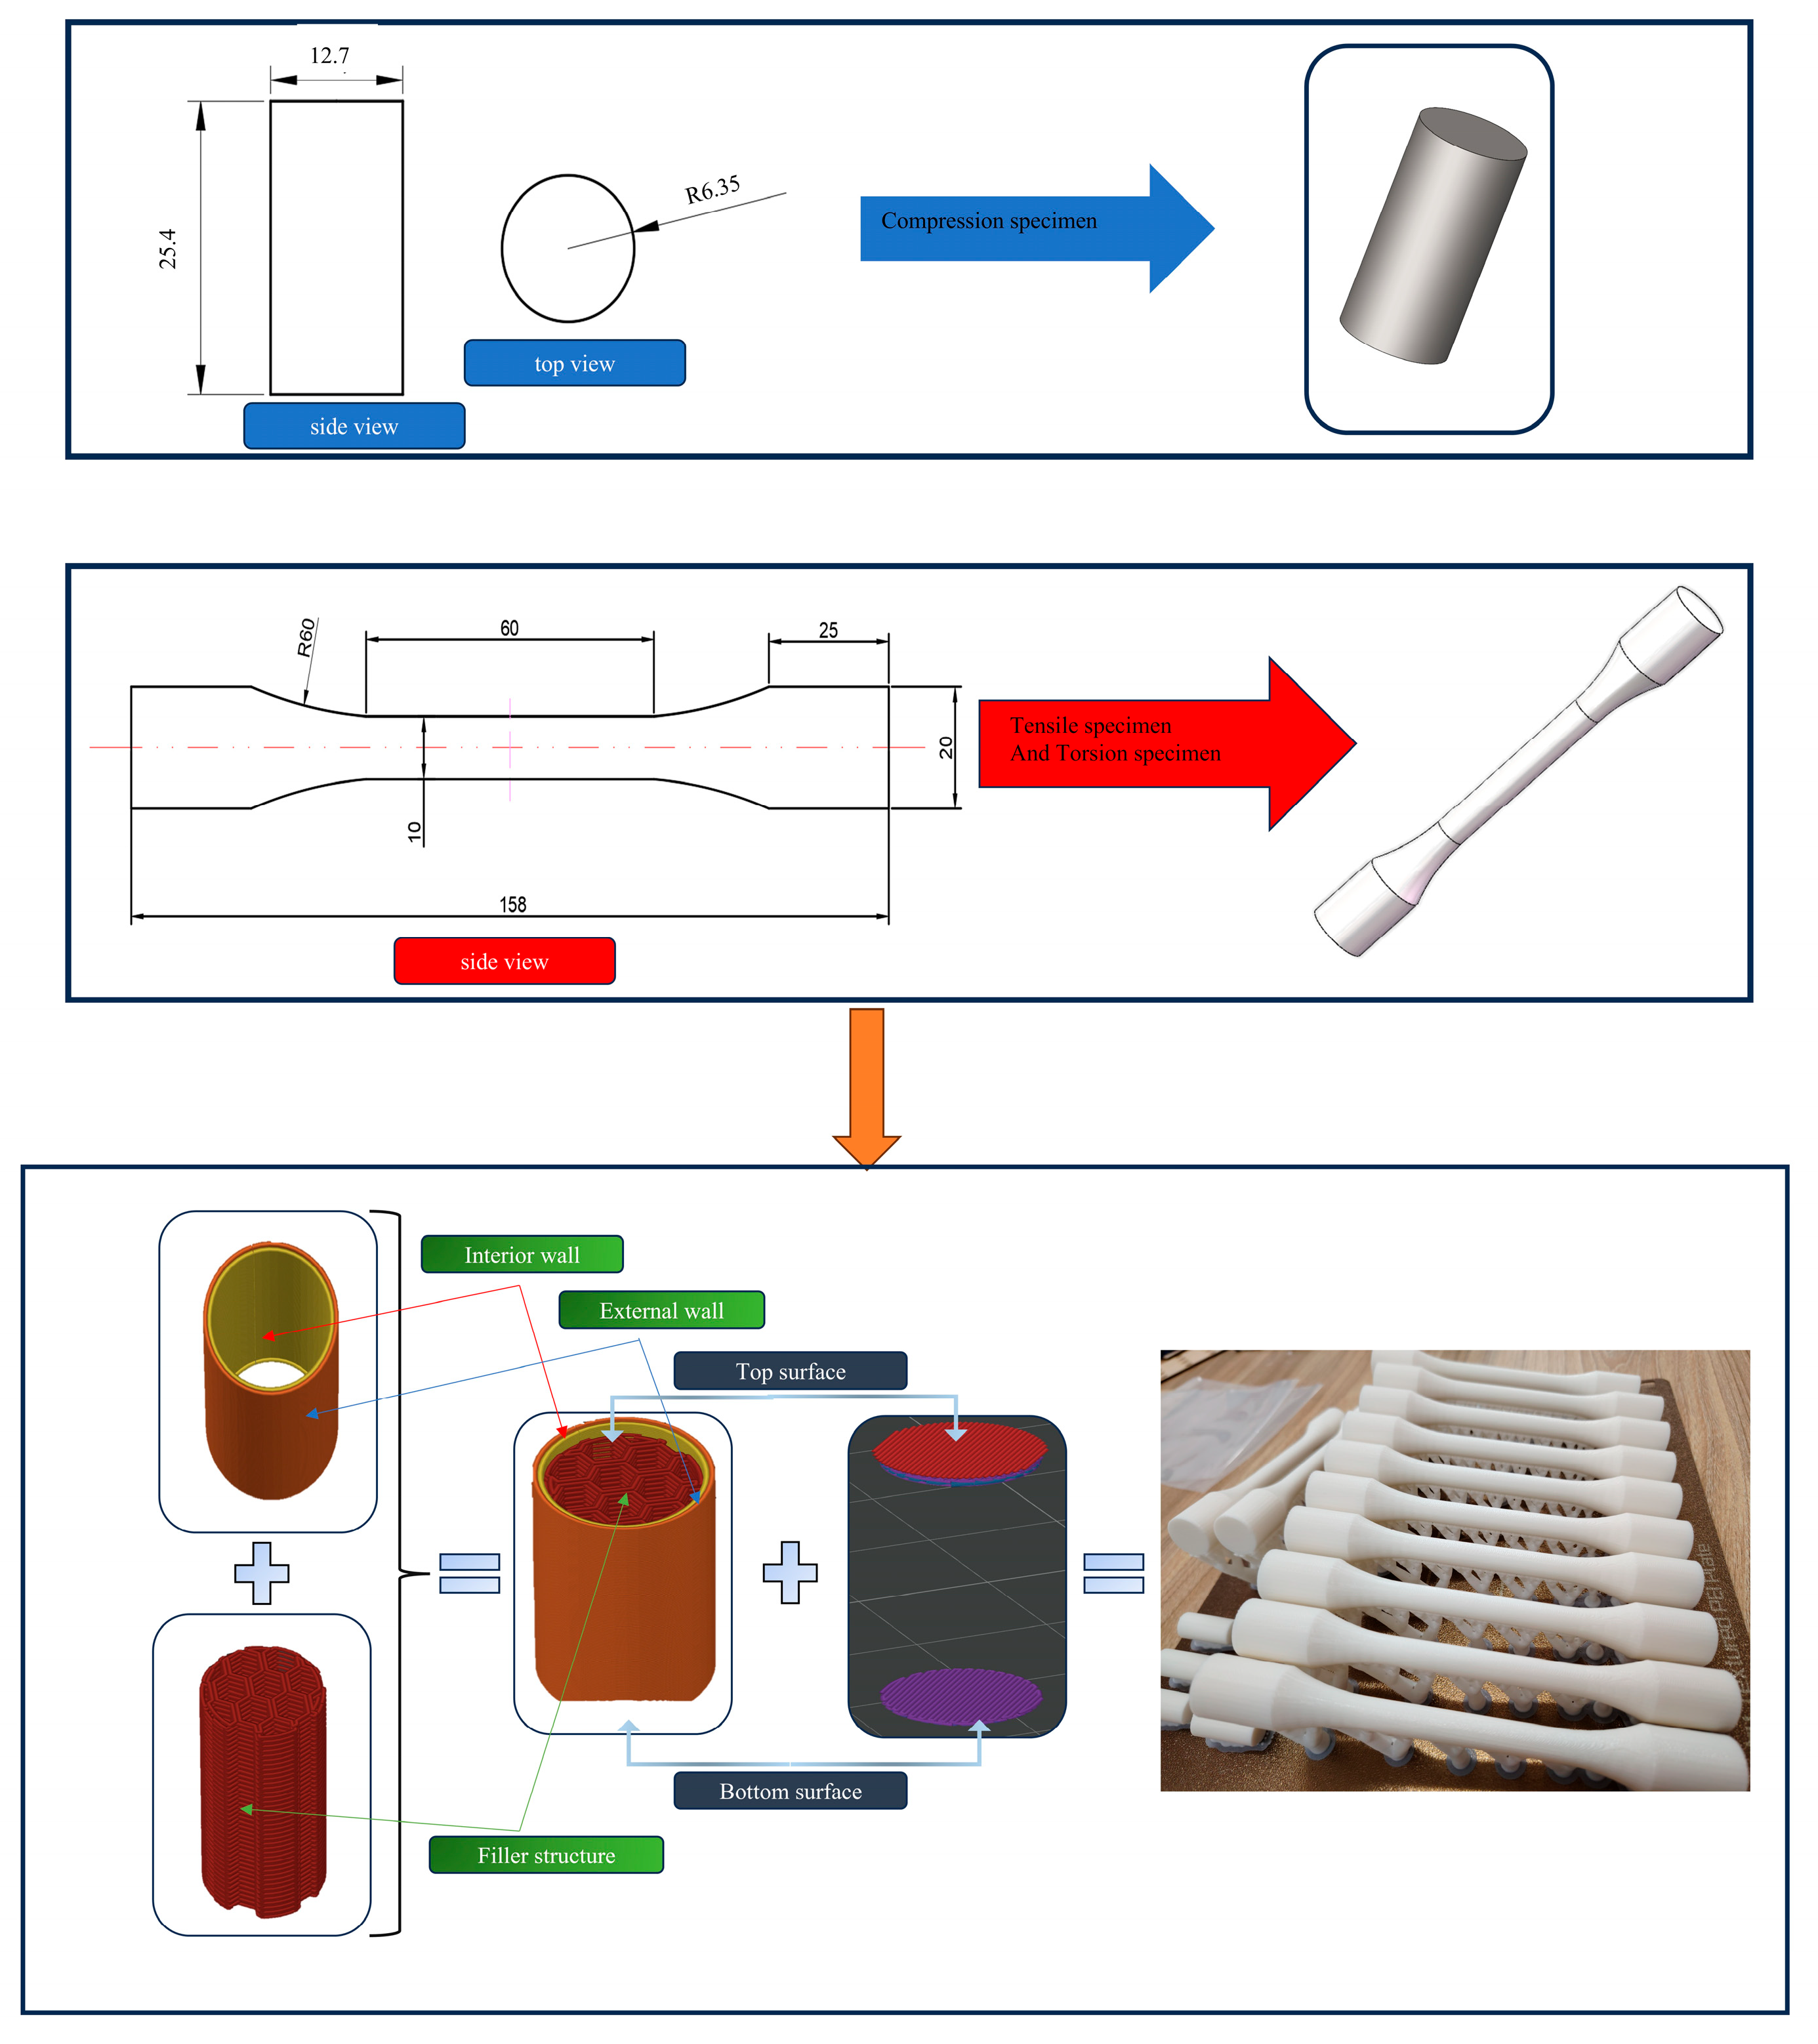
In accordance with international standards, this paper presents designs for a tensile test specimen, a torsion test specimen, and a compression test specimen, as illustrated in Figure 3, below. Notably, the parameter dimensions of the torsion test specimen and tensile test specimen are identical, and all numerical units in the figure are in millimeters. All experiments were conducted under atmospheric conditions.
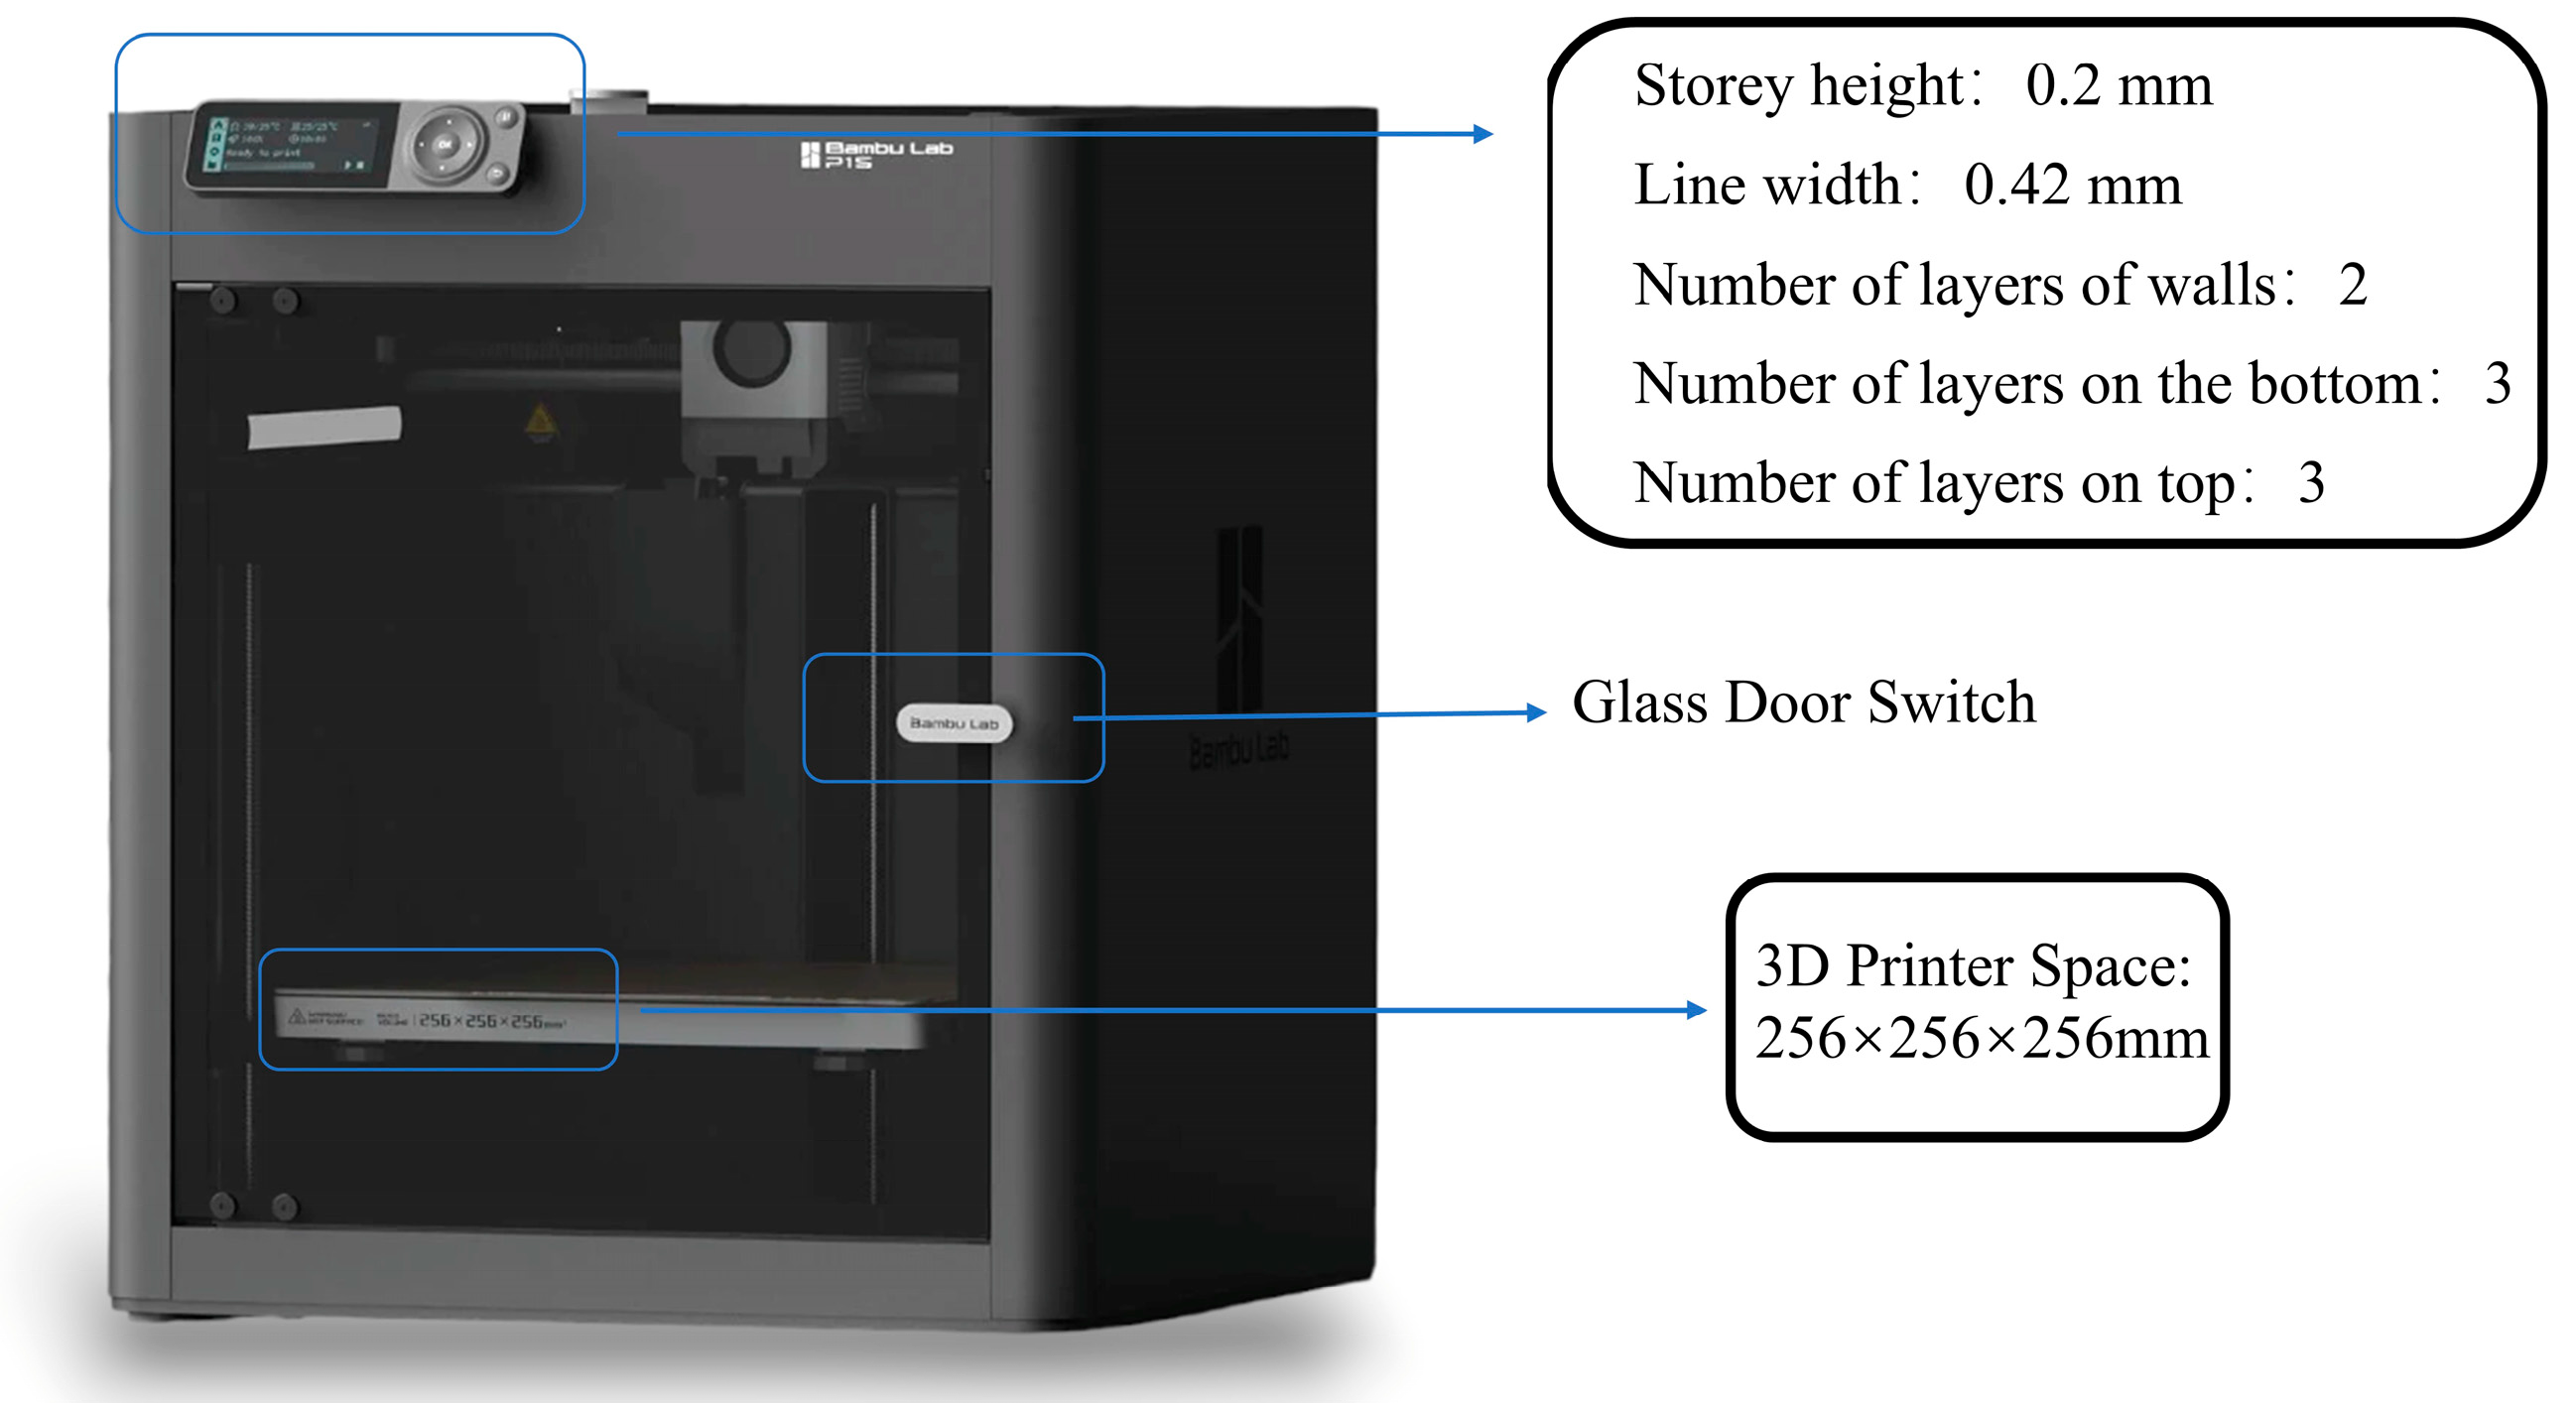
Figure 3 illustrates the structure of the compression specimen as an example. All experimental specimens are structured internally by the “wall,” which comprises the top and bottom surfaces, forming a complete closed shell around the internal structure. This shell not only protects the filled structure but also ensures that the manufactured specimens exhibit good surface quality. Specifically, the “wall” consists of an inner wall and an outer wall, totaling two layers, while both the top and bottom surfaces are composed of three layers each. The thicknesses of the “walls” correspond to the width of the wire extruded from the nozzle, while the layer thicknesses of the top and bottom surfaces align with the layer thicknesses defined by the slicing parameters. The above materials will be printed using the 3D printer shown in Figure 4.

2.2. Research Factors

The first factor examined was the filling structure, encompassing a total of 3 variables. The second factor was the filling rate, which comprised 4 variables. The third factor pertained to the specimen inclination angle, totaling 7 variables. Lastly, the fourth factor was the form of load applied to the specimen, consisting of 3 variables. As shown in Table 1.
As indicated in the combined formula, Formula (1), let a, m, e, and g represent the number of variables for the four research factors: filling structure, filling rate, specimen inclination angle, and experimental load, respectively. The total number of specimens, denoted as P in Equation (2), is established with b = n = f = h = 1 using the control variable method.
C x y = x ! y ! ( x y ) !
P = C a b C m n C s f C g h
Substituting the data b = n = f = h = 1, a = 3, m = 4, e = 7, g = 3 to find the total number of specimens, P = 252, we get 252 independent data points.

2.3. Filling Structure and Filling Rates

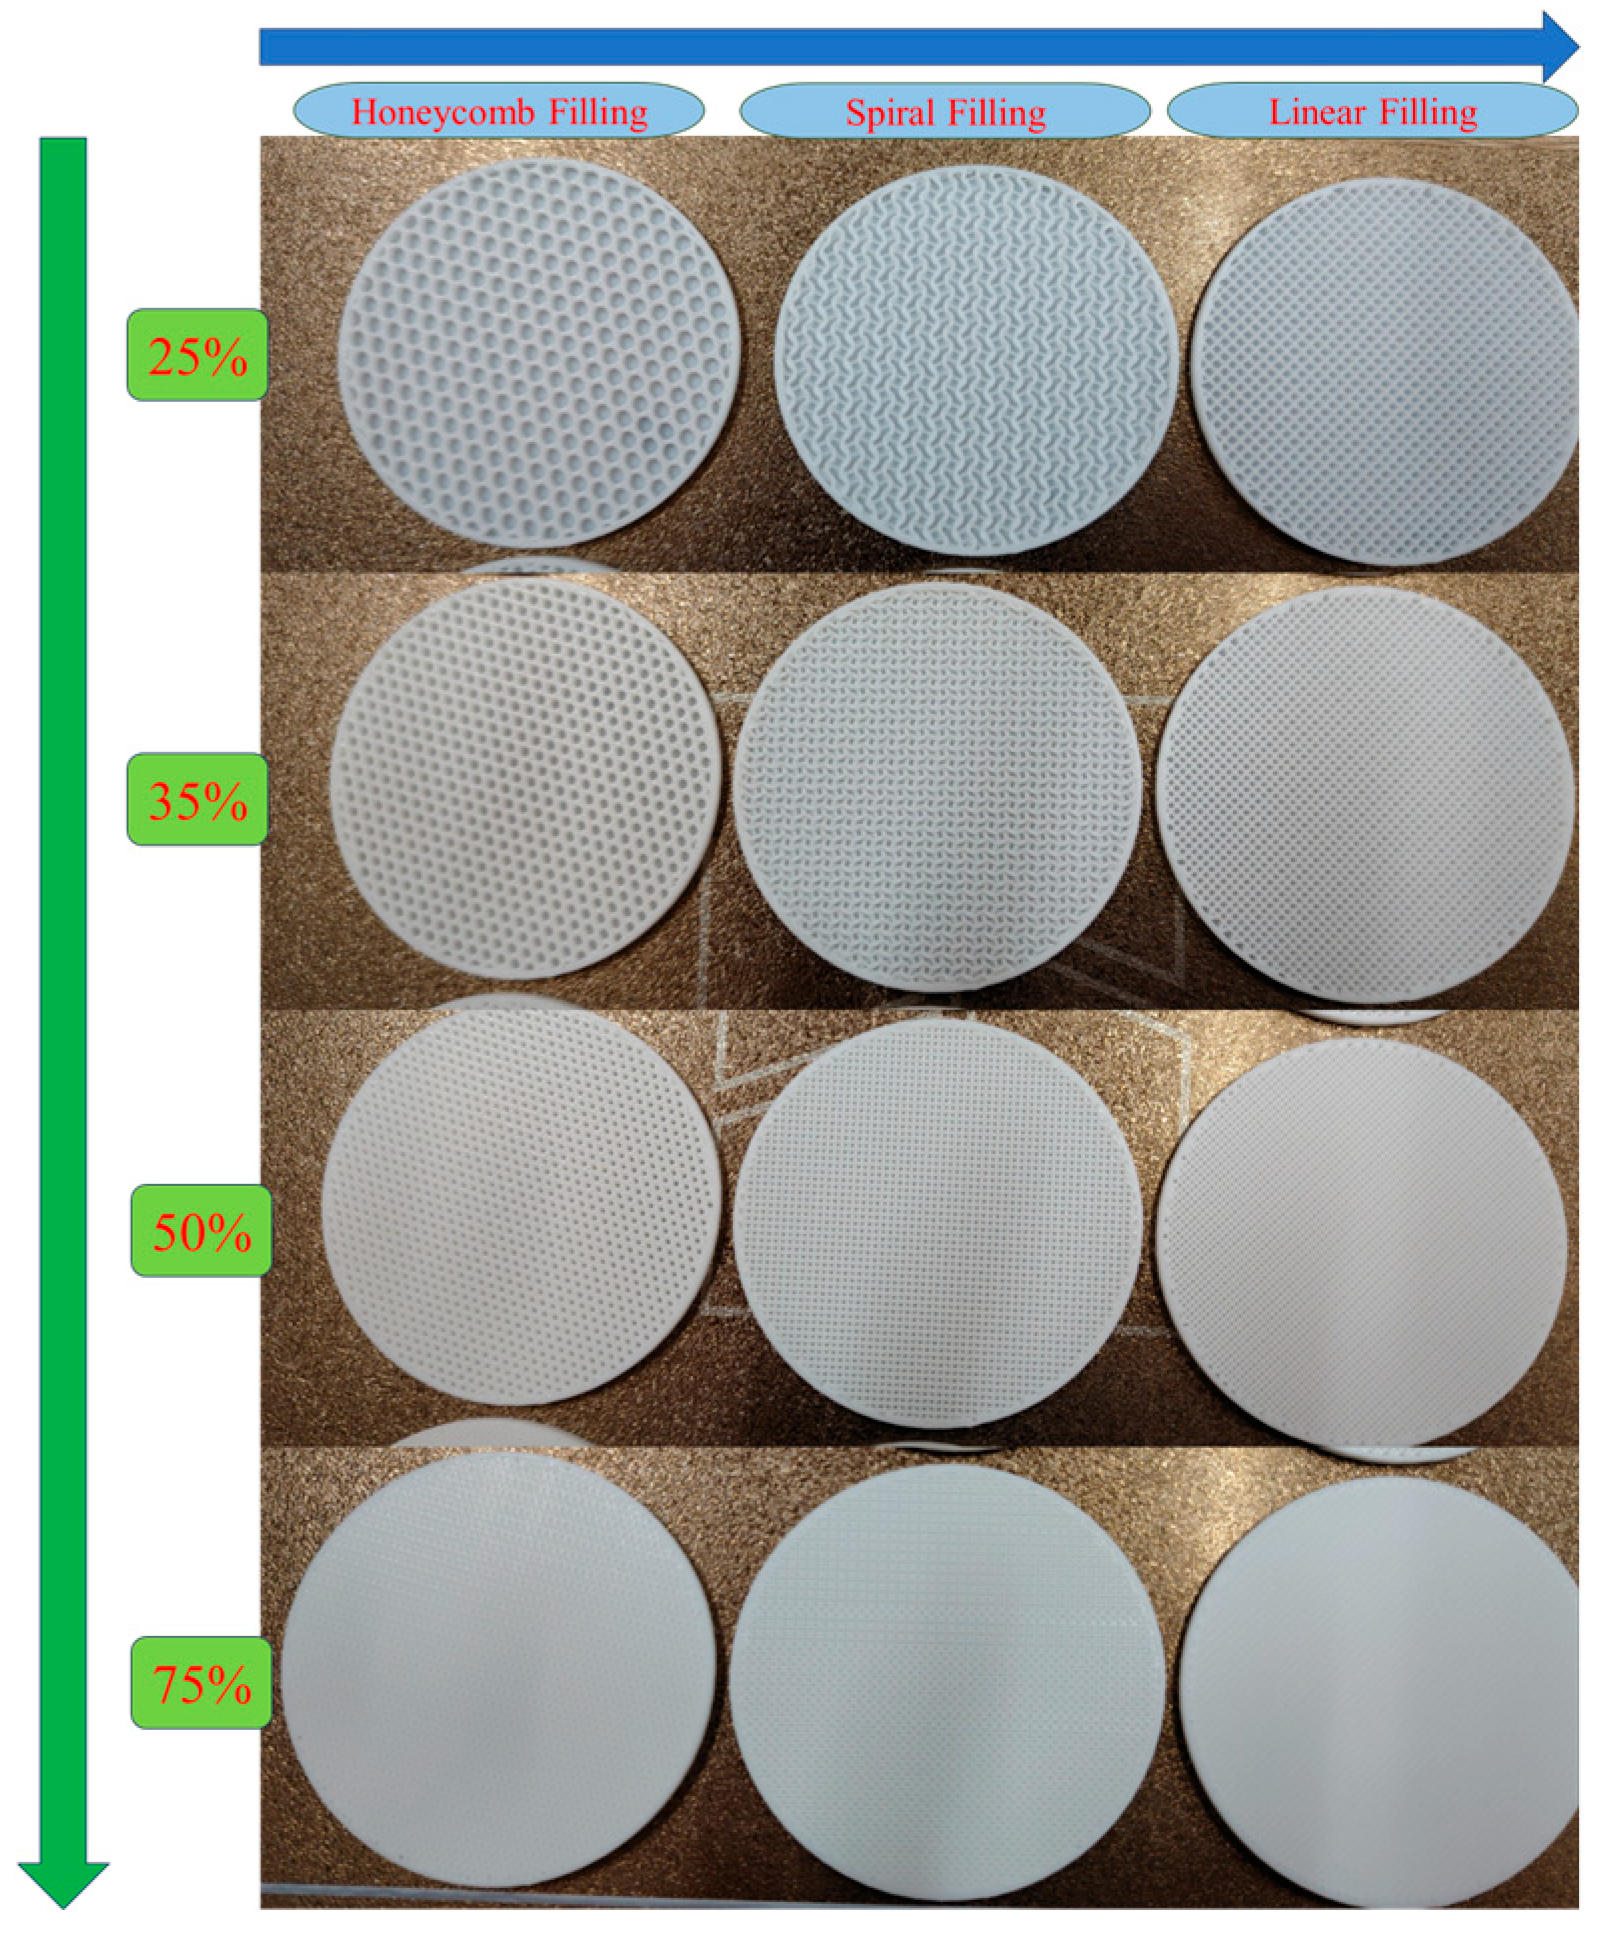
The pattern of each layer constitutes our infill structure. When printing a layer, it is essential for the printer’s path to avoid repetition to reduce nozzle wear and prolong its lifespan. Therefore, we selected three infill structures that do not involve repetitive paths for the nozzle: honeycomb; spiral; and the simplest option, straight line. Figure 5, below, illustrates these three infill structures along with 3D prints featuring different infill rates, where each row represents the same infill rate, and each column corresponds to the same infill structure.
The volume of the model we created in SolidWorks 2024 is referred to as the model volume, denoted by V. The fill volume represents the portion of the model volume that has been hollowed out, with the remaining volume classified as the fill volume, which directly indicates the amount of material used. The filling rate is defined as the ratio of the total fill volume to the model volume, multiplied by 100%. The specimen is constructed layer by layer, where V i represents the fill volume of the i layer, M i denotes the model volume of the i layer, S i refers to the filling cross-sectional area of the i layer, and A i signifies the model cross-sectional area of the i layer. The filling rate is represented by ρ, the height of the layer is indicated by h, and the extruded material of the 3D printer for the i layer is expressed as L i . The total length of the filament is also denoted as L i , while α represents the width of the extruded filament, determined by the print nozzle. In summary, we can derive the definition in Equation (3) for the fill rate.
ρ = V i V × 100 %
V i = S i h , M i = A i h
S i = L i α
ρ = L i α A i × 100 %

2.4. Specimen Inclination Angle

Printing complex structures will inevitably involve sections of the component’s axis being printed at a certain angle due to heat transfer. To investigate the mechanical properties of the printed specimen under these conditions, this paper will print the specimen at a tilted angle. This tilted angle refers to the angle between the specimen’s axis and the print bed, as shown in Figure 6, below, representing a line that forms an angle with the surface. This angle is referred to as the print tilt angle or specimen tilt angle. Adjusting the print tilt angle can also enhance the surface quality of the printed specimen by reducing the step effect, as well as optimizing printing time and the amount of support material used [35].

3. Theoretical Formulas

Hooke’s law: The relationship between stress ( σ ) and strain ( ε ) in the elastic range can be expressed as Equation (8), where E is the modulus of elasticity of the material (Young’s modulus), and F is the force, A, is the cross-sectional area in Equation (9).
σ = E ε
σ = F A
ε = Δ L L 0 , ν = ε l a t ε l o n g , W = 1 2 σ ε
where ∆L denotes the change in length of the specimen under load, and L 0 is the original length of the specimen. ν denotes Poisson’s ratio, which describes the ratio of the strain in one direction to the strain perpendicular to that direction. ε l a t indicates transverse strain, ε l o n g indicates longitudinal strain, and the energy density of storage is expressed as W .
Consider the microelementary hexahedron in one of the specimens, and let it possess stress components in three main directions in the x, y, z coordinate system: positive stress, σ x , σ y , σ z , and shear stress components, τ x y , τ x z , τ y z ; therefore, the stress state of the microelementary hexahedron can be expressed by the following stress tensor in Equation (11):
σ = σ z τ z y τ z z τ z y σ y τ y z τ z z τ y z σ z
The maximum stress can be found from the characteristic equation, Equation (12), where λ is the principal stress, and I is the unit matrix.
d ( σ λ I ) = 0 d = σ x λ τ x y τ x x τ x y σ y λ τ y x τ x x τ y x σ z λ = 0
Tianyun Yao et al. pointed out that 3D printing is stacked layer by layer, which can be considered transversely isotropic in the plane of any layer, and provided the elastic intrinsic relationship of the material [36], as shown in Equation (13), below.
ε 1 ε 2 ε 3 ε 4 ε 5 ε 6 = S 11 S 12 S 12 0 0 0 S 12 S 22 S 23 0 0 0 S 12 S 23 S 22 0 0 0 0 0 0 2 ( S 22 S 23 ) 0 0 0 0 0 0 S 56 0 0 0 0 0 0 S 65 σ 1 σ 2 σ 3 σ 4 σ 5 σ 6
For the plane stress state, then we have σ 3 = 0 , τ 23 = σ 4 = 0 , τ 31 = σ 5 = 0 ; the eigenstructure matrix can be written as Equation (14):
ε 1 ε 2 γ 12 = S 11 S 12 0 S 12 S 22 0 0 0 S 55 σ 1 σ 2 τ 12 γ al = γ al = 0 , ε 3 = S 13 σ 1 + S 23 σ 2
where the E 1 , E 2 engineering constants are Young’s modulus; Poisson’s ratio, ν 12 , ν 21 ; and shear modulus, G 12 . The matrix of four elastic constants can be expressed as Equation (15):
S 11 = 1 E 1 S 22 = 1 E 2 S 56 = 1 G 12 S 12 = ν 21 E 1 = ν 12 E 2
In our current study, we aim to reduce the weight of both turbines and hydroelectric generators while maintaining their structural integrity, thereby enhancing energy generation efficiency. Therefore, we now define lightweighting as follows.
The stress–strain relationship of elastic segment materials satisfies Hooke’s law:
σ i = E ε i
Fitting the effective stress-effective strain curve using the Swift constitutive equation,
σ j = k ( ε j + d ) m
For the elastic and plastic regions, the strain energy density is
ζ ε = σ d ε
Integrating ζ ε over the entire volume and assuming the stress state within the material is independent of volume yields the deformation potential energy, Q ε , as
Q ε = ζ ε d x d y d z = ( ζ ε i + ζ ε j ) d x d y d z = V 0 ε s σ i d ε i + 0 ε b σ j d ε j
In the equation, V represents volume; ζ ε i and ζ ε j denote the strain energy densities for the elastic and plastic regions, respectively; ε s is the strain at yield strength; and ε b is the maximum effective strain.
Substituting Equations (16) and (17) into Equation (19) yields
Q ε = V E 2 ε s 2 + k m + 1 ε b m + 1
For a given material volume, when specimen dimensions are identical, the volume is proportional to the material thickness, t. When two materials achieve equivalent energy absorption efficiency, their deformation potential energies are equal; thus,
t 1 t 2 = ε s 2 2 + k 2 m 2 + 1 ε b 2 m 2 + 1 ε s 1 2 + k 1 m 1 + 1 ε b 1 m 1 + 1 k 2 m 2 + 1 ε b 2 m 2 + 1 k 1 m 1 + 1 ε b 1 m 1 + 1
The readily applicable Formula (21) can be used for material thinning design.

4. Tensile Experiment Analysis

4.1. Curve Form of Tensile Specimen Load Variation with Specimen Length

The ETM series electronic universal testing machine was used for this tensile experiment. During the experiment, the specimen is firmly clamped by the fixture, the upper fixture is kept fixed, and the lower fixture moves downward at a slow speed until the specimen breaks. The data for the force applied to the specimen during the tensile process will be transmitted to the computer in real time for recording and analysis.
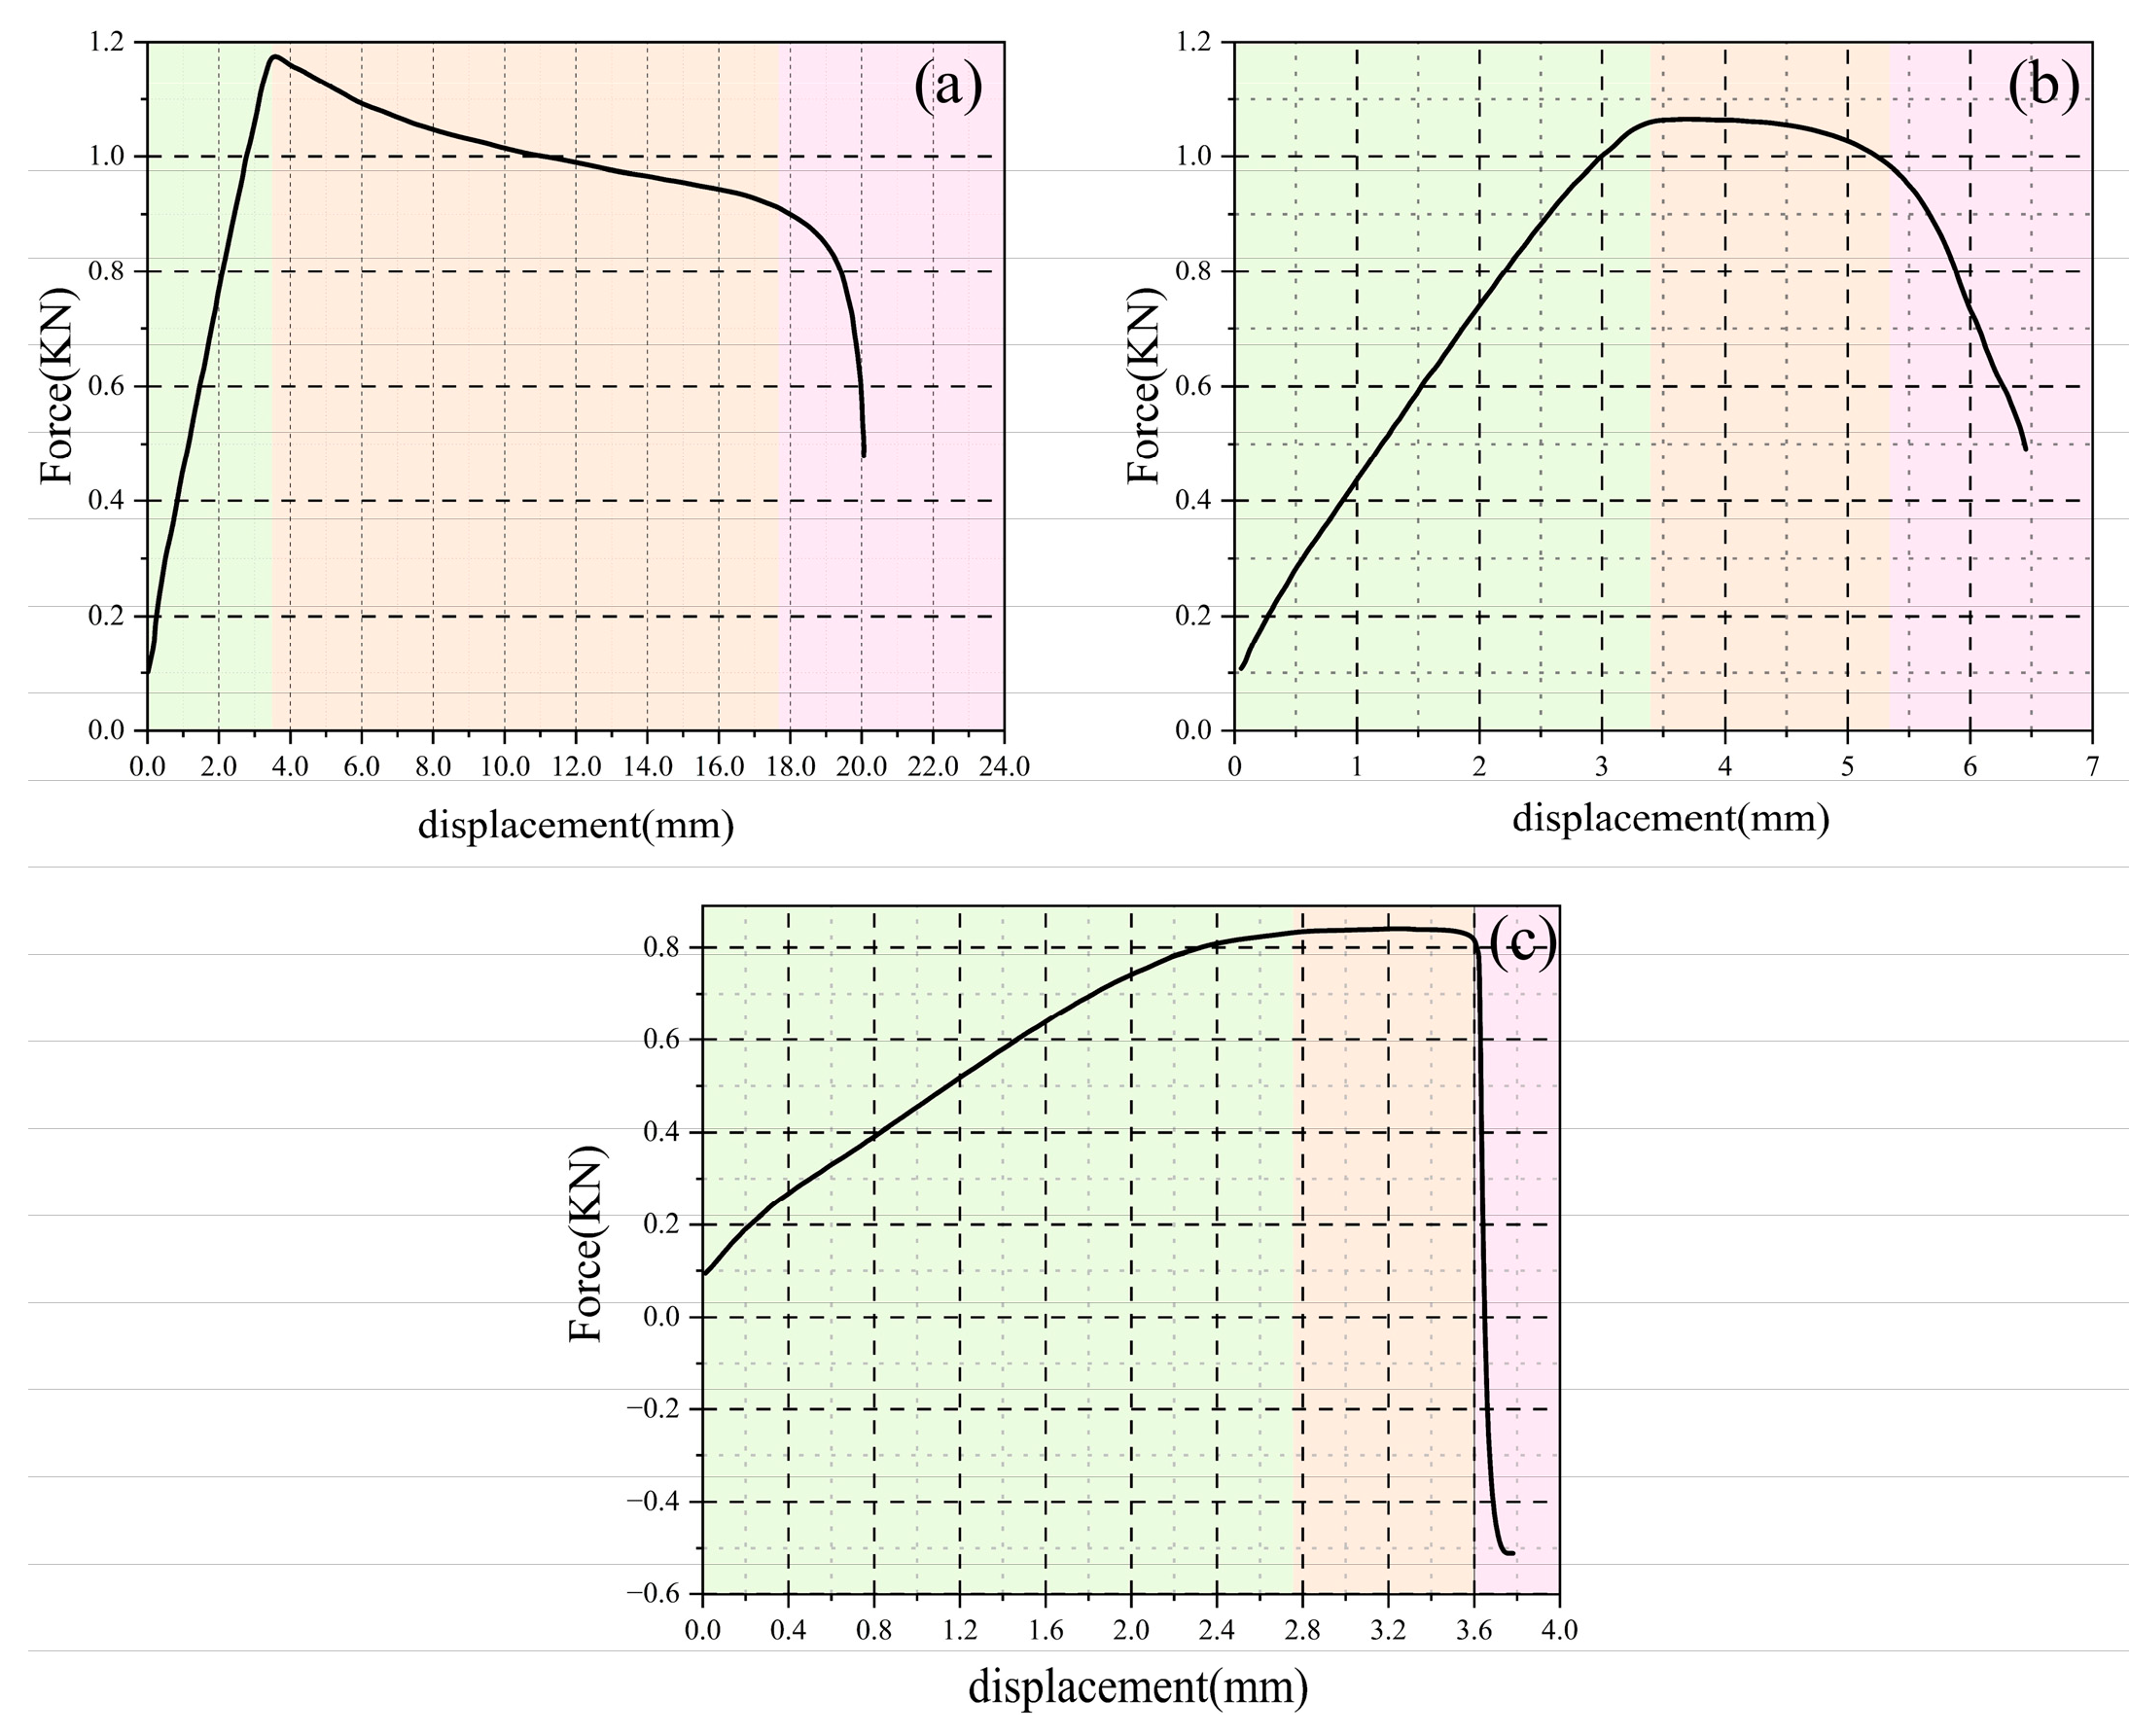
As shown in Figure 7, the computer-generated force versus elongation images of all the tensile specimens present three different types, corresponding to Figure 7a–c. Figure 7 demonstrates the type of image when the inclination angle of the tensile-printed specimen is 0°. This image is characterized by the fact that at the initial stage of stretching, the tensile force exerted on the specimen rises sharply with the increase in elongation. When the tension reaches a certain peak, it begins to decrease as the elongation continues to increase, and this process lasts for a relatively long time. When the elongation reaches a certain critical value, the specimen ruptures, at which time the tensile force decreases instantaneously, which is shown in the image as a sudden vertical fall in the curve. The second image type is shown in Figure 7b; when printing the specimen at a tilt angle of 15°, the computer forms this type of data image, which is characterized by a curve in the initial stage of the specimen force with an increase in elongation, which is relatively fast. When the tension reaches a peak, the tension begins to increase with the amount of elongation, and the very small rate of decrease in the image of the curve is approximately a straight line; when the amount of elongation reaches a certain value, it begins to decline rapidly. The third image type is when the specimen tilt angle is greater than 30°, where the initial stage of the curve has more specimen force, with an increase in elongation at a faster rate of increase, reaching a certain value, and then experiencing a slightly shorter period of time, which is instantly reduced to zero.

4.2. Tensile Fracture Form

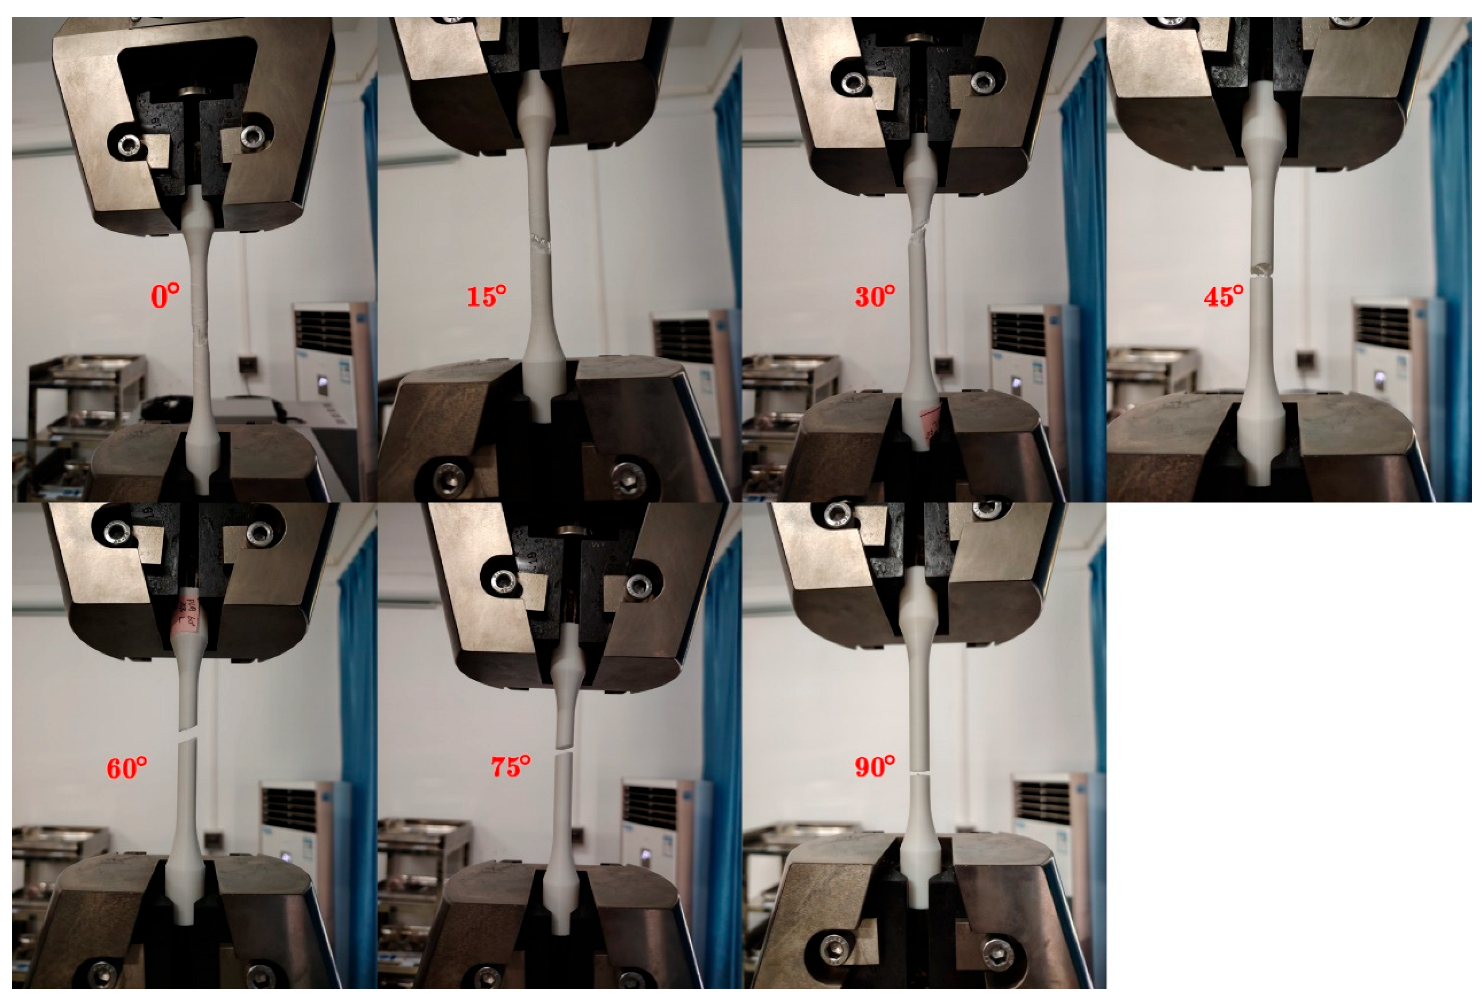
As shown in Figure 8, below, all the tensile specimens have a specimen tilt angle of 0° when fractures occur, such as in the root of the pulled fiber; that is, the print layer is parallel to the axis, so all of the tilt angles of the specimen are 0° along the direction of the axis parallel to its print direction; we can as also see several PLA fibers constituted by filaments. However, the print layer has a certain angle of inclination with the axis along the direction of the axis, and the fiber filament is composed of a segment; the number of segments is equal to the number of print layers. The experimental results show that, in addition to the specimen’s tilt angle of 0°, other specimens are along the angle of their print tilt breaks; in other words, they are along the print layer fractures. Print specimens stacked together in the two layers were then pulled apart.
The specimen’s tilt angle of 0° in the experiment occurs when elongation continues to increase to a certain value from the outside to the inside of the slow break; the process lasts for a long time. When the broken fiber filament reaches a certain amount, the fiber filament will instantly pull the rest of the fiber filaments broken all the way. When the specimen tilt angle is 15°, or when the specimen is along the print level from the outside to the inside of the fracture, the fracture pulls up a small number of PLA fibers out of the plastic deformation of the filaments; this phenomenon occurs at the same time at a high fill rate (greater than or equal to 50%) and a specimen print tilt angle of 30°. When the specimen print angle is greater than 30°, the specimen will be loaded to a certain value, and instantaneous fracture separation will occur along the print level; the larger the specimen print angle, the flatter the cross-section.
From the loading stage to the specimen fracture process, the fracture time of the specimen inclination angle of 0° is much greater than that of the other inclination angles, followed by the fracture time of the 15° inclination angle, which is significantly greater than the 30° inclination angle; the fracture time of the 30° inclination angle does not differ significantly. Combined with the experimental phenomena and computer-generated image curves, we can initially conclude that the inclination angle of 0° allows the material to withstand the tension of the fiber; when the tension exceeds the range of the material, the fibers can withstand fracture. When a certain angle of inclination printing is used to produce a specimen, there is an interlayer bonding force between the printing layers; therefore, the force is much smaller than that of the PLA fiber, which can thus withstand the force. As such, the specimen has an angle of inclination along the print layer fracture.

4.3. Tensile Strength Data Analysis

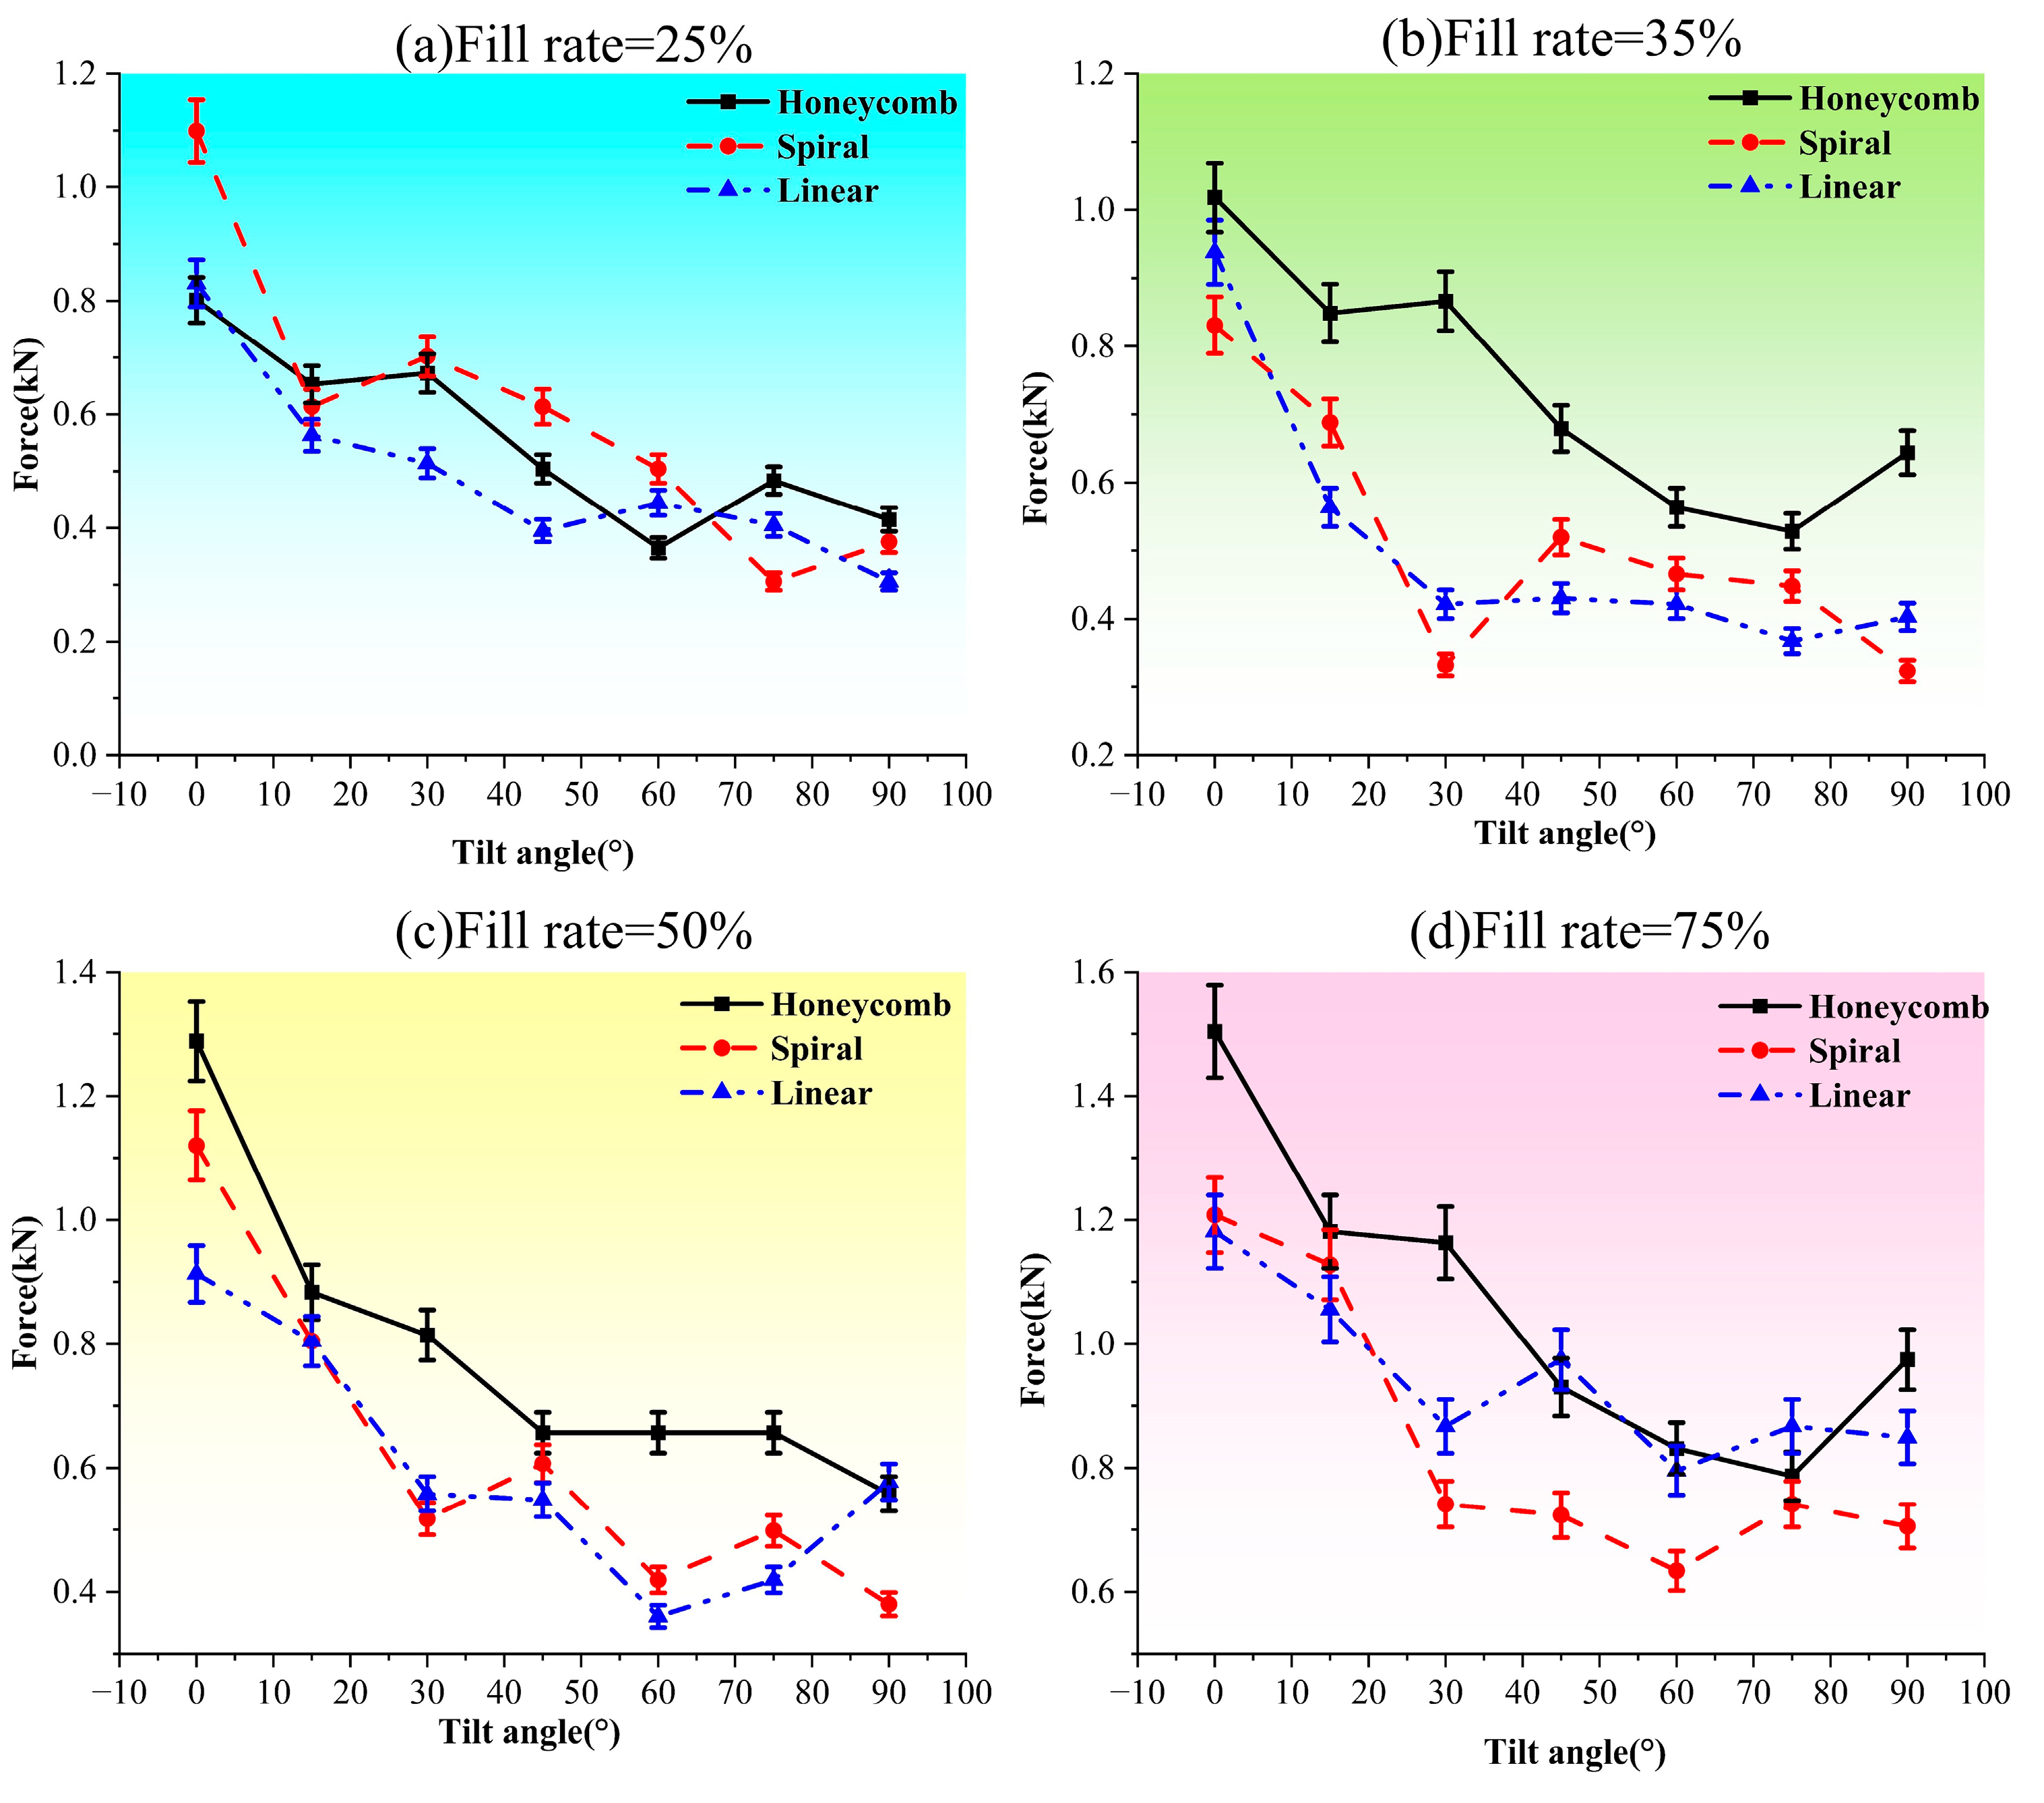
The maximum tensile force that the specimen can withstand before tensile rupture, as a measure of the tensile strength of the specimen, is shown in Figure 9, below, with the conditions of different filling rates. The vertical axis represents force, and the horizontal axis represents the specimen’s tilt angle. Figure 9a–d, respectively, show filling rates of 25%, 35%, 50%, and 75% under three kinds of filler structure under maximum force. For the tilt angle change, the black, solid-line nodes are rectangular, indicating that the filler structure is a honeycomb. The red dashed line nodes are round, indicating that the filler structure is a spiral. The last symbol indicates that the filler structure is a straight line. It is not difficult to see in Figure 9 that, regardless of the filling ratio, the maximum tensile stress that the component can withstand generally shows a decreasing trend as the printing inclination angle increases.
Removing the individual accidental anomalies from the graphs, the specimens of the three filling structures have a similar trend with the changes in specimen inclination angle at different filling rates. The trend is that the maximum tensile stress that the specimen can withstand decreases from 0° to 30°, increases from 30° to 45°, and decreases from 45° onward. Under the four filling rates, the curves of the honeycomb filling structure are, in most cases, located on the curves of the other two filling structures; from this, we can conclude that the tensile properties of the honeycomb filling structure are greater than those of the other two. At 35% and 50% filling rates, the curves of the spiral and linear filling structures are close to each other; at a 25% filling rate, the tensile properties of the spiral filling structures are better than those of the linear filling structures at inclination angles from 15° to 60°; and at the 75% filling rate, the tensile properties of the linear filling structures are better than those of the spiral filling structures.
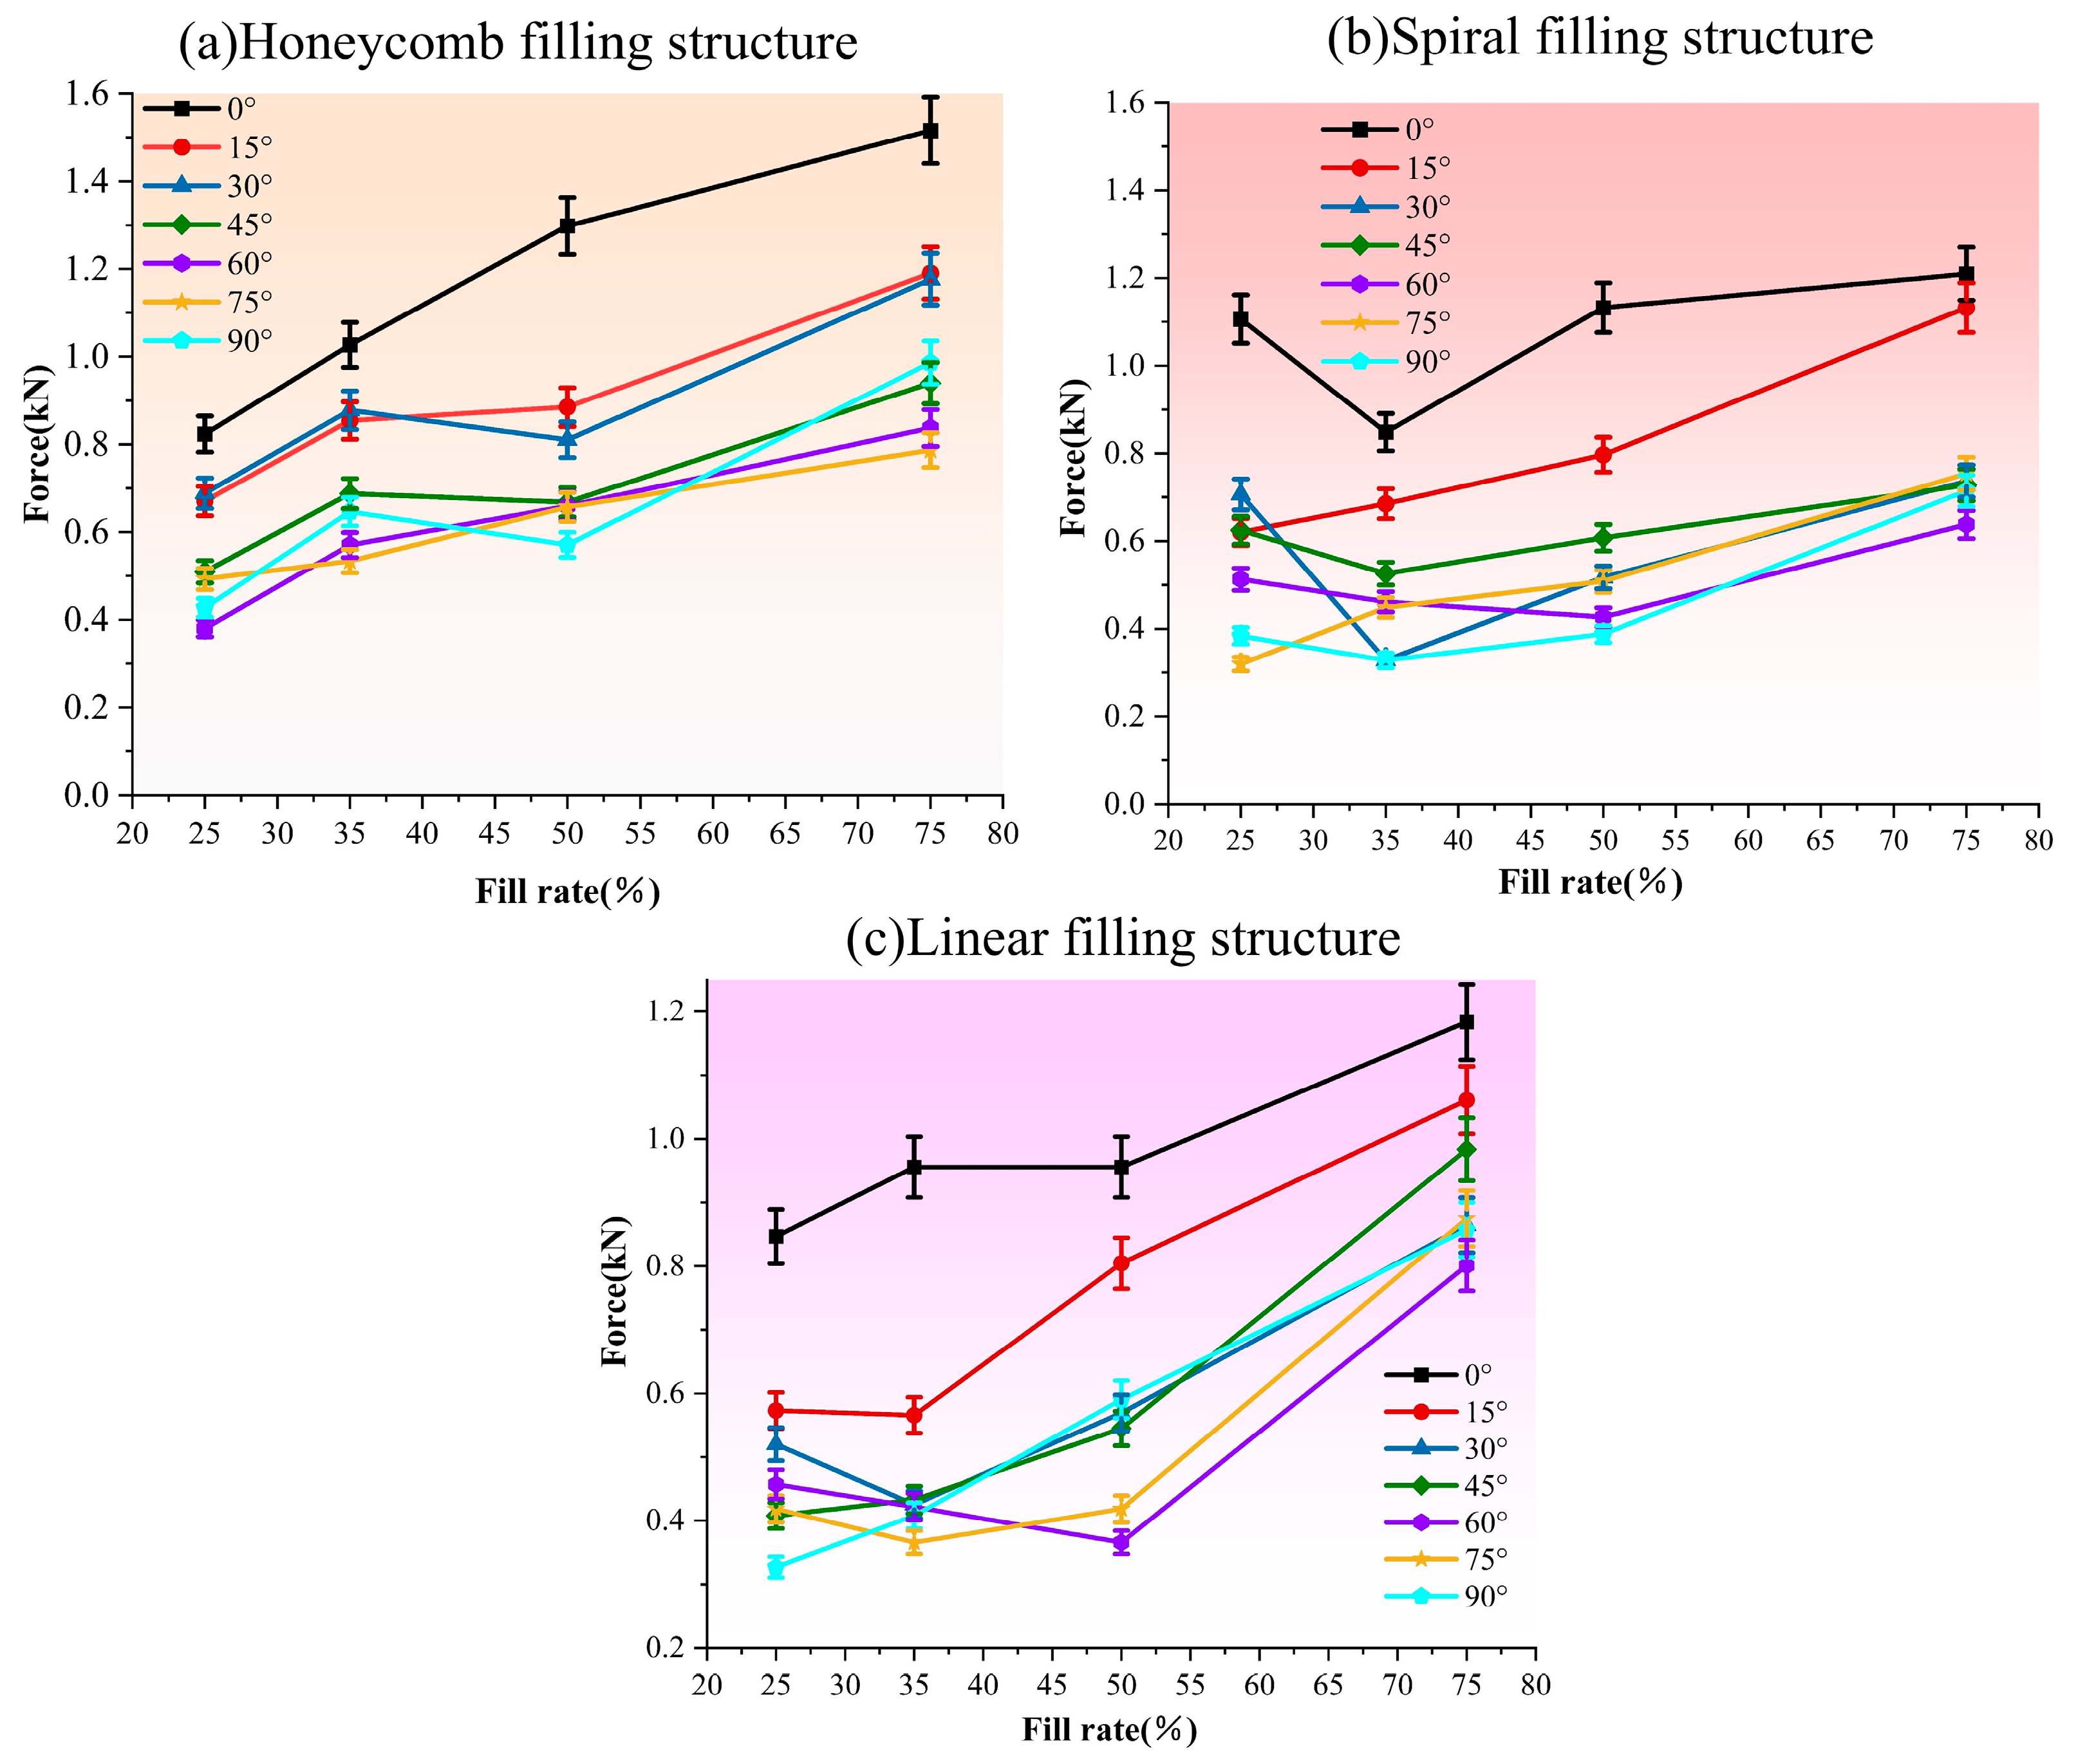
The data images in Figure 10a–c, below, show the fill rate as the horizontal axis and the force size as the vertical axis; data points in the longitudinal axis coordinates show the specimen before the fracture of the maximum load appears in the transverse coordinates of the specimen’s fill rate. From 10a–c, it can be seen that when the filling rate is greater than 50%, the maximum tensile load that the specimen can withstand at any inclination angle and under any filling structure increases with the increase in filling rate. The maximum tensile load that the specimen can withstand under each parameter when the filling rate is in an interval of 25% to 50% is uncertain, with the increase in the filling rate, so this interval is unstable. It can also be seen from the Figure 10 that when the specimen tilt angle is 0°, any filling rate and any filling structure of the specimen can withstand a large maximum load better than the other inclination angles; this again proves that an inclination angle of 0° for the tensile properties of the specimen is better than the other inclination angles. Secondly, the tensile properties of specimens with an inclination angle of 15° are also better than those with an inclination angle of more than 15° in general. It is not difficult to see from Figure 10 that, for the three different infill patterns, the maximum tensile stress that the component can withstand increases with the rise in the infill density ratio. This indicates that the infill ratio is one of the key factors determining the tensile capacity of the component.
Given the comprehensive experimental conclusions drawn in this section, in the manufacture of ships and marine engineering structures, we should make the inclination angle 0° when 3D printing structures that are subjected to tensile force; i.e., the nozzle-extruded material fiber filaments should lie flat in the printing layer, and the direction of tension should be the same as the longitudinal direction of the fiber filaments. Andrea Manes [37] pointed out that in fishery-rich areas where submarine pipelines are subjected to impacts, after removing the load, these pipelines are straightened and deformed due to rebound and applied axial tensile force; the deformation zone of the material is very easy to fracture, and leakage occurs. Dapeng Zhang [38] and others provided the theoretical basis and design method for the design of marine pipelines to cope with the complex marine environment. Combining the problems raised above and the design method of the reference pipeline, for the application of 3D printing technology for the manufacture of marine pipelines, the axial direction of the pipeline should be parallel to the longitudinal direction of the fiber filaments of the printing material; i.e., the specimen is printed with an inclination angle of 0°, and at the same time, the cellular structure is chosen. In order to satisfy the requirements of engineering safety, the filling rate should be set at more than 50%, so as to keep the tensile properties in a stable interval. For other marine structures subjected to tensile loads, 3D printing parameters and marine pipeline setup parameters should be the same, and the requirements of the surface quality can be appropriately adjusted to print the tilt angle while increasing the filling rate to compensate for the change in the tilt angle brought about by the change in compressive properties. For the requirements of very high elasticity and deflection changes in special pipelines, 3D-printed soft materials can be used [39] and then combined with rigid materials in the design of the parameters, hopefully achieving a number of excellent properties in one place.

5. Compression Experiment

5.1. Compression Specimen Load Changes with the Specimen Length in the Form of a Curve

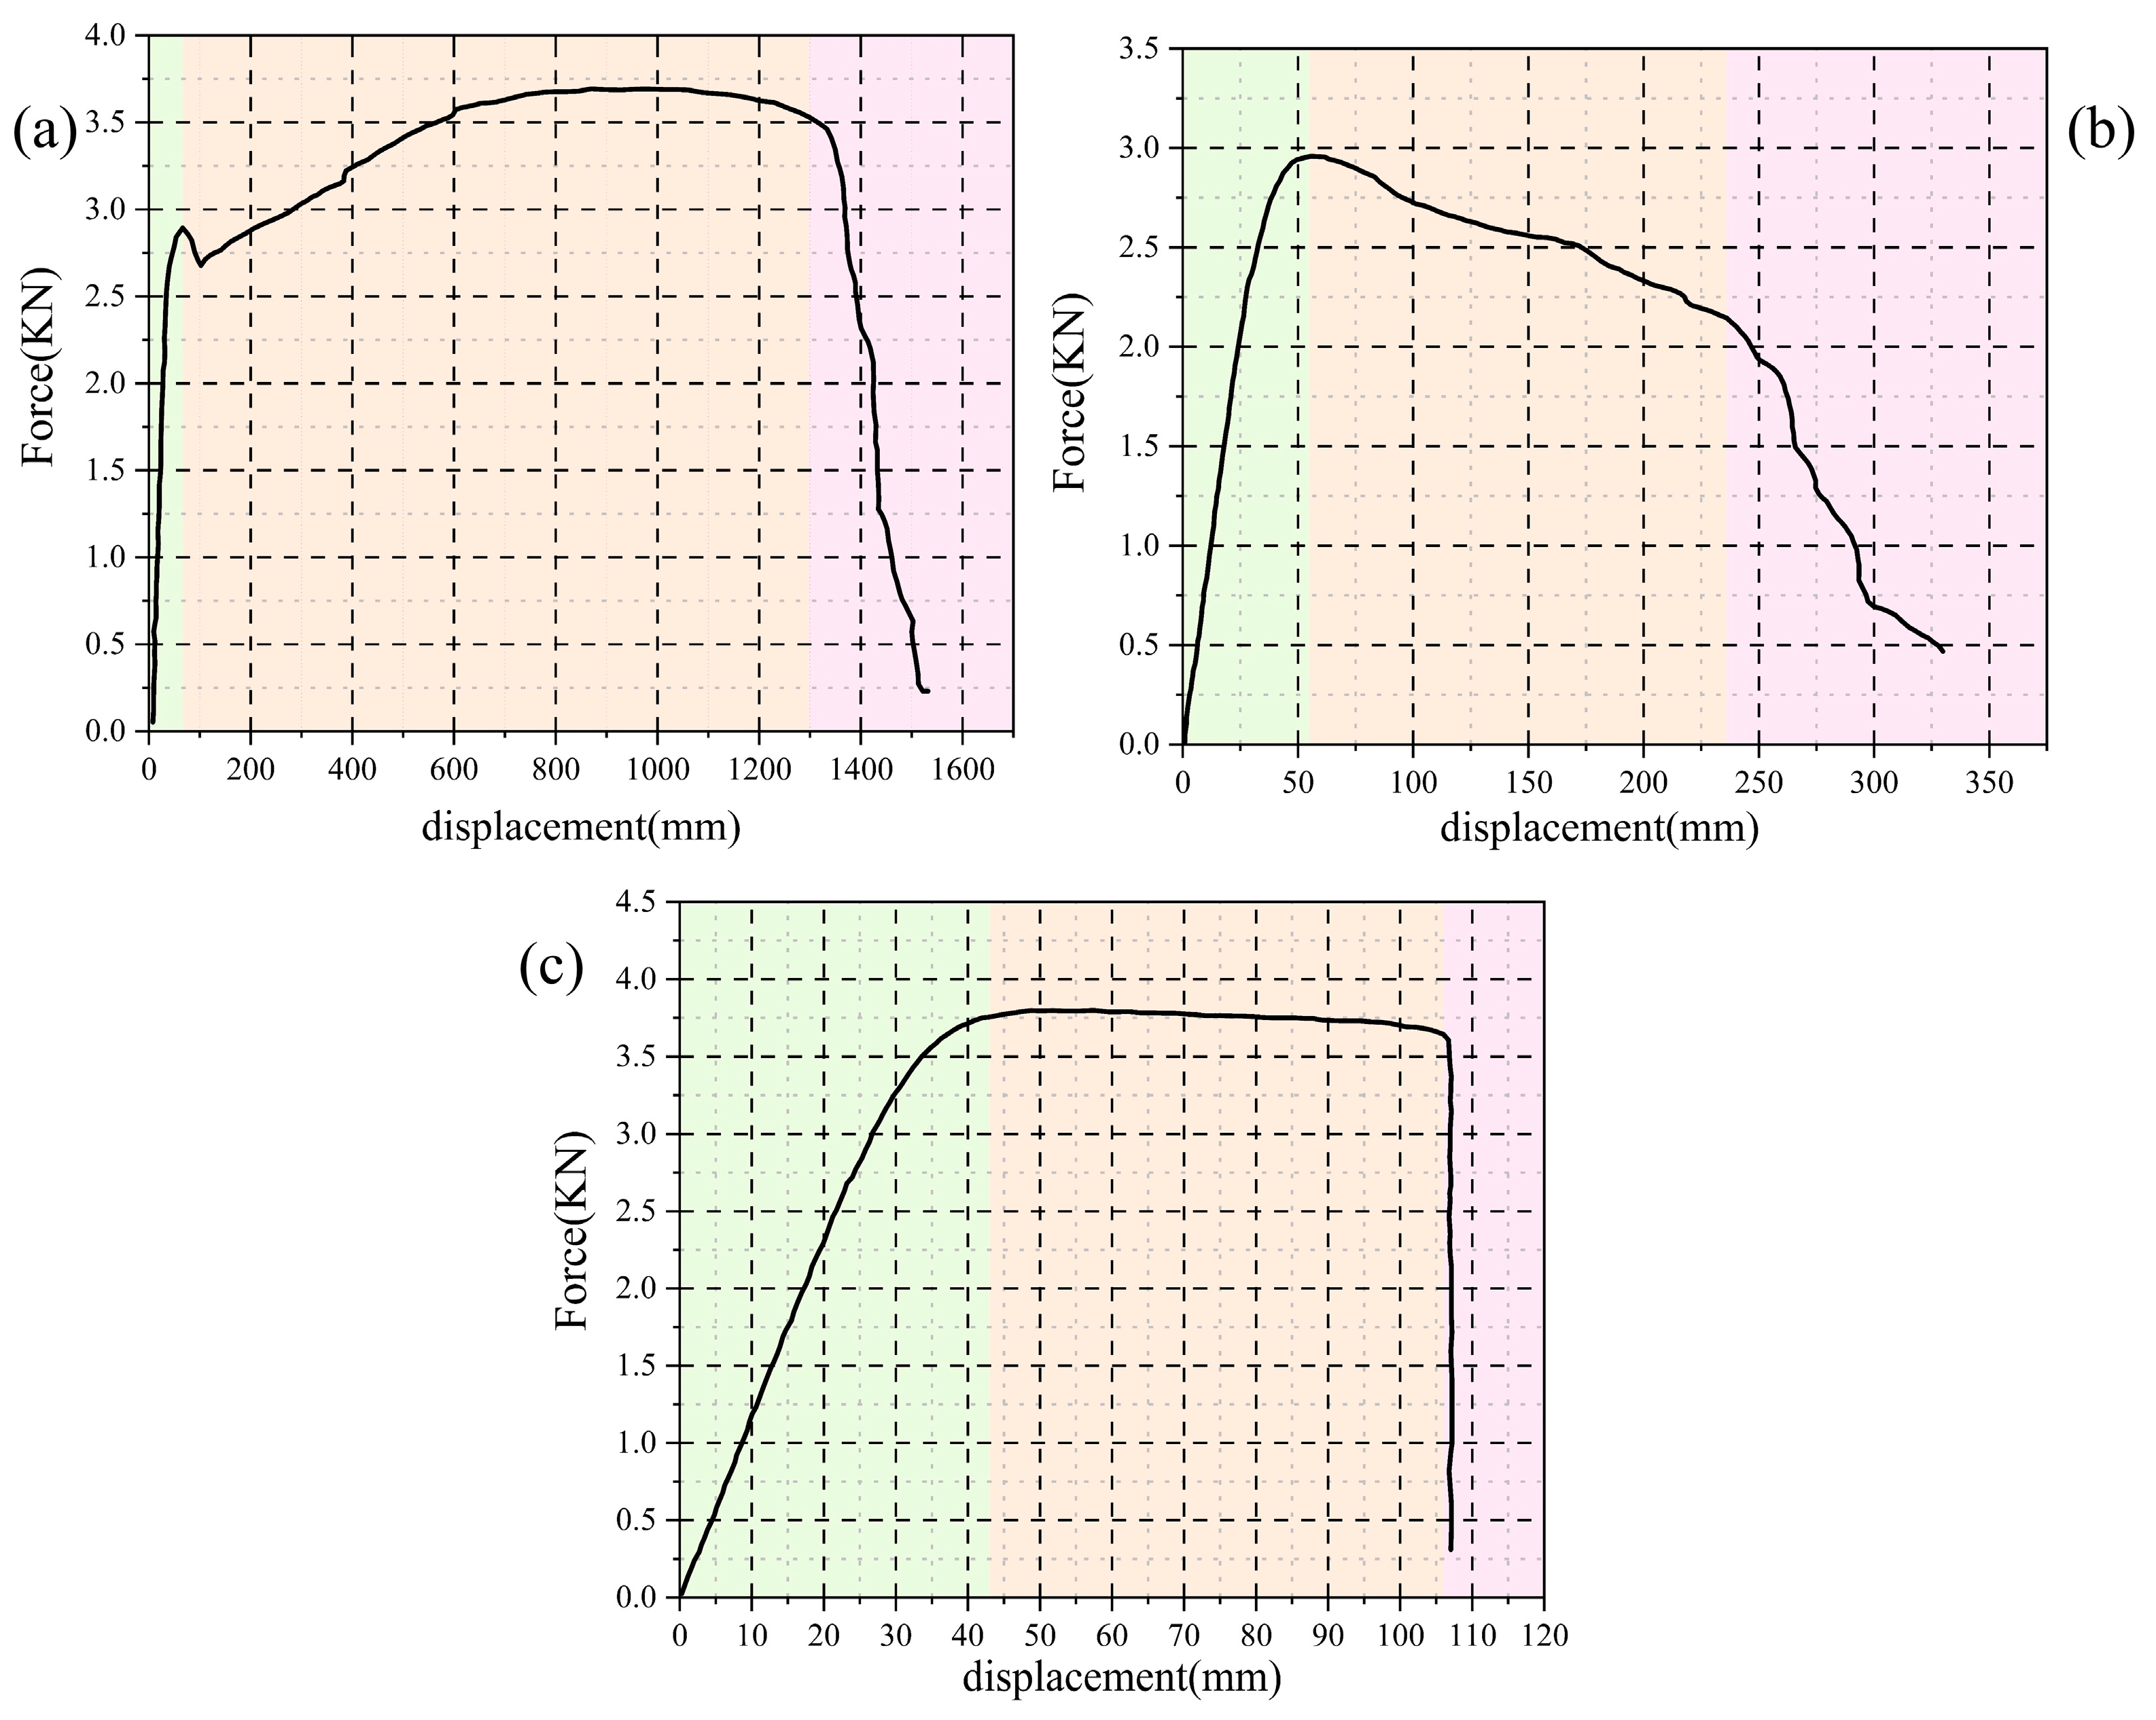
The compression test machine we used is an ETM series electronic universal testing machine that is integrated with a tensile test machine. Before starting the experiment, the lower platform needs to be leveled so that it is in a horizontal position; the upper platform compresses the experimental specimen downward at 3 mm per minute. The curve of the force and compression amount has only one form (as shown in Figure 11); the initial stage involves force, increasing the amount of compression in the specimen, so it can bear the rapid increase in pressure after reaching a certain value at a slow increase. Up and down the two end surfaces of the platform’s sassafras force, the specimen’s constraints cannot produce deformation; the middle of the specimen with the section with increased pressure will continue to become thicker; and the bearing capacity increases. When the amount of deformation is close to 5 mm, the experiment is stopped.

5.2. Compression of Experimental Data Analysis

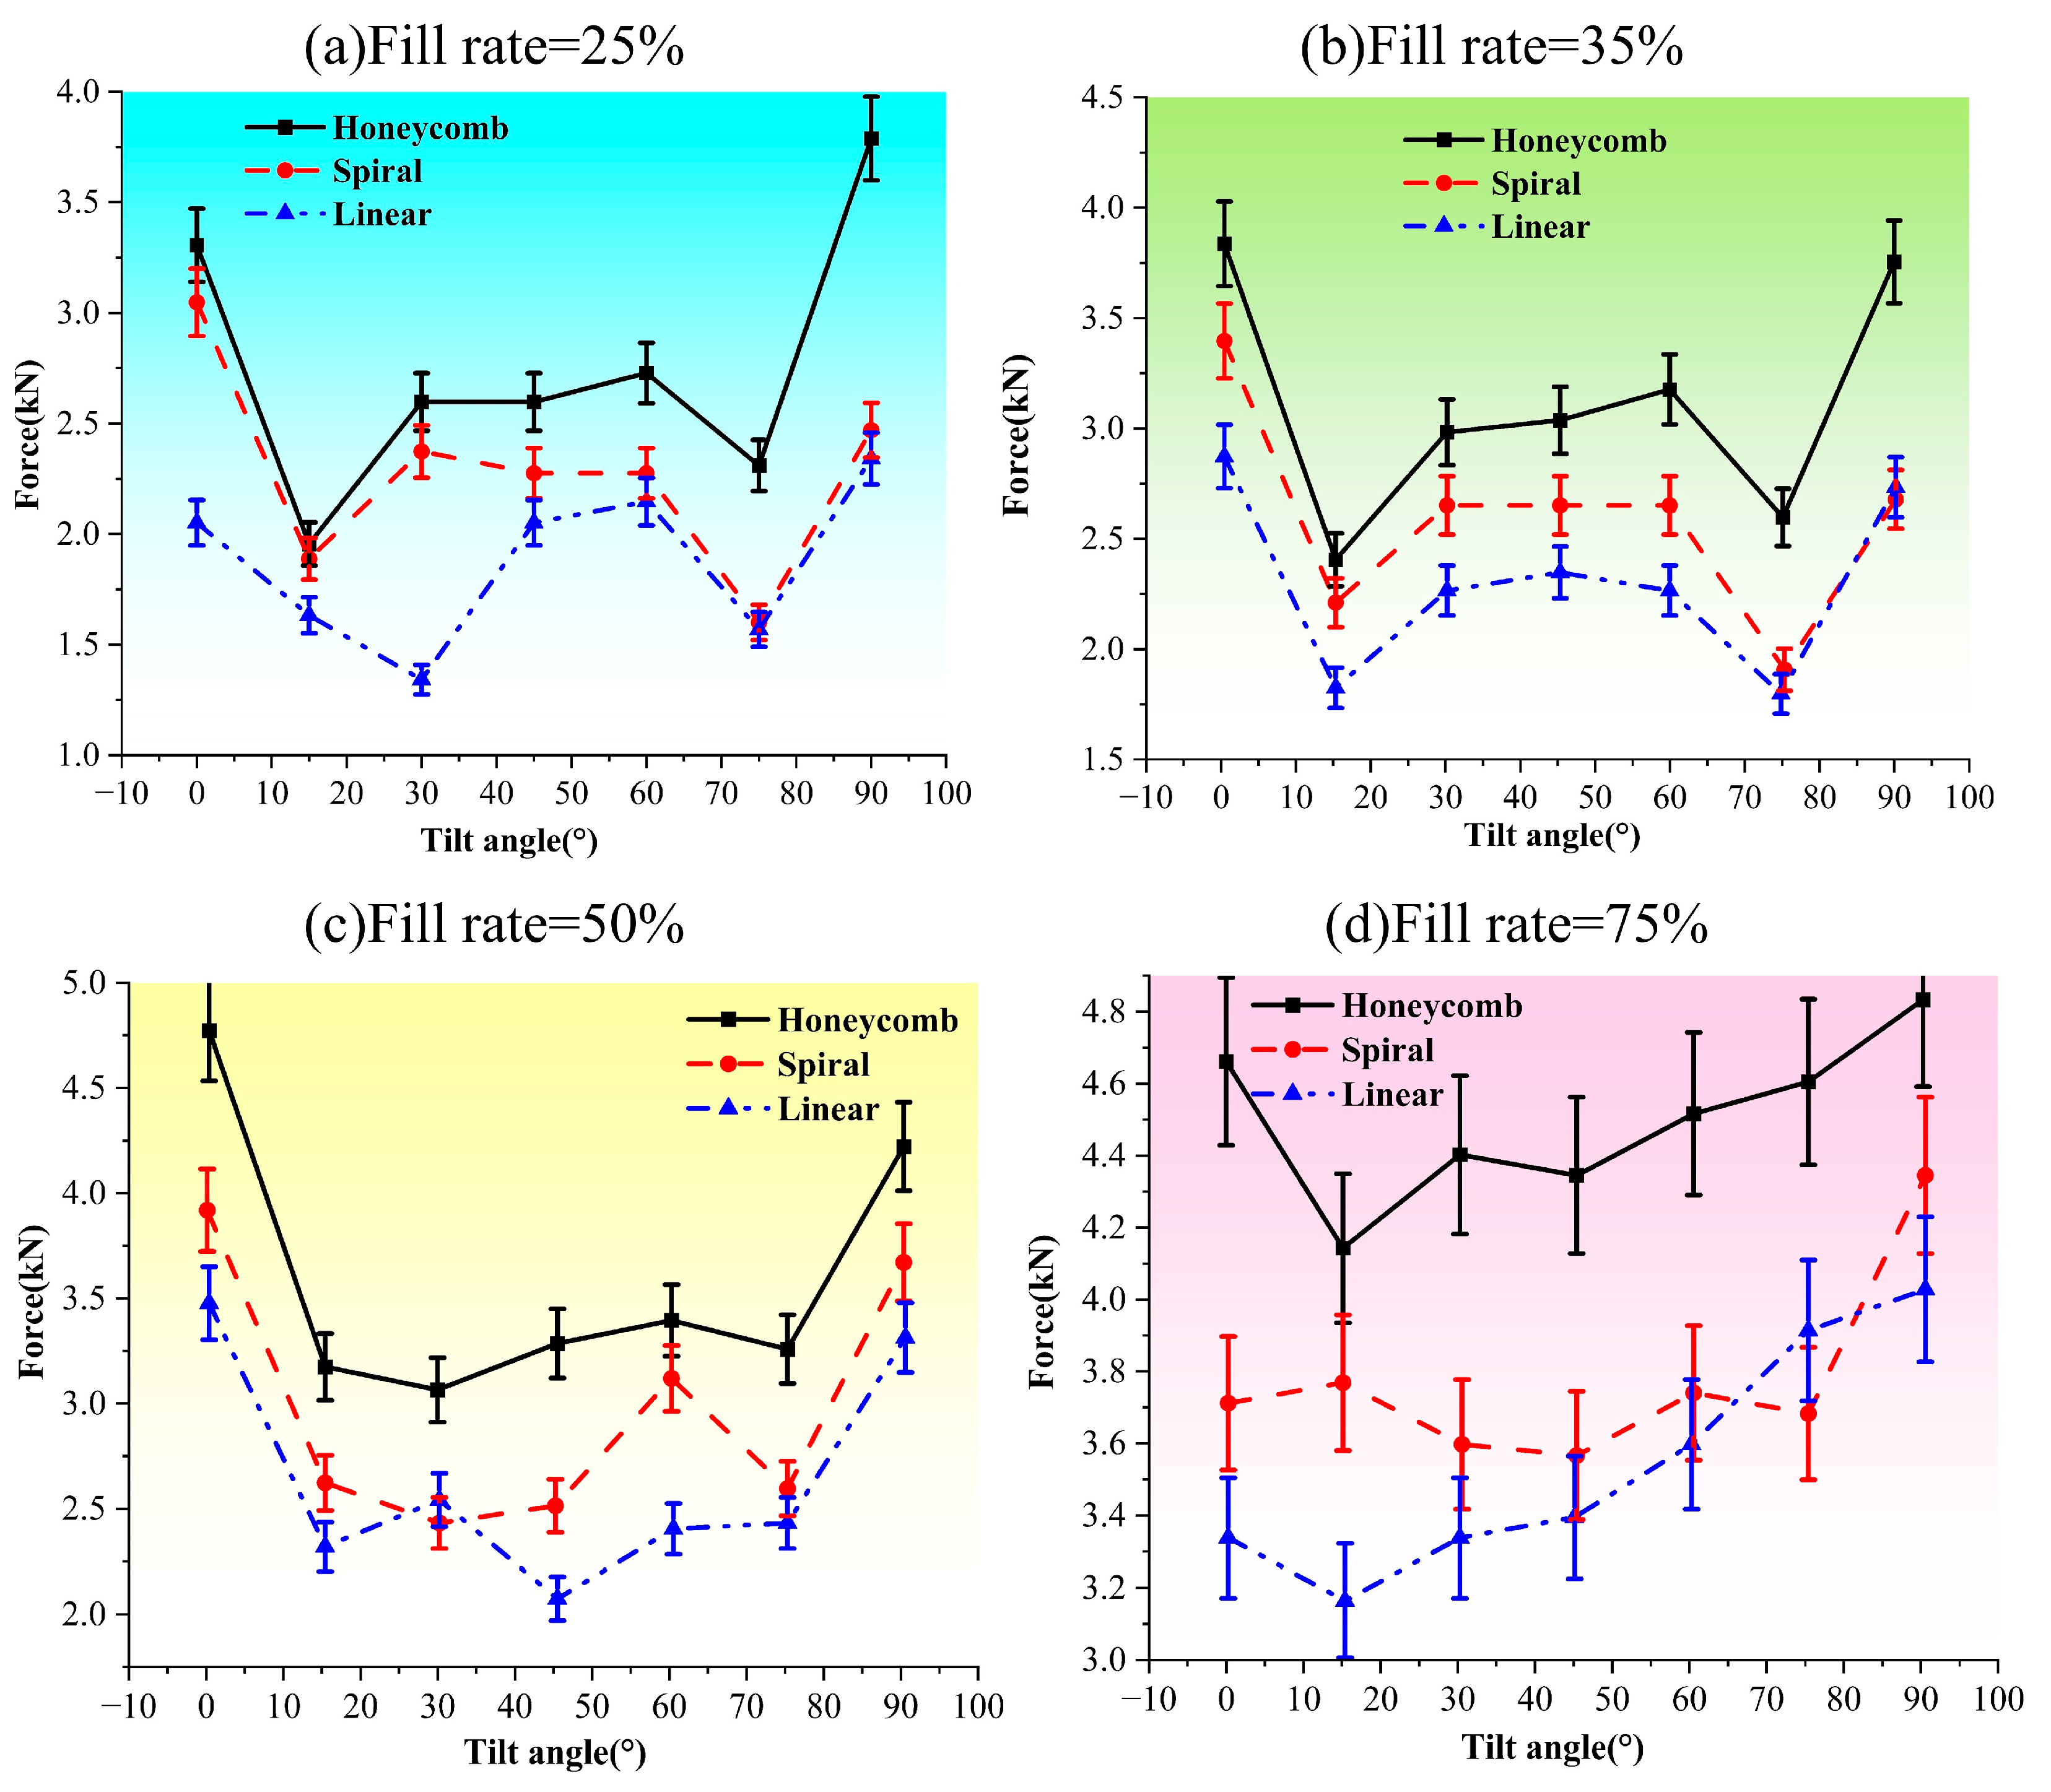
As shown in Figure 12a–d, below, the print tilt angle of the specimen is used as the horizontal axis, and the pressure is used as the vertical axis; the coordinates of the vertical axis of the data points are the pressures on the specimen when the deformation of the printed specimen is close to 5 mm. Figure 12a–d represent the variations in the maximum force of the three infill structures with the tilt angle under infill rates of 25%, 35%, 50%, and 75%, respectively. The black solid line nodes are rectangular, indicating that the filling structure is a honeycomb; the red dotted line nodes are circular, indicating that the filling structure is a spiral; and the last symbol indicates that the filling structure is straight.
When the filling rate is lower than 50%, the change curve of the loads of the three types of filling structures at a specimen deformation of 5 mm, with the print inclination angle of the specimen, is in the overall shape of a W. It decreases in an interval of 0° to 15°, rises in an interval of 15° to 45°, decreases in an interval of 45° to 75°, and rises in an interval of 75° to 90°; the trend of this curve is determined based on the statistical data of all the data, but there is bias in the individual data. At a 75% fill rate, the curves for the three fill structures show a decreasing trend in the 0° to 15° interval and an increasing trend in the 15° to 90° zone. The curve of the specimen with the honeycomb filling structure is located above the curves of the other two filling structures in all four filling rates, followed by the spiral filling curve above the curve of the linear filling structure. In summary, it can be concluded that the compressive performance of the specimens with honeycomb filling structure is better than that of the spiral one, and the compressive performance of the spiral filling structure is better than that of the linear filling structure.
As shown in Figure 13a–c, with the magnitude of the force as the vertical axis and the size of the filling rate as the horizontal axis, the vertical coordinates of the data points in the Figure 13 represent the magnitude of the compressive deformation of the specimen under pressure at the respective printing inclinations. The amount of deformation reaches 5 mm when subjected to pressure. The horizontal coordinates are the filling rate of the specimen. Figure 13a–c in the Figure 13 denote the honeycomb filling structure, the spiral filling structure, and the linear filling structure, respectively.
From a large number of data points, we can see that the size of the pressure on the specimen increases with the increase in the filling rate, and the difference between the values of each specimen becomes smaller and smaller, which leads to the conclusion that the compressive resistance of the specimen increases with the increase in the filling rate. It can be inferred that the compressive resistance grows closer and closer to the filling rate when it reaches a certain value. Individually, the compressive properties of the specimens with printing inclination angles of 0° and 15° are better than the others, while the line with a printing inclination angle of 0° shows an increasing trend in the filling rate range of 25% to 50% and a decreasing trend in the range of 50% to 75%.
Columns [40] are a typical solution for designing wind turbine towers and supporting foundations (e.g., monopiles and buoyancy), and the study of the structural stability and strength of column structures when subjected to axial pressures is of great significance for the wind energy industry [41]. Combined with the conclusions drawn from the compression experiments, in the use of 3D printing technology to manufacture towers, monopiles, offshore platforms, steel guides, and other such pressure-bearing structures, we can see that, regarding the compressive performance of the three infill structures under high infill rates of compression resistance, the honeycomb infill structure is more stable. The tilt angle of each of the compression resistance values also tends to be similar to the printing tilt angle. The two choices are 0° and 90°. If the overall printing structures need to be adjusted for the parameters or reasonable design of the local angle of the print bed components to obtain sufficient strength, we should choose high-fill-rate printing to achieve more than 80% success. However, then, the lightweight requirements will be reduced; therefore, this is a matter of trade-offs.

6. Torsion Experiment

6.1. Curve Form

This torsion experiment uses the ETT series torsion testing machine, as shown in Figure 14, below; it uses a computer through a sensor generated by the torque of the torsion angle of the curve. All the torsion specimens for the experiment generated three forms of curves, as shown in Figure 14a–c, which correspond to print inclination angles of 0°, 15°, and greater than 30° for the specimen. The three forms of the curve can be divided into three stages. The first stage is a rapid climb stage; that is, the specimen withstands the torque with a rapid increase in the torsion angle. In the second stage, there are three forms of the 0° curve, with the increase in the torsion angle of the torque withstanding a rate of increase, which is slightly slower than the first stage of the torque. The torque then increases to a certain value with the torsion angle, which continues to increase in a small range of change, that is, 15° for the specimen in this stage of the curve, within this range of the torque. The specimen in this stage increases its ability to withstand the torque with the increase in torsion angle, but there is a faster rate of decline. At greater than 30°, the specimen’s ability to withstand the tilt angle with the torque increase will last longer within a small range of change. However, the 30° specimen, with the exception of the tilt angle of the specimen at the second stage, will endure for a relatively short period of time. In the third stage, the specimen is unable to withstand the torque falling sharply, proving that the specimen has been completely destroyed. From the curve of the second stage, it can be initially judged that the specimen’s torsional performance is stronger at an inclination of 0°.

6.2. Torsional Experimental Fracture Forms

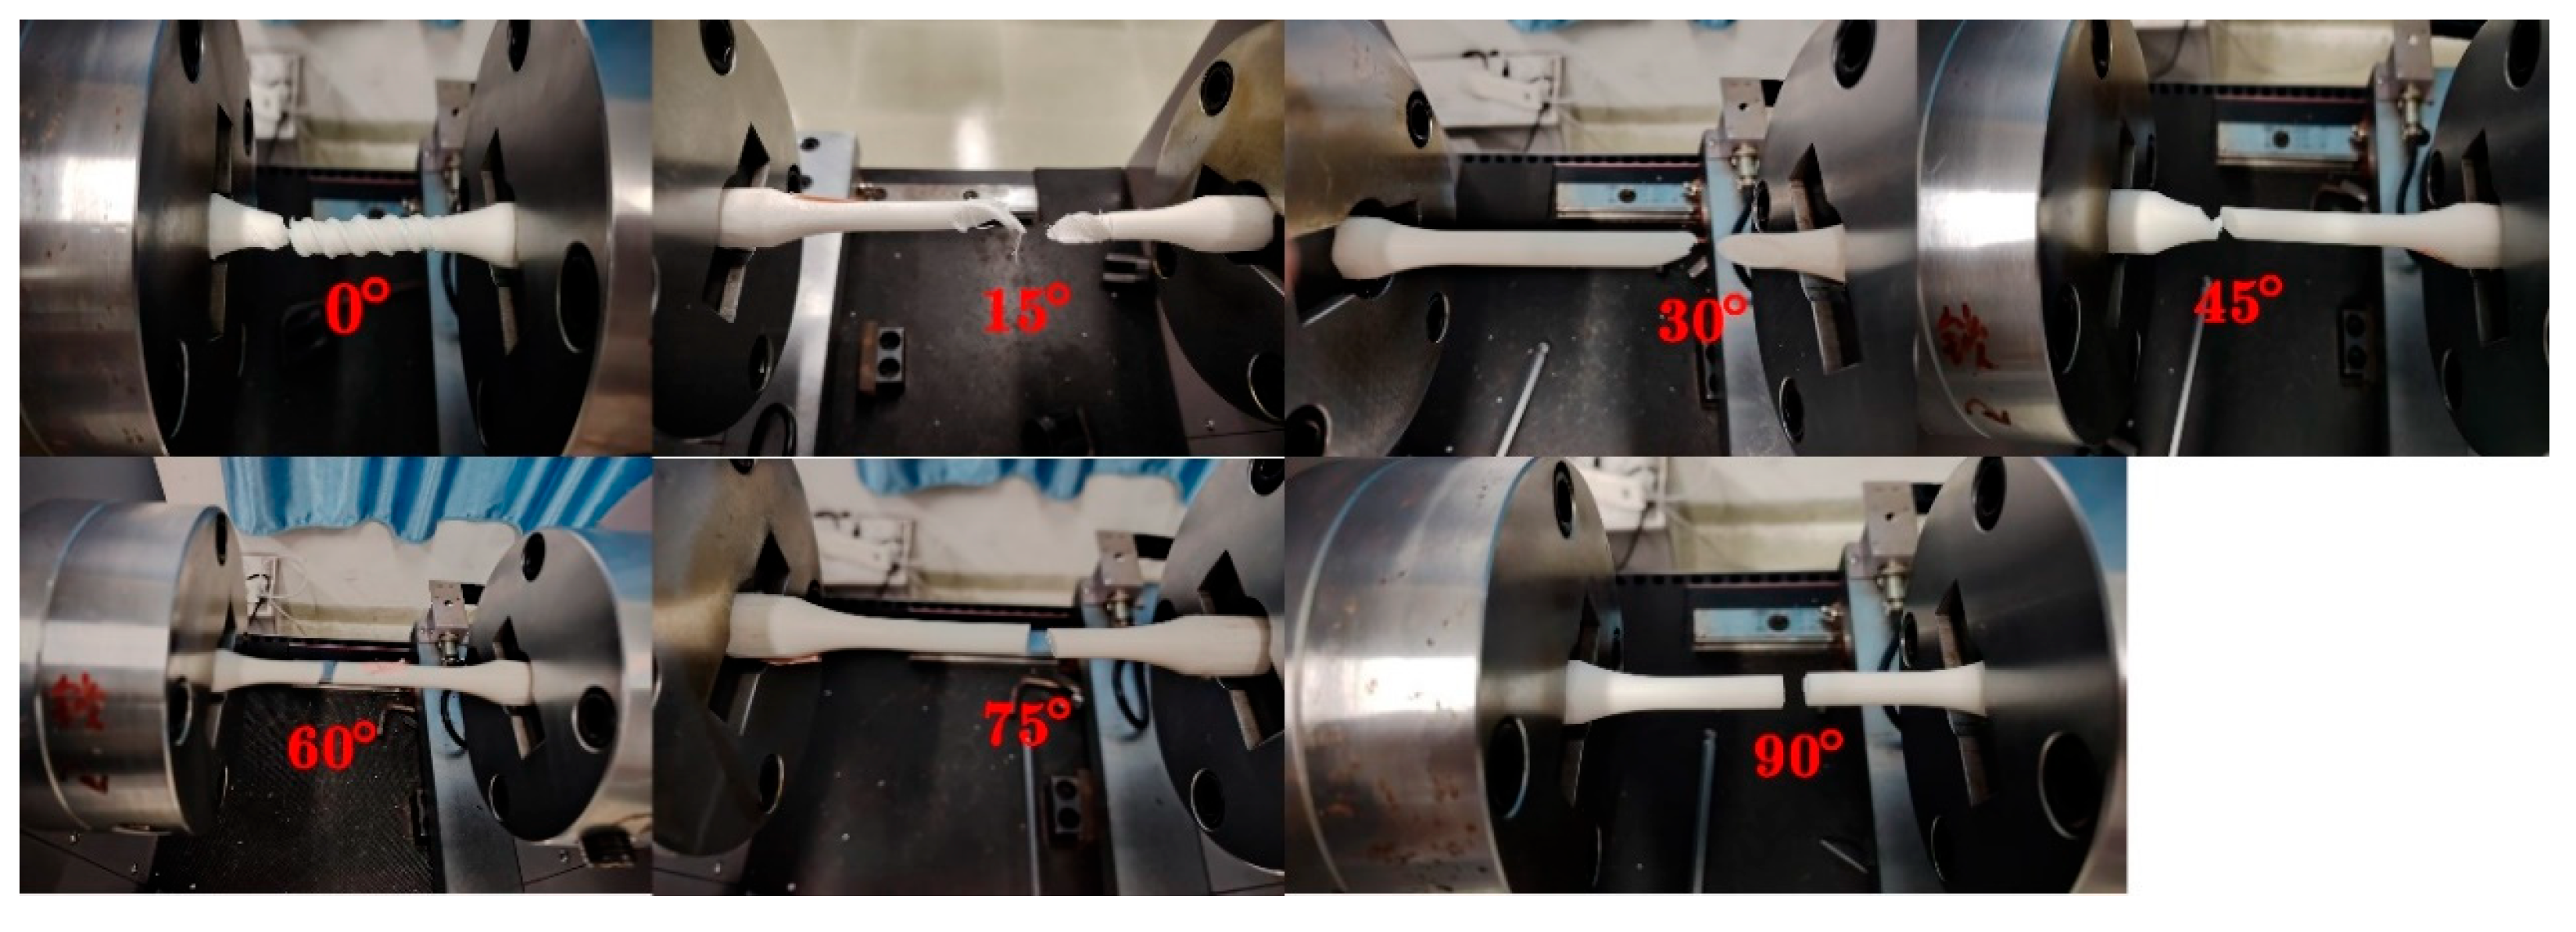
As shown in Figure 15, two fractures form in the torsion specimen. The first is for a specimen with a print inclination angle of 0°; with an increase in the torsion angle of the threaded specimen, the specimen surface will protrude from the marking distance, which is of a cyclic nature; this fracture and a tensile fracture in similar fiber filament material occur from the outside to the inside layer. The second form of fracture is along the print layer, with fractures and tensile fractures consistent with the larger angle of the cross-section, which is flatter. The 0° torsion specimen with the large number of threads on the surface is positively correlated with the torsion angle of the test piece before fracturing, which usually reaches 800° or more, while other specimen angles are usually within 500°, which further illustrates that the 0° print inclination angle of the specimen is better for its torsional performance than other inclination angles. This further indicates that the torsional properties of specimens printed with an inclination of 0° are better than those of specimens printed with other inclinations.
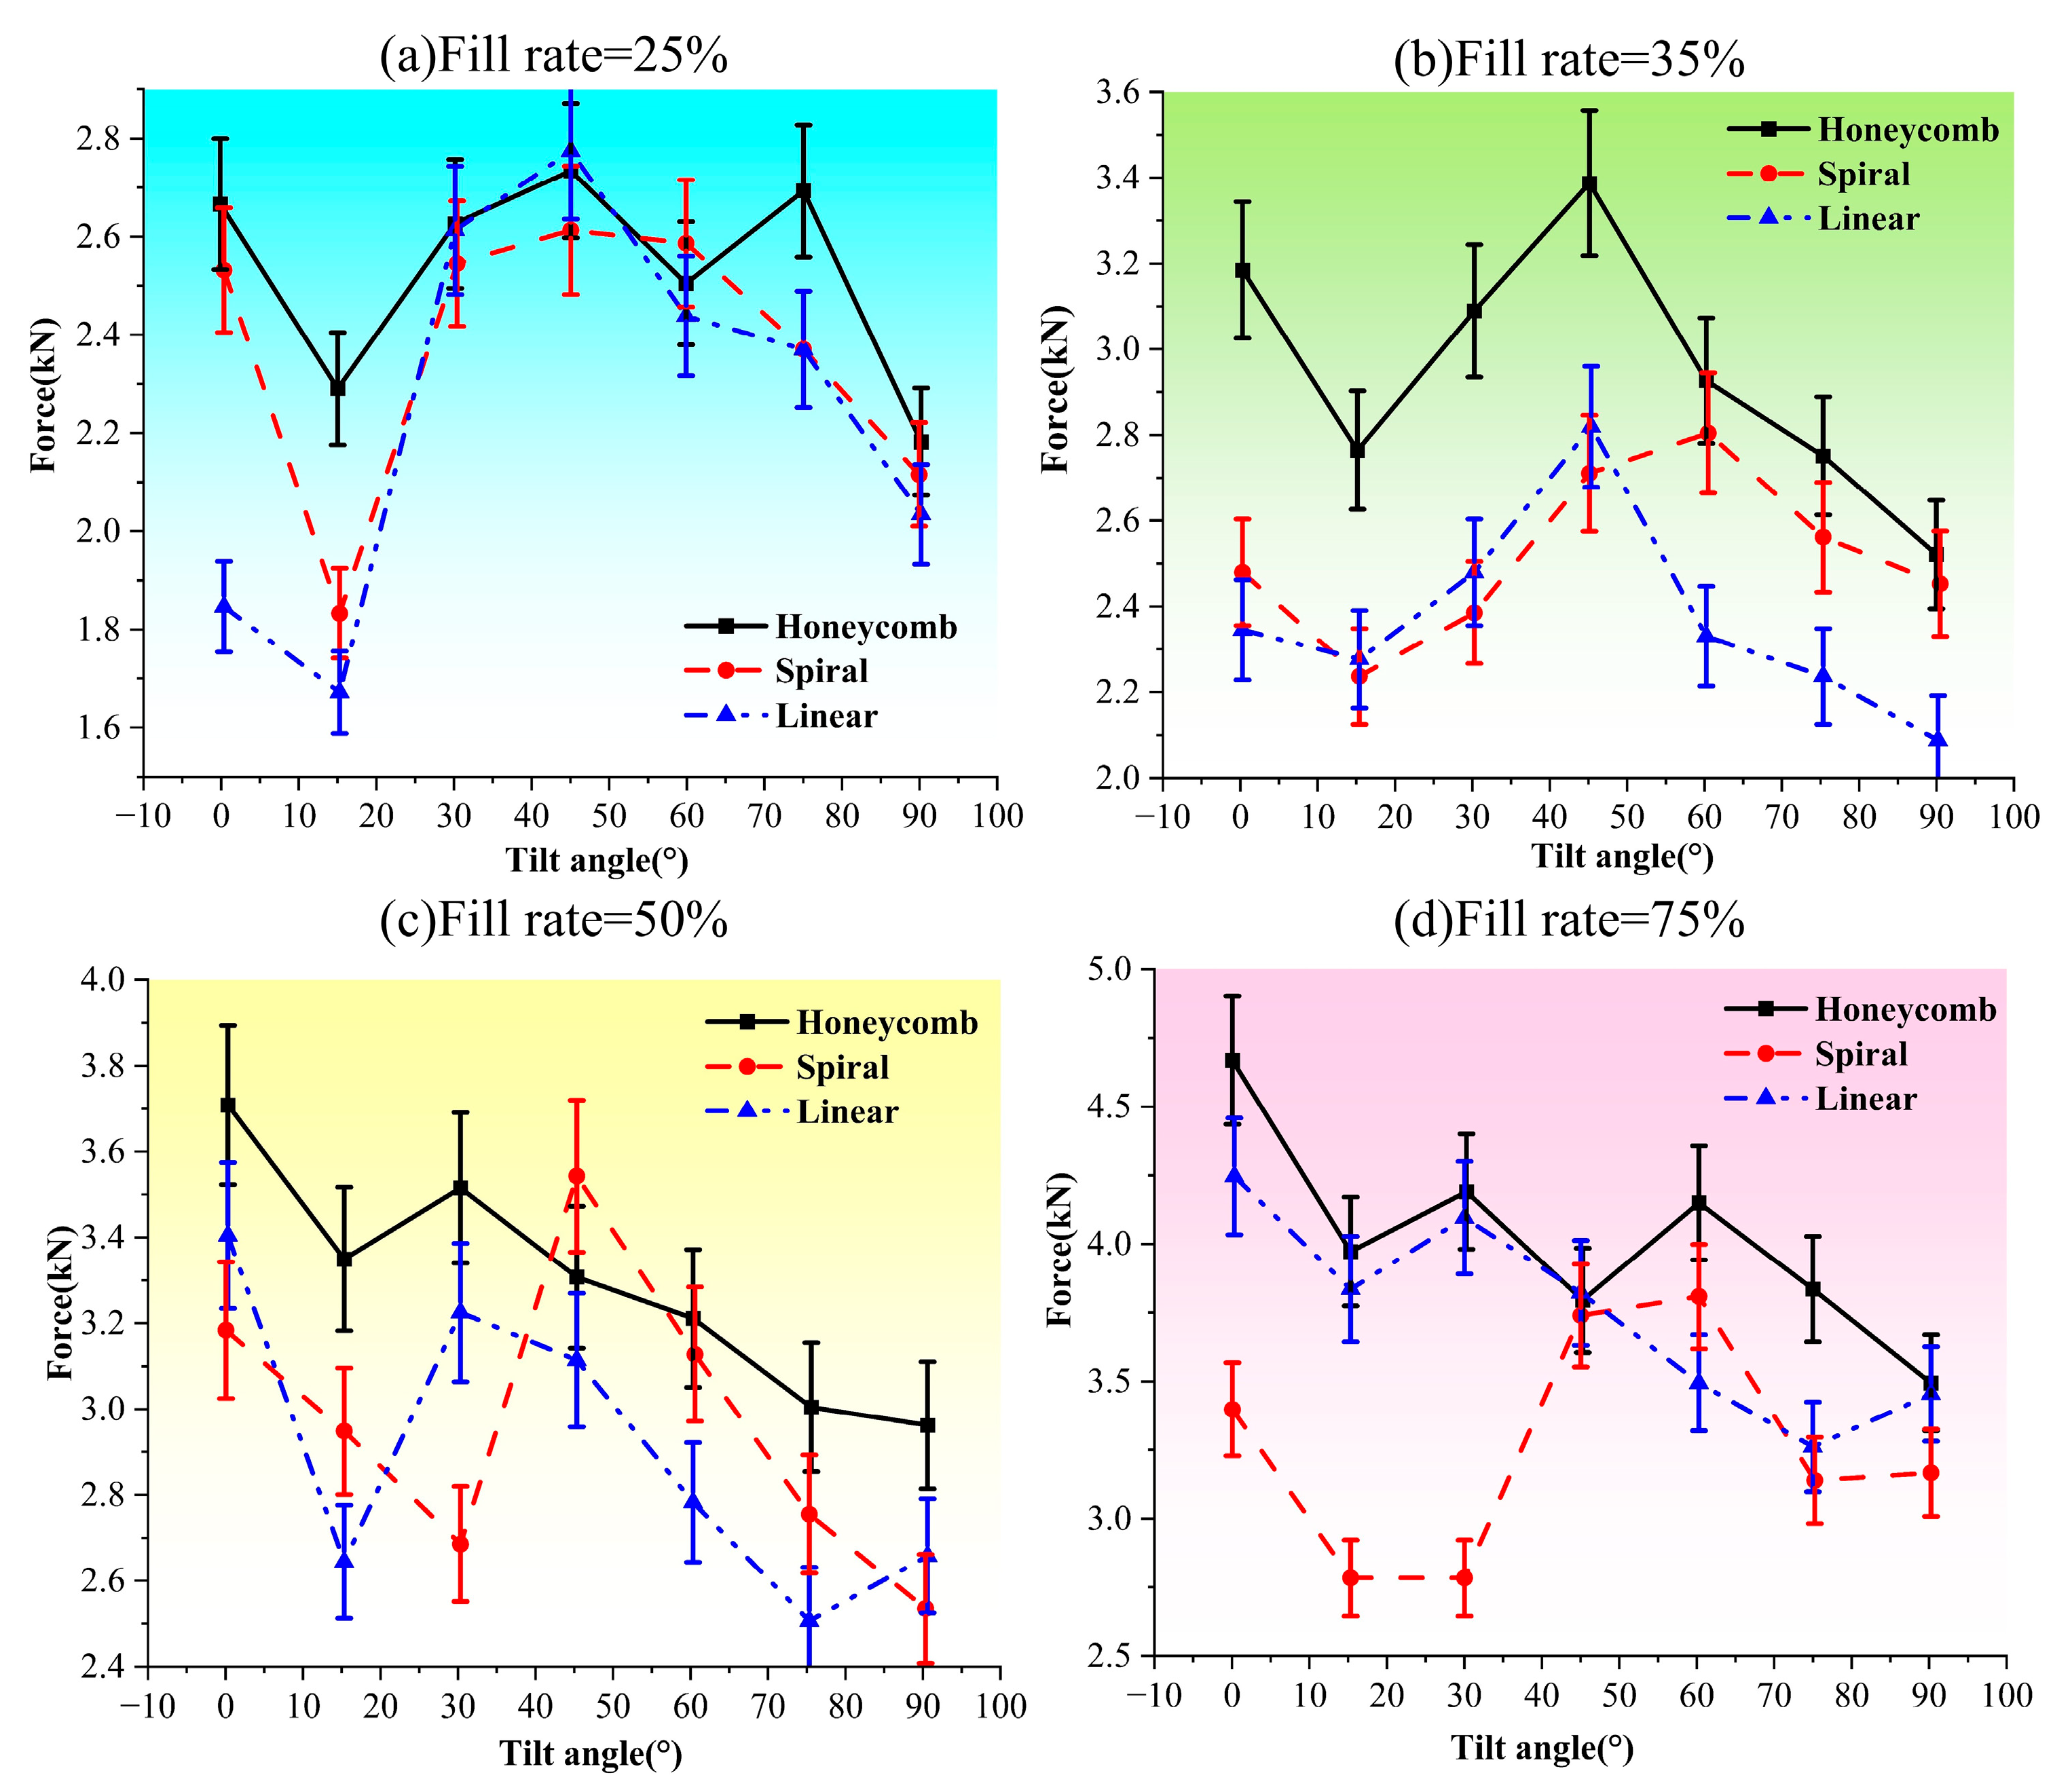
As shown by a,b,c,d in Figure 16 below, the horizontal axis of the coordinate system represents the print inclination of the specimen, and the vertical axis represents the torque that the specimen is subjected to. From Figure 16a–d, it can be seen that the fold line of the honeycomb infill structure is located above the other two infill structures in most cases, which shows that the torsional performance of the honeycomb infill structure is better than that of the other two infill structures. The variation curves of the three filler structures tend to decrease in an interval of 0° to 15°; in an interval of 15° to 30°, there is no obvious pattern in an unstable region, and there is a decrease in the interval from 45° to 90°. The maximum values of the data points of the three infill structures in the figure mostly appear at printing inclination angles of 0° and 45°, which indicates that the torsional performance of the specimens with these two printing inclinations is better. The torsional properties of the three infill structures are similar at low infill rates, and the honeycomb infill structure has a stronger variation pattern than the other two infill structures, indicating that it is more predictable.
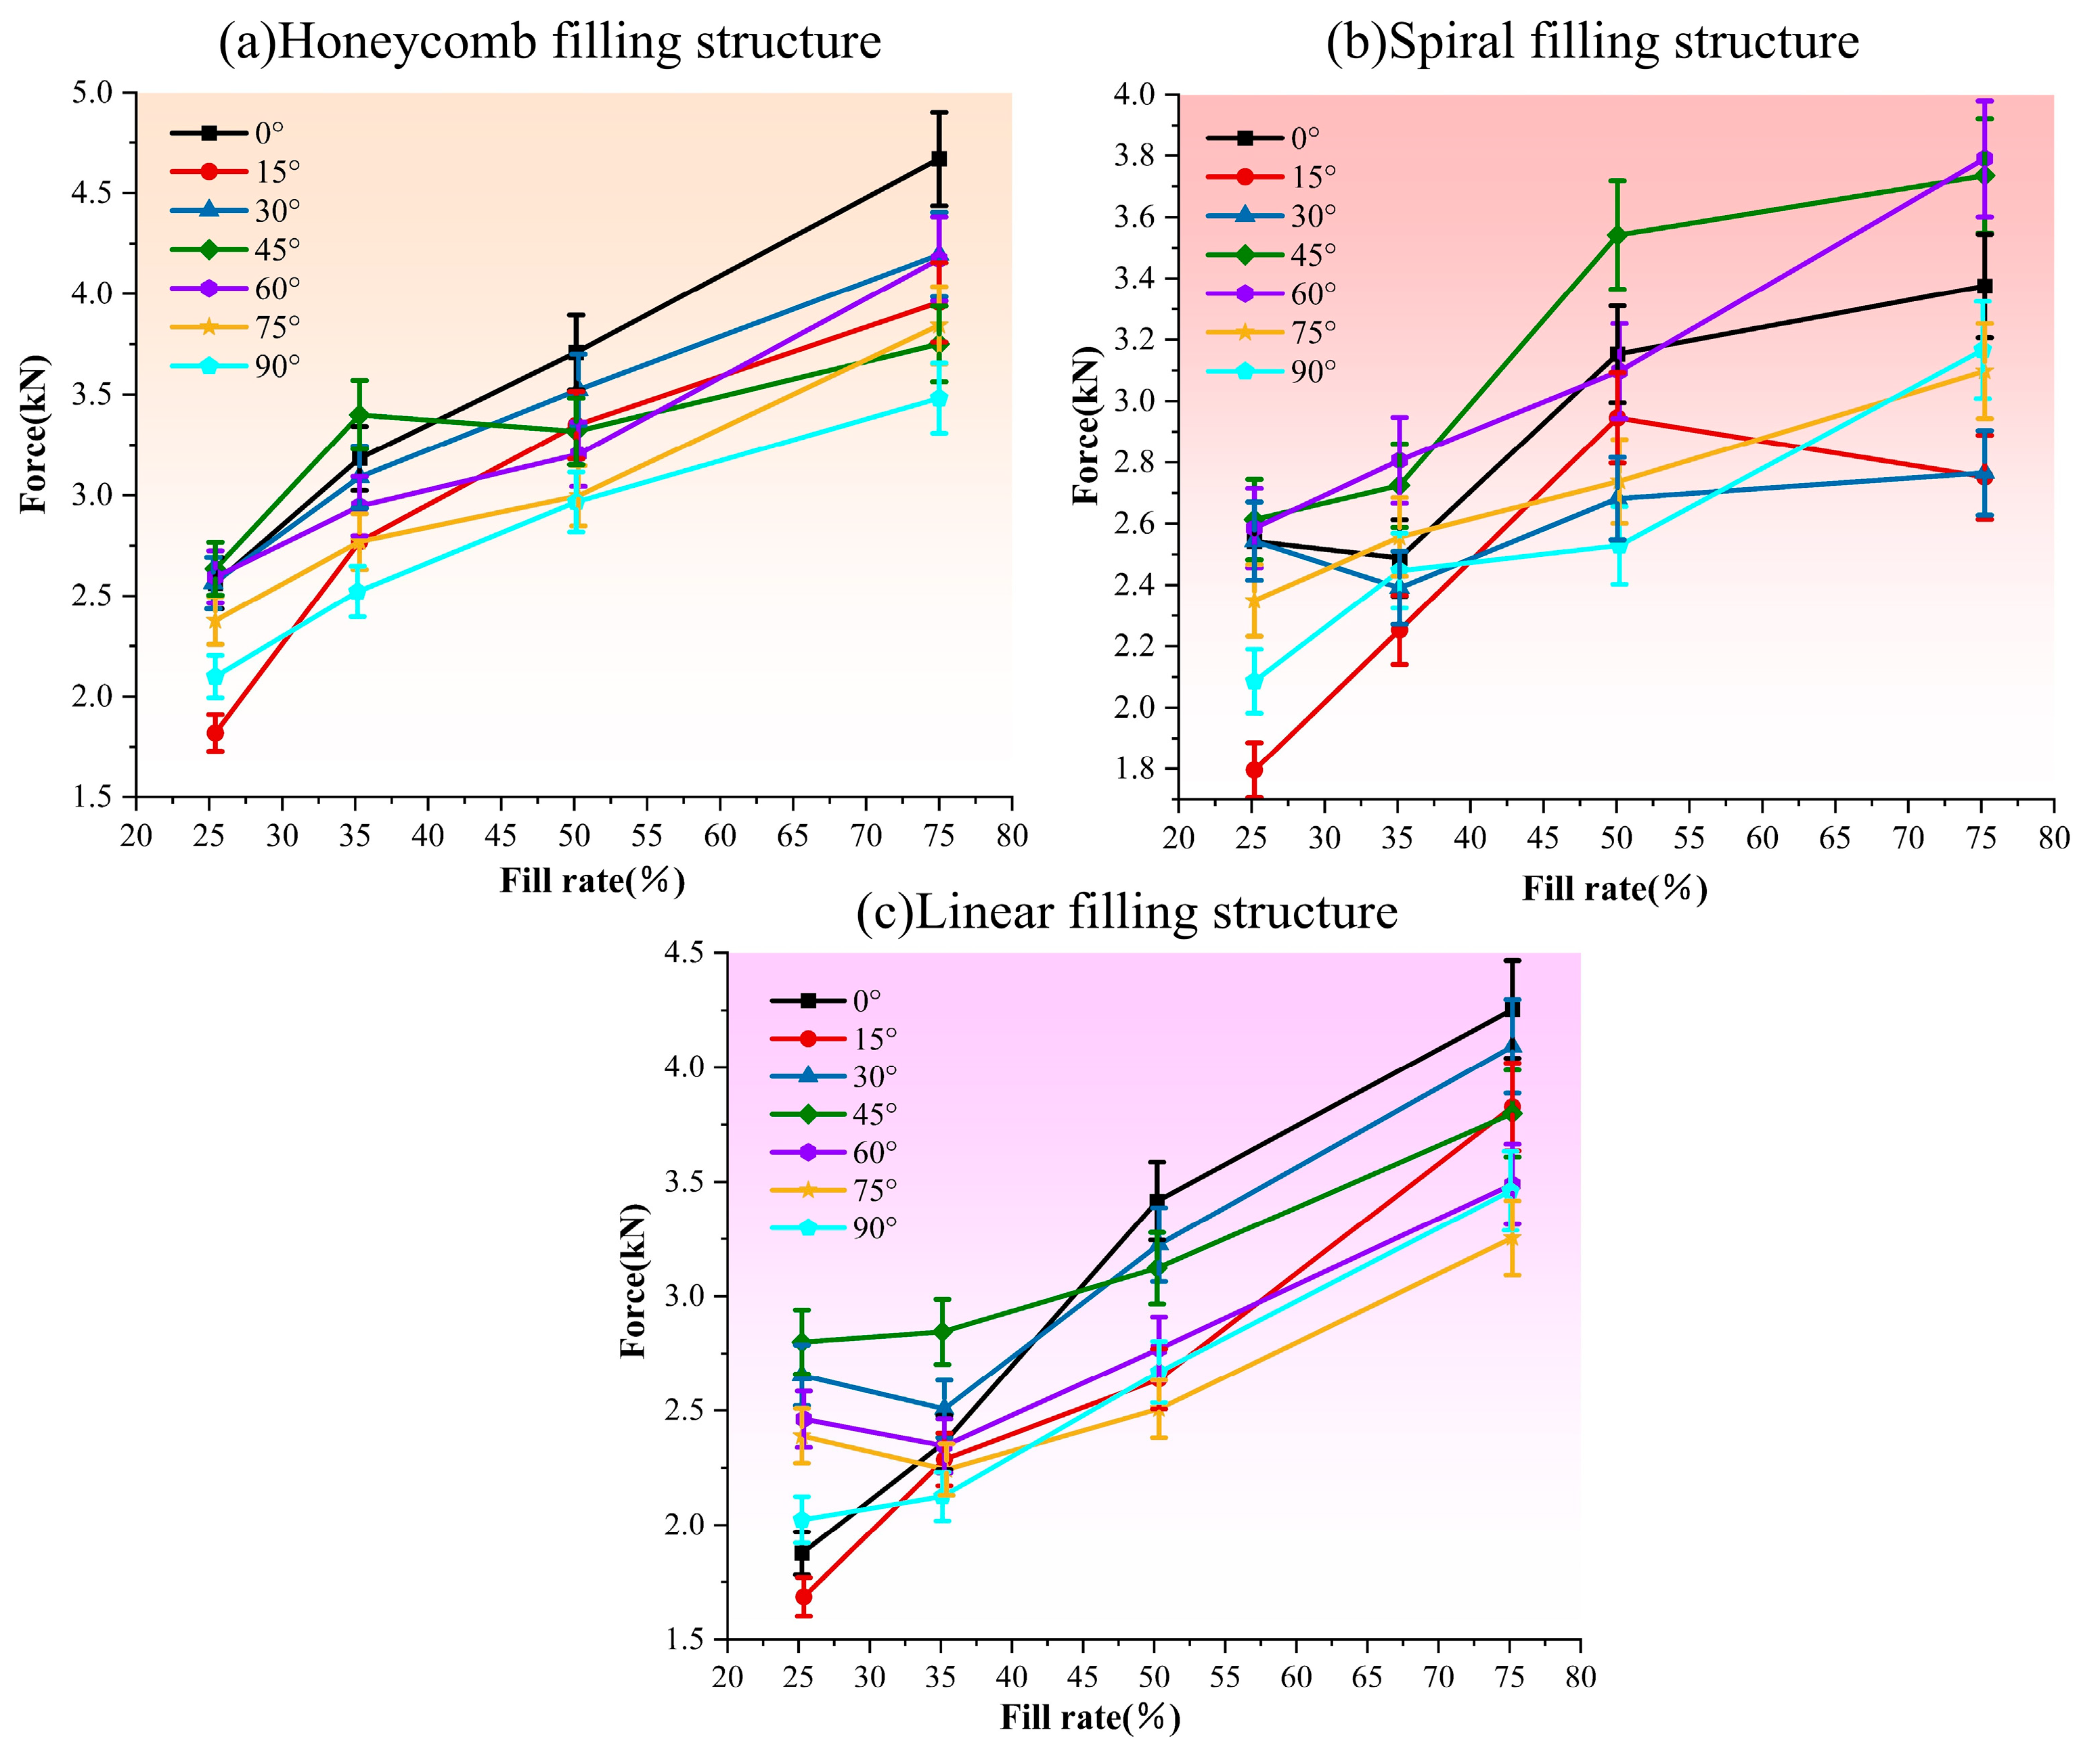
As shown in Figure 17a–c, the horizontal axis represents the filling rate, and the vertical axis represents the torque; each folded line represents a particular print inclination and a filling structure of the torsional specimen and its maximum torque, along with its change in filling rate. From Figure 17, it can be seen that, for the filling rate interval of 25% to 50%, the majority of the data points carrying the torque are increased by the increase in filling rate, but there are still a few parts that do not comply with this rule; furthermore, the filling rate of more than 50% also increased the compressive properties of specimen. For specimens with a spiral filling structure, inclination angles of 0° and 30° and a filling rate greater than 50% torsional performance are better; this is also true of 45°. From Figure 17, we can observe that under the three printing methods, the changing trend of the component’s torsional resistance mainly shows an upward pattern as the infill ratio increases.
Marine structures subjected to torsion are very important for the study of their failure, and determining the torsional performance of traditional marine structures is mostly based on the material itself [42]. The use of 3D printing technology to manufacture marine structures requires us to determine the torsional performance of not only the material itself but also the bonding force between the printed layers. A tilt angle of 0° for print specimens is more beneficial to the material’s torsional capacity, and the design of other parameters can improve the torsional performance of a material. In summary, it can be seen that the choice of the honeycomb filling structure fulfils the principle of a higher filler rate being better. A print tilt angle of 0° is preferred, followed by 30°.

7. Conclusions

Through tensile experiments, it can be concluded that the tensile properties of the honeycomb infill structure are better than those of the other two infill structures, and the tensile properties of the specimens with a printing inclination angle of 0° are determined by the strength of the fiber filaments of the material itself; the tensile specimen inclination angle of the specimen breaks along the printing layer between 15° and 90°, which indicates that the inter-layer bonding force is also one of the indicators for determining the tensile properties of 3D-printed specimens. The tensile properties of specimens with inclination angles of 0° and 15° are significantly greater than those with other inclination angles. A filling rate above 50% is in a regular and stable interval, in which the tensile properties of the specimens are positively correlated with the filling rate. The statistical data are shown in Table 2.
Through the compression experiment, it can be concluded that the quality of the compressive properties of the three kinds of filling structures is in the order of honeycomb filling structure, then spiral filling structure, and then linear filling structure. The compressive properties of the specimens with inclination angles of 0° and 90° are better than those of the other inclinations, but the specimens with an inclination angle of 90° have the best print surface quality (which does not have any effect on the mechanical properties); a filling rate of 50% is positively correlated with the filling rate when the compressive properties are positively correlated with the filling rate. The compressive properties are positively correlated with the filling rate when the filling rate is above 50%. The statistical data are shown in Table 3.
The torsion experiment shows that the specimen with honeycomb filling structure has better torsional performance; the specimen with 0° inclination angle breaks in torsion from the outer layer to the inner neck shrinkage, and then, one layer breaks; the specimens with other inclination angles break along the printed layer, similar to the tensile specimen; and the larger the angle, the flatter the section. This proves that the bonding force between the layers is one of the most important indices for determining torsional performance; the specimen printed with 0° is able to withstand larger torque and not fail at larger torsion angles, while the specimen with a 15° inclination angle has poorer torsional performance. The print specimens at 0° are able to withstand large torsion angles without failing and can withstand large torque, while torsional performance at a 15° inclination angle is poor; the positive correlation between torsional performance and the filling rate increases when the filling rate is higher than 50%. The statistical data are shown in Table 4.
The above situation is shown in Table 5. In the table below, we have compared the aforementioned experiments and identified the advantages of and variations in different printing methods under various experimental operations. In the above experiments, we used the maximum stress that the components can withstand as the reference standard. This is also our basic reference method for evaluating a component. The ability to withstand higher ultimate stress means that the component possesses better performance parameters.
In summary, for the three properties, the best performance parameters are a honeycomb filling structure, an inclination angle of 0° specimen, and 15° specimen tensile performance. These are good for good compressive performance. For the 90° specimen, compressive performance is good, and torsional and tensile performance are poor, but it has the best surface print quality. The filling rate applies a full range of enhancements to the overall performance, but although increased fill density delivers superior performance, higher fill density inevitably leads to increased weight. The objective of this study is to reduce the weight of turbines and hydroelectric generators using 3D-printed materials while maintaining strength, thereby enhancing efficiency. The definition of lightweight is the ratio of strength to weight. When the strength requirements of turbines and hydro-generators are met, appropriately increasing the lightweight ratio can reduce the weight of components, which can effectively improve the mechanical motion efficiency of the machines and thus enhance energy generation efficiency. However, since PLC material is not a traditional high-strength material, its mechanical performance under severe sea conditions remains to be verified. Additionally, its lightweight nature means that when used in large marine structures, it may exhibit excessive buoyancy, resulting in poor wave resistance. These are areas requiring future optimization. Future research may explore the varying structural impacts of different printing methods at equivalent mass.

Author Contributions

Conceptualization, H.J. and D.Z.; methodology, Y.X.; software, S.Z.; validation, Z.L. and S.G.; formal analysis, Y.X.; investigation, D.Z.; resources, D.Z.; data curation, S.Z.; writing—original draft preparation, Z.L.; writing—review and editing, D.Z. and Z.C.; visualization, D.Z.; supervision, D.Z.; project administration, D.Z.; funding acquisition, H.J. All authors have read and agreed to the published version of the manuscript.

Funding

This research was funded by the National Natural Science Foundation of China, grant number 62272109.

Data Availability Statement

The original contributions presented in this study are included in the article. Further inquiries can be directed to the corresponding author.

Conflicts of Interest

The authors declare that they have no known competing financial interests or personal relationships that could have appeared to influence the work reported in this paper.

References

  1. Tan, D.-P.; Li, P.-Y.; Ji, Y.-X.; Wen, D.-H.; Li, C. SA-ANN-based slag carry-over detection method and the embedded WME platform. IEEE Trans. Ind. Electron. 2012, 60, 4702–4713. [Google Scholar] [CrossRef]
  2. Wu, J.; Li, L.; Yin, Z.; Li, Z.; Wang, T.; Tan, Y.; Tan, D. Mass transfer mechanism of multiphase shear flows and interphase optimization solving method. Energy 2024, 292, 130475. [Google Scholar] [CrossRef]
  3. Soto-Rivas, K.; Richter, D.; Escauriaza, C. Flow effects of finite-sized tidal turbine arrays in the Chacao Channel, Southern Chile. Renew. Energy 2022, 195, 637–647. [Google Scholar] [CrossRef]
  4. Guo, X.; Wang, H.; Xiao, Y.; Liu, G.; Wang, W. Reassessing the cost of hydropower for multi-function hydropower bases: A case study from Sichuan. J. Clean. Prod. 2023, 413, 137422. [Google Scholar] [CrossRef]
  5. Comoglio, C.; Castelluccio, S.; Fiore, S. Environmental reporting in the hydropower sector: Analysis of EMAS registered hydropower companies in Italy. Front. Environ. Sci. 2023, 11, 1178037. [Google Scholar] [CrossRef]
  6. Wagner, B.; Hauer, C.; Habersack, H. Current hydropower developments in Europe. Curr. Opin. Environ. Sustain. 2019, 37, 41–49. [Google Scholar] [CrossRef]
  7. Guillou, N.; Chapalain, G.; Neill, S.P. The influence of waves on the tidal kinetic energy resource at a tidal stream energy site. Appl. Energy 2016, 180, 402–415. [Google Scholar] [CrossRef]
  8. Milford, C.; Martí, V.; Neill, S.P. Influence of the phase relationship between tidal currents and elevations on tidal energy conversion. Renew. Energy 2025, 247, 122774. [Google Scholar] [CrossRef]
  9. Rome, L.C.; Flynn, L.; Goldman, E.M.; Yoo, T.D. Generating electricity while walking with loads. Science 2005, 309, 1725–1728. [Google Scholar] [CrossRef]
  10. Donelan, J.M.; Li, Q.; Naing, V.; Hoffer, J.A.; Weber, D.J.; Kuo, A.D. Biomechanical energy harvesting: Generating electricity during walking with minimal user effort. Science 2008, 319, 807–810. [Google Scholar] [CrossRef]
  11. Cobb, B.R.; Sharp, K.V. Impulse (Turgo and Pelton) turbine performance characteristics and their impact on pico-hydro installations. Renew. Energy 2013, 50, 959–964. [Google Scholar] [CrossRef]
  12. Qi, Y.; Kim, J.; Nguyen, T.D.; Lisko, B.; Purohit, P.K.; McAlpine, M.C. Enhanced piezoelectricity and stretchability in energy harvesting devices fabricated from buckled pzt ribbons. Nano Lett. 2011, 11, 1331–1336. [Google Scholar] [CrossRef] [PubMed]
  13. Cottone, F.; Vocca, H.; Gammaitoni, L. Nonlinear energy harvesting. Phys. Rev. Lett. 2009, 102, 080601. [Google Scholar] [CrossRef]
  14. Qi, Y.; McAlpine, M.C. Nanotechnology-enabled flexible and biocompatible energy harvesting. Energy Environ. Sci. 2010, 3, 1275–1285. [Google Scholar] [CrossRef]
  15. Platt, S.; Farritor, S.; Garvin, K.; Haider, H. The use of piezoelectric ceramics for electric power generation within orthopedic implants. IEEE/ASME Trans. Mechatron. 2005, 10, 455–461. [Google Scholar] [CrossRef]
  16. Chen, X.; Xu, S.; Yao, N.; Shi, Y. 1.6 V nanogenerator for mechanical energy harvesting using PZT nanofibers. Nano Lett. 2010, 10, 2133–2137. [Google Scholar]
  17. Jeon, Y.; Sood, R.; Jeong, J.-H.; Kim, S.-G. MEMS power generator with transverse mode thin film PZT. Sens. Actuators A Phys. 2005, 122, 16–22. [Google Scholar] [CrossRef]
  18. Erturk, A.; Hoffmann, J.; Inman, D.J. A piezomagnetoelastic structure for broadband vibration energy harvesting. Appl. Phys. Lett. 2009, 94, 254102. [Google Scholar] [CrossRef]
  19. Wu, H.; Zheng, H.; Qin, X.; Jin, Y.; Li, Y.; Yang, S.; Yi, Z.; Gao, S.; Wang, S.; Wang, Z. Drinking-Bird-Enabled Triboelectric Hydrovoltaic Generator. Device 2024, 2, 100318. [Google Scholar] [CrossRef]
  20. Wei, L.; Nakamura, T.; Imai, K. Development and optimization of low-speed and high-efficiency permanent magnet generator for micro hydro-electrical generation system. Renew. Energy 2020, 147, 1653–1662. [Google Scholar] [CrossRef]
  21. Eick, B.; Brown, A.; Wilcoski, J.; Thurmer, C. Localization of flow-induced vibrations from wicket gates in hydropower generating units. J. Civ. Struct. Health Monit. 2023, 13, 811–825. [Google Scholar] [CrossRef]
  22. Yadav, G.; Chauhan, A.K. Design and development of pico micro hydro system by using house hold water supply. Int. J. Res. Eng. Technol. 2014, 3, 114–119. [Google Scholar]
  23. Ridzuan, M.J.M.; Hafis, S.; Azduwin, K.; Firdaus, K.; Zarina, Z. Development of pico-hydro turbine for domestic use. Appl. Mech. Mater. 2015, 695, 408–412. [Google Scholar] [CrossRef]
  24. Zainuddin, H.; Khamis, A.; Yahaya, M.S.; Basar, M.F.M.; Lazi, J.M.; Ibrahim, Z. Investigation on the performance of pico-hydro generation system using consuming water distributed to houses. In Proceedings of the 2009 1st International Conference on the Developements in Renewable Energy Technology (ICDRET), Dhaka, Bangladesh, 17–19 December 2009. [Google Scholar]
  25. Wang, C.X. Application of 3D printing technology in product styling design. Heilongjiang Sci. 2022, 13, 31–33. (In Chinese) [Google Scholar]
  26. Wu, Y.R. 3D Printing in aero engine manufacturing. China Sci. Technol. Inf. 2022, 11, 46–48. (In Chinese) [Google Scholar]
  27. Parwani, R.; Curto, M.; Kao, A.P.; Rowley, P.J.; Pani, M.; Tozzi, G.; Barber, A.H. Morphological and mechanical biomimetic bone structures. ACS Biomater. Sci. Eng. 2017, 3, 2761–2767. [Google Scholar] [CrossRef]
  28. Wong, K.V.; Hernandez, A. A review of additive manufacturing. Int. Sch. Res. Not. 2012, 2012, 208760. [Google Scholar] [CrossRef]
  29. Attaran, M. The rise of 3-D printing: The advantages of additive manufacturing over traditional manufacturing. Bus. Horiz. 2017, 60, 677–688. [Google Scholar] [CrossRef]
  30. Feng, J.; Fu, J.; Lin, Z.; Shang, C.; Li, B. A review of the design methods of complex topology structures for 3D printing. Vis. Comput. Ind. Biomed. Art 2018, 1, 5. [Google Scholar] [CrossRef]
  31. Olsson, A.; Hellsing, M.S.; Rennie, A.R. New possibilities using additive manufacturing with materials that are difficult to process and with complex structures. Phys. Scr. 2017, 92, 053002. [Google Scholar] [CrossRef]
  32. Ngo, T.D.; Kashani, A.; Imbalzano, G.; Nguyen, K.T.Q.; Hui, D. Additive manufacturing (3D printing): A review of materials, methods, applications and challenges. Compos. Part B Eng. 2018, 143, 172–196. [Google Scholar] [CrossRef]
  33. ISO 527-2-2012; Plastics–Determination of Tensile Properties–Part 2: Test Conditions for Moulding and Extrusion Plastics. The State Administration for Market Regulation of the People’s Republic of China, the Standardization Administration of the People’s Republic of China: Shanghai, China, 2013.
  34. ASTM D695-15; Standard Test Method for Compressive Properties of Rigid Plastics. ASTM International: West Conshohocken, PA, USA, 2010.
  35. Liang, Z.; Xie, Y.; Zhang, Y.; Zhao, G.; Lin, Q.; Zhang, D.; Jiang, H.; Yang, K.; Si, K.; Yang, K.; et al. The Effect of the Support Mass in 3D Printing on the Forming Time of the Model. Eng. Solut. Mech. Mar. Struct. Infrastruct. 2024, 1, 7. [Google Scholar] [CrossRef]
  36. Yao, T.; Deng, Z.; Zhang, K.; Li, S. A method to predict the ultimate tensile strength of 3D printing polylactic acid (PLA) materials with different printing orientations. Compos. Part B Eng. 2019, 163, 393–402. [Google Scholar] [CrossRef]
  37. Manes, A.; Porcaro, R.; Ilstad, H.; Levold, E.; Langseth, M.; Børvik, T. The behaviour of an offshore steel pipeline material subjected to bending and stretching. Ships Offshore Struct. 2012, 7, 371–387. [Google Scholar] [CrossRef]
  38. Zhang, D.; Zhang, Y.; Zhao, B.; Ma, Y.; Si, K. Exploring subsea dynamics: A comprehensive review of underwater pipelines and cables. Phys. Fluids 2024, 36, 101304. [Google Scholar] [CrossRef]
  39. Wallin, T.J.; Pikul, J.; Shepherd, R.F. 3D printing of soft robotic systems. Nat. Rev. Mater. 2018, 3, 84–100. [Google Scholar] [CrossRef]
  40. Li, S.; Kim, D.K. Ultimate strength characteristics of unstiffened cylindrical shell in axial compression. Ocean Eng. 2022, 243, 110253. [Google Scholar] [CrossRef]
  41. Zhang, Y.; Zhang, D.; Jiang, H. A review of offshore wind and wave installations in some areas with an eye towards generating economic benefits and offering commercial inspiration. Sustainability 2023, 15, 8429. [Google Scholar] [CrossRef]
  42. Buccino, F.; Martinoia, G.; Vergani, L.M. Torsion—Resistant structures: A nature addressed solution. Materials 2021, 14, 5368. [Google Scholar] [CrossRef] [PubMed]
Figure 1. Five advantages of 3D printing.
Jmse 13 02007 g001
Figure 2. Simplified model of marine engineering structures.
Jmse 13 02007 g002
Figure 3. Experimental specimen size parameters. The dashed line indicates the centerline of the component. Dotted lines indicate the centerline of the component.
Jmse 13 02007 g003
Figure 4. Basic printer parameters.
Jmse 13 02007 g004
Figure 5. Three fill structures and four fill rates. The green arrow indicates an increase in fill rate.
Jmse 13 02007 g005
Figure 6. Tilt angle schematic. The red arrow indicates the transition between the 3D and 2D schematic diagrams, while the blue arrow indicates the positive direction of the Z-axis.
Jmse 13 02007 g006
Figure 7. Tensile specimen curve forms. The green area represents the linear stage, the yellow-brown area represents the yield stage, and the pink area represents the fracture stage. (a) represents an inclination angle of 0°, (b) represents an inclination angle of 15°, and (c) represents an inclination angle of 30°.
Jmse 13 02007 g007
Figure 8. Tensile specimen fracture surface form.
Jmse 13 02007 g008
Figure 9. Variation in maximum load of tensile specimen with printing inclination angle. (a) represents a fill rate of 25%, (b) represents a fill rate of 35%, (c) represents a fill rate of 50%, and (d) represents a fill rate of 75%.
Jmse 13 02007 g009
Figure 10. Variation in maximum load of tensile specimen with filling rate. (a) represents honeycomb filling structure, (b) represents spiral filling structure, and (c) represents linear filling structure.
Jmse 13 02007 g010
Figure 11. Compression specimen and force versus compression curve form. The green area represents the linear stage, the yellow-brown area represents the yield stage, and the pink area represents the fracture stage.
Jmse 13 02007 g011
Figure 12. Variation in the maximum load that can be carried by a compression specimen with print tilt angle. (a) represents a fill rate of 25%, (b) represents a fill rate of 35%, (c) represents a fill rate of 50%, and (d) represents a fill rate of 75%.
Jmse 13 02007 g012
Figure 13. Variation in the maximum load that can be carried by a compression specimen with filling rates. (a) represents the honeycomb filling structure, (b) represents the spiral filling structure, and (c) represents the linear filling structure.
Jmse 13 02007 g013
Figure 14. The maximum torque that can be carried by a torsion specimen as a function of the torsion angle. The green area represents the linear stage, the yellow-brown area represents the yield stage, and the pink area represents the fracture stage. (a) represents an inclination angle of 0°, (b) represents an inclination angle of 15°, and (c) represents an inclination angle of 30°.
Jmse 13 02007 g014
Figure 15. Sectioning of torsion specimens.
Jmse 13 02007 g015
Figure 16. Variation in the maximum torque print with inclination angle that the torsion specimen can carry. (a) represents a fill rate of 25%, (b) represents a fill rate of 35%, (c) represents a fill rate of 50%, and (d) represents a fill rate of 75%.
Jmse 13 02007 g016
Figure 17. Variation in maximum torque that can be carried by a torsion specimen with filling rates. (a) represents the honeycomb filling structure, (b) represents the spiral filling structure, and (c) represents the linear filling structure.
Jmse 13 02007 g017
Table 1. Study variables and load forms.
Research Factors
Filling structureHoneycombSpiralLinear
Filling rate25%35%50%75%
Specimen tilt angle15°30°45°60°75°90°
Experimental loadTensile loadTorsional loadCompressive load
Table 2. The statistical data of the tensile experiments.
Tensile ExperimentsFill Rate
25%35%50%75%
Honeycomb filling structureMaximum load (kN)0.801.021.281.50
15°0.650.850.881.18
30°0.680.870.811.16
45°0.500.690.650.93
60°0.350.580.650.83
75°0.470.530.650.78
90°0.400.640.550.97
Spiral filling structure1.100.831.121.20
15°0.600.690.801.12
30°0.690.30.510.74
45°0.620.520.600.72
60°0.510.460.410.63
75°0.290.440.490.74
90°0.390.320.370.70
Linear filling structure0.840.930.911.18
15°0.560.560.801.05
30°0.510.420.550.86
45°0.380.430.540.97
60°0.420.420.360.79
75°0.400.360.410.86
90°0.290.400.570.84
Table 3. The statistical data of the compression experiment.
Compression ExperimentFill Rate
25%35%50%75%
Honeycomb filling structureMaximum load (kN)3.303.834.774.66
15°1.952.403.174.14
30°2.592.983.064.40
45°2.593.033.284.34
60°2.723.173.394.51
75°2.302.593.254.60
90°3.783.754.224.83
Spiral filling structure3.043.393.913.71
15°1.882.212.623.76
30°2.372.652.433.59
45°2.272.652.523.56
60°2.272.653.113.74
75°1.601.902.593.68
90°2.462.673.674.34
Linear filling structure2.052.873.473.33
15°1.631.822.323.16
30°1.342.262.543.33
45°2.052.352.073.39
60°2.142.262.403.59
75°1.561.792.433.91
90°2.342.733.314.02
Table 4. The statistical data of the torsion experiment.
Torsion ExperimentFill Rate
25%35%50%75%
Honeycomb filling structureMaximum load (kN)2.663.183.704.66
15°2.292.763.343.97
30°2.623.083.514.19
45°2.733.383.303.79
60°2.502.923.214.15
75°2.692.753.003.83
90°2.182.522.963.49
Spiral filling structure2.532.473.183.39
15°1.832.232.942.78
30°2.542.382.682.78
45°2.612.713.543.73
60°2.582.803.123.80
75°2.372.562.753.13
90°2.112.452.533.16
Linear filling structure1.842.343.404.24
15°1.672.272.643.83
30°2.612.473.224.09
45°2.772.813.113.82
60°2.432.332.783.49
75°2.372.232.503.26
90°2.032.082.653.45
Table 5. Summary of different performance characteristics.
Torsional StrengthStress StrengthTensile Strength
Filling methodHoneycomb filling outperforms the other two continuous filling methods.
Filling ratioWhen the filling ratio exceeds 50%, all three properties of the component begin to increase significantly.
Print tilt angleSpecimens printed at 0° can withstand greater torque and do not fail at larger twist angles, whereas specimens with a 15° tilt exhibit poorer torsional performance.Specimens with inclination angles of 0° and 90° exhibit superior compressive strength compared to those with other inclination angles.The tensile properties of specimens with inclination angles of 0° and 15° are significantly greater than those of specimens with other inclination angles.
Disclaimer/Publisher’s Note: The statements, opinions and data contained in all publications are solely those of the individual author(s) and contributor(s) and not of MDPI and/or the editor(s). MDPI and/or the editor(s) disclaim responsibility for any injury to people or property resulting from any ideas, methods, instructions or products referred to in the content.