Article

Reducing Aerodynamic Interference Through Layout Optimization of Symmetrically Cambered Wingsails: A Comparative Study of In-Line and Parallel Configurations

1
Department of Mechanics and Maritime Sciences, Chalmers University of Technology, 412 96 Gothenburg, Sweden
2
Institute of Mechanics, Chinese Academy of Sciences, Beijing 100190, China
3
School of Mechanical Engineering, Southwest Jiaotong University, Chengdu 610031, China
4
Department of Aeronautics and Astronautics, Massachusetts Institute of Technology, Cambridge, MA 02139, USA
5
School of Energy and Power Engineering, Beihang University, Beijing 100191, China
*
Author to whom correspondence should be addressed.
J. Mar. Sci. Eng. 2025, 13(10), 1998; https://doi.org/10.3390/jmse13101998
Submission received: 21 September 2025 / Revised: 12 October 2025 / Accepted: 17 October 2025 / Published: 17 October 2025
(This article belongs to the Special Issue Computational Fluid Dynamics and Acoustic Design Methods for Ship)

Abstract

Rigid wingsails are increasingly adopted for wind-assisted ship propulsion, with Symmetrically Cambered (SC) profiles identified as highly efficient for thrust generation. This study investigates installation layouts for multiple SC wingsails, focusing on aerodynamic interference that limits their performance. A fast 2D potential-flow panel method is employed and benchmarked against wind tunnel and 3D IDDES data. Two representative layouts are analyzed: triple-in-line (TL) and quad-in-parallel (QP). Layout optimization is performed using a genetic algorithm with distances between sails as design variables, constrained by the total installation span, at apparent wind angles (AWAs) of 60 ° , 90 ° , and 120 ° . Results show that thrust generation decreases progressively from upstream to downstream sails due to interference effects, with penalties of about 4–6% in the TL and up to 28% in the QP layout. The optimization improves performance only for the TL layout at 60 ° , while the QP layout shows negligible gains. Analysis of pressure distributions confirms that downstream sails suffer from reduced suction on the leading edge caused by upstream wakes. Overall, the TL layout demonstrates significantly higher aerodynamic reliability than the QP layout. These findings provide new insights into multi-sail configurations and highlight the importance of layout optimization in maximizing thrust efficiency.

1. Introduction

The maritime sector plays a critical role in global trade, but it is also a notable contributor to greenhouse gas (GHG) emissions. In 2018, international shipping accounted for approximately 3% of global GHG emissions [1]. Recognizing this impact, the International Maritime Organization (IMO) has set a target to reduce emissions from the shipping industry by 40% by 2030, relative to 2008 levels [1]. This goal has accelerated efforts to develop low-emission propulsion systems that can improve energy efficiency and reduce dependence on fossil fuels.
Among the emerging solutions, wind-assisted ship propulsion (WASP) technologies have gained increasing attention due to their potential to reduce fuel consumption [2,3]. Unlike many nascent propulsion technologies, WASP is rooted in the long-standing practice of sailing, offering a relatively mature foundation for innovation [4]. Common WASP implementations include Flettner rotors, kite sails, and rigid wingsails, each leveraging different aerodynamic mechanisms to improve overall propulsion efficiency [5,6].
Beyond fuel savings, WASP offers a practical pathway to improve Carbon Intensity Indicator (CII) ratings for both newbuilds and retrofits. Under the IMO framework, ships of 5000 GT and above must calculate and report an annual operational CII and are assigned a rating from A–E recorded on the Data Collection System (DCS) Statement of Compliance [7]. The requirements entered into force on 1 January 2023, with ratings issued for the 2023 operational year and thresholds tightening towards 2030 [8,9,10]. If a vessel is rated E in a single year or D for three consecutive years, it must submit and implement a corrective action plan in its SEEMP Part III to achieve C or better [7,10]. Material fuel and GHG reductions from WASP can translate directly into better CII scores [6,11,12]. This makes WASP a practical compliance means to reduce fuel consumption and improve the operational CII. For existing tonnage, retrofitting WASP can improve the assigned CII rating and help vessels remain in compliant bands for longer, effectively supporting lifetime extension where ratings are the binding constraint [13,14]. In parallel, class societies have released guidance for WASP installation and operation to guide deployment at scale and approval routes [15,16]. Thus, WASP is not only a propulsion assistance technology but also a compliance and asset-life tool.
Among WASP concepts, rigid wingsails have emerged as a particularly promising class of devices, capable of generating lift over a wide range of apparent wind angles [17,18]. Functionally similar to vertical aircraft wings, wingsails operate through controlled angle of attack (AOA), offering greater aerodynamic control than passive devices. Various wingsail sectional geometries have been explored in recent studies, including conventional NACA-series profiles [19], multi-element airfoil systems consisting of deflected flaps [20,21,22], and Symmetrically Cambered (SC) profiles [17]. Unlike the flat geometries with no inherent camber, the SC profiles (also referred to as the crescent-shaped profiles) introduce large camber while preserving geometric symmetry about the chord mid-point. This unique combination enables enhanced lift generation without the directional bias typically associated with asymmetric profiles about the centerline. On the other hand, designing wingsails for large commercial vessels is challenging in terms of aerodynamics and structural responses [23]. A key issue arises from the high Reynolds number ( R e ) under full-scale operating conditions—typically on the order of 10 7 . The R e cannot be accurately replicated in laboratory-scale experiments [24]. This scale discrepancy complicates the prediction of boundary layer behavior, flow separation, and overall aerodynamic performance.
The parameterization of SC profiles was introduced by ScandiNAOS AB [17]. In their method, an SC profile consists of four segments such as the pressure and suction sides, and the trailing and leading round edges, and the segments are formed using circular arcs. Later this method was adopted in the optimization of profile shapes for aerodynamic performance improvement [25,26]. In a recent study, Yao [27] introduced a hybrid parameterization framework for SC profiles, enabling controlled geometric flexibility suitable for performance tuning. Building on this foundation, van Reen et al. [28] applied machine learning-based multi-point optimization to systematically improve aerodynamic performance across varying apparent wind angles (AWA), achieving robust results under diverse operational conditions.
SC wingsails provide high lift across broad apparent-wind ranges and are now well-understood at the single-sail level. However, practical ship applications typically install multiple sails to meet thrust targets and redundancy needs, which introduces wake and pressure–field interactions (i.e., the aerodynamic interference effects) [19]. These effects can erode the unit-level gains and impact overall thrust and system efficiency. At ship scale and high R e , these interactions, together with deck space constraints and coordination of sheeting angles, become primary determinants of delivered thrust and control loads. Consequently, once the SC profile is fixed, the next critical step is layout optimization to select spacing and arrangement that mitigate interference and preserve the aerodynamic advantages of SC designs on large vessels.
Several studies have investigated how layout parameters influence aerodynamic performance. Wind tunnel experiments confirmed that optimal sheeting angles and spacing are critical, especially in turbulent conditions [29]. Computational Fluid Dynamics (CFD) simulations with arc-shaped sails indicated that sail interaction can either enhance or reduce thrust depending on spacing and AOA, with the first two sails having the most effect on the total system performance [30]. Similarly, CFD simulations showed that the aerodynamic interference between two U-shaped sails, of which the sectional profile is the SC type, was found to increase at larger AOAs [31]. RANS-based simulations examined the influence of the spacing and wind angle on layouts of two-element wingsails [32]. The optimal spacing was found to depend on the layout: 1.5 times the chord length in single-row layout, and four chord lengths horizontally with ten chord lengths longitudinally in double-row arrangement. A fast aerodynamic method combining semi-empirical and potential-flow models was also developed to efficiently capture key interference effects such as wake deflection and flow blockage in multi-sail layouts, of which the results were validated against CFD [19]. High-fidelity IDDES simulations also showed that aerodynamic interference in a three-sail system varies with AWA [33].
Beyond parameter studies, several studies have focused on optimizing installation layouts. Adjusting variables such as AOA, flap length, and deflection angle was shown to yield thrust improvements between 10% and 22% in 2D simulations [34]. Two rigid SC wingsails attached to the deck of a ship were optimized for their AOAs by using CFD [35]. The U-shaped sails were evaluated under different spacings using CFD, and an optimization framework based on a genetic algorithm and surrogate modeling was developed to identify the optimal AOA at each of the predefined spacings [36]. A CFD-based optimization with machine learning surrogates was introduced to predict aerodynamic performance of multiple DynaRig soft sails in terms of varying sail numbers, spacings, and wind conditions [37]. Additionally, ship design installed with wingsails was also optimized to balance emission reduction, capital expenditure, and net present value, and a reduction of 12% CO2 emissions was achieved [38].
Optimization methods can be broadly categorized into gradient-based and gradient-free approaches [39]. Gradient-based methods are computationally efficient and converge quickly but are restricted to continuous, differentiable functions and are prone to local minima [39]. In contrast, gradient-free algorithms, such as genetic algorithms (GA) and particle swarm optimization (PSO), are more flexible and robust in global search capabilities. GAs mimic evolutionary processes and are particularly effective in multi-objective optimization tasks [39,40], although they often suffer from slow convergence [41]. PSO, inspired by collective swarming behavior, offers a computationally lightweight alternative with good convergence characteristics, particularly when implemented with modest memory requirements [39,42,43]. Both methods have demonstrated success in optimizing complex layouts, such as wind farms and aerodynamic assemblies [44,45].
Despite recent progress, the system-level aerodynamic performance of multiple cambered wingsails arranged in different layouts remains insufficiently understood. This study addresses that gap by evaluating the performance of SC wingsails in two practical configurations: a triple-in-line (TL) layout and a quad-in-parallel (QP) layout. Although both layouts have been implemented on real vessels, their aerodynamic characteristics have not been directly compared. Using a potential-flow-based method, the current study analyzes how inter-sail spacing and relative positioning influence thrust generation, wake interactions, and overall system efficiency. The findings offer new insights into the aerodynamic behavior of multi-sail systems and provide practical guidance for the integration of wingsails in large commercial vessels.

2. Methods

2.1. Parameterization of Installation Layouts

The SC foil is generated using Bézier curves [27]. The camber height and maximum thickness of this foil, which are located at mid-chord, are specified to follow another SC foil (termed the crescent foil) from a previous study [46].
The present SC foil is illustrated in Figure 1, where the coordinates are normalized based on the chord length of the foil. The control points of the Bézier segments are displayed for half of the geometry for brevity. The locations of the control points have been optimized beforehand to achieve large thrust generation. The present geometry consists of 18 Bézier curves, whereas the previous one has four circular arc segments. Hereafter, the length scales are normalized with the foil chord length.
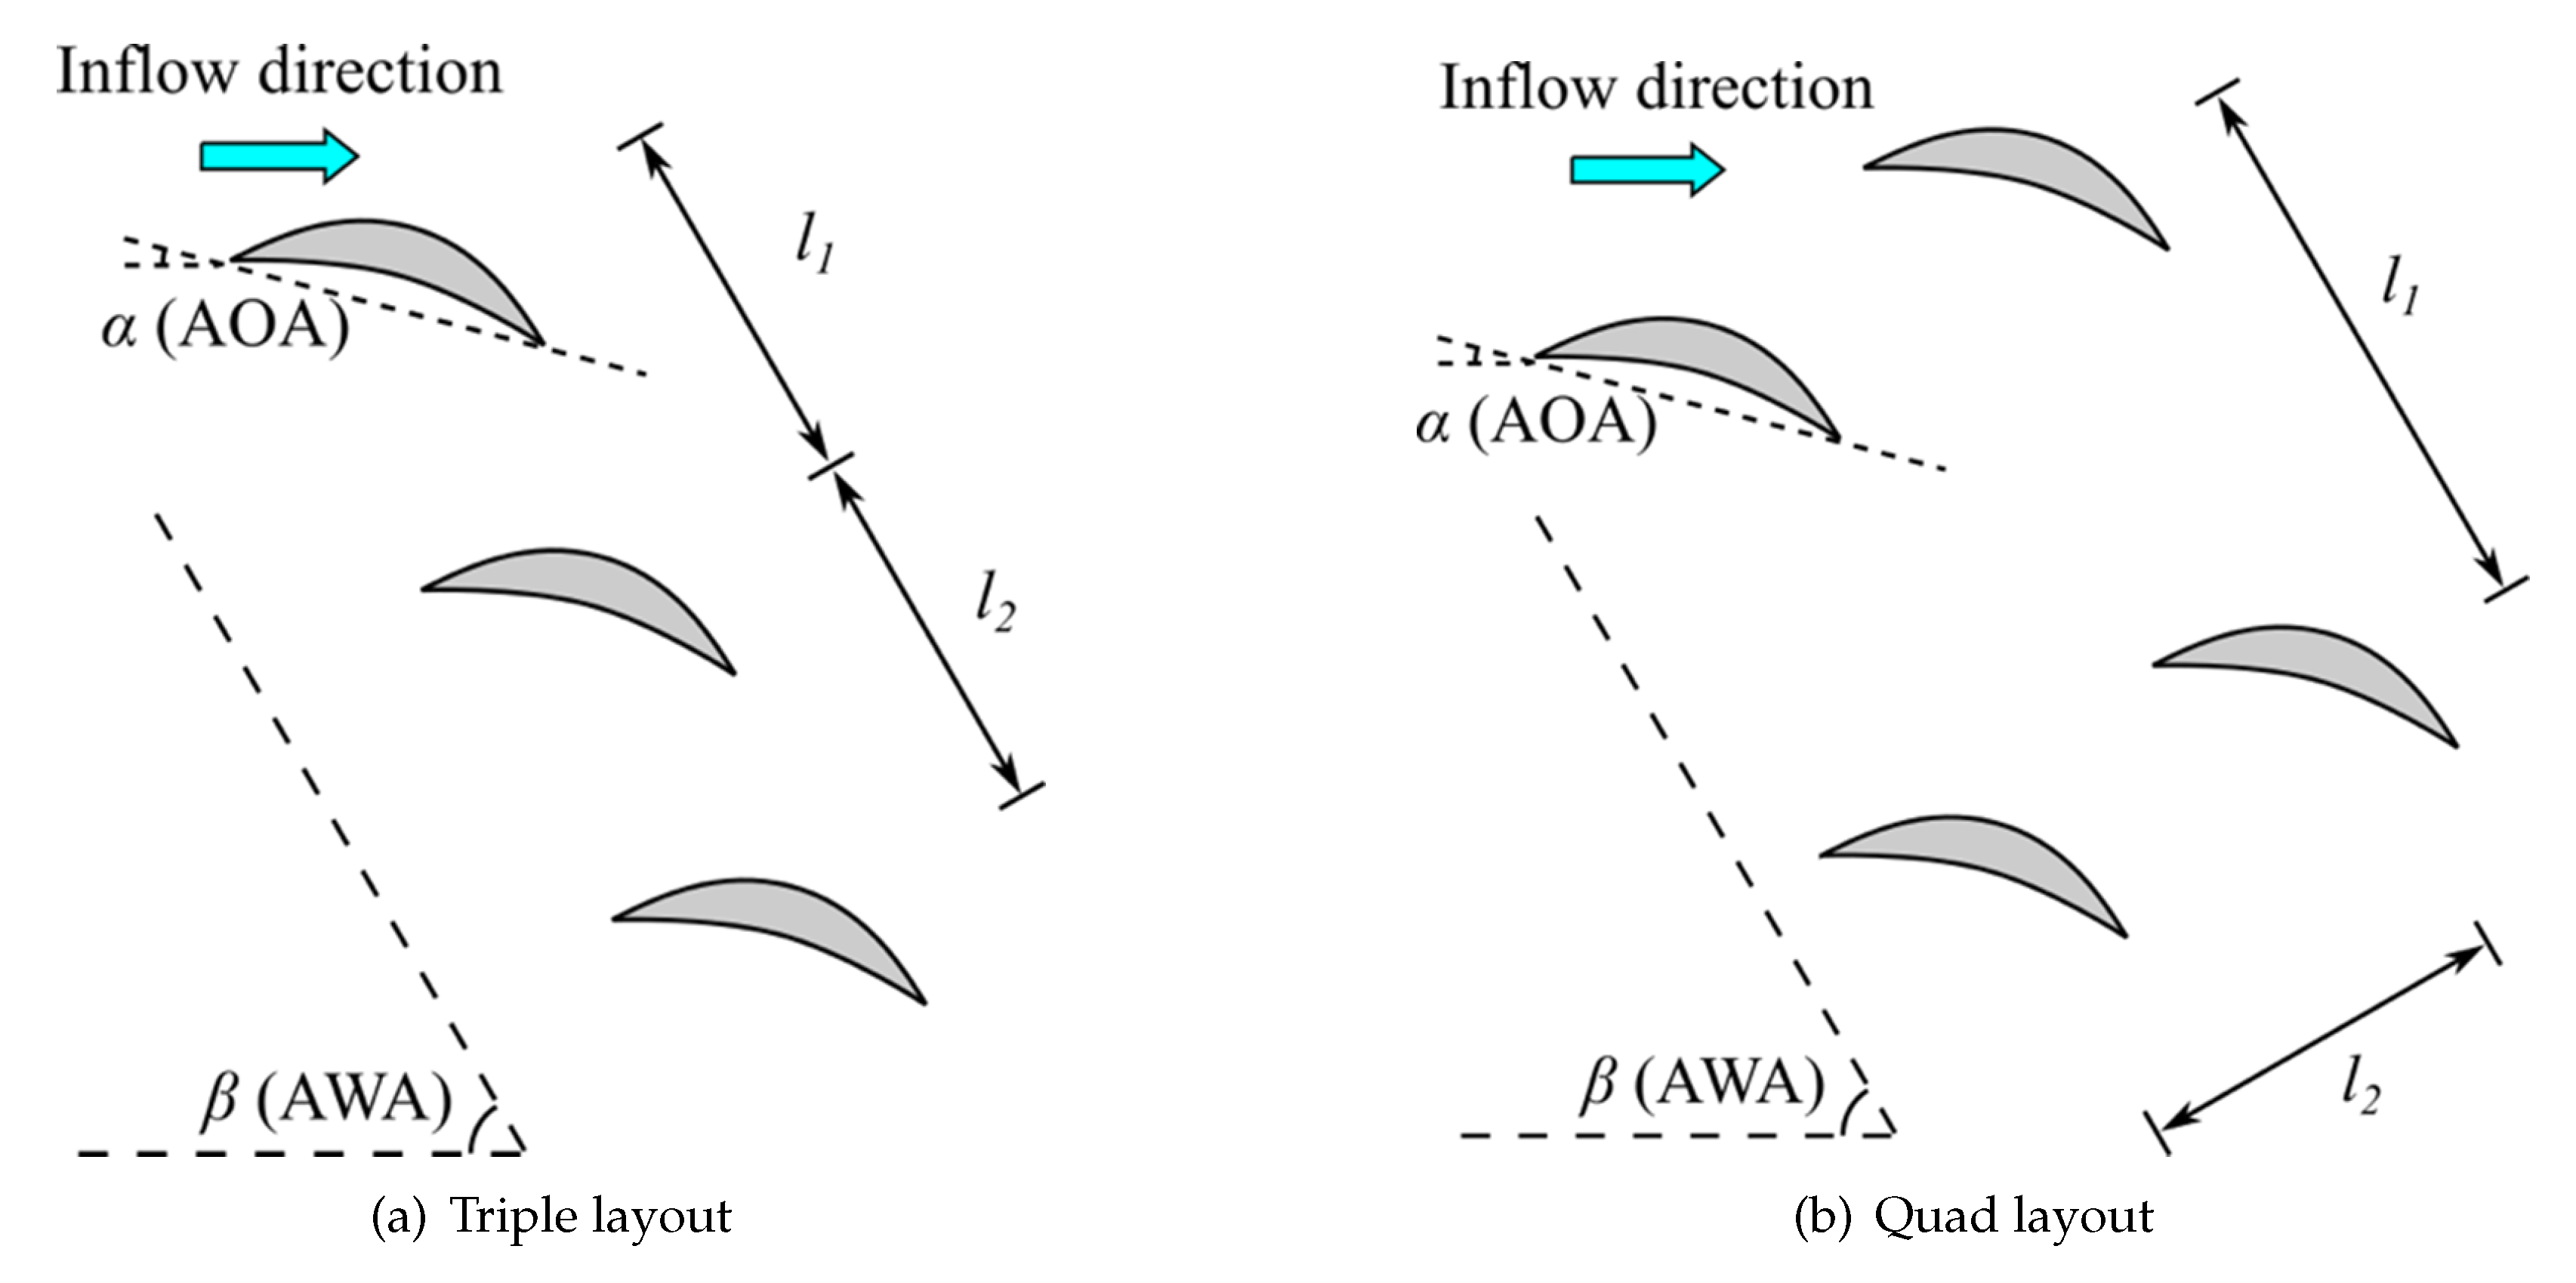
The installation layouts investigated in this study are illustrated in Figure 2. The first layout is to assemble triple sail units in line (TL), and the other one is for quad units in parallel (QP). The AOA of each sail unit, α , is defined with respect to the direction of the inflow wind. The angle between the inflow direction and the ship direction is the AWA denoted as β . The distances between the sail units, l 1 and l 2 , are defined in different ways for the two layouts. They are expected to be optimized to increase the thrust generation from the whole multiple sail system.
As the AOA and AWA are dependent on ship cruise and wind conditions, it is convenient to evaluate the aerodynamic performance at specific angles, which should be of most interest in practical operations. A matrix of these angles of high interest is defined in Table 1.

2.2. Computational Method

Aerodynamic analysis was performed with an inviscid 2D vortex-panel method, which is available as part of the open-source AeroSandbox library [47]. Each foil’s geometry is discretized into a number of panels, each of which contains an associated degree of freedom (the vortex strength) and an equation (the no-penetration condition). In addition to this, a Kutta-condition constraint is added at the trailing edge of each foil. This adds one additional equation, which means that an additional degree of freedom is needed to maintain a well-posed system. This last degree of freedom is a source strength that is distributed across all panels. Notably, this formulation allows proper analysis of airfoils with finite trailing-edge thickness.
The system as described forms a dense linear system, which is efficiently solved to recover the unknowns, allowing flow field reconstruction. Multiple independent lifting elements can be readily accommodated in this formulation, with their interactions well-handled.
Notably, the aerodynamic modeling approach as described is a purely inviscid method. The main advantage of this compared to RANS CFD methods is speed. The present method solves in well under one second, which greatly facilitates optimization and allows rapid extraction of design intuition. However, viscous effects, such as wake interactions, flow separation, and boundary layer displacement thickness are not captured in this framework. Future work could include the coupling of a viscous integral boundary layer model to this framework, similarly to XFoil [48], which would recover these effects while retaining speed.
The drag coefficient cannot be predicted based on the present inviscid method. In addition to the fact that a potential flow method does not yield profile drag data (i.e., d’Alembert’s paradox), the induced drag calculation with the given standard formula is not applicable, as the lifting surfaces are non-planar. For example, C D , ind = C L 2 / ( π A R e ) , where A R denotes the aspect ratio of the wingsail, and e is the Oswald efficiency factor that is typically 0.7 0.9 for efficient wings. This formula is only true for a single planar wing. However, multiple sails have interaction effects, which change the overall induced drag. The formula for a single wing is therefore not valid in the case of multiple sails.
The present inviscid method is compared against previous test data for NACA 0015 from a wind tunnel (WT) [49] and IDDES simulation data for an SC foil, termed D2R10, at the Reynolds number of 6.78 × 10 6 [46]. The lift and drag coefficients ( C L and C D ) of the foils using the different methods are listed in Table 2. The profile drag was measured in the WT tests. But in addition to the profile drag, the induced drag caused by tip vortices was also considered in the IDDES simulations. The coefficients at the AOAs of 5 ° , 10 ° , and 15 ° are compared. The present inviscid method is not used to compute the case at 20 ° since it is not able to predict flows near the stall condition. The results of C L calculated with the present method are comparable to the WT tests. The predicted trend with respect to the AOA is similar, although deviations are observed because of the viscous effects. In addition to the viscous effects, since the IDDES simulations include tip vortices and 3D spanwise coherent vortices, the computed lift coefficients are much smaller than the inviscid method. Nevertheless, the incremental changes in the coefficients with respect to the AOA increments are similar between the inviscid method and the IDDES. This indicates that it is still viable to apply the inviscid method to estimate overall aerodynamic trends related to design changes.
We acknowledge the limitations of applying a 2D inviscid method for design changes on a problem that is inherently viscous and 3D. Therefore, the present method is proposed to (a) serve as a stand-in analysis tool until the optimization workflow on this problem is ironed out, and (b) identify general design trends on lift and AWA only with respect to relative foil placement, acknowledging that this method provides no useful drag information.
Through the present inviscid method, the present SC foil is compared with the NACA 0015 and D2R10. It is seen in Table 2 that the present SC foil exhibits larger lift than the other foils. Figure 3 shows the pressure coefficient C p , which is defined based on the freestream velocity. The present SC foil exhibits the most negative C p on the suction side over x / c 0.3 0.7 . This explains why the present SC foil has the largest lift coefficient.

2.3. Optimization Method

A hybrid method combining the genetic algorithm (GA) and Kriging is used for the optimization [50]. The proposed approach has been successfully applied to a variety of engineering problems. The GA optimization can explore an extensive design space. It efficiently identifies promising regions and finds optimal solutions by simulating natural selection and genetic recombination. The Kriging method can establish a surrogate model to approximate the objective function, providing fast and accurate predictions while reducing computational costs. In the evolutionary optimization process, the surrogate model is updated based on new samples that are searched by GA. The optimization of the installation layouts is designed with a single objective to achieve the maximum total thrust coefficient at the AWAs listed in Table 1.
The total thrust coefficient of a sail system is defined as follows:
C T , sum = i = 1 N C T , i = i = 1 N C L , i sin β C D , i cos β ,
where C T , C L , and C D are the coefficients of the thrust, lift, and drag forces. The subscript “i” denotes the i-th sail unit in the multiple sail system, and the subscript “sum” the sum of all sail units. The number of sail units of the triple-in-line layout is N = 3 , and that of the quad-in-parallel layout is N = 4 . These force coefficients are normalized with 0.5 ρ V 2 l c , where ρ is the freestream density, V the freestream velocity, and l c the chord length of the foil. The average force coefficients are as follows:
C T , avg = 1 N C T , sum , C L , avg = 1 N C L , sum , C D , avg = 1 N C D , sum .
The 2D inviscid solver returns pressure-based lift, while viscous drag and 3D vortical losses are not resolved. For layout screening, we therefore define a thrust proxy as
C T , proxy = i = 1 N C L , i sin β .
This proxy omits C D and overpredicts absolute thrust but preserves relative differences due to inter-sail interference. A sensitivity bound with a generic polar C D = C D 0 + k C L 2 is provided in the Discussion (see Section 4) to quantify the impact of viscous drag on the comparative trends. The coefficients are set within typical ranges of airfoils such as C D 0 [ 0.01 , 0.02 ] and k [ 0.01 , 0.02 ] .
Throughout this paper, we report C T , proxy from the inviscid model considering the lift only. It should be interpreted as a screening metric for layout effects rather than an absolute thrust prediction.

3. Results

3.1. Triple-in-Line Layout

The TL layout is optimized given the premise that the total distance from the first to last sails (i.e., the space occupied by the sails in practice) is kept constant. A brief sensitivity check without the total distance constraint confirmed that thrust increases monotonically as both l 1 and l 2 increase. However, in practical implementations, the total layout length is limited by deck length, structural design, and weight distribution. Therefore, the optimization was carried out under the assumption of a fixed total spacing. In this study, the total distance is 2.4 in chord lengths. The operating conditions are at the AWAs of 60 ° , 90 ° , and 120 ° .
The ratio of the total thrust coefficient to three individual sails, C T , sum / ( C T , ref N ) , is defined to evaluate the optimal distances. Here N is the number of sails, which is 3 in the TL layout. The results for this layout are listed in Table 3. The optimization gives that the distance between the first and the second sails ( l 1 ) is 1.151 , and that between the second and third sails ( l 2 ) is 1.249 . The optimization leads to a significant improvement in the thrust ratio at β = 60 ° , but no changes at 90 ° , 120 ° . As sails operate over a wide range of AWAs, aerodynamic robustness is assessed based on the variation of C T , sum / ( C T , ref N ) across AWAs. And the optimal layout shows more consistent values, which indicates better robustness. Moreover, the layouts cannot reach the same thrust generation of three times an individual sail. The reason is the aerodynamic interference of the flows between the sails. The penalties of the thrust generation are approximately 4– 6 % .
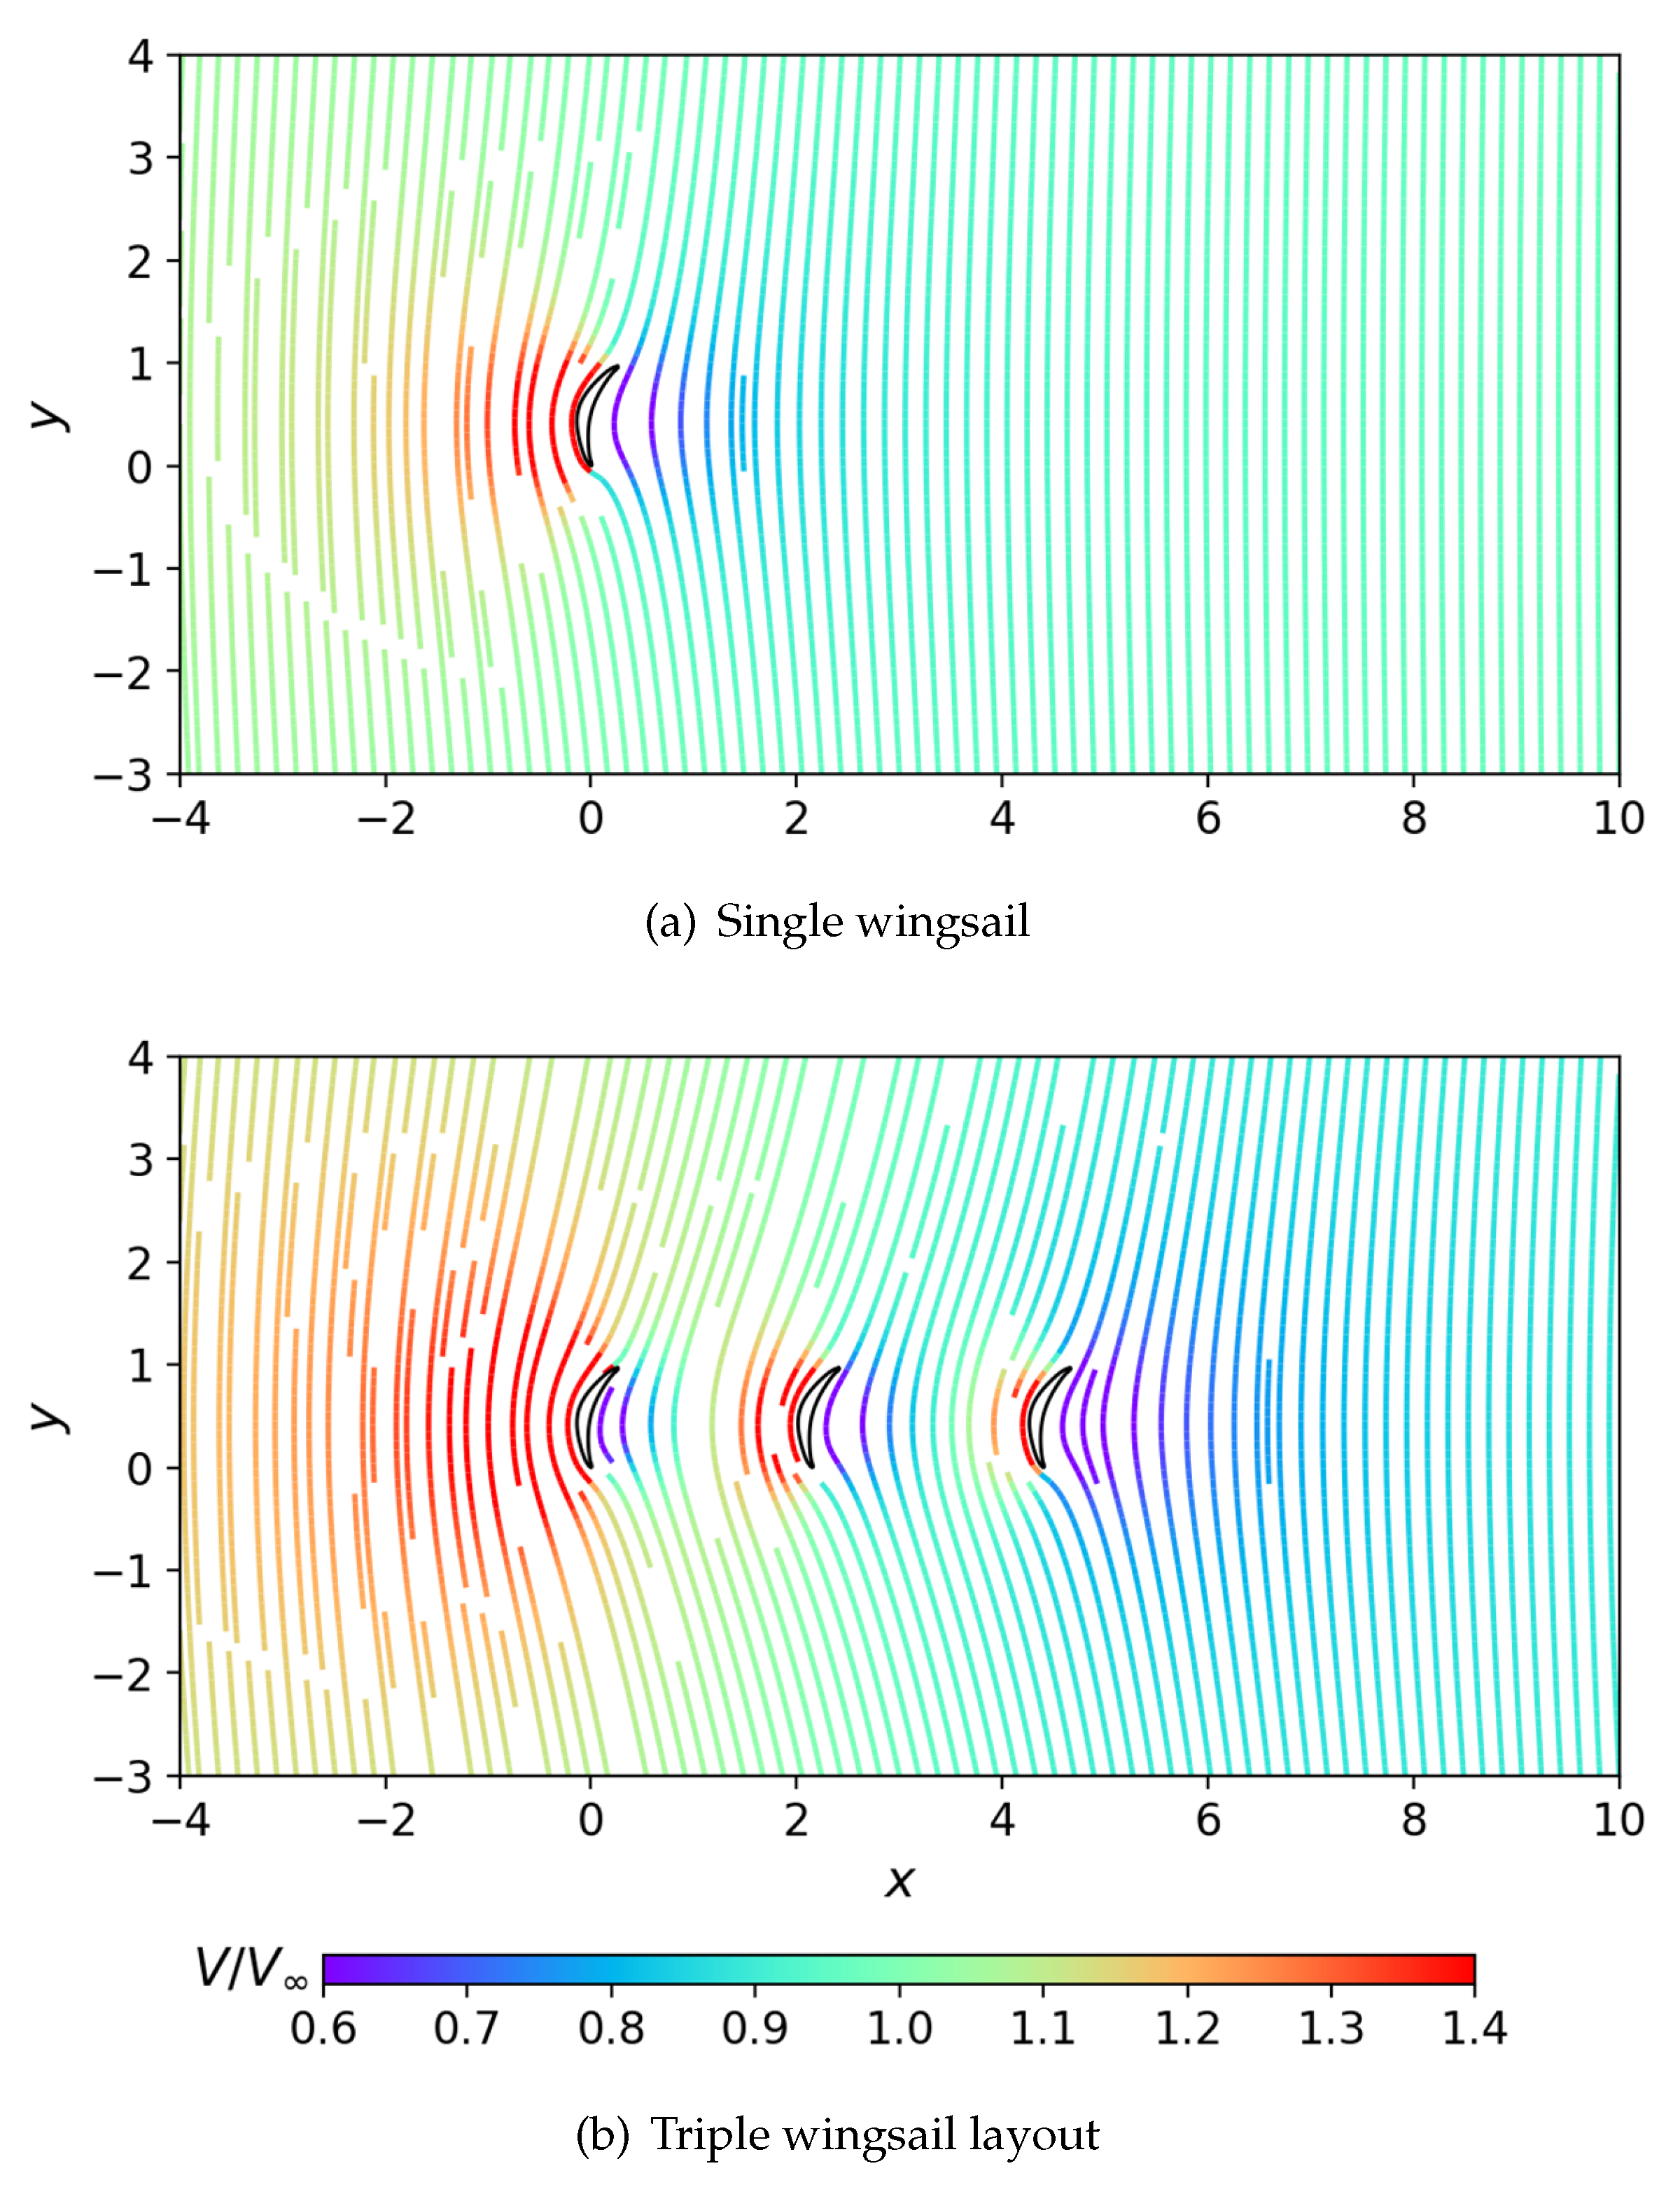
The streamlines and normalized velocity magnitudes, V / V , for the individual sail and TL layout at the AWA of β = 90 ° are shown in Figure 4. Here V is the freestream flow speed. By comparing the two cases, it is seen that the flow velocity on the suction side of the first sail (Sail 1) is significantly increased. Also, the velocity between the sails is overall larger than that on the pressure side of the individual sail, because of the flow acceleration on the suction sides of the middle and last sails (Sails 2 and 3). The differences in the velocity and streamlines between the two cases indicate that the aerodynamic interference exists in the TL layout.
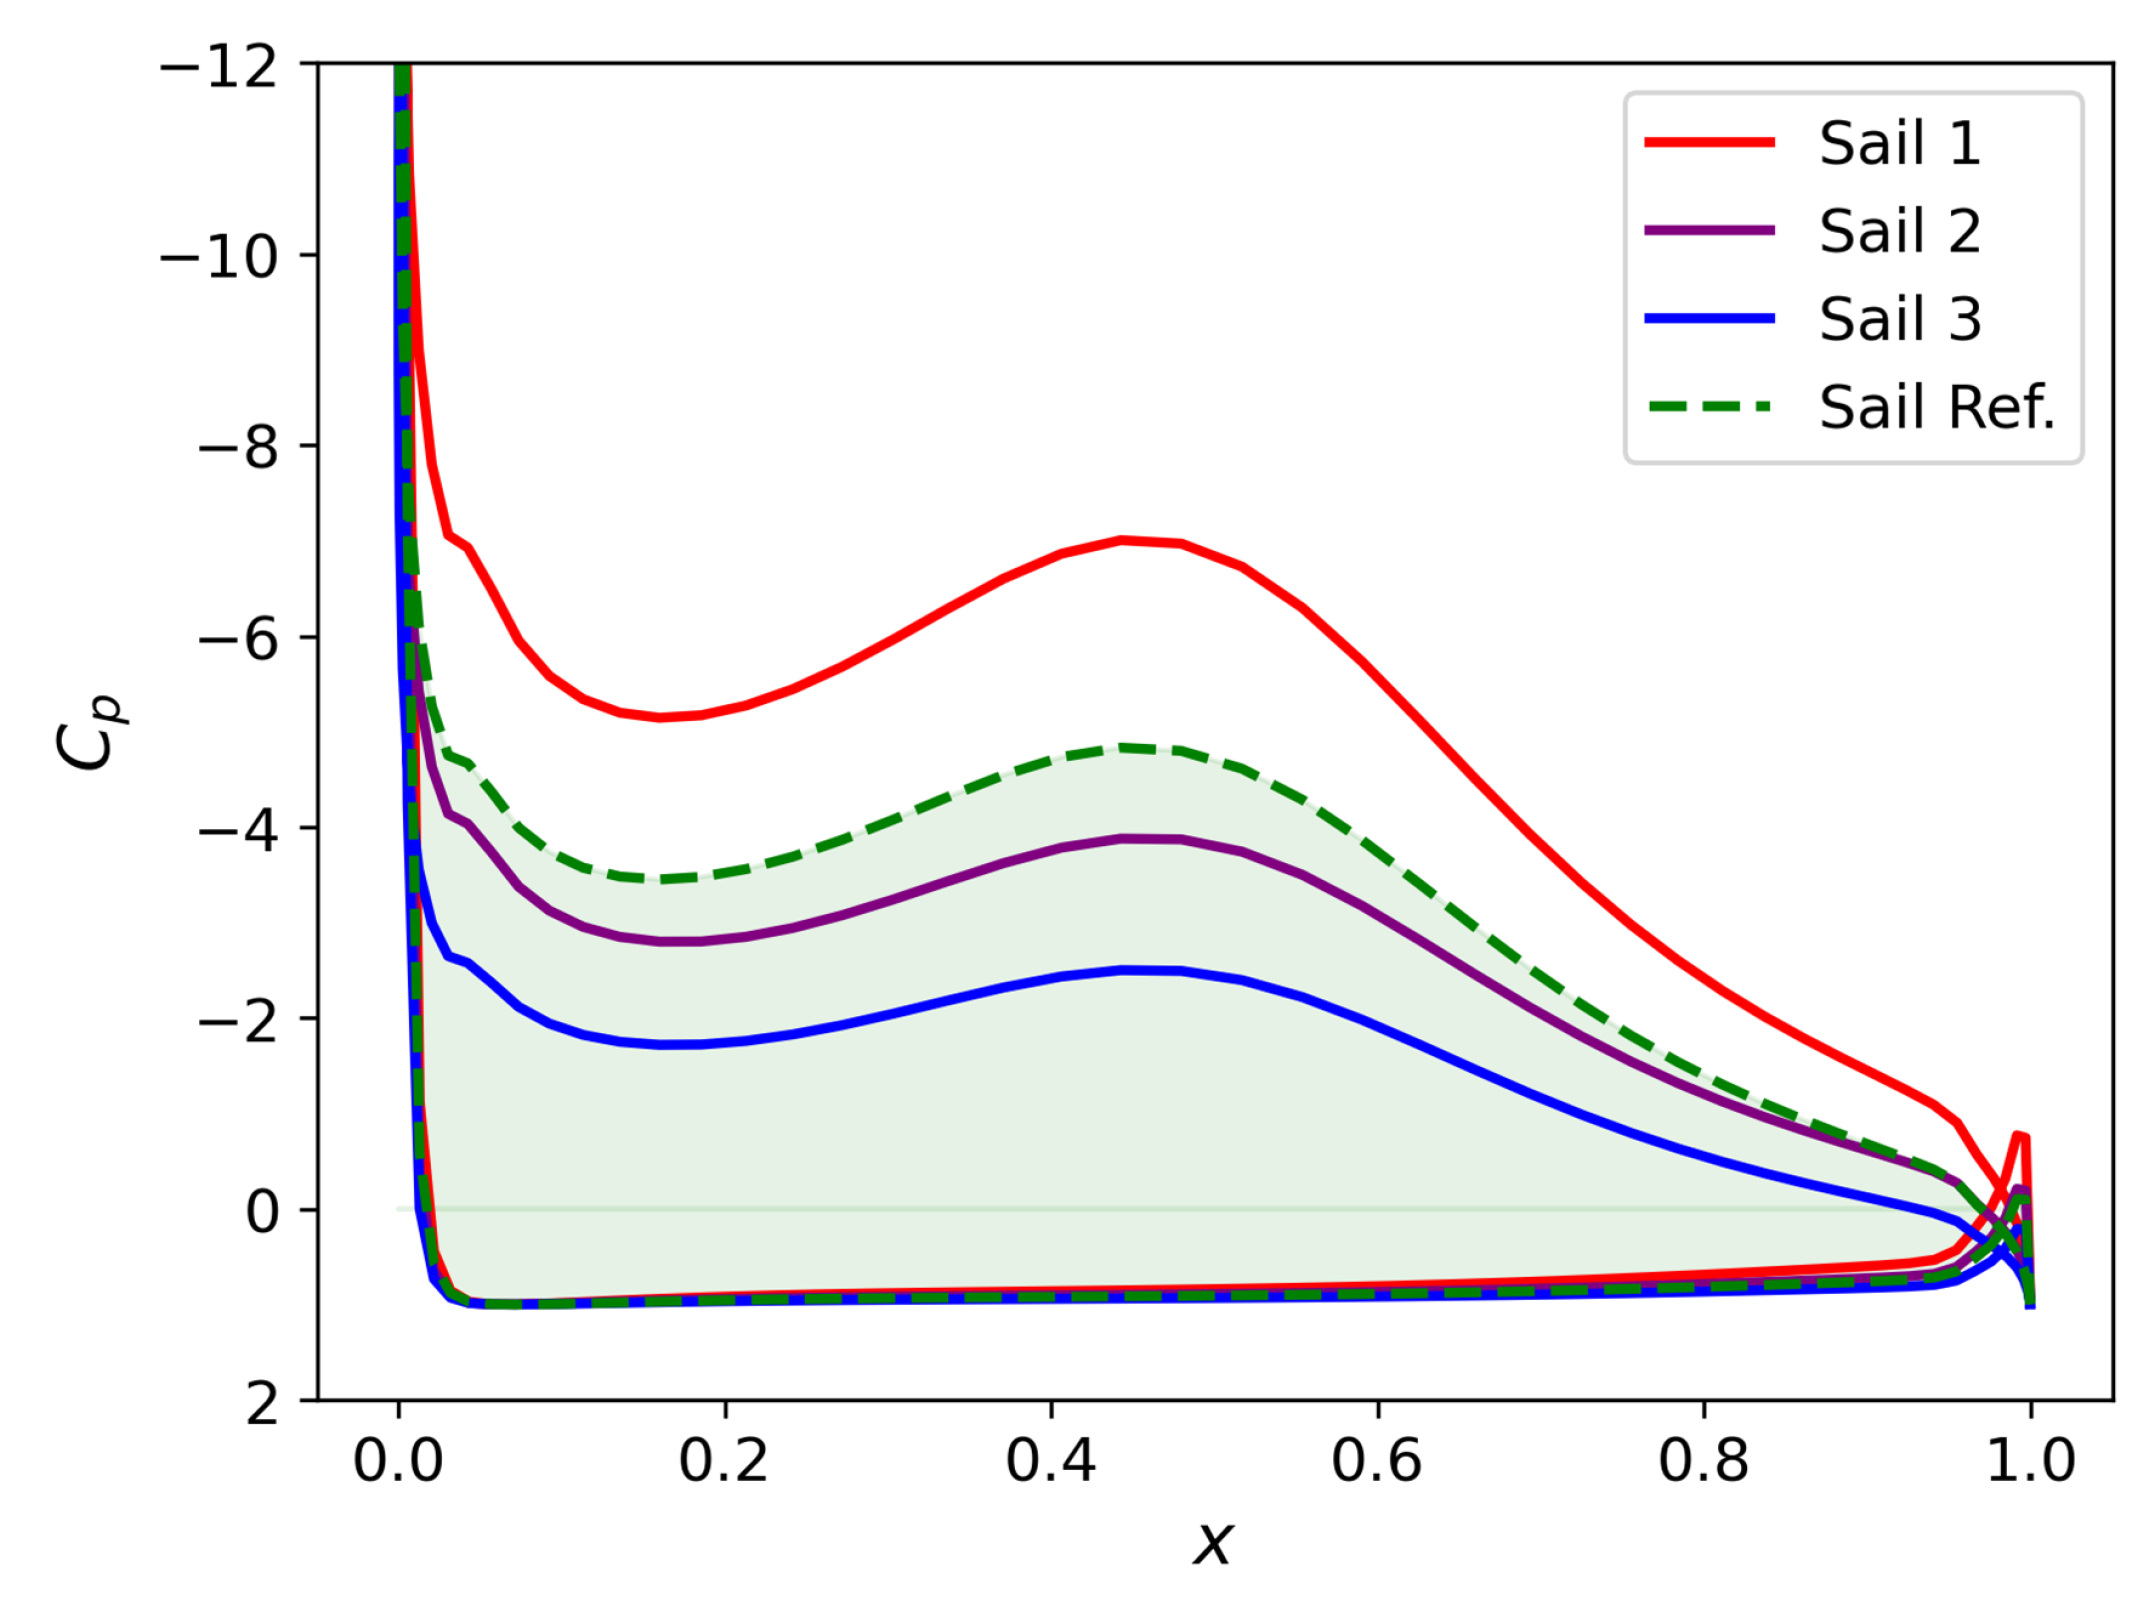
Figure 5 presents the pressure coefficient distributions of the sails in the TL layout compared with the reference individual sail at α = 15 ° and β = 90 ° . The suction side of Sail 1 shows a significant increase in negative pressure relative to the reference sail, particularly in the chordwise region x = 0.3 0.7 . This increase is the primary contributor to the higher thrust of Sail 1. In contrast, Sail 2 and Sail 3 exhibit reduced negative pressures on the suction sides, with the reduction becoming more pronounced toward the downstream sail. This tendency indicates that aerodynamic interference between the sails weakens their ability to generate thrust. Nevertheless, the incremental changes between the sails demonstrate that the aerodynamic penalty is progressive from the first to the last sail. Overall, the comparison with the reference sail suggests that the TL layout enhances the performance of the first sail but penalizes the downstream sails, leading to an overall thrust generation lower than the sum of three isolated sails.

3.2. Quad-in-Parallel Layout

The QP layout is optimized using the same strategy as the TL layout. A constraint is that the total distance of l 1 and l 2 is constant. Here, l 1 is in the direction along the ship body, and l 2 is normal to the direction. It is worth noting that, according to our preliminary investigation, without the total distance constraint, the thrust generation is always improved when increasing both l 1 and l 2 . In practical installation, it does mot seem reasonable to set up the constraint, as the spaces in the two directions are independent. Nevertheless, the total distance in the optimization is constrained to 2.4 in chord lengths, to represent a compact retrofit-feasible envelope in which longitudinal and transverse placements are jointly limited by deck integration (e.g., available zones, structural hard points), maintenance and handling clearances, and weight and stability considerations. This choice enables a comparison of TL and QP under the same practical constraint.
The thrust ratios, C T , sum / ( C T , ref N ) , of the initial and optimal layouts are listed in Table 4, where N = 4 and the operational AWAs are 60 ° , 90 ° , and 120 ° . The initial layout is set with both l 1 and l 2 equal to 1.2 . The optimized values of the two distances are 1.132 and 1.268 . However, it is noticeable that the improvement introduced by the distance optimization is very limited. The thrust generation from the optimal layout at 60 ° and 90 ° is not changed, and an increase of only 2 % is observed at 120 ° . As compared with the thrusts summed from four individual sails, the total thrusts of the QP layout are significantly reduced. The largest reduction is noticed at 60 ° , which is about 28 % . And the reduced percentages at 90 ° and 120 ° are also significant, that is, around 17 % and 10 % , respectively.
Figure 6 shows the streamlines and velocity magnitudes for the QP layout at the AWA of β = 90 ° . High velocity regions are seen on the suction sides of Sails 1 and 3. Flow velocities between Sails 1 and 2 and between Sails 3 and 4 are overall larger than the pressure sides of Sails 2 and 4. The mixed flow near the sails is apparently different from that around the individual sail (see Figure 4). It suggests that the aerodynamic interference effects are significant.
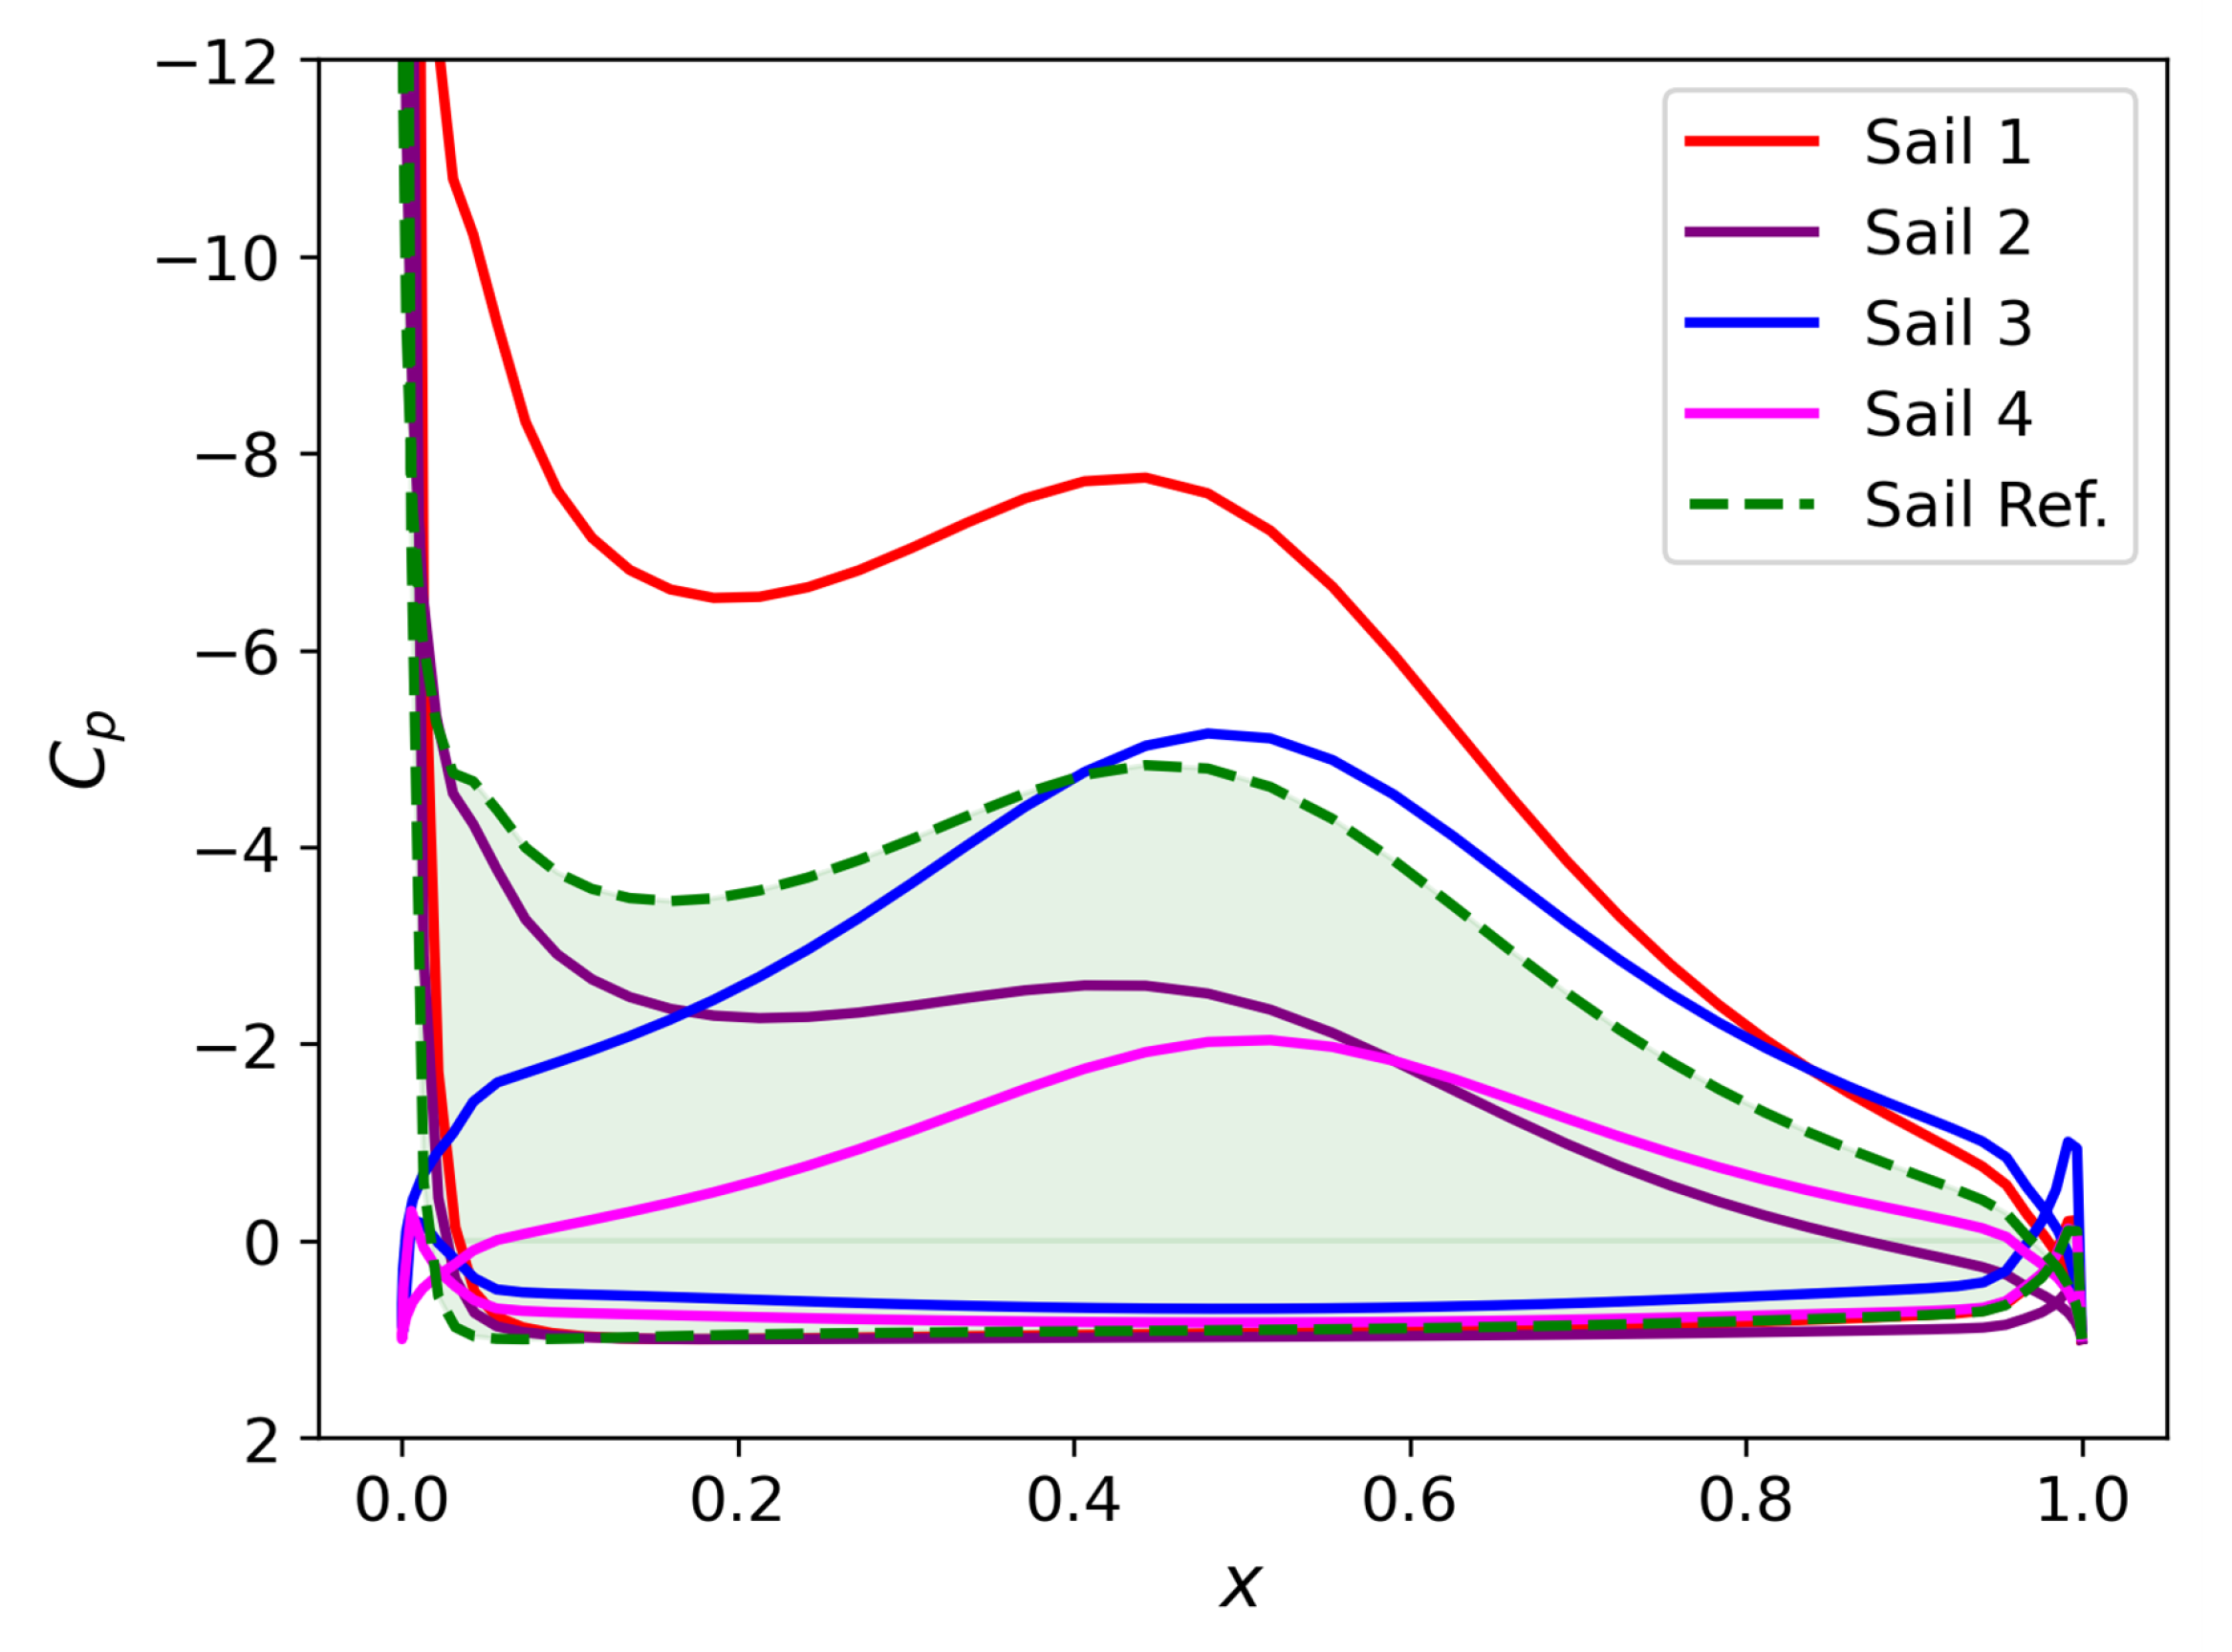
The pressure coefficients distributed on the foil surfaces of the optimized QP layout at β = 90 ° are displayed in Figure 7. The serial numbers of the sails have been indicated in Figure 6. The negative pressure on the suction side of Sail 1 is noticeably enhanced in comparison to that of the individual sail. Sail 3 also presents an increase in the negative pressure from x = 0.5 to 1.0 on the suction side, whereas the negative pressure from x = 0.0 to 0.5 on the suction side and the positive pressure on the pressure side are reduced. The reduction near the leading edge of Sail 3 is caused by the wake from Sail 1. Thus, the sum of the surface pressure of Sail 3 leads to a thrust smaller than that produced by the reference individual sail. Regarding Sail 2, the pressure on the pressure side is affected negligibly, but the pressure on the suction side is decreased. This effect and the pressure distribution pattern are similar to Sail 2 of the TL layout (see Figure 5). Sail 4 generates significantly less pressure than the other sails. And a reduction in the negative pressure in the front-half part of the suction side is also obvious. This effect is similar to Sail 3 in the same row along the ship body direction, due to the interference of the wake from Sail 2.

4. Discussion

To gauge the influence of viscous drag on the inviscid results, a generic polar C D = C D 0 + k C L 2 (typical bounds C D 0 [ 0.01 , 0.02 ] , k [ 0.01 , 0.02 ] ) is applied in addition to the reported C L . The corrected thrust C ˜ T = i N C L , i sin β C D , i cos β shows reduced magnitudes as expected, but the ranking between the layouts and spacing trends remain unchanged within these plausible ranges. Therefore, the inviscid C T , proxy is used for comparative layout screening, and we explicitly acknowledge that accurate absolute thrust requires viscous 3D modeling.
Across our cases, the limits behave in a consistent textbook way. As spacing grows, upstream wakes and pressure disturbances decay; and both TL and QP recover toward the single-sail baseline. As spacing tightens, shielding and flow deflection move the stagnation point forward on the downstream sail and weaken leading-edge suction, leading to reduced lift and thrust. This pattern of recovery at large separations and loss at small separations is a common aerodynamic behavior for lifting surfaces in proximity, and explains the monotonic improvement with increasing spacing observed in our results.
To ensure that isolated airfoil performance does not confound the aerodynamic interference assessment, it is interesting to examine where the new SC profile generates its additional lift and how the multi-sail layouts modify the surface pressures. As shown in Figure 3, the lift gain of the optimized SC section arises mainly from the mid-chord region for x 0.3 0.7 . In the TL layout (Figure 5), the suction-side pressure is reduced broadly, whereas in the QP layout (Figure 7), the pressure field is altered primarily near the leading edge for x 0.3 . Thus, the functional region responsible for the higher standalone lift ( x 0.3 0.7 ) is not the portion most affected by the interference in our cases, supporting the use of the optimized SC profile for layout comparisons. In practice, however, profile optimization should still be justified against potential amplification of interference to avoid unintended performance loss at the system level.
The new SC profile is considered for the layout optimization in this study. Regarding the total thrust generation at the AWAs of β = 60 ° , 90 ° , and 120 ° , the TL layout introduces less aerodynamic interference than the QP layout, which is identified by comparing the thrust coefficients in Table 3 and Table 4. Moreover, the optimization of the distances l 1 and l 2 is only effective for the TL layout at β = 60 ° . It is not able to introduce any obvious improvement to the TL layout at the larger AWAs and the QP layout at all three AWAs.
It is interesting to address where the thrust enhancement and penalty for the two layouts come from. Based on the pressure coefficient distributions in Figure 5 and Figure 7, the force generation can be derived from the pressure differences between the suction and pressure sides of a sail. We define the thrust penalty coefficient to quantify the thrust variation for each sail as
η T , i = ( C T , i C T , r e f ) / C T , r e f .
The thrust penalty coefficients of the sails are summarized in Table 5. Sail 3 in the TL layout is the primary cause of the thrust reduction in this layout. Sail 4 in the QP layout suffers the largest penalty of about 52.5 % of the isolated sail thrust.
Sails 1 and 2 in the TL layout are positioned in consistency with Sails 1 and 2 in the QP layout. Both of the second sails show similar patterns of the surface pressure distribution (see Figure 5 and Figure 7). But the second sail in the QP layout is subjected to larger penalties. This effect is dependent on the sail distance l 1 between Sails 1 and 2, while l 2 should play an important role. Therefore, the aerodynamic interference is dependent on both l 1 and l 2 .
The results at AoA = 15 ° are obtained in the attached-flow regime for the SC profile and, accordingly, reflect interference behavior without stall. Therefore, at lower AoA where the flow is also attached, the same qualitative trends analyzed above are expected. The chosen AWAs ( 60 ° , 90 ° , and 120 ° ) bracket the representative interaction modes: oblique-inflow wake deflection, beamwise pressure–field coupling, and leeward shielding. This range covers most operation points. Cases approaching stall or involving strong 3D effects may adjust magnitudes and precise spacings, which can be addressed through higher-fidelity simulations in future work.
While the QP layout allows for variable inter-sail spacings ( l 1 , l 2 ), the results indicate that aerodynamic performance is consistently penalized compared to the TL layout, with thrust reductions reaching up to 28%. A brief sensitivity analysis was performed without enforcing the total distance constraint, revealing that increasing l 1 + l 2 always leads to improved thrust. However, such unconstrained layouts are not realistic for practical deck installations, which are usually limited by available space, structural balance, and system integration requirements. As a result, the optimization was carried out under a fixed total layout length. Within this constraint, the optimal configuration simply maximizes spacing within the allowed range. This suggests that spacing optimization alone offers limited mitigation of the wake interference inherent in the QP layout. From an aerodynamic standpoint, the QP configuration should be avoided unless required by other design or operational constraints.
The present 2D inviscid analysis does not capture wingtip and spanwise vortices, which are known to modify effective AOA, induce additional downwash/upwash, and redistribute loading along the span. In multi-sail layouts, these 3D features can nonlinearly alter interference. Tip-vortex downwash may further reduce downstream effective AOA and thrust in closely spaced parallel rows such as the QP layout, while wake skew and spanwise flow can shift the regions of shielding/acceleration with AWA. At extreme AWAs, vortex pairing and cross-flow around mast gaps can strengthen pressure–field coupling, potentially amplifying penalties observed here. Consequently, 3D modeling (e.g., lifting-line/vortex-lattice with free-wake, or RANS/IDDES) may adjust the magnitude and the spacing at which optima occur, even if the qualitative ranking that TL outperforms QP under tight spacing is expected to remain.
Although TL shows higher thrust consistency in our analysis, the final layout choice also depends on ship-integration factors, for example, deck space and cargo operations, structure integration, and stability and weight distribution, as well as control and redundancy. In practice, these factors are weighed alongside the aerodynamic results reported here. When longitudinal space allows, TL provides higher and more uniform thrust. When a compact installation is mandatory, QP may be chosen for integration benefits but should allocate the maximum feasible spacing and adopt control strategies to limit side-by-side interference.
The large spacings of the order of 4–10 chord lengths identified for two-element wingsails in the prior study [32] lie outside the compact envelope considered here. Within the current total spacing of 2.4 chord lengths, interference is unavoidably strong. As the envelope is relaxed, both layouts converge toward the single-sail baseline, and penalties diminish. Nevertheless, the relative ordering (TL > QP) and the guidance to maximize spacing for QP do not change. Our conclusions therefore target space-limited installations typical of retrofits. If deck length allows, designers should allocate larger spacings accordingly.

5. Conclusions

In this paper, layouts for installing rigid wingsails with Symmetrically Cambered (SC) sectional profiles are investigated. SC profiles have been considered one of the profiles with high potential for wind-powered ship propulsion, given that it is efficient in producing high thrust in a wide range of AOAs. Two typical installation layouts such as triple-in-line (TL) and quad-in-parallel (QP) are analyzed, which have been put forward but not compared in terms of the aerodynamic performance.
Given that the inviscid thrust ( C T , proxy ) used here is a lift-only screening metric and that the absolute thrust also requires viscous/3D corrections, a simple drag sensitivity is applied using a modeled drag correction in the post-processing. The drag lowers absolute thrust levels but does not change the relative ordering of layouts or the spacing trends, indicating that the comparative conclusions are robust to reasonable drag penalties.
The TL layout consists of three sails, and the optimization constraint is specified as a constant total distance, which is the sum of the distances between the neighboring sails. The constant is 2.4 times the chord length. It is found that the total thrust generation is reduced because of the aerodynamic interference amongst the sails. In comparison to an individual sail, the sails in the optimized layout are still around 5 % less efficient in the thrust generation at the AWAs of 60 ° , 90 ° , and 120 ° . From the first to the last sails, the thrust reduction becomes more obvious. Moreover, the optimization is only effective at the smallest AWA ( 60 ° ).
Four sails are installed in the QP layout. The sails exhibit significantly decreased thrust generation over the AWAs of interest. Compared to the individual sail, the reductions reach about 28 % , 17 % , and 10 % at 60 ° , 90 ° , and 120 ° . Given the constraint of the total distance, the optimization leads to negligible improvements in the thrust generation. The downstream sails (Sails 3 and 4) present significant reductions, especially Sail 4 at the downstream corner.
The results show that layout choice is the dominant factor in multi-sail performance: TL consistently outperforms QP, whereas QP suffers substantial thrust penalties (up to 28%) caused by intensified wake interference. Increasing spacing mitigates these penalties. However, under a fixed total installation length, spacing “optimization” in QP effectively collapses to maximize the allowable distance, yielding only limited gains. In contrast, TL benefits more predictably from spacing, preserving the single-sail advantages of SC profiles by reducing wake shielding and unfavorable deflections.
These findings have direct implications for wind-assisted ship propulsion. After the airfoil shape is fixed, layout selection and spacing become the key levers for preserving SC wingsail efficiency at ship scale. Where deck length permits, TL is recommended as the baseline arrangement. If a compact installation is unavoidable, QP demands generous spacing to remain viable, and even then the aerodynamic risks remain higher. The results provide practical guidance for early-stage screening, performance prediction workflows, and integration decisions on large vessels.
The investigations in this paper exclude the effects from the hull. Despite that, the present 2D inviscid results provide robust comparative guidance, and 3D effects (tip vortices, spanwise flow) at large sails and extreme AWAs may shift optimal spacings and interaction strengths. Future work will assess these effects with lifting-line, vortex-lattice or CFD methods.

Author Contributions

Conceptualization, H.-D.Y.; methodology, H.-D.Y.; software, H.-D.Y. and P.S.; validation, S.v.R., J.L., J.N. and X.L.; formal analysis, S.v.R., X.L. and H.-D.Y.; investigation, S.v.R.; resources, H.-D.Y.; data curation, J.L. and J.N.; writing—original draft preparation, H.-D.Y. and S.v.R.; writing—review and editing, S.v.R., J.L., J.N., P.S. and X.L.; visualization, H.-D.Y.; supervision, H.-D.Y.; project administration, H.-D.Y.; funding acquisition, H.-D.Y. All authors have read and agreed to the published version of the manuscript.

Funding

This research was funded by the Swedish Transport Administration in the project “GEMINI” (generic multidisciplinary optimization for sail installation on wind-assisted ships) with the grant agreement no. TRV-2023/32107. The author H.-D. Yao also received financial support from Chalmers University of Technology Foundation for the strategic research project “Hydro- and Aerodynamics”.

Data Availability Statement

The original contributions presented in this study are included in the article. Further inquiries can be directed to the corresponding author.

Acknowledgments

We appreciate the internship student, Laryns Keurtys Leutchap Mbiatat, for his contribution to coding. The computations and data handling were enabled by resources provided by the National Academic Infrastructure for Supercomputing in Sweden (NAISS), partially funded by the Swedish Research Council through grant agreement no. 2022-06725.

Conflicts of Interest

The authors declare no conflicts of interest. The funders had no role in the design of the study; in the collection, analyses, or interpretation of data; in the writing of the manuscript; or in the decision to publish the results.

Abbreviations

The following abbreviations are used in this manuscript:
AOAAngle of attack
AWAApparent wind angle
A R Aspect ratio
CFDComputational fluid dynamics
FSIFluid–structure interaction
GAGenetic algorithm
GHGGreenhouse gases
IDDESImproved Delayed Detached-Eddy Simulation
NACANational Advisory Committee for Aeronautics
PSOParticle swarm optimization
RANSReynolds-averaged Navier–Stokes
ReReynolds number
SCSymmetrically Cambered (section/profile)
TLTriple-in-line (layout)
QPQuad-in-parallel (layout)
WTWind tunnel
WASPWind-assisted ship propulsion
C L Lift coefficient
C D Drag coefficient
C p Pressure coefficient
V Freestream velocity
2DTwo-dimensional
3DThree-dimensional

References

  1. International Maritime Organization. IMO Strategy on Reduction of GHG Emissions from Ships; IMO: London, UK, 2023. [Google Scholar]
  2. Kolodziejski, M.; Sosnowski, M. Review of Wind-Assisted Propulsion Systems in Maritime Transport. Energies 2025, 18, 897. [Google Scholar] [CrossRef]
  3. Huang, J.; Souppez, J.B.R.G. State of the Art in Wind Assisted Ship Propulsion for Maritime Decarbonisation and Sustainable Shipping: A Systematic Review. J. Sail. Technol. 2025, 10, 258–278. [Google Scholar] [CrossRef]
  4. Silva, M.F.; Friebe, A.; Malheiro, B.; Guedes, P.; Ferreira, P.; Waller, M. Rigid wing sailboats: A state of the art survey. Ocean Eng. 2019, 187, 106150. [Google Scholar] [CrossRef]
  5. Thies, F.; Fakiolas, K. Wind propulsion. In Sustainable Energy Systems on Ships; Elsevier: Amsterdam, The Netherlands, 2022; pp. 353–402. [Google Scholar]
  6. Čalić, A.; Jurić, Z.; Katalinić, M. Impact of Wind-Assisted Propulsion on Fuel Savings and Propeller Efficiency: A Case Study. J. Mar. Sci. Eng. 2024, 12, 2100. [Google Scholar] [CrossRef]
  7. International Maritime Organization. Resolution MEPC.328(76): 2021 Revised MARPOL Annex VI (Amendments to the Annex to the Protocol of 1997 to amend the International Convention for the Prevention of Pollution from Ships, 1973); IMO Resolution; International Maritime Organization: London, UK, 2021. [Google Scholar]
  8. International Maritime Organization. Resolution MEPC.352(78): 2022 Guidelines on Operational Carbon Intensity Indicators (CII Guidelines, G1); IMO Resolution; International Maritime Organization: London, UK, 2022. [Google Scholar]
  9. International Maritime Organization. Resolution MEPC.353(78): 2022 Guidelines on Reference Lines for Use with Operational Carbon Intensity Indicators (CII Reference Lines, G2); IMO Resolution; International Maritime Organization: London, UK, 2022. [Google Scholar]
  10. International Maritime Organization. Resolution MEPC.354(78): 2022 Guidelines on the Operational Carbon Intensity Rating of Ships (CII Rating Guidelines, G4); IMO Resolution; International Maritime Organization: London, UK, 2022. [Google Scholar]
  11. Bouman, E.A.; Lindstad, E.; Rialland, A.I.; Strømman, A.H. State-of-the-art technologies, measures, and potential for reducing GHG emissions from shipping—A review. Transp. Res. Part D Transp. Environ. 2017, 52, 408–421. [Google Scholar] [CrossRef]
  12. Mason, J.; Larkin, A.; Bullock, S.; van der Kolk, N.; Broderick, J.F. Quantifying Voyage Optimisation with Wind Propulsion for Short-Term CO2 Mitigation in Shipping. Ocean Eng. 2023, 289, 116065. [Google Scholar] [CrossRef]
  13. European Maritime Safety Agency. Potential of Wind-Assisted Propulsion for Shipping; Technical Report; EMSA: Lisbon, Portugal, 2023. [Google Scholar]
  14. International Maritime Organization. Reduction of GHG Emissions from Ships: White Paper on Wind Propulsion (MEPC 81/INF.39); Submitted by the Solomon Islands, IWSA, France, and Comoros; International Maritime Organization: London, UK, 2024. [Google Scholar]
  15. Lloyd’s Register. Guidance Notes on Wind Assisted Propulsion Systems; Guidance Notes; Lloyd’s Register: London, UK, 2024. [Google Scholar]
  16. ClassNK. Guidelines for Wind-Assisted Propulsion Systems (Edition 2.0); Guidelines; ClassNK: Vancouver, BC, Canada, 2023. [Google Scholar]
  17. Zhu, H.; Yao, H.D.; Thies, F.; Ringsberg, J.W.; Ramne, B. Propulsive performance of a rigid wingsail with crescent-shaped profiles. Ocean Eng. 2023, 285, 115349. [Google Scholar] [CrossRef]
  18. Ma, R.; Wang, Z.; Wang, K.; Zhao, H.D.; Jiang, B.; Liu, Y.; Xing, H.; Huang, L.Z. Evaluation Method for Energy Saving of Sail-Assisted Ship Based on Wind Resource Analysis of Typical Route. J. Mar. Sci. Eng. 2023, 11, 789. [Google Scholar] [CrossRef]
  19. Malmek, K.; Larsson, L.; Werner, S.; Ringsberg, J.W.; Bensow, R.; Finnsgård, C. Rapid aerodynamic method for predicting the performance of interacting wing sails. Ocean Eng. 2024, 293, 116596. [Google Scholar] [CrossRef]
  20. Hillenbrand, A.; Giovannetti, L.M.; Dhomé, U.; Kuttenkeuler, J. Wind Tunnel Tests of a Two-Element Wingsail with Focus on Near-Stall Aerodynamics. J. Sail. Technol. 2024, 9, 110–127. [Google Scholar] [CrossRef]
  21. Fang, S.; Tian, C.; Zhang, Y.; Xu, C.; Ding, T.; Wang, H.; Xia, T. Aerodynamic Analysis of Rigid Wing Sail Based on CFD Simulation for the Design of High-Performance Unmanned Sailboats. Mathematics 2024, 12, 2481. [Google Scholar] [CrossRef]
  22. Jiang, Y.; Cao, C.; Cui, T.; Yang, H.; Tian, Z. Numerical Study on Auxiliary Propulsion Performance of Foldable Three-Element Wingsail Utilizing Wind Energy. Energies 2024, 17, 3833. [Google Scholar] [CrossRef]
  23. Zhu, H.; Chernoray, V.; Yao, H.D.; Ringsberg, J.W.; Ramne, B. Fluid-structure interaction analysis of crescent-shaped wingsails. In Proceedings of the International Conference on Offshore Mechanics and Arctic Engineering (OMAE), Singapore, 9–14 June 2024. [Google Scholar]
  24. Zhu, H.; Chernoray, V.; Yao, H.D.; Ringsberg, J.W.; Ramne, B. Experimental study on structure responses of triple wing sails to turbulence flows at multiple apparent wind angles. In Proceedings of the 9th International Conference on Marine Structures (MarStruct), Gothenburg, Sweden, 3–5 April 2023. [Google Scholar]
  25. Ouchi, K.; Uzawa, K.; Kanai, A. Huge Hard Wing Sails for the Propulsor of Next Generation Sailing Vessel. In Proceedings of the Second International Symposium on Marine Propulsors, Hamburg, Germany, 15–17 June 2011. [Google Scholar]
  26. Ouchi, K.; Uzawa, K.; Kanai, A.; Katori, M. Wind Challenger: The Next Generation Hybrid Sailing Vessel. In Proceedings of the Third International Symposium on Marine Propulsors smp’13, Launceston, Tasmania, Australia, 5–8 May 2013. [Google Scholar]
  27. Yao, H.D. Hybrid Parametrization of Symmetrically Cambered (Crescent-Shaped) Airfoil Profiles for Rigid Wingsail Design in Wind-Assisted Ship Propulsion; Technical Report TR-2025-1; Chalmers University of Technology: Gothenburg, Sweden, 2025. [Google Scholar] [CrossRef]
  28. van Reen, S.; Serbülent, B.; Yao, H.D. Machine learning-based multipoint optimisation for improving aerodynamics of symmetrically cambered wing sails in wind-assisted ship propulsion. Ocean Eng. 2025, 342, 122829. [Google Scholar] [CrossRef]
  29. Giovannetti, L.M.; Dhome, U.; Malmek, K.; Persson, A.; Wielgosz, C. Multi-Wing Sails Interaction Effects. In Proceedings of the 24th Chesapeake Sailing Yacht Symposium, Annapolis, MD, USA, 10–11 June 2022. Paper No.: SNAME-CSYS-2022-006. [Google Scholar] [CrossRef]
  30. Chen, Z.; Cai, W.; Zeng, Q. A Numerical Study on the Thrust and Interaction of a Three-Sail Wind-Assisted Propulsion System. In Proceedings of the ASME 2022 41st International Conference on Ocean, Offshore and Arctic Engineering (OMAE 2022), Hamburg, Germany, 5–10 June 2022; p. V007T08A056. [Google Scholar] [CrossRef]
  31. Tian, F.; Huang, L.; Wang, Y.; Wang, K.; Ma, R. Numerical Simulation of the Aerodynamic Performance of A U-Shaped Sail. Proc. J. Phys. Conf. Ser. Iop Publ. 2023, 2508, 012029. [Google Scholar] [CrossRef]
  32. Wang, H.; Li, C.; Zuo, C.; Yuan, J.; Wu, B. Computational Fluid Dynamics Investigation of the Spacing of the Aerodynamic Characteristics for Multiple Wingsails on Ships. J. Mar. Sci. Eng. 2024, 12, 985. [Google Scholar] [CrossRef]
  33. Xu, K.; Malmek, K.; Bensow, R. Numerical investigation of multiple wingsails interaction under different apparent wind angles. Ocean Eng. 2025, 336, 121712. [Google Scholar] [CrossRef]
  34. Jo, Y.; Lee, H.; Choi, S.; Kwon, J.; Ahn, S. Aerodynamic Design Optimization of Wing-sails. In Proceedings of the 31st AIAA Applied Aerodynamics Conference, San Diego, CA, USA, 24–27 June 2013. [Google Scholar] [CrossRef]
  35. Yasuda, A.; Taniguchi, T.; Katayama, T. Numerical Investigation of Aerodynamic Interactions between Rigid Sails Attached to Ship. J. Mar. Sci. Eng. 2024, 12, 1425. [Google Scholar] [CrossRef]
  36. Zhang, R.; Huang, L.; Peng, G.; Ruan, Z.; Ma, R.; Wang, K.; Cao, J.; Wu, J.; Li, X. Investigation of aerodynamic performance and operational optimization of wing sails at varying spacings. Ocean Eng. 2025, 333, 121444. [Google Scholar] [CrossRef]
  37. Reche-Vilanova, M.; Kaltenbach, S.; Koumoutsakos, P.; Bingham, H.B.; Fluck, M.; Morris, D.; Psaraftis, H.N. Predictive Surrogates for Aerodynamic Performance and Independent Sail Trim Optimization of Multiple Wind Propulsion System Configurations. J. Sail. Technol. 2025, 10, 19–49. [Google Scholar] [CrossRef]
  38. Plessas, T.; Papanikolaou, A. Design Optimization and Assessment Platform for Wind-Assisted Ship Propulsion. J. Mar. Sci. Eng. 2025, 13, 1389. [Google Scholar] [CrossRef]
  39. Skinner, S.N.; Zare-Behtash, H. State-of-the-art in aerodynamic shape optimisation methods. Appl. Soft Comput. 2018, 62, 933–962. [Google Scholar] [CrossRef]
  40. Chiba, K.; Obayashi, S.; Nakahashi, K.; Morino, H. High-fidelity multidisciplinary design optimization of wing shape for regional jet aircraft. In Evolutionary Multi-Criterion Optimization; Springer: Berlin/Heidelberg, Germany, 2005; pp. 621–635. [Google Scholar]
  41. Zingg, D.W.; Nemec, M.; Pulliam, T.H. A comparative evaluation of genetic and gradient-based algorithms applied to aerodynamic optimization. Eur. J. Comput. Mech./Rev. Eur. Mécanique Numérique 2008, 17, 103–126. [Google Scholar] [CrossRef]
  42. Eberhart, R.; Kennedy, J. A new optimizer using particle swarm theory. In Proceedings of the MHS’95: Proceedings of the Sixth International Symposium on Micro Machine and Human Science, Nagoya, Japan, 4–6 October 1995; pp. 39–43. [Google Scholar]
  43. Wang, H.; Wang, S.; Zhuang, D.; Zhu, Z.; You, P.; Tang, Z.; Ding, G. Surrogate-based aerodynamic shape optimization of high-speed train heads: A review of four key technologies. Proc. Inst. Mech. Eng. Part F J. Rail Rapid Transit 2024, 238, 907–920. [Google Scholar] [CrossRef]
  44. Hashimoto, A.; Jeong, S.; Obayashi, S. Aerodynamic optimization of near-future high-wing aircraft. Trans. Jpn. Soc. Aeronaut. Space Sci. 2015, 58, 73–82. [Google Scholar] [CrossRef]
  45. Hou, P.; Hu, W.; Soltani, M.; Chen, Z. Optimized placement of wind turbines in large-scale offshore wind farm using particle swarm optimization algorithm. IEEE Trans. Sustain. Energy 2015, 6, 1272–1282. [Google Scholar] [CrossRef]
  46. Zhu, H.; Yao, H.D.; Ringsberg, J.W. Unsteady RANS and IDDES studies on a telescopic crescent-shaped wingsail. Ships Offshore Struct. 2024, 19, 134–147. [Google Scholar] [CrossRef]
  47. Sharpe, P.D. Accelerating Practical Engineering Design Optimization with Computational Graph Transformations. Ph.D. Thesis, Massachusetts Institute of Technology, Cambridge, MA, USA, 2024. [Google Scholar]
  48. Drela, M. XFOIL: An analysis and design system for low Reynolds number airfoils. In Low Reynolds Number Aerodynamics: Proceedings of the Conference, Notre Dame, Indiana, USA, 5–7 June 1989; Springer: Berlin/Heidelberg, Germany, 1989; pp. 1–12. [Google Scholar]
  49. Sheldahl, R.E.; Klimas, P.C. Aerodynamic Characteristics of Seven Symmetrical Airfoil Sections Through 180-Degree Angle of Attack for Use in Aerodynamic Analysis of Vertical Axis Wind Turbines; Technical Report; U.S. Laboratories: Albuquerque, NM, USA; Livermore, CA, USA, 1981. [Google Scholar]
  50. Forrester, A.; Sobester, A.; Keane, A. Engineering Design via Surrogate Modelling: A Practical Guide; John Wiley & Sons: Hoboken, NJ, USA, 2008. [Google Scholar]
Figure 1. The SC wingsail designed with Bézier curves based on the data of the profile parameters from [46]. The vertical dashed line indicates the symmetry axis of the wingsail at x = 0.5 .
Jmse 13 01998 g001
Figure 2. Schematics of the installation layouts: (a) triple units in line (TL), and (b) quad units in parallel (QP).
Jmse 13 01998 g002
Figure 3. The pressure coefficient distribution at an angle of attack of α = 15 ° along the chordwise direction, plotted for the NACA0015, D2R10, and the present SC profile.
Jmse 13 01998 g003
Figure 4. Streamlines colored with normalized velocity magnitudes for the individual sail and the sails installed in the TL layout. The AOA is α = 15 ° and the AWA is β = 90 ° .
Jmse 13 01998 g004
Figure 5. The pressure coefficients, C p , along the chord for the sails in the TL layout compared to the individual sail, at α = 15 ° and β = 90 ° .
Jmse 13 01998 g005
Figure 6. Streamlines colored with normalized velocity magnitudes for the optimized QP layout at α = 15 ° and β = 90 ° .
Jmse 13 01998 g006
Figure 7. The pressure coefficients, C p , along the chord for the sails in the optimized QP layout (Sails 1–4) and the reference individual sail, at α = 15 ° and β = 90 ° .
Jmse 13 01998 g007
Table 1. The matrix of AOAs and AWAs.
Layout TypeAOAAWA
TL 15 ° 60 ° , 90 ° , 120 °
QP 15 ° 60 ° , 90 ° , 120 °
Table 2. The lift and drag coefficients ( C L and C D ) of the benchmark foils used for the method validation.
NACA0015D2R10 SC FoilPresent SC Foil
ConditionCoeff.Present Inviscid MethodWT Tests [49]Present Inviscid MethodIDDES, 3D [46]Present Inviscid Method
C D , Drag type N/AProfile dragN/AProfile + induced dragN/A
α = 5 ° C L 0.6090.5502.2782.924
C D 0.0070.129
α = 10 ° C L 1.2081.1002.8621.6853.479
C D 0.0100.1630.177
α = 15 ° C L 1.7921.4143.4091.9803.988
C D 0.0190.1940.330
α = 20 ° C L 1.3332.243
C D 0.0260.388
Table 3. The ratio of the thrust coefficient C T , sum / ( C T , ref N ) of the TL layout at different AWAs.
l 1 l 2 60 ° 90 ° 120 °
Equal spacing1.2001.2000.7900.9490.933
Optimal1.1511.2490.9610.9490.933
Table 4. The ratio of the thrust coefficient C T , sum / ( C T , ref N ) of the QP layout at different AWAs.
l 1 l 2 60 ° 90 ° 120 °
Equal spacing1.2001.2000.7220.8330.889
Optimal1.1321.2680.7220.8330.910
Table 5. The thrust penalty coefficients of the sails in relation to the layout types.
TL LayoutQP Layout
Sail 10.1650.182
Sail 2−0.104−0.305
Sail 3−0.218−0.0657
Sail 4−0.525
Total−0.052−0.178
Disclaimer/Publisher’s Note: The statements, opinions and data contained in all publications are solely those of the individual author(s) and contributor(s) and not of MDPI and/or the editor(s). MDPI and/or the editor(s) disclaim responsibility for any injury to people or property resulting from any ideas, methods, instructions or products referred to in the content.